Project Time Management J. S. Chou, P.E., Ph.D.

Project Time Management
Jan 02, 2016
Project Time Management. J. S. Chou, P.E., Ph.D. Activity Sequencing. Involves reviewing activities and determining dependencies. A dependency or relationship relates to the sequencing of project activities or tasks. - PowerPoint PPT Presentation
Welcome message from author
This document is posted to help you gain knowledge. Please leave a comment to let me know what you think about it! Share it to your friends and learn new things together.
Transcript
Project Time Management
J. S. Chou, P.E., Ph.D.
2
Activity Sequencing
Involves reviewing activities and determining dependencies.
A dependency or relationship relates to the sequencing of project activities or tasks.
You must determine dependencies in order to use critical path analysis.
3
Network Diagrams
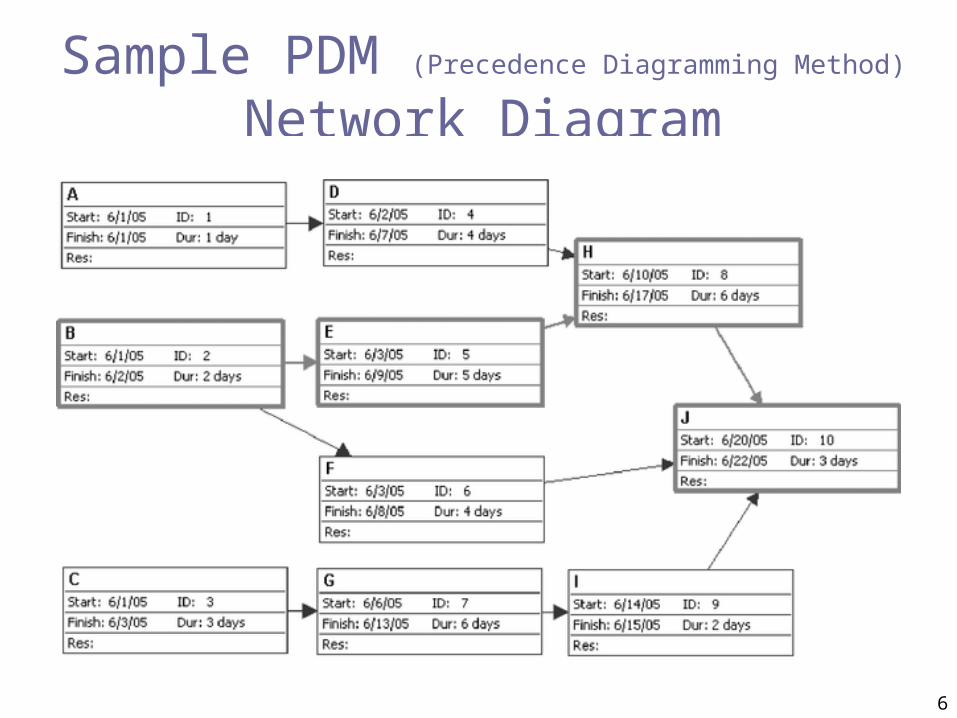
Network diagrams are the preferred technique for showing activity sequencing.
A network diagram is a schematic display of the logical relationships among, or sequencing of, project activities.
Two main formats are the arrow and precedence diagramming methods.
4
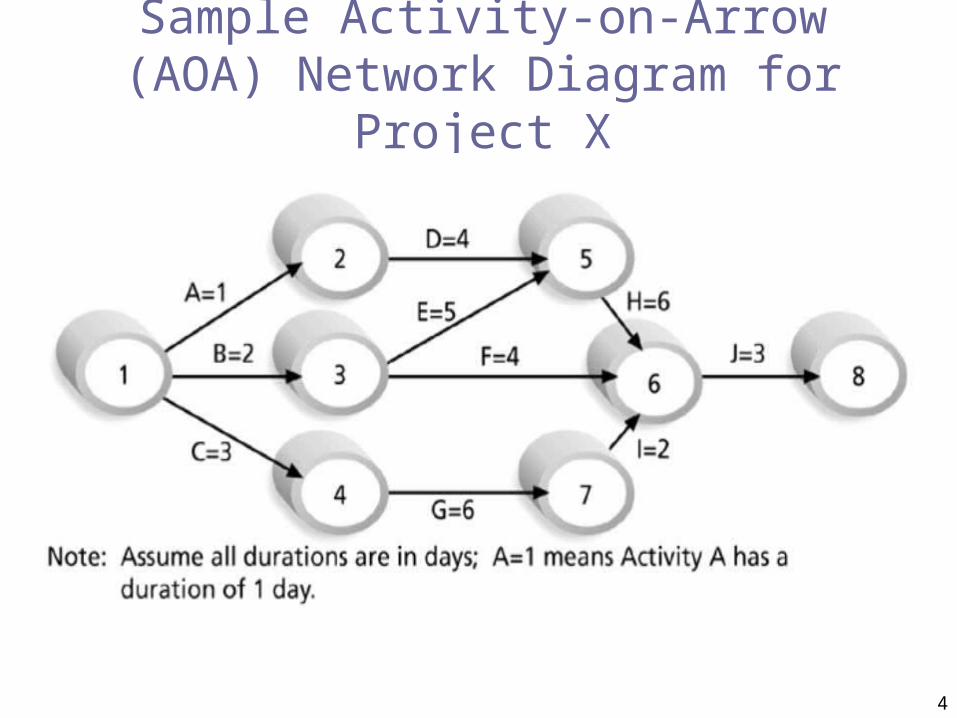
Sample Activity-on-Arrow (AOA) Network Diagram for Project X
5
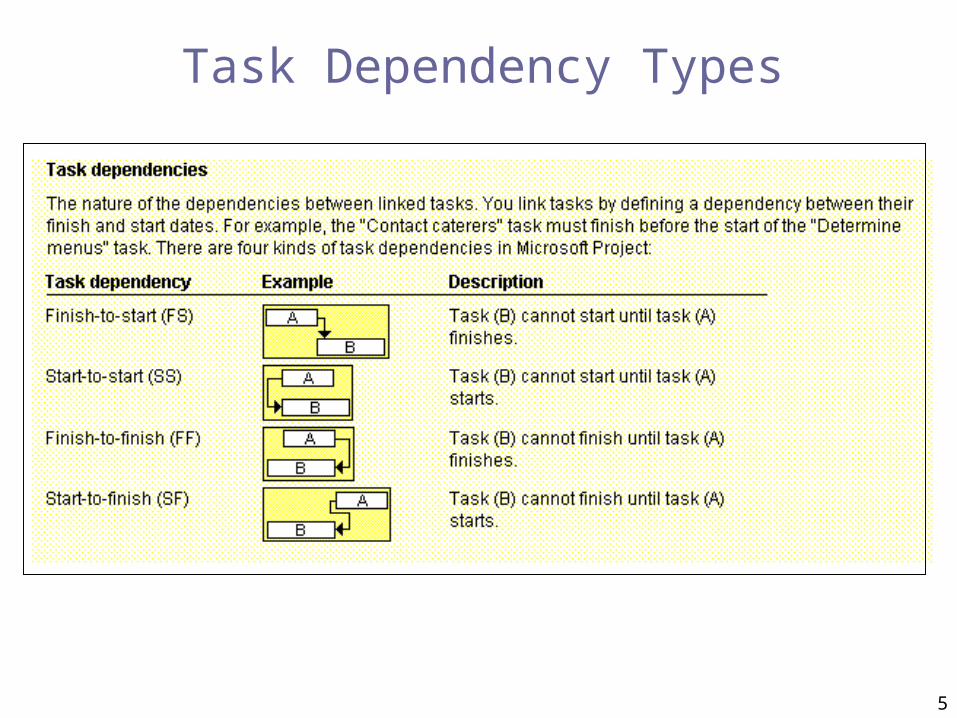
Task Dependency Types
6
Sample PDM (Precedence Diagramming
Method) Network Diagram
7
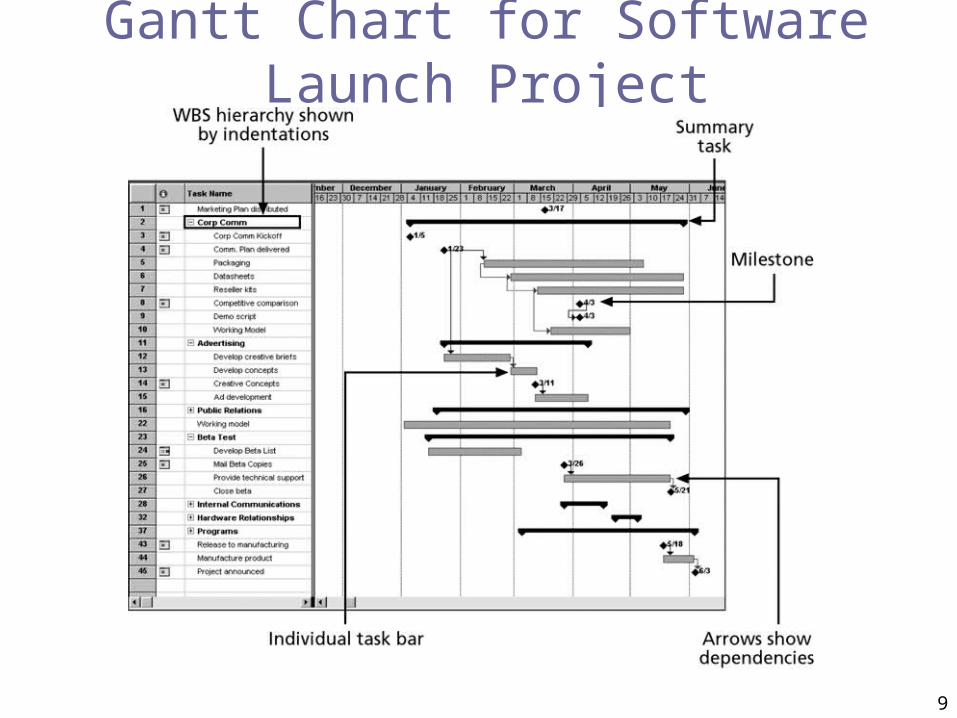
Gantt Charts
Gantt charts provide a standard format for displaying project schedule information by listing project activities and their corresponding start and finish dates in a calendar format.
Symbols include:
Black diamonds: Milestones
Thick black bars: Summary tasks
Lighter horizontal bars: Durations of tasks
Arrows: Dependencies between tasks
8
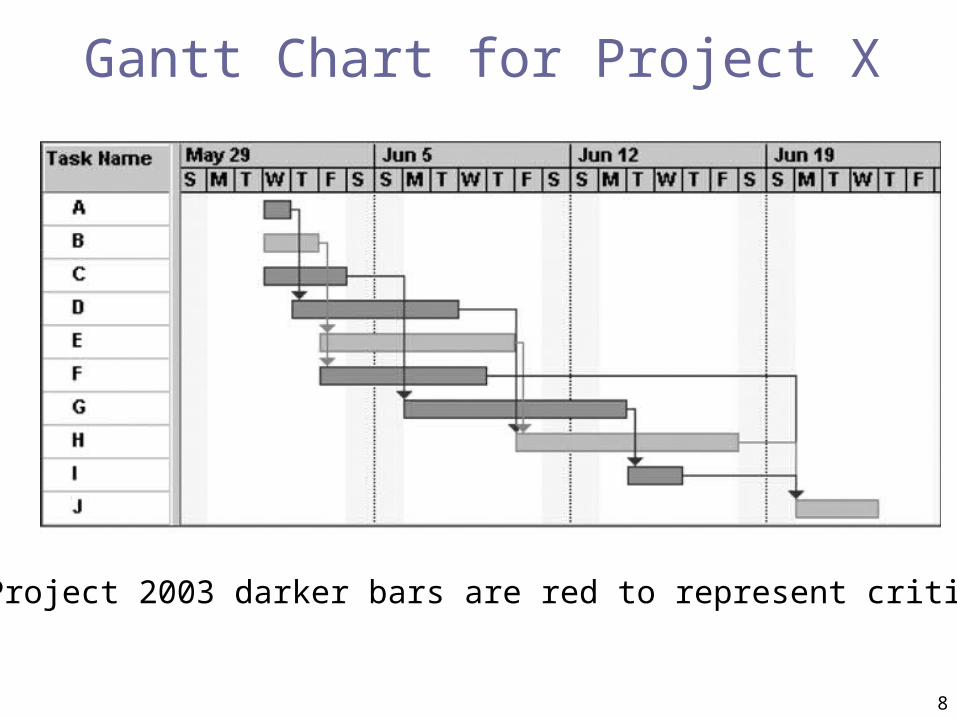
Gantt Chart for Project X
Note: In Project 2003 darker bars are red to represent critical tasks.
9
Gantt Chart for Software Launch Project
10
Adding Milestones to Gantt Charts
Many people like to focus on meeting milestones, especially for large projects.
Milestones emphasize important events or accomplishments in projects.
You typically create milestone by entering tasks that have a zero duration, or you can mark any task as a milestone.
11
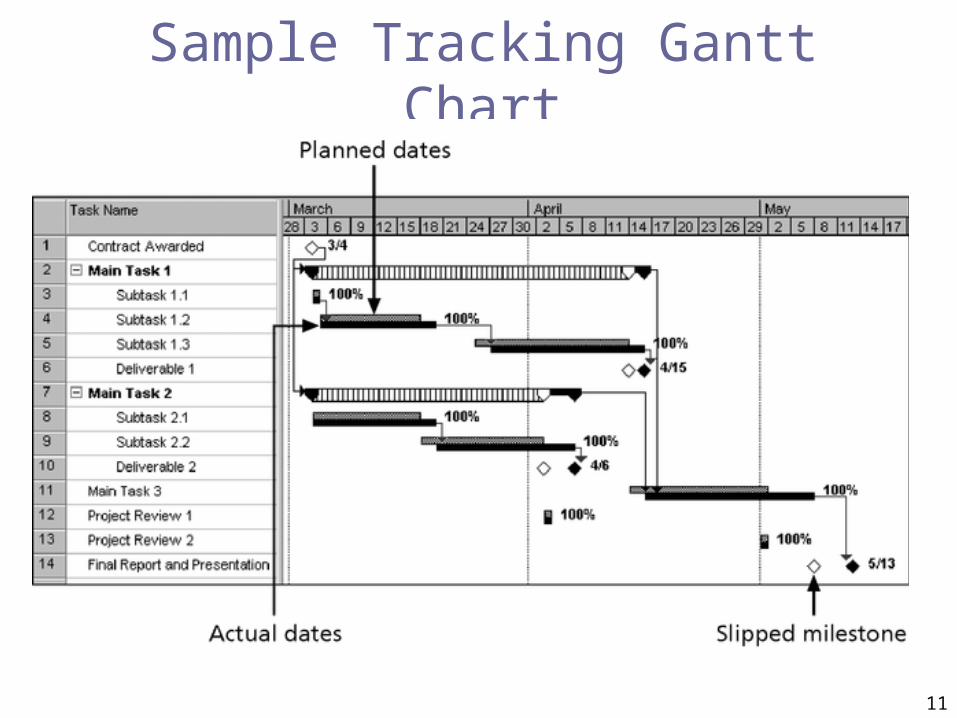
Sample Tracking Gantt Chart
12
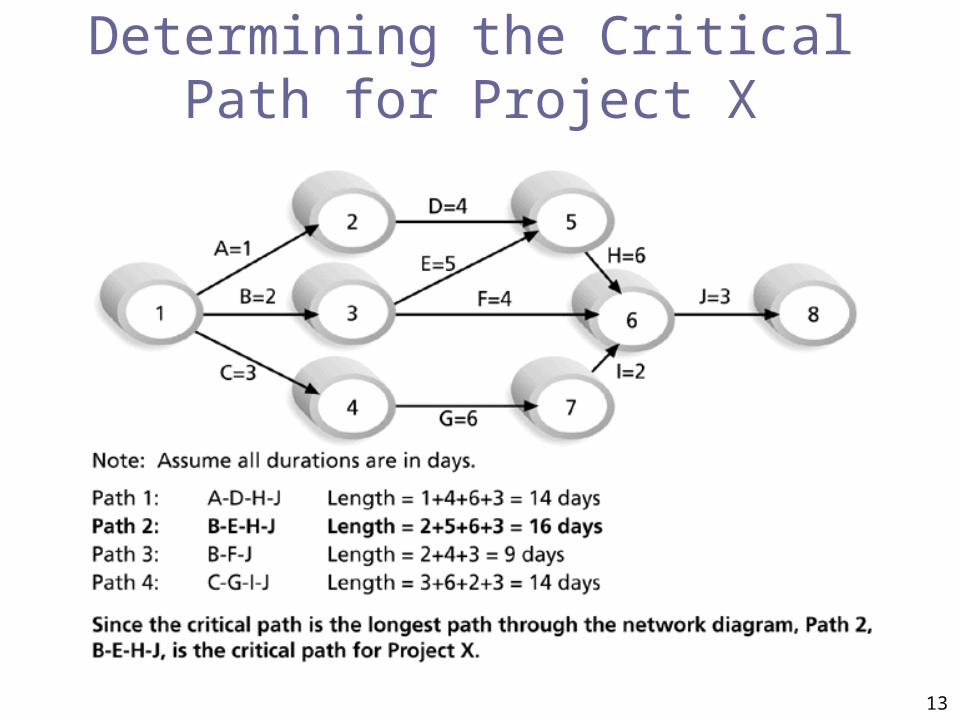
Critical Path Method (CPM) CPM is a network diagramming technique used to
predict total project duration.
A critical path for a project is the series of activities that determines the earliest time by which the project can be completed.
The critical path is the longest path through the network diagram and has the least amount of slack or float.
Slack or float is the amount of time an activity can be delayed without delaying a succeeding activity or the project finish date.
13
Determining the Critical Path for Project X
14
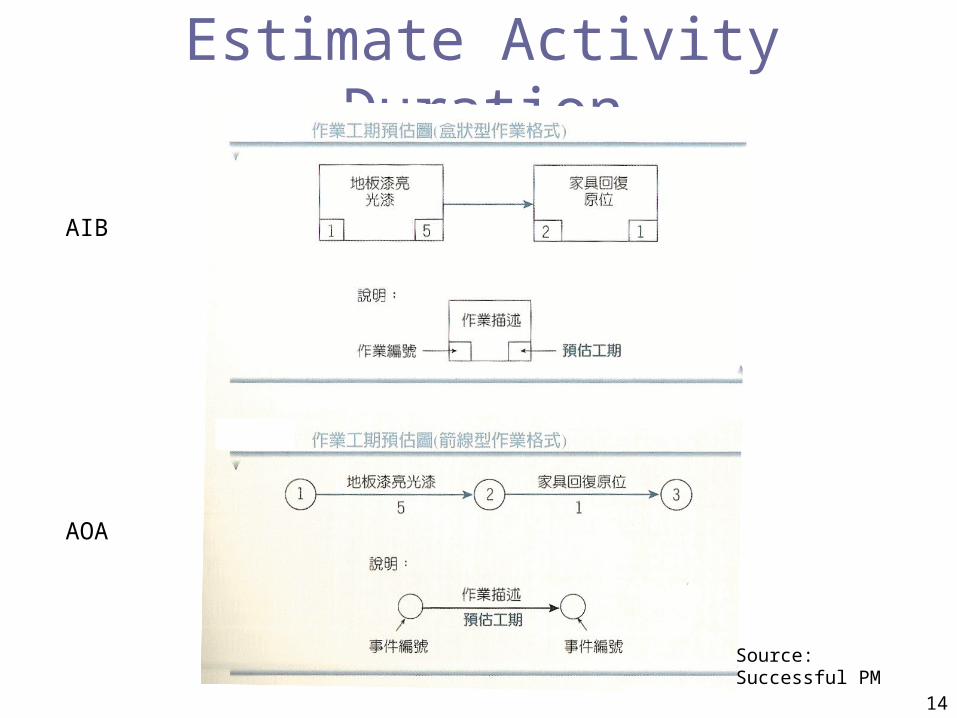
Estimate Activity Duration
AIB
AOA
Source: Successful PM
15
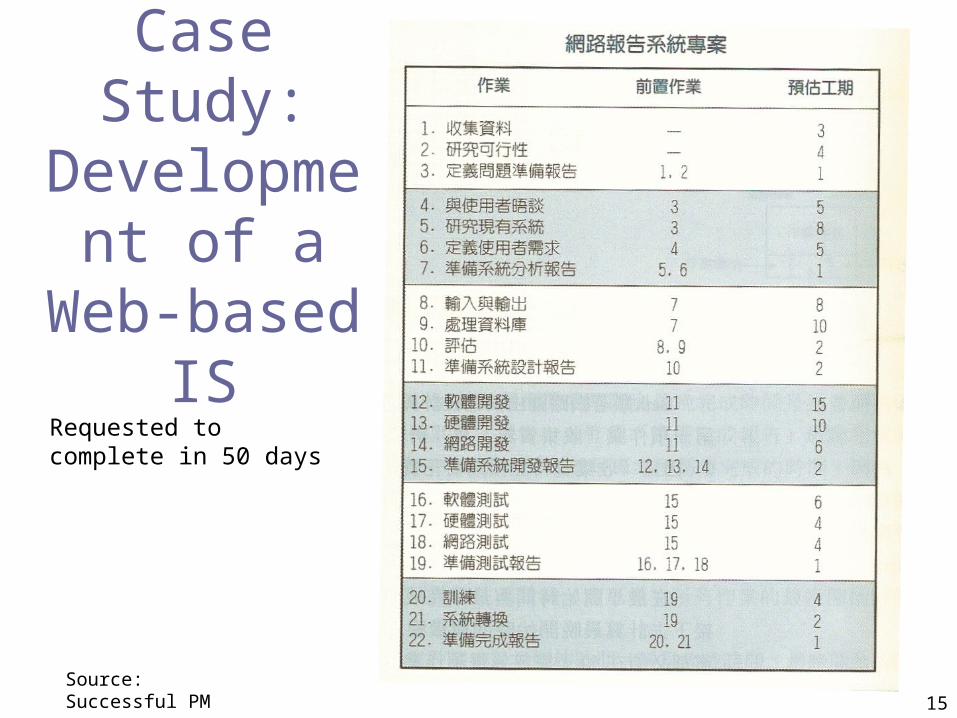
Case Study:
Development of a
Web-based IS
Requested to complete in 50 days
Source: Successful PM
16
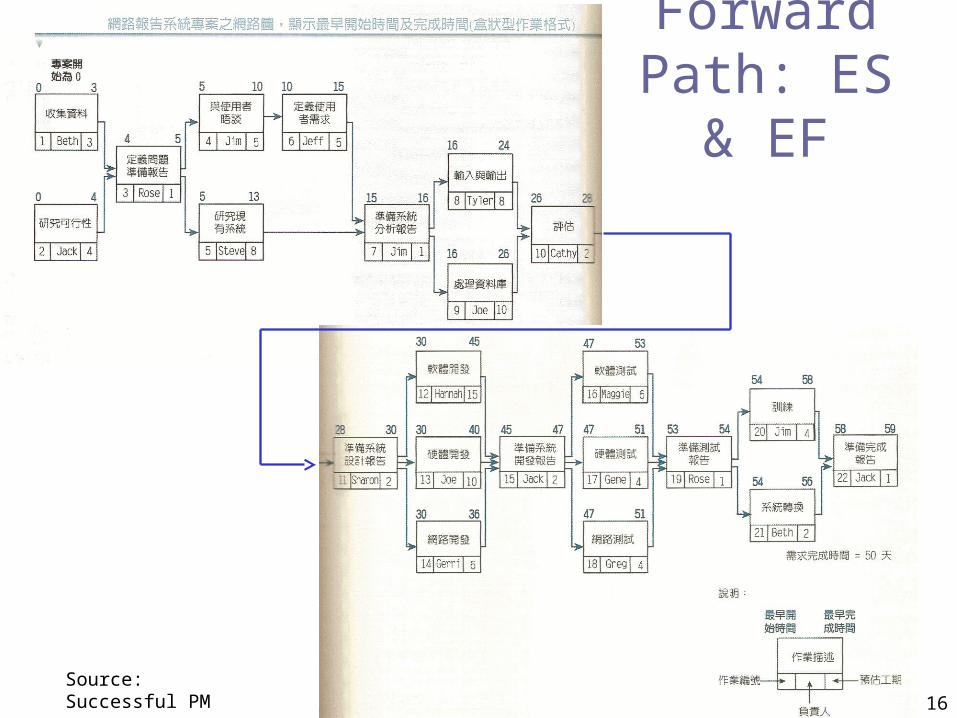
Forward Path: ES
& EF
Source: Successful PM
17
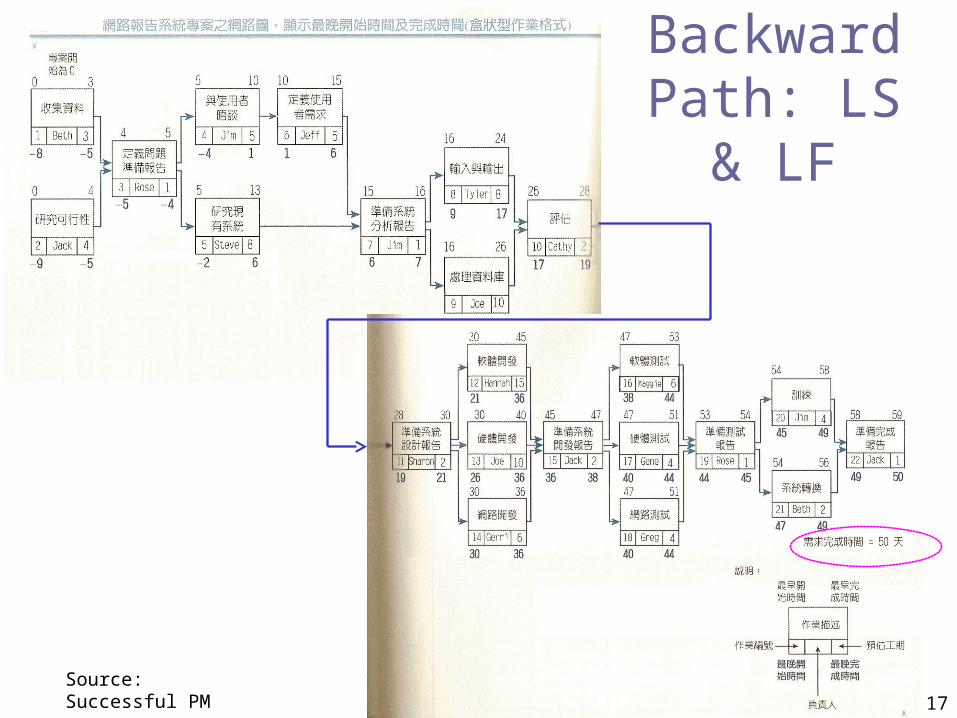
Backward Path: LS &
LF
Source: Successful PM
18
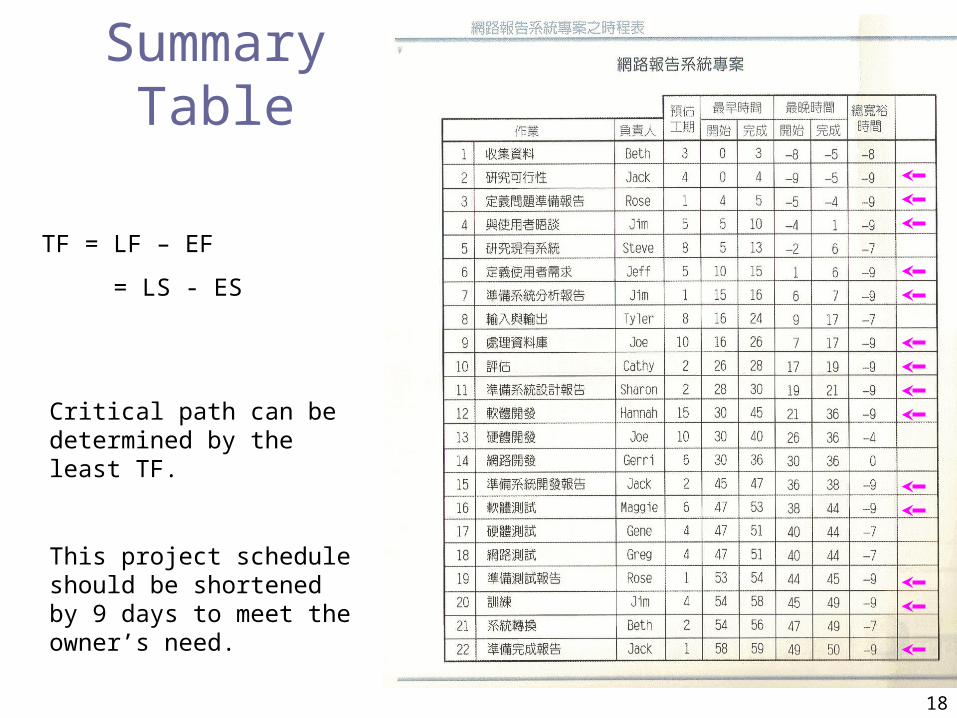
Summary Table
TF = LF – EF
= LS - ES
Critical path can be determined by the least TF.
This project schedule should be shortened by 9 days to meet the owner’s need.
19
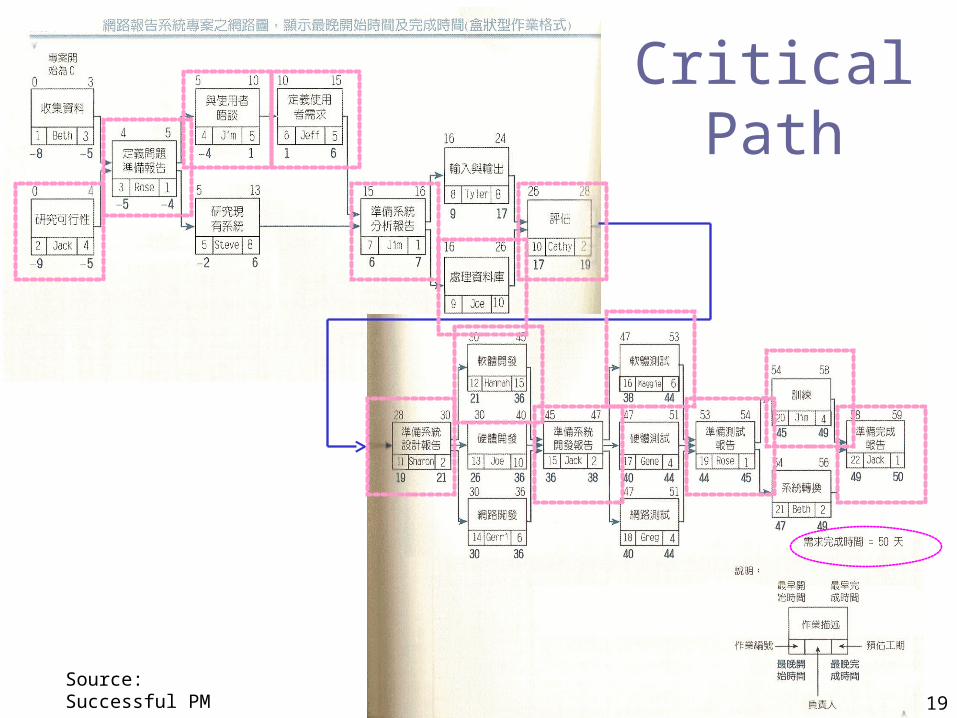
Critical Path
Source: Successful PM
20
Using the Critical Path to Shorten a Project Schedule
Three main techniques for shortening schedules:
Shortening the duration of critical activities or tasks by adding more resources or changing their scope.
Crashing activities by obtaining the greatest amount of schedule compression for the least incremental cost.
Fast tracking activities by doing them in parallel or overlapping them.
21
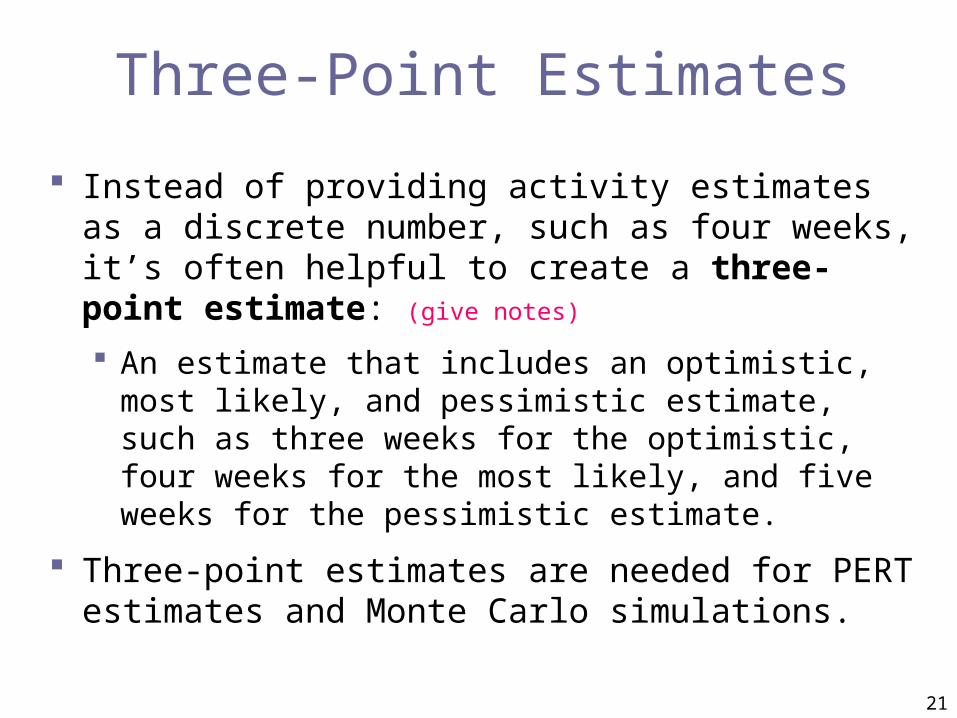
Three-Point Estimates
Instead of providing activity estimates as a discrete number, such as four weeks, it’s often helpful to create a three-point estimate: (give notes)
An estimate that includes an optimistic, most likely, and pessimistic estimate, such as three weeks for the optimistic, four weeks for the most likely, and five weeks for the pessimistic estimate.
Three-point estimates are needed for PERT estimates and Monte Carlo simulations.
22
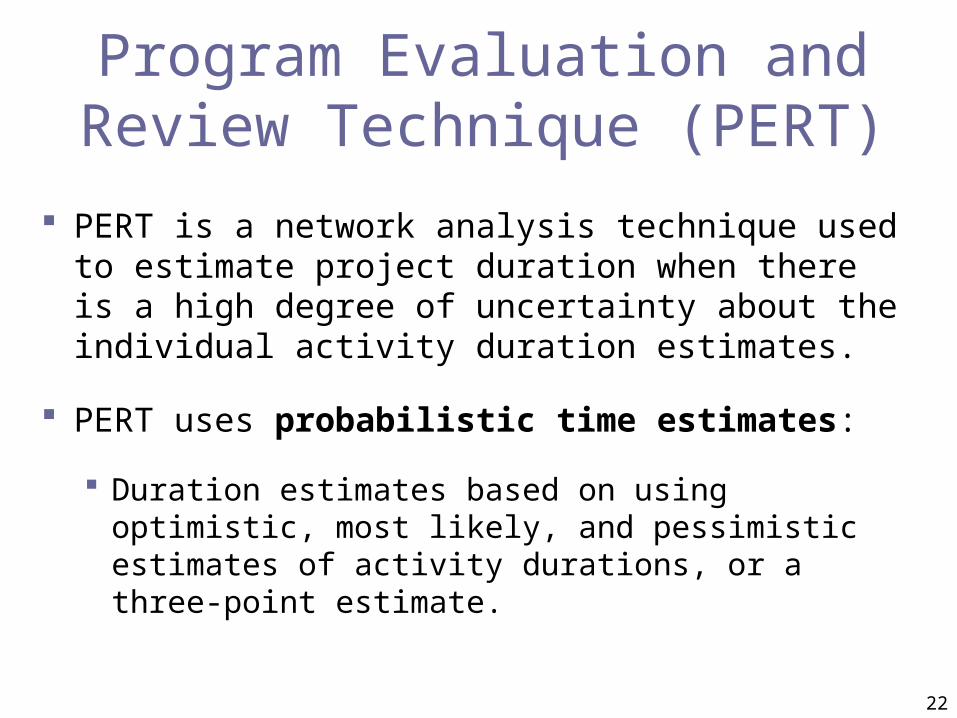
Program Evaluation and Review Technique (PERT)
PERT is a network analysis technique used to estimate project duration when there is a high degree of uncertainty about the individual activity duration estimates.
PERT uses probabilistic time estimates:
Duration estimates based on using optimistic, most likely, and pessimistic estimates of activity durations, or a three-point estimate.
23
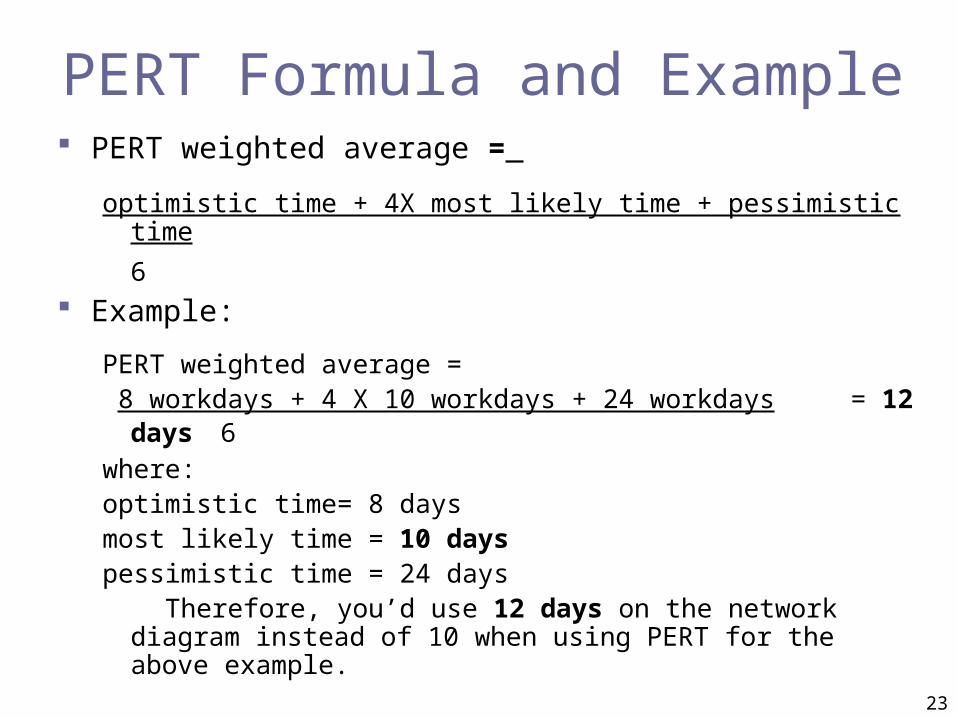
PERT Formula and Example PERT weighted average =
optimistic time + 4X most likely time + pessimistic time
6 Example:
PERT weighted average =
8 workdays + 4 X 10 workdays + 24 workdays = 12 days6
where: optimistic time= 8 daysmost likely time = 10 dayspessimistic time = 24 days Therefore, you’d use 12 days on the network diagram instead of 10
when using PERT for the above example.
24
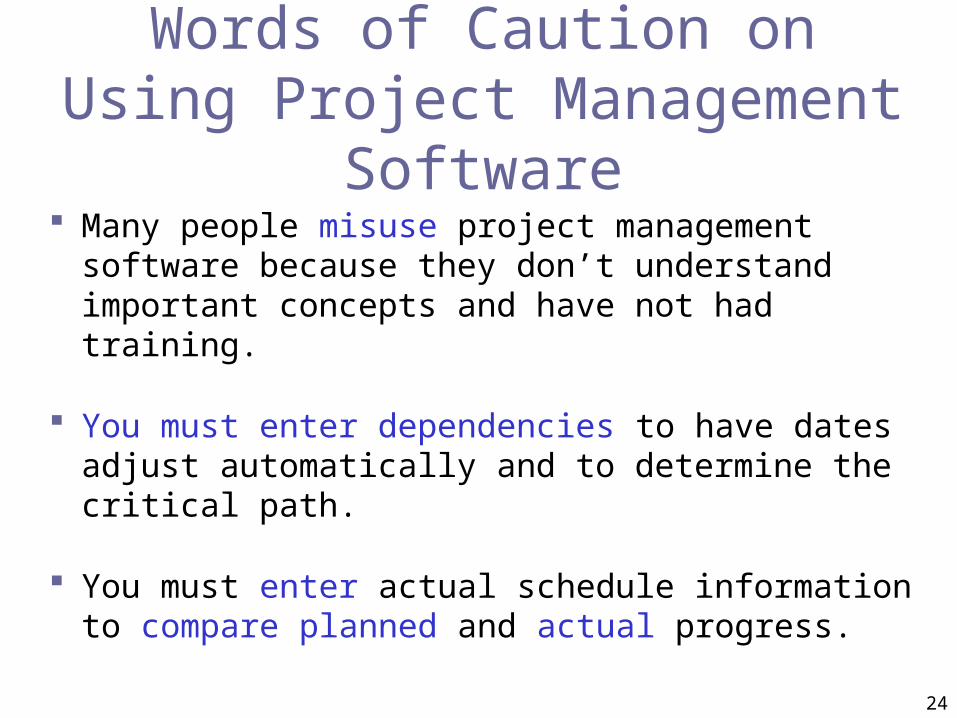
Words of Caution on Using Project Management
Software Many people misuse project management software
because they don’t understand important concepts and have not had training.
You must enter dependencies to have dates adjust automatically and to determine the critical path.
You must enter actual schedule information to compare planned and actual progress.
25
Demo of Project 2003
Related Documents