PROJECT DESIGN DOCUMENT FORM (CDM PDD) - Version 03.1. CDM – Executive Board page 1 CLEAN DEVELOPMENT MECHANISM PROJECT DESIGN DOCUMENT FORM (CDM-PDD) Version 03 - in effect as of: 28 July 2006 CONTENTS A. General description of project activity B. Application of a baseline and monitoring methodology C. Duration of the project activity / crediting period D. Environmental impacts E. Stakeholders’ comments Annexes Annex 1: Contact information on participants in the project activity Annex 2: Information regarding public funding Annex 3: Baseline information Annex 4: Monitoring plan

Welcome message from author
This document is posted to help you gain knowledge. Please leave a comment to let me know what you think about it! Share it to your friends and learn new things together.
Transcript

PROJECT DESIGN DOCUMENT FORM (CDM PDD) - Version 03.1.
CDM – Executive Board
page 1
CLEAN DEVELOPMENT MECHANISM
PROJECT DESIGN DOCUMENT FORM (CDM-PDD)
Version 03 - in effect as of: 28 July 2006
CONTENTS
A. General description of project activity
B. Application of a baseline and monitoring methodology
C. Duration of the project activity / crediting period
D. Environmental impacts
E. Stakeholders’ comments
Annexes
Annex 1: Contact information on participants in the project activity
Annex 2: Information regarding public funding
Annex 3: Baseline information
Annex 4: Monitoring plan
PROJECT DESIGN DOCUMENT FORM (CDM PDD) - Version 03.1.
CDM – Executive Board
page 2
SECTION A. General description of project activity
A.1 Title of the project activity:
Angang Surplus Waste Heat Steam Generation Project
Version 4.0, 14/11/2008, revised according to methodology ACM0012, version 3
PDD history:
Version 1.0, 01/03/2007, GSP version
Version 2.0, 21/12/2007, updated following DOE site visit and receipt of DOE CAR & CR list
Version 3.0, 02/02/2008, updated following DOE comments
Version 3.1, 05/03/2008, updated following DOE comments
A.2. Description of the project activity:
Anyang Iron and Steel Co., Ltd. (AIS) is a large manufacturer of pig iron, steel, and steel products
headquartered in Henan Province of China. The objective of the Angang Surplus Waste Heat Steam
Generation Project (hereafter referred to as the Project) is to utilize the surplus low pressure and low
temperature steam from the AIS steam network. The Project will install a low temperature steam
generation unit with capacity of 15MW. The estimated annual power generation is 54.5 GWh per year,
which will be totally consumed by the iron and steel production process.
There is a large amount of residual heat generated by the process of iron and steel production. In AIS,
most residual heat has been recovered to generate steam, which has been consumed by low pressure
steam users within the facility during the winter months. However, in the spring, summer, and autumn
seasons when there is no demand for space heating, surplus steam is available. The project’s feasibility
study report showed the surplus amount to be around 69t/h. The Project will take advantage of the
surplus steam to generate 54.5GWh of electricity per year, to replace power that is imported from the
Central China Power Grid (CCPG). The CCPG is dominated by fossil fuel-fired power plants, and the
project is expected to reduce an estimated 43,614 tCO2e per year.
Besides the GHG emission reductions, the Project would contribute to local and national sustainable
development through:
♦ Reduction of air pollutants of coal fired power plants such as SO2 and TSP;
♦ Reduction of fossil fuel-based energy consumption, thus improving energy efficiency;
♦ Improvement of energy mix and energy security;
♦ Creating employment opportunities for the local community;
♦ Promoting implementation of similar activities in the region.
The estimated investment required for the project is 68.13 million RMB, of which the majority will be
provided by loans.
PROJECT DESIGN DOCUMENT FORM (CDM PDD) - Version 03.1.
CDM – Executive Board
page 3
Although the Project Owner has been in discussion with suppliers since late 2007, project construction is
not expected to begin until October 2009 because suitable technology is not yet available. The project
timetable is therefore as follows:
Begin construction: October 2009
Begin operation: December 2010 (begin commissioning), 15/03/2011 (operation start date
once steam is available after winter space heating season)
Start of crediting period: 15/03/2011
A.3. Project participants:
Please list project participants and Party(ies) involved and provide contact information in Annex 1.
Information shall be indicated using the following tabular format.
Name of Party involved (*)
((host) indicates a host
Party)
Private and/or public entity(ies)
project participants (*)
(as applicable)
Kindly indicate if
the Party involved
wishes to be
considered as
project participant
(Yes/No)
China (host)
Anyang Iron and Steel Co., Ltd. No
United Kingdom of Great
Britain and Northern Ireland
Noble Carbon Credits Limited
(private entity) No
United Kingdom of Great
Britain and Northern Ireland
Camco International Limited
(private entity) No
(*) In accordance with the CDM modalities and procedures, at the time of making the CDM-PDD public
at the stage of validation, a Party involved may or may not have provided its approval. At the time of
requesting registration, the approval by the Party(ies) involved is required.
Note: When the PDD is filled in support of a proposed new methodology (form CDM-NM), at least
the host Party(ies) and any known project participant (e.g. those proposing a new methodology) shall
be identified.
A.4. Technical description of the project activity:
A.4.1. Location of the project activity:
A.4.1.1. Host Party(ies):
China
A.4.1.2. Region/State/Province etc.:
Henan Province
PROJECT DESIGN DOCUMENT FORM (CDM PDD) - Version 03.1.
CDM – Executive Board
page 4
A.4.1.3. City/Town/Community etc:
Yindu District, Anyang City
A.4.1.4. Detail of physical location, including information allowing the
unique identification of this project activity (maximum one page):
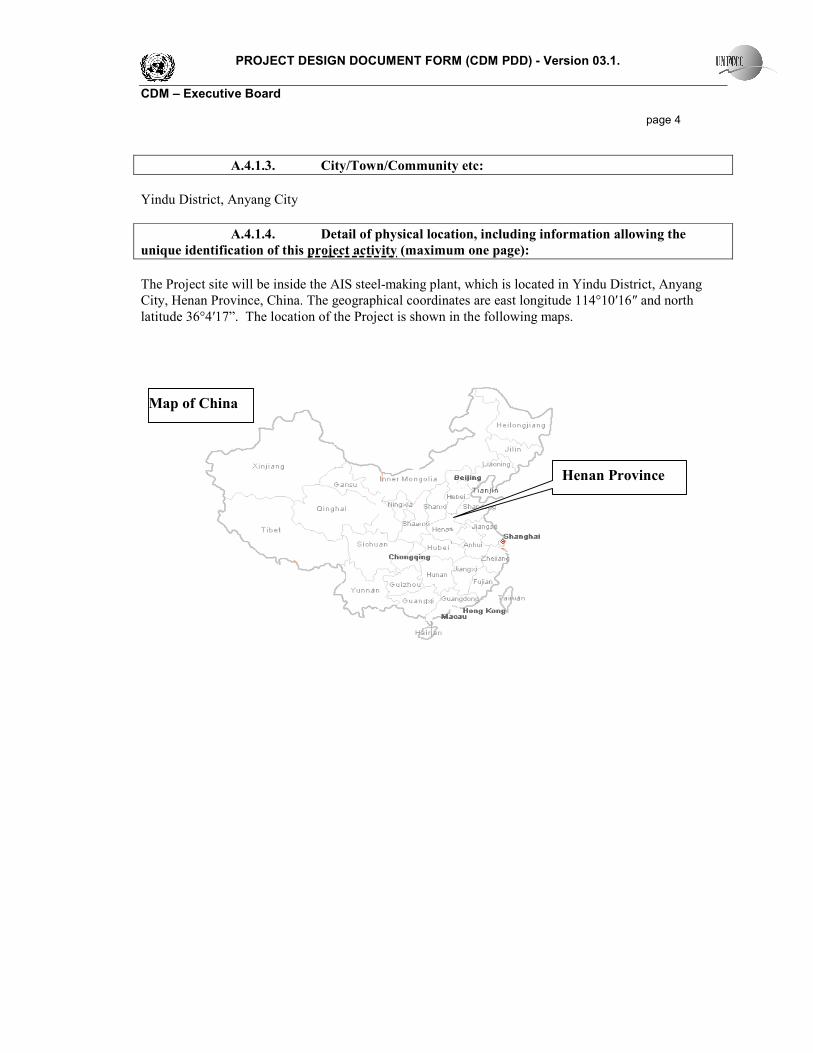
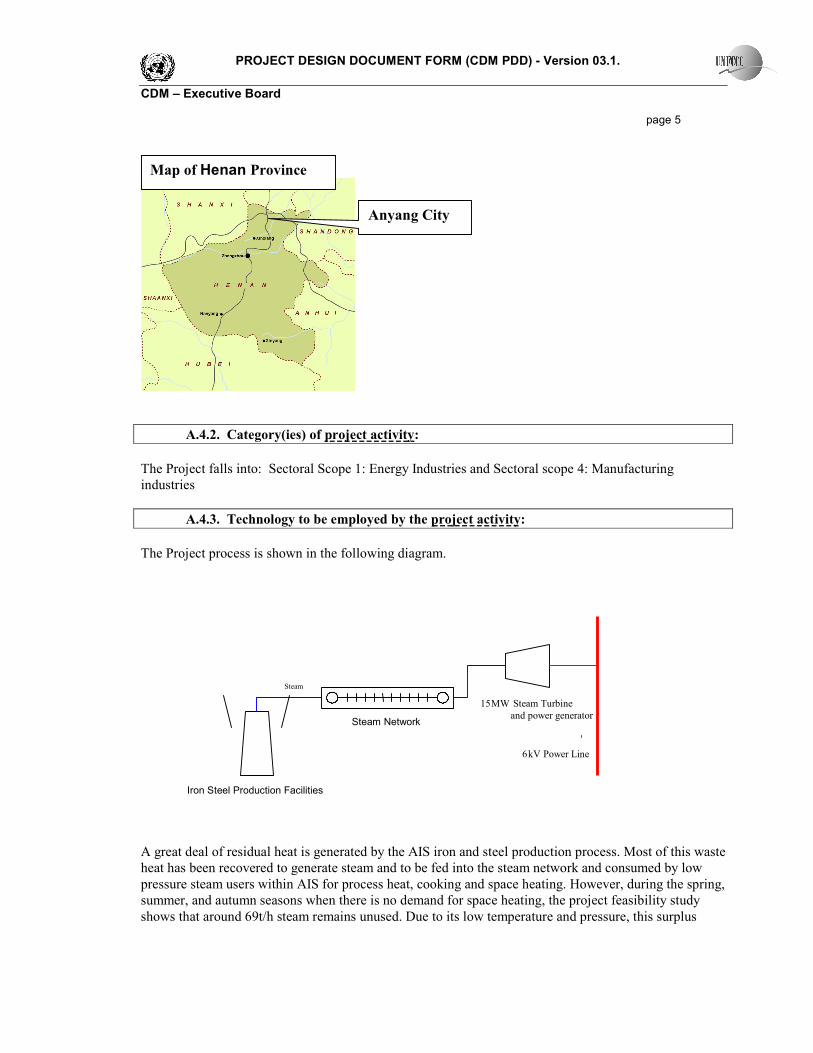
The Project site will be inside the AIS steel-making plant, which is located in Yindu District, Anyang
City, Henan Province, China. The geographical coordinates are east longitude 114°10′16″ and north
latitude 36°4′17”. The location of the Project is shown in the following maps.
Map of China
Henan Province
PROJECT DESIGN DOCUMENT FORM (CDM PDD) - Version 03.1.
CDM – Executive Board
page 5
A.4.2. Category(ies) of project activity:
The Project falls into: Sectoral Scope 1: Energy Industries and Sectoral scope 4: Manufacturing
industries
A.4.3. Technology to be employed by the project activity:
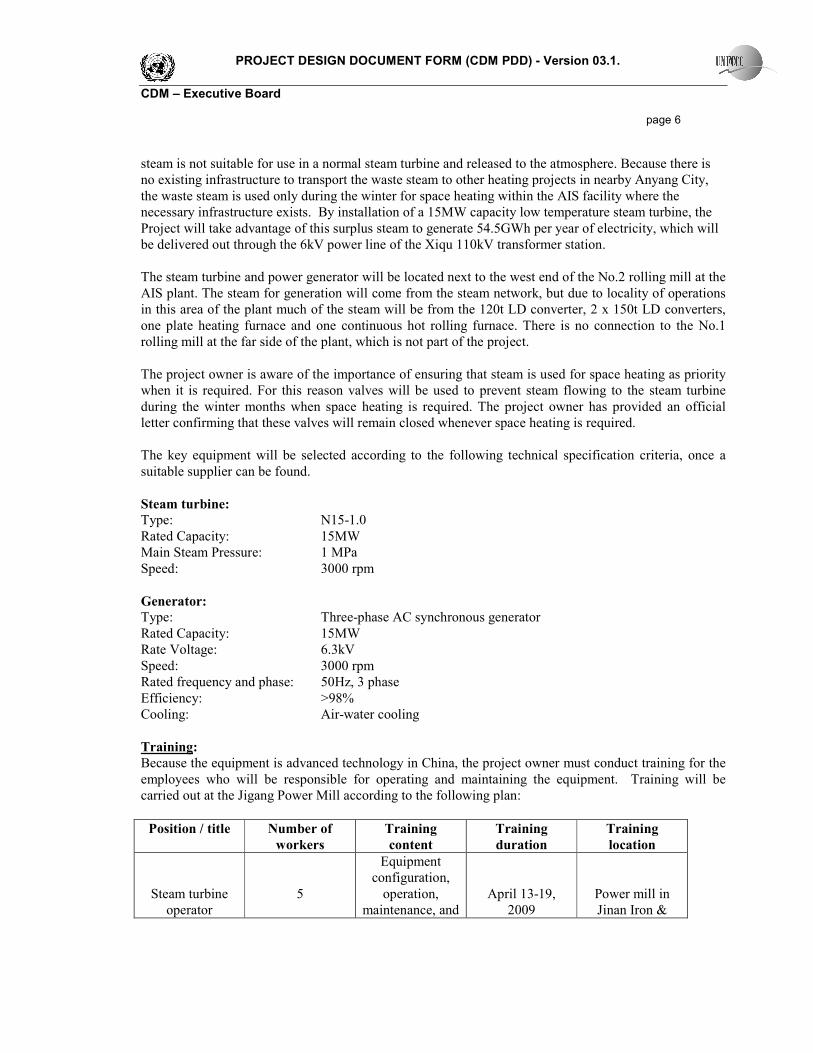
The Project process is shown in the following diagram.
A great deal of residual heat is generated by the AIS iron and steel production process. Most of this waste
heat has been recovered to generate steam and to be fed into the steam network and consumed by low
pressure steam users within AIS for process heat, cooking and space heating. However, during the spring,
summer, and autumn seasons when there is no demand for space heating, the project feasibility study
shows that around 69t/h steam remains unused. Due to its low temperature and pressure, this surplus
Map of Henan Province
Anyang City
Iron Steel Production Facilities
15 MW Steam Turbine
and power generator
Steam
6 kV Power Line
Steam Network
PROJECT DESIGN DOCUMENT FORM (CDM PDD) - Version 03.1.
CDM – Executive Board
page 6
steam is not suitable for use in a normal steam turbine and released to the atmosphere. Because there is
no existing infrastructure to transport the waste steam to other heating projects in nearby Anyang City,
the waste steam is used only during the winter for space heating within the AIS facility where the
necessary infrastructure exists. By installation of a 15MW capacity low temperature steam turbine, the
Project will take advantage of this surplus steam to generate 54.5GWh per year of electricity, which will
be delivered out through the 6kV power line of the Xiqu 110kV transformer station.
The steam turbine and power generator will be located next to the west end of the No.2 rolling mill at the
AIS plant. The steam for generation will come from the steam network, but due to locality of operations
in this area of the plant much of the steam will be from the 120t LD converter, 2 x 150t LD converters,
one plate heating furnace and one continuous hot rolling furnace. There is no connection to the No.1
rolling mill at the far side of the plant, which is not part of the project.
The project owner is aware of the importance of ensuring that steam is used for space heating as priority
when it is required. For this reason valves will be used to prevent steam flowing to the steam turbine
during the winter months when space heating is required. The project owner has provided an official
letter confirming that these valves will remain closed whenever space heating is required.
The key equipment will be selected according to the following technical specification criteria, once a
suitable supplier can be found.
Steam turbine:
Type: N15-1.0
Rated Capacity: 15MW
Main Steam Pressure: 1 MPa
Speed: 3000 rpm
Generator:
Type: Three-phase AC synchronous generator
Rated Capacity: 15MW
Rate Voltage: 6.3kV
Speed: 3000 rpm
Rated frequency and phase: 50Hz, 3 phase
Efficiency: >98%
Cooling: Air-water cooling
Training:
Because the equipment is advanced technology in China, the project owner must conduct training for the
employees who will be responsible for operating and maintaining the equipment. Training will be
carried out at the Jigang Power Mill according to the following plan:
Position / title Number of
workers
Training
content
Training
duration
Training
location
Steam turbine
operator
5
Equipment
configuration,
operation,
maintenance, and
April 13-19,
2009
Power mill in
Jinan Iron &
PROJECT DESIGN DOCUMENT FORM (CDM PDD) - Version 03.1.
CDM – Executive Board
page 7
trouble-shooting Steel Plant
Power generator
operator
5
Equipment
configuration,
operation,
maintenance, and
trouble-shooting
April 13-19,
2009
Power mill in
Jinan Iron &
Steel Plant
Circulated water
equipment
operator
5
Equipment
configuration,
operation,
maintenance, and
trouble-shooting
March 16-22,
2009
Power mill in
Jinan Iron &
Steel Plant
Operation
locksmith
5
Equipment
configuration
and maintenance
March 16-22,
2009
Power mill in
Jinan Iron &
Steel Plant
A.4.4 Estimated amount of emission reductions over the chosen crediting period:
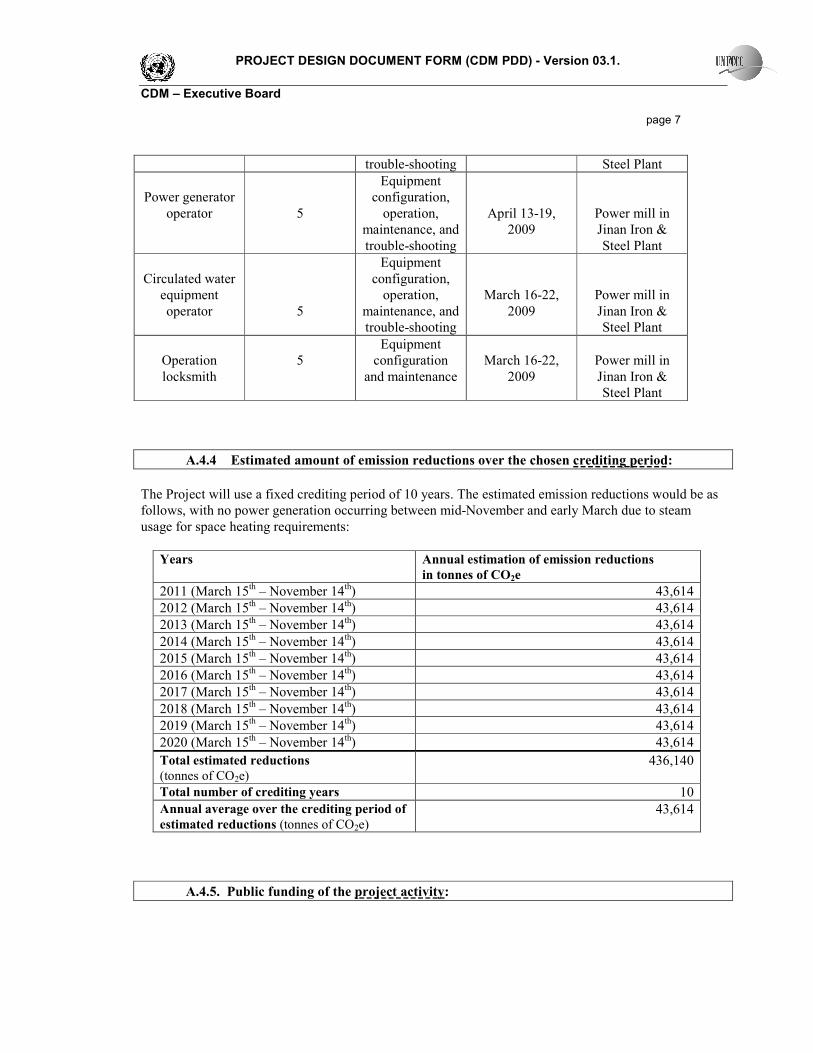
The Project will use a fixed crediting period of 10 years. The estimated emission reductions would be as
follows, with no power generation occurring between mid-November and early March due to steam
usage for space heating requirements:
Years
Annual estimation of emission reductions
in tonnes of CO2e
2011 (March 15th – November 14
th) 43,614
2012 (March 15th – November 14th) 43,614
2013 (March 15th – November 14th) 43,614
2014 (March 15th – November 14
th) 43,614
2015 (March 15th – November 14
th) 43,614
2016 (March 15th – November 14th) 43,614
2017 (March 15th – November 14th) 43,614
2018 (March 15th – November 14
th) 43,614
2019 (March 15th – November 14
th) 43,614
2020 (March 15th – November 14th) 43,614
Total estimated reductions
(tonnes of CO2e)
436,140
Total number of crediting years 10
Annual average over the crediting period of
estimated reductions (tonnes of CO2e)
43,614
A.4.5. Public funding of the project activity:

PROJECT DESIGN DOCUMENT FORM (CDM PDD) - Version 03.1.
CDM – Executive Board
page 8
There is no public funding of the Project.
PROJECT DESIGN DOCUMENT FORM (CDM PDD) - Version 03.1.
CDM – Executive Board
page 9
SECTION B. Application of a baseline and monitoring methodology
B.1. Title and reference of the approved baseline and monitoring methodology applied to the
project activity:
The following methodology is used:
Approved consolidated baseline and monitoring methodology ACM0012 (version 3) “Consolidated
baseline methodology for GHG emission reductions for waste gas or waste heat or waste pressure based
energy system.”
The “Tool to calculate the emission factor for an electricity system,” version 1, (EB 35) is used to
calculate the emission factor.
The “Tool for the Demonstration and Assessment of Additionality,” Version 5.02, (EB 39) is used to
demonstrate the additionality of the project activity.
More information is available at:
http://cdm.unfccc.int/methodologies/PAmethodologies/approved.html.
B.2 Justification of the choice of the methodology and why it is applicable to the project
activity:
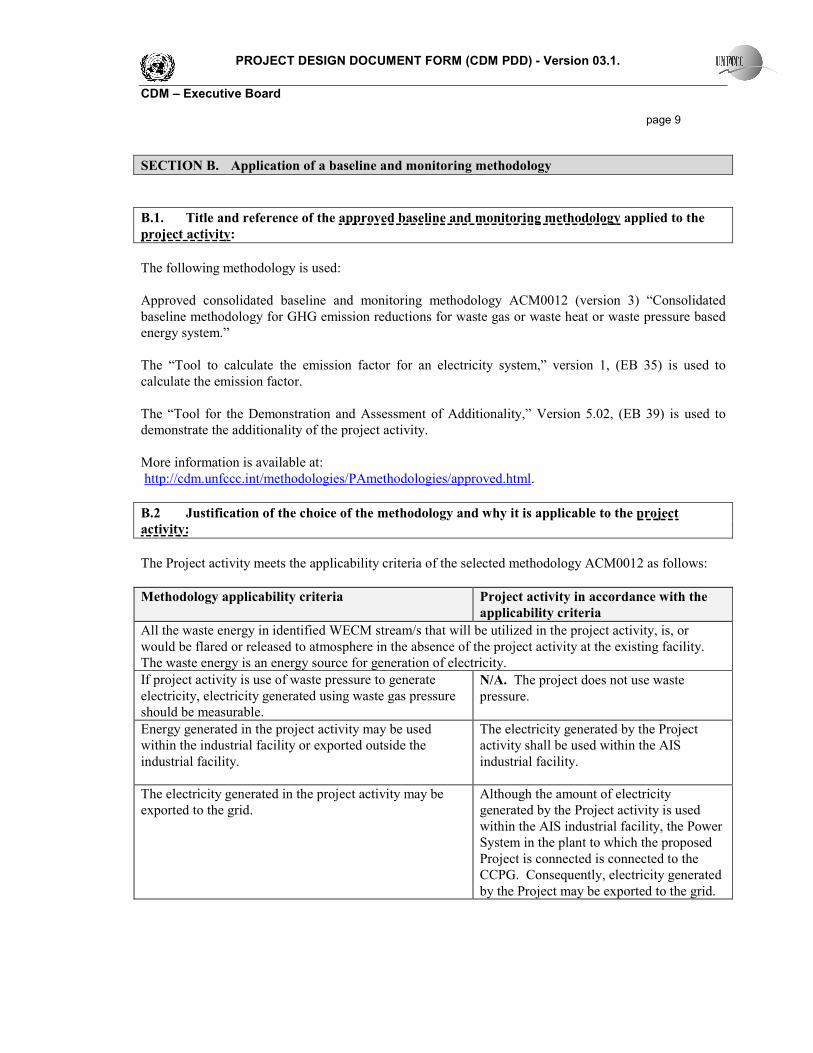
The Project activity meets the applicability criteria of the selected methodology ACM0012 as follows:
Methodology applicability criteria Project activity in accordance with the
applicability criteria
All the waste energy in identified WECM stream/s that will be utilized in the project activity, is, or
would be flared or released to atmosphere in the absence of the project activity at the existing facility.
The waste energy is an energy source for generation of electricity.
If project activity is use of waste pressure to generate
electricity, electricity generated using waste gas pressure
should be measurable.
N/A. The project does not use waste
pressure.
Energy generated in the project activity may be used
within the industrial facility or exported outside the
industrial facility.
The electricity generated by the Project
activity shall be used within the AIS
industrial facility.
The electricity generated in the project activity may be
exported to the grid.
Although the amount of electricity
generated by the Project activity is used
within the AIS industrial facility, the Power
System in the plant to which the proposed
Project is connected is connected to the
CCPG. Consequently, electricity generated
by the Project may be exported to the grid.
PROJECT DESIGN DOCUMENT FORM (CDM PDD) - Version 03.1.
CDM – Executive Board
page 10
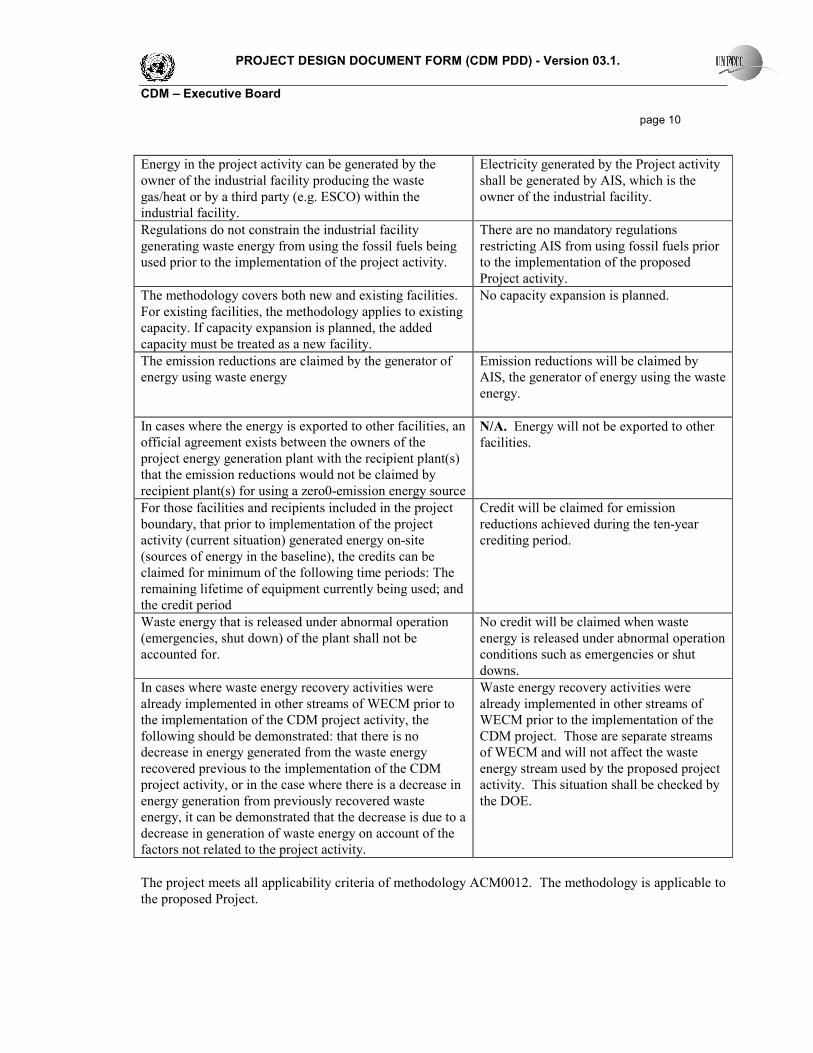
Energy in the project activity can be generated by the
owner of the industrial facility producing the waste
gas/heat or by a third party (e.g. ESCO) within the
industrial facility.
Electricity generated by the Project activity
shall be generated by AIS, which is the
owner of the industrial facility.
Regulations do not constrain the industrial facility
generating waste energy from using the fossil fuels being
used prior to the implementation of the project activity.
There are no mandatory regulations
restricting AIS from using fossil fuels prior
to the implementation of the proposed
Project activity.
The methodology covers both new and existing facilities.
For existing facilities, the methodology applies to existing
capacity. If capacity expansion is planned, the added
capacity must be treated as a new facility.
No capacity expansion is planned.
The emission reductions are claimed by the generator of
energy using waste energy
Emission reductions will be claimed by
AIS, the generator of energy using the waste
energy.
In cases where the energy is exported to other facilities, an
official agreement exists between the owners of the
project energy generation plant with the recipient plant(s)
that the emission reductions would not be claimed by
recipient plant(s) for using a zero0-emission energy source
N/A. Energy will not be exported to other
facilities.
For those facilities and recipients included in the project
boundary, that prior to implementation of the project
activity (current situation) generated energy on-site
(sources of energy in the baseline), the credits can be
claimed for minimum of the following time periods: The
remaining lifetime of equipment currently being used; and
the credit period
Credit will be claimed for emission
reductions achieved during the ten-year
crediting period.
Waste energy that is released under abnormal operation
(emergencies, shut down) of the plant shall not be
accounted for.
No credit will be claimed when waste
energy is released under abnormal operation
conditions such as emergencies or shut
downs.
In cases where waste energy recovery activities were
already implemented in other streams of WECM prior to
the implementation of the CDM project activity, the
following should be demonstrated: that there is no
decrease in energy generated from the waste energy
recovered previous to the implementation of the CDM
project activity, or in the case where there is a decrease in
energy generation from previously recovered waste
energy, it can be demonstrated that the decrease is due to a
decrease in generation of waste energy on account of the
factors not related to the project activity.
Waste energy recovery activities were
already implemented in other streams of
WECM prior to the implementation of the
CDM project. Those are separate streams
of WECM and will not affect the waste
energy stream used by the proposed project
activity. This situation shall be checked by
the DOE.
The project meets all applicability criteria of methodology ACM0012. The methodology is applicable to
the proposed Project.
PROJECT DESIGN DOCUMENT FORM (CDM PDD) - Version 03.1.
CDM – Executive Board
page 11
B.3. Description of the sources and gases included in the project boundary
As per ACM0012, the geographical extent of the project boundary shall include the following:
1. The industrial facility where waste energy is generated
The proposed project activity uses waste energy is generated in the AIS industrial facility.
2. The facility where process heat in element process/steam/electricity/mechanical energy is
generated (generator of process heat/stream/electricity/mechanical energy). Equipment
providing auxiliary heat to the waste energy recovery process shall be included within the
project boundary;
The project boundary shall encompass the AIS facility where residual heat is generated and
recovered to generate steam. No auxiliary heat is added to the waste heat recovery process and steam
generation process.
3. The facility/s where the process heat in the element process/steam/electricity/mechanical
energy is used (the recipient plant(s)) and /or grid where electricity is exported, if applicable.
The project boundary shall encompass the AIS facility where residual heat is generated and
recovered to generate steam, which is used to generate electricity. The amount of electricity
produced is used in its entirety in the AIS facility. It is sent to the AIS Power System, which is
connected to the CCPG.
Based on the “Tool to calculate the emission factor for an electricity system” version 1, the spatial extent
of the Project is the power plants that are physically connected through transmission and distribution
lines to the Project activity. As China has published a delineation of the Project electricity system and
connected electricity system, we use the CCPG as the Project electricity system, which includes Henan
province, Hubei province, Hunan province, Jiangxi province, Sichuan province and Chongqing.1
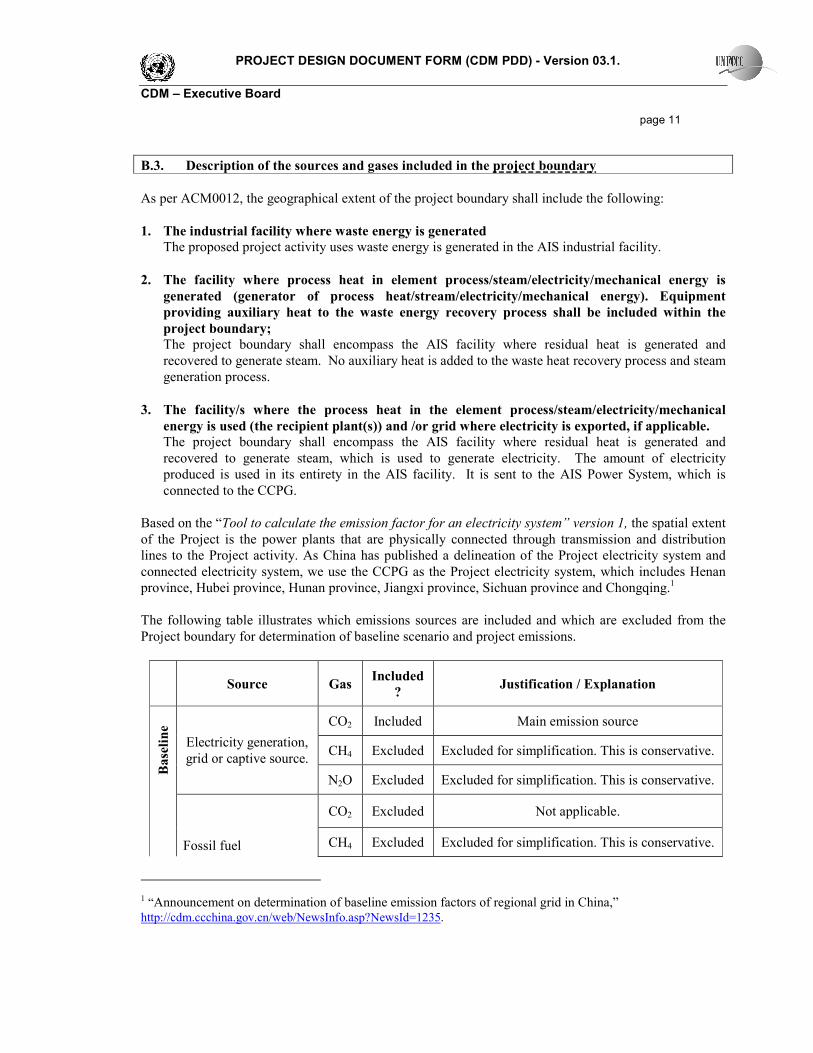
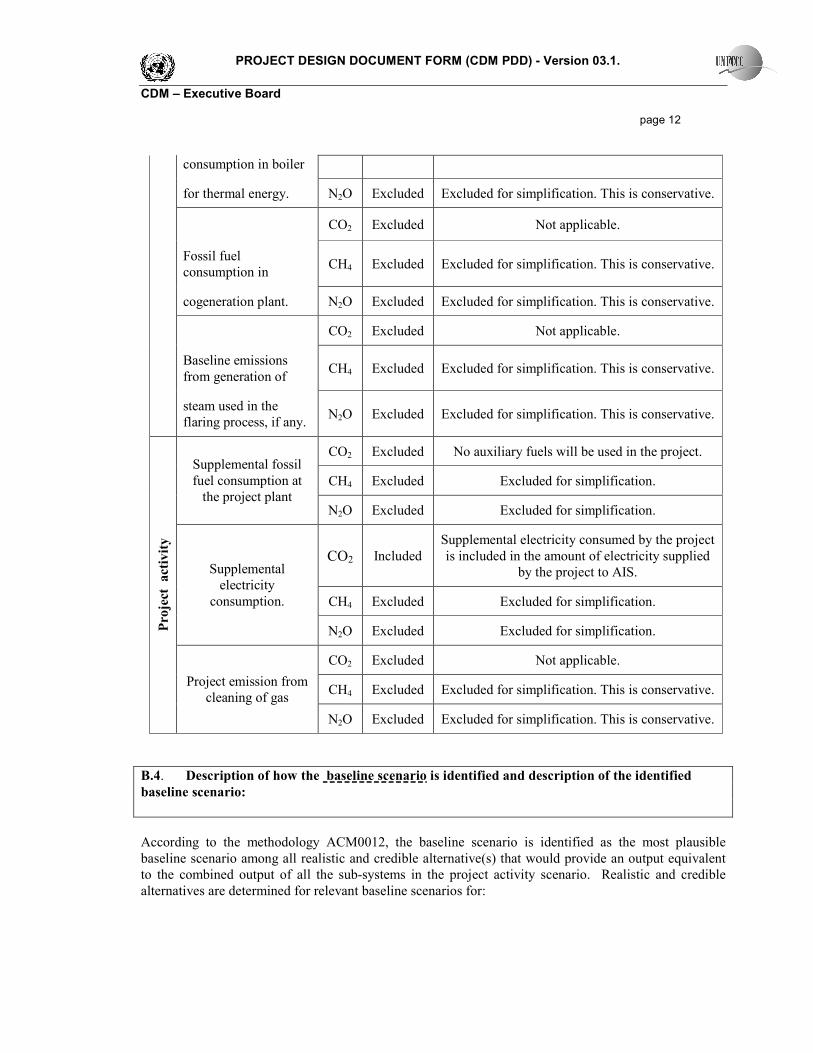
The following table illustrates which emissions sources are included and which are excluded from the
Project boundary for determination of baseline scenario and project emissions.
Source Gas Included
? Justification / Explanation
CO2 Included Main emission source
CH4 Excluded Excluded for simplification. This is conservative.
Base
line
Electricity generation,
grid or captive source.
N2O Excluded Excluded for simplification. This is conservative.
CO2 Excluded Not applicable.
Fossil fuel CH4 Excluded Excluded for simplification. This is conservative.
1 “Announcement on determination of baseline emission factors of regional grid in China,” http://cdm.ccchina.gov.cn/web/NewsInfo.asp?NewsId=1235.
PROJECT DESIGN DOCUMENT FORM (CDM PDD) - Version 03.1.
CDM – Executive Board
page 12
consumption in boiler
for thermal energy. N2O Excluded Excluded for simplification. This is conservative.
CO2 Excluded Not applicable.
Fossil fuel
consumption in CH4 Excluded Excluded for simplification. This is conservative.
cogeneration plant. N2O Excluded Excluded for simplification. This is conservative.
CO2 Excluded Not applicable.
Baseline emissions
from generation of CH4 Excluded Excluded for simplification. This is conservative.
steam used in the
flaring process, if any. N2O Excluded Excluded for simplification. This is conservative.
CO2 Excluded No auxiliary fuels will be used in the project.
CH4 Excluded Excluded for simplification.
Supplemental fossil
fuel consumption at
the project plant N2O Excluded Excluded for simplification.
CO2 Included
Supplemental electricity consumed by the project
is included in the amount of electricity supplied
by the project to AIS.
CH4 Excluded Excluded for simplification.
Supplemental
electricity
consumption.
N2O Excluded Excluded for simplification.
CO2 Excluded Not applicable.
CH4 Excluded Excluded for simplification. This is conservative.
Pro
ject
act
ivity
Project emission from
cleaning of gas
N2O Excluded Excluded for simplification. This is conservative.
B.4. Description of how the baseline scenario is identified and description of the identified
baseline scenario:
According to the methodology ACM0012, the baseline scenario is identified as the most plausible
baseline scenario among all realistic and credible alternative(s) that would provide an output equivalent
to the combined output of all the sub-systems in the project activity scenario. Realistic and credible
alternatives are determined for relevant baseline scenarios for:
PROJECT DESIGN DOCUMENT FORM (CDM PDD) - Version 03.1.
CDM – Executive Board
page 13
• Waste energy use in the absence of the project activity; and
• Power generation in the absence of the project activity.
The project participant shall exclude baseline options that:
• Do not comply with legal and regulatory requirements; or
• Depend on fuels that are not available at the project site.
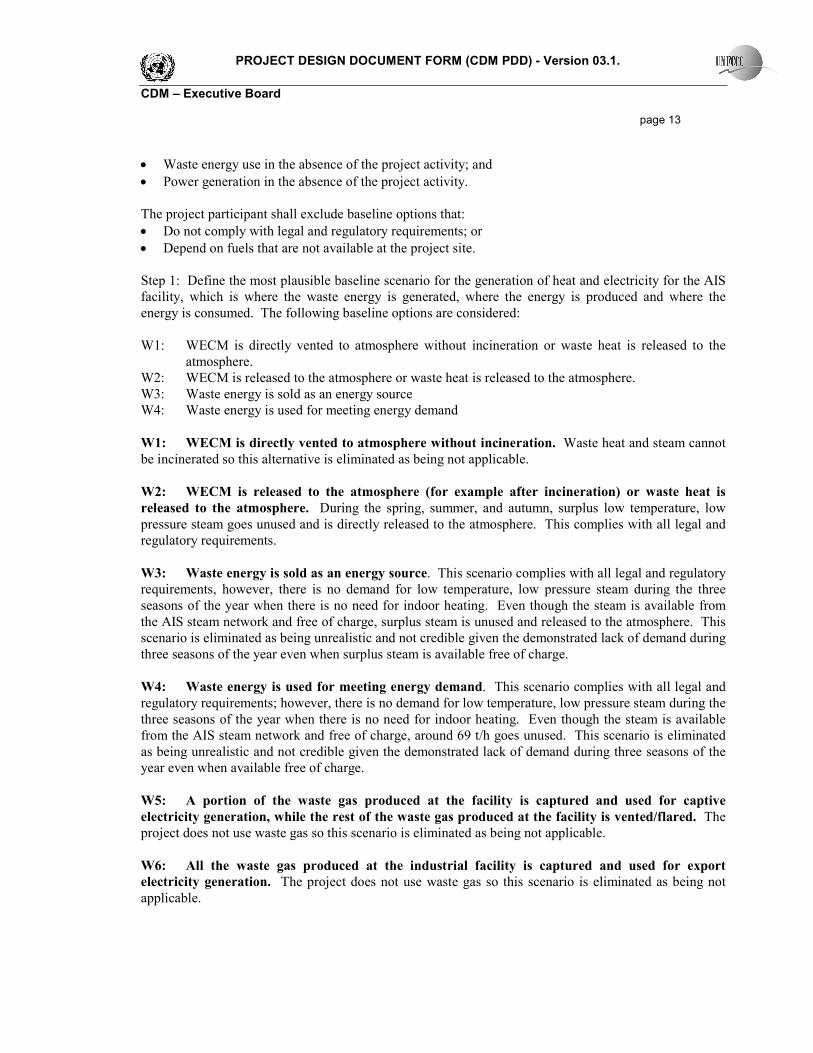
Step 1: Define the most plausible baseline scenario for the generation of heat and electricity for the AIS
facility, which is where the waste energy is generated, where the energy is produced and where the
energy is consumed. The following baseline options are considered:
W1: WECM is directly vented to atmosphere without incineration or waste heat is released to the
atmosphere.
W2: WECM is released to the atmosphere or waste heat is released to the atmosphere.
W3: Waste energy is sold as an energy source
W4: Waste energy is used for meeting energy demand
W1: WECM is directly vented to atmosphere without incineration. Waste heat and steam cannot
be incinerated so this alternative is eliminated as being not applicable.
W2: WECM is released to the atmosphere (for example after incineration) or waste heat is
released to the atmosphere. During the spring, summer, and autumn, surplus low temperature, low
pressure steam goes unused and is directly released to the atmosphere. This complies with all legal and
regulatory requirements.
W3: Waste energy is sold as an energy source. This scenario complies with all legal and regulatory
requirements, however, there is no demand for low temperature, low pressure steam during the three
seasons of the year when there is no need for indoor heating. Even though the steam is available from
the AIS steam network and free of charge, surplus steam is unused and released to the atmosphere. This
scenario is eliminated as being unrealistic and not credible given the demonstrated lack of demand during
three seasons of the year even when surplus steam is available free of charge.
W4: Waste energy is used for meeting energy demand. This scenario complies with all legal and
regulatory requirements; however, there is no demand for low temperature, low pressure steam during the
three seasons of the year when there is no need for indoor heating. Even though the steam is available
from the AIS steam network and free of charge, around 69 t/h goes unused. This scenario is eliminated
as being unrealistic and not credible given the demonstrated lack of demand during three seasons of the
year even when available free of charge.
W5: A portion of the waste gas produced at the facility is captured and used for captive
electricity generation, while the rest of the waste gas produced at the facility is vented/flared. The
project does not use waste gas so this scenario is eliminated as being not applicable.
W6: All the waste gas produced at the industrial facility is captured and used for export
electricity generation. The project does not use waste gas so this scenario is eliminated as being not
applicable.
PROJECT DESIGN DOCUMENT FORM (CDM PDD) - Version 03.1.
CDM – Executive Board
page 14
From the above analysis we can conclude that alternatives W1 (WECM is directly vented to
atmosphere without incineration) and W2 (WECM is released to the atmosphere (for example
after incineration) or waste heat is released to the atmosphere) are plausible baseline alternatives
for the use of waste steam.
Regarding power generation, the relevant baseline alternatives are as follows:
P1: Proposed project activity not undertaken as a CDM project activity;
P2: On-site or off-site existing/new fossil fuel fired cogeneration plant;
P3: On-site or off-site existing/new renewable energy based cogeneration plant;
P4: On-site or off-site existing/new fossil fuel based existing captive or identified plant;
P5: On-site or off-site existing/new renewable energy or other waste energy based existing captive or
identified plant;
P6: Sourced Grid-connected power plants;
P7: Captive Electricity generation using waste energy (if project activity is captive generation using
waste energy, this scenario represents captive generation with lower efficiency than the project activity.);
P8: Cogeneration using waste energy (if project activity is cogeneration with waste energy, this
scenario represents cogeneration with lower efficiency than the project activity).
P9: Existing power generating equipment (used previous to implementation of project activity for
captive electricity generation from a captured portion of waste gas) is either decommissioned to build
new more efficient and larger capacity plant or modified or expanded (by installing new equipment), and
resulting in higher efficiency, to produce and only export electricity generated from waste gas. The
electricity generated by existing equipment for captive consumption is now imported from the grid.
P10: Existing power generating equipment (used previous to implementation fo project activity for
captive electricity generation from a captured portion of waste gas) is either decommissioned to build
new more efficient and larger capacity plant or modified or expanded (by installing new equipment), and
resulting in higher efficiency, to produce electricity from waste gas (already utilized portion plus the
portion flared/vented) for own consumption and for export.
P11: Existing power generating equipment is maintained and additional electricity generated by grid
connected power plants.
P1: Proposed project activity not undertaken as a CDM project activity. This complies with all
applicable Chinese laws and regulations and is a realistic and credible baseline alternative.
P2: On-site or off-site existing/new fossil fuel fired cogeneration plant. The proposed Project is
for power generation only, therefore this option is not applicable and is excluded.
P3: On-site or off-site existing/new renewable energy based cogeneration plant. The proposed
Project is for power generation only, therefore this option is not applicable and is excluded.
P4: On-site or off-site existing/new fossil fuel based existing captive or identified plant. There is
no existing fossil fuel-based captive power plant in the AIS facility. Constructing a new fossil fuel-based
power plant is prohibited by the “Notice from the General Office of the PRC State Council on Strictly
Prohibiting Constructing Thermal Power Units with the Capacity under 135MW” (state council public
notice [2002] No.6). The proposed project activity would install a 15MW power generation unit, which
is well within the regulatory prohibition.
PROJECT DESIGN DOCUMENT FORM (CDM PDD) - Version 03.1.
CDM – Executive Board
page 15
Existing fossil fuel based plants are connected to the power grid and identified individual plants
therefore cannot supply electricity directly to AIS. This option cannot be considered a realistic and
credible baseline alternative.
P5: On-site or off-site existing/new renewable energy based existing captive or identified plant.
There are no hydro power or wind power resources that can be developed in the area of the project
activity, and the cost of solar energy is prohibitively high. New biomass power projects under
development in Henan Province are hundreds of kilometres away, so it would not be economically
feasible to import electricity from these biomass power plants directly. Furthermore, new biomass power
plants in this area are applying for CDM registration and therefore face different technology and
economic barriers. Existing biomass power plants are connected to the CCPG and cannot therefore
supply electricity directly to the plant. Hence this option cannot be considered a realistic and credible
baseline alternative.
P6: Sourced Grid-connected power plants. This is the current situation. Power demand is met by
the electricity delivered from the local grid, which is part of the Central China Power Grid. P6 is a
realistic and credible baseline alternative.
P7: Captive Electricity generation from waste energy (if project activity is captive generation
using waste energy, this scenario represents captive generation with lower efficiency than the
project activity.) Power could be generated using the low temperature, low pressure steam in a lower
efficiency steam generator. This option would face even greater financial barriers as the financial returns
from a lower efficiency boiler would be lower than for the Project. This is because the power output
would be lower and a larger system would be needed to provide an equivalent amount of power as the
proposed project. P7 is not a realistic baseline alternative.
P8: Cogeneration using waste energy (if project activity is cogeneration with waste energy, this
scenario represents cogeneration with lower efficiency than the project activity). The proposed
Project is for power generation only; therefore this option is not applicable and is excluded.
P9: Existing power generating equipment (used previous to implementation of project activity
for captive electricity generation from a captured portion of waste gas) is either decommissioned to
build new more efficient and larger capacity plant or modified or expanded (by installing new
equipment), and resulting in higher efficiency, to produce and only export electricity generated
from waste gas. The electricity generated by existing equipment for captive consumption is now
imported from the grid. Prior to the proposed project activity, there is no existing power generating
equipment using the low temperature, low pressure steam. P9 is not applicable and is excluded.
P10: Existing power generating equipment (used previous to implementation of project activity
for captive electricity generation from a captured portion of waste gas) is either decommissioned to
build new more efficient and larger capacity plant or modified or expanded (by installing new
equipment), and resulting in higher efficiency, to produce electricity from waste gas (already
utilized portion plus the portion flared/vented) for own consumption and for export. Prior to the
proposed project activity, there is no existing power generating equipment using the low temperature,
low pressure steam, and the project does not use waste gas. P10 is not applicable and is excluded.
PROJECT DESIGN DOCUMENT FORM (CDM PDD) - Version 03.1.
CDM – Executive Board
page 16
P11: Existing power generating equipment is maintained and additional electricity generated by
grid connected power plants. There is no existing power generating equipment using the low
temperature, low pressure steam. P11 is not applicable and is excluded.
The project does not involve heat generation or mechanical energy so no baseline scenarios for heat and
mechanical energy are considered.
From the above analysis we can conclude that the scenarios W1 (WECM is directly vented to the
atmosphere), W2 (WECM is released to the atmosphere), P1 (Proposed Project activity not undertaken as
a CDM Project activity), and P6 (Sourced Grid-connected power plants) are realistic and baseline
scenarios for power generation. All comply with legal and regulatory requirements and do not depend on
fuels that are not available at the project site.
In summary, there are two baseline alternatives:
Baseline options
Scenario Waste
energy Power
Description of situation
1 W2 P6 WECM is released to the atmosphere and electricity is obtained
from the grid.
2 W2 P1 WECM is released to the atmosphere and the Proposed Project
activity is not undertaken as a CDM Project activity
Step 2: Identify the fuel for the baseline choice of energy source taking into account the national
and/or sectoral policies as applicable
In neither scenario 1 or 2 above is a choice of baseline fuel applicable. Therefore, this step is omitted.
Step 3: Step 2 and/ or Step 3 of the latest approved version of the “Tool for the demonstration and
assessment of additionality” shall be used to identify the most plausible baseline scenario by eliminating
non-feasible options
Section B.5 shall demonstrates that scenario 2 (Proposed activity not undertaken as a CDM activity) is
not economically attractive given its equity IRR of 11.32%, which falls short of the benchmark of 13%.
The proposed project activity is financially unattractive to AIS if it is not undertaken as a CDM Project
activity. Please see Section B.5 Step 3.
Therefore only one baseline scenario remains:
Baseline options Scenario
Waste energy Power Description of situation
1 W2 P6 WECM is released to the atmosphere and electricity is
obtained from the grid.
Step 4: If more than one credible and plausible scenario remain, the alternative with the lowest
baseline emissions shall be considered as the most likely baseline scenario.
PROJECT DESIGN DOCUMENT FORM (CDM PDD) - Version 03.1.
CDM – Executive Board
page 17
Only one baseline scenario remains so this step is not applicable.
Conclusion:
The baseline scenario has been determined to be:
Baseline Scenario
Waste
energy Power
Description of situation
W2 P6 WECM is released to the atmosphere and electricity is obtained from
the grid.
B.5. Description of how the anthropogenic emissions of GHG by sources are reduced below
those that would have occurred in the absence of the registered CDM project activity (assessment
and demonstration of additionality):
According to ACM0012, the additionality of the project should be assessed using the latest version of the
“Tool for the demonstration and assessment of additionality” (in this case version 5.02, EB39).
Step 1. Identification of alternatives to the project activity consistent with current laws and
regulations
Sub-step 1a. Define alternatives to the project activity:
According to the Additionality Tool, these alternatives shall include:
(a) The proposed project activity undertaken without being registered as a CDM project activity
– this is represented in Scenario 2.
(b) Other realistic and credible alternative scenario(s) that deliver comparable outputs – this is
represented by both Scenarios 1 and 2.
(c) Continuation of the current situation – this is represented by Scenario 1.
As discussed in section B.4, there are two realistic and credible baseline alternatives that provide outputs
comparable with the proposed CDM project activity:
Baseline options
Scenario Waste
energy Power
Description of situation
1 W2 P6 WECM is released to the atmosphere and electricity is obtained
from the grid.
2 W2 P1 WECM is released to the atmosphere and the Proposed Project
activity is not undertaken as a CDM Project activity
Outcome of Step 1a: identified realistic and credible alternative scenario(s) to the project activity are
shown in the table above.
PROJECT DESIGN DOCUMENT FORM (CDM PDD) - Version 03.1.
CDM – Executive Board
page 18
Sub-step 1b: Consistency with mandatory laws and regulations
Both of the alternative combinations W1/P6 and W2/P1 are consistent with current mandatory laws and
regulations. The Project activity is not the only alternative amongst the ones considered above, therefore
the proposed CDM project activity passes this Step.
Outcome of step 1b:
The realistic and credible alternative scenarios to the activity are the same as for sub-step 1a above.
Step 2. Investment analysis
Determine whether the proposed project activity is not:
(a) The most economically or financially attractive; or
(b) Economically or financially feasible, without the revenue from the sale of certified emission
reductions (CERs).
Sub-step 2a. Determine appropriate analysis method
Since the Project generates benefits other than CDM-related income through the electric power that will
be produced, simple cost analysis is not employed. Instead this project will apply benchmark analysis
(Option III).
Sub-step 2b – Option III. Apply benchmark analysis
The financial indicator most suitable for the project type and decision context is the equity IRR. This
analysis is based on parameters that are standard in the market, considering the specific characteristics of
the project type.
The benchmark used by the proposed project activity is taken from a government/official source that
determines the financial feasibility of investment decisions according to economic sector. According to
“Methods and Parameters for Economic Assessment of Construction Project (version 3),” a proposed
project in the iron and steel sector is considered financially feasible only if its internal rate of return (IRR)
surpasses the sectoral benchmark IRR. Although the Project is a power generation project, AIS’s core
field, including for investment decisions, is the iron and steel industry and the investment that would
otherwise go toward the expansion of iron and steel production. The iron and steel industry sectoral
benchmark is the appropriate and relevant benchmark equity IRR, which is 13%.2
Sub-step 2c. Calculation and comparison of financial indicators (only applicable to options II and
option III)
2 National Development and Reform Commission and Ministry of Commerce. “Methodology and Parameters for
Economic Evaluation of Construction Projects,” version 3, Beijing, 2006, p. 204.
PROJECT DESIGN DOCUMENT FORM (CDM PDD) - Version 03.1.
CDM – Executive Board
page 19
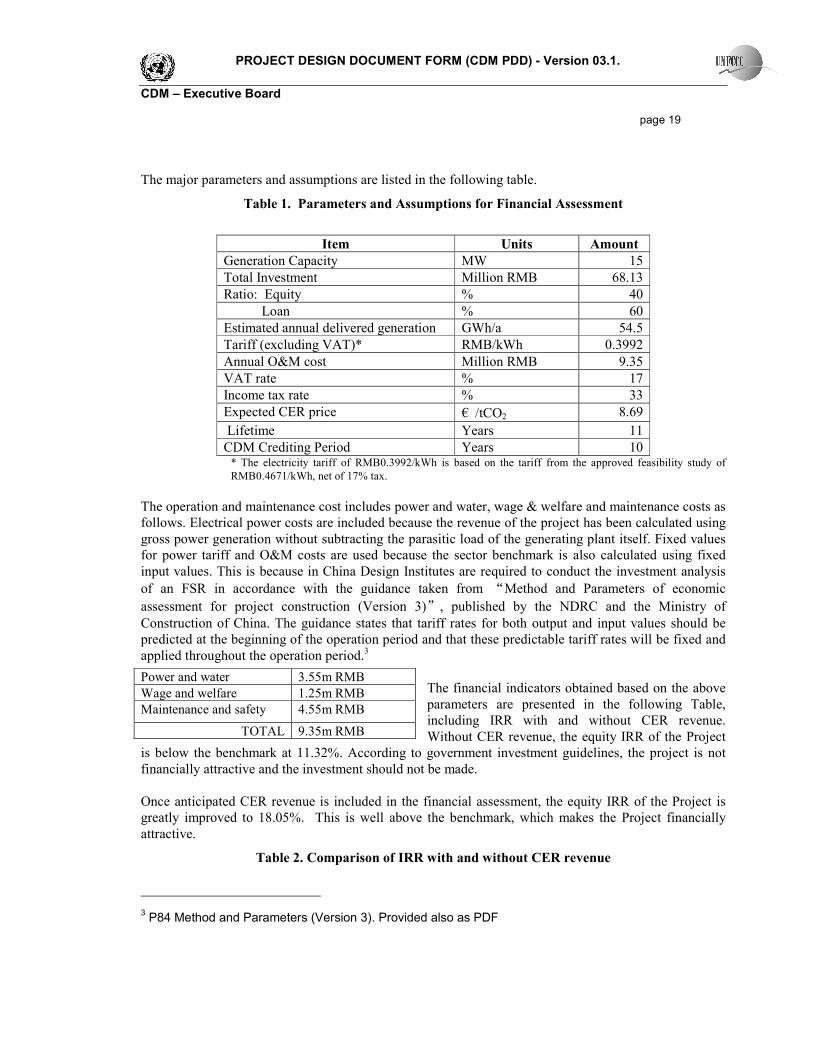
The major parameters and assumptions are listed in the following table.
Table 1. Parameters and Assumptions for Financial Assessment
Item Units Amount
Generation Capacity MW 15
Total Investment Million RMB 68.13
Ratio: Equity % 40
Loan % 60
Estimated annual delivered generation GWh/a 54.5
Tariff (excluding VAT)* RMB/kWh 0.3992
Annual O&M cost Million RMB 9.35
VAT rate % 17
Income tax rate % 33
Expected CER price € /tCO2 8.69
Lifetime Years 11
CDM Crediting Period Years 10 * The electricity tariff of RMB0.3992/kWh is based on the tariff from the approved feasibility study of
RMB0.4671/kWh, net of 17% tax.
The operation and maintenance cost includes power and water, wage & welfare and maintenance costs as
follows. Electrical power costs are included because the revenue of the project has been calculated using
gross power generation without subtracting the parasitic load of the generating plant itself. Fixed values
for power tariff and O&M costs are used because the sector benchmark is also calculated using fixed
input values. This is because in China Design Institutes are required to conduct the investment analysis
of an FSR in accordance with the guidance taken from “Method and Parameters of economic
assessment for project construction (Version 3)”, published by the NDRC and the Ministry of
Construction of China. The guidance states that tariff rates for both output and input values should be
predicted at the beginning of the operation period and that these predictable tariff rates will be fixed and
applied throughout the operation period.3
The financial indicators obtained based on the above
parameters are presented in the following Table,
including IRR with and without CER revenue.
Without CER revenue, the equity IRR of the Project
is below the benchmark at 11.32%. According to government investment guidelines, the project is not
financially attractive and the investment should not be made.
Once anticipated CER revenue is included in the financial assessment, the equity IRR of the Project is
greatly improved to 18.05%. This is well above the benchmark, which makes the Project financially
attractive.
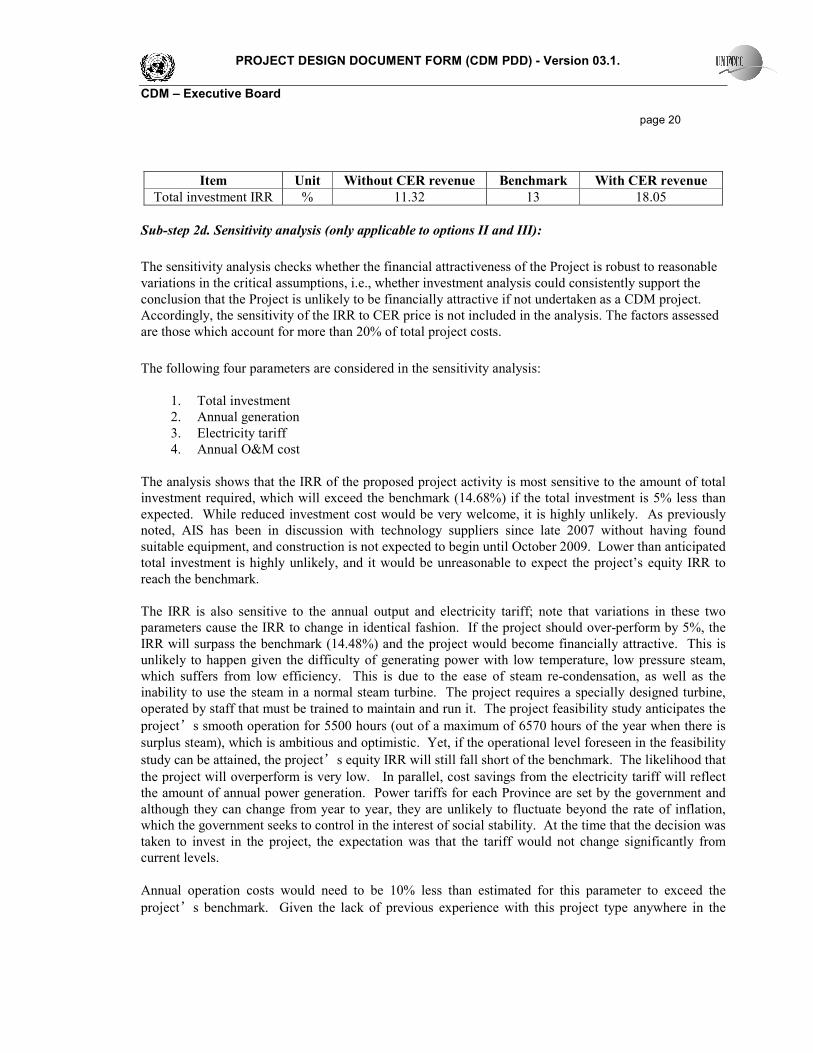
Table 2. Comparison of IRR with and without CER revenue
3 P84 Method and Parameters (Version 3). Provided also as PDF
Power and water 3.55m RMB
Wage and welfare 1.25m RMB
Maintenance and safety 4.55m RMB
TOTAL 9.35m RMB
PROJECT DESIGN DOCUMENT FORM (CDM PDD) - Version 03.1.
CDM – Executive Board
page 20
Item Unit Without CER revenue Benchmark With CER revenue
Total investment IRR % 11.32 13 18.05
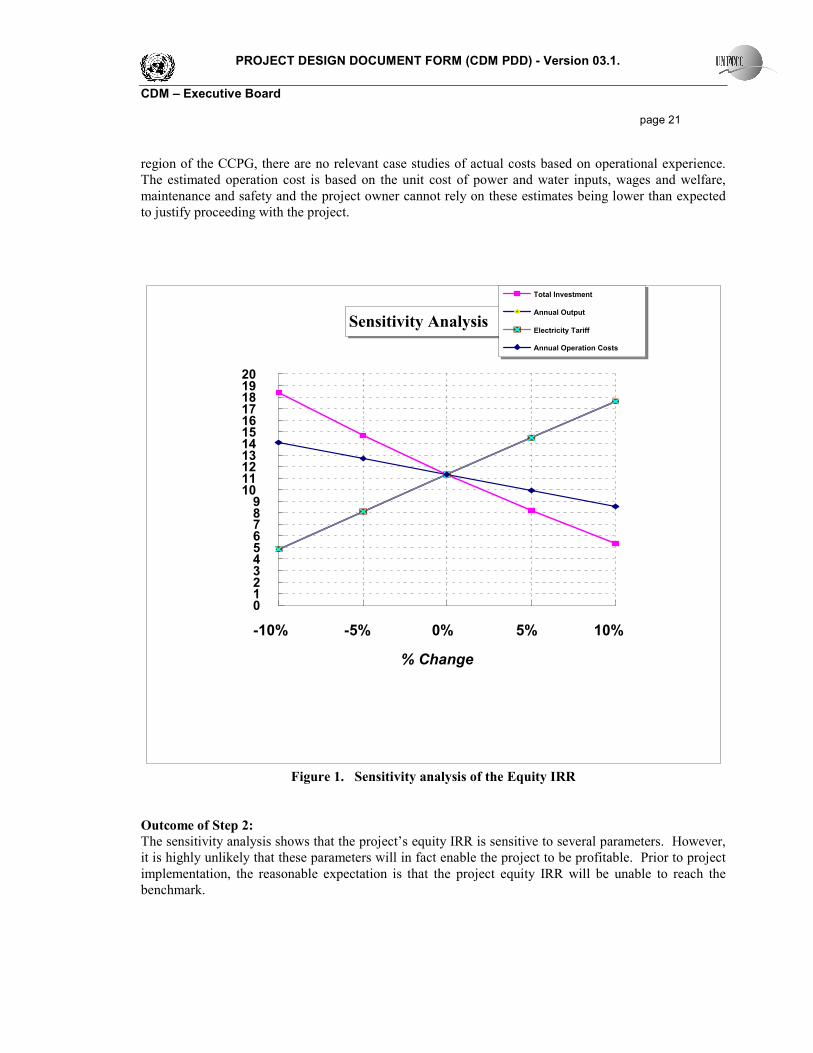
Sub-step 2d. Sensitivity analysis (only applicable to options II and III):
The sensitivity analysis checks whether the financial attractiveness of the Project is robust to reasonable
variations in the critical assumptions, i.e., whether investment analysis could consistently support the
conclusion that the Project is unlikely to be financially attractive if not undertaken as a CDM project.
Accordingly, the sensitivity of the IRR to CER price is not included in the analysis. The factors assessed
are those which account for more than 20% of total project costs.
The following four parameters are considered in the sensitivity analysis:
1. Total investment
2. Annual generation
3. Electricity tariff
4. Annual O&M cost
The analysis shows that the IRR of the proposed project activity is most sensitive to the amount of total
investment required, which will exceed the benchmark (14.68%) if the total investment is 5% less than
expected. While reduced investment cost would be very welcome, it is highly unlikely. As previously
noted, AIS has been in discussion with technology suppliers since late 2007 without having found
suitable equipment, and construction is not expected to begin until October 2009. Lower than anticipated
total investment is highly unlikely, and it would be unreasonable to expect the project’s equity IRR to
reach the benchmark.
The IRR is also sensitive to the annual output and electricity tariff; note that variations in these two
parameters cause the IRR to change in identical fashion. If the project should over-perform by 5%, the
IRR will surpass the benchmark (14.48%) and the project would become financially attractive. This is
unlikely to happen given the difficulty of generating power with low temperature, low pressure steam,
which suffers from low efficiency. This is due to the ease of steam re-condensation, as well as the
inability to use the steam in a normal steam turbine. The project requires a specially designed turbine,
operated by staff that must be trained to maintain and run it. The project feasibility study anticipates the
project’s smooth operation for 5500 hours (out of a maximum of 6570 hours of the year when there is
surplus steam), which is ambitious and optimistic. Yet, if the operational level foreseen in the feasibility
study can be attained, the project’s equity IRR will still fall short of the benchmark. The likelihood that
the project will overperform is very low. In parallel, cost savings from the electricity tariff will reflect
the amount of annual power generation. Power tariffs for each Province are set by the government and
although they can change from year to year, they are unlikely to fluctuate beyond the rate of inflation,
which the government seeks to control in the interest of social stability. At the time that the decision was
taken to invest in the project, the expectation was that the tariff would not change significantly from
current levels.
Annual operation costs would need to be 10% less than estimated for this parameter to exceed the
project’s benchmark. Given the lack of previous experience with this project type anywhere in the
PROJECT DESIGN DOCUMENT FORM (CDM PDD) - Version 03.1.
CDM – Executive Board
page 21
region of the CCPG, there are no relevant case studies of actual costs based on operational experience.
The estimated operation cost is based on the unit cost of power and water inputs, wages and welfare,
maintenance and safety and the project owner cannot rely on these estimates being lower than expected
to justify proceeding with the project.
Sensitivity Analysis
0123456789
1011121314151617181920
-10% -5% 0% 5% 10%
% Change
Total Investment
Annual Output
Electricity Tariff
Annual Operation Costs
Figure 1. Sensitivity analysis of the Equity IRR
Outcome of Step 2:
The sensitivity analysis shows that the project’s equity IRR is sensitive to several parameters. However,
it is highly unlikely that these parameters will in fact enable the project to be profitable. Prior to project
implementation, the reasonable expectation is that the project equity IRR will be unable to reach the
benchmark.
PROJECT DESIGN DOCUMENT FORM (CDM PDD) - Version 03.1.
CDM – Executive Board
page 22
Step 3. Barrier analysis
Omitted because additionality ahs been demonstrated through investment analysis.
Step 4. Common practice analysis
Sub-step 4a. Analyze other activities similar to the proposed project activity:
There are over 20 iron and steel plants in Henan province alone, of which AIS is the largest. No other
similar plant utilizes surplus waste heat for power generation in their operations. Use of low-pressure and
temperature steam for power generation is generally very rare in an industrial context. There are no
similar projects at iron and steel plants anywhere on the Central China Power Grid, including the
provinces of Henan, Hubei, Jiangxi, Hunan, Sichuan and Chongqing city. The Project is the first of its
kind in the CCPG.
Sub-step 4b. Discuss any similar options that are occurring:
There are no similar project activities being undertaken in the CCPG region. This supports the
conclusion of Step 2 and Step 3 that the Project is not financially attractive and faces prohibitive barriers.
B.6. Emission reductions:
B.6.1. Explanation of methodological choices:
Baseline Emissions (BEy)
The baseline emissions for the year y shall be determined as follows:
yflstyEny BEBEBE ,, +=
Where:
BEy: The total baseline emissions during the year y in tons of CO2;
BEEn,y: The baseline emissions from energy generated by project activity during the year y in tons of CO2;
BEflst,y: Baseline emissions from steam generation, if any, using fossil fuel, that would have been used
for flaring the waste gas in absence of the project activity (tCO2e per year), calculated as per
equation 1c. This is relevant for those project activities where in the baseline steam is used to
flare the waste gas.
As in the baseline, there is no waste gas and no steam used to waste gas. Therefore, BEflst,y=0, and
PROJECT DESIGN DOCUMENT FORM (CDM PDD) - Version 03.1.
CDM – Executive Board
page 23
yBE = yEnBE , .
The calculation of baseline emissions depends on the identified baseline scenario. Since the proposed
project involves only generation of electricity the baseline emissions for the proposed project are
determined as follows:
yTheryElecyEn BEBEBE ,,, +=
Where:
BEElec,y : Baseline emissions from electricity during the year y in tons of CO2;
BETher,y : Baseline emissions from thermal energy (due to heat generation by element process)
during the year y in tons of CO2
As there is no heat generation in the proposed project, BETher,y,=0. Therefore yEnBE , = BEElec,y.
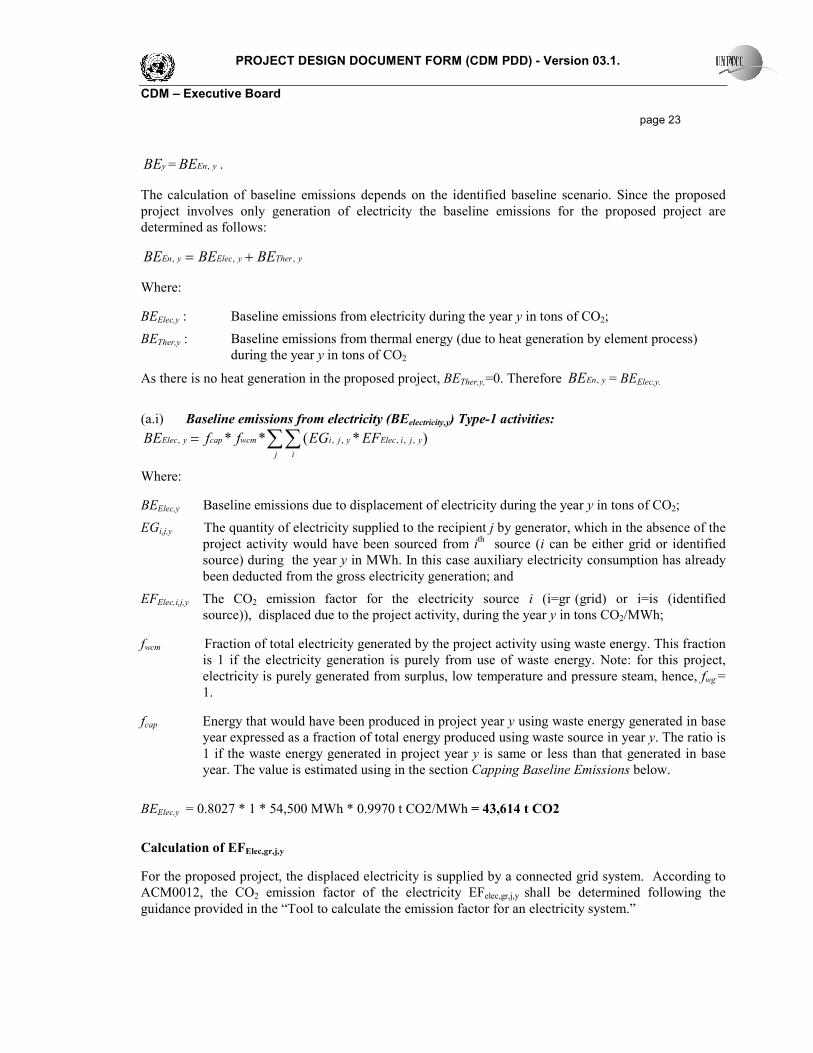
(a.i) Baseline emissions from electricity (BEelectricity,y) Type-1 activities:
∑∑=j i
yjiElecyjiwcmcapyElec EFEGffBE )*(** ,,,,,,
Where:
BEElec,y Baseline emissions due to displacement of electricity during the year y in tons of CO2;
EGi,j,y The quantity of electricity supplied to the recipient j by generator, which in the absence of the
project activity would have been sourced from ith source (i can be either grid or identified
source) during the year y in MWh. In this case auxiliary electricity consumption has already
been deducted from the gross electricity generation; and
EFElec,i,j,y The CO2 emission factor for the electricity source i (i=gr (grid) or i=is (identified
source)), displaced due to the project activity, during the year y in tons CO2/MWh;
fwcm Fraction of total electricity generated by the project activity using waste energy. This fraction
is 1 if the electricity generation is purely from use of waste energy. Note: for this project,
electricity is purely generated from surplus, low temperature and pressure steam, hence, fwg =
1.
fcap Energy that would have been produced in project year y using waste energy generated in base
year expressed as a fraction of total energy produced using waste source in year y. The ratio is
1 if the waste energy generated in project year y is same or less than that generated in base
year. The value is estimated using in the section Capping Baseline Emissions below.
BEElec,y = 0.8027 * 1 * 54,500 MWh * 0.9970 t CO2/MWh = 43,614 t CO2
Calculation of EFElec,gr,j,y
For the proposed project, the displaced electricity is supplied by a connected grid system. According to
ACM0012, the CO2 emission factor of the electricity EFelec,gr,j,y shall be determined following the
guidance provided in the “Tool to calculate the emission factor for an electricity system.”
PROJECT DESIGN DOCUMENT FORM (CDM PDD) - Version 03.1.
CDM – Executive Board
page 24
Step 1. Identify the relevant electric power system
The project electricity system is defined as the spatial extent of the power plants that are physically
connected through transmission and distribution lines to the project activity and that can be dispatched
without significant transmission constraints. The Chinese DNA has published a delineation of the
project electricity system. The relevant electric power system is the Central China Power Grid (CCPG),
which consists of Henan province, Hubei province, Hunan province, Jiangxi province, Sichuan province
and Chongqing municipality.
The operating margin emission factor may be determined using one of the following four options:
(a) 0 tCO2/MWh, or
(b) The weighted average operating margin (OM) emission rate of the exporting grid; or
(c) The simple operating margin emission rate of the exporting grid; or
(d) The simple adjusted operating margin emission rate of the exporting grid.
This project activity will employ option (c) to calculate the OM emission factor of the CCPG.
Step 2. Select an operating margin (OM) method
The calculation of the operating margin emission factor (EFgrid,OM,y) is based on one of the following
methods:
a) Simple OM
b) Simple adjusted OM
c) Dispatch data analysis OM
d) Average OM
It is appropriate to use the “Simple OM” to calculate the Operating Margin emission factor (EFOM,y) for
the following reasons:
• In China, the detailed dispatch information is not publicly available;
• According to the China Electric Power Yearbook (2003-2007), the CCPG is a coal-dominated
power grid. The installed capacity of low cost and must run plants account for 35.95%, 43.81%,
37.89%, 38.60% and 35.12% of total capacity in 2002, 2003, 2004, 2005 and 2006 respectively,
is less than 50%.
For simple OM, the emission factor can be calculated using either of the two following data vintages:
Ex ante option: A 3-year generation weighted average, based on the most recent data available at the time
of submission of the CDM-PDD for validation, without requirement to monitor and recalculate the
emissions factor during the crediting period, or
Ex post option: The year in which the project activity displaces grid electricity, requiring the emission
factor to be updated annually during monitoring. If the data required calculating the emission factor for
year y is usually only available later than six months after the end of year y.
The “ex ante” will be used for OM calculation of the project.
PROJECT DESIGN DOCUMENT FORM (CDM PDD) - Version 03.1.
CDM – Executive Board
page 25
Step 3. Calculate the operating margin emission factor according to selected method.
According to the “Tool to calculate the emission factor for an electricity system”, the Simple OM
emission factor is calculated as the generation-weighted average CO2 emissions per unit net electricity
generation (tCO2/MWh) of all generating power plants serving the system, not including low-operating
cost / must-run power plants / units. It may be calculated:
• Based on data on fuel consumption and net electricity generation of each power plant/unit (Option A)
• Based on data on net electricity generation, the average efficiency of each power unit and the fuel
type(s) used in each power unit (Option B)
• Based on data on the total net electricity generation of all power plants serving the system and the
fuel types and total fuel consumption of the project electricity system (Option C)
Data on fuel consumption, power generation and average efficiency of individual power stations is not
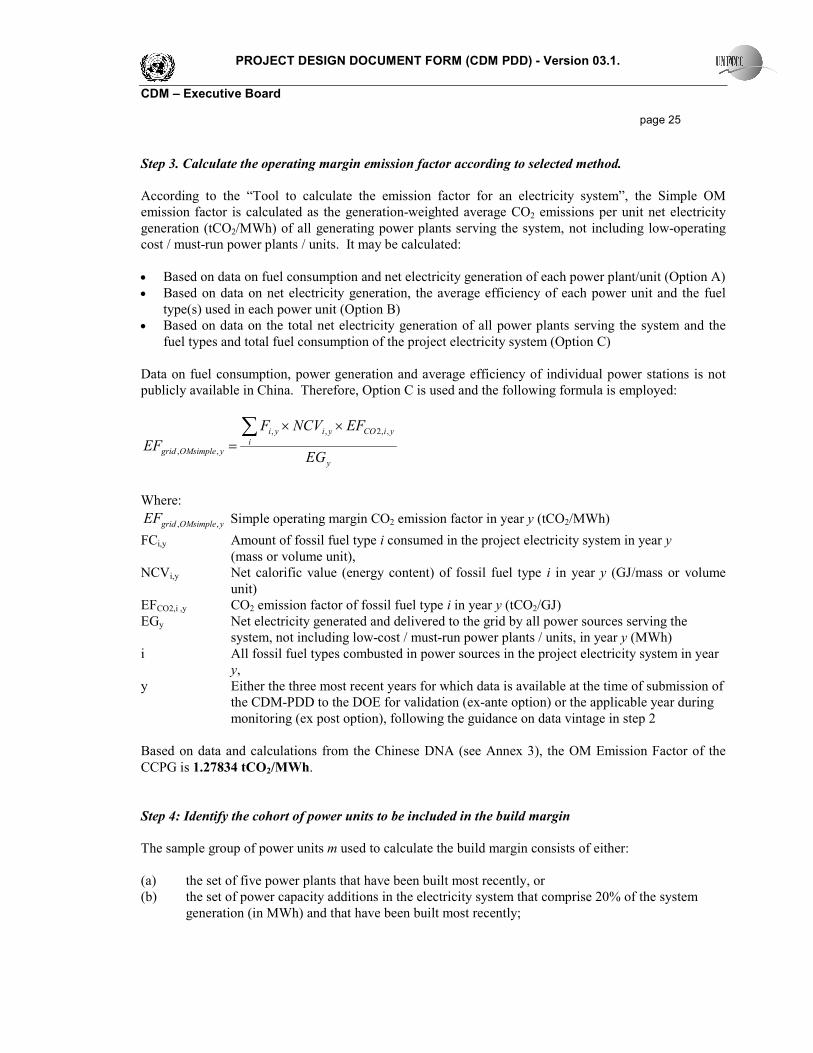
publicly available in China. Therefore, Option C is used and the following formula is employed:
y
i
yiCOyiyi
yOMsimplegridEG
EFNCVF
EF∑ ××
=
,,2,,
,,
Where:
yOMsimplegridEF ,, Simple operating margin CO2 emission factor in year y (tCO2/MWh)
FCi,y Amount of fossil fuel type i consumed in the project electricity system in year y
(mass or volume unit),
NCVi,y Net calorific value (energy content) of fossil fuel type i in year y (GJ/mass or volume
unit)
EFCO2,i ,y CO2 emission factor of fossil fuel type i in year y (tCO2/GJ)
EGy Net electricity generated and delivered to the grid by all power sources serving the
system, not including low-cost / must-run power plants / units, in year y (MWh)
i All fossil fuel types combusted in power sources in the project electricity system in year
y,
y Either the three most recent years for which data is available at the time of submission of
the CDM-PDD to the DOE for validation (ex-ante option) or the applicable year during
monitoring (ex post option), following the guidance on data vintage in step 2
Based on data and calculations from the Chinese DNA (see Annex 3), the OM Emission Factor of the
CCPG is 1.27834 tCO2/MWh.
Step 4: Identify the cohort of power units to be included in the build margin
The sample group of power units m used to calculate the build margin consists of either:
(a) the set of five power plants that have been built most recently, or
(b) the set of power capacity additions in the electricity system that comprise 20% of the system
generation (in MWh) and that have been built most recently;
PROJECT DESIGN DOCUMENT FORM (CDM PDD) - Version 03.1.
CDM – Executive Board
page 26
The set of power units that comprise the larger annual generation should be used. Option (b) is the
appropriate choice.
In terms of the vintage of the data, the proposed project activity selects Option 1: For the first crediting
period, the build margin emission factor is calculated ex-ante based on the most recent information
available on units already built for sample group m at the time of CDM-PDD submission to the DOE for
validation. This option does not require monitoring the emission factor during the crediting period.
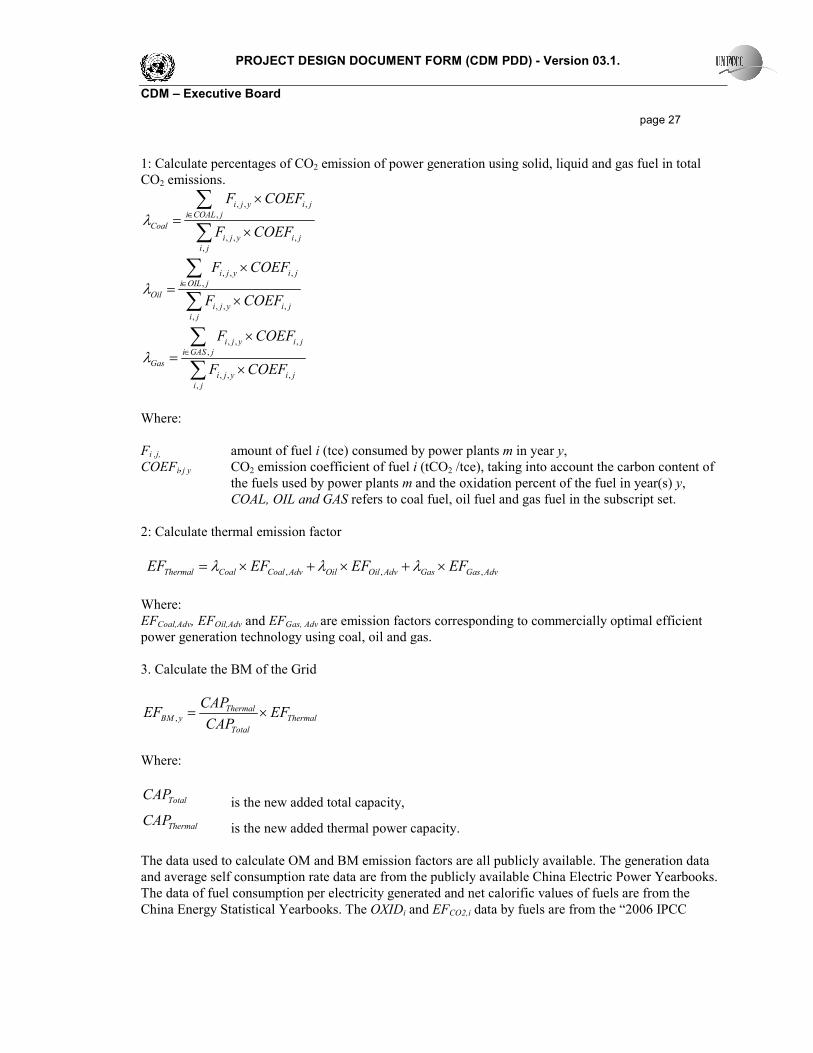
Step 5: Calculate the build margin emission factor
The build margin emissions factor is the generation-weighted average emission factor (tCO2/MWh) of all
power units m during the most recent year y for which power generation data is available, calculated as
follows:
∑
∑ ×
=
m
ym
m
ymELym
yBMgridEG
EFEG
EF,
,,,
,,
Where:
EFgrid,BM,y Build margin CO2 emission factor in year y (tCO2/MWh)
EGm,y Net quantity of electricity generated and delivered to the grid by power unit m in year y
(MWh)
EFEL,m,y CO2 emission factor of power unit m in year y
m Power units included in the build margin
y Most recent historical year for which power generation data is available
Following guidance issued by the CDM Executive Board in response to a request for guidance from an
accredited DOE on the determination of the Build Margin in methodology AM0005 in China, EFBM,y is
calculated as the capacity weighted average emissions factor of new installed capacity rather than the
generation weighted factor. Furthermore, it is suggested in the same guidance note that the efficiency
level of the best technology commercially available in the provincial/regional or national grid of China
shall be used as a conservative proxy for each fuel type in estimating the fuel consumption when
calculating the Build Margin. This approach is employed to determine the Build Margin.
Because capacities of technologies using coal, oil and gas cannot be separated from the total thermal
power generation using available data, the following method is used for the calculation: first, use the
most recent one year available energy balance data and calculate percentages of CO2 emissions of power
generation using solid, liquid and gas fuel in the total CO2 emission. Second, calculate grid thermal
power emission factors, using the percentages (as weights) and emission factors of technologies
corresponding to best available efficiencies. Lastly, the thermal power emission factor is multiplied by
the percentage of thermal power in the newest 20% capacity in the grid, and the result is the Build
Margin emission factor of the grid.
The steps and equations are as follows:
PROJECT DESIGN DOCUMENT FORM (CDM PDD) - Version 03.1.
CDM – Executive Board
page 27
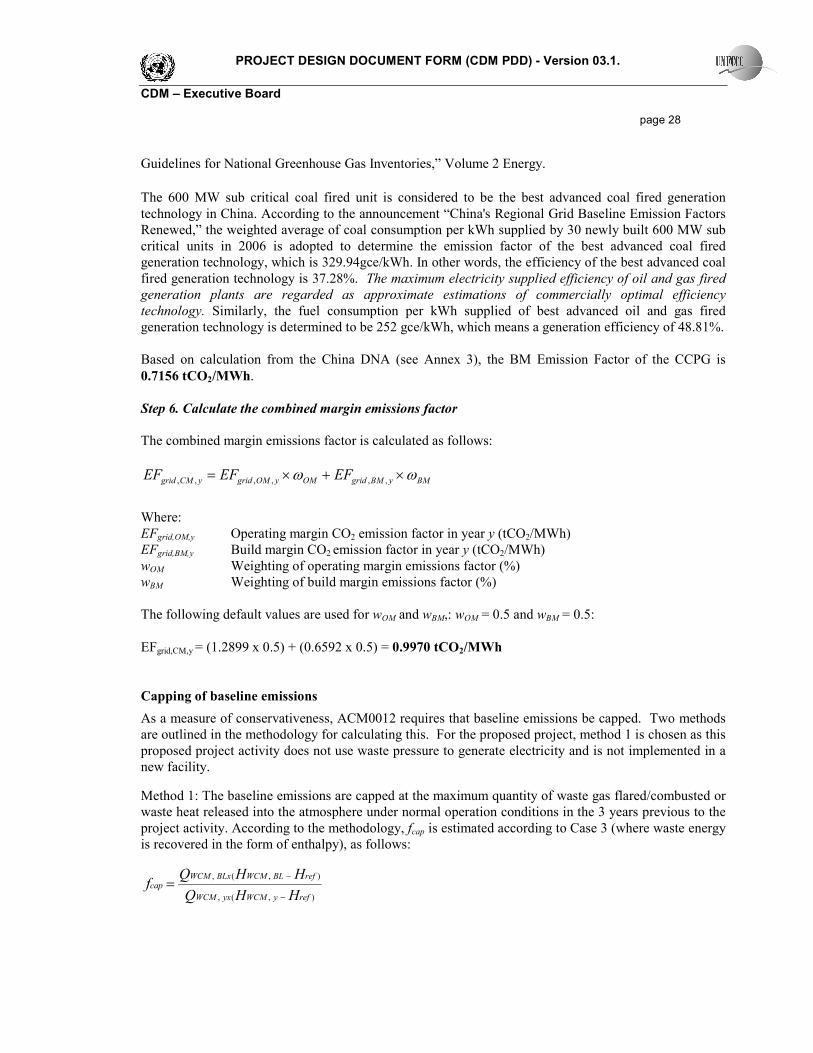
1: Calculate percentages of CO2 emission of power generation using solid, liquid and gas fuel in total
CO2 emissions.
, , ,
,
, , ,
,
i j y i j
i COAL j
Coal
i j y i j
i j
F COEF
F COEFλ
∈
×
=×
∑
∑
, , ,
,
, , ,
,
i j y i j
i OIL j
Oil
i j y i j
i j
F COEF
F COEFλ
∈
×
=×
∑
∑
, , ,
,
, , ,
,
i j y i j
i GAS j
Gas
i j y i j
i j
F COEF
F COEFλ
∈
×
=×
∑
∑
Where:
Fi ,j, amount of fuel i (tce) consumed by power plants m in year y,
COEFi,j y CO2 emission coefficient of fuel i (tCO2 /tce), taking into account the carbon content of
the fuels used by power plants m and the oxidation percent of the fuel in year(s) y,
COAL, OIL and GAS refers to coal fuel, oil fuel and gas fuel in the subscript set.
2: Calculate thermal emission factor
, , ,Thermal Coal Coal Adv Oil Oil Adv Gas Gas AdvEF EF EF EFλ λ λ= × + × + ×
Where:
EFCoal,Adv, EFOil,Adv and EFGas, Adv are emission factors corresponding to commercially optimal efficient
power generation technology using coal, oil and gas.
3. Calculate the BM of the Grid
,Thermal
BM y Thermal
Total
CAPEF EF
CAP= ×
Where:
TotalCAP is the new added total capacity,
ThermalCAP is the new added thermal power capacity.
The data used to calculate OM and BM emission factors are all publicly available. The generation data
and average self consumption rate data are from the publicly available China Electric Power Yearbooks.
The data of fuel consumption per electricity generated and net calorific values of fuels are from the
China Energy Statistical Yearbooks. The OXIDi and EFCO2,i data by fuels are from the “2006 IPCC
PROJECT DESIGN DOCUMENT FORM (CDM PDD) - Version 03.1.
CDM – Executive Board
page 28
Guidelines for National Greenhouse Gas Inventories,” Volume 2 Energy.
The 600 MW sub critical coal fired unit is considered to be the best advanced coal fired generation
technology in China. According to the announcement “China's Regional Grid Baseline Emission Factors
Renewed,” the weighted average of coal consumption per kWh supplied by 30 newly built 600 MW sub
critical units in 2006 is adopted to determine the emission factor of the best advanced coal fired
generation technology, which is 329.94gce/kWh. In other words, the efficiency of the best advanced coal
fired generation technology is 37.28%. The maximum electricity supplied efficiency of oil and gas fired
generation plants are regarded as approximate estimations of commercially optimal efficiency
technology. Similarly, the fuel consumption per kWh supplied of best advanced oil and gas fired
generation technology is determined to be 252 gce/kWh, which means a generation efficiency of 48.81%.
Based on calculation from the China DNA (see Annex 3), the BM Emission Factor of the CCPG is
0.7156 tCO2/MWh.
Step 6. Calculate the combined margin emissions factor
The combined margin emissions factor is calculated as follows:
BMyBMgridOMyOMgridyCMgrid EFEFEF ωω ×+×= ,,,,,,
Where:
EFgrid,OM,y Operating margin CO2 emission factor in year y (tCO2/MWh)
EFgrid,BM,y Build margin CO2 emission factor in year y (tCO2/MWh)
wOM Weighting of operating margin emissions factor (%)
wBM Weighting of build margin emissions factor (%)
The following default values are used for wOM and wBM,: wOM = 0.5 and wBM = 0.5:
EFgrid,CM,y = (1.2899 x 0.5) + (0.6592 x 0.5) = 0.9970 tCO2/MWh
Capping of baseline emissions
As a measure of conservativeness, ACM0012 requires that baseline emissions be capped. Two methods
are outlined in the methodology for calculating this. For the proposed project, method 1 is chosen as this
proposed project activity does not use waste pressure to generate electricity and is not implemented in a
new facility.
Method 1: The baseline emissions are capped at the maximum quantity of waste gas flared/combusted or
waste heat released into the atmosphere under normal operation conditions in the 3 years previous to the
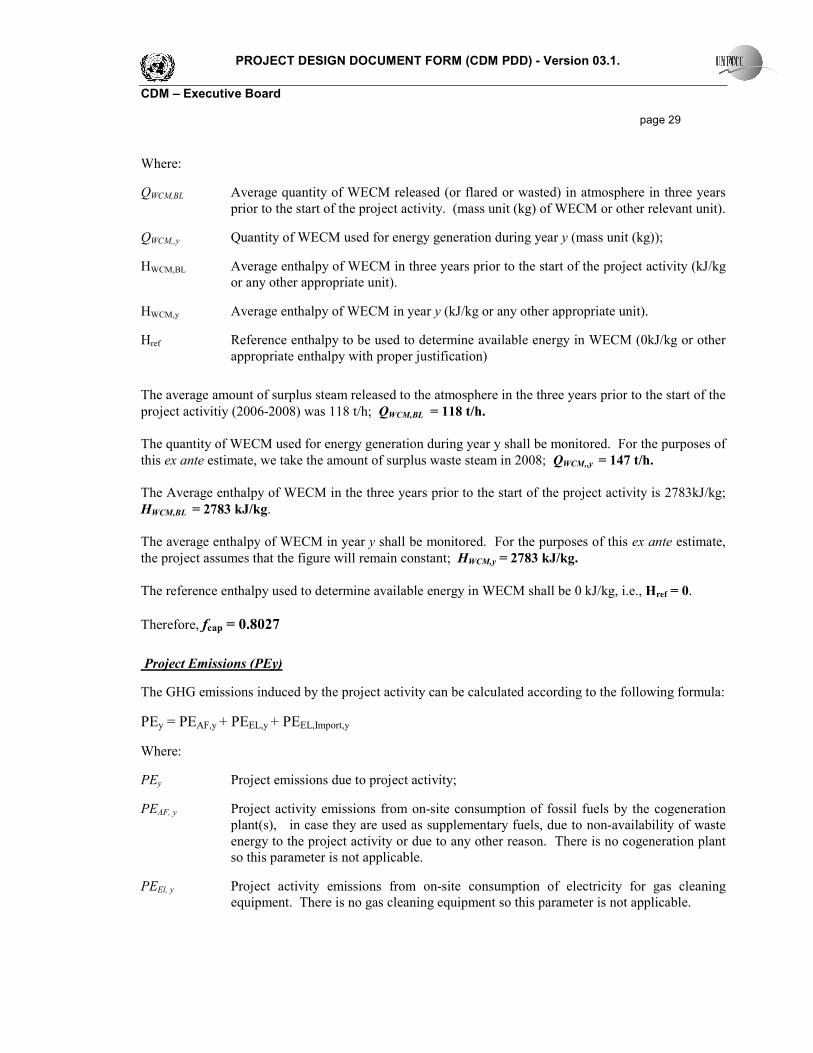
project activity. According to the methodology, fcap is estimated according to Case 3 (where waste energy
is recovered in the form of enthalpy), as follows:
),(,
),(,
refyWCMyxWCM
refBLWCMBLxWCMcap
HHQ
HHQf
−
−
=
PROJECT DESIGN DOCUMENT FORM (CDM PDD) - Version 03.1.
CDM – Executive Board
page 29
Where:
QWCM,BL Average quantity of WECM released (or flared or wasted) in atmosphere in three years
prior to the start of the project activity. (mass unit (kg) of WECM or other relevant unit).
QWCM,,y Quantity of WECM used for energy generation during year y (mass unit (kg));
HWCM,BL Average enthalpy of WECM in three years prior to the start of the project activity (kJ/kg
or any other appropriate unit).
HWCM,y Average enthalpy of WECM in year y (kJ/kg or any other appropriate unit).
Href Reference enthalpy to be used to determine available energy in WECM (0kJ/kg or other
appropriate enthalpy with proper justification)
The average amount of surplus steam released to the atmosphere in the three years prior to the start of the
project activitiy (2006-2008) was 118 t/h; QWCM,BL = 118 t/h.
The quantity of WECM used for energy generation during year y shall be monitored. For the purposes of
this ex ante estimate, we take the amount of surplus waste steam in 2008; QWCM,,y = 147 t/h.
The Average enthalpy of WECM in the three years prior to the start of the project activity is 2783kJ/kg;
HWCM,BL = 2783 kJ/kg.
The average enthalpy of WECM in year y shall be monitored. For the purposes of this ex ante estimate,
the project assumes that the figure will remain constant; HWCM,y = 2783 kJ/kg.
The reference enthalpy used to determine available energy in WECM shall be 0 kJ/kg, i.e., Href = 0.
Therefore, fcap = 0.8027
Project Emissions (PEy)
The GHG emissions induced by the project activity can be calculated according to the following formula:
PEy = PEAF,y + PEEL,y + PEEL,Import,y
Where:
PEy Project emissions due to project activity;
PEAF, y Project activity emissions from on-site consumption of fossil fuels by the cogeneration
plant(s), in case they are used as supplementary fuels, due to non-availability of waste
energy to the project activity or due to any other reason. There is no cogeneration plant
so this parameter is not applicable.
PEEl, y Project activity emissions from on-site consumption of electricity for gas cleaning
equipment. There is no gas cleaning equipment so this parameter is not applicable.
PROJECT DESIGN DOCUMENT FORM (CDM PDD) - Version 03.1.
CDM – Executive Board
page 30
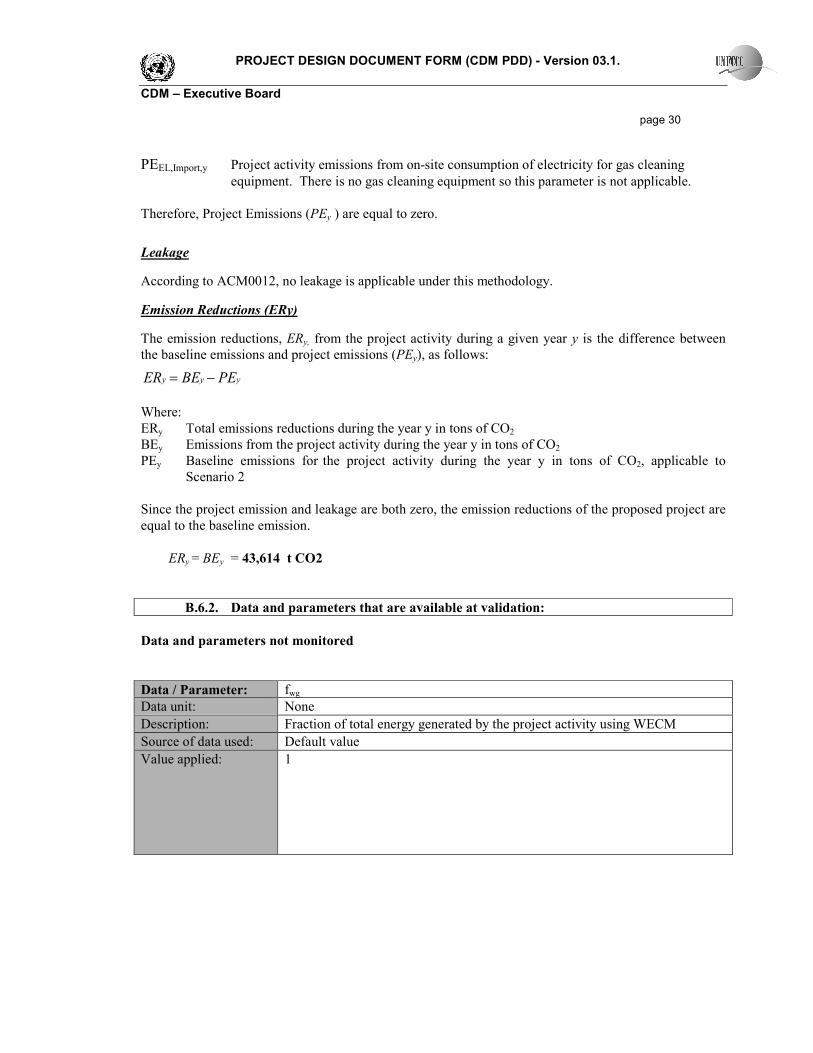
PEEL,Import,y Project activity emissions from on-site consumption of electricity for gas cleaning
equipment. There is no gas cleaning equipment so this parameter is not applicable.
Therefore, Project Emissions (PEy ) are equal to zero.
Leakage
According to ACM0012, no leakage is applicable under this methodology.
Emission Reductions (ERy)
The emission reductions, ERy, from the project activity during a given year y is the difference between
the baseline emissions and project emissions (PEy), as follows:
yyy PEBEER −=
Where:
ERy Total emissions reductions during the year y in tons of CO2
BEy Emissions from the project activity during the year y in tons of CO2
PEy Baseline emissions for the project activity during the year y in tons of CO2, applicable to
Scenario 2
Since the project emission and leakage are both zero, the emission reductions of the proposed project are
equal to the baseline emission.
ERy = BEy = 43,614 t CO2
B.6.2. Data and parameters that are available at validation:
Data and parameters not monitored
Data / Parameter: fwg
Data unit: None
Description: Fraction of total energy generated by the project activity using WECM
Source of data used: Default value
Value applied: 1
PROJECT DESIGN DOCUMENT FORM (CDM PDD) - Version 03.1.
CDM – Executive Board
page 31
Justification of the
choice of data or
description of
measurement methods
and procedures
actually applied :
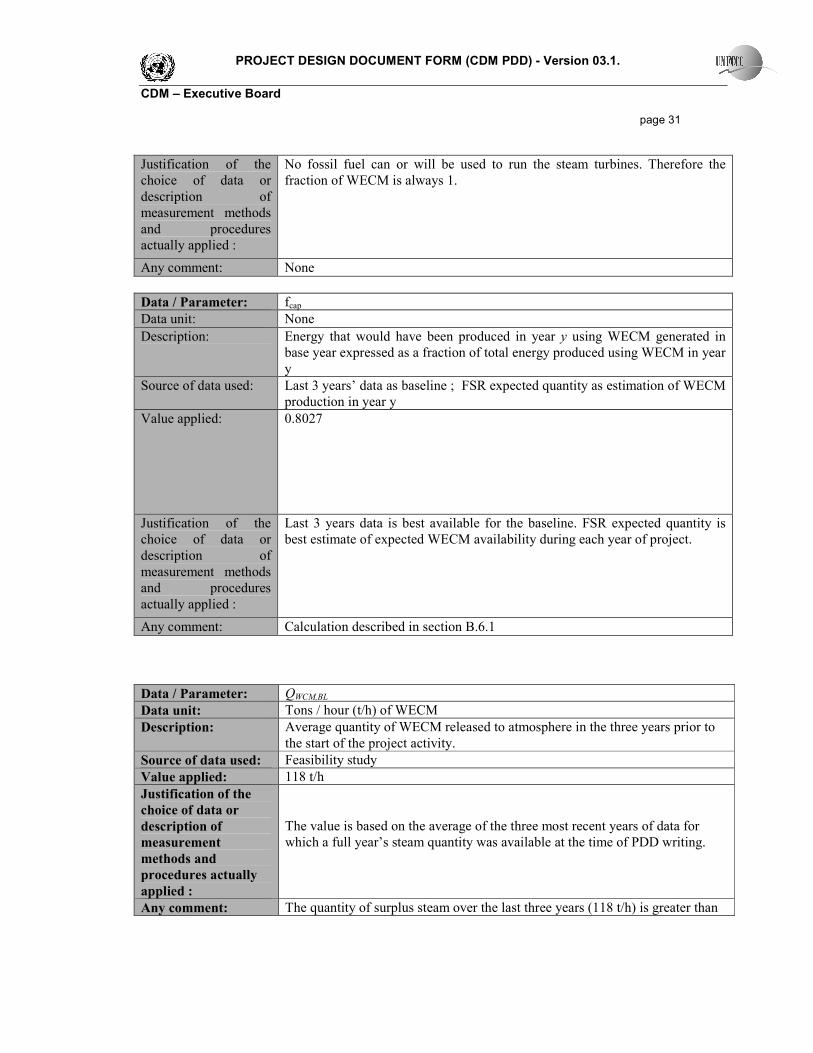
No fossil fuel can or will be used to run the steam turbines. Therefore the
fraction of WECM is always 1.
Any comment: None
Data / Parameter: fcap
Data unit: None
Description: Energy that would have been produced in year y using WECM generated in
base year expressed as a fraction of total energy produced using WECM in year
y
Source of data used: Last 3 years’ data as baseline ; FSR expected quantity as estimation of WECM
production in year y
Value applied: 0.8027
Justification of the
choice of data or
description of
measurement methods
and procedures
actually applied :
Last 3 years data is best available for the baseline. FSR expected quantity is
best estimate of expected WECM availability during each year of project.
Any comment: Calculation described in section B.6.1
Data / Parameter: QWCM,BL
Data unit: Tons / hour (t/h) of WECM
Description: Average quantity of WECM released to atmosphere in the three years prior to
the start of the project activity.
Source of data used: Feasibility study
Value applied: 118 t/h
Justification of the
choice of data or
description of
measurement
methods and
procedures actually
applied :
The value is based on the average of the three most recent years of data for
which a full year’s steam quantity was available at the time of PDD writing.
Any comment: The quantity of surplus steam over the last three years (118 t/h) is greater than
PROJECT DESIGN DOCUMENT FORM (CDM PDD) - Version 03.1.
CDM – Executive Board
page 32
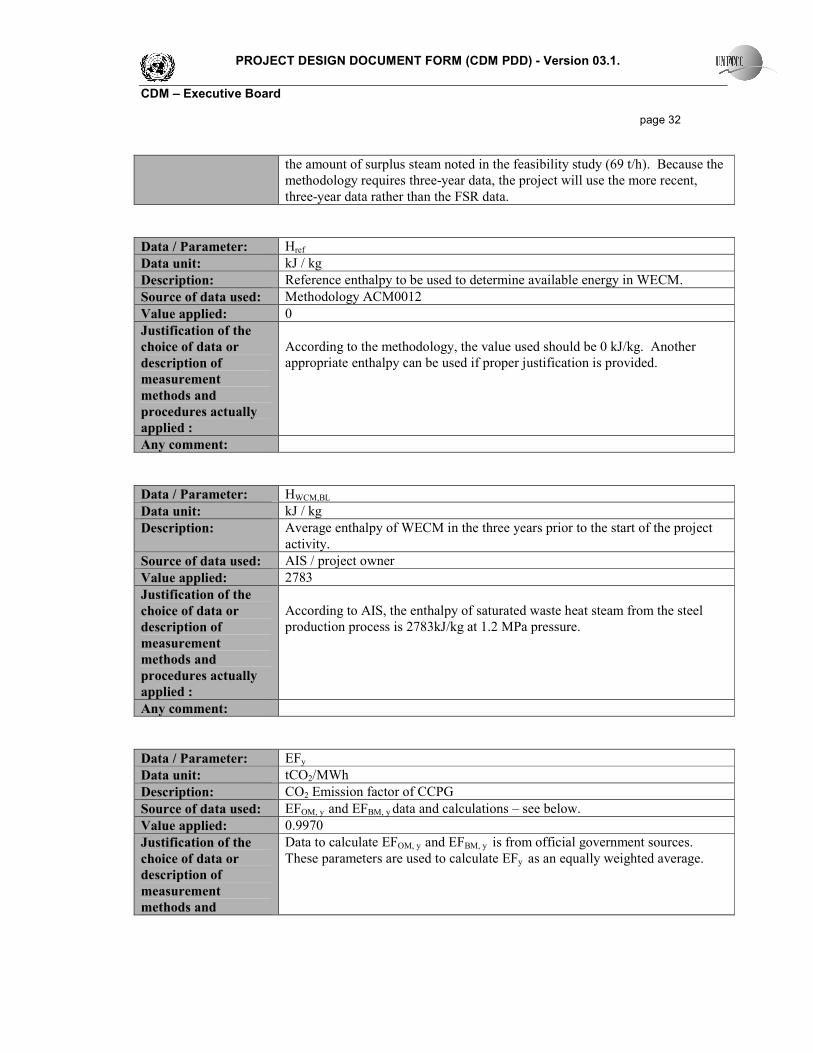
the amount of surplus steam noted in the feasibility study (69 t/h). Because the
methodology requires three-year data, the project will use the more recent,
three-year data rather than the FSR data.
Data / Parameter: Href
Data unit: kJ / kg
Description: Reference enthalpy to be used to determine available energy in WECM.
Source of data used: Methodology ACM0012
Value applied: 0
Justification of the
choice of data or
description of
measurement
methods and
procedures actually
applied :
According to the methodology, the value used should be 0 kJ/kg. Another
appropriate enthalpy can be used if proper justification is provided.
Any comment:
Data / Parameter: HWCM,BL
Data unit: kJ / kg
Description: Average enthalpy of WECM in the three years prior to the start of the project
activity.
Source of data used: AIS / project owner
Value applied: 2783
Justification of the
choice of data or
description of
measurement
methods and
procedures actually
applied :
According to AIS, the enthalpy of saturated waste heat steam from the steel
production process is 2783kJ/kg at 1.2 MPa pressure.
Any comment:
Data / Parameter: EFy
Data unit: tCO2/MWh
Description: CO2 Emission factor of CCPG
Source of data used: EFOM, y and EFBM, y data and calculations – see below.
Value applied: 0.9970
Justification of the
choice of data or
description of
measurement
methods and
Data to calculate EFOM, y and EFBM, y is from official government sources.
These parameters are used to calculate EFy as an equally weighted average.
PROJECT DESIGN DOCUMENT FORM (CDM PDD) - Version 03.1.
CDM – Executive Board
page 33
procedures actually
applied :
Any comment:
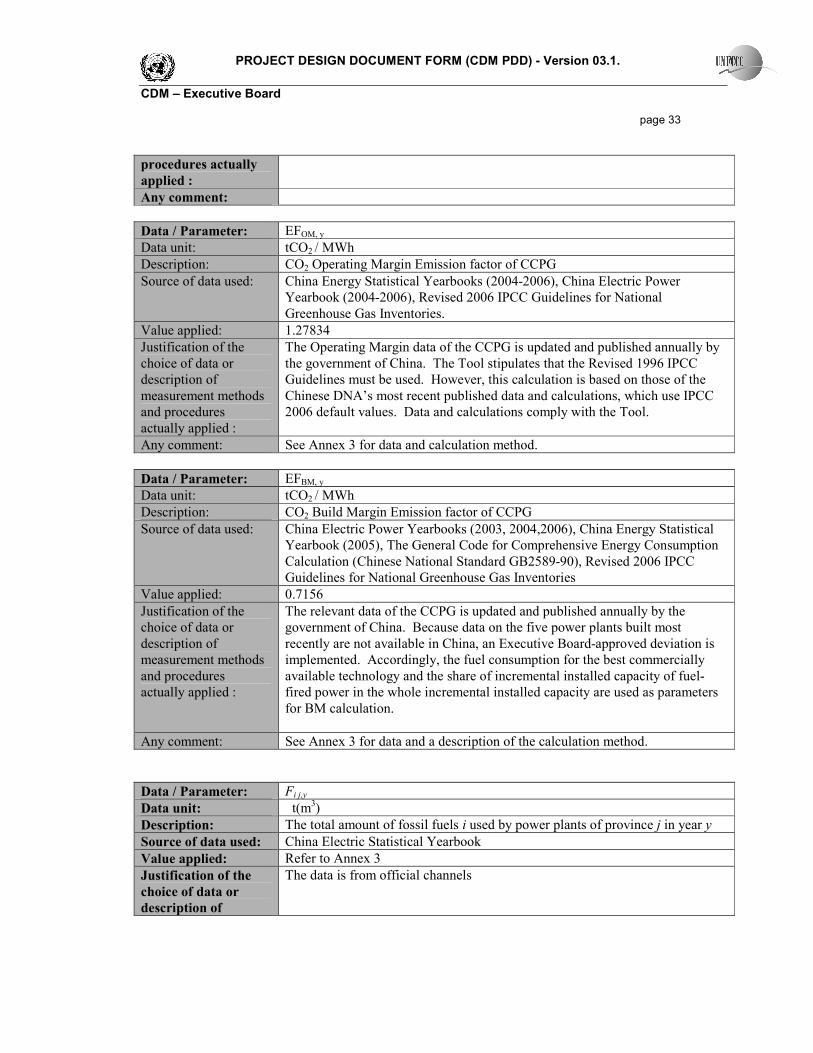
Data / Parameter: EFOM, y
Data unit: tCO2 / MWh
Description: CO2 Operating Margin Emission factor of CCPG
Source of data used: China Energy Statistical Yearbooks (2004-2006), China Electric Power
Yearbook (2004-2006), Revised 2006 IPCC Guidelines for National
Greenhouse Gas Inventories.
Value applied: 1.27834
Justification of the
choice of data or
description of
measurement methods
and procedures
actually applied :
The Operating Margin data of the CCPG is updated and published annually by
the government of China. The Tool stipulates that the Revised 1996 IPCC
Guidelines must be used. However, this calculation is based on those of the
Chinese DNA’s most recent published data and calculations, which use IPCC
2006 default values. Data and calculations comply with the Tool.
Any comment: See Annex 3 for data and calculation method.
Data / Parameter: EFBM, y
Data unit: tCO2 / MWh
Description: CO2 Build Margin Emission factor of CCPG
Source of data used: China Electric Power Yearbooks (2003, 2004,2006), China Energy Statistical
Yearbook (2005), The General Code for Comprehensive Energy Consumption
Calculation (Chinese National Standard GB2589-90), Revised 2006 IPCC
Guidelines for National Greenhouse Gas Inventories
Value applied: 0.7156
Justification of the
choice of data or
description of
measurement methods
and procedures
actually applied :
The relevant data of the CCPG is updated and published annually by the
government of China. Because data on the five power plants built most
recently are not available in China, an Executive Board-approved deviation is
implemented. Accordingly, the fuel consumption for the best commercially
available technology and the share of incremental installed capacity of fuel-
fired power in the whole incremental installed capacity are used as parameters
for BM calculation.
Any comment: See Annex 3 for data and a description of the calculation method.
Data / Parameter: Fi j,y
Data unit: t(m3)
Description: The total amount of fossil fuels i used by power plants of province j in year y
Source of data used: China Electric Statistical Yearbook
Value applied: Refer to Annex 3
Justification of the
choice of data or
description of
The data is from official channels
PROJECT DESIGN DOCUMENT FORM (CDM PDD) - Version 03.1.
CDM – Executive Board
page 34
measurement
methods and
procedures actually
applied :
Any comment:
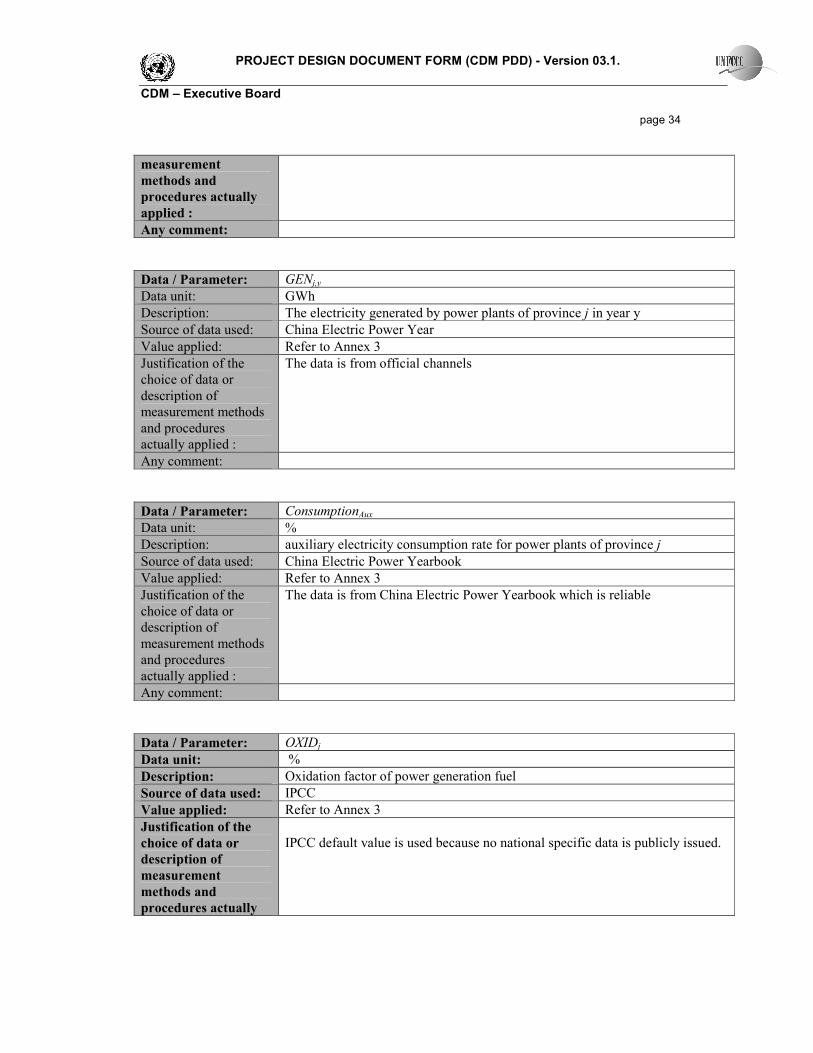
Data / Parameter: GENj,y
Data unit: GWh
Description: The electricity generated by power plants of province j in year y
Source of data used: China Electric Power Year
Value applied: Refer to Annex 3
Justification of the
choice of data or
description of
measurement methods
and procedures
actually applied :
The data is from official channels
Any comment:
Data / Parameter: ConsumptionAux
Data unit: %
Description: auxiliary electricity consumption rate for power plants of province j
Source of data used: China Electric Power Yearbook
Value applied: Refer to Annex 3
Justification of the
choice of data or
description of
measurement methods
and procedures
actually applied :
The data is from China Electric Power Yearbook which is reliable
Any comment:
Data / Parameter: OXIDj
Data unit: %
Description: Oxidation factor of power generation fuel
Source of data used: IPCC
Value applied: Refer to Annex 3
Justification of the
choice of data or
description of
measurement
methods and
procedures actually
IPCC default value is used because no national specific data is publicly issued.
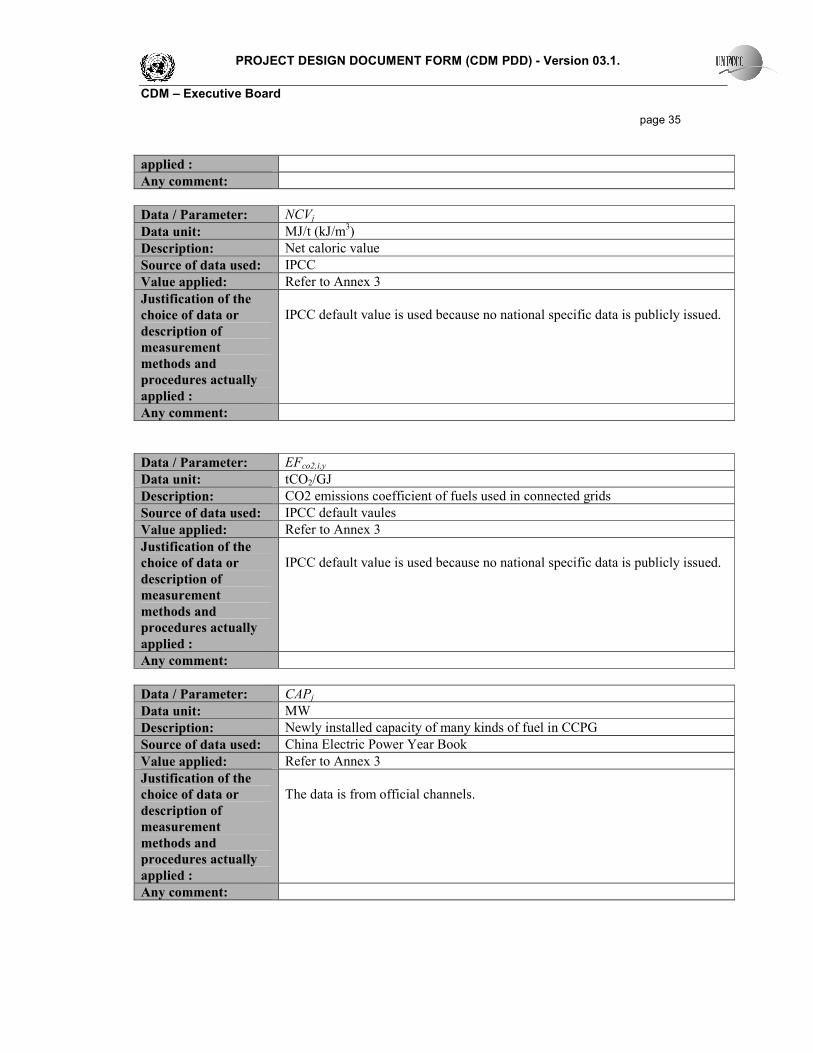
PROJECT DESIGN DOCUMENT FORM (CDM PDD) - Version 03.1.
CDM – Executive Board
page 35
applied :
Any comment:
Data / Parameter: NCVj
Data unit: MJ/t (kJ/m3)
Description: Net caloric value
Source of data used: IPCC
Value applied: Refer to Annex 3
Justification of the
choice of data or
description of
measurement
methods and
procedures actually
applied :
IPCC default value is used because no national specific data is publicly issued.
Any comment:
Data / Parameter: EFco2,i,y
Data unit: tCO2/GJ
Description: CO2 emissions coefficient of fuels used in connected grids
Source of data used: IPCC default vaules
Value applied: Refer to Annex 3
Justification of the
choice of data or
description of
measurement
methods and
procedures actually
applied :
IPCC default value is used because no national specific data is publicly issued.
Any comment:
Data / Parameter: CAPj
Data unit: MW
Description: Newly installed capacity of many kinds of fuel in CCPG
Source of data used: China Electric Power Year Book
Value applied: Refer to Annex 3
Justification of the
choice of data or
description of
measurement
methods and
procedures actually
applied :
The data is from official channels.
Any comment:
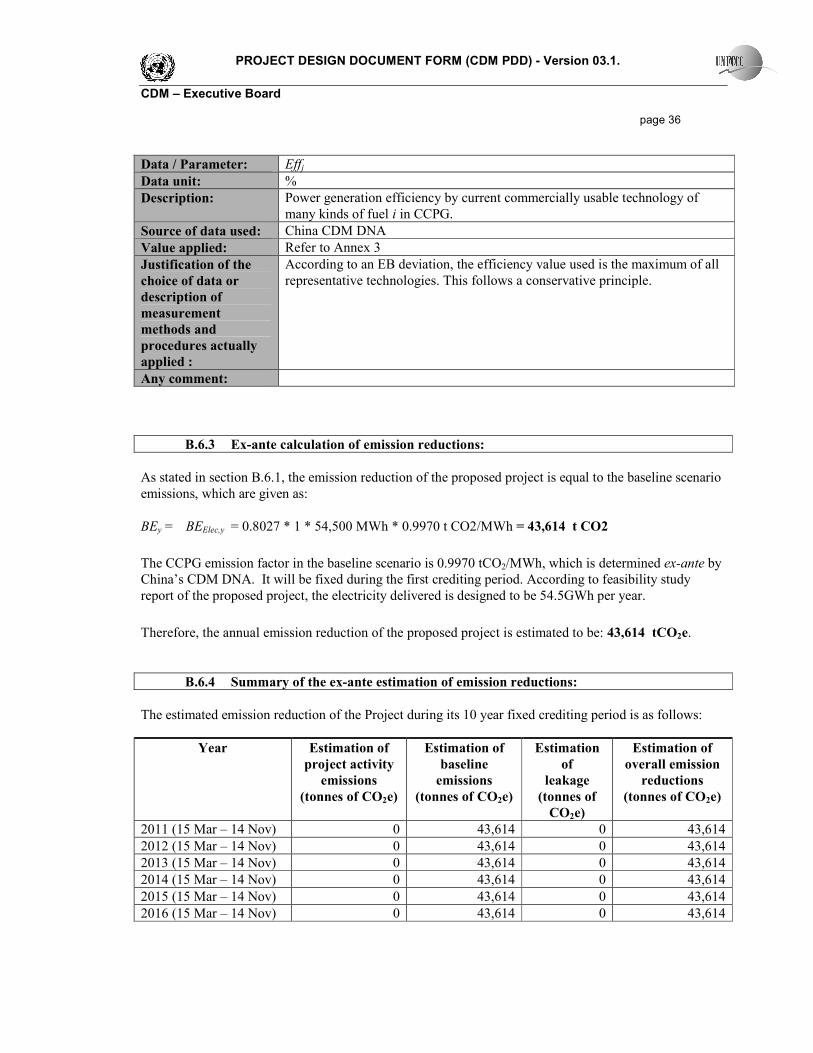
PROJECT DESIGN DOCUMENT FORM (CDM PDD) - Version 03.1.
CDM – Executive Board
page 36
Data / Parameter: Effj
Data unit: %
Description: Power generation efficiency by current commercially usable technology of
many kinds of fuel i in CCPG.
Source of data used: China CDM DNA
Value applied: Refer to Annex 3
Justification of the
choice of data or
description of
measurement
methods and
procedures actually
applied :
According to an EB deviation, the efficiency value used is the maximum of all
representative technologies. This follows a conservative principle.
Any comment:
B.6.3 Ex-ante calculation of emission reductions:
As stated in section B.6.1, the emission reduction of the proposed project is equal to the baseline scenario
emissions, which are given as:
BEy = BEElec,y = 0.8027 * 1 * 54,500 MWh * 0.9970 t CO2/MWh = 43,614 t CO2
The CCPG emission factor in the baseline scenario is 0.9970 tCO2/MWh, which is determined ex-ante by
China’s CDM DNA. It will be fixed during the first crediting period. According to feasibility study
report of the proposed project, the electricity delivered is designed to be 54.5GWh per year.
Therefore, the annual emission reduction of the proposed project is estimated to be: 43,614 tCO2e.
B.6.4 Summary of the ex-ante estimation of emission reductions:
The estimated emission reduction of the Project during its 10 year fixed crediting period is as follows:
Year Estimation of
project activity
emissions
(tonnes of CO2e)
Estimation of
baseline
emissions
(tonnes of CO2e)
Estimation
of
leakage
(tonnes of
CO2e)
Estimation of
overall emission
reductions
(tonnes of CO2e)
2011 (15 Mar – 14 Nov) 0 43,614 0 43,614
2012 (15 Mar – 14 Nov) 0 43,614 0 43,614
2013 (15 Mar – 14 Nov) 0 43,614 0 43,614
2014 (15 Mar – 14 Nov) 0 43,614 0 43,614
2015 (15 Mar – 14 Nov) 0 43,614 0 43,614
2016 (15 Mar – 14 Nov) 0 43,614 0 43,614
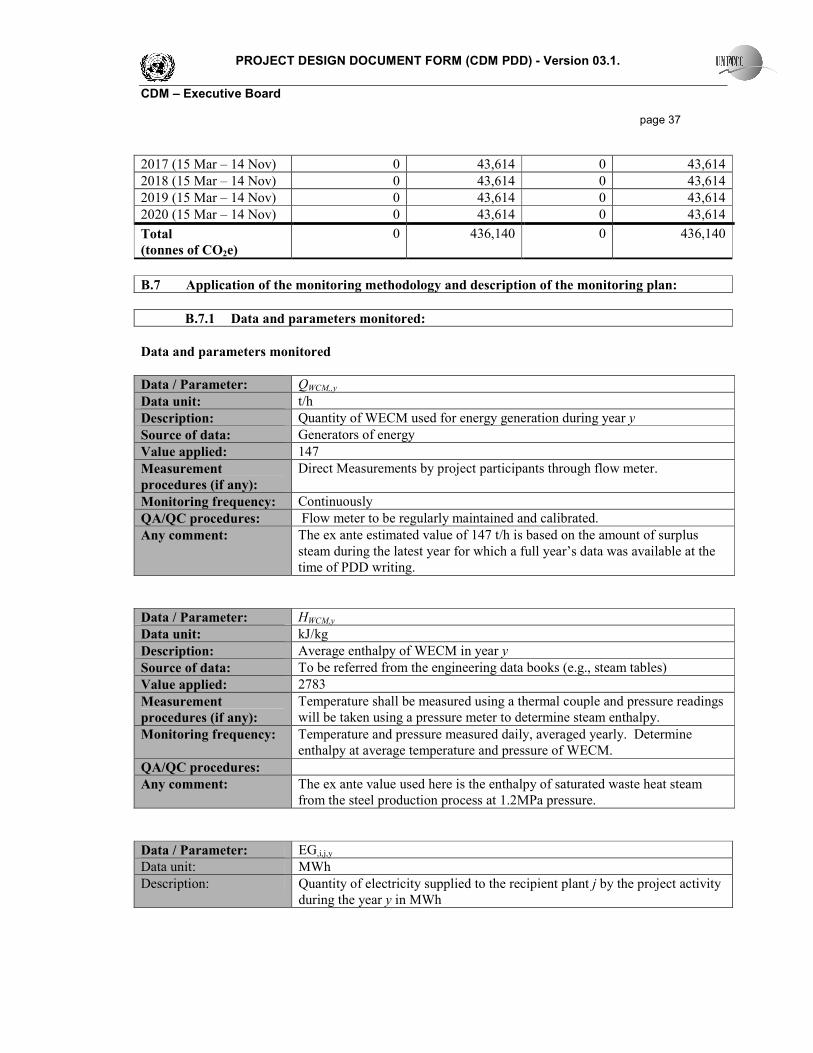
PROJECT DESIGN DOCUMENT FORM (CDM PDD) - Version 03.1.
CDM – Executive Board
page 37
2017 (15 Mar – 14 Nov) 0 43,614 0 43,614
2018 (15 Mar – 14 Nov) 0 43,614 0 43,614
2019 (15 Mar – 14 Nov) 0 43,614 0 43,614
2020 (15 Mar – 14 Nov) 0 43,614 0 43,614
Total
(tonnes of CO2e)
0 436,140 0 436,140
B.7 Application of the monitoring methodology and description of the monitoring plan:
B.7.1 Data and parameters monitored:
Data and parameters monitored
Data / Parameter: QWCM,,y
Data unit: t/h
Description: Quantity of WECM used for energy generation during year y
Source of data: Generators of energy
Value applied: 147
Measurement
procedures (if any):
Direct Measurements by project participants through flow meter.
Monitoring frequency: Continuously
QA/QC procedures: Flow meter to be regularly maintained and calibrated.
Any comment: The ex ante estimated value of 147 t/h is based on the amount of surplus
steam during the latest year for which a full year’s data was available at the
time of PDD writing.
Data / Parameter: HWCM,y
Data unit: kJ/kg
Description: Average enthalpy of WECM in year y
Source of data: To be referred from the engineering data books (e.g., steam tables)
Value applied: 2783
Measurement
procedures (if any):
Temperature shall be measured using a thermal couple and pressure readings
will be taken using a pressure meter to determine steam enthalpy.
Monitoring frequency: Temperature and pressure measured daily, averaged yearly. Determine
enthalpy at average temperature and pressure of WECM.
QA/QC procedures:
Any comment: The ex ante value used here is the enthalpy of saturated waste heat steam
from the steel production process at 1.2MPa pressure.
Data / Parameter: EG,i,j,y
Data unit: MWh
Description: Quantity of electricity supplied to the recipient plant j by the project activity
during the year y in MWh
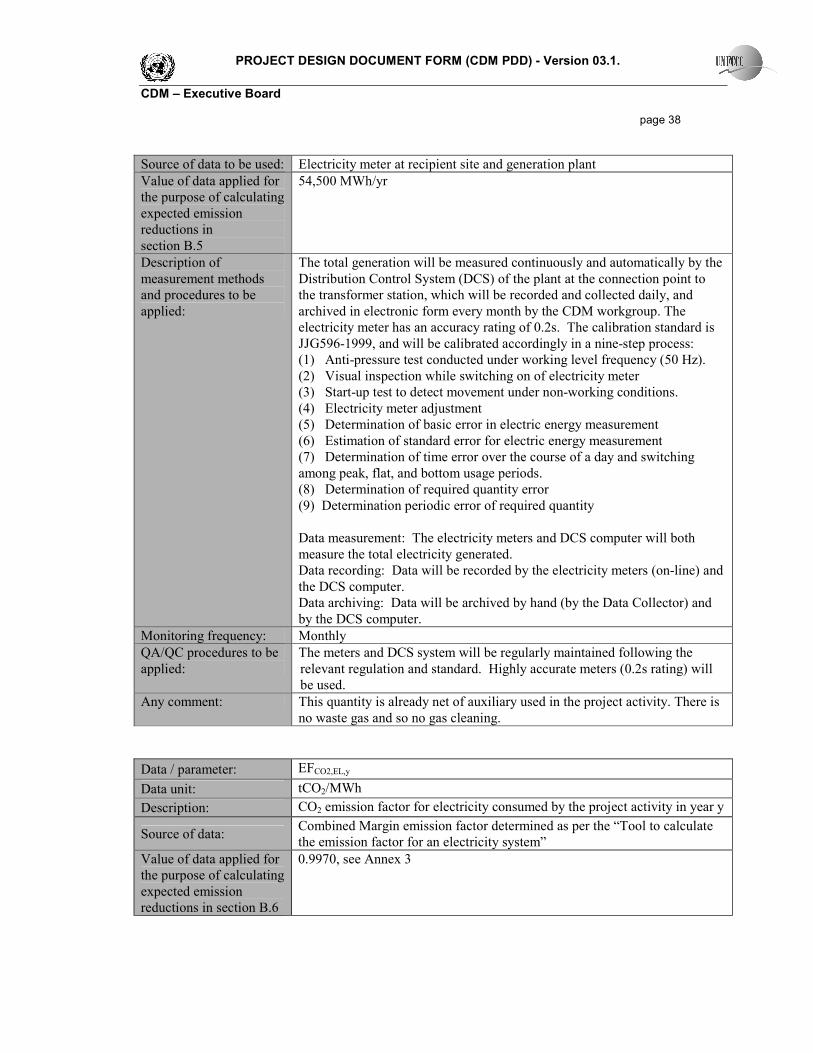
PROJECT DESIGN DOCUMENT FORM (CDM PDD) - Version 03.1.
CDM – Executive Board
page 38
Source of data to be used: Electricity meter at recipient site and generation plant
Value of data applied for
the purpose of calculating
expected emission
reductions in
section B.5
54,500 MWh/yr
Description of
measurement methods
and procedures to be
applied:
The total generation will be measured continuously and automatically by the
Distribution Control System (DCS) of the plant at the connection point to
the transformer station, which will be recorded and collected daily, and
archived in electronic form every month by the CDM workgroup. The
electricity meter has an accuracy rating of 0.2s. The calibration standard is
JJG596-1999, and will be calibrated accordingly in a nine-step process:
(1) Anti-pressure test conducted under working level frequency (50 Hz).
(2) Visual inspection while switching on of electricity meter
(3) Start-up test to detect movement under non-working conditions.
(4) Electricity meter adjustment
(5) Determination of basic error in electric energy measurement
(6) Estimation of standard error for electric energy measurement
(7) Determination of time error over the course of a day and switching
among peak, flat, and bottom usage periods.
(8) Determination of required quantity error
(9) Determination periodic error of required quantity
Data measurement: The electricity meters and DCS computer will both
measure the total electricity generated.
Data recording: Data will be recorded by the electricity meters (on-line) and
the DCS computer.
Data archiving: Data will be archived by hand (by the Data Collector) and
by the DCS computer.
Monitoring frequency: Monthly
QA/QC procedures to be
applied:
The meters and DCS system will be regularly maintained following the
relevant regulation and standard. Highly accurate meters (0.2s rating) will
be used.
Any comment: This quantity is already net of auxiliary used in the project activity. There is
no waste gas and so no gas cleaning.
Data / parameter: EFCO2,EL,y
Data unit: tCO2/MWh
Description: CO2 emission factor for electricity consumed by the project activity in year y
Source of data: Combined Margin emission factor determined as per the “Tool to calculate
the emission factor for an electricity system”
Value of data applied for
the purpose of calculating
expected emission
reductions in section B.6
0.9970, see Annex 3
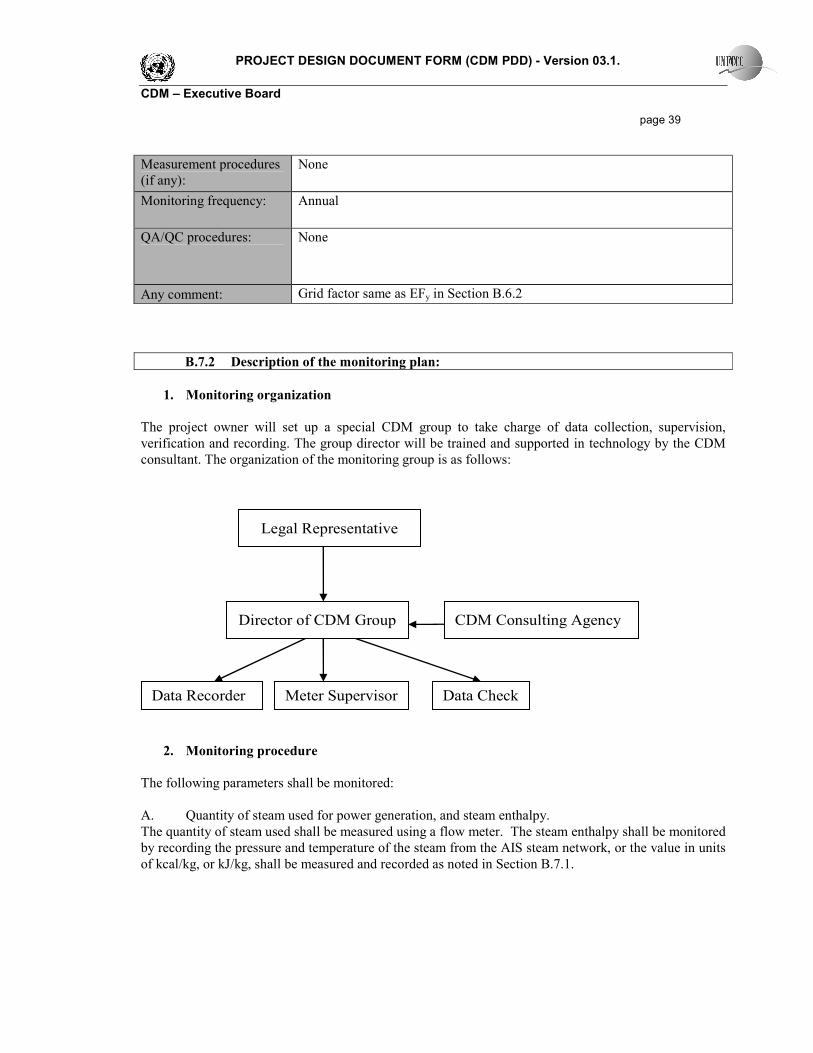
PROJECT DESIGN DOCUMENT FORM (CDM PDD) - Version 03.1.
CDM – Executive Board
page 39
Measurement procedures
(if any):
None
Monitoring frequency: Annual
QA/QC procedures: None
Any comment: Grid factor same as EFy in Section B.6.2
B.7.2 Description of the monitoring plan:
1. Monitoring organization
The project owner will set up a special CDM group to take charge of data collection, supervision,
verification and recording. The group director will be trained and supported in technology by the CDM
consultant. The organization of the monitoring group is as follows:
Data Check Meter Supervisor Data Recorder
Director of CDM Group CDM Consulting Agency
Legal Representative
2. Monitoring procedure
The following parameters shall be monitored:
A. Quantity of steam used for power generation, and steam enthalpy.
The quantity of steam used shall be measured using a flow meter. The steam enthalpy shall be monitored
by recording the pressure and temperature of the steam from the AIS steam network, or the value in units
of kcal/kg, or kJ/kg, shall be measured and recorded as noted in Section B.7.1.
PROJECT DESIGN DOCUMENT FORM (CDM PDD) - Version 03.1.
CDM – Executive Board
page 40
B. Electricity supplied by the project
The electricity supplied by the project will be calculated as the difference between the total electricity
generated and the auxiliary electricity consumption of the power generating equipment. The EGGEN and
EGAUX shall be measured continuously and automatically by electricity meters and the DCS computer.
Equipment calibration, data measurement, recording and archiving will be carried out as described in
Section B.7.1.
3. Training, Record Keeping, Error handling and Reporting Procedures
Training
Members of staff who are involved in the CDM project will be given training on the CDM and reporting
requirements, prior to registration of the project. New members of staff joining the CDM project team
will also be given training in relation to their responsibilities. Full training procedures and a training
plan will be detailed in the CDM Manual.
Record Keeping and Internal Reporting Procedure
The CDM group appointed by the project owner should keep the monitoring data in electronic archives at
the end of every month, electronic documents should also be printed, to archive as a written document.
Written documents, such as maps, forms, EIA reports etc, should be used with a monitoring plan to check
the authenticity of the data. All of the written data and information should be kept in the archives by the
CDM group; all of the documents should have a backup copy. All of the data should be saved for 2 years
after the crediting period.
Error Handling Procedure
In the event that a meter has lost calibration over the allowable error limit then this shall be corrected at
the earliest opportunity and re-calibrated and the data recorded from this meter since the last successful
calibration shall be ignored.
In the event that there is uncertainty over the accuracy of the data set for net electricity generated from
the main meter (e.g. the meter has lost calibration over the acceptable error limit) then the data from the
back-up meter shall be used.
The check of the CDM Project Officer and then the third party verifier prior to issuance of the CERs is
considered adequate for errors in the calculations. Where errors in the calculations are discovered by
either of these Parties, the monitoring report shall be modified and the corrected version shall be
resubmitted to the verifier.
External Reporting Procedure
After signing by the CDM Project Officer, the report is sent to the 3rd party verifier who is contracted to
verify the emissions reductions during the crediting period of the project.
Procedure for corrective actions arising
PROJECT DESIGN DOCUMENT FORM (CDM PDD) - Version 03.1.
CDM – Executive Board
page 41
The CDM Project Officer is responsible for identifying corrective actions arising from the above
procedures and for liaising with the purchaser, the 3rd party verifiers and other stakeholders to take
necessary steps to implement the corrective actions.
B.8 Date of completion of the application of the baseline study and monitoring methodology
and the name of the responsible person(s)/entity(ies)
The application of the methodology to the proposed project was completed on October 17, 2008 by the
following person(s) and organization:
Name Project Participant (Yes / No)
Sophie Chou
Andrew Prag
CAMCO International
14th Floor, Lucky Tower A, No. 3 North Road,
East 3rd Ring Road, Chaoyang District,
Beijing 100027, P.R. China
Tel: +86 10 8448 1623
Fax: +86 10 8448 2432
Email:[email protected]
Website: www.camcoglobal.com
Yes
PROJECT DESIGN DOCUMENT FORM (CDM PDD) - Version 03.1.
CDM – Executive Board
page 42
SECTION C. Duration of the project activity / crediting period
C.1 Duration of the project activity:
C.1.1. Starting date of the project activity:
01/10/2009
C.1.2. Expected operational lifetime of the project activity:
11 years
C.2 Choice of the crediting period and related information:
C.2.1. Renewable crediting period
C.2.1.1. Starting date of the first crediting period:
N/A
C.2.1.2. Length of the first crediting period:
N/A
C.2.2. Fixed crediting period:
C.2.2.1. Starting date:
15/03/2011
C.2.2.2. Length:
10 years

PROJECT DESIGN DOCUMENT FORM (CDM PDD) - Version 03.1.
CDM – Executive Board
page 43
SECTION D. Environmental impacts
D.1. Documentation on the analysis of the environmental impacts, including transboundary
impacts:
The Project’s environmental impacts analysis report has been approved by the Environmental Protection
Bureau of Henan Province. The major conclusions are presented as follows:
The energy source of the Project is surplus waste heat steam, therefore there are no air pollutants or solid
waste discharged by the Project activity. The major potential pollution is noise.
Noise
Operation of the steam turbine and pump are the major sources of noise. Noise isolation hoods will be
installed in the steam turbine. The pump will be set in a specific pump house with a rubber connector in
the outlet of the pump. The control room of the Project will be noise isolated. The noise level of the
vibrating equipment will be less than 85dB (A) and in the control room it will be less than 70dB (A).
This would comply with the “Code for Noise Control Design of Industrial Enterprises” of China.
Waste Water Discharge
The waste water discharge would comply with the “Discharge Standard of Waste Pollutants for Ion and
Steel Industry (GB13456-92),” and the “Integrated wastewater discharge standard (GB8978-1996).”
Additionally, further effort will be made by the Project to increase the proportion of the plant to15%. The
idle land of the plant will be taken fully advantage of for planting trees and flowers to improve
environmental quality and to reduce pollution. A specific department will be established to take charge of
environmental management of the plant. All the pollution discharged will be monitored periodically by
the environmental monitoring station.
In conclusion, the Project will not have any significant environment impacts. On the contrary, by
reducing fossil energy consumption for generation, the Project will yield environmental benefits.
D.2. If environmental impacts are considered significant by the project participants or the host
Party, please provide conclusions and all references to support documentation of an environmental
impact assessment undertaken in accordance with the procedures as required by the host Party:
According to the EIA approved by the Environmental Protection Bureau of Henan Province, the impacts
of the Project are not considered to be significant.
PROJECT DESIGN DOCUMENT FORM (CDM PDD) - Version 03.1.
CDM – Executive Board
page 44
SECTION E. Stakeholders’ comments
E.1. Brief description how comments by local stakeholders have been invited and compiled:
The project owner, Anyang Iron & Steel Co., Ltd. (AIS), issued an open invitation to the local
community of Anyang City on November 28, 2006 to participate in a stakeholder consultation on the
Angang Waste Gas Recovery and Generation Project. The invitation was conveyed through Chinese
Communist Party community information distribution channels, which is a very typical and effective
means of widely disseminating information to the general public, and concerned two separate stakeholder
meetings.
The first meeting of the stakeholder consultation took place on December 8, 2006, at the Angang Hotel in
Anyang City. Thirty-seven community representatives responded to the invitation, including local
workers, villagers, intellectuals, teachers, students and deputies to local People's Congress. The meeting
was chaired by Ms. Zhao Yuqin, deputy director of AIS CDM development office. Mr. Zhang Qingyou,
director of AIS CDM development office, made a presentation to introduce the plan to develop the
project. A survey was distributed to participants to complete and return at a follow up meeting. The
survey questions were:
1. Are you satisfied with the present local environment?
2. Do you think it is important to conduct this project?
3. Do you agree with the project being constructed?
4. Do you think the project location chosen is reasonable?
5. What is the main environmental problem addressed by the project?
6. What effect will project construction have on the environment?
7. Do you think the project construction will affect the surrounding environment?
8. Are you satisfied with environmental impact mitigation measures?
9. What do you think will be the impact of project construction on the local economy?
10. What do you think will be the impact of project construction on local employment?
Any ideas or suggestions for the project?
What do you think of any other measures we can do for the project?
A second invitation was issued, through the same channel as the first, for the second stakeholder meeting,
which took place on December 25, 2006 with the same group of 37 participants. All 37 participants
returned completed surveys and were invited to engage in a question and answer session and general
discussion of the project. The questions asked were related to the speed of implementation of the project
and how quickly CER revenue could be established and also concerned the means of recycling steam and
thereby conserving energy. The surveys were analysed and found to unanimously support the
construction of the project.
E.2. Summary of the comments received:
Stakeholder comments from the general discussion of the AIS Angang Surplus Waste Heat Steam
Generation Project are as follows:
PROJECT DESIGN DOCUMENT FORM (CDM PDD) - Version 03.1.
CDM – Executive Board
page 45
♦ The Project would promote energy efficiency by using a currently wasted energy resource from an
industrial facility to generate power. As such, it meets the requirement of the national sustainable
development strategy.
♦ The Project would contribute to global climate change mitigation by reducing greenhouse gas
emissions.
♦ If developed, the Project would help optimize the local energy mix, improve environment quality,
create employment opportunities, and prompt technology transfer, thereby bringing both social and
environment benefits to the community.
♦ Project registration would achieve significant improvement in the project’s financial position and
help ensure successful implementation.
♦ All participants supported the development of the project and encouraged the project owner to take
full advantage of the CDM opportunity.
E.3. Report on how due account was taken of any comments received:
Considering full support from local stakeholders, the project owner expressed their intention to take full
advantage of the CDM opportunity to facilitate Project implementation. The meeting Chair invited
those present to monitor the construction and implementation of the Angang Surplus Waste Heat Steam
Generation Project in the future.
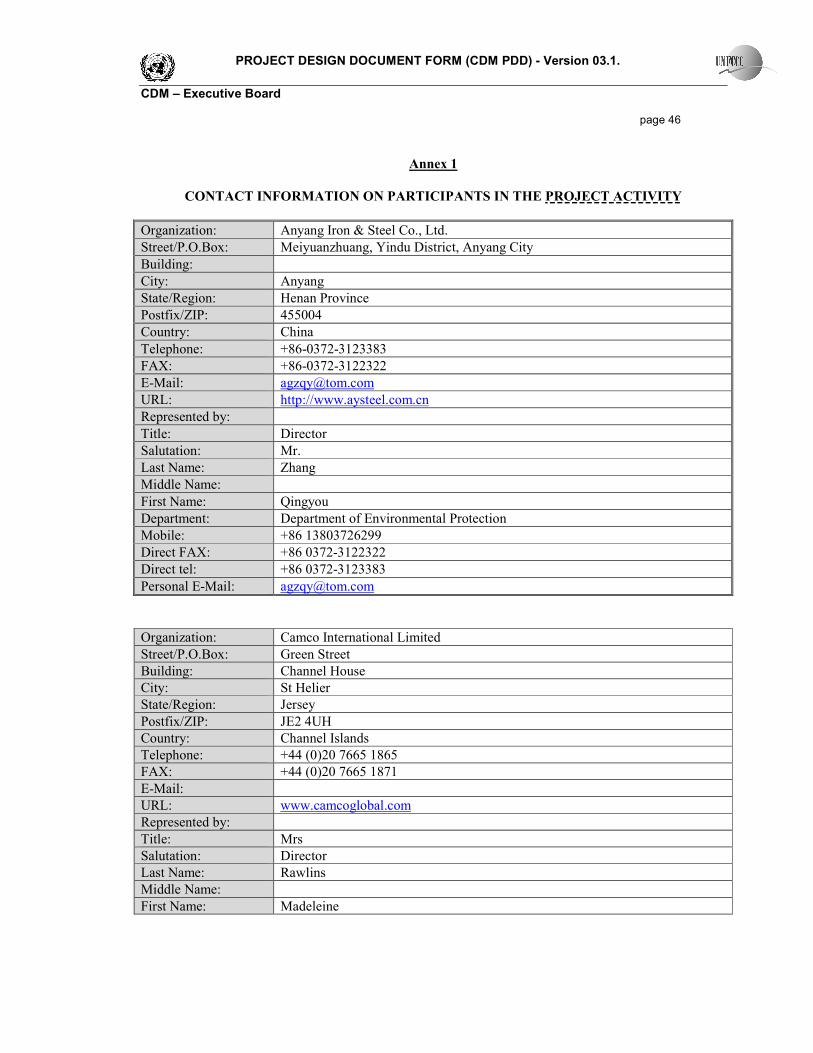
PROJECT DESIGN DOCUMENT FORM (CDM PDD) - Version 03.1.
CDM – Executive Board
page 46
Annex 1
CONTACT INFORMATION ON PARTICIPANTS IN THE PROJECT ACTIVITY
Organization: Anyang Iron & Steel Co., Ltd.
Street/P.O.Box: Meiyuanzhuang, Yindu District, Anyang City
Building:
City: Anyang
State/Region: Henan Province
Postfix/ZIP: 455004
Country: China
Telephone: +86-0372-3123383
FAX: +86-0372-3122322
E-Mail: [email protected]
URL: http://www.aysteel.com.cn
Represented by:
Title: Director
Salutation: Mr.
Last Name: Zhang
Middle Name:
First Name: Qingyou
Department: Department of Environmental Protection
Mobile: +86 13803726299
Direct FAX: +86 0372-3122322
Direct tel: +86 0372-3123383
Personal E-Mail: [email protected]
Organization: Camco International Limited
Street/P.O.Box: Green Street
Building: Channel House
City: St Helier
State/Region: Jersey
Postfix/ZIP: JE2 4UH
Country: Channel Islands
Telephone: +44 (0)20 7665 1865
FAX: +44 (0)20 7665 1871
E-Mail:
URL: www.camcoglobal.com
Represented by:
Title: Mrs
Salutation: Director
Last Name: Rawlins
Middle Name:
First Name: Madeleine
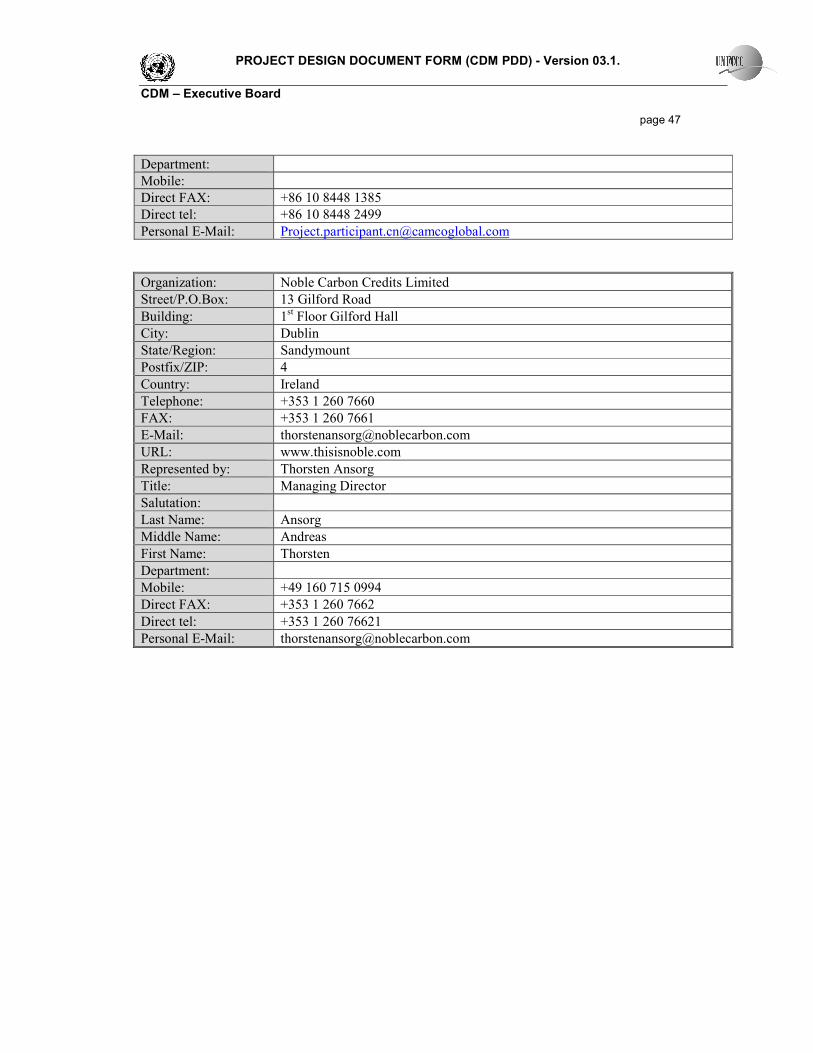
PROJECT DESIGN DOCUMENT FORM (CDM PDD) - Version 03.1.
CDM – Executive Board
page 47
Department:
Mobile:
Direct FAX: +86 10 8448 1385
Direct tel: +86 10 8448 2499
Personal E-Mail: [email protected]
Organization: Noble Carbon Credits Limited
Street/P.O.Box: 13 Gilford Road
Building: 1st Floor Gilford Hall
City: Dublin
State/Region: Sandymount
Postfix/ZIP: 4
Country: Ireland
Telephone: +353 1 260 7660
FAX: +353 1 260 7661
E-Mail: [email protected]
URL: www.thisisnoble.com
Represented by: Thorsten Ansorg
Title: Managing Director
Salutation:
Last Name: Ansorg
Middle Name: Andreas
First Name: Thorsten
Department:
Mobile: +49 160 715 0994
Direct FAX: +353 1 260 7662
Direct tel: +353 1 260 76621
Personal E-Mail: [email protected]

PROJECT DESIGN DOCUMENT FORM (CDM PDD) - Version 03.1.
CDM – Executive Board
page 48
Annex 2
INFORMATION REGARDING PUBLIC FUNDING
No public funding is involved in the Project.
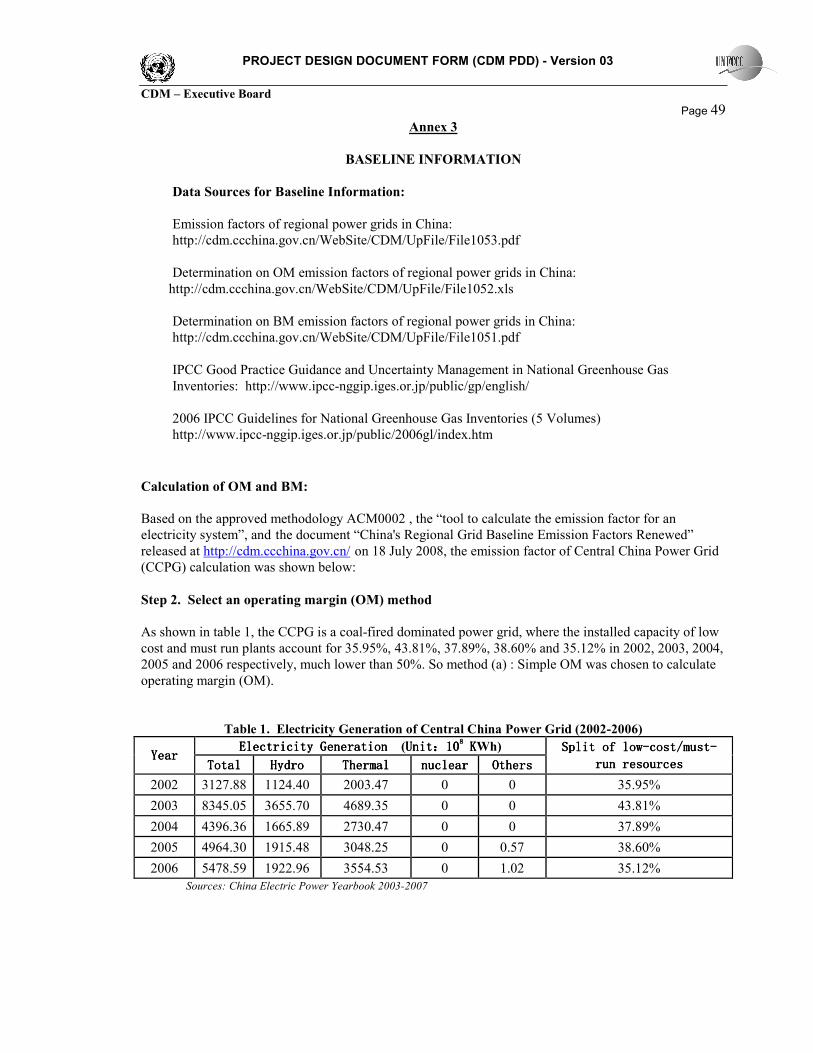
PROJECT DESIGN DOCUMENT FORM (CDM PDD) - Version 03
CDM – Executive Board
Page 49 Annex 3
BASELINE INFORMATION
Data Sources for Baseline Information:
Emission factors of regional power grids in China:
http://cdm.ccchina.gov.cn/WebSite/CDM/UpFile/File1053.pdf
Determination on OM emission factors of regional power grids in China:
http://cdm.ccchina.gov.cn/WebSite/CDM/UpFile/File1052.xls
Determination on BM emission factors of regional power grids in China:
http://cdm.ccchina.gov.cn/WebSite/CDM/UpFile/File1051.pdf
IPCC Good Practice Guidance and Uncertainty Management in National Greenhouse Gas
Inventories: http://www.ipcc-nggip.iges.or.jp/public/gp/english/
2006 IPCC Guidelines for National Greenhouse Gas Inventories (5 Volumes)
http://www.ipcc-nggip.iges.or.jp/public/2006gl/index.htm
Calculation of OM and BM:
Based on the approved methodology ACM0002 , the “tool to calculate the emission factor for an
electricity system”, and the document “China's Regional Grid Baseline Emission Factors Renewed”
released at http://cdm.ccchina.gov.cn/ on 18 July 2008, the emission factor of Central China Power Grid
(CCPG) calculation was shown below:
Step 2. Select an operating margin (OM) method
As shown in table 1, the CCPG is a coal-fired dominated power grid, where the installed capacity of low
cost and must run plants account for 35.95%, 43.81%, 37.89%, 38.60% and 35.12% in 2002, 2003, 2004,
2005 and 2006 respectively, much lower than 50%. So method (a) : Simple OM was chosen to calculate
operating margin (OM).
Table 1. Electricity Generation of Central China Power Grid (2002-2006)
Electricity GenElectricity GenElectricity GenElectricity Generation eration eration eration (UnitUnitUnitUnit::::101010108888 K K K KWh)
YearYearYearYear TotalTotalTotalTotal HydroHydroHydroHydro ThermalThermalThermalThermal nuclearnuclearnuclearnuclear OthersOthersOthersOthers
Split of lowSplit of lowSplit of lowSplit of low----cost/mustcost/mustcost/mustcost/must----
run resourcesrun resourcesrun resourcesrun resources
2002 3127.88 1124.40 2003.47 0 0 35.95%
2003 8345.05 3655.70 4689.35 0 0 43.81%
2004 4396.36 1665.89 2730.47 0 0 37.89%
2005 4964.30 1915.48 3048.25 0 0.57 38.60%
2006 5478.59 1922.96 3554.53 0 1.02 35.12%
Sources: China Electric Power Yearbook 2003-2007
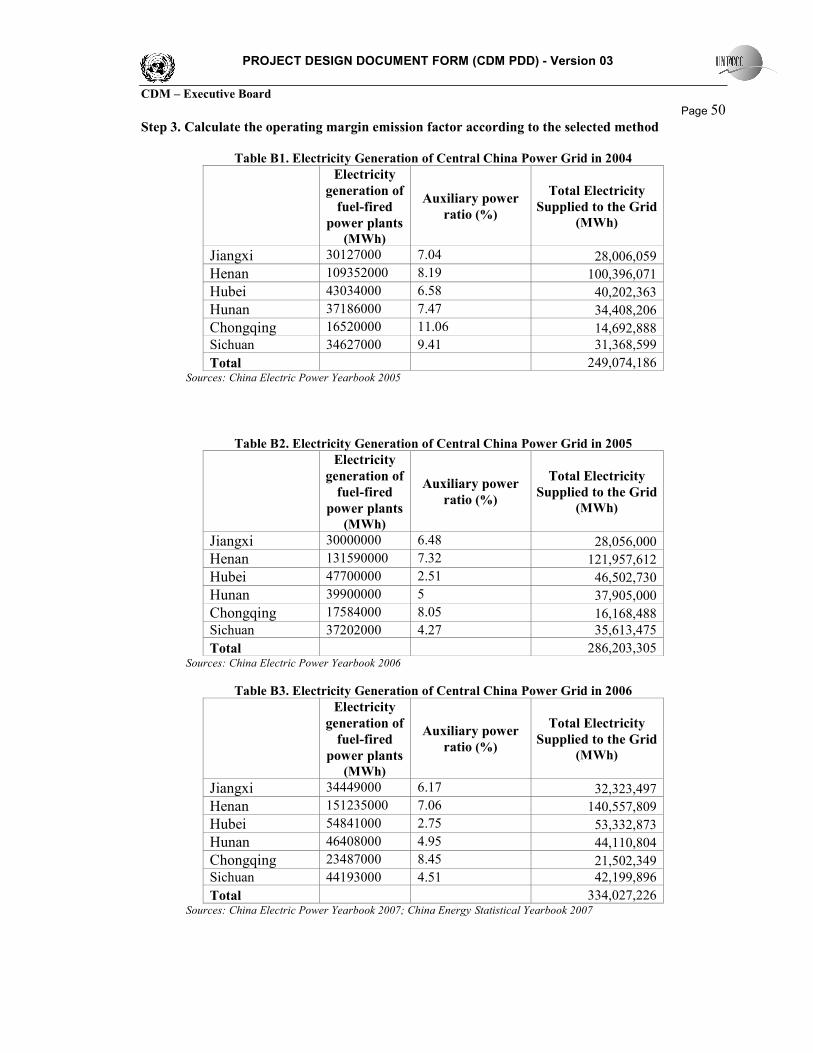
PROJECT DESIGN DOCUMENT FORM (CDM PDD) - Version 03
CDM – Executive Board
Page 50 Step 3. Calculate the operating margin emission factor according to the selected method
Table B1. Electricity Generation of Central China Power Grid in 2004
Electricity
generation of
fuel-fired
power plants
(MWh)
Auxiliary power
ratio (%)
Total Electricity
Supplied to the Grid
(MWh)
Jiangxi 30127000 7.04 28,006,059
Henan 109352000 8.19 100,396,071
Hubei 43034000 6.58 40,202,363
Hunan 37186000 7.47 34,408,206
Chongqing 16520000 11.06 14,692,888
Sichuan 34627000 9.41 31,368,599
Total 249,074,186 Sources: China Electric Power Yearbook 2005
Table B2. Electricity Generation of Central China Power Grid in 2005
Electricity
generation of
fuel-fired
power plants
(MWh)
Auxiliary power
ratio (%)
Total Electricity
Supplied to the Grid
(MWh)
Jiangxi 30000000 6.48 28,056,000
Henan 131590000 7.32 121,957,612
Hubei 47700000 2.51 46,502,730
Hunan 39900000 5 37,905,000
Chongqing 17584000 8.05 16,168,488
Sichuan 37202000 4.27 35,613,475
Total 286,203,305 Sources: China Electric Power Yearbook 2006
Table B3. Electricity Generation of Central China Power Grid in 2006
Electricity
generation of
fuel-fired
power plants
(MWh)
Auxiliary power
ratio (%)
Total Electricity
Supplied to the Grid
(MWh)
Jiangxi 34449000 6.17 32,323,497
Henan 151235000 7.06 140,557,809
Hubei 54841000 2.75 53,332,873
Hunan 46408000 4.95 44,110,804
Chongqing 23487000 8.45 21,502,349
Sichuan 44193000 4.51 42,199,896
Total 334,027,226 Sources: China Electric Power Yearbook 2007; China Energy Statistical Yearbook 2007

PROJECT DESIGN DOCUMENT FORM (CDM PDD) - Version 03
CDM – Executive Board
Page 51
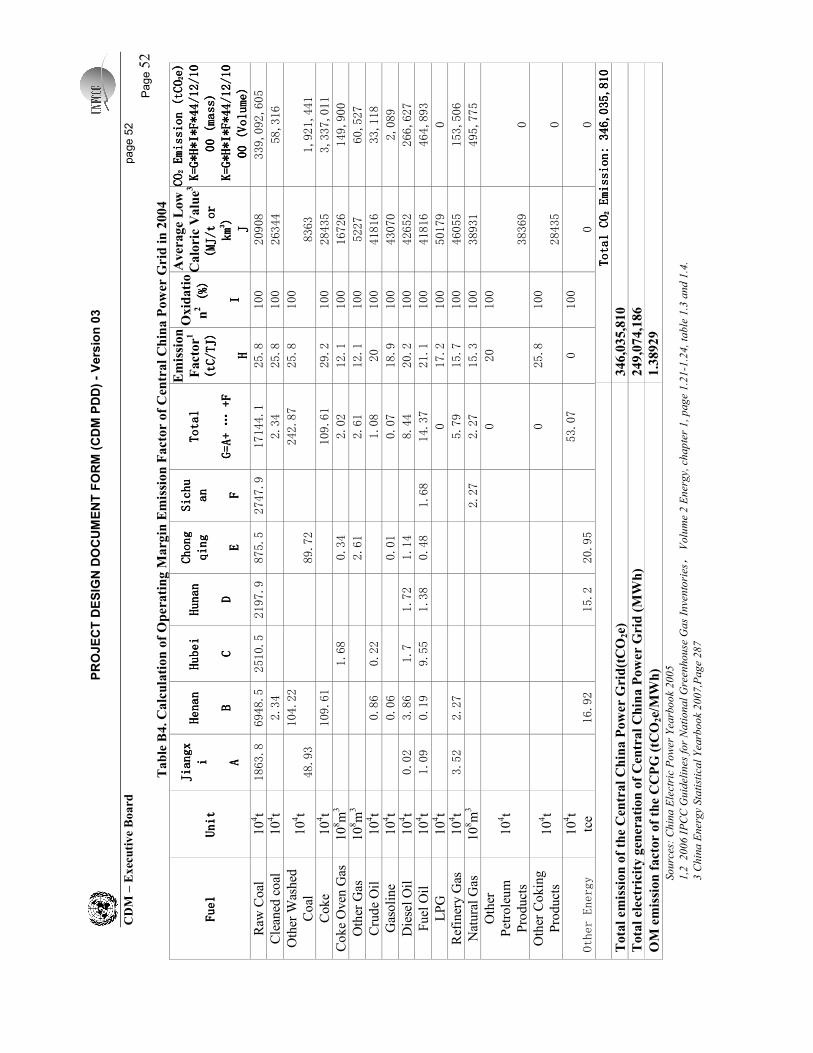
PROJECT DESIGN DOCUMENT FORM (CDM PDD) - Version 03
CD
M –
Exec
utive B
oard
page 52
Page 52
Table
B4. C
alc
ula
tion o
f O
pera
ting M
arg
in E
mis
sion F
acto
r o
f C
entr
al C
hin
a P
ow
er G
rid
in 2
004
Fuel
Fuel
Fuel
Fuel
Unit
Unit
Unit
Unit
Jiangx
Jiangx
Jiangx
Jiangx
i iii A AAA
Henan
Henan
Henan
Henan
B BBB
Hubei
Hubei
Hubei
Hubei
C CCC
Hunan
Hunan
Hunan
Hunan
D DDD
Chong
Chong
Chong
Chong
qing
qing
qing
qing
E EEE
Sichu
Sichu
Sichu
Sichu
an
anan
an F FFF
Total
Total
Total
Total
G GGG=A+
=A+
=A+
=A+ … ………
+ +++F FFF
Em
issi
on
Facto
r1
(tC/TJ)
(tC/TJ)
(tC/TJ)
(tC/TJ)
H HHH
Oxid
atio
n2 (%)
(%)
(%)
(%)
I III
Aver
age L
ow
Calo
ric
Valu
e3
(MJ/t
(MJ/t
(MJ/t
(MJ/t or
oror
or
k kkkm mmm
3 333) )))
J JJJ
CO
COCO
CO
2 222 Emission
Emission
Emission
Emission (tCO
(tCO
(tCO
(tCO
2 222e)
e)e)
e)
K=G*H*I*F*44/12/10
K=G*H*I*F*44/12/10
K=G*H*I*F*44/12/10
K=G*H*I*F*44/12/10
00 (mass)
00 (mass)
00 (mass)
00 (mass)
K=G*H*I*F*44/12/10
K=G*H*I*F*44/12/10
K=G*H*I*F*44/12/10
K=G*H*I*F*44/12/10
00 (Volume)
00 (Volume)
00 (Volume)
00 (Volume)
Raw
Coal
104t
1863.8
6948.5
2510.5
2197.9
875.5
2747.9
17144.1
25.8
100
20908
339,092,605
Cleaned coal
104t
2.34
2.34
25.8
100
26344
58,316
Other W
ashed
Coal
104t
48.93
104.22
89.72
242.87
25.8
100
8363
1,921,441
Coke
104t
109.61
109.61
29.2
100
28435
3,337,011
Coke Oven Gas
108m
3
1.68
0.34
2.02
12.1
100
16726
149,900
Other Gas
108m
3
2.61
2.61
12.1
100
5227
60,527
Crude Oil
104t
0.86
0.22
1.08
20
100
41816
33,118
Gasoline
104t
0.06
0.01
0.07
18.9
100
43070
2,089
Diesel Oil
104t
0.02
3.86
1.7
1.72
1.14
8.44
20.2
100
42652
266,627
Fuel Oil
104t
1.09
0.19
9.55
1.38
0.48
1.68
14.37
21.1
100
41816
464,893
LPG
104t
0
17.2
100
50179
0
Refinery Gas
104t
3.52
2.27
5.79
15.7
100
46055
153,506
Natural Gas
108m
3
2.27
2.27
15.3
100
38931
495,775
Other
Petroleum
Products
104t
0
20
100
38369
0
Other Coking
Products
104t
0
25.8
100
28435
0
Other Energy
104t
tce
16.92
15.2
20.95
53.07
0
100
0
0
Total
Total
Total
Total CO
CO
CO
CO
2 222 Emission
Emission
Emission
Emission:
: :
: 346,035,810
346,035,810
346,035,810
346,035,810
Tota
l em
issi
on o
f th
e C
entr
al C
hin
a P
ow
er
Gri
d(t
CO
2e)
346,0
35,8
10
Tota
l ele
ctri
city
gen
era
tion o
f C
entr
al C
hin
a P
ow
er
Gri
d (M
Wh)
249,0
74,1
86
OM
em
issi
on facto
r of th
e C
CPG (tC
O2e/
MW
h)
1.3
8929
Sources: China Electric Power Yearbook 2005
1,2 2006 IPCC Guidelines for National Greenhouse Gas Inventories, Volume 2 Energy, chapter 1, page 1.21-1.24, table 1.3 and 1.4.
3 China Energy Statistical Yearbook 2007,Page 287
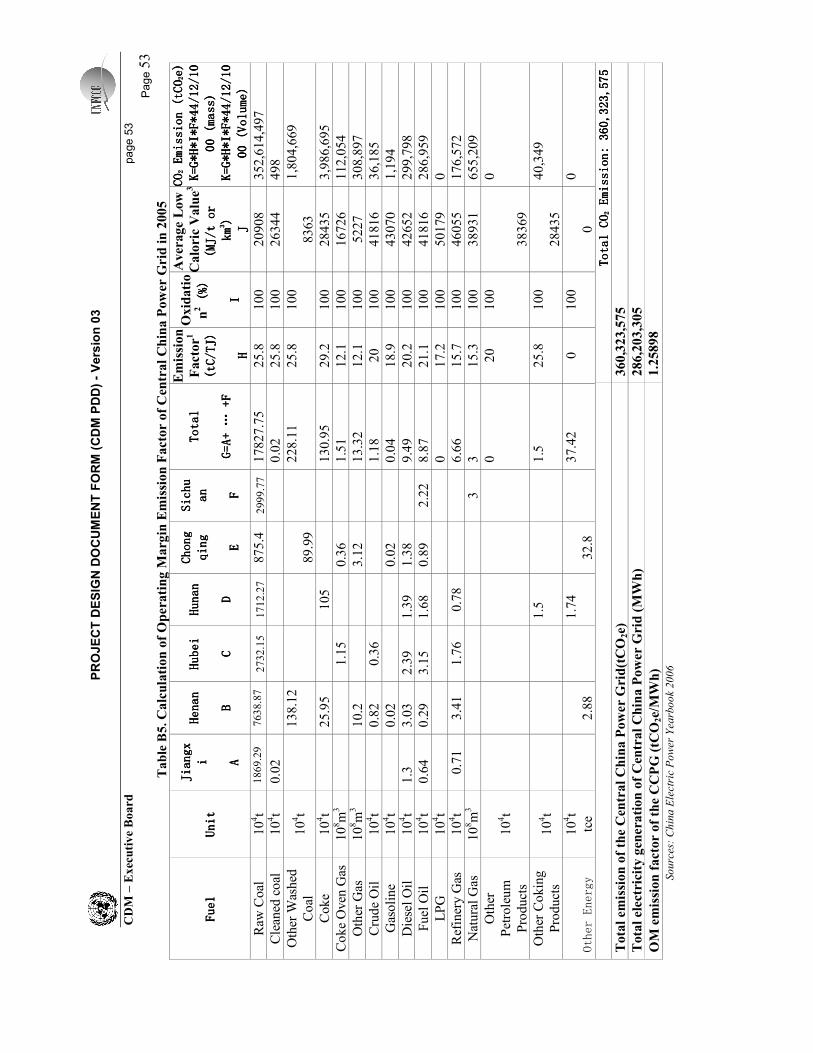
PROJECT DESIGN DOCUMENT FORM (CDM PDD) - Version 03
CD
M –
Exec
utive B
oard
page 53
Page 53
Table
B5. C
alc
ula
tion o
f O
pera
ting M
arg
in E
mis
sion F
acto
r o
f C
entr
al C
hin
a P
ow
er G
rid
in 2
005
Fuel
Fuel
Fuel
Fuel
Unit
Unit
Unit
Unit
Jiangx
Jiangx
Jiangx
Jiangx
i iii A AAA
Henan
Henan
Henan
Henan
B BBB
Hubei
Hubei
Hubei
Hubei
C CCC
Hunan
Hunan
Hunan
Hunan
D DDD
Chong
Chong
Chong
Chong
qing
qing
qing
qing
E EEE
Sichu
Sichu
Sichu
Sichu
an
anan
an F FFF
Total
Total
Total
Total
G GGG=A+
=A+
=A+
=A+ … ………
+ +++F FFF
Em
issi
on
Facto
r1
(tC/TJ)
(tC/TJ)
(tC/TJ)
(tC/TJ)
H HHH
Oxid
atio
n2 (%)
(%)
(%)
(%)
I III
Aver
age L
ow
Calo
ric
Valu
e3
(MJ/t
(MJ/t
(MJ/t
(MJ/t or
oror
or
k kkkm mmm
3 333) )))
J JJJ
CO
COCO
CO
2 222 Emission
Emission
Emission
Emission (tCO
(tCO
(tCO
(tCO
2 222e)
e)e)
e)
K=G*H*I*F*44/12/10
K=G*H*I*F*44/12/10
K=G*H*I*F*44/12/10
K=G*H*I*F*44/12/10
00 (mass)
00 (mass)
00 (mass)
00 (mass)
K=G*H*I*F*44/12/10
K=G*H*I*F*44/12/10
K=G*H*I*F*44/12/10
K=G*H*I*F*44/12/10
00 (Volume)
00 (Volume)
00 (Volume)
00 (Volume)
Raw
Coal
104t
1869.29
7638.87
2732.15
1712.27
875.4
2999.77
17827.75
25.8
100
20908
352,614,497
Cleaned coal
104t
0.02
0.02
25.8
100
26344
498
Other W
ashed
Coal
104t
138.12
89.99
228.11
25.8
100
8363
1,804,669
Coke
104t
25.95
105
130.95
29.2
100
28435
3,986,695
Coke Oven Gas
108m
3
1.15
0.36
1.51
12.1
100
16726
112,054
Other Gas
108m
3
10.2
3.12
13.32
12.1
100
5227
308,897
Crude Oil
104t
0.82
0.36
1.18
20
100
41816
36,185
Gasoline
104t
0.02
0.02
0.04
18.9
100
43070
1,194
Diesel Oil
104t
1.3
3.03
2.39
1.39
1.38
9.49
20.2
100
42652
299,798
Fuel Oil
104t
0.64
0.29
3.15
1.68
0.89
2.22
8.87
21.1
100
41816
286,959
LPG
104t
0
17.2
100
50179
0
Refinery Gas
104t
0.71
3.41
1.76
0.78
6.66
15.7
100
46055
176,572
Natural Gas
108m
3
3
3
15.3
100
38931
655,209
Other
Petroleum
Products
104t
0
20
100
38369
0
Other Coking
Products
104t
1.5
1.5
25.8
100
28435
40,349
Other Energy
104t
tce
2.88
1.74
32.8
37.42
0
100
0
0
Total
Total
Total
Total CO
CO
CO
CO
2 222 Emission
Emission
Emission
Emission:
: :
: 360,323,575
360,323,575
360,323,575
360,323,575
Tota
l em
issi
on o
f th
e C
entr
al C
hin
a P
ow
er
Gri
d(t
CO
2e)
360,3
23,5
75
Tota
l ele
ctri
city
gen
era
tion o
f C
entr
al C
hin
a P
ow
er
Gri
d (M
Wh)
286,2
03,3
05
OM
em
issi
on facto
r of th
e C
CPG (tC
O2e/
MW
h)
1.2
5898
Sources: China Electric Power Yearbook 2006
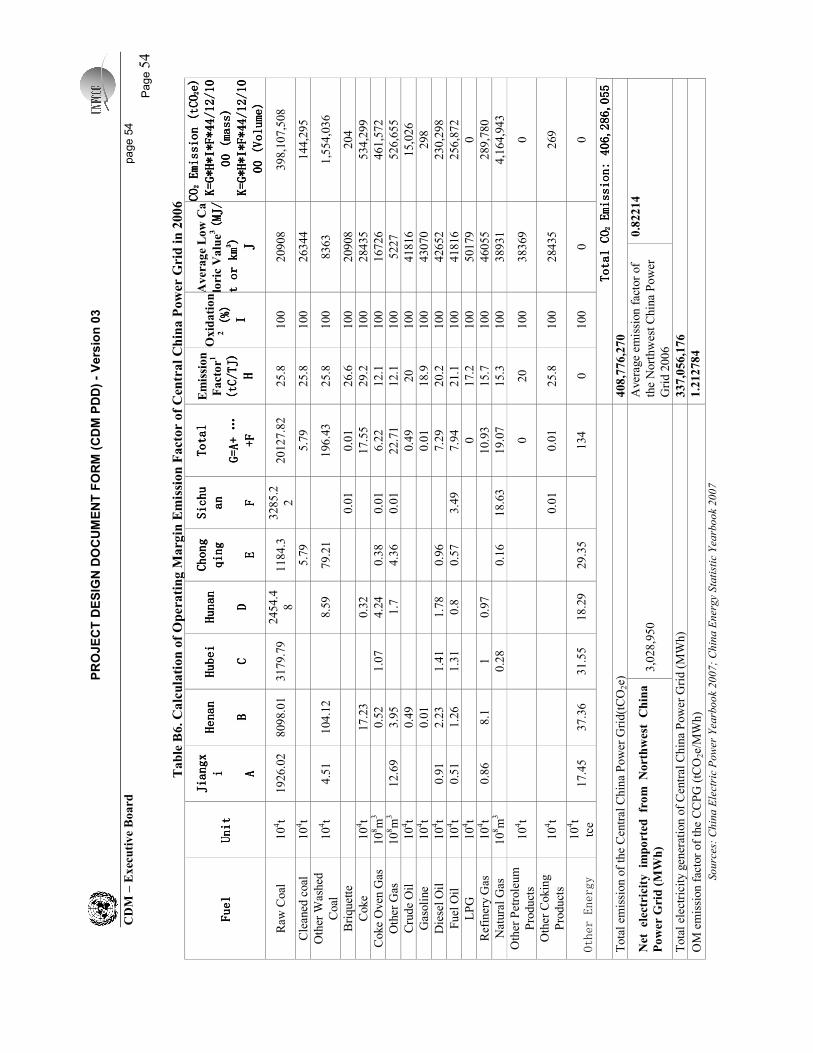
PROJECT DESIGN DOCUMENT FORM (CDM PDD) - Version 03
CD
M –
Exec
utive B
oard
page 54
Page 54
Table
B6. C
alc
ula
tion o
f O
pera
ting M
arg
in E
mis
sion F
acto
r o
f C
entr
al C
hin
a P
ow
er G
rid
in 2
006
Fuel
Fuel
Fuel
Fuel
Unit
Unit
Unit
Unit
Jiangx
Jiangx
Jiangx
Jiangx
i iii A AAA
Henan
Henan
Henan
Henan
B BBB
Hubei
Hubei
Hubei
Hubei
C CCC
Hunan
Hunan
Hunan
Hunan
D DDD
Chong
Chong
Chong
Chong
qing
qing
qing
qing
E EEE
Sichu
Sichu
Sichu
Sichu
an
anan
an F FFF
Total
Total
Total
Total
G GGG=A+
=A+
=A+
=A+ … ………
+ +++F FFF
Em
ission
Facto
r1
(tC/TJ)
(tC/TJ)
(tC/TJ)
(tC/TJ)
H HHH
Oxid
ation
2 (%)
(%)
(%)
(%)
I III
Average L
ow
Ca
lori
c V
alu
e3 (MJ/
(MJ/
(MJ/
(MJ/
t
t t
t or
oror
or k kkkm mmm
3 333) )))
J JJJ
CO
COCO
CO
2 222 Emission (tCO
Emission (tCO
Emission (tCO
Emission (tCO
2 222e)
e)e)
e)
K=G*H*I*F*44/12/10
K=G*H*I*F*44/12/10
K=G*H*I*F*44/12/10
K=G*H*I*F*44/12/10
00 (mass)
00 (mass)
00 (mass)
00 (mass)
K=G*H*I*F*44/12/10
K=G*H*I*F*44/12/10
K=G*H*I*F*44/12/10
K=G*H*I*F*44/12/10
00 (Volume)
00 (Volume)
00 (Volume)
00 (Volume)
Raw
Coal
104t
1926.02
8098.01
3179.79
2454.4
8
1184.3
3285.2
2
20127.82
25.8
100
20908
398,107,508
Cleaned coal
104t
5.79
5.79
25.8
100
26344
144,295
Other W
ashed
Coal
104t
4.51
104.12
8.59
79.21
196.43
25.8
100
8363
1,554,036
Briquette
0.01
0.01
26.6
100
20908
204
Coke
104t
17.23
0.32
17.55
29.2
100
28435
534,299
Coke Oven Gas
108m
3
0.52
1.07
4.24
0.38
0.01
6.22
12.1
100
16726
461,572
Other Gas
108m
3
12.69
3.95
1.7
4.36
0.01
22.71
12.1
100
5227
526,655
Crude Oil
104t
0.49
0.49
20
100
41816
15,026
Gasoline
104t
0.01
0.01
18.9
100
43070
298
Diesel Oil
104t
0.91
2.23
1.41
1.78
0.96
7.29
20.2
100
42652
230,298
Fuel Oil
104t
0.51
1.26
1.31
0.8
0.57
3.49
7.94
21.1
100
41816
256,872
LPG
104t
0
17.2
100
50179
0
Refinery Gas
104t
0.86
8.1
1
0.97
10.93
15.7
100
46055
289,780
Natural Gas
108m
3
0.28
0.16
18.63
19.07
15.3
100
38931
4,164,943
Other Petroleum
Products
104t
0
20
100
38369
0
Other Coking
Products
104t
0.01
0.01
25.8
100
28435
269
Other Energy
104t
tce
17.45
37.36
31.55
18.29
29.35
134
0
100
0
0
Total
Total
Total
Total CO
CO
CO
CO
2 222 Emission
Emission
Emission
Emission:
: :
: 406,286,055
406,286,055
406,286,055
406,286,055
Total em
ission of the Central China Power Grid(tCO
2e)
408,7
76,2
70
Net
ele
ctr
icity im
porte
d fr
om
N
orth
west
C
hin
a
Pow
er G
rid (M
Wh)
3,028,950
Average em
ission factor of
the Northwest China Power
Grid 2006
0.8
2214
Total electricity generation of Central China Power Grid (MWh)
337,0
56,1
76
OM emission factor of the CCPG (tCO
2e/MWh)
1.2
12784
Sources: China Electric Power Yearbook 2007; China Energy Statistic Yearbook 2007

PROJECT DESIGN DOCUMENT FORM (CDM PDD) - Version 03
CD
M –
Exec
utive B
oard
page 55
Page 55
Table
B7. W
eig
hte
d-a
ver
age
OM
em
ission facto
r of C
entr
al C
hin
a P
ow
er G
rid
(2004-2
006)
2004
2005
2006
Wei
ghte
d-a
verage O
M e
mission facto
r
Total Emission, tCO2
346,035,810
360,323,575
408,776,270
Total power supply, M
Wh
249,074,186
286,203,305
337,056,176
OM emission factor, tCO2/M
Wh
1.38929
1.25898
1.212784
1.2
7834
Therefore,
simple
OM
grid
EF
,,
=(346,035,810+ 360,323,575+408,776,270)/ ( 249,074,186+ 286,203,305+ 337,056,176) = 1
.27834 tCO
2e/MWh
Ste
p 5
. C
alc
ula
te the b
uild m
arg
in e
mis
sion fact
or
(EF
grid
,BM
,y)
The Emission Factor, Oxidation, Average Low Caloric Value applied in the calculation of OM and BM emission factor are listed in table C1.
Table
C1 R
ela
ted P
ara
met
ers
Fuel
Emission Factor 1(tc/TJ)
Oxidation 2(%)
Average Low Caloric Value 3
Raw
Coal
25.8
100
20908 kJ/kg
Cleaned Coal
25.8
100
26344 kJ/kg
Other W
ashed Coal
25.8
100
8363 kJ/kg
Briquette
26.6
100
20908 kJ/kg
Coke
29.2
100
28435 kJ/kg
Crude Oil
20
100
41816 kJ/kg
Gasoline
18.9
100
43070 kJ/kg
Kerosene
19.6
100
43070 kJ/kg
Diesel Oil
20.2
100
42652 kJ/kg
Fuel Oil
21.1
100
41816 kJ/kg
Other Petroleum Products
20
100
38369 kJ/kg
Other Coking Products
25.8
100
28435 kJ/kg
Natural Gas
15.3
100
38931 kJ/m
3
Coke Oven Gas
12.1
100
16726 kJ/m
3
Other Gas
12.1
100
5227 kJ/m
3
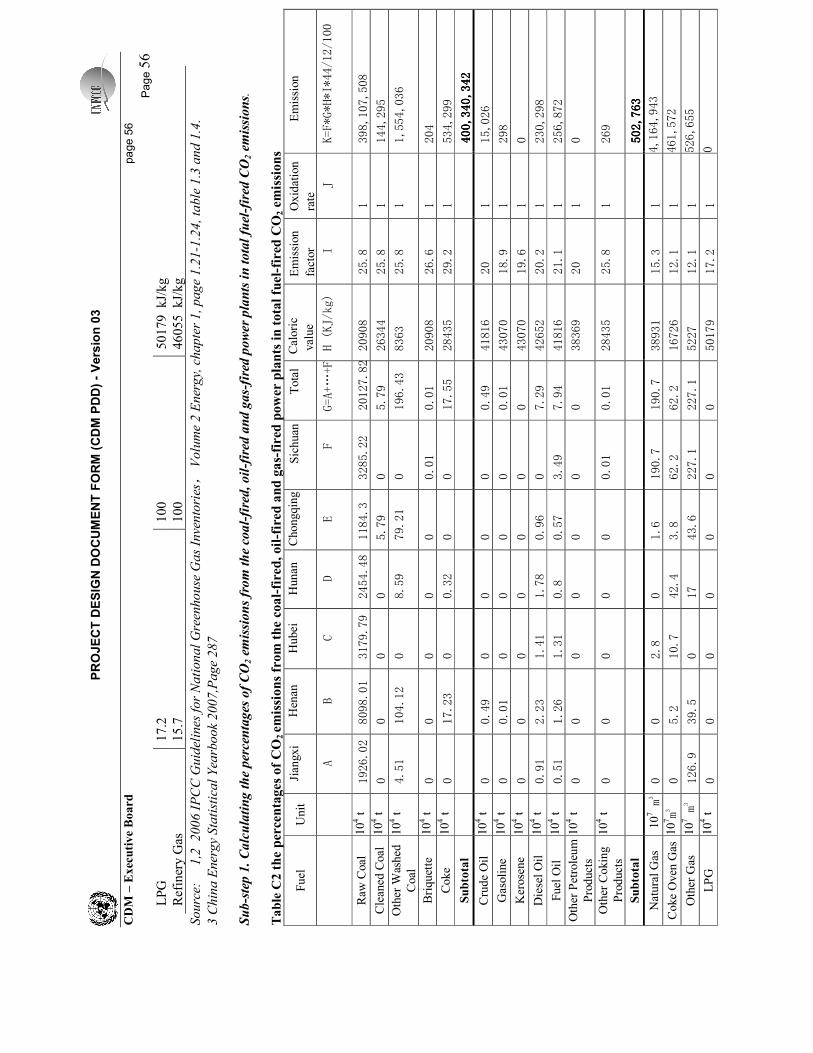
PROJECT DESIGN DOCUMENT FORM (CDM PDD) - Version 03
CD
M –
Exec
utive B
oard
page 56
Page 56
LPG
17.2
100
50179 kJ/kg
Refinery Gas
15.7
100
46055 kJ/kg
Source: 1,2 2006 IPCC Guidelines for National Greenhouse Gas Inventories, Volume 2 Energy, chapter 1, page 1.21-1.24, table 1.3 and 1.4.
3 China Energy Statistical Yearbook 2007,Page 287
Sub-step 1. Calculating the percentages of CO
2 emissions from the coal-fired, oil-fired and gas-fired power plants in total fuel-fired CO
2 emissions.
Table
C2 the p
erce
nta
ges of C
O2 em
issi
ons fr
om
the c
oal-fire
d, oil-f
ired a
nd g
as-
fired
pow
er p
lants
in tota
l fu
el-fired
CO
2 e
mis
sions
Fuel
Unit
Jiangxi
Henan
Hubei
Hunan
Chongqing
Sichuan
Total
Caloric
value
Emission
factor
Oxidation
rate
Emission
A
B
C
D
E
F
G=A+…+F
H (KJ/kg)
I
J
K=F*G*H*I*44/12/100
Raw
Coal
104 t
1926.02
8098.01
3179.79
2454.48
1184.3
3285.22
20127.82
20908
25.8
1
398,107,508
Cleaned Coal 104 t
0
0
0
0
5.79
0
5.79
26344
25.8
1
144,295
Other W
ashed
Coal
104 t
4.51
104.12
0
8.59
79.21
0
196.43
8363
25.8
1
1,554,036
Briquette
104 t
0
0
0
0
0
0.01
0.01
20908
26.6
1
204
Coke
104 t
0
17.23
0
0.32
0
0
17.55
28435
29.2
1
534,299
Subto
tal
400,340,
400,340,
400,340,
400,340,342
342
342
342
Crude Oil
104 t
0
0.49
0
0
0
0
0.49
41816
20
1
15,026
Gasoline
104 t
0
0.01
0
0
0
0
0.01
43070
18.9
1
298
Kerosene
104 t
0
0
0
0
0
0
0
43070
19.6
1
0
Diesel Oil
104 t
0.91
2.23
1.41
1.78
0.96
0
7.29
42652
20.2
1
230,298
Fuel Oil
104 t
0.51
1.26
1.31
0.8
0.57
3.49
7.94
41816
21.1
1
256,872
Other Petroleum
Products
104 t
0
0
0
0
0
0
0
38369
20
1
0
Other Coking
Products
104 t
0
0
0
0
0
0.01
0.01
28435
25.8
1
269
Subto
tal
502,763
502,763
502,763
502,763
Natural Gas
107 m3 0
0
2.8
0
1.6
190.7
190.7
38931
15.3
1
4,164,943
Coke Oven Gas 107m3
0
5.2
10.7
42.4
3.8
62.2
62.2
16726
12.1
1
461,572
Other Gas
107 m
3 126.9
39.5
0
17
43.6
227.1
227.1
5227
12.1
1
526,655
LPG
104 t
0
0
0
0
0
0
0
50179
17.2
1
0
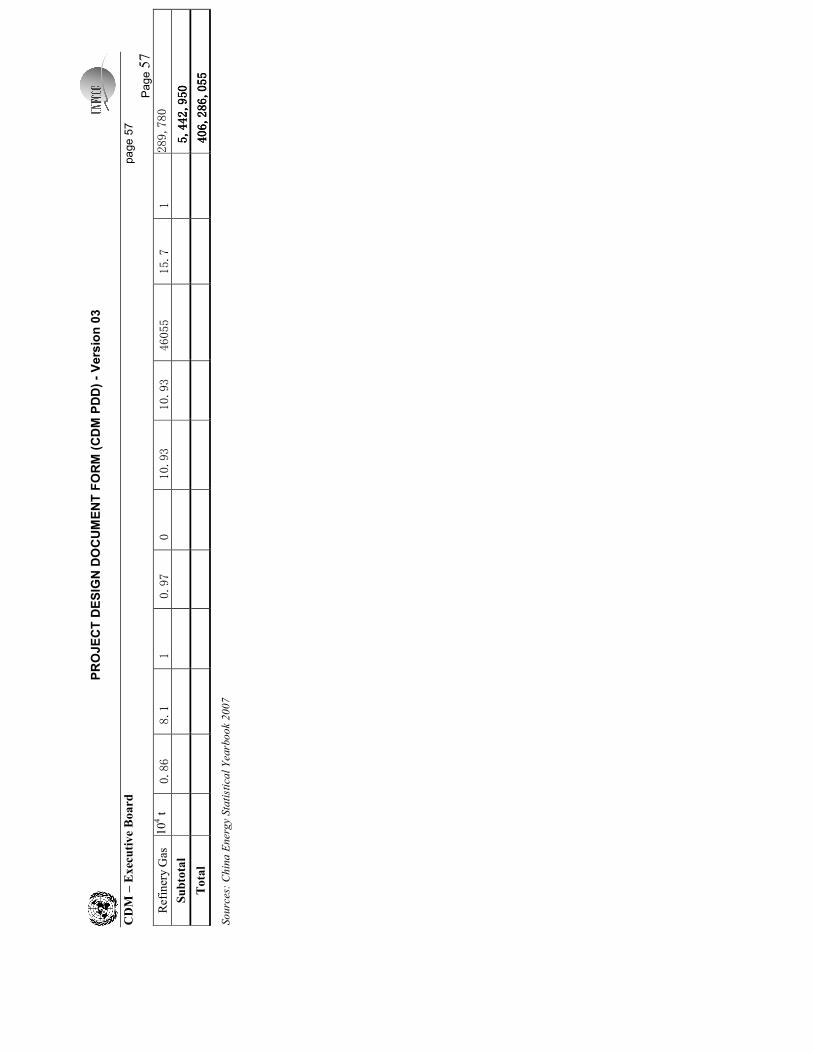
PROJECT DESIGN DOCUMENT FORM (CDM PDD) - Version 03
CD
M –
Exec
utive B
oard
page 57
Page 57
Refinery Gas
104 t
0.86
8.1
1
0.97
0
10.93
10.93
46055
15.7
1
289,780
Subto
tal
5,442,950
5,442,950
5,442,950
5,442,950
Tota
l
406,286,055
406,286,055
406,286,055
406,286,055
Sources: China Energy Statistical Yearbook 2007
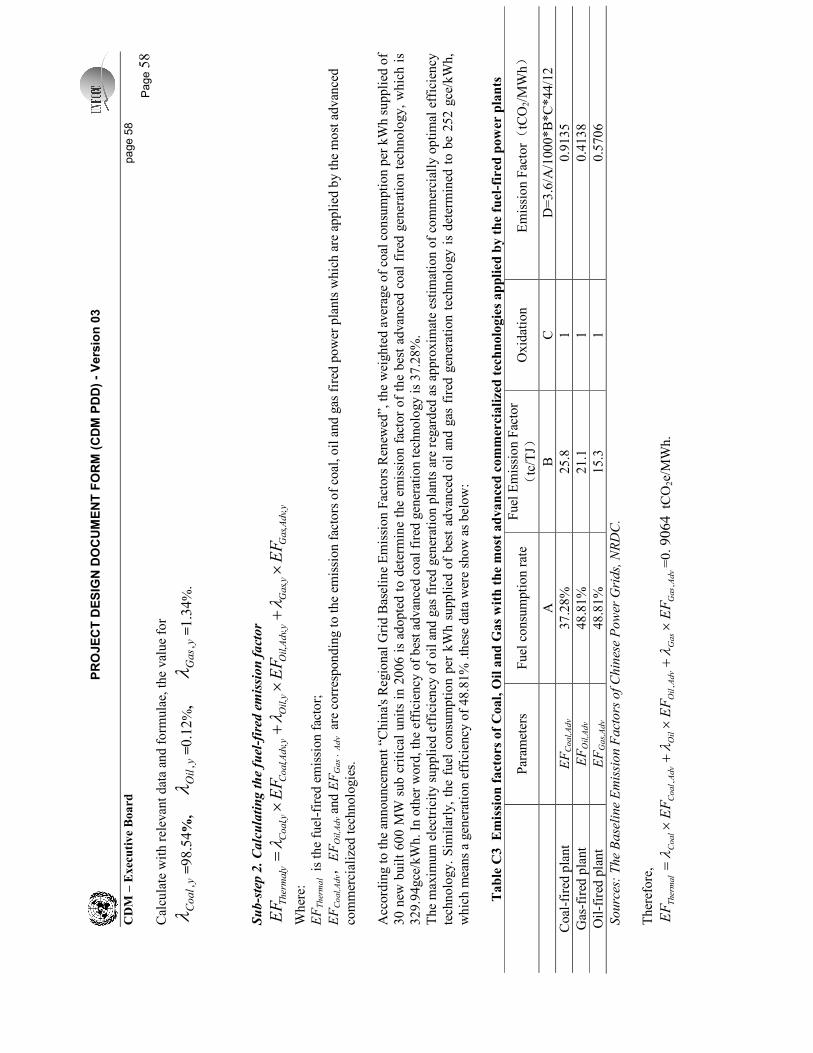
PROJECT DESIGN DOCUMENT FORM (CDM PDD) - Version 03
CD
M –
Exec
utive B
oard
page 58
Page 58
Calculate with relevant data and form
ulae, the value for
yCoal,
λ=98.54%
,
yOil,
λ=0.12%
,
yGas,
λ=1.34%.
Sub-step 2. Calculating the fuel-fired emission factor
yAdv
Gas
yGas
yAdv
Oil
yOil
yAdv
Coal
yCoal
yThermal
EF
EF
EF
EF
,,
,,
,,
,,
,,
×+
×+
×=
λλ
λ
Where:
EFThermal is the fuel-fired emission factor;
EFCoal,Adv,
EFOil,Adv and EFGas ,Adv are corresponding to the em
ission factors of coal, oil and gas fired power plants which are applied by the most advanced
commercialized technologies.
According to the announcement “C
hina's Regional Grid Baseline Emission Factors Renew
ed”, the weighted average of coal consumption per kWh supplied of
30 new
built 600 M
W sub critical units in 2006 is adopted to determine the em
ission factor of the best advanced coal fired generation technology, which is
329.94gce/kWh. In other word, the efficiency of best advanced coal fired generation technology is 37.28%.
The maxim
um electricity supplied efficiency of oil and gas fired generation plants are regarded as approxim
ate estimation of commercially optimal efficiency
technology. Sim
ilarly, the fuel consumption per kWh supplied of best advanced oil and gas fired generation technology is determined to be 252 gce/kWh,
which m
eans a generation efficiency of 48.81% .these data were show as below:
Table
C3 Em
issi
on facto
rs of C
oal, O
il a
nd G
as w
ith the
most
advance
d c
om
mer
cialize
d tec
hnolo
gie
s applied b
y the fuel
-fir
ed p
ow
er p
lants
Param
eters
Fuel consumption rate
Fuel Emission Factor
(tc/TJ)
Oxidation
Emission Factor(
tCO
2/M
Wh)
A
B
C
D=3.6/A
/1000*B*C*44/12
Coal-fired plant
EFCoal,Adv
37.28%
25.8
1
0.9135
Gas-fired plant
EFOil,Adv
48.81%
21.1
1
0.4138
Oil-fired plant
EFGas,Adv
48.81%
15.3
1
0.5706
Sources: The Baseline Emission Factors of Chinese Power Grids, NRDC.
Therefore,
Adv
Gas
Gas
Adv
Oil
Oil
Adv
Coal
Coal
Thermal
EF
EF
EF
EF
,,
,×
+×
+×
=λ
λλ
=0. 9064 tCO
2e/MWh.
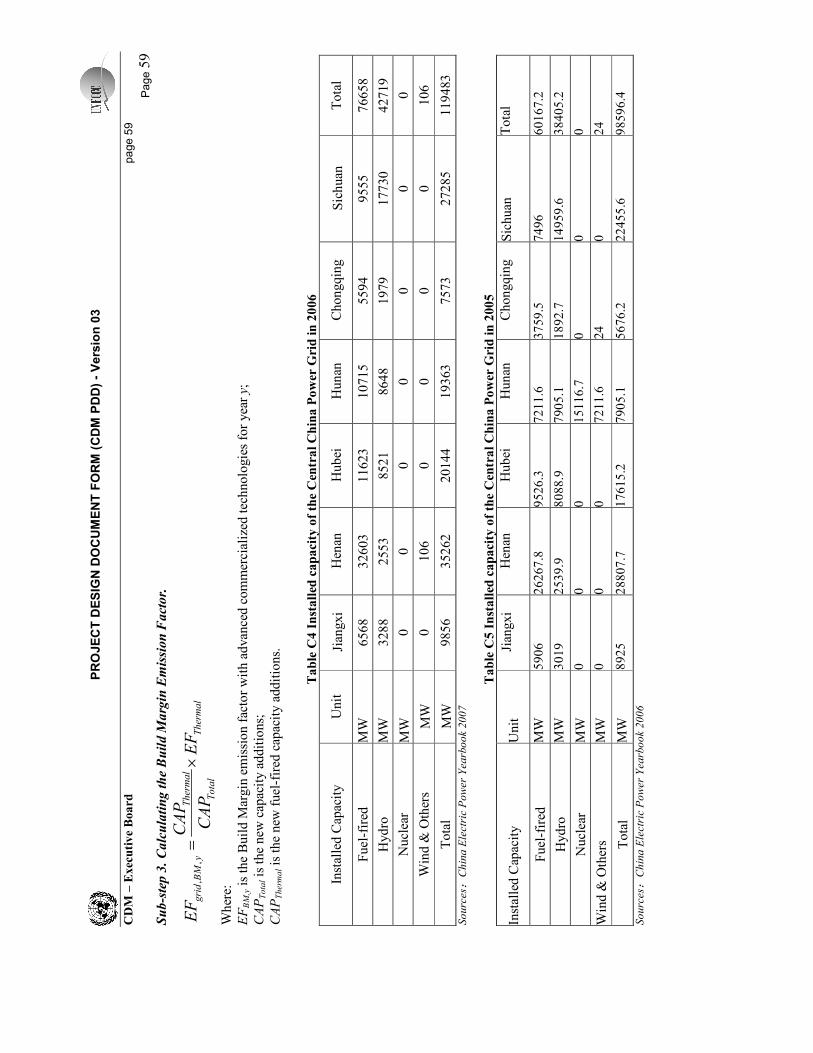
PROJECT DESIGN DOCUMENT FORM (CDM PDD) - Version 03
CD
M –
Exec
utive B
oard
page 59
Page 59
Sub-step 3. Calculating the Build M
argin Emission Factor.
Thermal
Total
Thermal
yBM
grid
EF
CAP
CAP
EF
×=
,,
Where:
EFBM,y is the Build M
argin emission factor with advanced commercialized technologies for year y;
CAPTotal is the new
capacity additions;
CAPTherm
al is the new
fuel-fired capacity additions.
T
able
C4 Inst
alled
capacity o
f th
e C
entr
al C
hin
a P
ow
er G
rid in 2
006
Installed Capacity
Unit
Jiangxi
Henan
Hubei
Hunan
Chongqing
Sichuan
Total
Fuel-fired
MW
6568
32603
11623
10715
5594
9555
76658
Hydro
MW
3288
2553
8521
8648
1979
17730
42719
Nuclear
MW
0
0
0
0
0
0
0
Wind &
Others
MW
0
106
0
0
0
0
106
Total
MW
9856
35262
20144
19363
7573
27285
119483
Sources:China Electric Power Yearbook 2007
T
able
C5 Inst
alled
capacity o
f th
e C
entr
al C
hin
a P
ow
er G
rid in 2
005
Installed Capacity
Unit
Jiangxi
Henan
Hubei
Hunan
Chongqing
Sichuan
Total
Fuel-fired
MW
5906
26267.8
9526.3
7211.6
3759.5
7496
60167.2
Hydro
MW
3019
2539.9
8088.9
7905.1
1892.7
14959.6
38405.2
Nuclear
MW
0
0
0
15116.7
0
0
0
Wind &
Others
MW
0
0
0
7211.6
24
0
24
Total
MW
8925
28807.7
17615.2
7905.1
5676.2
22455.6
98596.4
Sources:China Electric Power Yearbook 2006
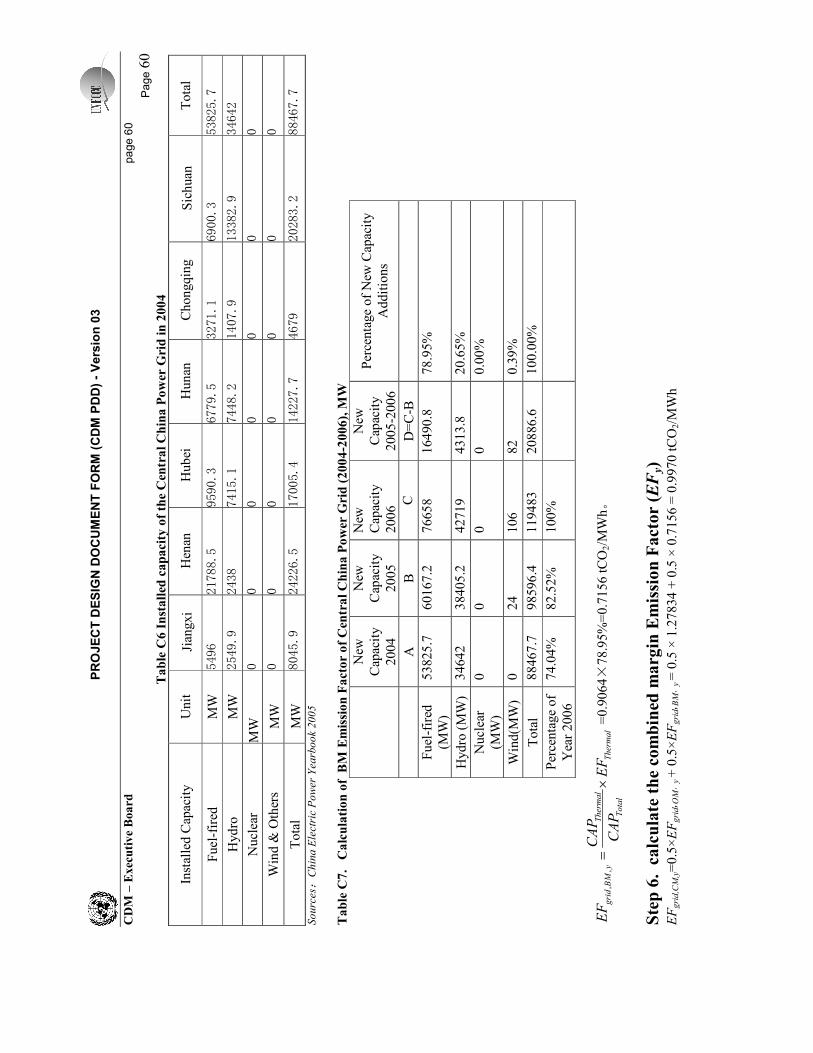
PROJECT DESIGN DOCUMENT FORM (CDM PDD) - Version 03
CD
M –
Exec
utive B
oard
page 60
Page 60
Table
C6 Inst
alled
capacity o
f th
e C
entr
al C
hin
a P
ow
er G
rid in 2
004
Installed Capacity
Unit
Jiangxi
Henan
Hubei
Hunan
Chongqing
Sichuan
Total
Fuel-fired
MW
5496
21788.5
9590.3
6779.
5 32
71.1
6900.3
53825.
7
Hydro
MW
2549.9
2438
7415.1
7448.
2 14
07.9
13382.9
34642
Nuclear
MW
0
0
0
0 0
0 0
Wind &
Others
MW
0
0
0
0 0
0 0
Total
MW
8045.9
24226.5
17005.4
14227
.7
4679
20283.2
88467.
7
Sources:China Electric Power Yearbook 2005
Table
C7. C
alc
ula
tion o
f B
M E
mission F
acto
r o
f C
entr
al C
hin
a P
ow
er G
rid (2004-2
006), M
W
New
Capacity
2004
New
Capacity
2005
New
Capacity
2006
New
Capacity
2005-2006
Percentage of New
Capacity
Additions
A
B
C
D=C-B
Fuel-fired
(MW)
53825.7
60167.2
76658
16490.8
78.95%
Hydro (MW)
34642
38405.2
42719
4313.8
20.65%
Nuclear
(MW)
0
0
0
0
0.00%
Wind(M
W)
0
24
106
82
0.39%
Total
88467.7
98596.4
119483
20886.6
100.00%
Percentage of
Year 2006
74.04%
82.52%
100%
Thermal
Total
Thermal
yBM
grid
EF
CAP
CAP
EF
×=
,,
=0.9064×78.95%=0.7156 tCO
2/M
Wh。
Ste
p 6
. c
alc
ula
te the
com
bin
ed m
arg
in E
mis
sion F
act
or
(EF
y)
EFgrid,CM,y=0.5×EFgrid, O
M,y + 0.5×EFgrid, BM
,y = 0.5 × 1.27834 + 0.5 × 0.7156 = 0.9970 tCO
2/M
Wh
PROJECT DESIGN DOCUMENT FORM (CDM PDD) - Version 03
CD
M –
Exec
utive B
oard
page 61
Page 61
Annex
4
MO
NIT
OR
ING
IN
FO
RM
ATIO
N
No additional inform
ation.
Related Documents