Progressive forest canopy water loss during the 2012–2015 California drought Gregory P. Asner 1 , Philip G. Brodrick, Christopher B. Anderson, Nicholas Vaughn, David E. Knapp, and Roberta E. Martin Department of Global Ecology, Carnegie Institution for Science, Stanford, CA 94305 Contributed by Gregory P. Asner, November 30, 2015 (sent for review November 10, 2015); reviewed by Craig D. Allen and Robert Green) The 2012–2015 drought has left California with severely reduced snowpack, soil moisture, ground water, and reservoir stocks, but the impact of this estimated millennial-scale event on forest health is unknown. We used airborne laser-guided spectroscopy and satel- lite-based models to assess losses in canopy water content of Califor- nia’s forests between 2011 and 2015. Approximately 10.6 million ha of forest containing up to 888 million large trees experienced measur- able loss in canopy water content during this drought period. Severe canopy water losses of greater than 30% occurred over 1 million ha, affecting up to 58 million large trees. Our measurements exclude forests affected by fire between 2011 and 2015. If drought conditions continue or reoccur, even with temporary reprieves such as El Niño, we predict substantial future forest change. canopy water | climate change | drought | forest health | imaging spectroscopy C alifornia has undergone progressive drought since 2012, with the cumulative rainfall deficit in 2015 described as a one in a 1,000-y event (1). As a result, concern has grown over the eco- logical and societal effects of the drought throughout the envi- ronmental conservation, management, and resource policy communities (2). Such concerns are likely to increase as rising temperatures interact with droughts in California and around the world (3–5). Forests of California are of particular interest because they include the tallest, most massive, and oldest trees on Earth, as well as provide a wide variety of goods and services to the state of California and the world. These services include habitat for nu- merous plant and animal species, carbon storage for climate change mitigation, water provisioning for a myriad of industries and communities, timber for wood products, and ecotourism (6). Combined with high air temperatures and insect infestations, the 2012–2015 drought has generated a large pulse of tree mortality in California (7). This event may have cascading effects on forest fire susceptibility and severity, animal habitat and biological di- versity, water resources, and carbon sequestration. However, tree mortality mapping provides a limited understanding of forest vulnerability and adaptation, because the observations do not di- rectly resolve forest physiological responses to ongoing changes in climate. To improve predictions of how forests will change in the future, spatially and temporally continuous measurements of can- opy functional responses to climate change are needed. Monitoring forest canopy physiology in the context of drought and other climate perturbations has proven challenging, because the onset and progression of canopy stress is not easily revealed in traditional satellite observations (8). Newer technologies, such as high-fidelity imaging spectroscopy (HiFIS), may help to break this barrier (9, 10). HiFIS measures the spectral radiance reflected from the land surface in narrow, overlapping, and contiguous spectral channels (11). After compensation for illumination and atmospheric effects, HiFIS-measured spectral reflectance yields quantitative measurements of the mass-concentration of biologically important molecules and elements (12–15), some of which are di- agnostic and predictive of vegetation responses to climate change. One of the most operational HiFIS measurements is canopy water content (CWC), which is the total amount of liquid water in the foliage of a canopy. CWC is an indicator of tree physio- logical status because it underpins important plant functions, including light interception and growth (16–18). It is broadly correlated with leaf water potential during times of water stress (19–21), and thus has served as an indicator of progressive drought effects on forest canopies (8). CWC is also a useful predictor for vegetation flammability (22). CWC can be esti- mated from HiFIS in units of water volume (e.g., liters) in the canopy on a per area (e.g., square meter) basis, derived from the depth and shape of 118 spectral absorption features centered at 980 nm and 1,160 nm (23, 24). By combining HiFIS measure- ments with 3D forest imaging via light detection and ranging (LiDAR) scanning, it is possible to exclude nonforest canopies, such as grasses and short shrubs, as well as bare ground, rock cover, and infrastructure, from the intended measurement (25). This data-fusion technique, called laser-guided HiFIS, allows for the measurement and projection of forest CWC in three dimensions. HiFIS and LiDAR technologies are not currently available from satellites. The Carnegie Airborne Observatory (CAO) is one of the few systems that can make laser-guided HiFIS measurements on an operational basis (26). Nonetheless, the time needed to cover a large area, such as the ∼13.4 million ha of forest in California, re- quires additional techniques that combine aircraft measurements with an integrated suite of statewide geospatial data (27, 28). We combined airborne laser-guided HiFIS, multivariate satellite and environmental data, and geostatistical modeling to develop high- resolution forest CWC maps of California (SI Appendix, Figs. S1–S4 and Table S1). The airborne and satellite measurements were collected in August 2015, allowing for the derivation of geostatistically robust Significance The state of California has a globally important economy and a population exceeding 38 million. The state relies on its forested watersheds to support numerous services, such as water pro- visioning, carbon storage, timber products, ecotourism, and rec- reation. However, secular changes in air temperature, combined with periodic and prolonged drought, pose a compounding chal- lenge to forest health. Here we use new remote-sensing and modeling techniques to assess changes in the canopy water con- tent of California’s forests from 2011 to 2015. Our resulting maps of progressive canopy water stress identify at-risk forest land- scapes and watersheds at fine resolution, and offer geographically explicit information to support innovative forest management and policies in preparation for climate change. Author contributions: G.P.A. designed research; G.P.A., P.G.B., C.B.A., N.V., D.E.K., and R.E.M. performed research; G.P.A., P.G.B., C.B.A., N.V., D.E.K., and R.E.M. analyzed data; and G.P.A., P.G.B., and R.E.M. wrote the paper. Reviewers: C.D.A., US Geological Survey; and R.G., Jet Propulsion Laboratory. The authors declare no conflict of interest. Freely available online through the PNAS open access option. 1 To whom correspondence should be addressed. Email: [email protected]. This article contains supporting information online at www.pnas.org/lookup/suppl/doi:10. 1073/pnas.1523397113/-/DCSupplemental. www.pnas.org/cgi/doi/10.1073/pnas.1523397113 PNAS | Published online December 28, 2015 | E249–E255 SUSTAINABILITY SCIENCE PNAS PLUS

Welcome message from author
This document is posted to help you gain knowledge. Please leave a comment to let me know what you think about it! Share it to your friends and learn new things together.
Transcript
Progressive forest canopy water loss during the2012–2015 California droughtGregory P. Asner1, Philip G. Brodrick, Christopher B. Anderson, Nicholas Vaughn, David E. Knapp, and Roberta E. Martin
Department of Global Ecology, Carnegie Institution for Science, Stanford, CA 94305
Contributed by Gregory P. Asner, November 30, 2015 (sent for review November 10, 2015); reviewed by Craig D. Allen and Robert Green)
The 2012–2015 drought has left California with severely reducedsnowpack, soil moisture, ground water, and reservoir stocks, butthe impact of this estimated millennial-scale event on forest healthis unknown. We used airborne laser-guided spectroscopy and satel-lite-based models to assess losses in canopy water content of Califor-nia’s forests between 2011 and 2015. Approximately 10.6 million haof forest containing up to 888 million large trees experienced measur-able loss in canopy water content during this drought period. Severecanopy water losses of greater than 30% occurred over 1 million ha,affecting up to 58 million large trees. Our measurements excludeforests affected by fire between 2011 and 2015. If drought conditionscontinue or reoccur, even with temporary reprieves such as El Niño,we predict substantial future forest change.
canopy water | climate change | drought | forest health |imaging spectroscopy
California has undergone progressive drought since 2012, withthe cumulative rainfall deficit in 2015 described as a one in a
1,000-y event (1). As a result, concern has grown over the eco-logical and societal effects of the drought throughout the envi-ronmental conservation, management, and resource policycommunities (2). Such concerns are likely to increase as risingtemperatures interact with droughts in California and around theworld (3–5).Forests of California are of particular interest because they
include the tallest, most massive, and oldest trees on Earth, aswell as provide a wide variety of goods and services to the state ofCalifornia and the world. These services include habitat for nu-merous plant and animal species, carbon storage for climatechange mitigation, water provisioning for a myriad of industriesand communities, timber for wood products, and ecotourism (6).Combined with high air temperatures and insect infestations, the2012–2015 drought has generated a large pulse of tree mortalityin California (7). This event may have cascading effects on forestfire susceptibility and severity, animal habitat and biological di-versity, water resources, and carbon sequestration. However, treemortality mapping provides a limited understanding of forestvulnerability and adaptation, because the observations do not di-rectly resolve forest physiological responses to ongoing changes inclimate. To improve predictions of how forests will change in thefuture, spatially and temporally continuous measurements of can-opy functional responses to climate change are needed.Monitoring forest canopy physiology in the context of drought
and other climate perturbations has proven challenging, becausethe onset and progression of canopy stress is not easily revealedin traditional satellite observations (8). Newer technologies, suchas high-fidelity imaging spectroscopy (HiFIS), may help to breakthis barrier (9, 10). HiFIS measures the spectral radiance reflectedfrom the land surface in narrow, overlapping, and contiguousspectral channels (11). After compensation for illumination andatmospheric effects, HiFIS-measured spectral reflectance yieldsquantitative measurements of the mass-concentration of biologicallyimportant molecules and elements (12–15), some of which are di-agnostic and predictive of vegetation responses to climate change.One of the most operational HiFIS measurements is canopy
water content (CWC), which is the total amount of liquid water
in the foliage of a canopy. CWC is an indicator of tree physio-logical status because it underpins important plant functions,including light interception and growth (16–18). It is broadlycorrelated with leaf water potential during times of water stress(19–21), and thus has served as an indicator of progressivedrought effects on forest canopies (8). CWC is also a usefulpredictor for vegetation flammability (22). CWC can be esti-mated from HiFIS in units of water volume (e.g., liters) in thecanopy on a per area (e.g., square meter) basis, derived from thedepth and shape of 118 spectral absorption features centered at980 nm and 1,160 nm (23, 24). By combining HiFIS measure-ments with 3D forest imaging via light detection and ranging(LiDAR) scanning, it is possible to exclude nonforest canopies,such as grasses and short shrubs, as well as bare ground, rockcover, and infrastructure, from the intended measurement(25). This data-fusion technique, called laser-guided HiFIS,allows for the measurement and projection of forest CWC inthree dimensions.HiFIS and LiDAR technologies are not currently available from
satellites. The Carnegie Airborne Observatory (CAO) is one of thefew systems that can make laser-guided HiFIS measurements on anoperational basis (26). Nonetheless, the time needed to cover alarge area, such as the ∼13.4 million ha of forest in California, re-quires additional techniques that combine aircraft measurementswith an integrated suite of statewide geospatial data (27, 28). Wecombined airborne laser-guided HiFIS, multivariate satellite andenvironmental data, and geostatistical modeling to develop high-resolution forest CWCmaps of California (SI Appendix, Figs. S1–S4and Table S1).The airborne and satellite measurements were collected in
August 2015, allowing for the derivation of geostatistically robust
Significance
The state of California has a globally important economy and apopulation exceeding 38 million. The state relies on its forestedwatersheds to support numerous services, such as water pro-visioning, carbon storage, timber products, ecotourism, and rec-reation. However, secular changes in air temperature, combinedwith periodic and prolonged drought, pose a compounding chal-lenge to forest health. Here we use new remote-sensing andmodeling techniques to assess changes in the canopy water con-tent of California’s forests from 2011 to 2015. Our resulting mapsof progressive canopy water stress identify at-risk forest land-scapes andwatersheds at fine resolution, and offer geographicallyexplicit information to support innovative forest managementand policies in preparation for climate change.
Author contributions: G.P.A. designed research; G.P.A., P.G.B., C.B.A., N.V., D.E.K., andR.E.M. performed research; G.P.A., P.G.B., C.B.A., N.V., D.E.K., and R.E.M. analyzeddata; and G.P.A., P.G.B., and R.E.M. wrote the paper.
Reviewers: C.D.A., US Geological Survey; and R.G., Jet Propulsion Laboratory.
The authors declare no conflict of interest.
Freely available online through the PNAS open access option.1To whom correspondence should be addressed. Email: [email protected].
This article contains supporting information online at www.pnas.org/lookup/suppl/doi:10.1073/pnas.1523397113/-/DCSupplemental.
www.pnas.org/cgi/doi/10.1073/pnas.1523397113 PNAS | Published online December 28, 2015 | E249–E255
SUST
AINABILITY
SCIENCE
PNASPL
US
relationships between HiFIS and satellite data using a deeplearning model (SI Appendix). These relationships were used toscale up the 2015 HiFIS measurements to the entire forestedregion of California. In addition, statewide multivariate satellitedata were compiled for 2011, 2013, and 2014, and used to ret-rospectively estimate forest CWC and change from 2011 to 2015using our modeling technique. The goal was to quantify CWCchanges over 4 years as a means to understand forest canopyphysiological responses to progressive drought.
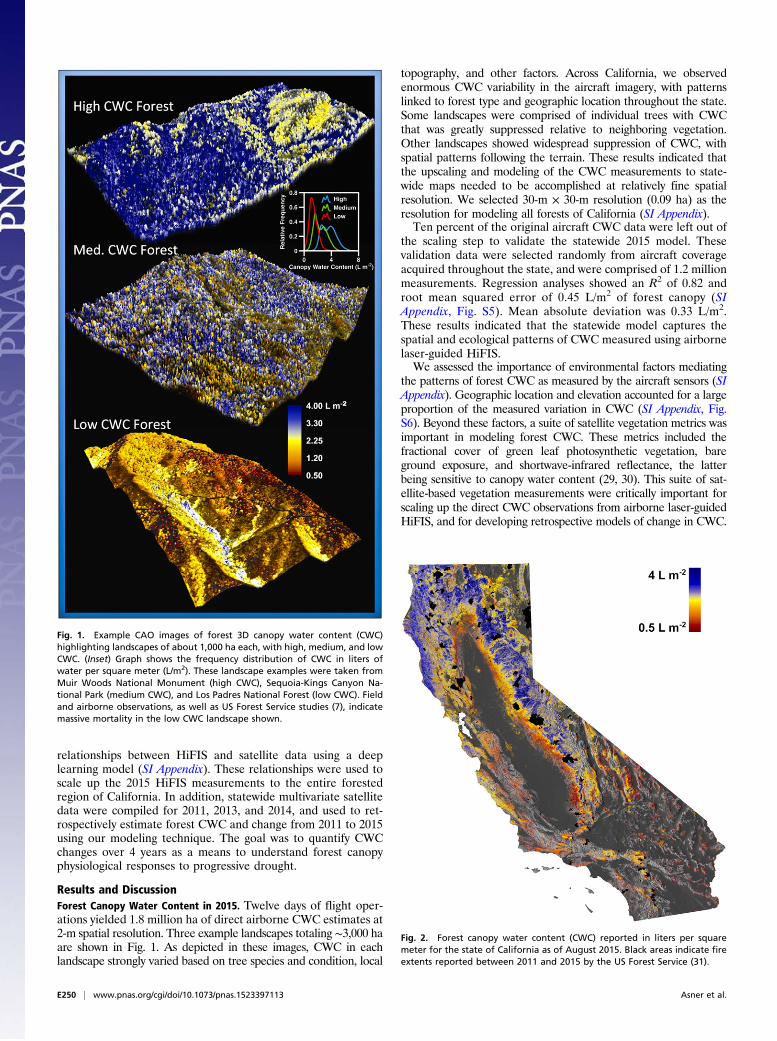
Results and DiscussionForest Canopy Water Content in 2015. Twelve days of flight oper-ations yielded 1.8 million ha of direct airborne CWC estimates at2-m spatial resolution. Three example landscapes totaling ∼3,000 haare shown in Fig. 1. As depicted in these images, CWC in eachlandscape strongly varied based on tree species and condition, local
topography, and other factors. Across California, we observedenormous CWC variability in the aircraft imagery, with patternslinked to forest type and geographic location throughout the state.Some landscapes were comprised of individual trees with CWCthat was greatly suppressed relative to neighboring vegetation.Other landscapes showed widespread suppression of CWC, withspatial patterns following the terrain. These results indicated thatthe upscaling and modeling of the CWC measurements to state-wide maps needed to be accomplished at relatively fine spatialresolution. We selected 30-m × 30-m resolution (0.09 ha) as theresolution for modeling all forests of California (SI Appendix).Ten percent of the original aircraft CWC data were left out of
the scaling step to validate the statewide 2015 model. Thesevalidation data were selected randomly from aircraft coverageacquired throughout the state, and were comprised of 1.2 millionmeasurements. Regression analyses showed an R2 of 0.82 androot mean squared error of 0.45 L/m2 of forest canopy (SIAppendix, Fig. S5). Mean absolute deviation was 0.33 L/m2.These results indicated that the statewide model captures thespatial and ecological patterns of CWC measured using airbornelaser-guided HiFIS.We assessed the importance of environmental factors mediating
the patterns of forest CWC as measured by the aircraft sensors (SIAppendix). Geographic location and elevation accounted for a largeproportion of the measured variation in CWC (SI Appendix, Fig.S6). Beyond these factors, a suite of satellite vegetation metrics wasimportant in modeling forest CWC. These metrics included thefractional cover of green leaf photosynthetic vegetation, bareground exposure, and shortwave-infrared reflectance, the latterbeing sensitive to canopy water content (29, 30). This suite of sat-ellite-based vegetation measurements were critically important forscaling up the direct CWC observations from airborne laser-guidedHiFIS, and for developing retrospective models of change in CWC.
Fig. 1. Example CAO images of forest 3D canopy water content (CWC)highlighting landscapes of about 1,000 ha each, with high, medium, and lowCWC. (Inset) Graph shows the frequency distribution of CWC in liters ofwater per square meter (L/m2). These landscape examples were taken fromMuir Woods National Monument (high CWC), Sequoia-Kings Canyon Na-tional Park (medium CWC), and Los Padres National Forest (low CWC). Fieldand airborne observations, as well as US Forest Service studies (7), indicatemassive mortality in the low CWC landscape shown.
Fig. 2. Forest canopy water content (CWC) reported in liters per squaremeter for the state of California as of August 2015. Black areas indicate fireextents reported between 2011 and 2015 by the US Forest Service (31).
E250 | www.pnas.org/cgi/doi/10.1073/pnas.1523397113 Asner et al.
The statewide model for August 2015 indicated local- to re-gional-scale gradients in forest canopy water content (Fig. 2and SI Appendix, Figs. S7–S9). The lowest modeled CWC values(<1.0 L/m2) were observed in southern Californian forests as wellas in lower elevation forests encircling the Central Valley. Thisincluded lower elevations of the Sierra Nevada Mountains. Ad-ditional low-CWC forests were modeled on slopes above forested
drainages and river valleys, as well as in extensive swaths throughoutmuch of the state’s wildland-urban interface.
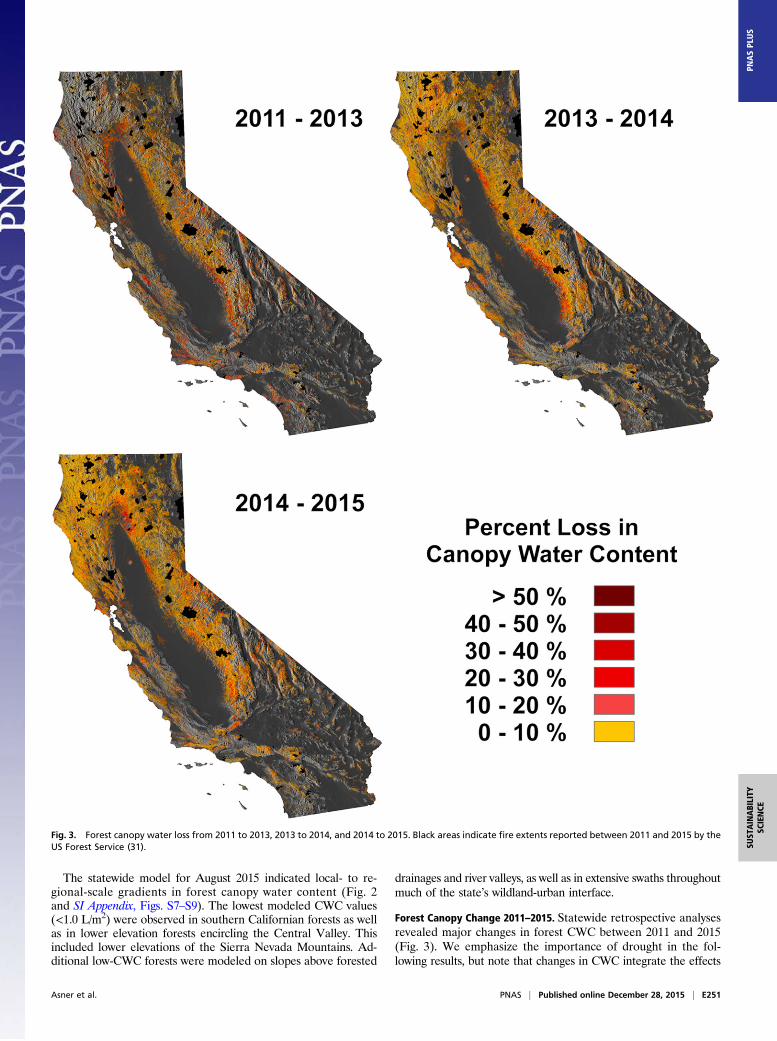
Forest Canopy Change 2011–2015. Statewide retrospective analysesrevealed major changes in forest CWC between 2011 and 2015(Fig. 3). We emphasize the importance of drought in the fol-lowing results, but note that changes in CWC integrate the effects
Fig. 3. Forest canopy water loss from 2011 to 2013, 2013 to 2014, and 2014 to 2015. Black areas indicate fire extents reported between 2011 and 2015 by theUS Forest Service (31).
Asner et al. PNAS | Published online December 28, 2015 | E251
SUST
AINABILITY
SCIENCE
PNASPL
US
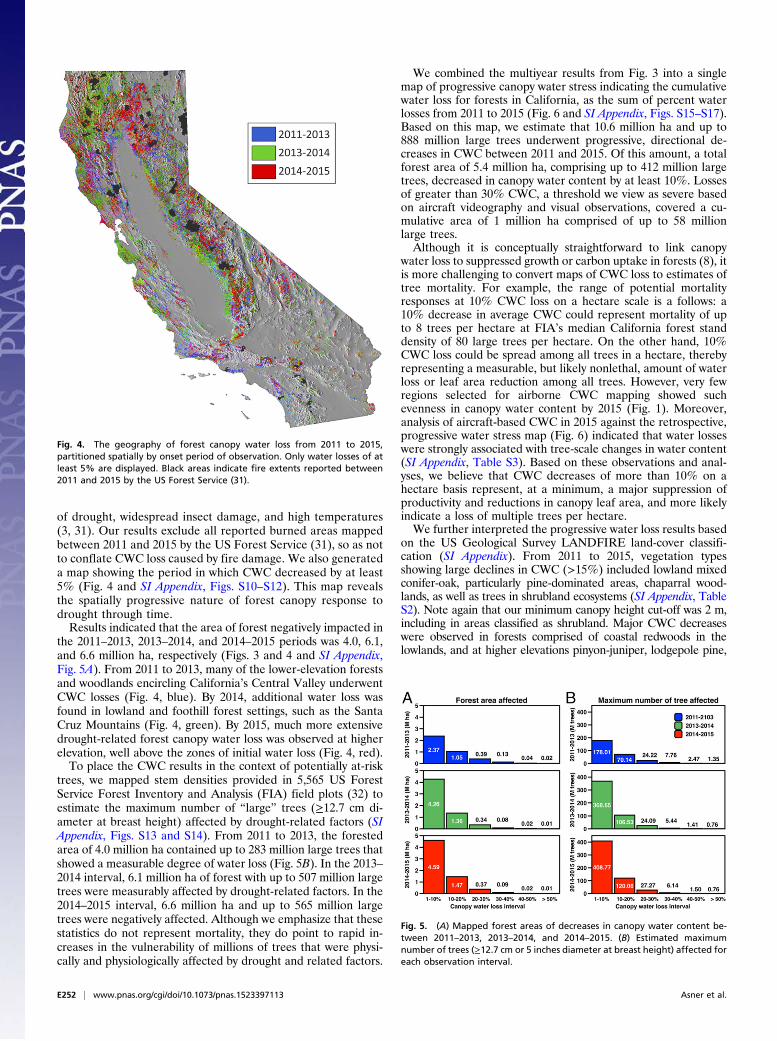
of drought, widespread insect damage, and high temperatures(3, 31). Our results exclude all reported burned areas mappedbetween 2011 and 2015 by the US Forest Service (31), so as notto conflate CWC loss caused by fire damage. We also generateda map showing the period in which CWC decreased by at least5% (Fig. 4 and SI Appendix, Figs. S10–S12). This map revealsthe spatially progressive nature of forest canopy response todrought through time.Results indicated that the area of forest negatively impacted in
the 2011–2013, 2013–2014, and 2014–2015 periods was 4.0, 6.1,and 6.6 million ha, respectively (Figs. 3 and 4 and SI Appendix,Fig. 5A). From 2011 to 2013, many of the lower-elevation forestsand woodlands encircling California’s Central Valley underwentCWC losses (Fig. 4, blue). By 2014, additional water loss wasfound in lowland and foothill forest settings, such as the SantaCruz Mountains (Fig. 4, green). By 2015, much more extensivedrought-related forest canopy water loss was observed at higherelevation, well above the zones of initial water loss (Fig. 4, red).To place the CWC results in the context of potentially at-risk
trees, we mapped stem densities provided in 5,565 US ForestService Forest Inventory and Analysis (FIA) field plots (32) toestimate the maximum number of “large” trees (≥12.7 cm di-ameter at breast height) affected by drought-related factors (SIAppendix, Figs. S13 and S14). From 2011 to 2013, the forestedarea of 4.0 million ha contained up to 283 million large trees thatshowed a measurable degree of water loss (Fig. 5B). In the 2013–2014 interval, 6.1 million ha of forest with up to 507 million largetrees were measurably affected by drought-related factors. In the2014–2015 interval, 6.6 million ha and up to 565 million largetrees were negatively affected. Although we emphasize that thesestatistics do not represent mortality, they do point to rapid in-creases in the vulnerability of millions of trees that were physi-cally and physiologically affected by drought and related factors.
We combined the multiyear results from Fig. 3 into a singlemap of progressive canopy water stress indicating the cumulativewater loss for forests in California, as the sum of percent waterlosses from 2011 to 2015 (Fig. 6 and SI Appendix, Figs. S15–S17).Based on this map, we estimate that 10.6 million ha and up to888 million large trees underwent progressive, directional de-creases in CWC between 2011 and 2015. Of this amount, a totalforest area of 5.4 million ha, comprising up to 412 million largetrees, decreased in canopy water content by at least 10%. Lossesof greater than 30% CWC, a threshold we view as severe basedon aircraft videography and visual observations, covered a cu-mulative area of 1 million ha comprised of up to 58 millionlarge trees.Although it is conceptually straightforward to link canopy
water loss to suppressed growth or carbon uptake in forests (8), itis more challenging to convert maps of CWC loss to estimates oftree mortality. For example, the range of potential mortalityresponses at 10% CWC loss on a hectare scale is a follows: a10% decrease in average CWC could represent mortality of upto 8 trees per hectare at FIA’s median California forest standdensity of 80 large trees per hectare. On the other hand, 10%CWC loss could be spread among all trees in a hectare, therebyrepresenting a measurable, but likely nonlethal, amount of waterloss or leaf area reduction among all trees. However, very fewregions selected for airborne CWC mapping showed suchevenness in canopy water content by 2015 (Fig. 1). Moreover,analysis of aircraft-based CWC in 2015 against the retrospective,progressive water stress map (Fig. 6) indicated that water losseswere strongly associated with tree-scale changes in water content(SI Appendix, Table S3). Based on these observations and anal-yses, we believe that CWC decreases of more than 10% on ahectare basis represent, at a minimum, a major suppression ofproductivity and reductions in canopy leaf area, and more likelyindicate a loss of multiple trees per hectare.We further interpreted the progressive water loss results based
on the US Geological Survey LANDFIRE land-cover classifi-cation (SI Appendix). From 2011 to 2015, vegetation typesshowing large declines in CWC (>15%) included lowland mixedconifer-oak, particularly pine-dominated areas, chaparral wood-lands, as well as trees in shrubland ecosystems (SI Appendix, TableS2). Note again that our minimum canopy height cut-off was 2 m,including in areas classified as shrubland. Major CWC decreaseswere observed in forests comprised of coastal redwoods in thelowlands, and at higher elevations pinyon-juniper, lodgepole pine,
Fig. 4. The geography of forest canopy water loss from 2011 to 2015,partitioned spatially by onset period of observation. Only water losses of atleast 5% are displayed. Black areas indicate fire extents reported between2011 and 2015 by the US Forest Service (31).
Fig. 5. (A) Mapped forest areas of decreases in canopy water content be-tween 2011–2013, 2013–2014, and 2014–2015. (B) Estimated maximumnumber of trees (≥12.7 cm or 5 inches diameter at breast height) affected foreach observation interval.
E252 | www.pnas.org/cgi/doi/10.1073/pnas.1523397113 Asner et al.
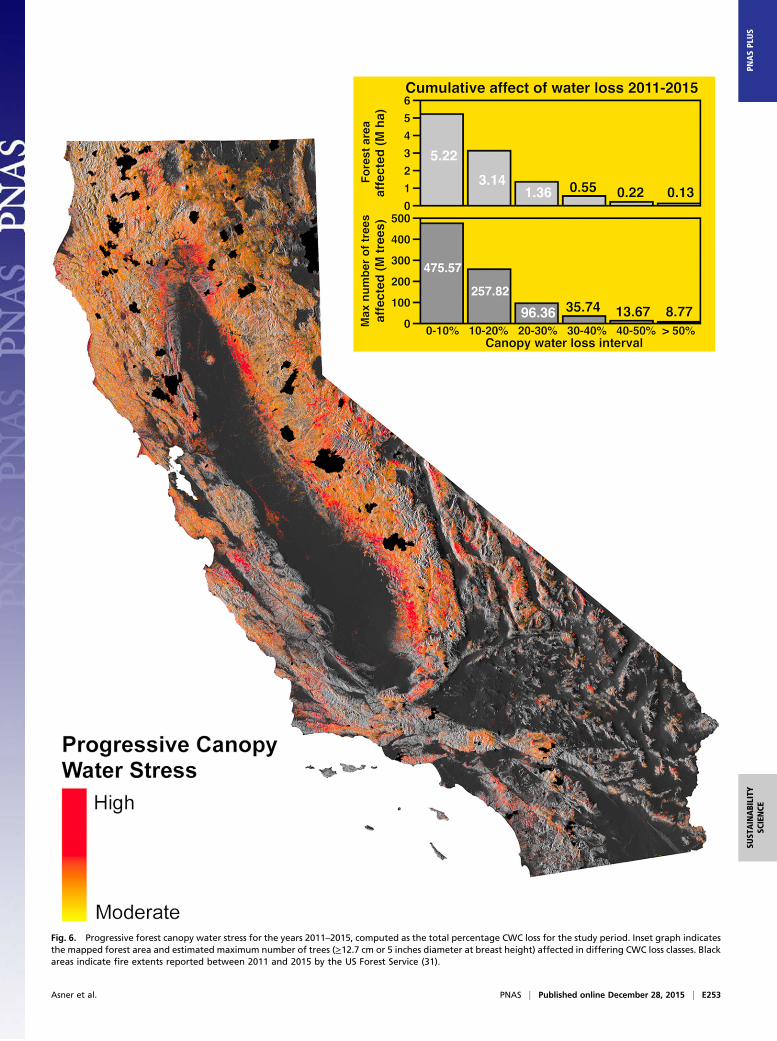
Fig. 6. Progressive forest canopy water stress for the years 2011–2015, computed as the total percentage CWC loss for the study period. Inset graph indicatesthe mapped forest area and estimated maximum number of trees (≥12.7 cm or 5 inches diameter at breast height) affected in differing CWC loss classes. Blackareas indicate fire extents reported between 2011 and 2015 by the US Forest Service (31).
Asner et al. PNAS | Published online December 28, 2015 | E253
SUST
AINABILITY
SCIENCE
PNASPL
US
red fir, and black oak forests underwent widespread water losses.Only the highest-elevation forests and patches of lower-elevationforests and woodland types showed less (but still measurable)losses in CWC.
Forest Monitoring in a Changing Climate. To our knowledge, ourresults are the first to reveal progressive forest canopy water lossresulting in highly suppressed canopy water content in manyregions of California. By August 2015, much of the state hadundergone a measurable decrease in forest CWC since 2011.Over approximately the same time period, low-altitude visualmapping studies conducted by the US Forest Service estimatedthat roughly 27 million trees died in California forests (7, 33, 34).Major differences in mapping approach preclude a direct com-parison of our method to aerial tree counts: Aerial surveys ofbrown and leafless trees suggest increasing mortality rates overtime, whereas our modeled changes in canopy water content servemore of a prognostic role in terms of potential mortality. None-theless, map-to-map comparisons indicate a similar overall geo-graphic pattern of canopy water loss (Fig. 6) and mortality (7, 33).Importantly, our measurements reveal far higher levels of
drought-affected forest than can be assessed using visual map-ping approaches. We found massive areas of progressive canopywater stress that are geographically aligned with a growingpopulation of observed dead trees. Moreover, if drought con-tinues or reoccurs, there exists a pool of trees spread over mil-lions of hectares of forest that may undergo sufficient CWC lossto result in death. Based on rates of CWC change observedduring the drought (Fig. 5), this pool could increase into thehundreds of millions of trees.Given the wide variety of forest and woodland environments
found throughout California, and their variable CWC lossesduring the 2012–2015 drought, repeated airborne and satellitesurveys will be needed to assess longer-term impacts. By com-bining CWC monitoring with field inventory, it should be pos-sible to develop a capability to predict mortality. Until then, ourapproach uniquely identifies trees and landscapes of changingvulnerability as climate conditions evolve over time.CWC monitoring yields spatially explicit information to sup-
port innovations in forest conservation, management and re-source policy development at multiple scales. The options varydepending upon the scale-dependent technological steps de-veloped and presented here. High-resolution, aircraft-basedCWC measurements provide new data on millions of hectares offorest and generate detail on a tree-by-tree basis (Fig. 1). Potentialapplications of HiFIS data include implementation of prescribed
fire, firebreaks, and other fire-management approaches, hazardoustree removal, ecological corridor and habitat management, andwatershed management. At the broad state level, the 30-m reso-lution models reveal the full extent and depth of impact of droughton California’s entire forest canopy. The findings strongly suggestthat if drought continues, even with a potential temporary reprievevia a 2015–2016 El Niño (35), we can expect continuing forestchange at the regional scale. Long-term resource policy and de-cision-making efforts may consider such impacts on forest re-sources, such as by assessing geographically explicit increases incarbon emissions where tree mortality occurs, versus increases incarbon sequestration following tree species migration (e.g., higherelevations). Planning for corridors of species migration in Cal-ifornia, such as by expanding protected areas and limiting infra-structural development, is one example strategic use of the newinformation derived from imaging spectroscopy.In the context of forest management and resource decision-
making, current mainstream satellite technologies provide in-formation only on forest cover, deforestation, and other physicaldisturbances to forest canopies (36). We currently lack a mission toplace a high-fidelity imaging spectrometer into Earth orbit. Such adevice will deliver continuous measurements of vegetation canopywater content, along with several other Earth surface chemicals(22, 37). The NASA HyspIRI imaging spectrometer remains in apremission phase of study (11), yet it lacks a clear plan or schedulefor deployment. Such a mission could greatly enhance our ability tomeasure, monitor, and map changes in biospheric composition andfunction in the face of climate change.
MethodsTo assess the effect of progressive drought on California forests, HiFIS andLiDAR data were collected using the Carnegie Airborne Observatory (26). TheCAO sensor package includes a dual-laser waveform LiDAR system and aHiFIS that measures in the 380- to 2,510-nm wavelength range (SI Appendix).The CAO is able to collect up to 6 ha/s of data during flight. Even at this rapidrate it is unrealistic to provide wall-to-wall coverage of California’s ∼13.4million ha of forest. Moreover, even complete coverage would provide onlyan instantaneous view in time of CWC. Instead, our approach builds uponestablished methods for using noncontinuous airborne data to train aportfolio of geographically contiguous data to generate statewide geo-graphic models of forest CWC (SI Appendix).
ACKNOWLEDGMENTS. This study was supported by the David and LucilePackard Foundation. The Carnegie Airborne Observatory is currently supportedby the Avatar Alliance Foundation, John D. and Catherine T. MacArthurFoundation, Mary Anne Nyburg Baker and G. Leonard Baker Jr., and William R.Hearst III.
1. Robeson SM (2015) Revisiting the recent California drought as an extreme value.Geophys Res Lett 42(16):6771–6779.
2. Brown EG (2015) State of California Proclamation of a State of Emergency (ExecutiveDepartment, State of California, Sacramento, CA).
3. Williams AP, et al. (2015) Contribution of anthropogenic warming to Californiadrought during 2012-2014. Geophys Res Lett, 42(16):6819–6828.
4. Diffenbaugh NS, Swain DL, Touma D (2015) Anthropogenic warming has increaseddrought risk in California. Proc Natl Acad Sci USA 112(13):3931–3936.
5. Allen CD, et al. (2010) A global overview of drought and heat-induced tree mortalityreveals emerging climate change risks for forests. For Ecol Manage 259(4):660–684.
6. Chornesky EA, et al. (2015) Adapting California’s ecosystems to a changing climate.Bioscience 65(3):247–262.
7. USFS (2015) 2015 Forest Health Protection Arial Detection Survey. Available at www.fs.usda.gov/detail/r5/forest-grasslandhealth/. Accessed November 1, 2015.
8. Asner GP, Nepstad D, Cardinot G, Ray D (2004) Drought stress and carbon uptake inan Amazon forest measured with spaceborne imaging spectroscopy. Proc Natl AcadSci USA 101(16):6039–6044.
9. Shugart HH, et al. (2015) Computer and remote-sensing infrastructure to enhancelarge-scale testing of individual-based forest models. Front Ecol Environ 13(9):503–511.
10. Schimel DS, Asner GP, Moorcroft PR (2013) Observing changing ecological diversity inthe Anthropocene. Front Ecol Environ 11(3):129–137.
11. Lee CM, et al. (2015) An introduction to the NASA Hyperspectral InfraRed Imager(HyspIRI) mission and preparatory activities. Remote Sens Environ 167:6–19.
12. Curran PJ (1989) Remote sensing of foliar chemistry. Remote Sens Environ 30:271–278.
13. Asner GP, Martin RE, Anderson CB, Knapp DE (2015) Quantifying forest canopy traits:Imaging spectroscopy versus field survey. Remote Sens Environ 158(0):15–27.
14. Serbin SP, Singh A, McNeil BE, Kingdon CC, Townsend PA (2014) Spectroscopic de-termination of leaf morphological and biochemical traits for northern temperate andboreal tree species. Ecol Appl 24(7):1651–1669.
15. Clark RN, et al. (2003) Imaging spectroscopy: Earth and planetary remote sensing withthe USGS Tetracorder and expert systems. J Geophys Res Planets 108(5131):1–44.
16. Chaves MM, et al. (2002) How plants cope with water stress in the field. Photosyn-thesis and growth. Ann Bot (Lond) 89(Spec No):907–916.
17. Metcalfe DB, et al. (2008) The effects of water availability on root growth andmorphology in an Amazon rainforest. Plant Soil 311(1-2):189–199.
18. Farooq M, Wahid A, Kobayashi N, Fujita D, Basra SMA (2009) Plant drought stress:Effects, mechanisms and management. Sustainable Agriculture, eds Lichtfouse E,Navarrete M, Debaeke P, Souchere V, Alberola C (Springer, The Netherlands), pp153–188.
19. Meir P, et al. (2009) The effects of drought on Amazonian rain forests. Amazonia andGlobal Change, Geophysical Monograph Series, eds Keller M, Bustamante M, Gash J,Silva Dias P (American Geophysical Union, Washington, DC), Vol 186, pp 429–449.
20. Nepstad DC, et al. (2002) The effects of partial throughfall exclusion on canopyprocesses, aboveground production, and biogeochemistry of an Amazon forest.J Geophys Res 107(D20):1–18.
21. Vourlitis GL, et al. (2008) Energy balance and canopy conductance of a tropical semi-deciduous forest of the southern Amazon Basin. Water Resour Res 44(3):W03412.
22. Ustin SL, Roberts DA, Gamon JA, Asner GP, Green RO (2004) Using imaging spec-troscopy to study ecosystem processes and properties. Bioscience 54(6):523–534.
E254 | www.pnas.org/cgi/doi/10.1073/pnas.1523397113 Asner et al.
23. Gao B-C, Goetz AFH (1990) Column atmospheric water vapor and vegetation liquidwater retrievals from airborne imaging spectrometer data. J Geophys Res 95(D4):3549–3564.
24. Green RO, Painter TH, Roberts DA, Dozier J (2006) Measuring the expressed abun-dance of the three phases of water with an imaging spectrometer over melting snow.Water Resour Res 42(10):W10402.
25. Asner GP, et al. (2007) Carnegie Airborne Observatory: In-flight fusion of hyper-spectral imaging and waveform light detection and ranging for three-dimensionalstudies of ecosystems. J Appl Remote Sens 1:013536.
26. Asner GP, et al. (2012) Carnegie Airborne Observatory-2: Increasing science data di-mensionality via high-fidelity multi-sensor fusion. Remote Sens Environ 124(0):454–465.
27. Mascaro J, et al. (2014) A tale of two “forests”: Random forest machine learning AIDStropical forest carbon mapping. PLoS One 9(1):e85993.
28. Asner GP (2009) Tropical forest carbon assessment: Integrating satellite and airbornemapping approaches. Environ Res Lett 4(3):034009.
29. Ustin S, et al. (1996) Estimating canopy water content of chaparral shrubs using op-tical methods. Summaries of the Sixth Annual JPL Airborne Earth Science Workshop,ed Green RO (NASA Jet Propulsion Laboratory, Pasadena, CA), pp 235–238.
30. Ceccato P, Flasse S, Tarantola S, Jacquemoud S, Gregoire JM (2001) Detecting vege-tation leaf water content using reflectance in the optical domain. Remote SensEnviron 77(1):22–33.
31. USDA (2015) US Forest Service Fire Detection Maps. Available at activefiremaps.fs.fed.us/. Accessed November 1, 2015.
32. USDA (2008) Forest Inventory and Analysis Program. Available at www.fia.fs.fed.us.Accessed November 1, 2015.
33. USFS (2015) 1014 Aerial Survey Results: California. Available at www.fs.usda.gov/detail/r5/forest-grasslandhealth. Accessed November 1, 2015.
34. USFS (2013) 2012 Aerial Survey Results: California. Available at www.fs.usda.gov/detail/r5/forest-grasslandhealth. Accessed November 1, 2015.
35. NOAA (2015) El Niño/Southern Oscillaiton (ENSO) Diagnostic Discussion (NationalWeather Service, College Park, MD).
36. GOFC-GOLD (2008) Reducing Greenhouse Gas Emissions from Deforestation andDegradation in Developing Countries: A Sourcebook of Methods and Procedures forMonitoring, Measuring and Reporting (Office of GOFC-GOLD Program, Alberta, Canada).
37. Kokaly RF, Asner GP, Ollinger SV, Martin ME, Wessman CA (2009) Characterizingcanopy biochemistry from imaging spectroscopy and its application to ecosystemstudies. Remote Sens Environ 113(0):S78–S91.
Asner et al. PNAS | Published online December 28, 2015 | E255
SUST
AINABILITY
SCIENCE
PNASPL
US
Related Documents