Progressive Approximate Aggregate Queries with a Multi-Resolution Tree Structure Iosif Lazaridis, Sharad Mehrotra University of California, Irvine SIGMOD 2001, Santa Barbara

Progressive Approximate Aggregate Queries with a Multi-Resolution Tree Structure
Dec 30, 2015
Progressive Approximate Aggregate Queries with a Multi-Resolution Tree Structure. Iosif Lazaridis, Sharad Mehrotra University of California, Irvine SIGMOD 2001, Santa Barbara. Talk Outline. Aggregate Queries Motivation for Approximate Answering Multi-Resolution Aggregate Tree (MRA-Tree) - PowerPoint PPT Presentation
Welcome message from author
This document is posted to help you gain knowledge. Please leave a comment to let me know what you think about it! Share it to your friends and learn new things together.
Transcript
Progressive Approximate Aggregate Queries with a Multi-Resolution Tree Structure
Iosif Lazaridis, Sharad MehrotraUniversity of California, Irvine
SIGMOD 2001, Santa Barbara
Talk Outline
Aggregate QueriesMotivation for Approximate AnsweringMulti-Resolution Aggregate Tree (MRA-
Tree)Progressive Algorithm with Error BoundsExperimental EvaluationSummary and Future Work
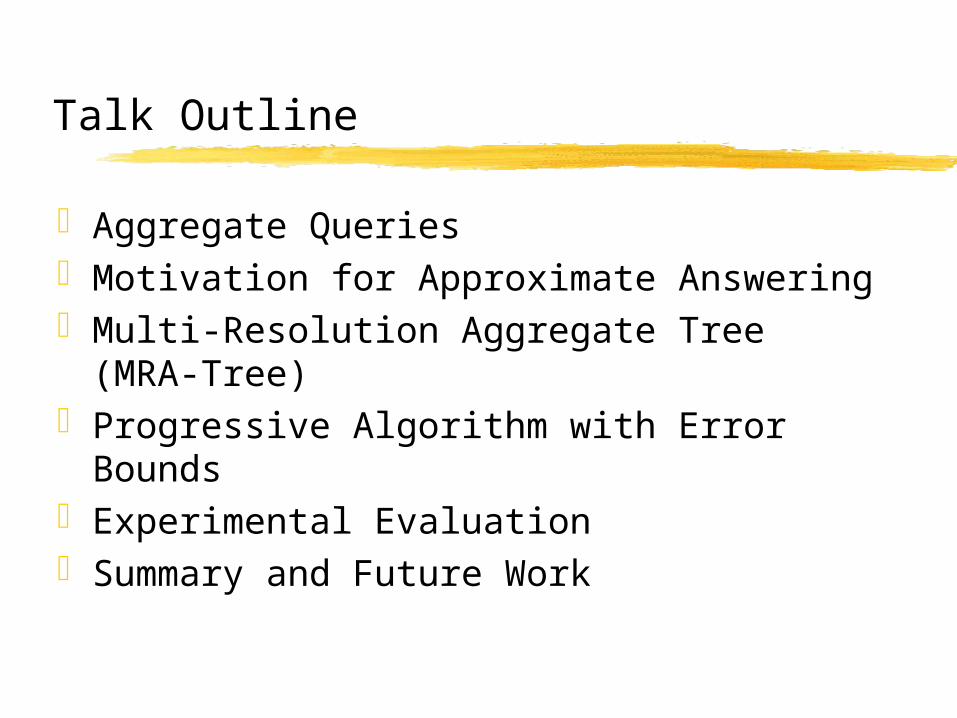
Aggregate Queries
9
6
3
8
27
Q
S
minQ = 2
maxQ = 7
countQ = 3
sumQ = 2+7+6 = 15
avgQ = 15/3 = 5
Evaluating Aggregate Queries
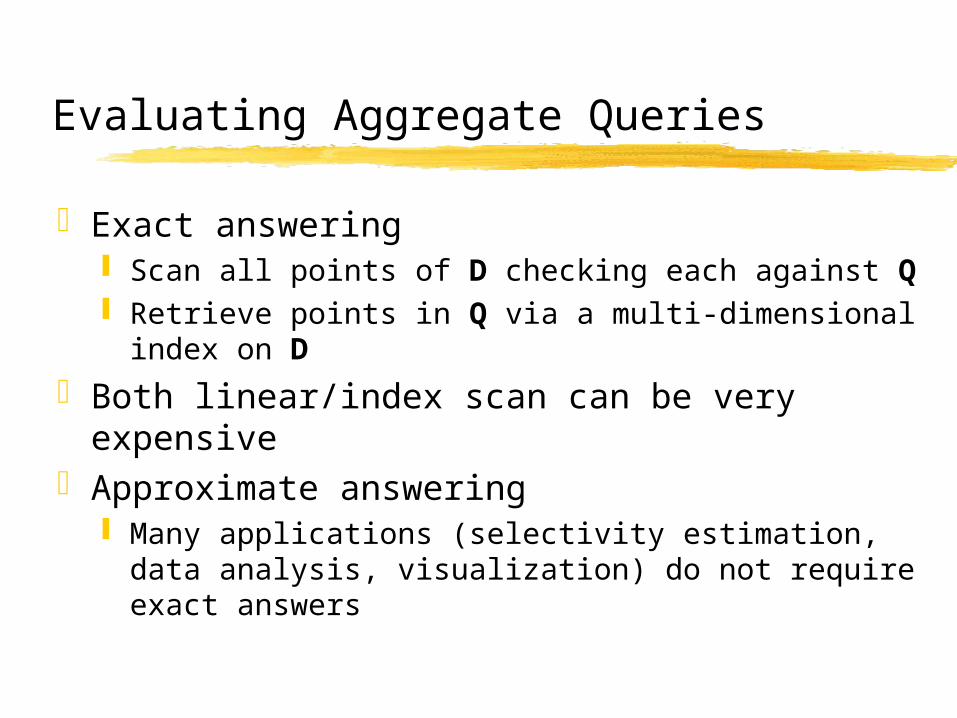
Exact answering Scan all points of D checking each against Q Retrieve points in Q via a multi-dimensional index
on D
Both linear/index scan can be very expensive
Approximate answering Many applications (selectivity estimation, data
analysis, visualization) do not require exact answers
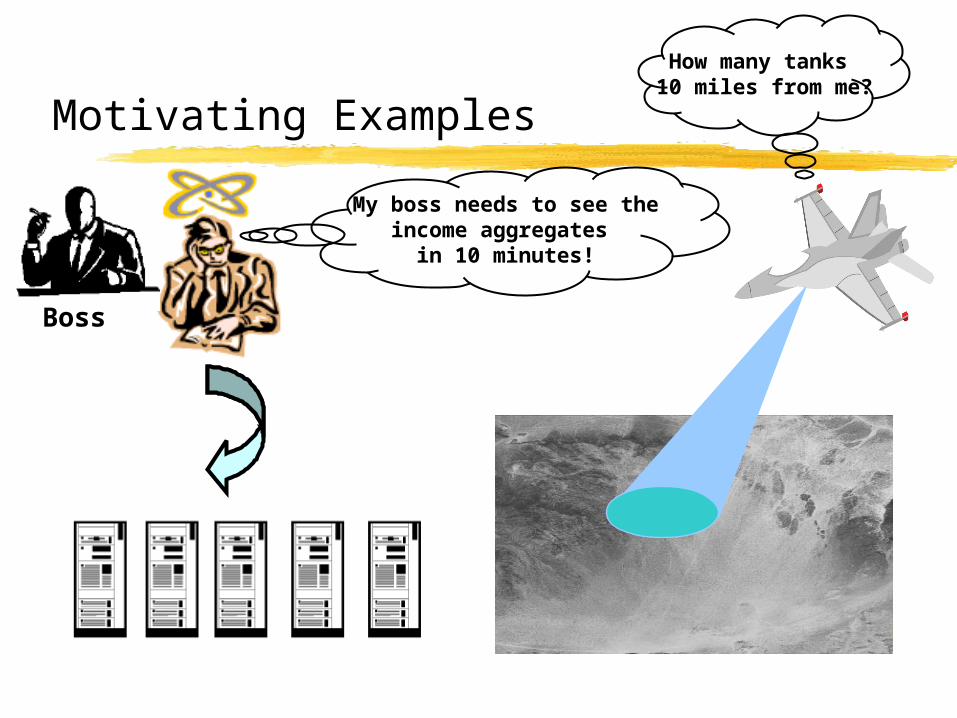
Motivating Examples
My boss needs to see theincome aggregates
in 10 minutes!
How many tanks 10 miles from me?
Boss
Techniques for Approximate Aggregate Queries
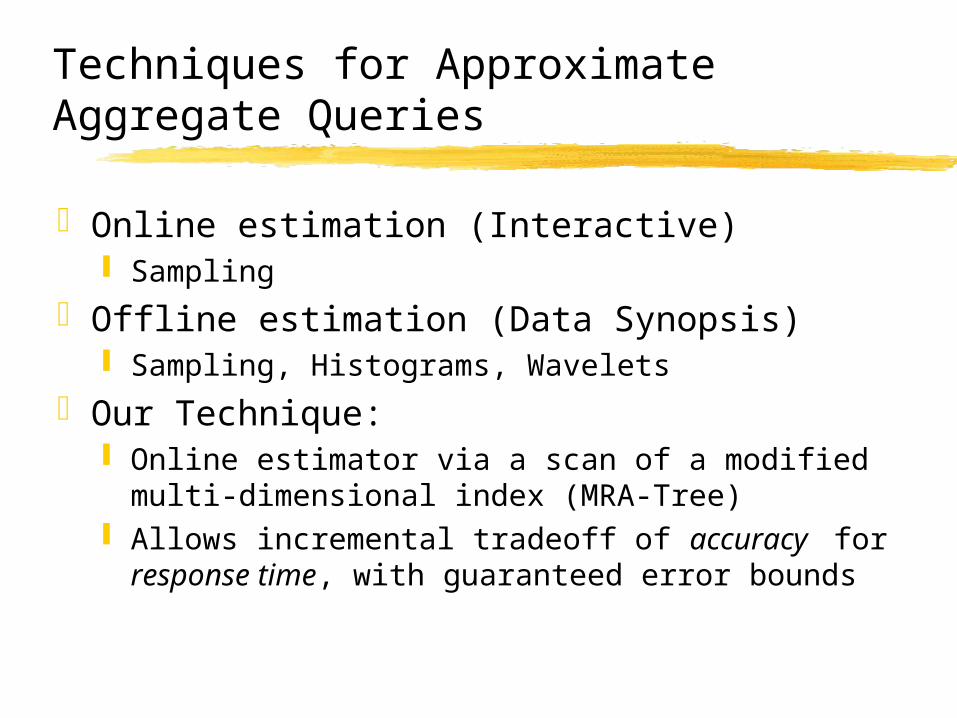
Online estimation (Interactive) Sampling
Offline estimation (Data Synopsis) Sampling, Histograms, Wavelets
Our Technique: Online estimator via a scan of a modified
multi-dimensional index (MRA-Tree) Allows incremental tradeoff of accuracy for
response time, with guaranteed error bounds
Multi-Resolution Aggregate Tree (MRA-Tree)
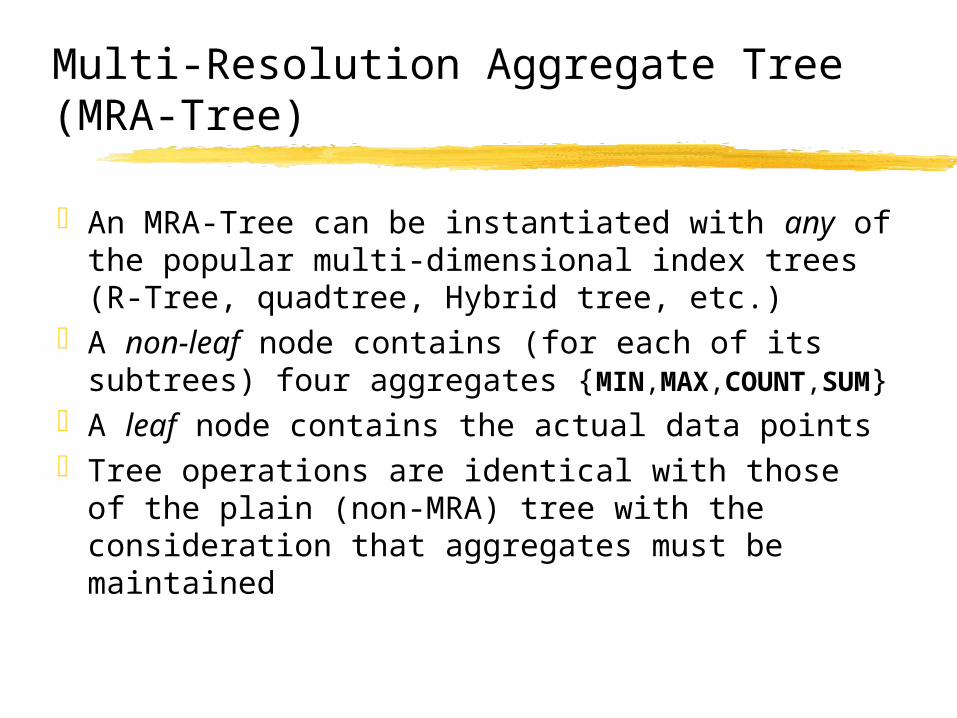
An MRA-Tree can be instantiated with any of the popular multi-dimensional index trees (R-Tree, quadtree, Hybrid tree, etc.)
A non-leaf node contains (for each of its subtrees) four aggregates {MIN,MAX,COUNT,SUM}
A leaf node contains the actual data pointsTree operations are identical with those of the
plain (non-MRA) tree with the consideration that aggregates must be maintained
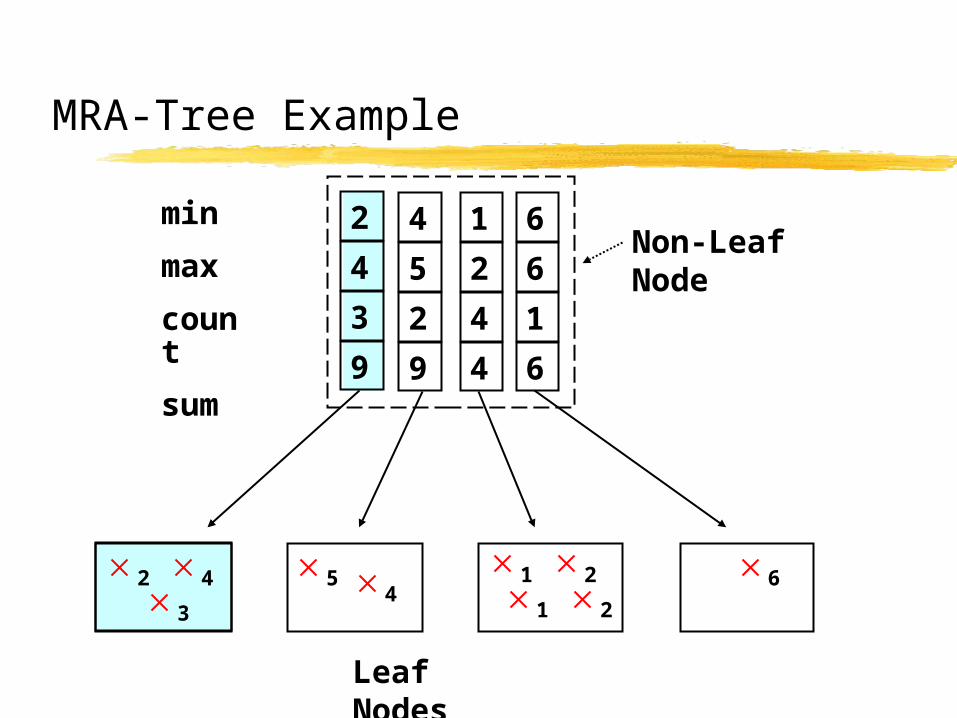
MRA-Tree Example
min
max
count
sum
Non-Leaf Node
Leaf Nodes
2 4
3
54
2
3
9
4
4
2
9
5
1
4
4
2
6
1
6
6
1
2
2
1
6
Progressive Algorithm Outline
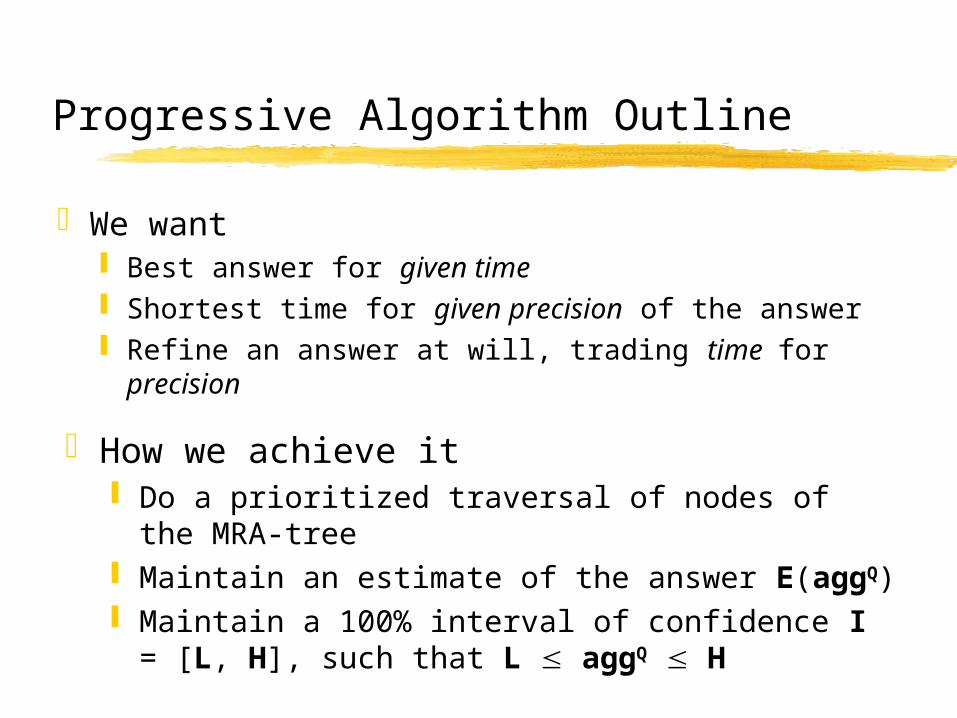
We want Best answer for given time Shortest time for given precision of the answer Refine an answer at will, trading time for precision
How we achieve it Do a prioritized traversal of nodes of the MRA-
tree Maintain an estimate of the answer E(aggQ) Maintain a 100% interval of confidence I = [L,
H], such that L aggQ H
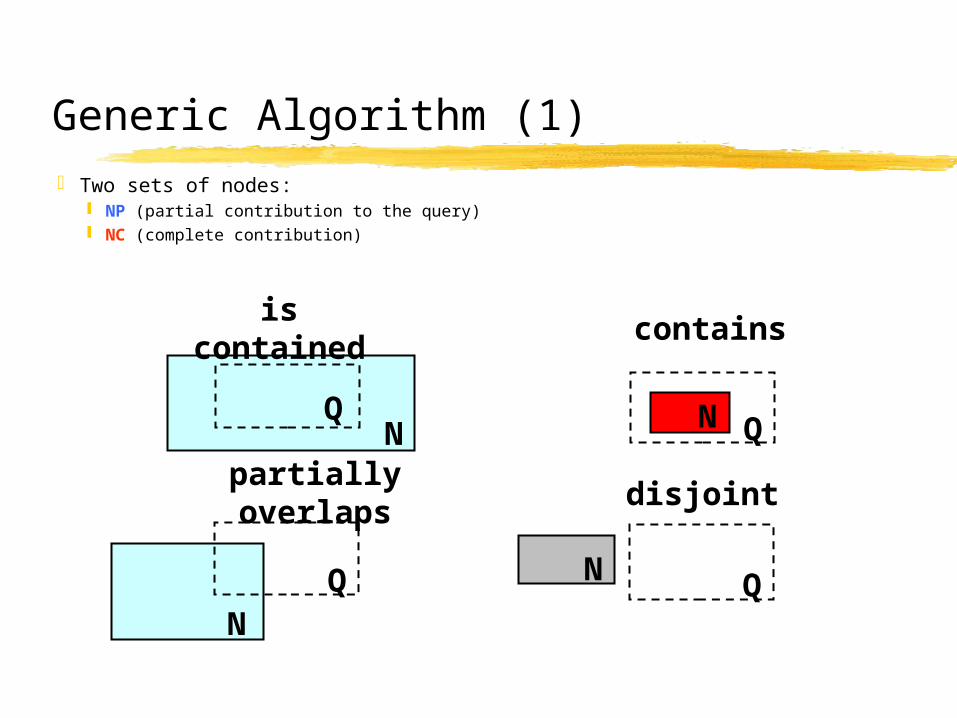
Generic Algorithm (1)
QN
disjoint
contains
QNQN
is contained
QN
partially overlaps
Two sets of nodes: NP (partial contribution to the query) NC (complete contribution)
Generic Algorithm (2)
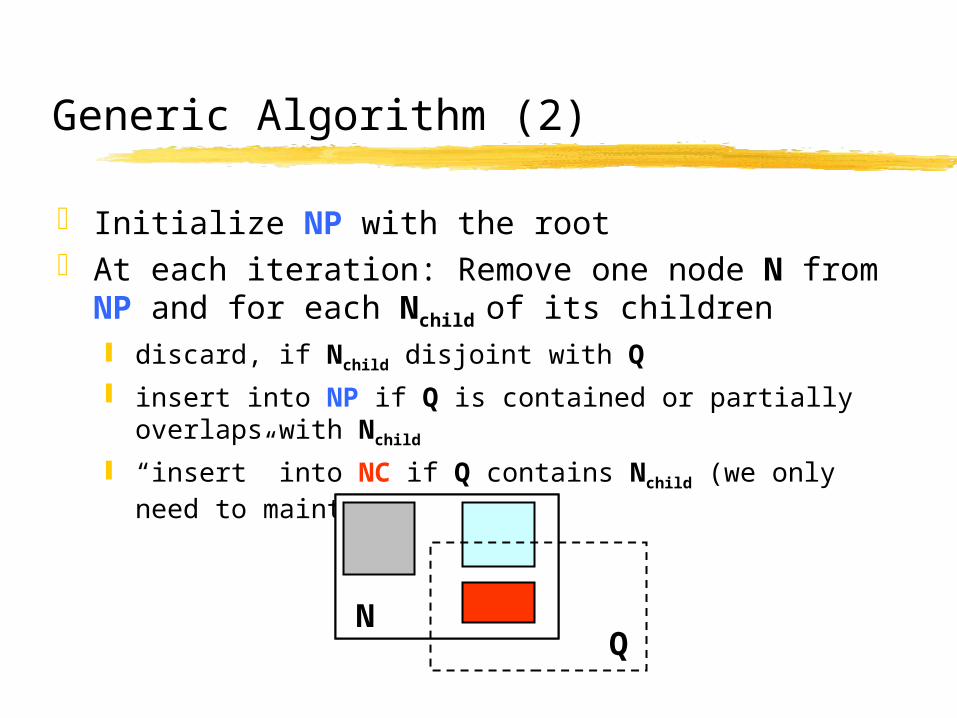
Initialize NP with the root At each iteration: Remove one node N from NP
and for each Nchild of its children
discard, if Nchild disjoint with Q
insert into NP if Q is contained or partially overlaps with Nchild
“insert” into NC if Q contains Nchild (we only need to maintain aggNC)
QN
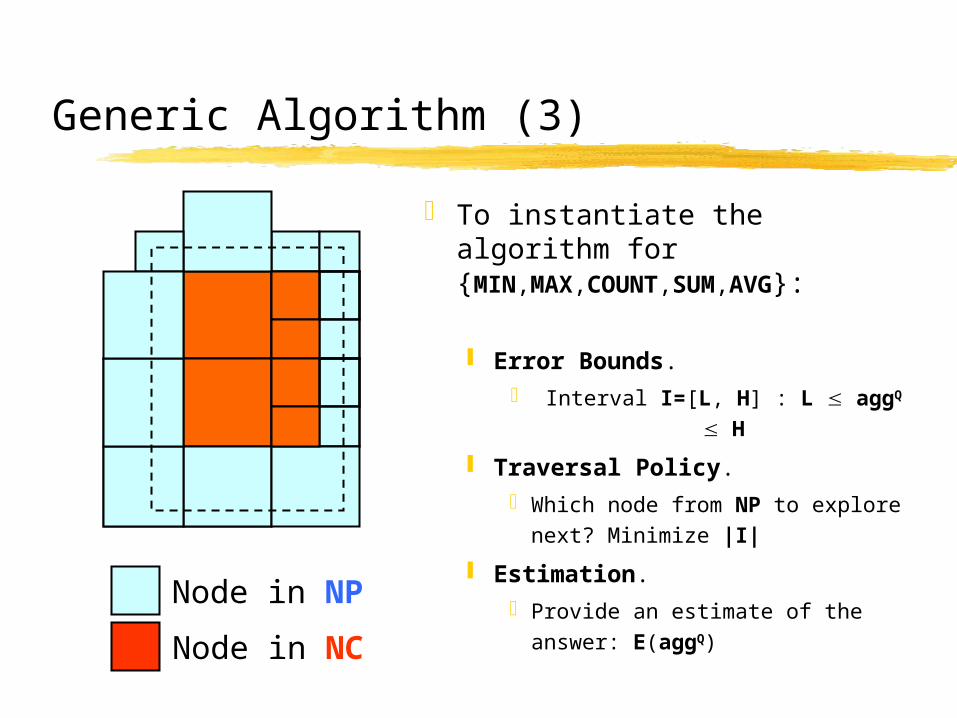
Generic Algorithm (3)
Node in NP
Node in NC
To instantiate the algorithm for {MIN,MAX,COUNT,SUM,AVG}:
Error Bounds. Interval I=[L, H] : L aggQ
H
Traversal Policy. Which node from NP to
explore next? Minimize |I|
Estimation. Provide an estimate of the
answer: E(aggQ)
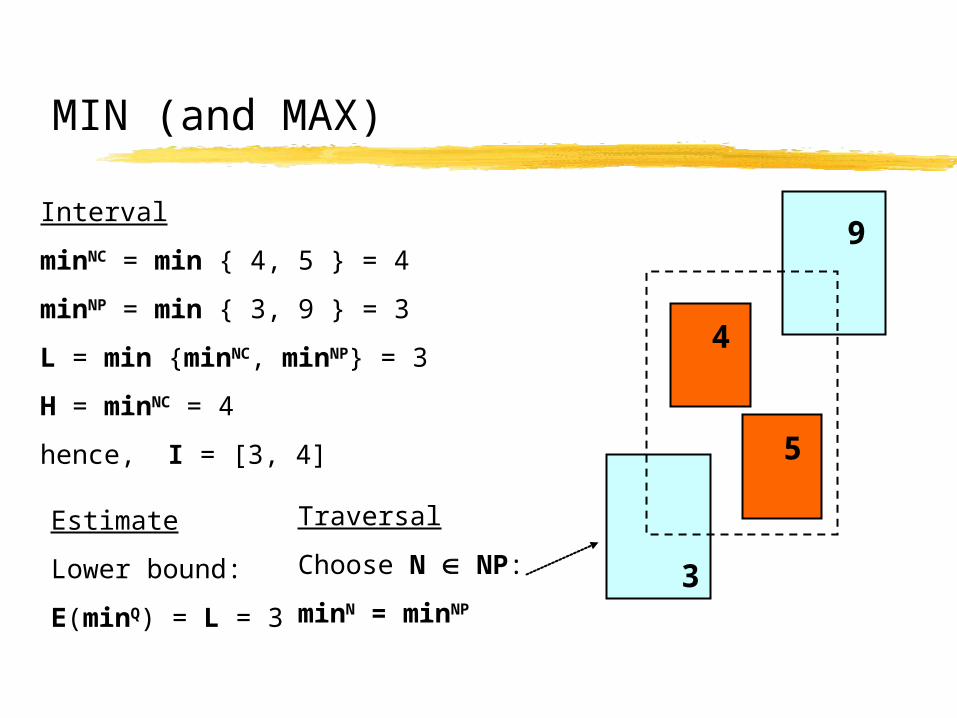
MIN (and MAX)
3
9
4
5
Interval
minNC = min { 4, 5 } = 4
minNP = min { 3, 9 } = 3
L = min {minNC, minNP} = 3
H = minNC = 4
hence, I = [3, 4]
Estimate
Lower bound:
E(minQ) = L = 3
Traversal
Choose N NP:
minN = minNP
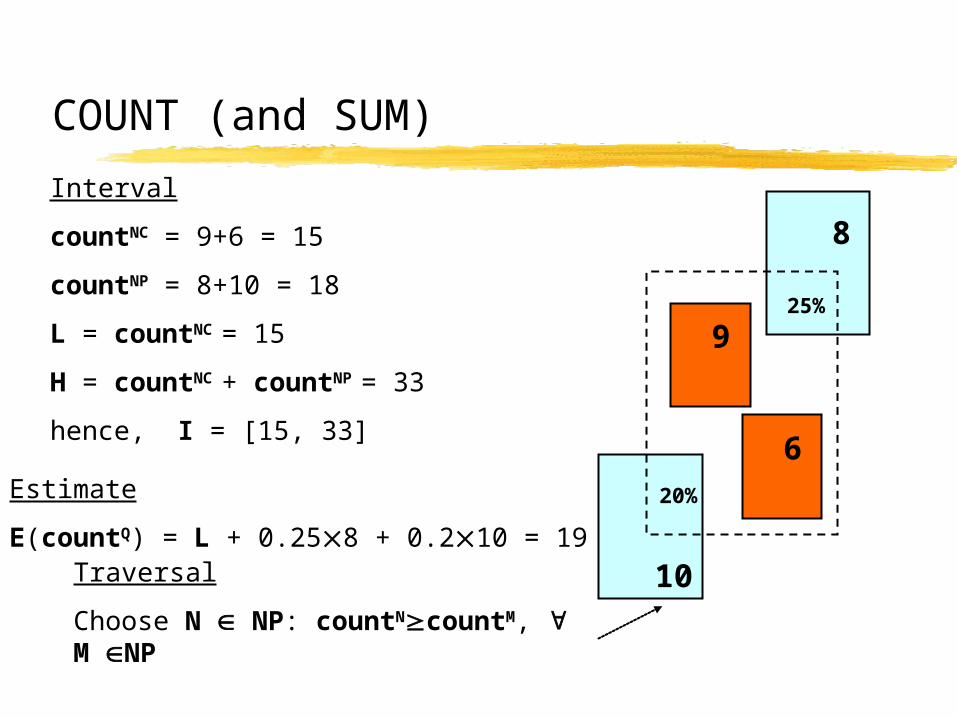
COUNT (and SUM)
10
20%
25%
8
6
9
Interval
countNC = 9+6 = 15
countNP = 8+10 = 18
L = countNC = 15
H = countNC + countNP = 33
hence, I = [15, 33]
Estimate
E(countQ) = L + 0.258 + 0.210 = 19
Traversal
Choose N NP: countNcountM, M NP
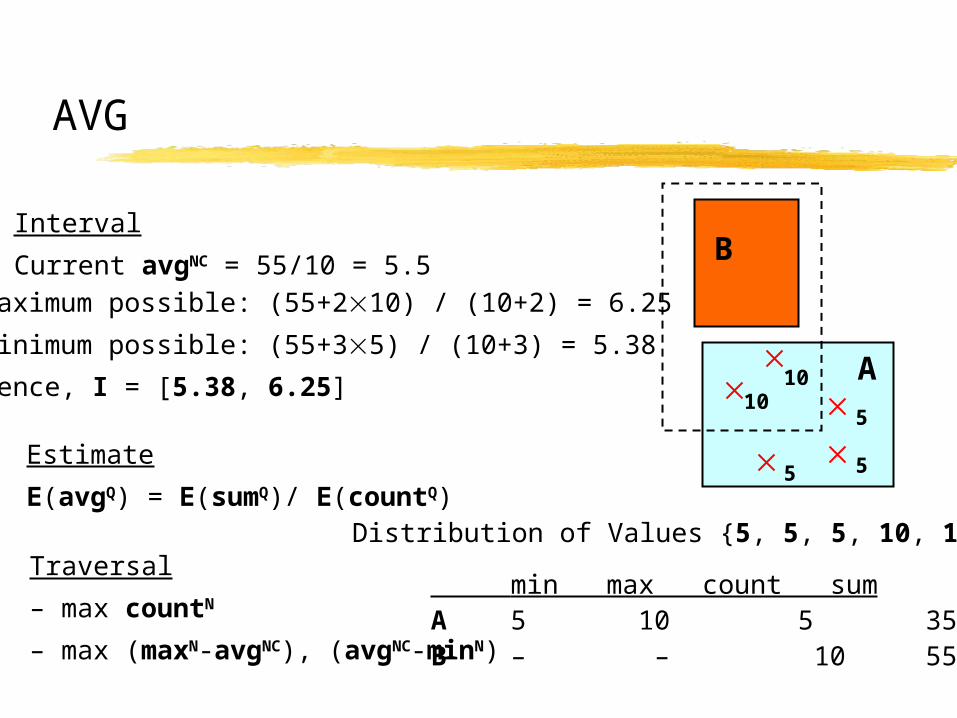
AVG
A
B
min max count sumA 5 10 5 35 B – – 10 55
Interval
Current avgNC = 55/10 = 5.5
10
5
5
5
10
Estimate
E(avgQ) = E(sumQ)/ E(countQ)
Traversal
– max countN
– max (maxN-avgNC), (avgNC-minN)
Distribution of Values {5, 5, 5, 10, 10}
Maximum possible: (55+210) / (10+2) = 6.25
Minimum possible: (55+35) / (10+3) = 5.38
hence, I = [5.38, 6.25]
Experiments
Synthetic datasets 2-4DReal datasets: 2D spatial (USGS) and 4D
(UCI KDD Forest Cover)MRA-quadtree and MRA-Rtree indicesWe study
MRA-tree Vs. “plain” tree MRA-tree Vs. online sampling Accuracy of estimation Scalability with database size
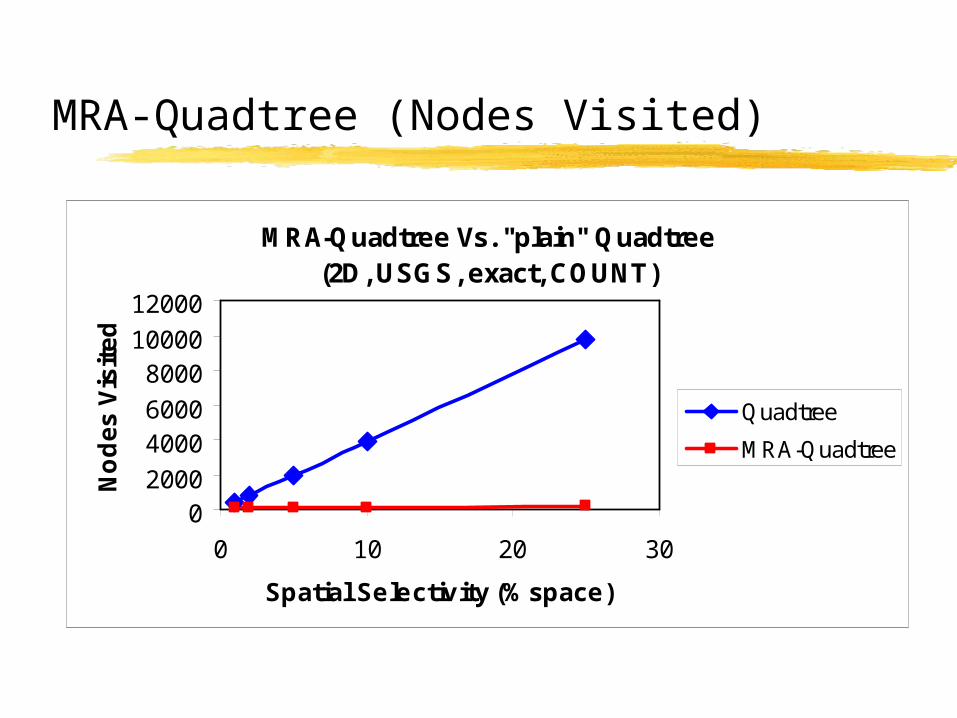
MRA-Quadtree (Nodes Visited)
MRA-Quadtree Vs. "plain" Quadtree (2D, USGS, exact, COUNT)
02000
40006000
800010000
12000
0 10 20 30
Spatial Selectivity (% space)
No
de
s V
isit
ed
Quadtree
MRA-Quadtree
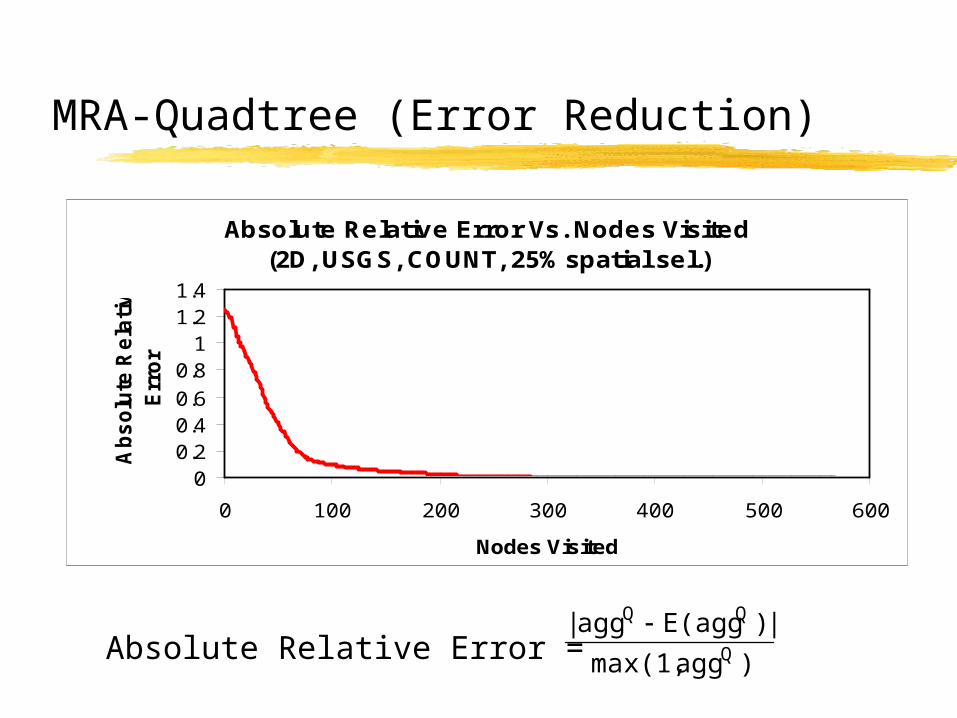
MRA-Quadtree (Error Reduction)
Absolute Relative Error Vs. Nodes Visited(2D, USGS, COUNT, 25% spatial sel.)
00.20.40.6
0.81
1.21.4
0 100 200 300 400 500 600
Nodes Visited
Ab
so
lute
Re
lati
ve
Err
or
Absolute Relative Error = )aggmax(1,
|)E(aggagg|Q
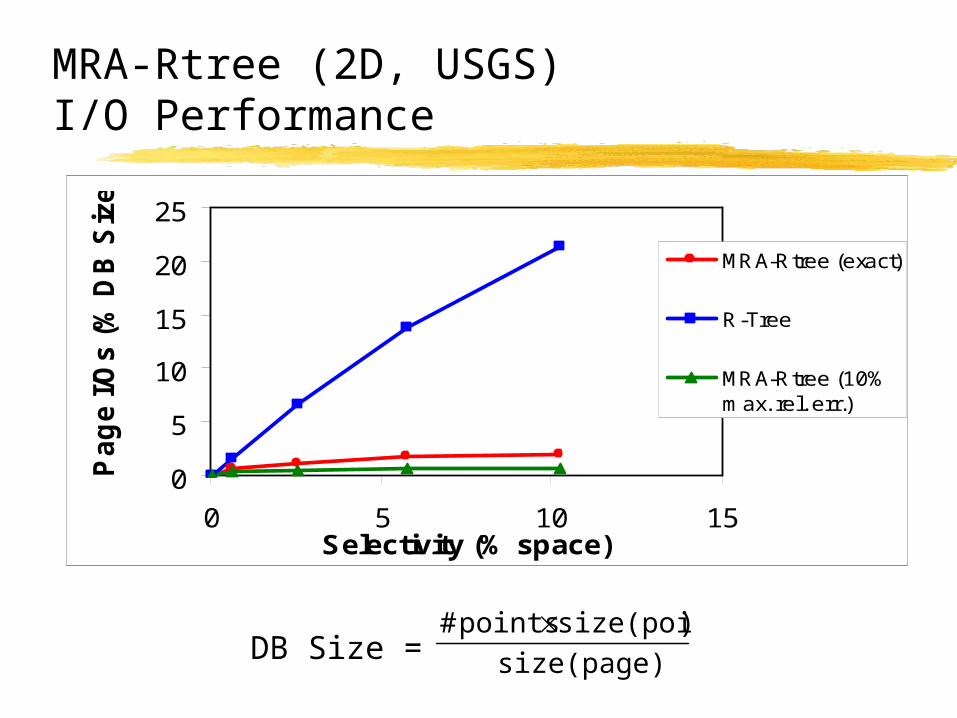
MRA-Rtree (2D, USGS) I/O Performance
0
5
10
15
20
25
0 5 10 15Selectivity (% space)
Pa
ge
I/O
s (
% D
B S
ize
)
MRA-Rtree (exact)
R-Tree
MRA-Rtree (10%max. rel. err.)
DB Size = size(page)
)size(pointpoints#
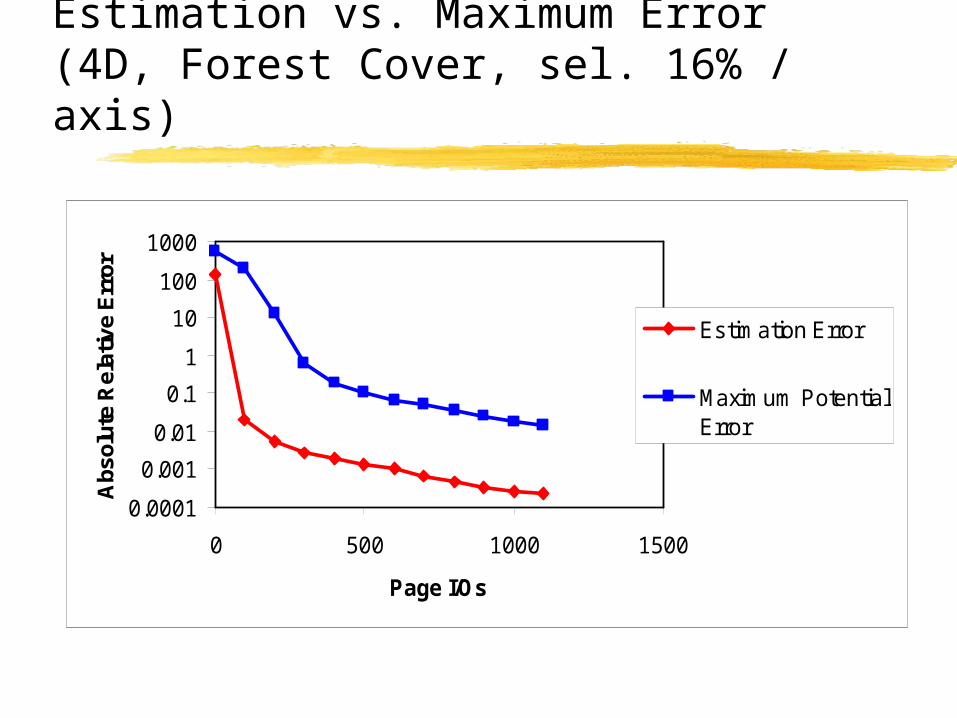
Estimation vs. Maximum Error (4D, Forest Cover, sel. 16% / axis)
0.0001
0.001
0.01
0.1
1
10
100
1000
0 500 1000 1500
Page I/Os
Abs
olut
e R
elat
ive
Err
or
Estimation Error
Maximum PotentialError
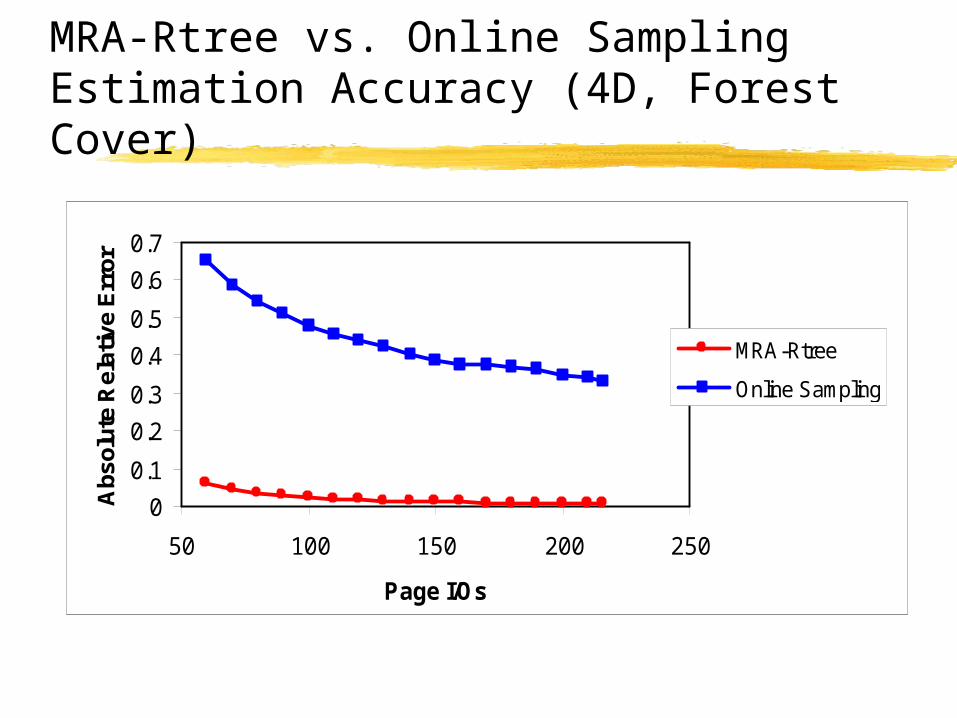
0
0.1
0.2
0.3
0.4
0.5
0.6
0.7
50 100 150 200 250
Page I/Os
Abs
olut
e R
elat
ive
Err
or
MRA-Rtree
Online Sampling
MRA-Rtree vs. Online SamplingEstimation Accuracy (4D, Forest Cover)
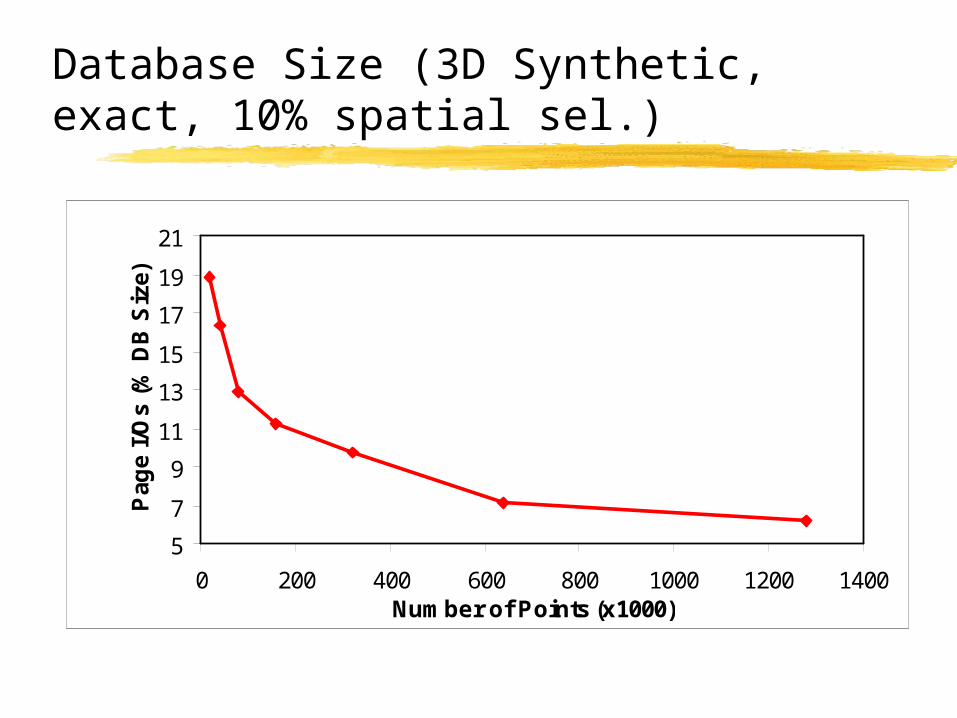
Database Size (3D Synthetic, exact, 10% spatial sel.)
5
7
9
11
13
15
17
19
21
0 200 400 600 800 1000 1200 1400Number of Points (x1000)
Pag
e I/
Os
(% D
B S
ize)
Summary
MRA-Tree is a modified multi-dimensional index for approximate answering of aggregate queries
For exact answer faster than “plain” index
Advantages over offline estimators Progressively improving answers Error bounds
Advantages over sampling Better estimate for same I/O
Algorithm scales gracefully with database size
Future Work (QUASAR Project, UC Irvine)
Scalability with high dimensionality, by using a dedicated high-D index structure
Scalability in high update rate environments Approximate query processing of general SQL
queries using dedicated data structures, similar to MRA-tree
Related Documents