Unit 4 Industrial Economies Steve Margetts CONTENTS The birth and growth of firms. The motives and methods of growth 2 Costs 4 Revenue. 7 Profit. 9 Alternative motives for firms 14 Short run and long run. 16 Diminishing Marginal Returns and Economies of scale. 17 Perfect competition 20 Monopoly 25 Monopolistic competition 28 Oligopoly 32 Cartels 34 Productive and allocative efficiency 37 Monopoly And The Public Interest 42 Measures of market concentration 45 Price discrimination in monopoly 46 Pricing and non-pricing strategies 50 Contestable markets 51 Competition policy 54 Regulation of privatised industries 56 Index 61 www.revisionguru.co.uk Page 1

Welcome message from author
This document is posted to help you gain knowledge. Please leave a comment to let me know what you think about it! Share it to your friends and learn new things together.
Transcript
Unit 4 Industrial Economies Steve Margetts
CONTENTS The birth and growth of firms. The motives and methods of growth
2
Costs 4 Revenue. 7 Profit. 9 Alternative motives for firms 14 Short run and long run. 16 Diminishing Marginal Returns and Economies of scale.
17
Perfect competition 20 Monopoly 25 Monopolistic competition 28 Oligopoly 32 Cartels 34 Productive and allocative efficiency 37 Monopoly And The Public Interest 42 Measures of market concentration 45 Price discrimination in monopoly 46 Pricing and non-pricing strategies 50 Contestable markets 51 Competition policy 54 Regulation of privatised industries 56 Index 61
www.revisionguru.co.uk Page 1
Unit 4 Industrial Economies Steve Margetts
THE GROWTH OF FIRMS Firms can grow in one of two ways:
• Internal growth. • External growth.
INTERNAL GROWTH This requires an increase in sales. In order to do this the firm will have to promote existing products and launch new products, this will require an increase in productive capacity. It can finance growth via borrowing, retaining profits (internal funds) or issuing new shares. EXTERNAL GROWTH Mergers and takeovers are ways in which businesses can grow externally and grow by joining together to form one company. Mergers are mutual agreements between the companies involved to join together. Most takeovers tend to be hostile, in that the company being taken over does not want to be bought by the larger business. Takeovers do not need to be and are not always hostile, as some in fact can be friendly, in that the company being taken over wants to be taken over and can even ask to be taken over. WHY DO COMPANIES JOIN TOGETHER?
• It is the quickest and easiest way to expand. • Buying a smaller competitor is normally cheaper than growing
internally. • Simple survival – survival of the fittest. To continue in the market the
company may need to grow and the easiest way is to buy up someone else.
• The main aim of the business may be expansion. • Investment purposes. Buying up other businesses is a form of
investment. • To prepare for the European Single Market. • To asset strip. Some companies buy other companies in order to sell
off the most profitable assets of the business and make a profit. • To gain economies of scale.
TYPES OF MERGER/TAKEOVER
• Horizontal: A horizontal merger/takeover is one where two businesses in exactly the same line of business or stage of production join/merge with on another, for example if two hairdressers joined together.
• Forward Vertical: A forward vertical merger/takeover is where a business merges with a business at the next stage of the production process, for example a business making furniture may merge with the retail outlet selling the furniture.
• Backward Vertical: A backward vertical merger/takeover is where a business merges with a business at the previous stage of the
www.revisionguru.co.uk Page 2
Unit 4 Industrial Economies Steve Margetts
production process, for example the business making the furniture may merge with the business that supplies the wood and parts for the furniture.
• Lateral: A lateral merger/takeover is where a business merges with a business who makes similar goods to it but who are not in competition with each other, for example if a chocolate bar manufacturer merged with a luxury chocolate manufacturer.
• Conglomerate/Diversification: A conglomerate/diversification merger or takeover is where businesses in completely different industries merge together, for example if a football club merged with a computer firm.
JOINT VENTURES Some businesses join forces with other businesses to share the cost of a project because it is too expensive for one business, share expertise of staff and machinery etc. This is known as a joint venture. The benefits of joint ventures are:
• Businesses have all the advantages of merges but no lose of company identity.
• Each business can specalise in its field of expertise. • Expensive costs of mergers/takeovers are not incurred. • Mergers/takeovers can be unfriendly and do not work – staff are
concerned about job losses. • Competition may be reduced due to joint venture.
Drawbacks of joint ventures:
• Anticipated benefits of the venture may not appear due to difficulties of running ‘one’ business for the venture.
• Disagreements about who is in charge can result. • As profits are normally split this could cause problems if one business
feels it has put more effort, time, money than the other. Mergers were very common during the late 1980’s with many companies merging with competitors and other businesses. Whereas towards the end of the 1990’s most companies have decided that large companies with numerous businesses is in fact bad and leading to un-competiteveness (due to dis-economies of scale), this has lead to a trend of firms de-merging.
www.revisionguru.co.uk Page 3
Unit 4 Industrial Economies Steve Margetts
0
200
400
600
800
1000
1200
1400
1600
1970 1972 1974 1976 1978 1980 1982 1984 1986 1988 1990 1992 1994 1996 1998
Number
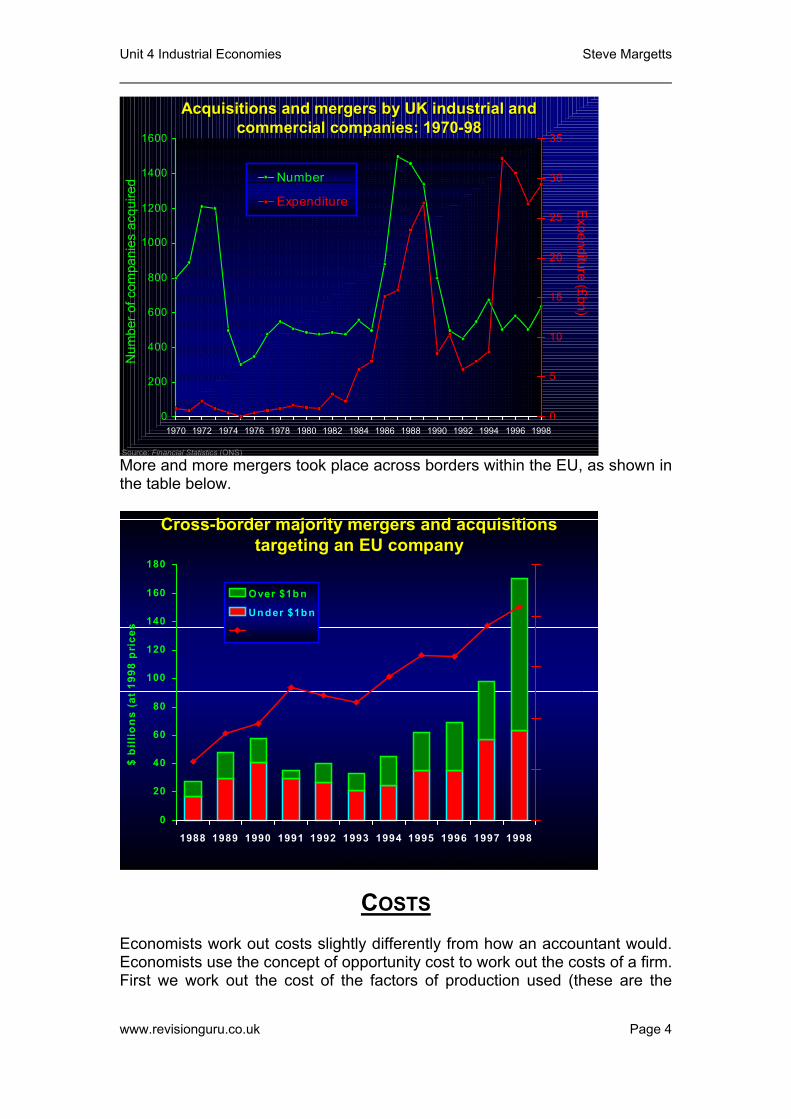
Acquisitions and mergers by UK industrial andAcquisitions and mergers by UK industrial andcommercial companies: 1970commercial companies: 1970--9898
Source: Financial Statistics (ONS)
Num
ber o
f com
pani
es a
cqui
red
0
5
10
15
20
25
30
35
Expenditure Expenditure (£bn)
0
500
1000
1500
2000
2500N
um
ber
of
dea
ls
Nu m ber
More and more mergers took place across borders within the EU, as shown in the table below.
0
20
40
60
80
100
120
140
160
180
1988 1989 1990 1991 1992 1993 1994 1995 1996 1997 1998
$ b
illio
ns
(at
1998
pri
ces)
Over $1b n
Un der $1bn
CrossCross--border majority mergers and acquisitionsborder majority mergers and acquisitionstargeting an EU companytargeting an EU company
Source: Based on information provided by Thomson Financial Securities Data
COSTS Economists work out costs slightly differently from how an accountant would. Economists use the concept of opportunity cost to work out the costs of a firm. First we work out the cost of the factors of production used (these are the
www.revisionguru.co.uk Page 4
Unit 4 Industrial Economies Steve Margetts
costs an accountant would use) and then we add the opportunity cost of using them. The following are all examples of opportunity costs that could be added to the accounting cost to arrive at the economic cost:
• The owner could work for somebody else's company and earn £20,000. This £20,000 is the opportunity cost of the owner's labour.
• The shop that the hairdresser owns could be rented out for £500 per week. This £500 per week is the opportunity cost of using the shop.
• The owner draws £10,000 from the bank to refurbish the shop. The opportunity cost of this £10,000 is the interest that it would have received if it were left in the bank.
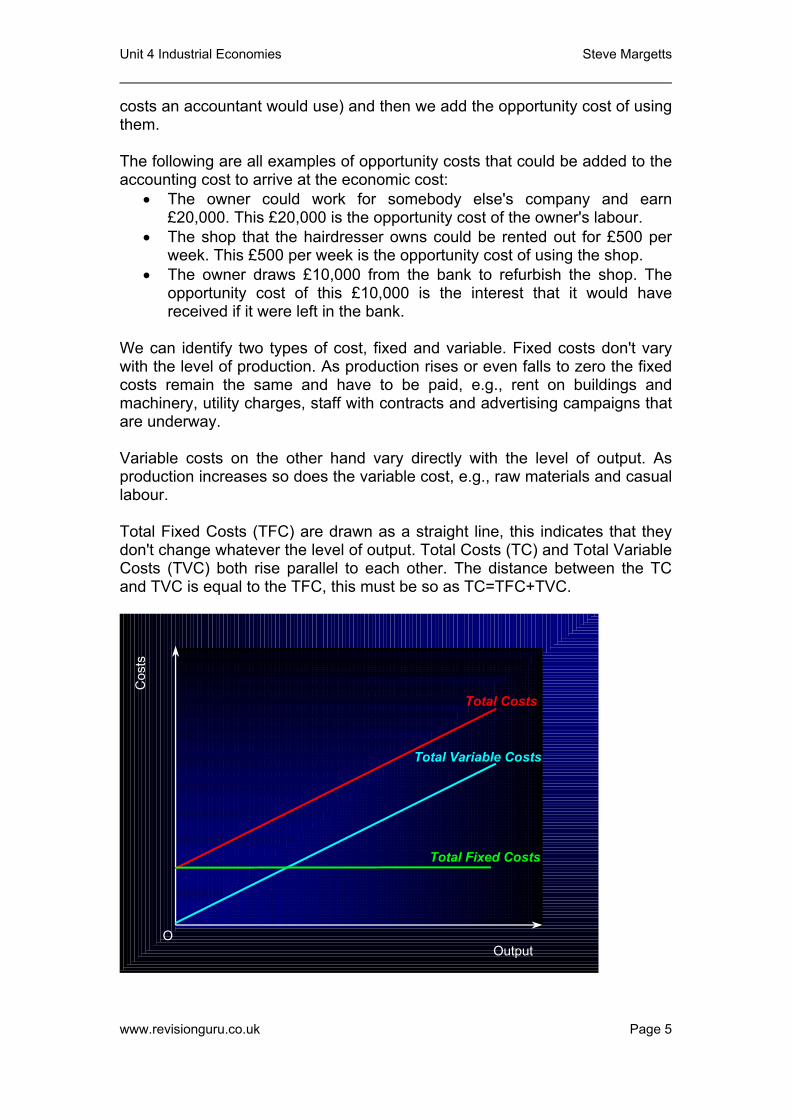
We can identify two types of cost, fixed and variable. Fixed costs don't vary with the level of production. As production rises or even falls to zero the fixed costs remain the same and have to be paid, e.g., rent on buildings and machinery, utility charges, staff with contracts and advertising campaigns that are underway. Variable costs on the other hand vary directly with the level of output. As production increases so does the variable cost, e.g., raw materials and casual labour. Total Fixed Costs (TFC) are drawn as a straight line, this indicates that they don't change whatever the level of output. Total Costs (TC) and Total Variable Costs (TVC) both rise parallel to each other. The distance between the TC and TVC is equal to the TFC, this must be so as TC=TFC+TVC.
Cos
ts
OutputO
Total Variable Costs
Total Fixed Costs
Total Costs
www.revisionguru.co.uk Page 5
Unit 4 Industrial Economies Steve Margetts
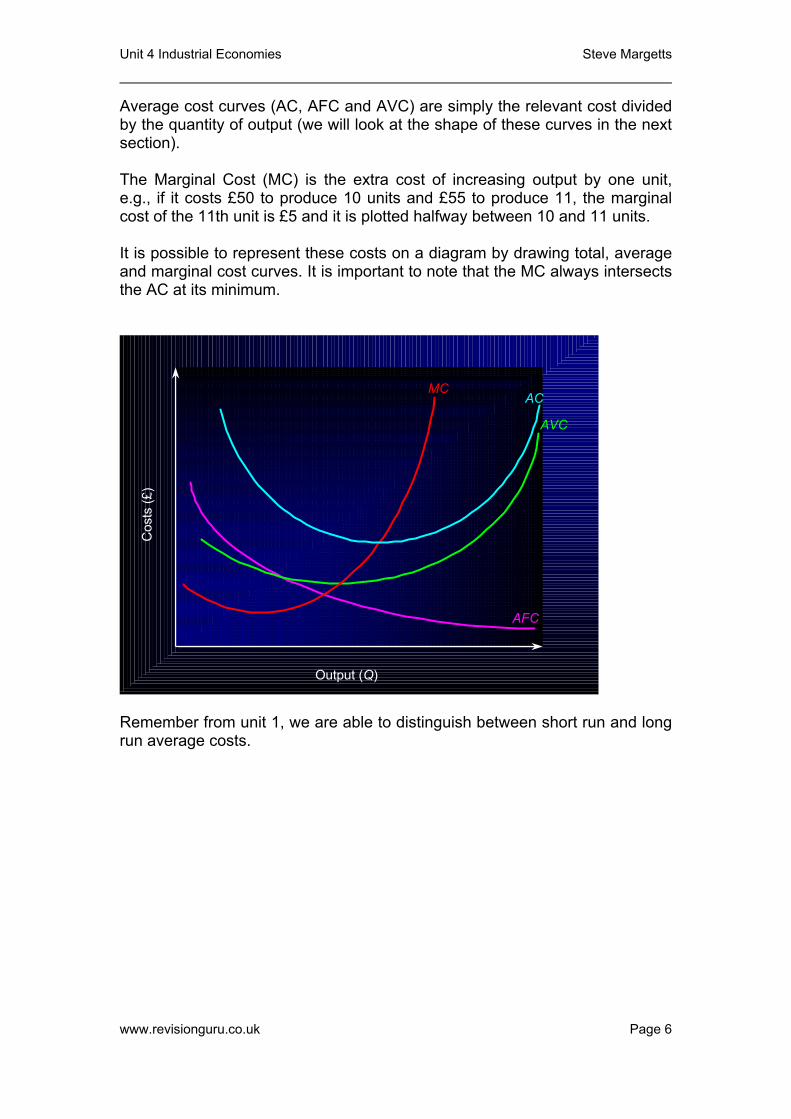
Average cost curves (AC, AFC and AVC) are simply the relevant cost divided by the quantity of output (we will look at the shape of these curves in the next section). The Marginal Cost (MC) is the extra cost of increasing output by one unit, e.g., if it costs £50 to produce 10 units and £55 to produce 11, the marginal cost of the 11th unit is £5 and it is plotted halfway between 10 and 11 units. It is possible to represent these costs on a diagram by drawing total, average and marginal cost curves. It is important to note that the MC always intersects the AC at its minimum.
Output (Q)
Cos
ts (£
)
AFC
AVC
AC
MC
Remember from unit 1, we are able to distinguish between short run and long run average costs.
www.revisionguru.co.uk Page 6
Unit 4 Industrial Economies Steve Margetts
Cos
ts
OutputO MES
Economies of Scale Diseconomies of Scale
SRAC1
SRAC3
SRAC2 SRAC4
SRAC5
LRAC
REVENUE
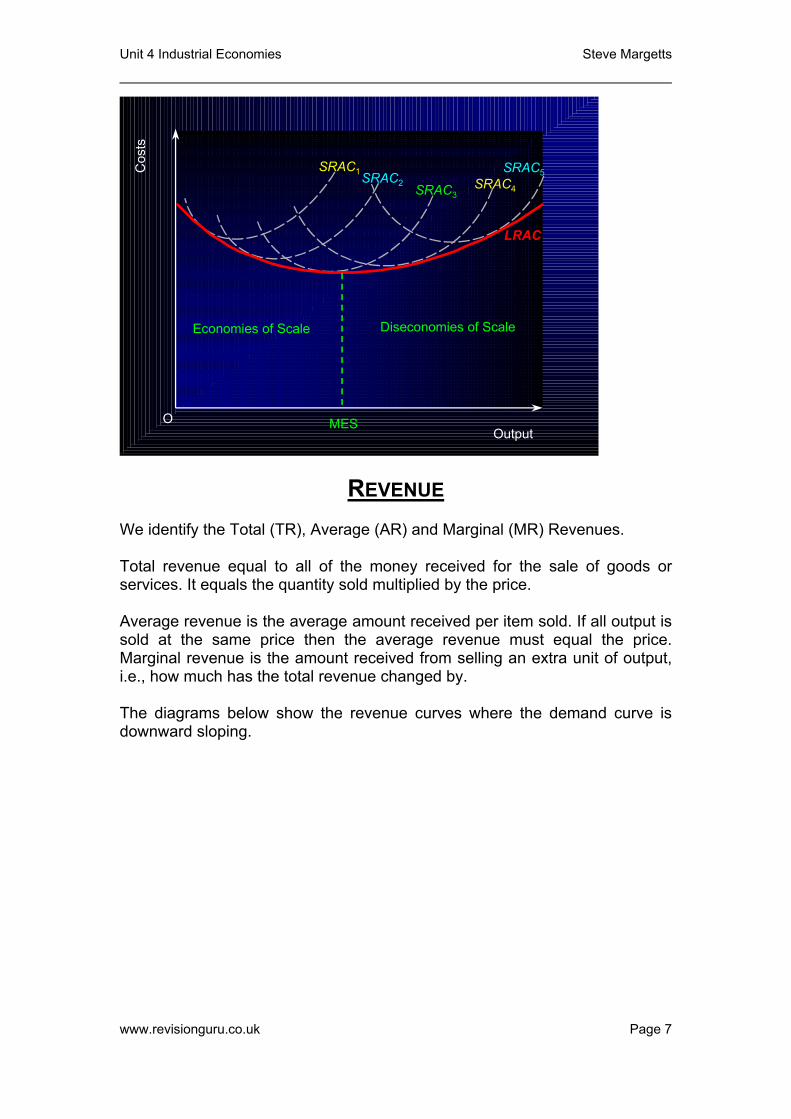
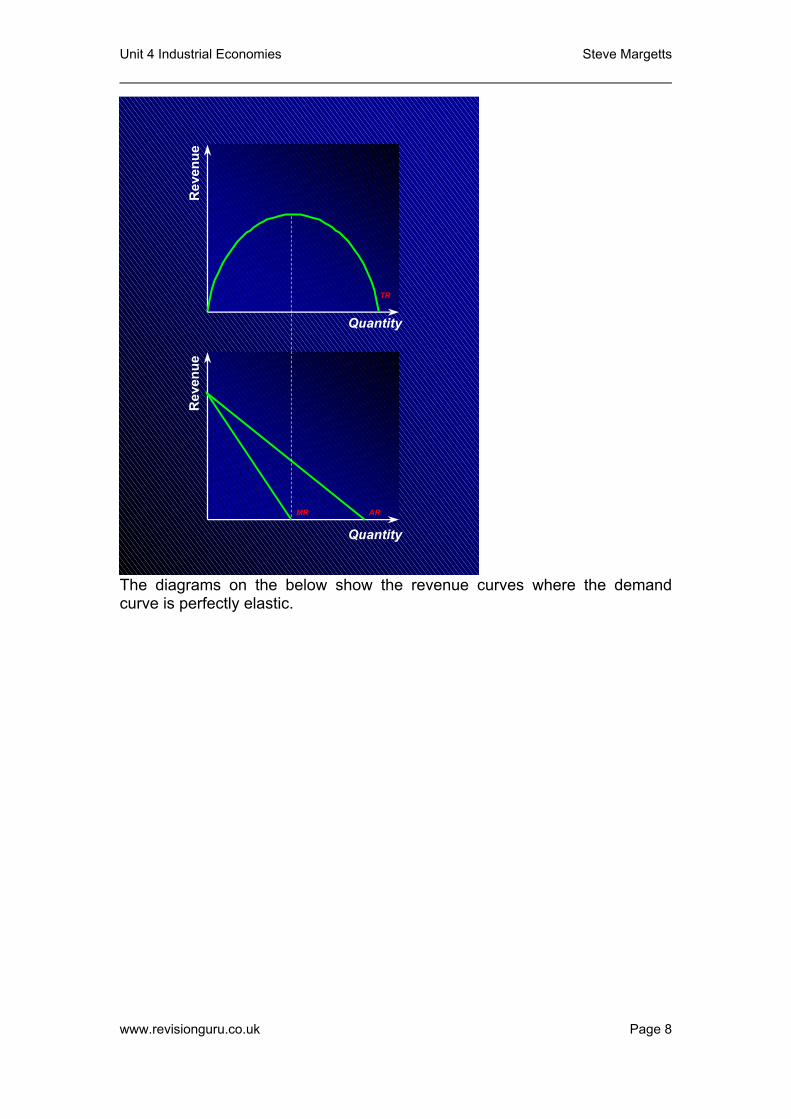
We identify the Total (TR), Average (AR) and Marginal (MR) Revenues. Total revenue equal to all of the money received for the sale of goods or services. It equals the quantity sold multiplied by the price. Average revenue is the average amount received per item sold. If all output is sold at the same price then the average revenue must equal the price. Marginal revenue is the amount received from selling an extra unit of output, i.e., how much has the total revenue changed by. The diagrams below show the revenue curves where the demand curve is downward sloping.
www.revisionguru.co.uk Page 7
Unit 4 Industrial Economies Steve Margetts
Rev
enue
Rev
enue
Quantity
Quantity
TR
ARMR
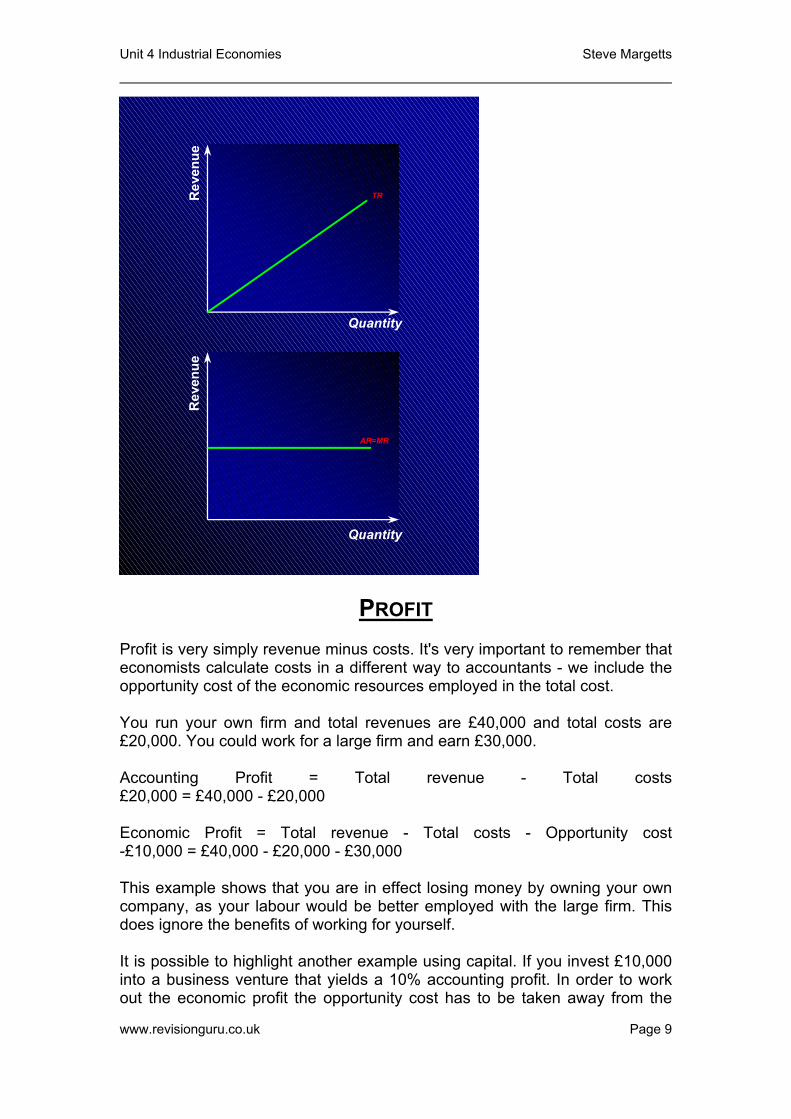
The diagrams on the below show the revenue curves where the demand curve is perfectly elastic.
www.revisionguru.co.uk Page 8
Unit 4 Industrial Economies Steve Margetts
Rev
enue
Rev
enue
Quantity
Quantity
TR
AR=MR
PROFIT
Profit is very simply revenue minus costs. It's very important to remember that economists calculate costs in a different way to accountants - we include the opportunity cost of the economic resources employed in the total cost. You run your own firm and total revenues are £40,000 and total costs are £20,000. You could work for a large firm and earn £30,000. Accounting Profit = Total revenue - Total costs £20,000 = £40,000 - £20,000 Economic Profit = Total revenue - Total costs - Opportunity cost -£10,000 = £40,000 - £20,000 - £30,000 This example shows that you are in effect losing money by owning your own company, as your labour would be better employed with the large firm. This does ignore the benefits of working for yourself. It is possible to highlight another example using capital. If you invest £10,000 into a business venture that yields a 10% accounting profit. In order to work out the economic profit the opportunity cost has to be taken away from the
www.revisionguru.co.uk Page 9
Unit 4 Industrial Economies Steve Margetts
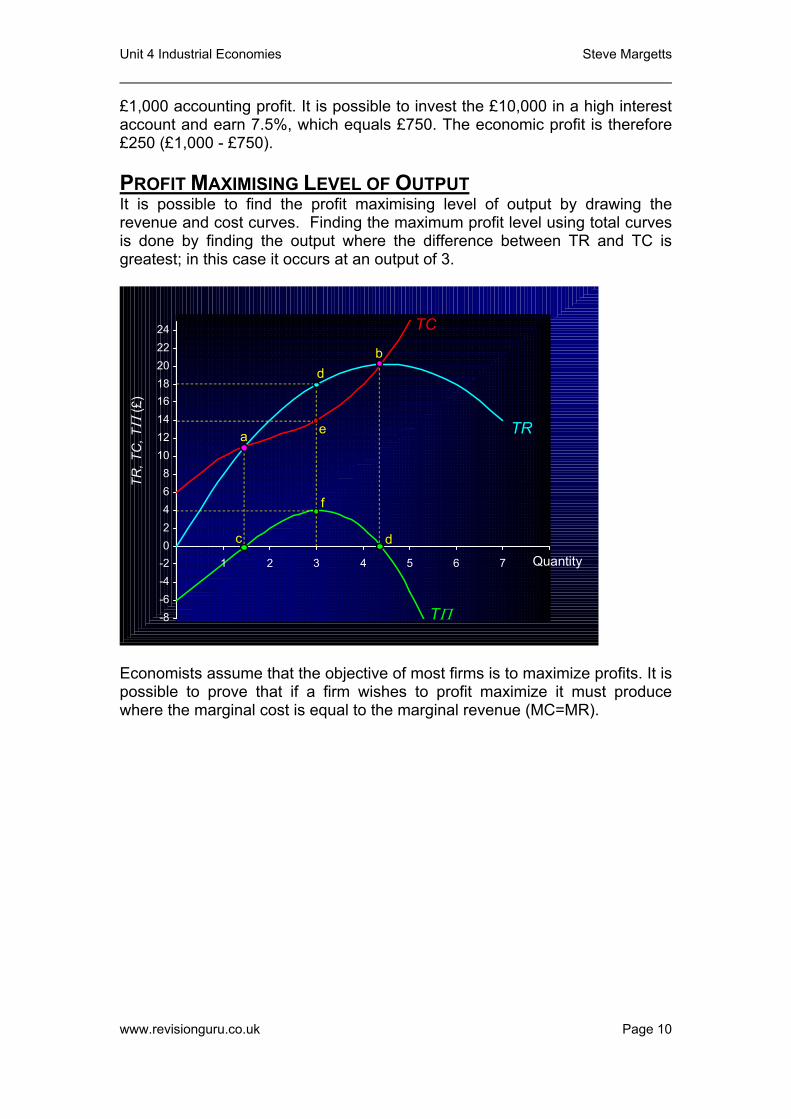
£1,000 accounting profit. It is possible to invest the £10,000 in a high interest account and earn 7.5%, which equals £750. The economic profit is therefore £250 (£1,000 - £750). PROFIT MAXIMISING LEVEL OF OUTPUT It is possible to find the profit maximising level of output by drawing the revenue and cost curves. Finding the maximum profit level using total curves is done by finding the output where the difference between TR and TC is greatest; in this case it occurs at an output of 3.
-8-6-4-202468
1012141618202224
1 2 3 4 5 6 7
TR, T
C, T
Π(£
)
TΠ
TR
d
e
f
Quantity
a
b
c d
TC
Economists assume that the objective of most firms is to maximize profits. It is possible to prove that if a firm wishes to profit maximize it must produce where the marginal cost is equal to the marginal revenue (MC=MR).
www.revisionguru.co.uk Page 10
Unit 4 Industrial Economies Steve Margetts
-4
0
4
8
12
16
1 2 3 4 5 6 7
MR
Quantity
Cos
ts a
nd re
venu
e (£
)
Profit-maximising outpute
MC
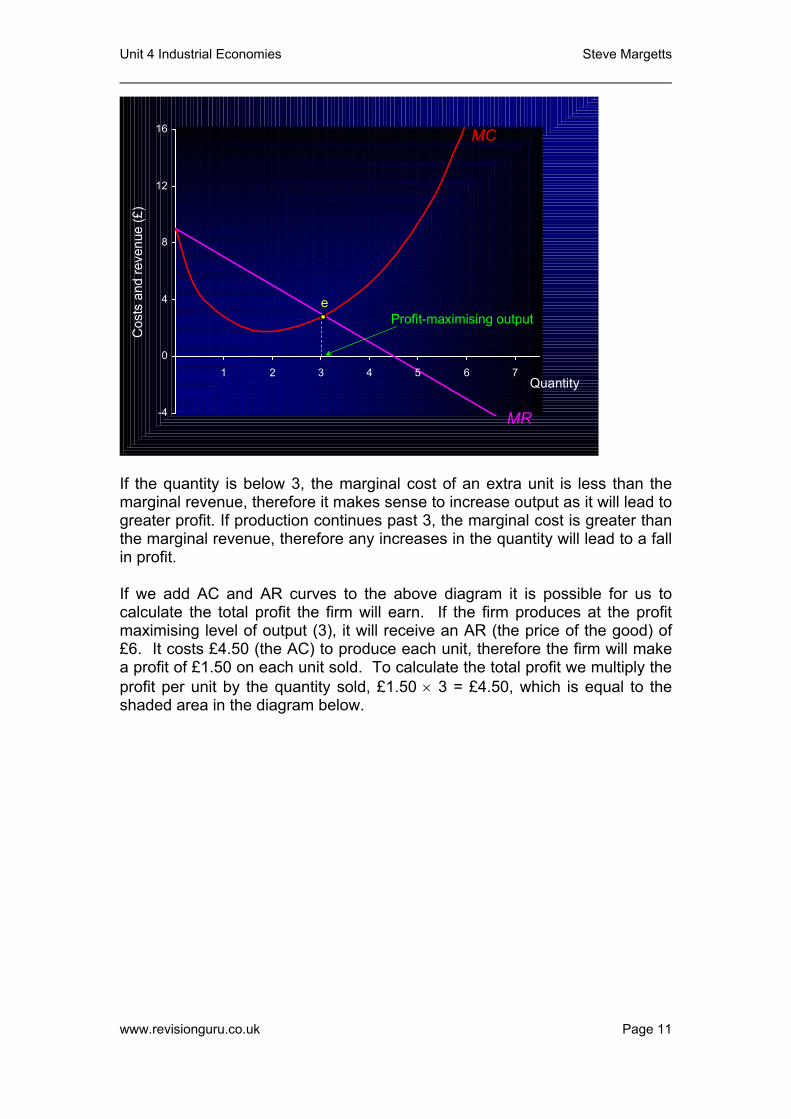
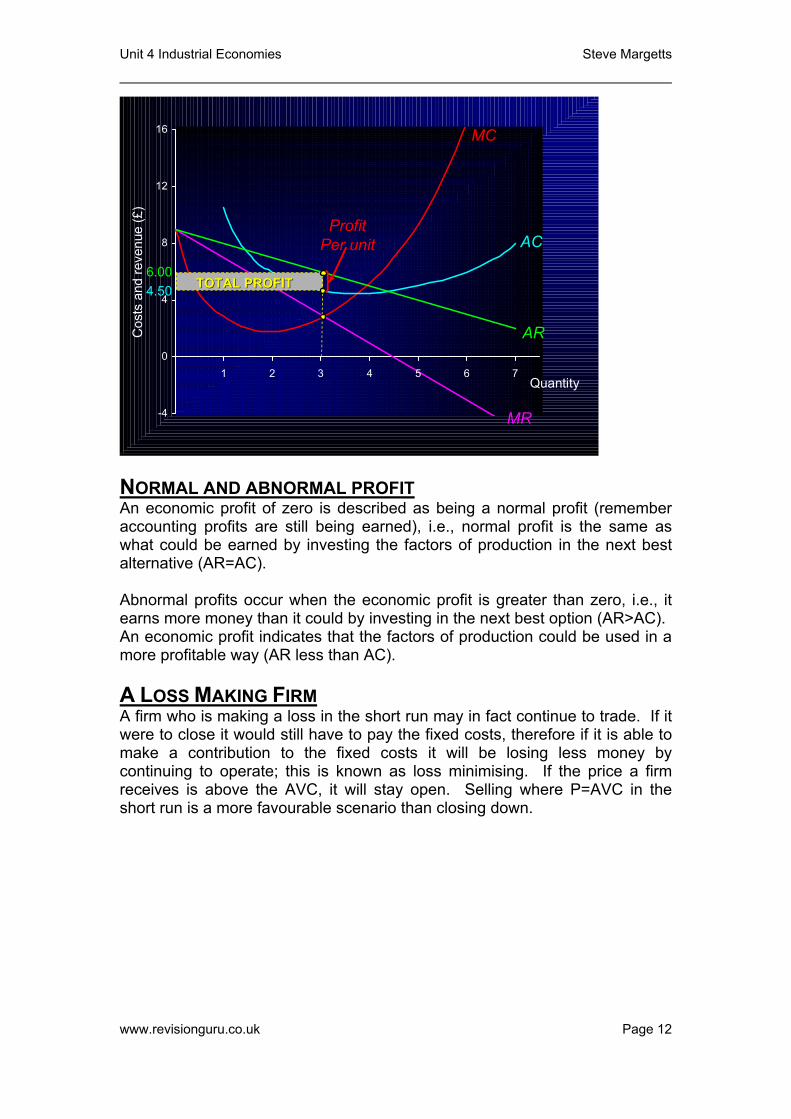
If the quantity is below 3, the marginal cost of an extra unit is less than the marginal revenue, therefore it makes sense to increase output as it will lead to greater profit. If production continues past 3, the marginal cost is greater than the marginal revenue, therefore any increases in the quantity will lead to a fall in profit. If we add AC and AR curves to the above diagram it is possible for us to calculate the total profit the firm will earn. If the firm produces at the profit maximising level of output (3), it will receive an AR (the price of the good) of £6. It costs £4.50 (the AC) to produce each unit, therefore the firm will make a profit of £1.50 on each unit sold. To calculate the total profit we multiply the profit per unit by the quantity sold, £1.50 × 3 = £4.50, which is equal to the shaded area in the diagram below.
www.revisionguru.co.uk Page 11
Unit 4 Industrial Economies Steve Margetts
-4
0
4
8
12
16
1 2 3 4 5 6 7
MR
Quantity
Cos
ts a
nd re
venu
e (£
)
AC
AR
6.004.50 TOTAL PROFITTOTAL PROFIT
MC
ProfitPer unit
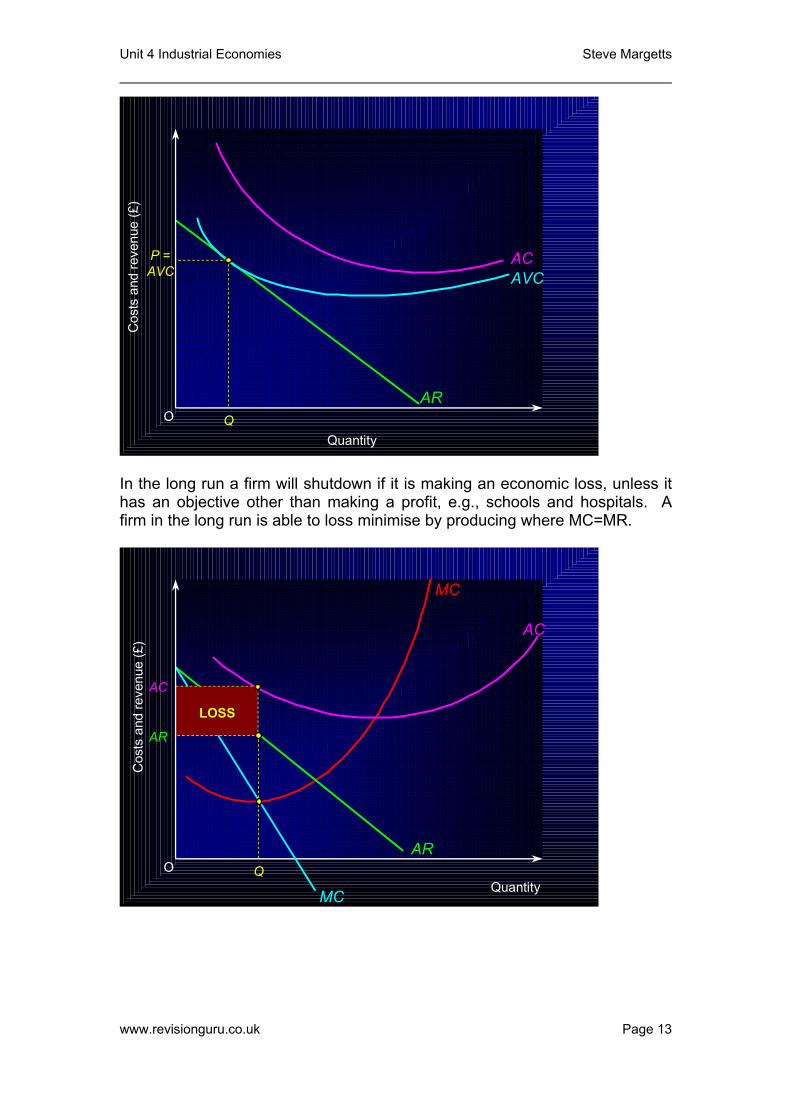
NORMAL AND ABNORMAL PROFIT An economic profit of zero is described as being a normal profit (remember accounting profits are still being earned), i.e., normal profit is the same as what could be earned by investing the factors of production in the next best alternative (AR=AC). Abnormal profits occur when the economic profit is greater than zero, i.e., it earns more money than it could by investing in the next best option (AR>AC). An economic profit indicates that the factors of production could be used in a more profitable way (AR less than AC). A LOSS MAKING FIRM A firm who is making a loss in the short run may in fact continue to trade. If it were to close it would still have to pay the fixed costs, therefore if it is able to make a contribution to the fixed costs it will be losing less money by continuing to operate; this is known as loss minimising. If the price a firm receives is above the AVC, it will stay open. Selling where P=AVC in the short run is a more favourable scenario than closing down.
www.revisionguru.co.uk Page 12
Unit 4 Industrial Economies Steve Margetts
O
Cos
ts a
nd re
venu
e (£
)
Quantity
AR
AVCACP =
AVC
Q
In the long run a firm will shutdown if it is making an economic loss, unless it has an objective other than making a profit, e.g., schools and hospitals. A firm in the long run is able to loss minimise by producing where MC=MR.
O
Cos
ts a
nd re
venu
e (£
)
Quantity
AC
AR
MCQ
LOSSLOSS
AC
AR
MC
www.revisionguru.co.uk Page 13
Unit 4 Industrial Economies Steve Margetts
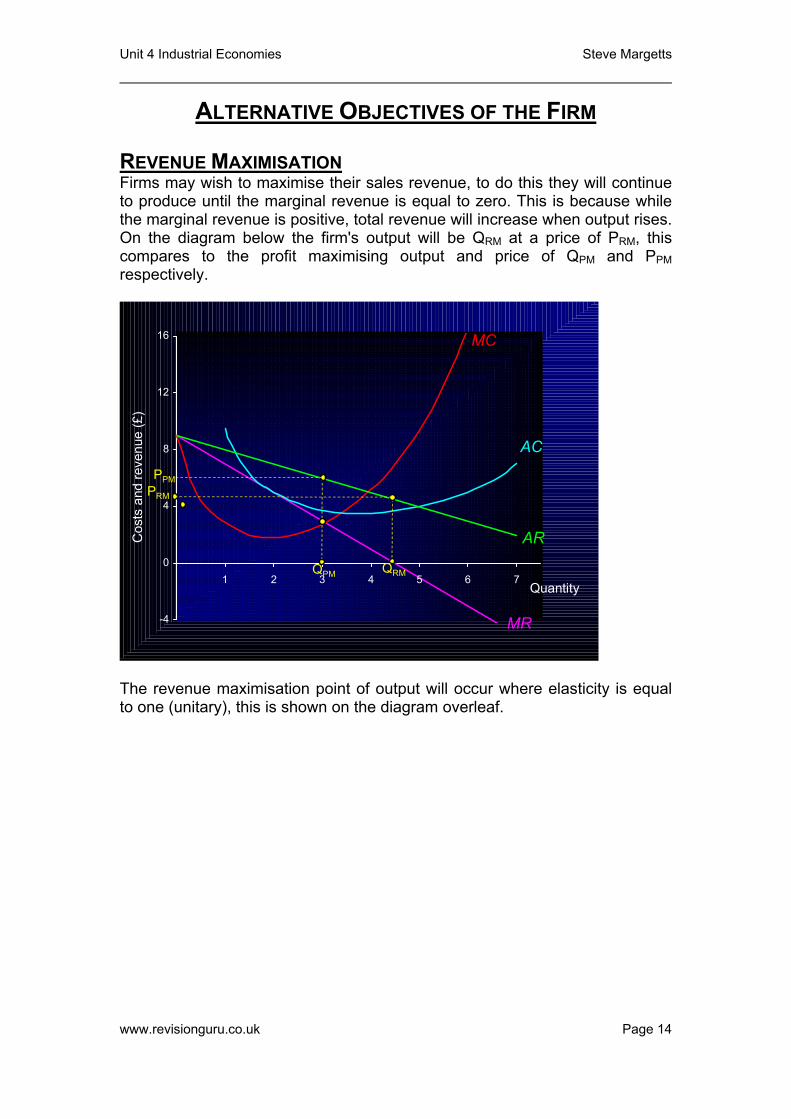
ALTERNATIVE OBJECTIVES OF THE FIRM REVENUE MAXIMISATION Firms may wish to maximise their sales revenue, to do this they will continue to produce until the marginal revenue is equal to zero. This is because while the marginal revenue is positive, total revenue will increase when output rises. On the diagram below the firm's output will be QRM at a price of PRM, this compares to the profit maximising output and price of QPM and PPM respectively.
-4
0
4
8
12
16
1 2 3 4 5 6 7
MR
Quantity
Cos
ts a
nd re
venu
e (£
)
AC
AR
QPM
PRM
PPM
QRM
MC
The revenue maximisation point of output will occur where elasticity is equal to one (unitary), this is shown on the diagram overleaf.
www.revisionguru.co.uk Page 14

Unit 4 Industrial Economies Steve Margetts
Rev
enue
Pric
e
Quantity
Quantity
PED=1
TR
Revenue Maximised
MR D=AR
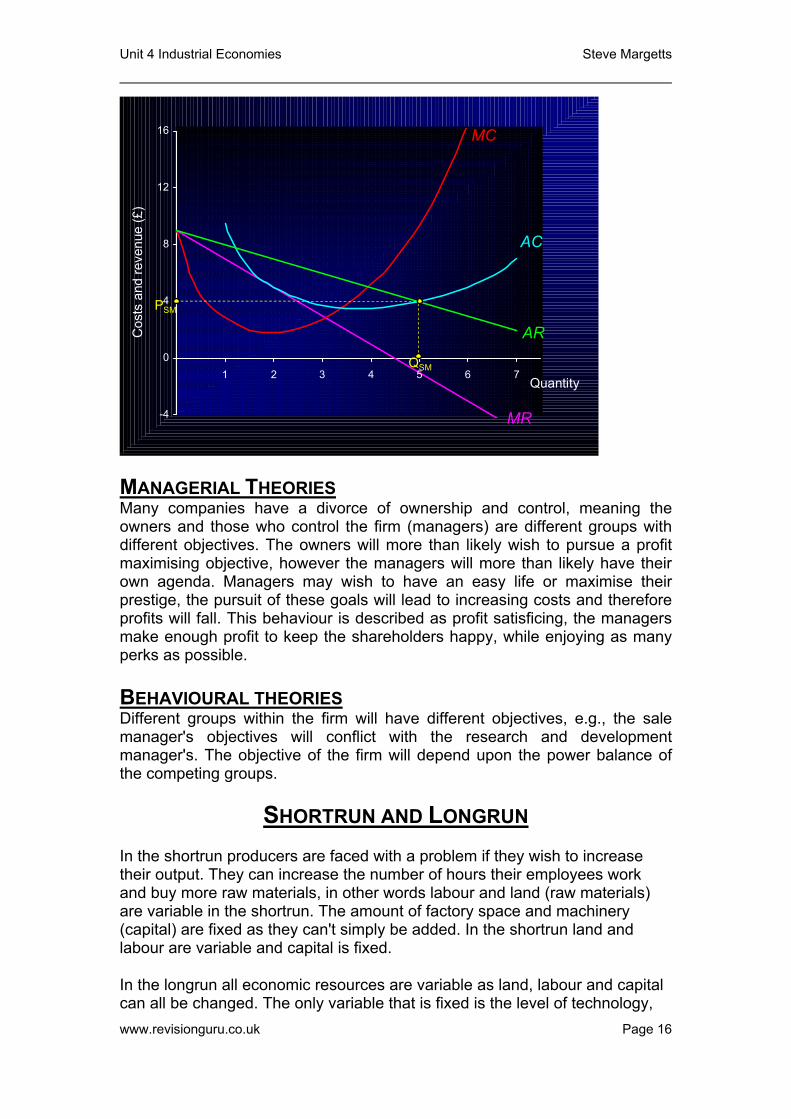
SALES MAXIMISATION A firm may wish to maximise its sales in order to gain as large a share of the market as possible. This goal would have to be pursued subject to the constraint of at least normal economic profit. The firm will lower its price until the point where AC=AR, giving an output of Qs.
www.revisionguru.co.uk Page 15
Unit 4 Industrial Economies Steve Margetts
-4
0
4
8
12
16
1 2 3 4 5 6 7
MR
Quantity
Cos
ts a
nd re
venu
e (£
)
AC
AR
PSM
QSM
MC
MANAGERIAL THEORIES Many companies have a divorce of ownership and control, meaning the owners and those who control the firm (managers) are different groups with different objectives. The owners will more than likely wish to pursue a profit maximising objective, however the managers will more than likely have their own agenda. Managers may wish to have an easy life or maximise their prestige, the pursuit of these goals will lead to increasing costs and therefore profits will fall. This behaviour is described as profit satisficing, the managers make enough profit to keep the shareholders happy, while enjoying as many perks as possible. BEHAVIOURAL THEORIES Different groups within the firm will have different objectives, e.g., the sale manager's objectives will conflict with the research and development manager's. The objective of the firm will depend upon the power balance of the competing groups.
SHORTRUN AND LONGRUN In the shortrun producers are faced with a problem if they wish to increase their output. They can increase the number of hours their employees work and buy more raw materials, in other words labour and land (raw materials) are variable in the shortrun. The amount of factory space and machinery (capital) are fixed as they can't simply be added. In the shortrun land and labour are variable and capital is fixed.
In the longrun all economic resources are variable as land, labour and capital can all be changed. The only variable that is fixed is the level of technology, www.revisionguru.co.uk Page 16
Unit 4 Industrial Economies Steve Margetts
but this can be introduced in the very long run, e.g., new IT or production techniques are introduced.
There is no standard measure for these time periods as they vary greatly from industry to industry, e.g., a market trader can increase its capital (the market stall) a lot quicker than ICI (a new chemical plant).
ECONOMIES OF SCALE PRODUCTION IN THE SHORTRUN If we assume that a firm only uses capital (which is fixed) and labour (which is variable), what will happen to output as we employ more and more workers? If a factory is designed for 1000 people its unlikely to have a high output if there is only one worker. As workers are added it is likely that the marginal output will increase as specialization occurs. There will come a point when output per worker will fall, e.g., if there are 5000 workers in a factory designed for 1000 they will get in each other's way. If the extra worker adds less to total output than the worker before him, we say diminishing marginal returns is occurring. PRODUCTION IN THE LONGRUN The law of diminishing marginal returns assumes the firm is operating in the shortrun (as capital is fixed). As we know in the longrun firms are able to vary all of their factors of production, what will happen to output as inputs are increased in the longrun? Firms are able to grow in one of two ways:
• Internal growth: this occurs when a firm expands its own sales and output. To do this firms must employ more factors of production (CELL).
• External growth: this occurs via mergers and takeovers As firms grow we have found that their average cost of production per unit can fall, we call this economies of scale. Internal economies of scale occur because of the increase in output by the firm:
• Technical economies - large firms are able to buy equipment that wouldn't be economical for small firms to purchase, as it would lie idle for a majority of the time. e.g., Tesco are able to afford electrical point of sale (EPOS) equipment that wouldn’t be economical for a corner shop o buy.
• Managerial economies - Larger firms have greater scope for the
specialisation of labour, employing specialist workers to perform a relatively narrow task. e.g., large schools can employ specialist biology, chemistry and physics teachers, while a small school has to employ a general science teacher.
www.revisionguru.co.uk Page 17
Unit 4 Industrial Economies Steve Margetts
• Increasing dimensions - doubling the height and width of a building or ship etc. will lead the volume to increase by around threefold. This means the bigger the building or ship the lower the average cost will be.
• Marketing economies - as a firm grows the average cost of advertising
per unit will fall, leading to lower average costs. e.g., small firms are unable to afford large scale advertising campaigns, while their larger competitors are able to finance television and radio campaigns.
• Purchasing economies - buying in bulk means that you will normally receive a discount from the supplier. e.g., these are similar to when you go into a supermarket and are able to buy individual items cheaper in a multipack.
• Financial economies - larger firms are deemed to be more credit worthy, therefore they have a better chance of being lent money and they are given a lower rate of interest on loans e.g., Sainsbury’s are more likely to be able to pay back a loan than a small cornershop so a bank will charge them a lower rate of interest to reflect this. If the bank refuse Sainsbury’s the loan its more than likely they will take their business elsewhere, whilst the cornershop will have fewer banks willing to take on their risky business.
External economies of scale arise due to factors that the firm is unable to control:
• Growth of industry - if many firms are located in close proximity, better roads will be built that will reduce costs. Other firms will train workers that can be poached, thereby reducing expenditure.
• Lowering taxation - a decrease in national insurance contributions for example would lower a firm's costs.
• Technology - the introduction of a more efficient technology would lower the costs for the firm.
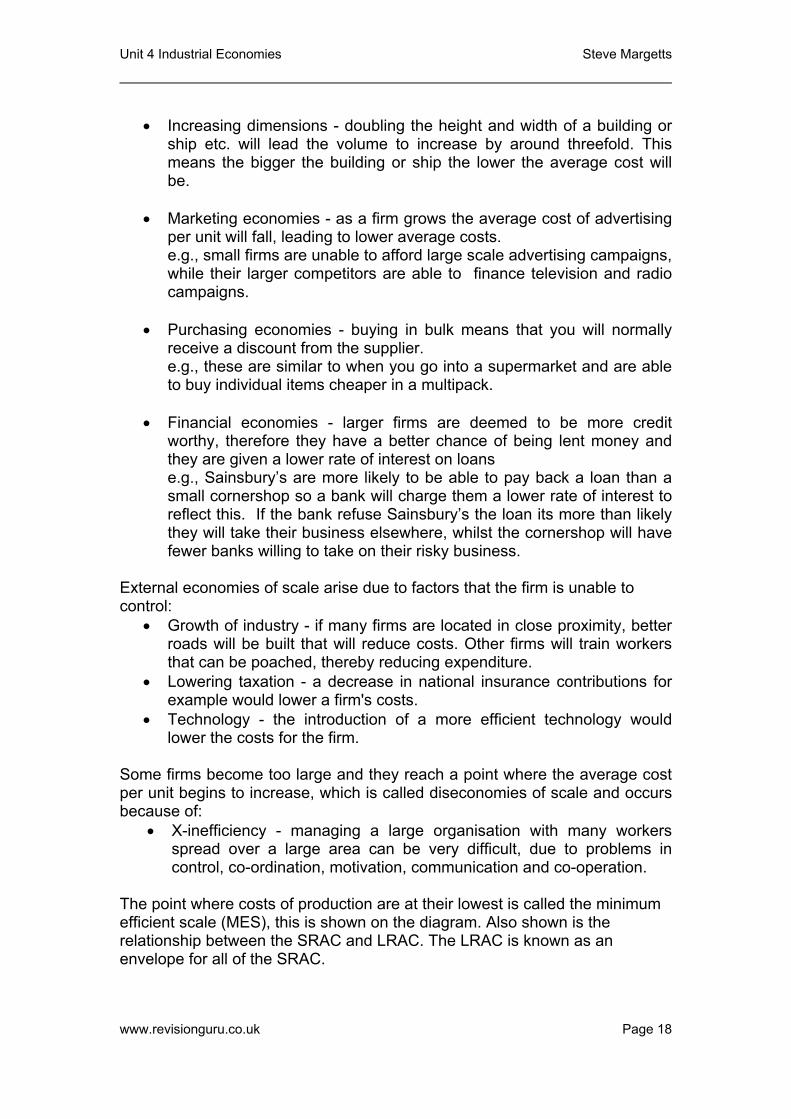
Some firms become too large and they reach a point where the average cost per unit begins to increase, which is called diseconomies of scale and occurs because of:
• X-inefficiency - managing a large organisation with many workers spread over a large area can be very difficult, due to problems in control, co-ordination, motivation, communication and co-operation.
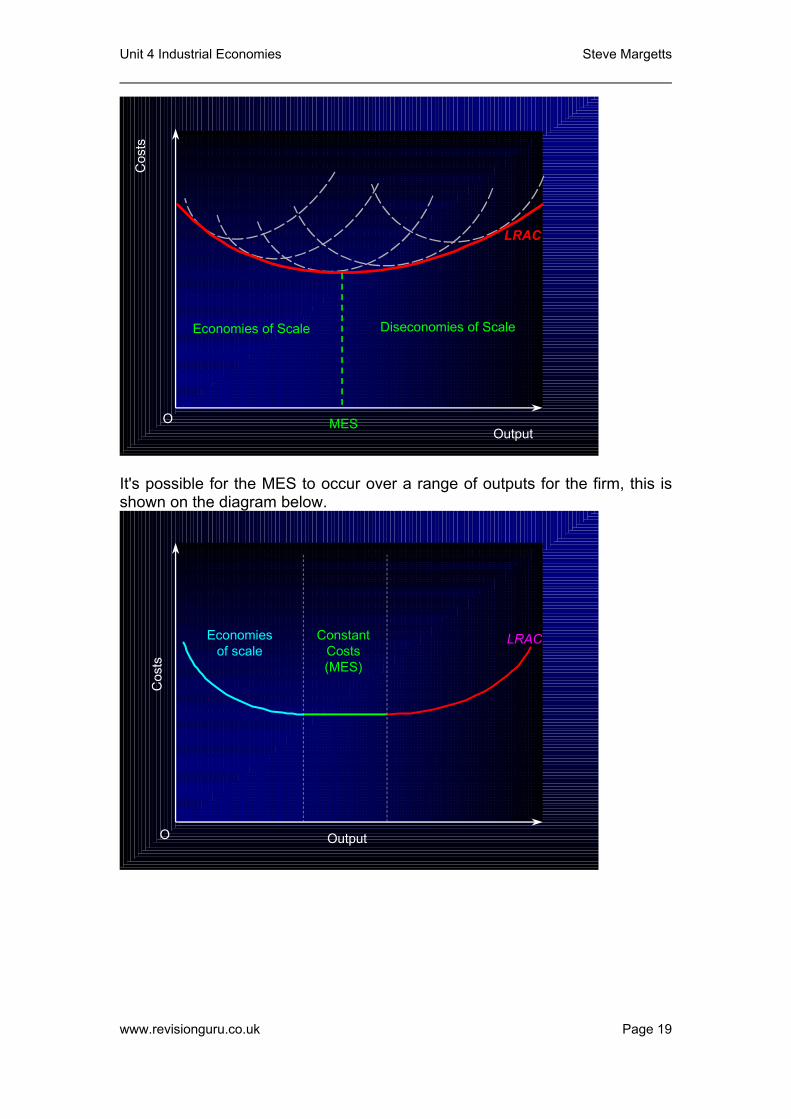
The point where costs of production are at their lowest is called the minimum efficient scale (MES), this is shown on the diagram. Also shown is the relationship between the SRAC and LRAC. The LRAC is known as an envelope for all of the SRAC.
www.revisionguru.co.uk Page 18
Unit 4 Industrial Economies Steve Margetts
Cos
ts
OutputO MES
Economies of Scale Diseconomies of Scale
LRAC
Diseconomiesof scale
It's possible for the MES to occur over a range of outputs for the firm, this is shown on the diagram below.
OutputO
Cos
ts
LRACEconomiesof scale
ConstantCosts(MES)
www.revisionguru.co.uk Page 19
Unit 4 Industrial Economies Steve Margetts
PERFECT COMPETITION Perfect competition doesn't imply ideal results are produced or economic welfare is maximised. Four characteristics of perfect competition
• There are many buyers and sellers in the market place, none of whom are large enough to influence the price. Sellers are described as being price takers.
• There is freedom of entry and exit into the market, i.e., barriers to entry are low. Firms must be able to establish themselves quickly in the marketplace.
• Buyers and sellers have perfect knowledge, economic agents are fully informed of prices and output in the industry.
• All firms produce a homogeneous (identical) product. The agriculture industry is the most commonly used example of perfect competition, it satisfies the above criteria as follows:
• There are a large number of buyers and sellers in a massive market. • It is easy to buy a farm and equally easy to sell it. • Farmers know the current market prices for agricultural goods as they
are frequently published. • Farmers produce a range of homogeneous goods.
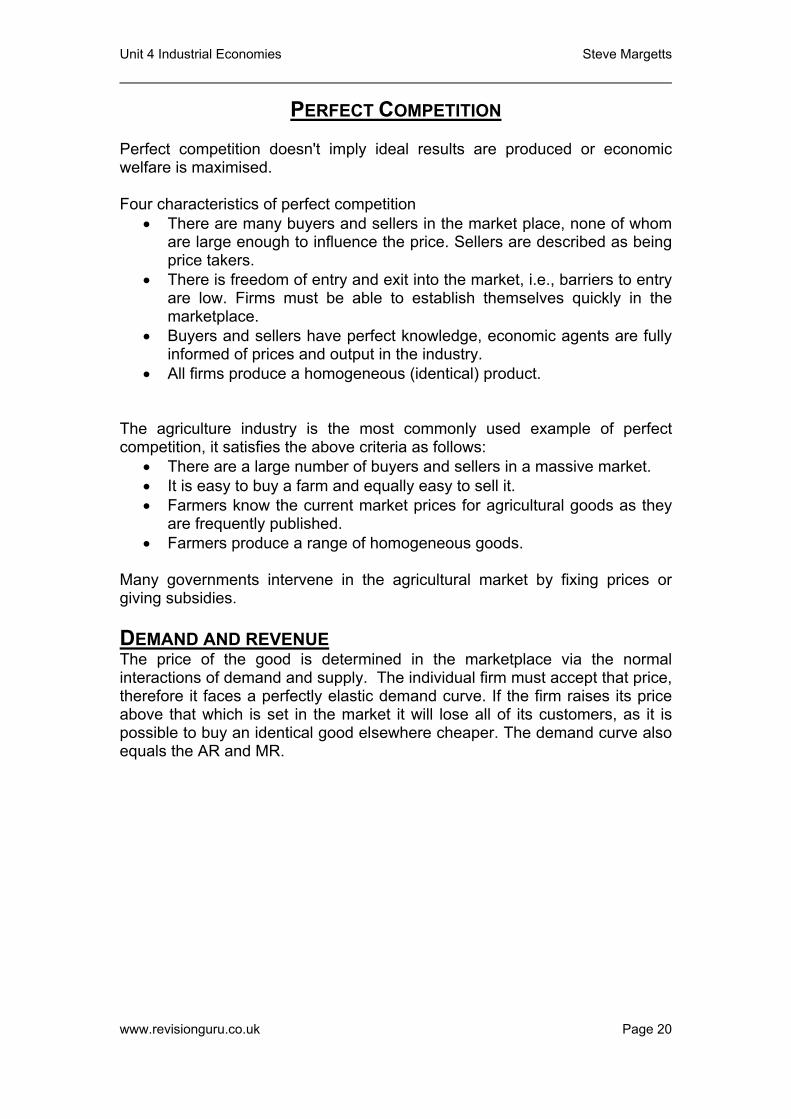
Many governments intervene in the agricultural market by fixing prices or giving subsidies. DEMAND AND REVENUE The price of the good is determined in the marketplace via the normal interactions of demand and supply. The individual firm must accept that price, therefore it faces a perfectly elastic demand curve. If the firm raises its price above that which is set in the market it will lose all of its customers, as it is possible to buy an identical good elsewhere cheaper. The demand curve also equals the AR and MR.
www.revisionguru.co.uk Page 20
Unit 4 Industrial Economies Steve Margetts
O O
S
D
(a) (a) IndustryIndustry
P £
(b) (b) FirmFirm
Q (millions) Q (thousands)
Pe AR D = AR= MR
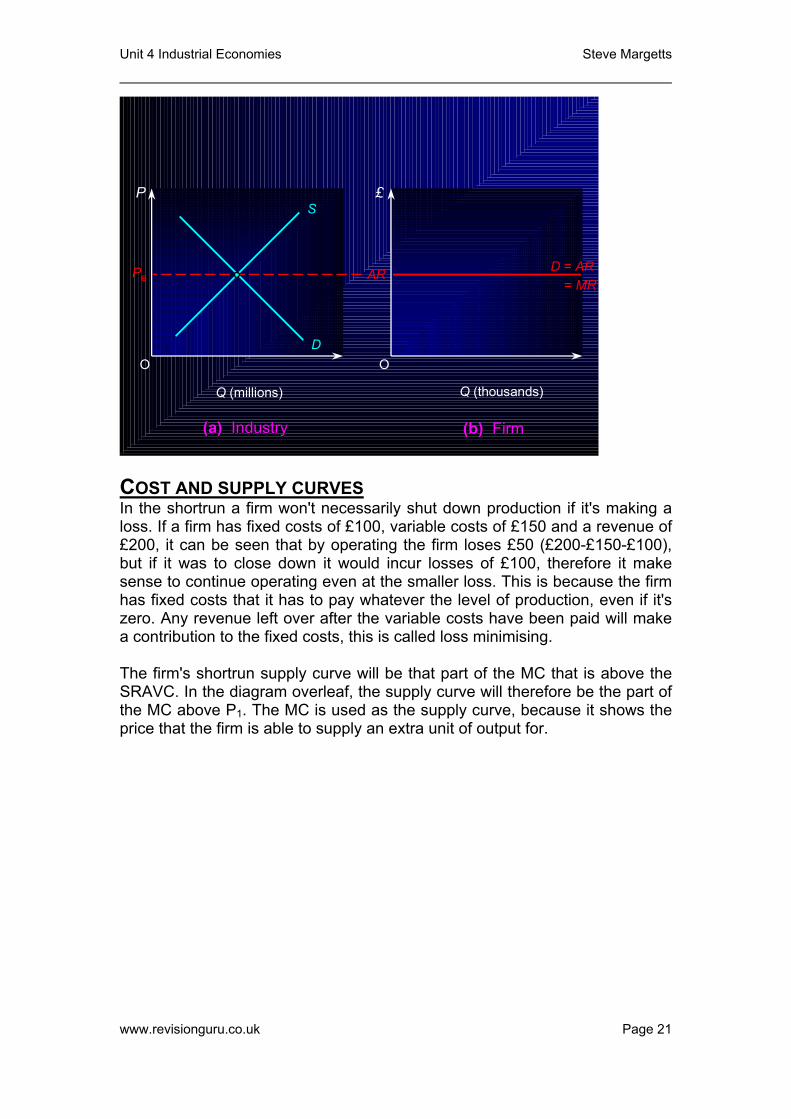
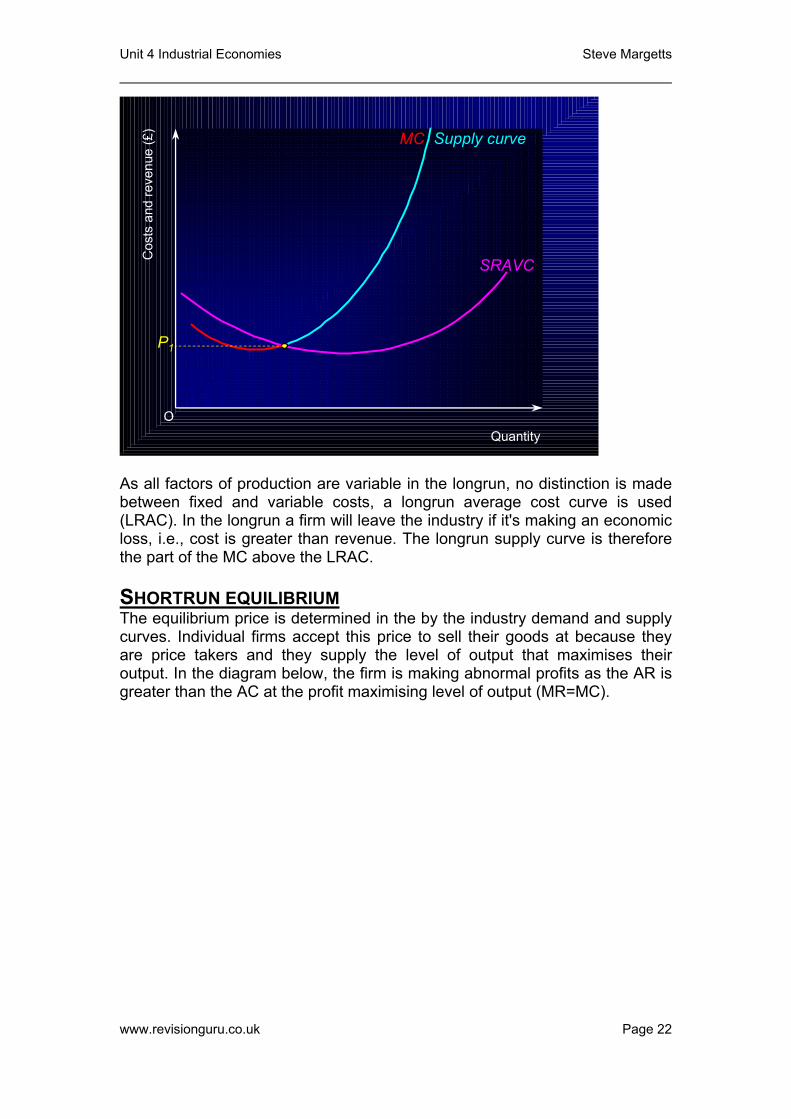
COST AND SUPPLY CURVES In the shortrun a firm won't necessarily shut down production if it's making a loss. If a firm has fixed costs of £100, variable costs of £150 and a revenue of £200, it can be seen that by operating the firm loses £50 (£200-£150-£100), but if it was to close down it would incur losses of £100, therefore it make sense to continue operating even at the smaller loss. This is because the firm has fixed costs that it has to pay whatever the level of production, even if it's zero. Any revenue left over after the variable costs have been paid will make a contribution to the fixed costs, this is called loss minimising. The firm's shortrun supply curve will be that part of the MC that is above the SRAVC. In the diagram overleaf, the supply curve will therefore be the part of the MC above P1. The MC is used as the supply curve, because it shows the price that the firm is able to supply an extra unit of output for.
www.revisionguru.co.uk Page 21
Unit 4 Industrial Economies Steve Margetts
O
Cos
ts a
nd re
venu
e (£
)
Quantity
SRAVC
Supply curve
P1
MC
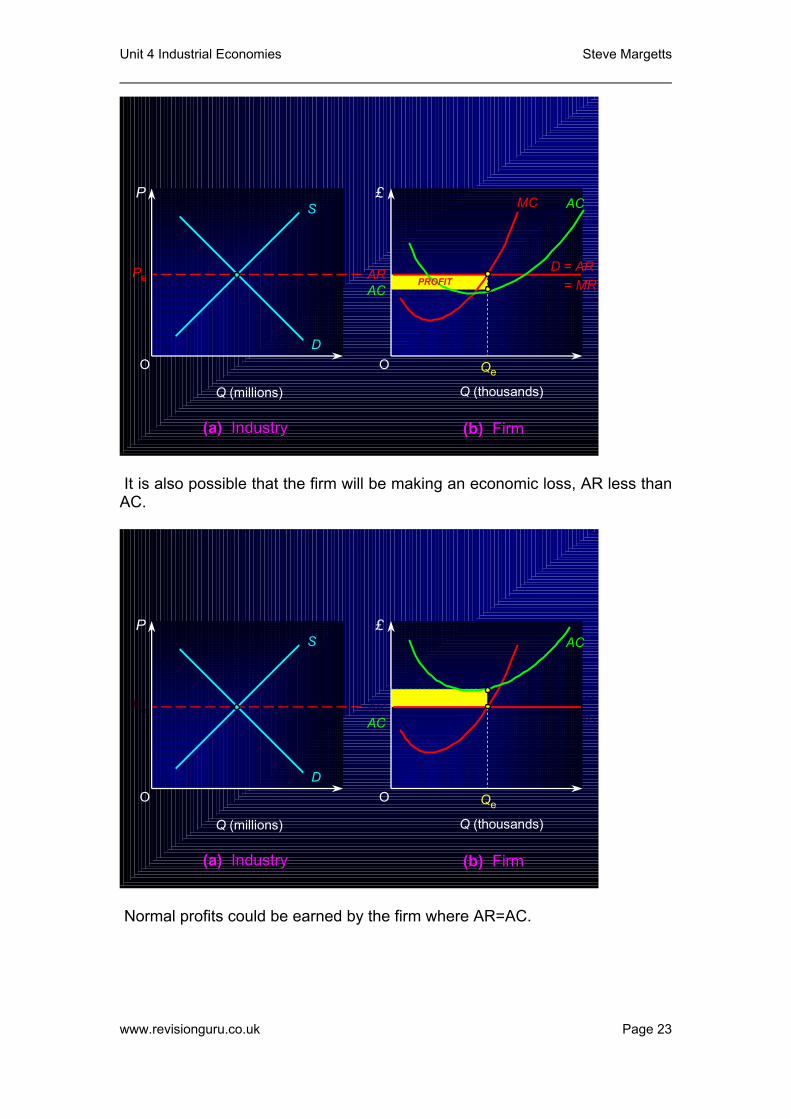
As all factors of production are variable in the longrun, no distinction is made between fixed and variable costs, a longrun average cost curve is used (LRAC). In the longrun a firm will leave the industry if it's making an economic loss, i.e., cost is greater than revenue. The longrun supply curve is therefore the part of the MC above the LRAC. SHORTRUN EQUILIBRIUM The equilibrium price is determined in the by the industry demand and supply curves. Individual firms accept this price to sell their goods at because they are price takers and they supply the level of output that maximises their output. In the diagram below, the firm is making abnormal profits as the AR is greater than the AC at the profit maximising level of output (MR=MC).
www.revisionguru.co.uk Page 22
Unit 4 Industrial Economies Steve Margetts
O O
S
D
(a) (a) IndustryIndustry
P £
Q (millions)
(b) (b) FirmFirm
Qe
AC
AC
Q (thousands)
Pe AR D = AR= MR
MC
PROFIT
Pe AR D = AR= MR
MC
LOSS
It is also possible that the firm will be making an economic loss, AR less than AC.
O O
S
D
(a) (a) IndustryIndustry
P £
Q (millions)
(b) (b) FirmFirm
Qe
AC
AC
Q (thousands)
Normal profits could be earned by the firm where AR=AC.
www.revisionguru.co.uk Page 23
Unit 4 Industrial Economies Steve Margetts
O O
S
D
(a) (a) IndustryIndustry
P £
Q (millions)
(b) (b) FirmFirm
Qe
AC
Q (thousands)
PeAR
=ACD = AR
= MR
MC
MC
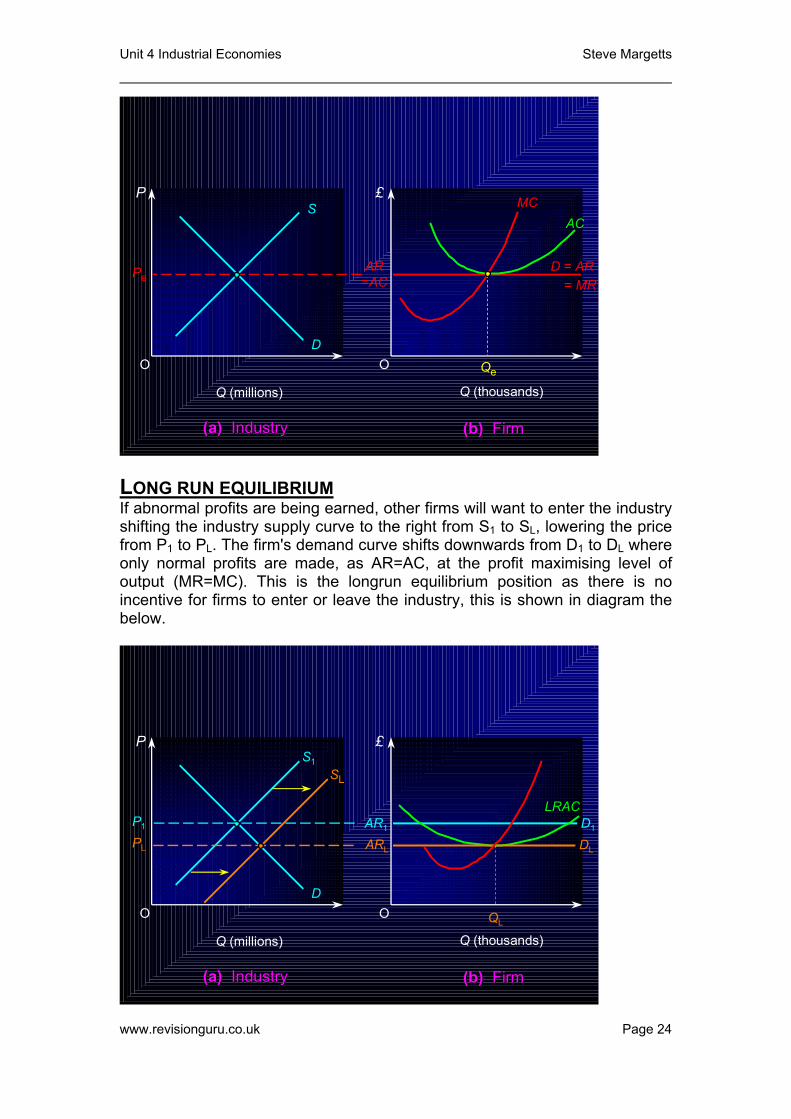
LONG RUN EQUILIBRIUM If abnormal profits are being earned, other firms will want to enter the industry shifting the industry supply curve to the right from S1 to SL, lowering the price from P1 to PL. The firm's demand curve shifts downwards from D1 to DL where only normal profits are made, as AR=AC, at the profit maximising level of output (MR=MC). This is the longrun equilibrium position as there is no incentive for firms to enter or leave the industry, this is shown in diagram the below.
O O
S1
D
(a) (a) IndustryIndustry
P £
Q (millions)
P1
(b) (b) FirmFirm
AR1
LRAC
PL ARL
QL
SL
D1
DL
Q (thousands)
www.revisionguru.co.uk Page 24
Unit 4 Industrial Economies Steve Margetts
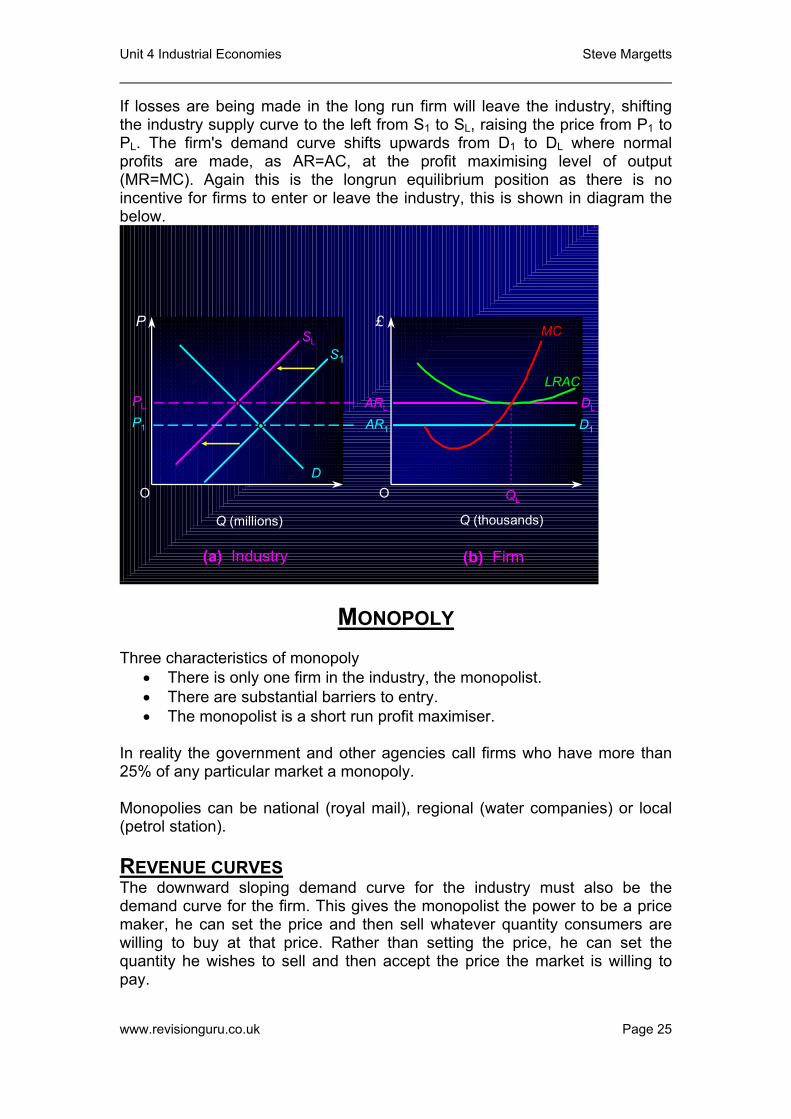
If losses are being made in the long run firm will leave the industry, shifting the industry supply curve to the left from S1 to SL, raising the price from P1 to PL. The firm's demand curve shifts upwards from D1 to DL where normal profits are made, as AR=AC, at the profit maximising level of output (MR=MC). Again this is the longrun equilibrium position as there is no incentive for firms to enter or leave the industry, this is shown in diagram the below.
O O
SL
D
(a) (a) IndustryIndustry
P £
Q (millions)
PL
(b) (b) FirmFirm
ARL
LRAC
P1 AR1
QL
S1
DL
D1
Q (thousands)
MC
MONOPOLY
Three characteristics of monopoly
• There is only one firm in the industry, the monopolist. • There are substantial barriers to entry. • The monopolist is a short run profit maximiser.
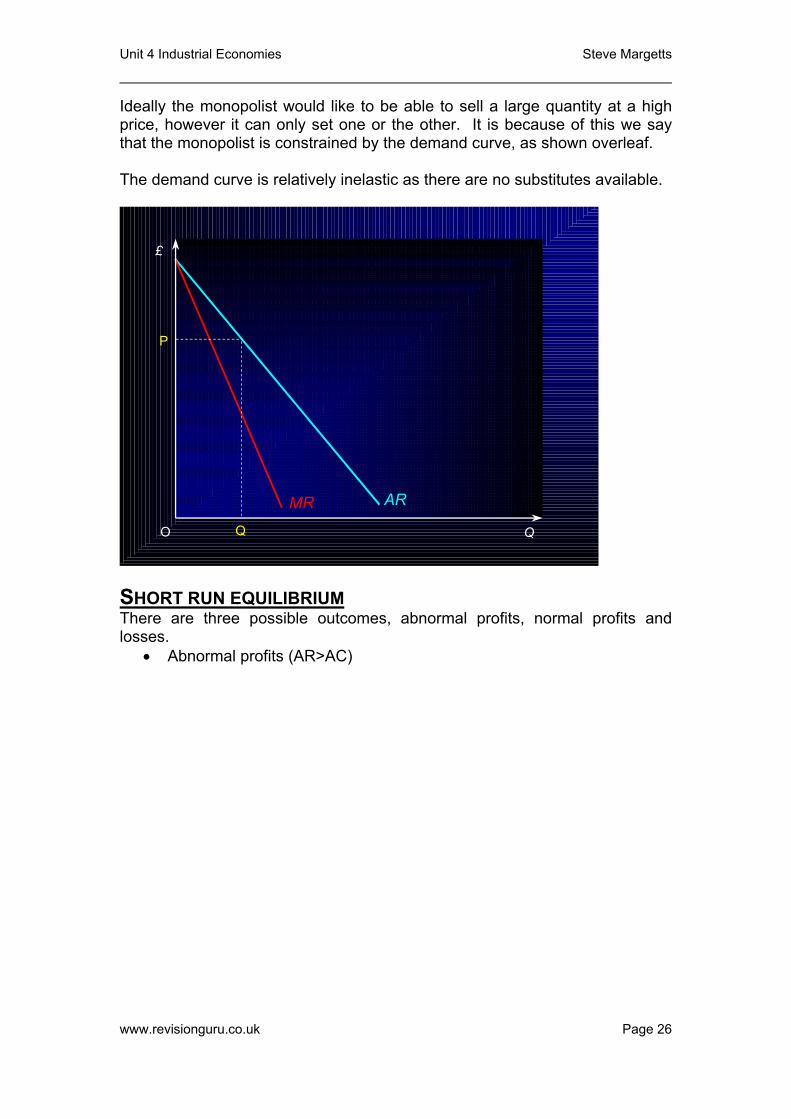
In reality the government and other agencies call firms who have more than 25% of any particular market a monopoly. Monopolies can be national (royal mail), regional (water companies) or local (petrol station). REVENUE CURVES The downward sloping demand curve for the industry must also be the demand curve for the firm. This gives the monopolist the power to be a price maker, he can set the price and then sell whatever quantity consumers are willing to buy at that price. Rather than setting the price, he can set the quantity he wishes to sell and then accept the price the market is willing to pay.
www.revisionguru.co.uk Page 25
Unit 4 Industrial Economies Steve Margetts
Ideally the monopolist would like to be able to sell a large quantity at a high price, however it can only set one or the other. It is because of this we say that the monopolist is constrained by the demand curve, as shown overleaf. The demand curve is relatively inelastic as there are no substitutes available.
£
Q O
AR
P
Q
MR
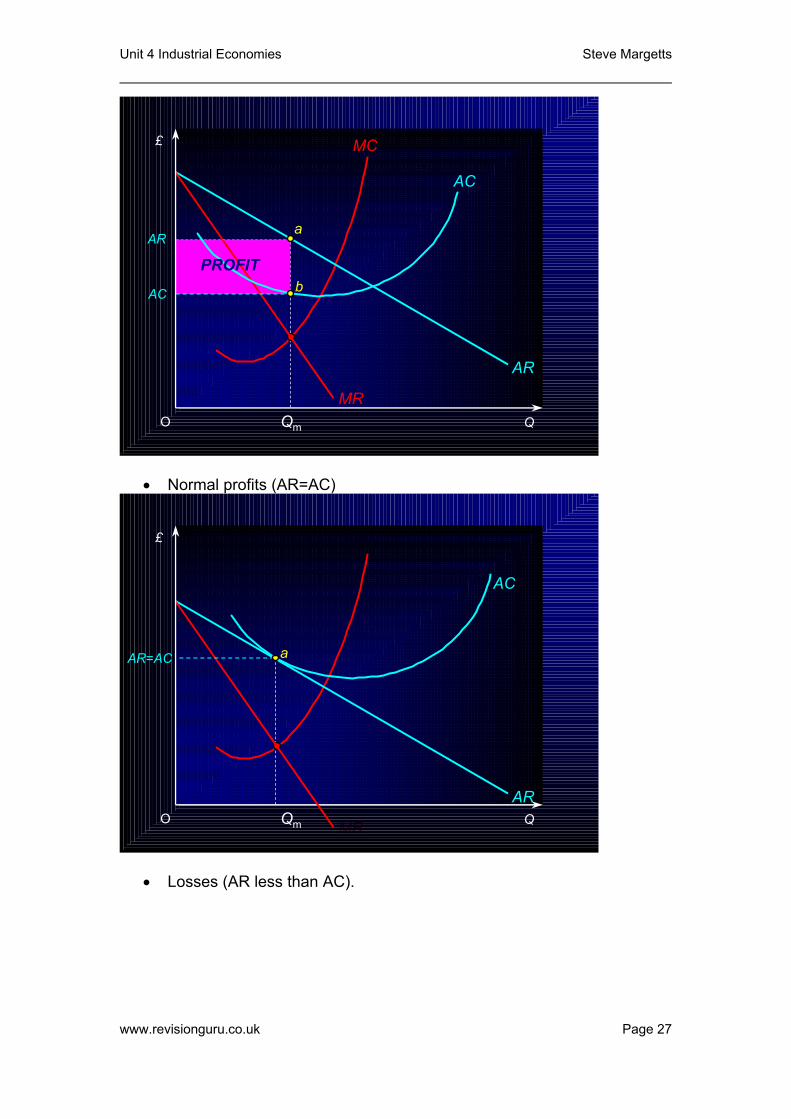
SHORT RUN EQUILIBRIUM There are three possible outcomes, abnormal profits, normal profits and losses.
• Abnormal profits (AR>AC)
www.revisionguru.co.uk Page 26
Unit 4 Industrial Economies Steve Margetts
£
Q O
AC
AR
AC
Qm
AR
a
bPROFIT
MC
MR
MC
MR
• Normal profits (AR=AC)
£
Q O
AC
AR=AC
Qm
AR
a
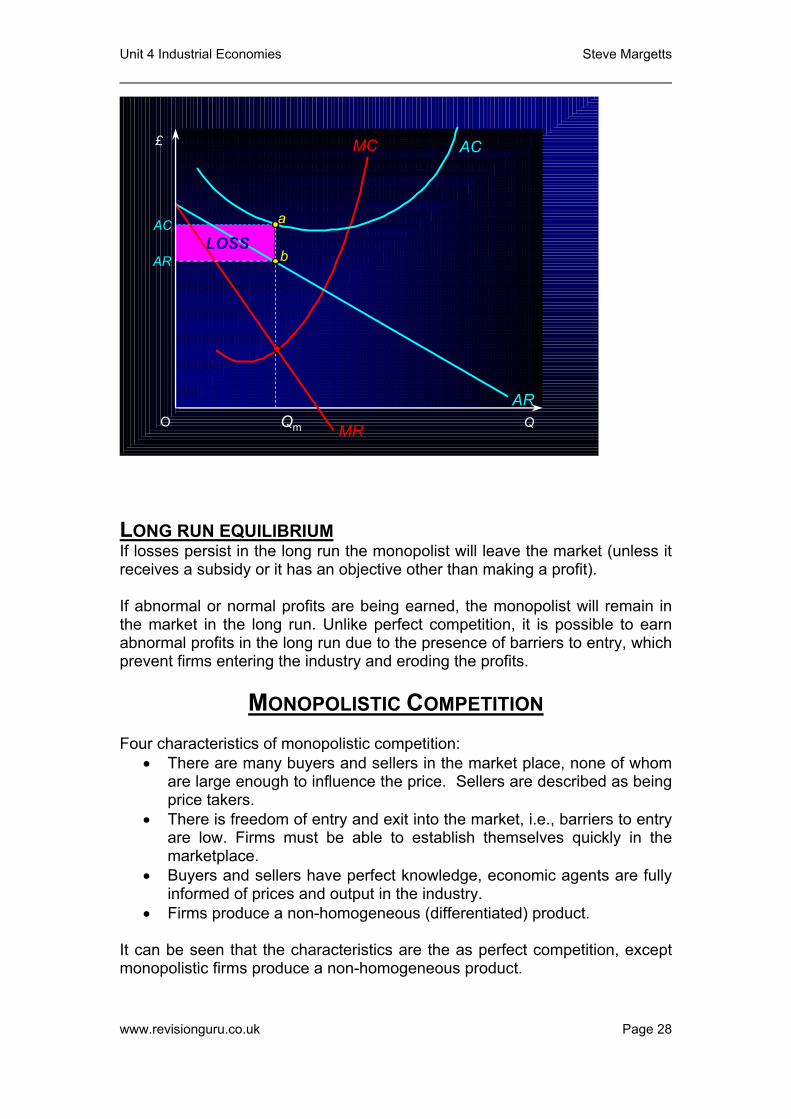
• Losses (AR less than AC).
www.revisionguru.co.uk Page 27
Unit 4 Industrial Economies Steve Margetts
£
Q O
AC
AR
AC
Qm
AR
a
bLOSS
MC
MR
LONG RUN EQUILIBRIUM If losses persist in the long run the monopolist will leave the market (unless it receives a subsidy or it has an objective other than making a profit). If abnormal or normal profits are being earned, the monopolist will remain in the market in the long run. Unlike perfect competition, it is possible to earn abnormal profits in the long run due to the presence of barriers to entry, which prevent firms entering the industry and eroding the profits.
MONOPOLISTIC COMPETITION Four characteristics of monopolistic competition:
• There are many buyers and sellers in the market place, none of whom are large enough to influence the price. Sellers are described as being price takers.
• There is freedom of entry and exit into the market, i.e., barriers to entry are low. Firms must be able to establish themselves quickly in the marketplace.
• Buyers and sellers have perfect knowledge, economic agents are fully informed of prices and output in the industry.
• Firms produce a non-homogeneous (differentiated) product. It can be seen that the characteristics are the as perfect competition, except monopolistic firms produce a non-homogeneous product.
www.revisionguru.co.uk Page 28
Unit 4 Industrial Economies Steve Margetts
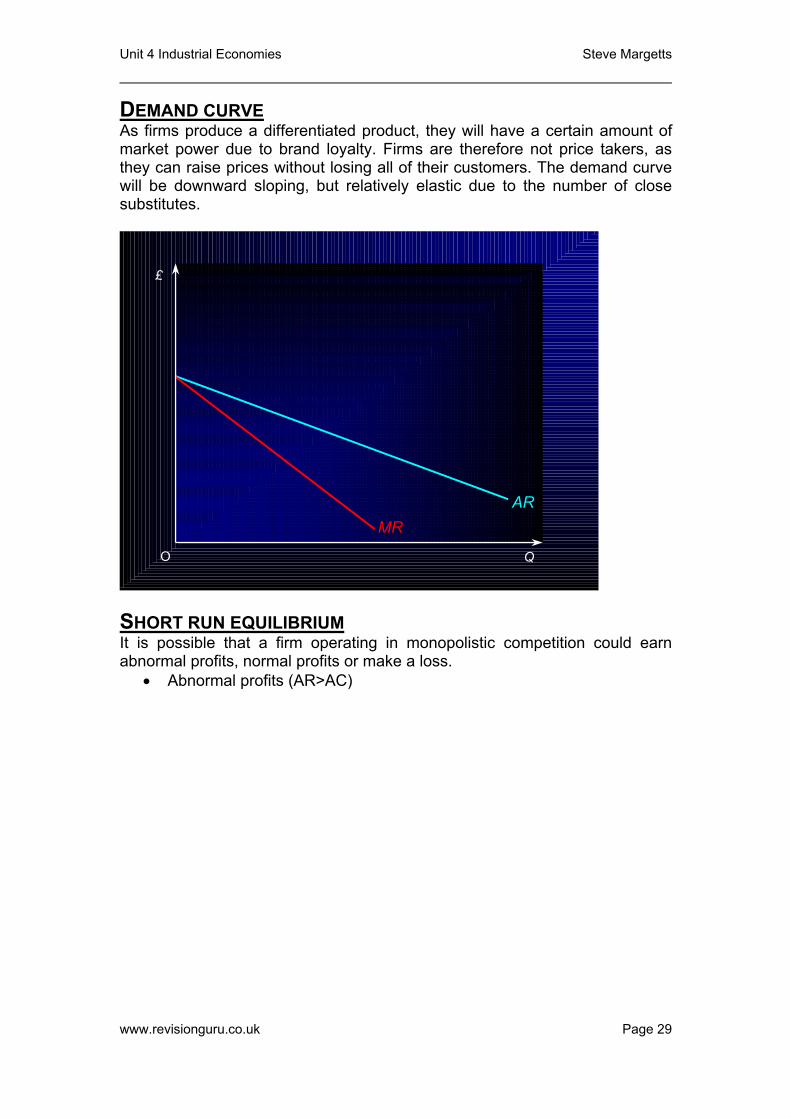
DEMAND CURVE As firms produce a differentiated product, they will have a certain amount of market power due to brand loyalty. Firms are therefore not price takers, as they can raise prices without losing all of their customers. The demand curve will be downward sloping, but relatively elastic due to the number of close substitutes.
£
Q O
AR
MR
SHORT RUN EQUILIBRIUM It is possible that a firm operating in monopolistic competition could earn abnormal profits, normal profits or make a loss.
• Abnormal profits (AR>AC)
www.revisionguru.co.uk Page 29

Unit 4 Industrial Economies Steve Margetts
£
Q O
AC
AR
AC
Qm
AR
a
bPROFIT
MC
MR
MC
MR
• Normal profits (AR=AC)
£
Q O
AC
AR=AC
Qm
AR
a
• Losses (AR less than AC).
www.revisionguru.co.uk Page 30
Unit 4 Industrial Economies Steve Margetts
£
Q O
AC
AR
AC
Qm
AR
a
bLOSS
MC
MR
MC
MR
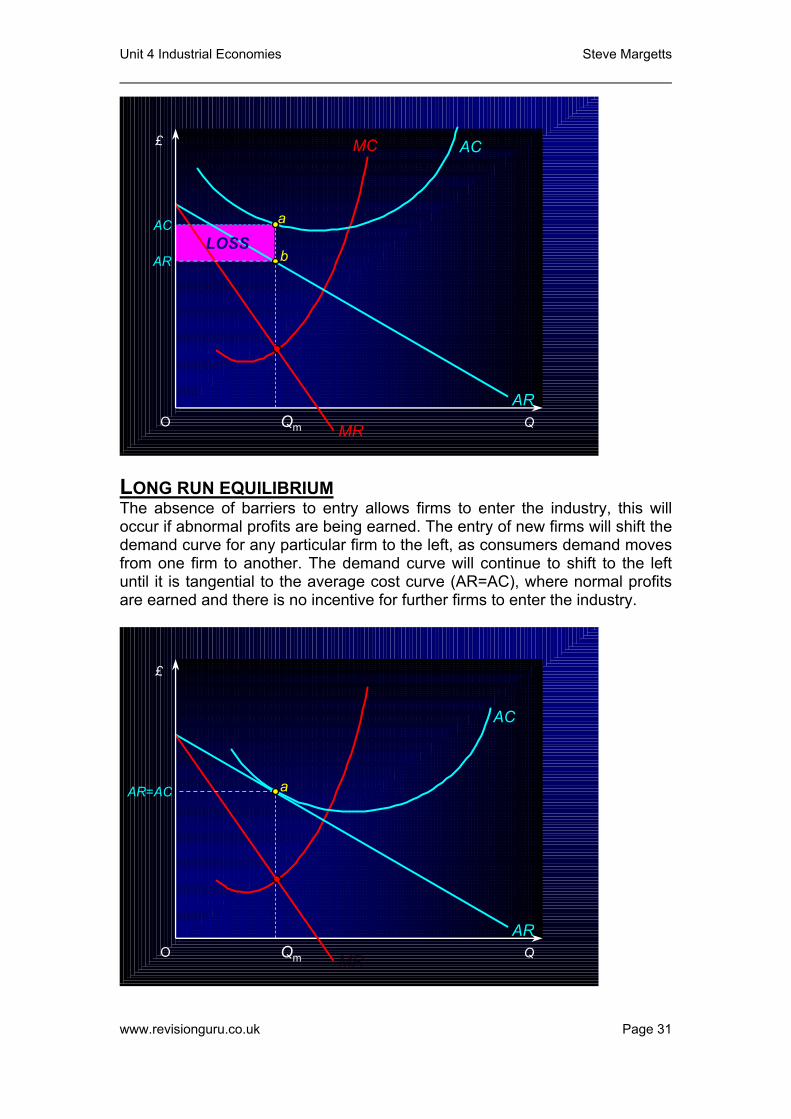
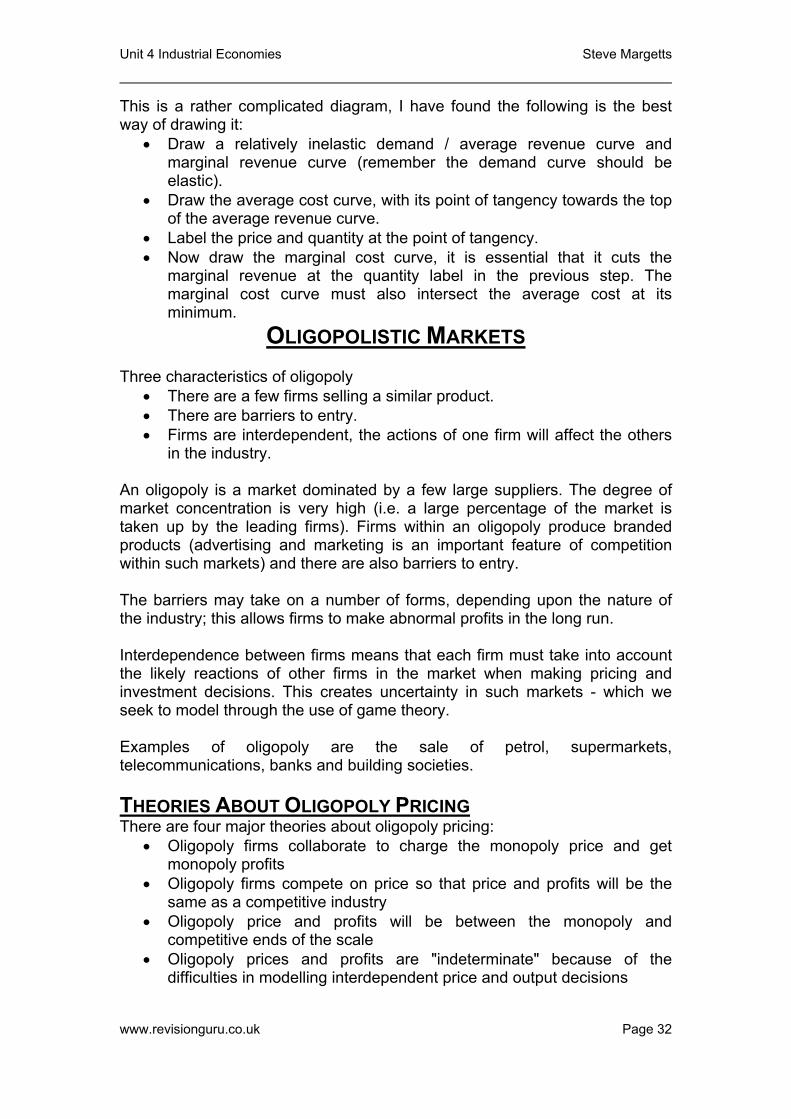
LONG RUN EQUILIBRIUM The absence of barriers to entry allows firms to enter the industry, this will occur if abnormal profits are being earned. The entry of new firms will shift the demand curve for any particular firm to the left, as consumers demand moves from one firm to another. The demand curve will continue to shift to the left until it is tangential to the average cost curve (AR=AC), where normal profits are earned and there is no incentive for further firms to enter the industry.
£
Q O
AC
AR=AC
Qm
AR
a
www.revisionguru.co.uk Page 31
Unit 4 Industrial Economies Steve Margetts
This is a rather complicated diagram, I have found the following is the best way of drawing it:
• Draw a relatively inelastic demand / average revenue curve and marginal revenue curve (remember the demand curve should be elastic).
• Draw the average cost curve, with its point of tangency towards the top of the average revenue curve.
• Label the price and quantity at the point of tangency. • Now draw the marginal cost curve, it is essential that it cuts the
marginal revenue at the quantity label in the previous step. The marginal cost curve must also intersect the average cost at its minimum.
OLIGOPOLISTIC MARKETS Three characteristics of oligopoly
• There are a few firms selling a similar product. • There are barriers to entry. • Firms are interdependent, the actions of one firm will affect the others
in the industry. An oligopoly is a market dominated by a few large suppliers. The degree of market concentration is very high (i.e. a large percentage of the market is taken up by the leading firms). Firms within an oligopoly produce branded products (advertising and marketing is an important feature of competition within such markets) and there are also barriers to entry. The barriers may take on a number of forms, depending upon the nature of the industry; this allows firms to make abnormal profits in the long run. Interdependence between firms means that each firm must take into account the likely reactions of other firms in the market when making pricing and investment decisions. This creates uncertainty in such markets - which we seek to model through the use of game theory. Examples of oligopoly are the sale of petrol, supermarkets, telecommunications, banks and building societies. THEORIES ABOUT OLIGOPOLY PRICING There are four major theories about oligopoly pricing:
• Oligopoly firms collaborate to charge the monopoly price and get monopoly profits
• Oligopoly firms compete on price so that price and profits will be the same as a competitive industry
• Oligopoly price and profits will be between the monopoly and competitive ends of the scale
• Oligopoly prices and profits are "indeterminate" because of the difficulties in modelling interdependent price and output decisions
www.revisionguru.co.uk Page 32
Unit 4 Industrial Economies Steve Margetts
• When one firm has a dominant position in the market the oligopoly may
experience price leadership. The firms with lower market shares may simply follow the pricing changes prompted by the dominant firms. We see examples of this with the major mortgage lenders and petrol retailers.
THE IMPORTANCE OF PRICE AND NON-PRICE COMPETITION Firms compete for market share and the demand from consumers in lots of ways. We make an important distinction between price competition and non-price competition. Price competition can involve discounting the price of a product (or a range of products) to increase demand. Non-price competition focuses on other strategies for increasing market share. Consider the example of the highly competitive UK supermarket industry where non-price competition has become very important in the battle for sales
• Mass media advertising and marketing • Store Loyalty cards • Banking and other Financial Services (including travel insurance) • In-store chemists / post offices / creches • Home delivery systems • Discounted petrol at hyper-markets • Extension of opening hours (24 hour shopping in many stores) • Innovative use of technology for shoppers including self-scanning
machines • Financial incentives to shop at off-peak times • Internet shopping for customers
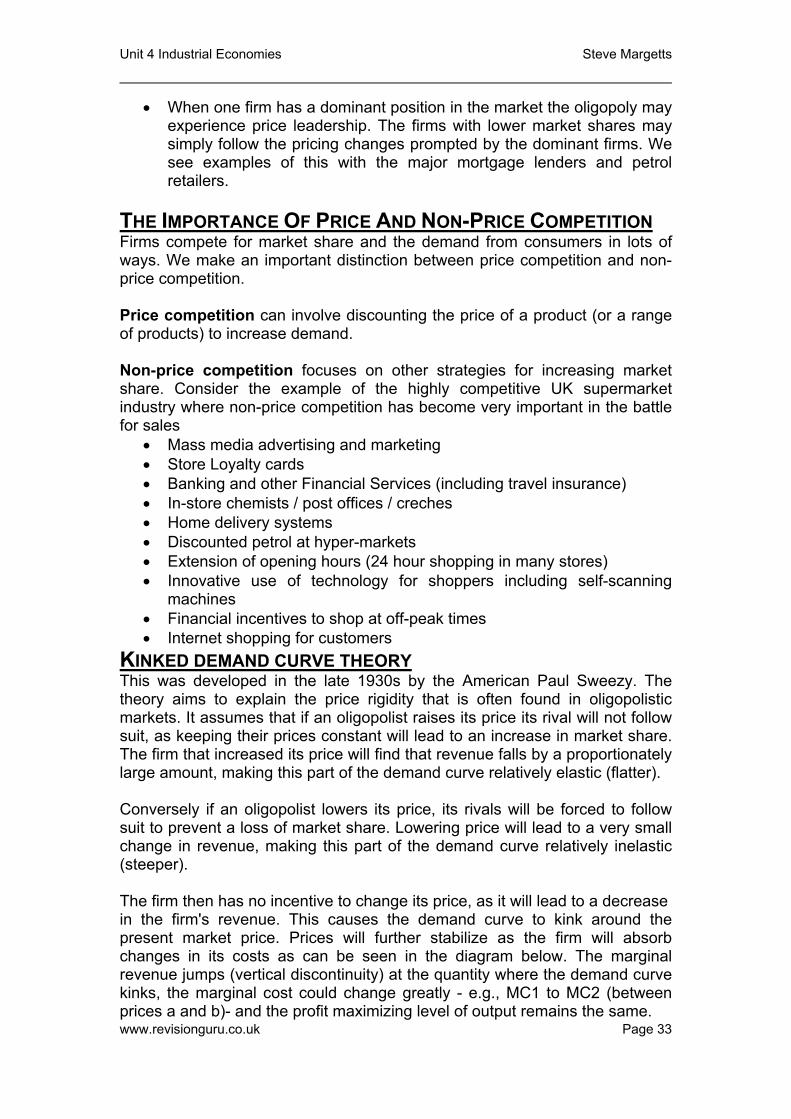
KINKED DEMAND CURVE THEORY This was developed in the late 1930s by the American Paul Sweezy. The theory aims to explain the price rigidity that is often found in oligopolistic markets. It assumes that if an oligopolist raises its price its rival will not follow suit, as keeping their prices constant will lead to an increase in market share. The firm that increased its price will find that revenue falls by a proportionately large amount, making this part of the demand curve relatively elastic (flatter). Conversely if an oligopolist lowers its price, its rivals will be forced to follow suit to prevent a loss of market share. Lowering price will lead to a very small change in revenue, making this part of the demand curve relatively inelastic (steeper). The firm then has no incentive to change its price, as it will lead to a decrease
www.revisionguru.co.uk Page 33
in the firm's revenue. This causes the demand curve to kink around the present market price. Prices will further stabilize as the firm will absorb changes in its costs as can be seen in the diagram below. The marginal revenue jumps (vertical discontinuity) at the quantity where the demand curve kinks, the marginal cost could change greatly - e.g., MC1 to MC2 (between prices a and b)- and the profit maximizing level of output remains the same.
Unit 4 Industrial Economies Steve Margetts
£
QO
P1
Q1
MC2
MC1
D = AR
MR
a
b
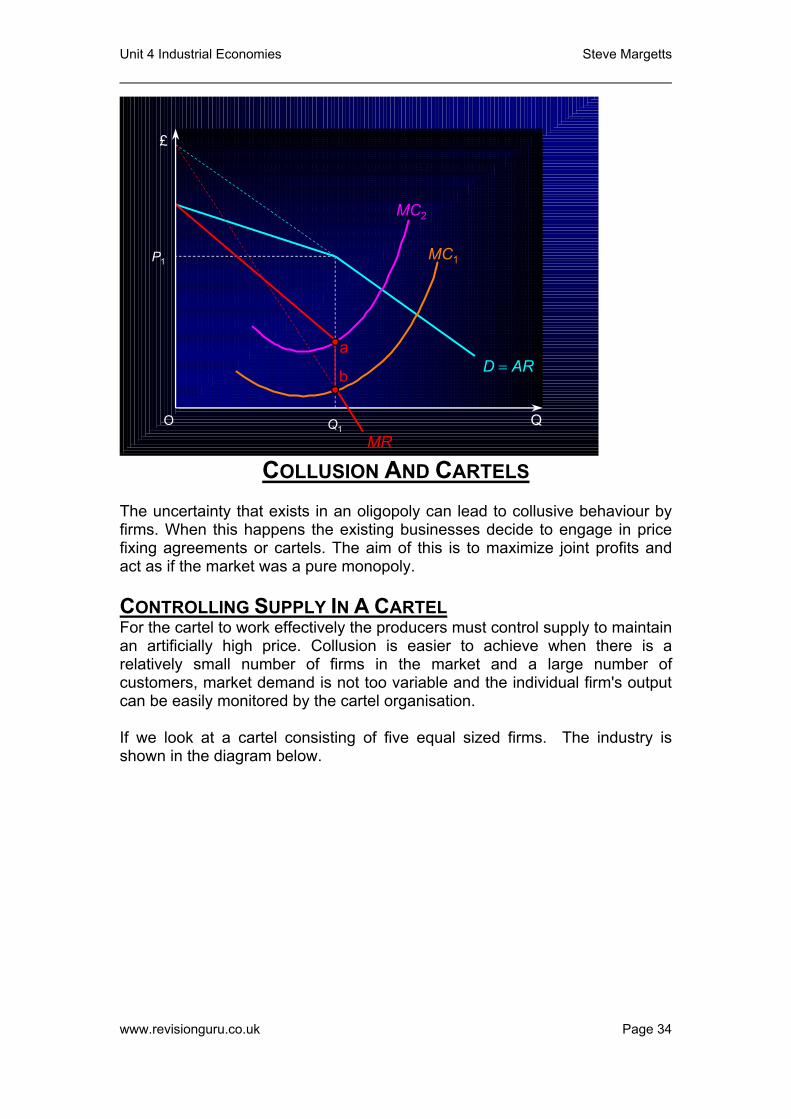
COLLUSION AND CARTELS The uncertainty that exists in an oligopoly can lead to collusive behaviour by firms. When this happens the existing businesses decide to engage in price fixing agreements or cartels. The aim of this is to maximize joint profits and act as if the market was a pure monopoly. CONTROLLING SUPPLY IN A CARTEL For the cartel to work effectively the producers must control supply to maintain an artificially high price. Collusion is easier to achieve when there is a relatively small number of firms in the market and a large number of customers, market demand is not too variable and the individual firm's output can be easily monitored by the cartel organisation. If we look at a cartel consisting of five equal sized firms. The industry is shown in the diagram below.
www.revisionguru.co.uk Page 34
Unit 4 Industrial Economies Steve Margetts
2
4
6
12
MC
AR
MR
£
QThe IndustryThe Industry
2000 3000
£10 is the cartel’sprofit-maximising price
8
0
10
1000
200
Cartel PriceCartel Price(= (= MRMR if price remains fixed)if price remains fixed)
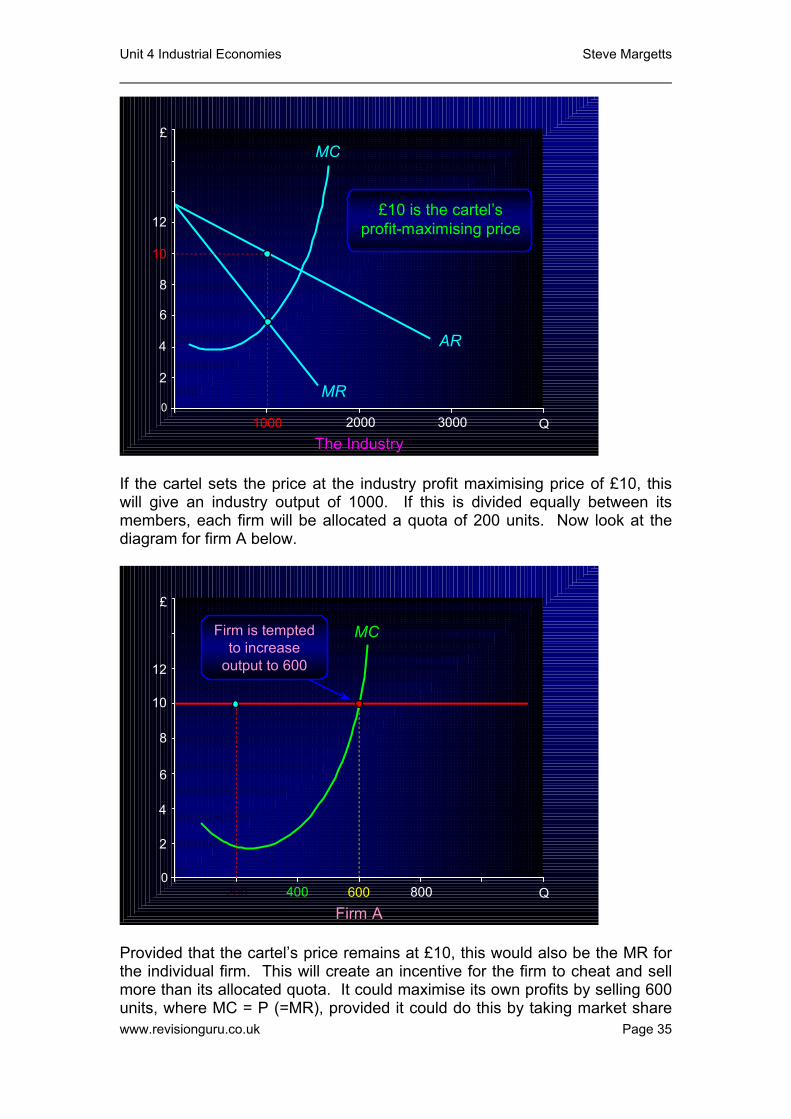
If the cartel sets the price at the industry profit maximising price of £10, this will give an industry output of 1000. If this is divided equally between its members, each firm will be allocated a quota of 200 units. Now look at the diagram for firm A below.
0
2
4
6
8
10
12
400 600
MC
£
QFirm AFirm A
800
Firm is temptedto increase
output to 600
Provided that the cartel’s price remains at £10, this would also be the MR for the individual firm. This will create an incentive for the firm to cheat and sell more than its allocated quota. It could maximise its own profits by selling 600 units, where MC = P (=MR), provided it could do this by taking market share www.revisionguru.co.uk Page 35
Unit 4 Industrial Economies Steve Margetts
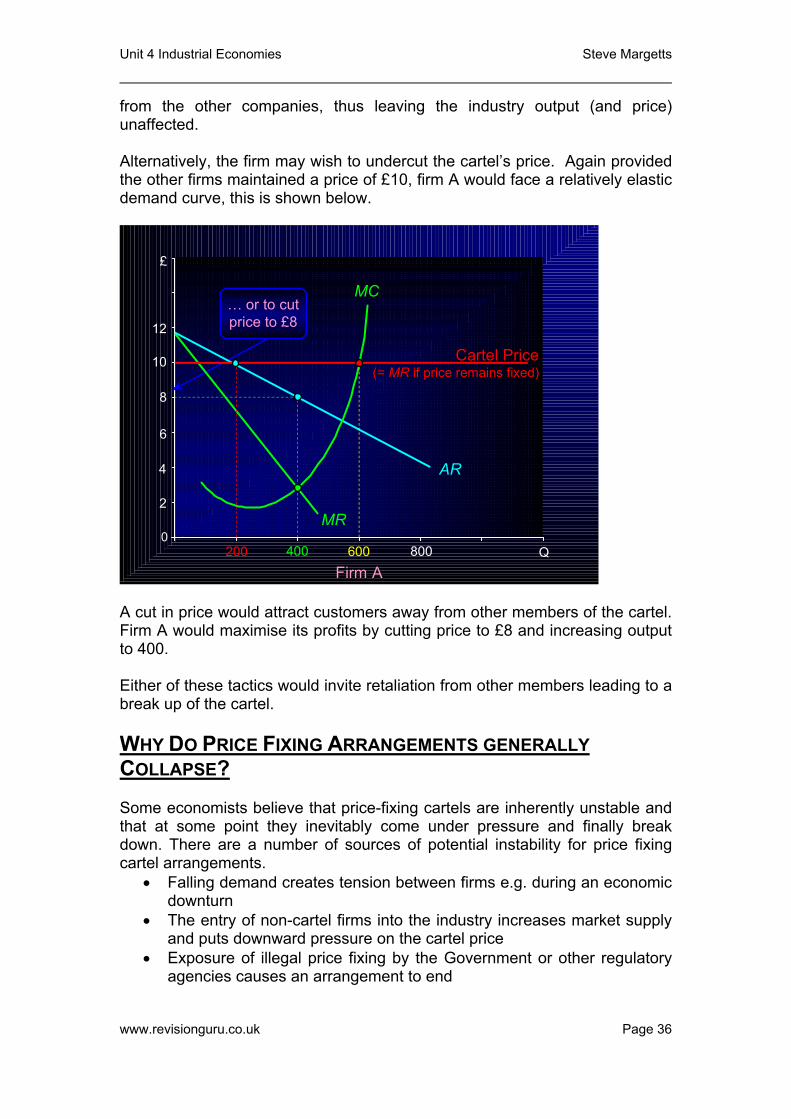
from the other companies, thus leaving the industry output (and price) unaffected. Alternatively, the firm may wish to undercut the cartel’s price. Again provided the other firms maintained a price of £10, firm A would face a relatively elastic demand curve, this is shown below.
0
2
4
6
8
10
12
400 600
MC
AR
MR
£
QFirm AFirm A
800
… or to cutprice to £8
200
Cartel PriceCartel Price(= (= MRMR if price remains fixed)if price remains fixed)
A cut in price would attract customers away from other members of the cartel. Firm A would maximise its profits by cutting price to £8 and increasing output to 400. Either of these tactics would invite retaliation from other members leading to a break up of the cartel. WHY DO PRICE FIXING ARRANGEMENTS GENERALLY COLLAPSE? Some economists believe that price-fixing cartels are inherently unstable and that at some point they inevitably come under pressure and finally break down. There are a number of sources of potential instability for price fixing cartel arrangements.
• Falling demand creates tension between firms e.g. during an economic downturn
• The entry of non-cartel firms into the industry increases market supply and puts downward pressure on the cartel price
• Exposure of illegal price fixing by the Government or other regulatory agencies causes an arrangement to end
www.revisionguru.co.uk Page 36
Unit 4 Industrial Economies Steve Margetts
• Over-production and excess supply by cartel members breaks the price
fixing • The Prisoners’ Dilemma game suggests that all collusive agreements
tend to fall eventually because although price fixing is in the joint interests of all members of a cartel, it is not a profit maximising equilibrium for each individual firm
ECONOMIC EFFICIENCY
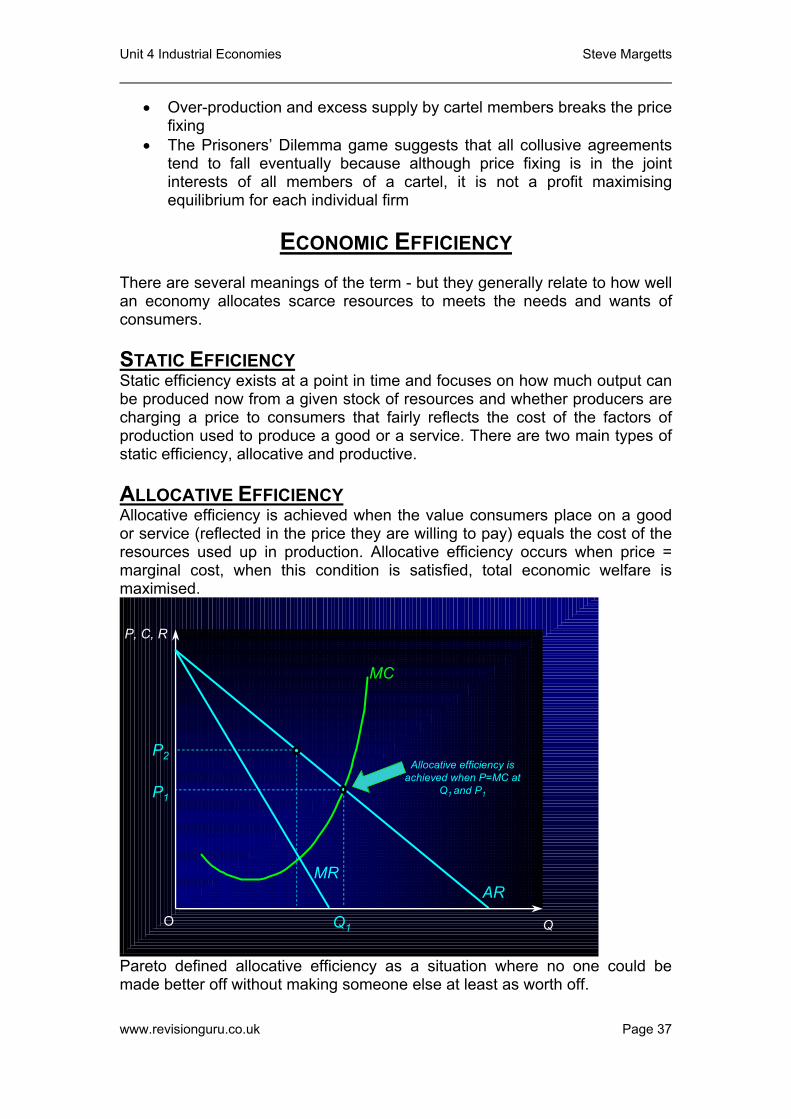
There are several meanings of the term - but they generally relate to how well an economy allocates scarce resources to meets the needs and wants of consumers. STATIC EFFICIENCY Static efficiency exists at a point in time and focuses on how much output can be produced now from a given stock of resources and whether producers are charging a price to consumers that fairly reflects the cost of the factors of production used to produce a good or a service. There are two main types of static efficiency, allocative and productive. ALLOCATIVE EFFICIENCY Allocative efficiency is achieved when the value consumers place on a good or service (reflected in the price they are willing to pay) equals the cost of the resources used up in production. Allocative efficiency occurs when price = marginal cost, when this condition is satisfied, total economic welfare is maximised.
P, C, R
QO
AR
MC
MR
Allocative efficiency is achieved when P=MC at
Q1 and P1
Q1
P2
P1
Pareto defined allocative efficiency as a situation where no one could be made better off without making someone else at least as worth off. www.revisionguru.co.uk Page 37
Unit 4 Industrial Economies Steve Margetts
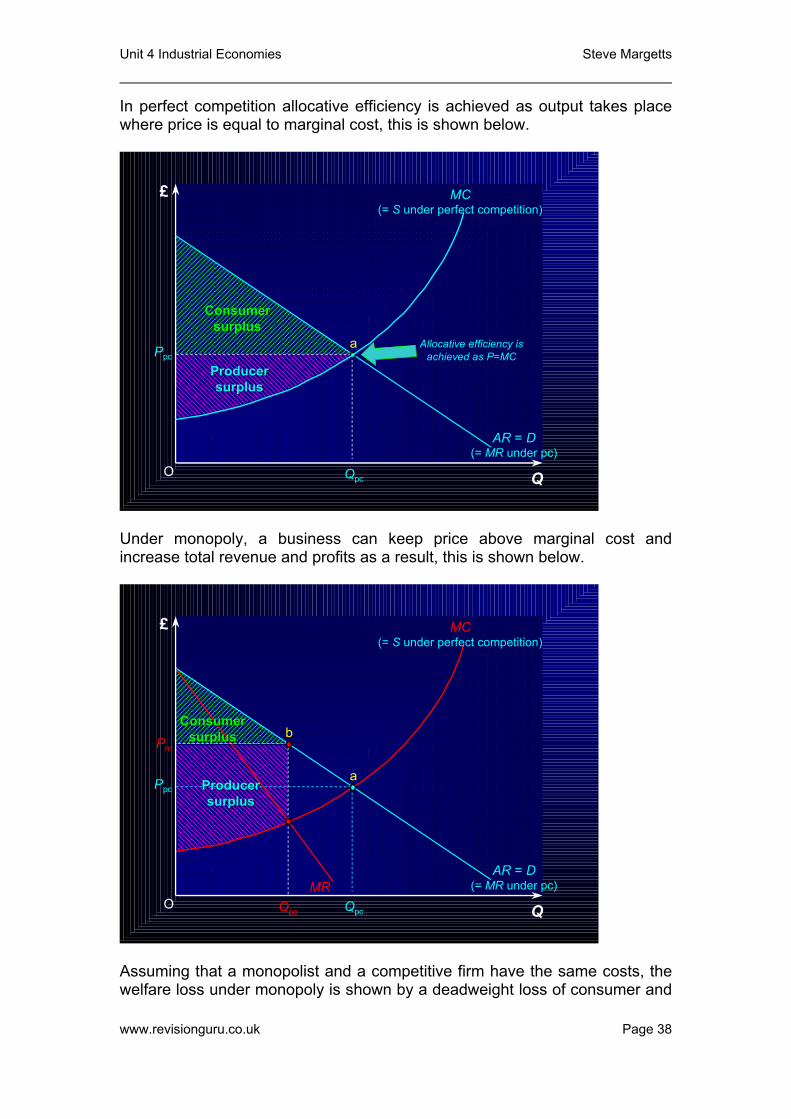
In perfect competition allocative efficiency is achieved as output takes place where price is equal to marginal cost, this is shown below.
��������������������������������������������������������������������������������������������������������������������������������������������������������������������������������������������������������������������������������������������������������������������������������������������������������������������������������������������������������������
���������������������������������������������������������������������������������������������������������������������������������������������������������������������������������������������������������������������������������������������������������������������������������������������������������������������������������������������������������������������������������������������������������������������������������������������������������������������������������������������������������������������������������������������������������������������������������������������������������������������������������������������������������������
O
£
Q
Ppc
Qpc
MC(= S under perfect competition)
ConsumerConsumersurplussurplus
ProducerProducersurplussurplus
a
AR = D(= MR under pc)
Allocative efficiency is achieved as P=MC
Under monopoly, a business can keep price above marginal cost and increase total revenue and profits as a result, this is shown below.
������������������������������������������������������������������������������������������������������������������������������������������������������������������������������������������������������������������������������������������������������������������������������������������������������������������������������������������������������������������������
������������������������������������������������������������������������������������������������������������������������������������������������������������������������������������������������������������������������������������������������������������������������������
O
£
Q
Ppc
Qpc
(= S under perfect competition)
a
bConsumerConsumer
surplussurplus
ProducerProducersurplussurplus
AR = D(= MR under pc)
MC
Pm
Qpc
MR
Assuming that a monopolist and a competitive firm have the same costs, the welfare loss under monopoly is shown by a deadweight loss of consumer and
www.revisionguru.co.uk Page 38
Unit 4 Industrial Economies Steve Margetts
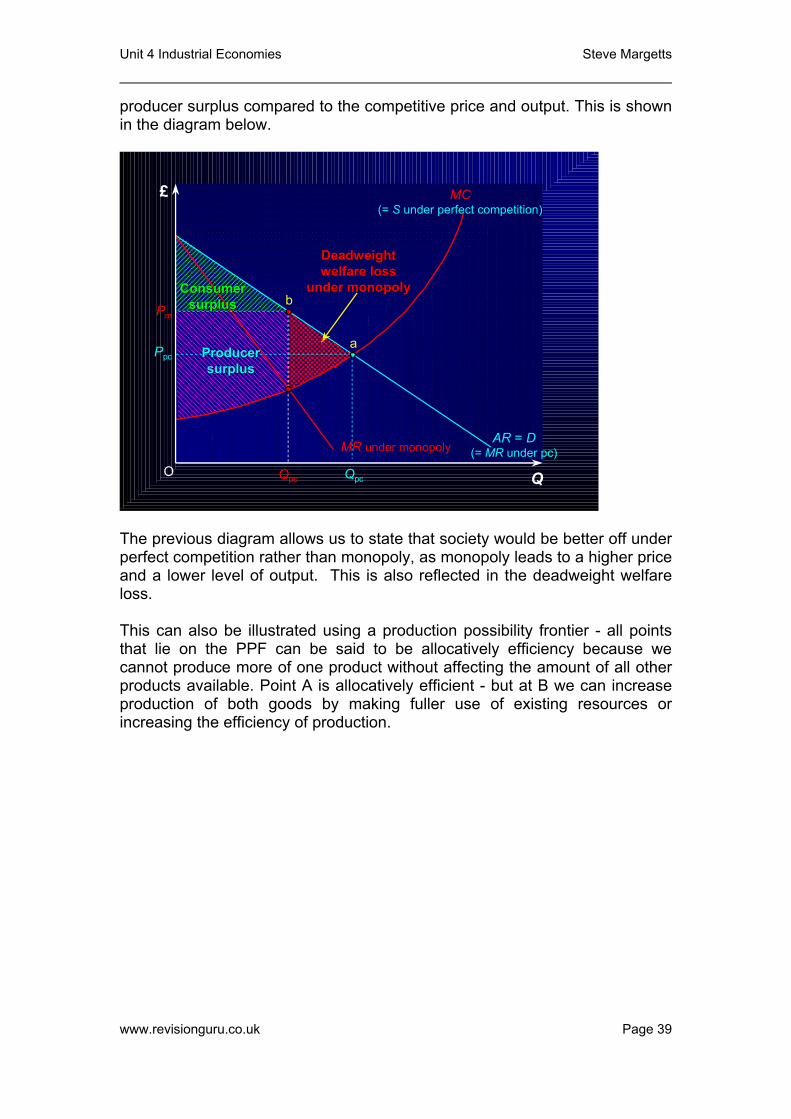
producer surplus compared to the competitive price and output. This is shown in the diagram below.
��������������������������������� �����������������������������������������������������������������������������������
������������������������������������������������������������������������������������������������������������������������������������������������������������������������������������������������������������������������������������������������������������������������������������������������������������������������������������������������������������������������
������������������������������������������������������������������������������������������������������������������������������������������������������������������������������������������������������������������������������������������������������������������������������
O
£
Q
Ppc
Qpc
(= S under perfect competition)
a
bConsumerConsumer
surplussurplus
ProducerProducersurplussurplus
AR = D(= MR under pc)
�����������������������
�����������������������
MC
Pm
Qpc
DeadweightDeadweightwelfare losswelfare loss
under monopolyunder monopoly
MR under monopoly
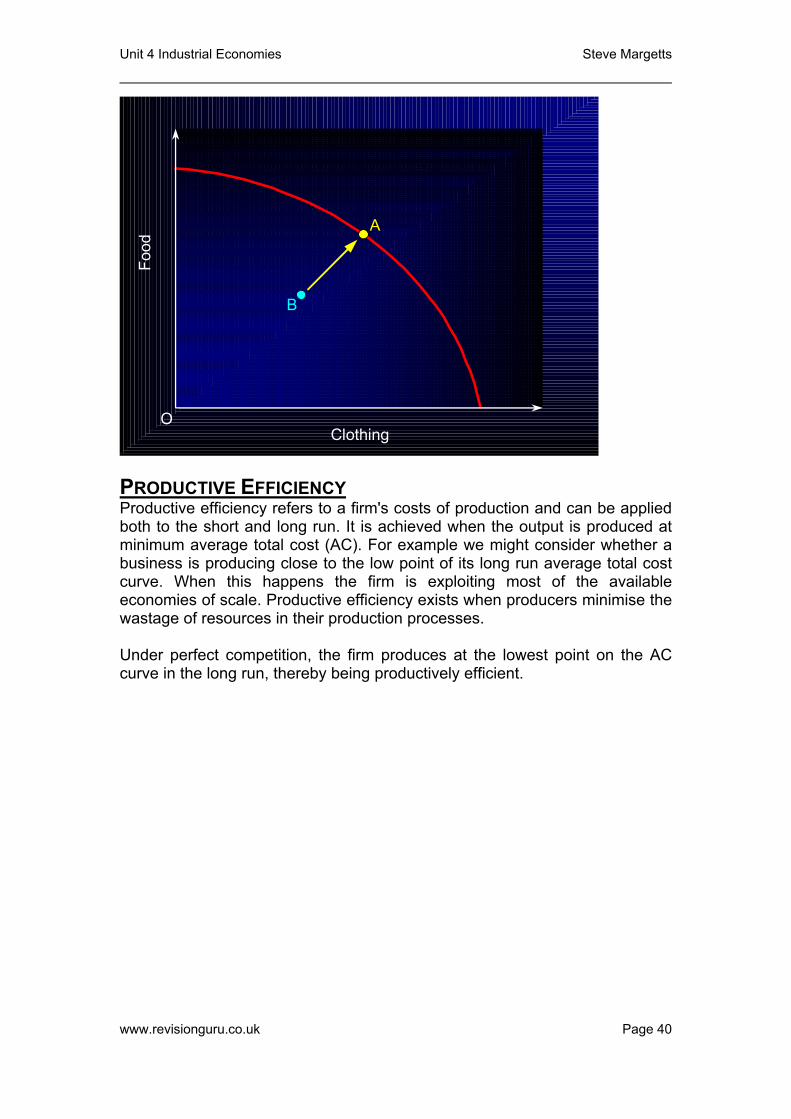
The previous diagram allows us to state that society would be better off under perfect competition rather than monopoly, as monopoly leads to a higher price and a lower level of output. This is also reflected in the deadweight welfare loss. This can also be illustrated using a production possibility frontier - all points that lie on the PPF can be said to be allocatively efficiency because we cannot produce more of one product without affecting the amount of all other products available. Point A is allocatively efficient - but at B we can increase production of both goods by making fuller use of existing resources or increasing the efficiency of production.
www.revisionguru.co.uk Page 39
Unit 4 Industrial Economies Steve Margetts
B
A
O
Food
Clothing
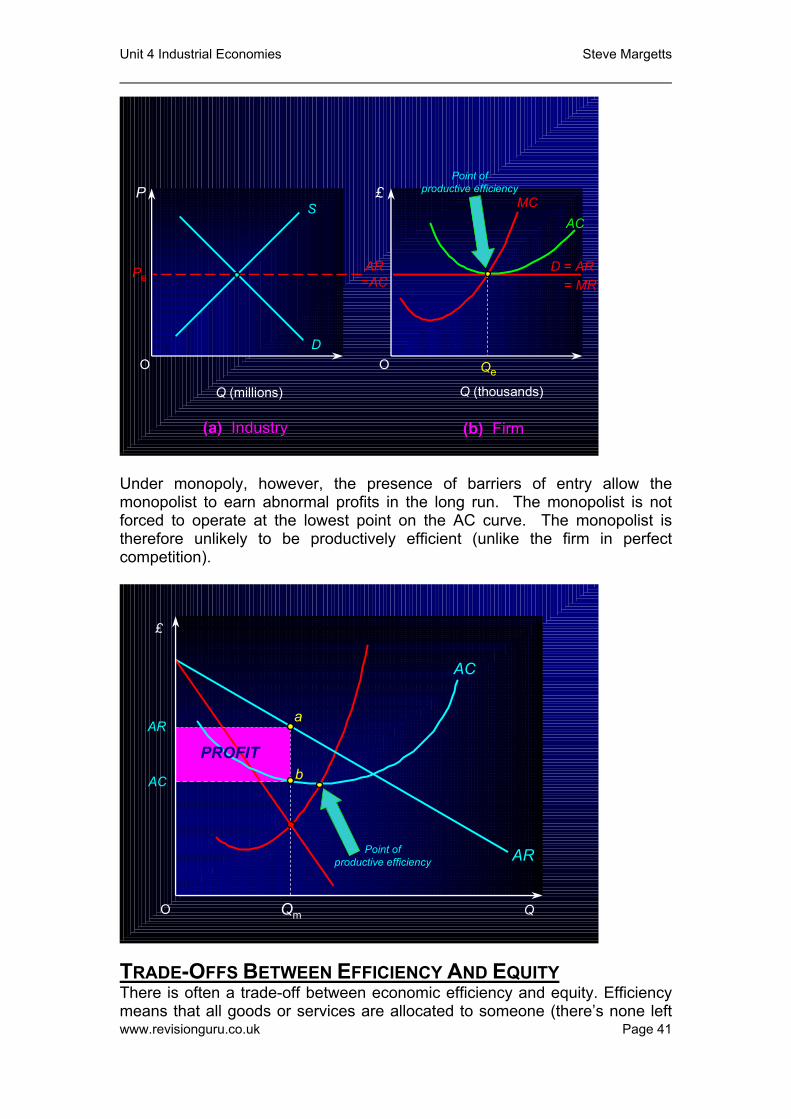
PRODUCTIVE EFFICIENCY Productive efficiency refers to a firm's costs of production and can be applied both to the short and long run. It is achieved when the output is produced at minimum average total cost (AC). For example we might consider whether a business is producing close to the low point of its long run average total cost curve. When this happens the firm is exploiting most of the available economies of scale. Productive efficiency exists when producers minimise the wastage of resources in their production processes. Under perfect competition, the firm produces at the lowest point on the AC curve in the long run, thereby being productively efficient.
www.revisionguru.co.uk Page 40
Unit 4 Industrial Economies Steve Margetts
O O
S
D
(a) (a) IndustryIndustry
P £
Q (millions)
(b) (b) FirmFirm
Qe
AC
Q (thousands)
Point of productive efficiency
PeAR
=ACD = AR
= MR
MC
MC
MR
Under monopoly, however, the presence of barriers of entry allow the monopolist to earn abnormal profits in the long run. The monopolist is not forced to operate at the lowest point on the AC curve. The monopolist is therefore unlikely to be productively efficient (unlike the firm in perfect competition).
£
Q O
AC
AR
AC
Qm
AR
a
bPROFIT
Point of productive efficiency
TRADE-OFFS BETWEEN EFFICIENCY AND EQUITY
www.revisionguru.co.uk Page 41
There is often a trade-off between economic efficiency and equity. Efficiency means that all goods or services are allocated to someone (there’s none left
Unit 4 Industrial Economies Steve Margetts
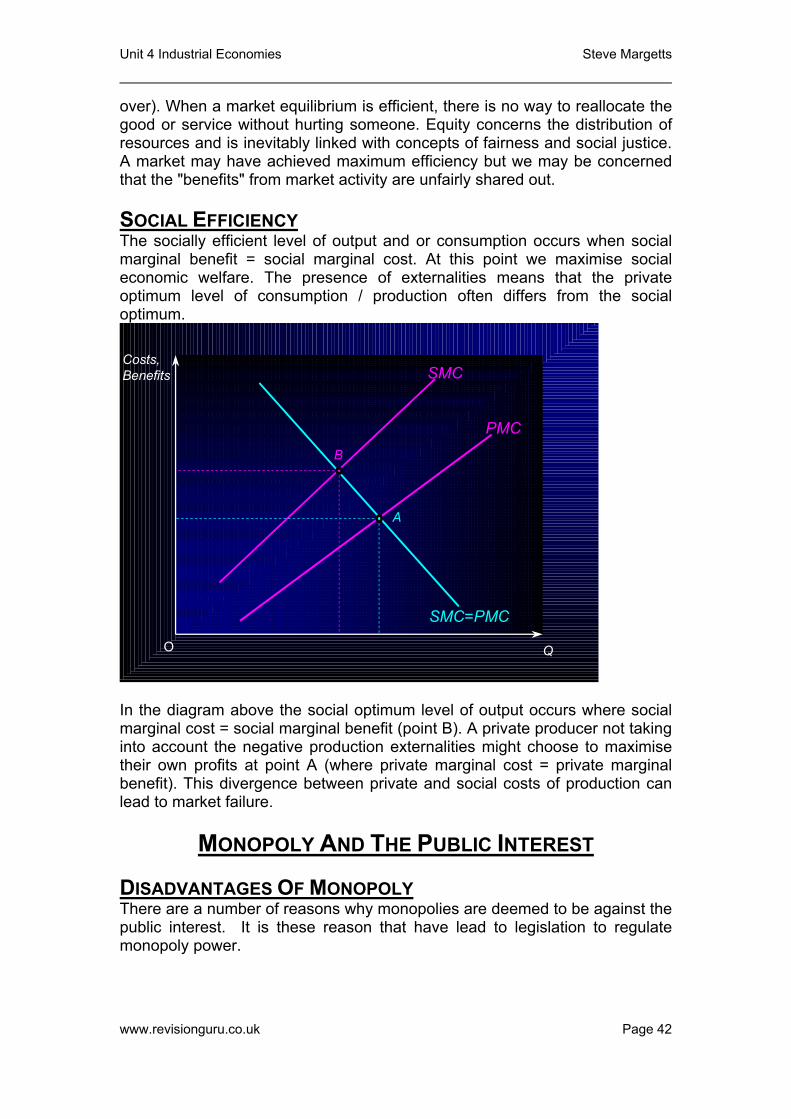
over). When a market equilibrium is efficient, there is no way to reallocate the good or service without hurting someone. Equity concerns the distribution of resources and is inevitably linked with concepts of fairness and social justice. A market may have achieved maximum efficiency but we may be concerned that the "benefits" from market activity are unfairly shared out. SOCIAL EFFICIENCY The socially efficient level of output and or consumption occurs when social marginal benefit = social marginal cost. At this point we maximise social economic welfare. The presence of externalities means that the private optimum level of consumption / production often differs from the social optimum.
Costs, Benefits
QO
SMC=PMC
SMC
A
B
PMC
In the diagram above the social optimum level of output occurs where social marginal cost = social marginal benefit (point B). A private producer not taking into account the negative production externalities might choose to maximise their own profits at point A (where private marginal cost = private marginal benefit). This divergence between private and social costs of production can lead to market failure.
MONOPOLY AND THE PUBLIC INTEREST DISADVANTAGES OF MONOPOLY There are a number of reasons why monopolies are deemed to be against the public interest. It is these reason that have lead to legislation to regulate monopoly power.
www.revisionguru.co.uk Page 42
Unit 4 Industrial Economies Steve Margetts
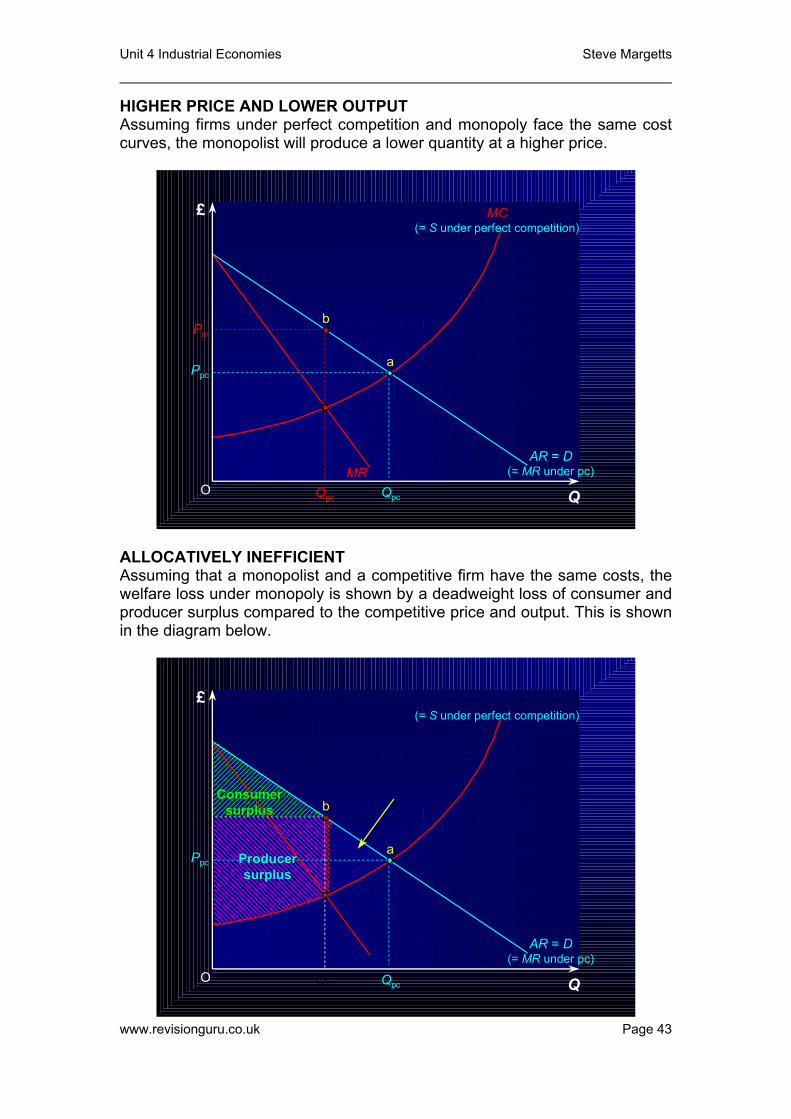
HIGHER PRICE AND LOWER OUTPUT Assuming firms under perfect competition and monopoly face the same cost curves, the monopolist will produce a lower quantity at a higher price.
O
£
Q
Ppc
Qpc
(= S under perfect competition)
a
b
AR = D(= MR under pc)
MC
Pm
Qpc
MR
����������������������������������������������������������������������������������������������������������������������������������������������
MC
Pm
Qpc
DeadweightDeadweightwelfare losswelfare loss
under monopolyunder monopoly
MR under monopoly
ALLOCATIVELY INEFFICIENT Assuming that a monopolist and a competitive firm have the same costs, the welfare loss under monopoly is shown by a deadweight loss of consumer and producer surplus compared to the competitive price and output. This is shown in the diagram below.
www.revisionguru.co.uk Page 43
������� �������
������������������������������������������������������������������������������������������������������������������������������������������������������������������������������������������������������������������������������������������������������������������������������������������������������������������������������������������������������������������������
������������������������������������������������������������������������������������������������������������������������������������������������������������������������������������������������������������������������������������������������������������������������������
O
£
Q
Ppc
Qpc
(= S under perfect competition)
a
bConsumerConsumer
surplussurplus
ProducerProducersurplussurplus
AR = D(= MR under pc)
Unit 4 Industrial Economies Steve Margetts
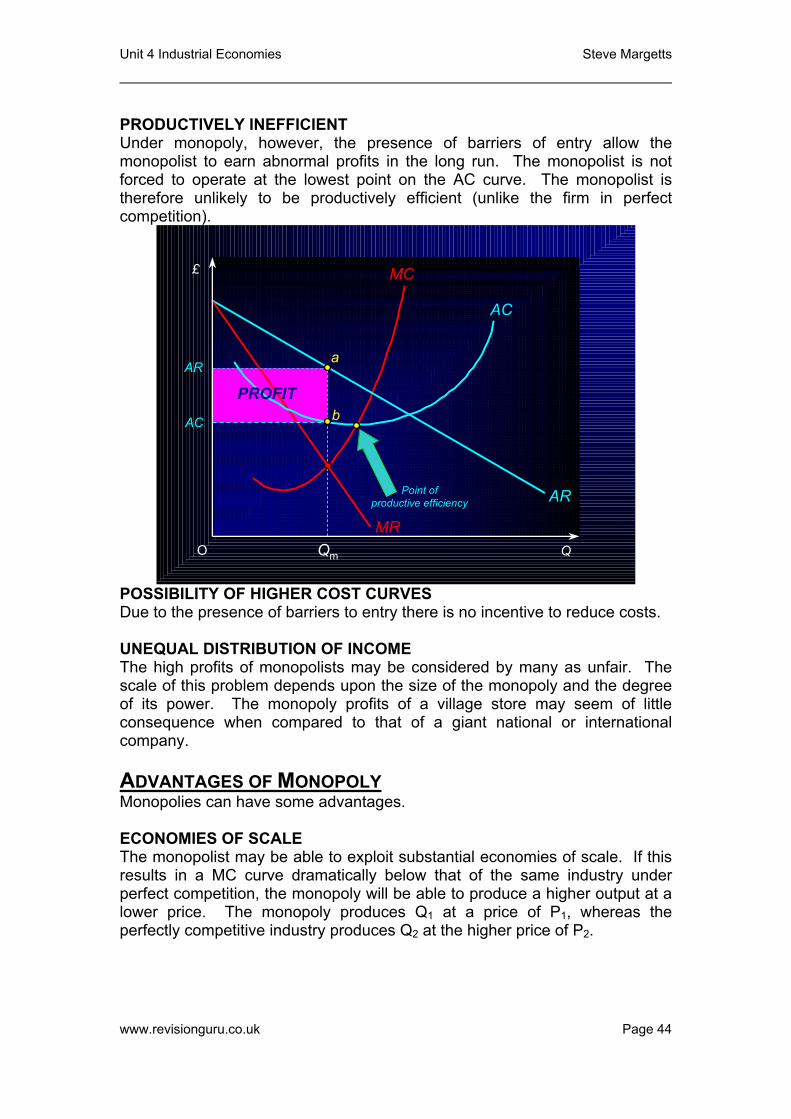
PRODUCTIVELY INEFFICIENT Under monopoly, however, the presence of barriers of entry allow the monopolist to earn abnormal profits in the long run. The monopolist is not forced to operate at the lowest point on the AC curve. The monopolist is therefore unlikely to be productively efficient (unlike the firm in perfect competition).
£
Q O
AC
AR
AC
Qm
AR
a
bPROFIT
Point of productive efficiency
MC
MR
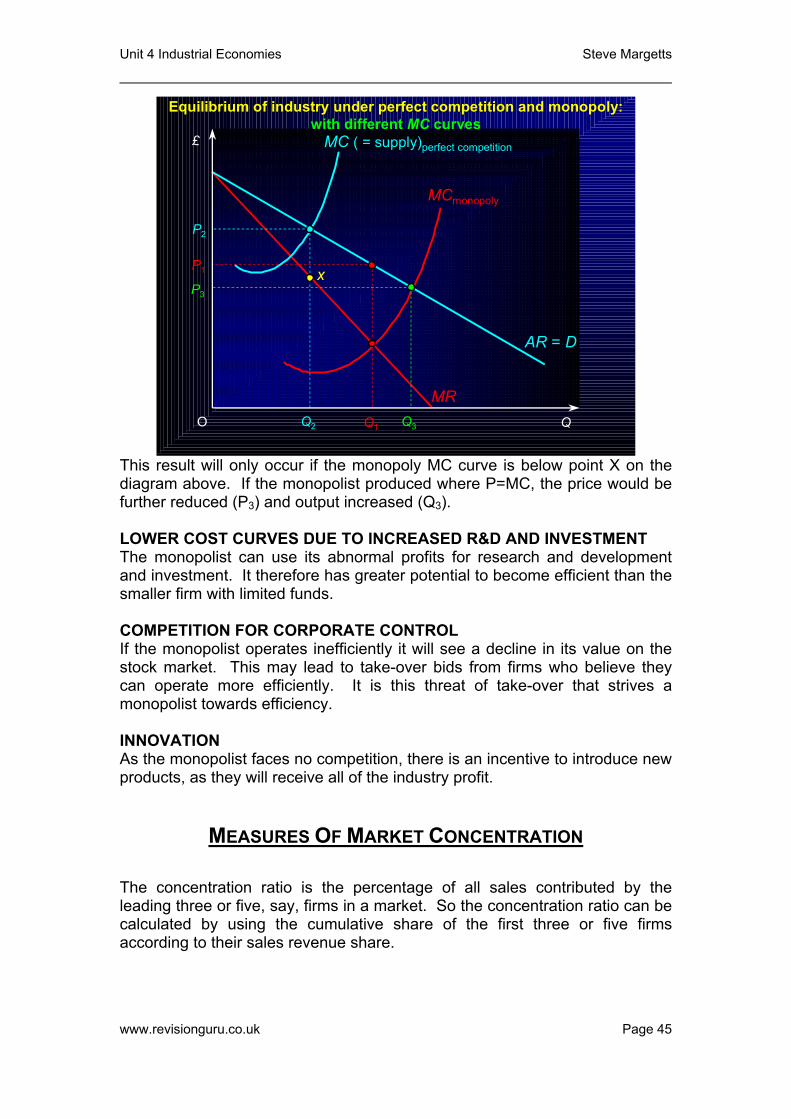
POSSIBILITY OF HIGHER COST CURVES Due to the presence of barriers to entry there is no incentive to reduce costs. UNEQUAL DISTRIBUTION OF INCOME The high profits of monopolists may be considered by many as unfair. The scale of this problem depends upon the size of the monopoly and the degree of its power. The monopoly profits of a village store may seem of little consequence when compared to that of a giant national or international company. ADVANTAGES OF MONOPOLY Monopolies can have some advantages. ECONOMIES OF SCALE The monopolist may be able to exploit substantial economies of scale. If this results in a MC curve dramatically below that of the same industry under perfect competition, the monopoly will be able to produce a higher output at a lower price. The monopoly produces Q1 at a price of P1, whereas the perfectly competitive industry produces Q2 at the higher price of P2.
www.revisionguru.co.uk Page 44
Unit 4 Industrial Economies Steve Margetts
£
Q O
MC ( = supply)perfect competition
P2
Q2 Q3
P3
AR = D
Equilibrium of industry under perfect competition and monopoly:Equilibrium of industry under perfect competition and monopoly:with different with different MCMC curvescurves
x
Q1
MR
P1
MCmonopoly
This result will only occur if the monopoly MC curve is below point X on the diagram above. If the monopolist produced where P=MC, the price would be further reduced (P3) and output increased (Q3). LOWER COST CURVES DUE TO INCREASED R&D AND INVESTMENT The monopolist can use its abnormal profits for research and development and investment. It therefore has greater potential to become efficient than the smaller firm with limited funds. COMPETITION FOR CORPORATE CONTROL If the monopolist operates inefficiently it will see a decline in its value on the stock market. This may lead to take-over bids from firms who believe they can operate more efficiently. It is this threat of take-over that strives a monopolist towards efficiency. INNOVATION As the monopolist faces no competition, there is an incentive to introduce new products, as they will receive all of the industry profit.
MEASURES OF MARKET CONCENTRATION The concentration ratio is the percentage of all sales contributed by the leading three or five, say, firms in a market. So the concentration ratio can be calculated by using the cumulative share of the first three or five firms according to their sales revenue share.
www.revisionguru.co.uk Page 45
Unit 4 Industrial Economies Steve Margetts
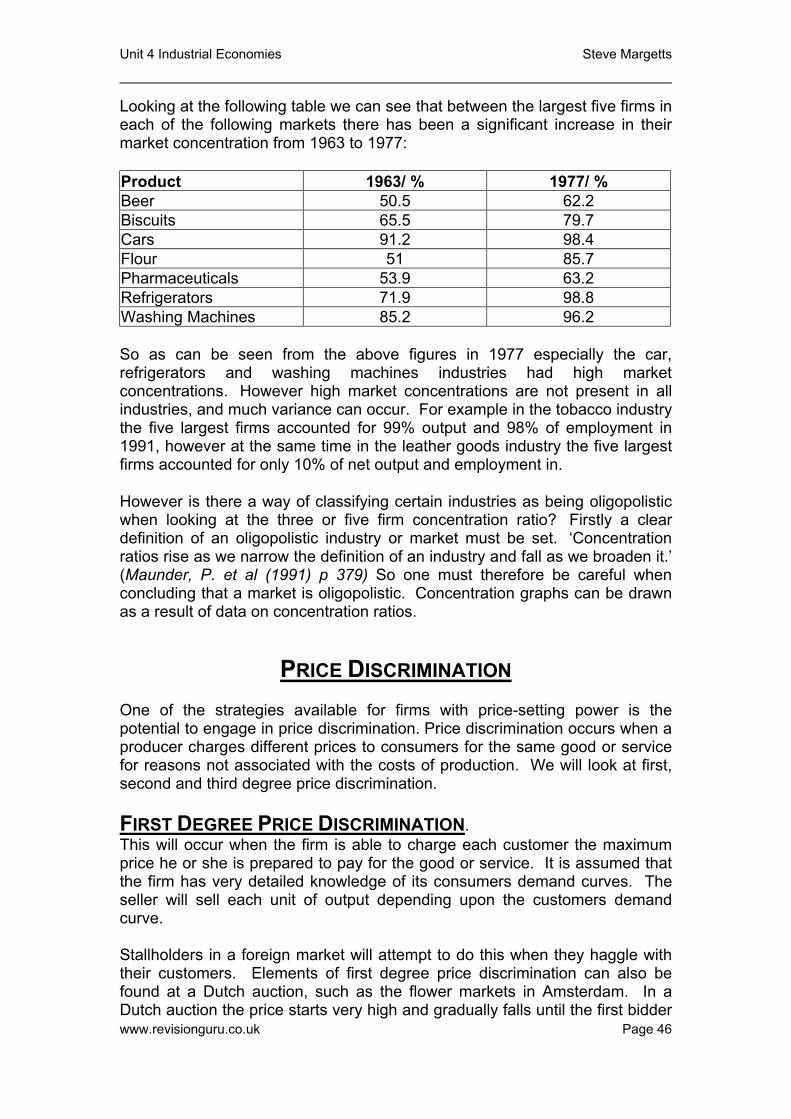
Looking at the following table we can see that between the largest five firms in each of the following markets there has been a significant increase in their market concentration from 1963 to 1977:
Product 1963/ % 1977/ % Beer 50.5 62.2 Biscuits 65.5 79.7 Cars 91.2 98.4 Flour 51 85.7 Pharmaceuticals 53.9 63.2 Refrigerators 71.9 98.8 Washing Machines 85.2 96.2 So as can be seen from the above figures in 1977 especially the car, refrigerators and washing machines industries had high market concentrations. However high market concentrations are not present in all industries, and much variance can occur. For example in the tobacco industry the five largest firms accounted for 99% output and 98% of employment in 1991, however at the same time in the leather goods industry the five largest firms accounted for only 10% of net output and employment in.
However is there a way of classifying certain industries as being oligopolistic when looking at the three or five firm concentration ratio? Firstly a clear definition of an oligopolistic industry or market must be set. ‘Concentration ratios rise as we narrow the definition of an industry and fall as we broaden it.’ (Maunder, P. et al (1991) p 379) So one must therefore be careful when concluding that a market is oligopolistic. Concentration graphs can be drawn as a result of data on concentration ratios.
PRICE DISCRIMINATION
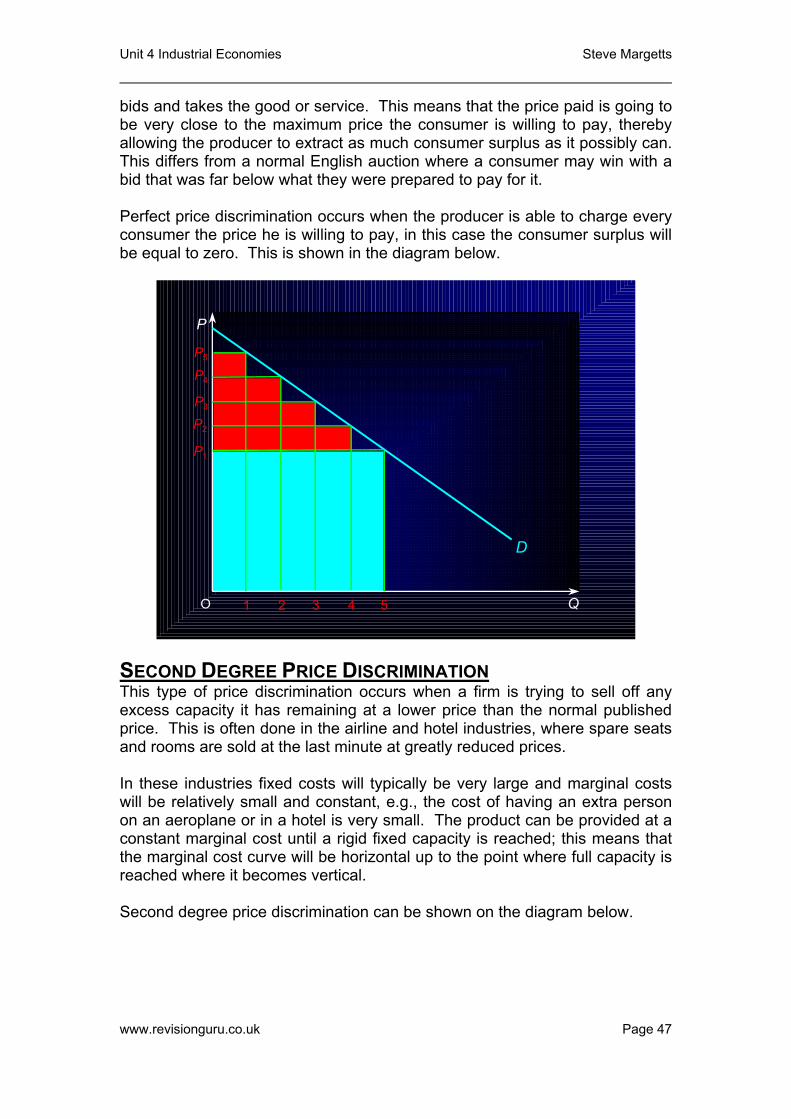
One of the strategies available for firms with price-setting power is the potential to engage in price discrimination. Price discrimination occurs when a producer charges different prices to consumers for the same good or service for reasons not associated with the costs of production. We will look at first, second and third degree price discrimination. FIRST DEGREE PRICE DISCRIMINATION. This will occur when the firm is able to charge each customer the maximum price he or she is prepared to pay for the good or service. It is assumed that the firm has very detailed knowledge of its consumers demand curves. The seller will sell each unit of output depending upon the customers demand curve.
www.revisionguru.co.uk Page 46
Stallholders in a foreign market will attempt to do this when they haggle with their customers. Elements of first degree price discrimination can also be found at a Dutch auction, such as the flower markets in Amsterdam. In a Dutch auction the price starts very high and gradually falls until the first bidder
Unit 4 Industrial Economies Steve Margetts
bids and takes the good or service. This means that the price paid is going to be very close to the maximum price the consumer is willing to pay, thereby allowing the producer to extract as much consumer surplus as it possibly can. This differs from a normal English auction where a consumer may win with a bid that was far below what they were prepared to pay for it. Perfect price discrimination occurs when the producer is able to charge every consumer the price he is willing to pay, in this case the consumer surplus will be equal to zero. This is shown in the diagram below.
O
D
P
Q
P5
1
P4
P3
P2
P1
2 3 4 5
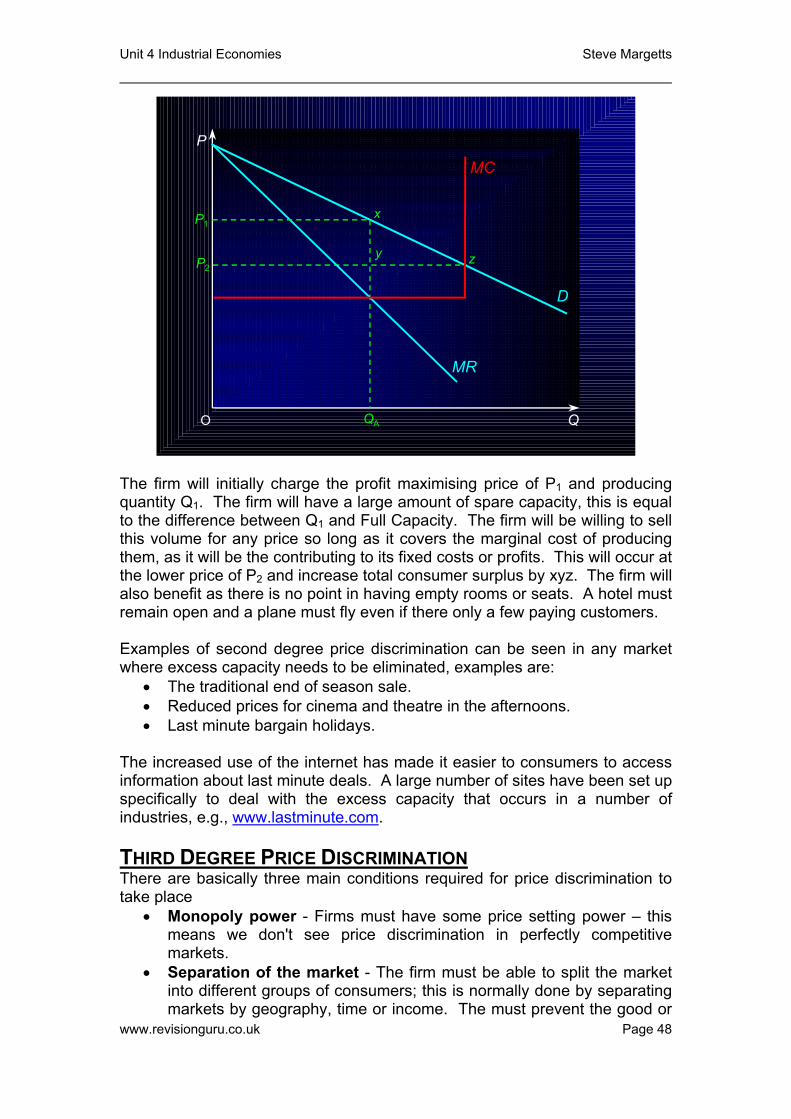
SECOND DEGREE PRICE DISCRIMINATION This type of price discrimination occurs when a firm is trying to sell off any excess capacity it has remaining at a lower price than the normal published price. This is often done in the airline and hotel industries, where spare seats and rooms are sold at the last minute at greatly reduced prices. In these industries fixed costs will typically be very large and marginal costs will be relatively small and constant, e.g., the cost of having an extra person on an aeroplane or in a hotel is very small. The product can be provided at a constant marginal cost until a rigid fixed capacity is reached; this means that the marginal cost curve will be horizontal up to the point where full capacity is reached where it becomes vertical. Second degree price discrimination can be shown on the diagram below.
www.revisionguru.co.uk Page 47
Unit 4 Industrial Economies Steve Margetts
P
QO
P1
D
MR
P2
QA
x
y z
MC
The firm will initially charge the profit maximising price of P1 and producing quantity Q1. The firm will have a large amount of spare capacity, this is equal to the difference between Q1 and Full Capacity. The firm will be willing to sell this volume for any price so long as it covers the marginal cost of producing them, as it will be the contributing to its fixed costs or profits. This will occur at the lower price of P2 and increase total consumer surplus by xyz. The firm will also benefit as there is no point in having empty rooms or seats. A hotel must remain open and a plane must fly even if there only a few paying customers. Examples of second degree price discrimination can be seen in any market where excess capacity needs to be eliminated, examples are:
• The traditional end of season sale. • Reduced prices for cinema and theatre in the afternoons. • Last minute bargain holidays.
The increased use of the internet has made it easier to consumers to access information about last minute deals. A large number of sites have been set up specifically to deal with the excess capacity that occurs in a number of industries, e.g., www.lastminute.com. THIRD DEGREE PRICE DISCRIMINATION There are basically three main conditions required for price discrimination to take place
• Monopoly power - Firms must have some price setting power – this means we don't see price discrimination in perfectly competitive markets.
• Separation of the market - The firm must be able to split the market into different groups of consumers; this is normally done by separating markets by geography, time or income. The must prevent the good or
www.revisionguru.co.uk Page 48
Unit 4 Industrial Economies Steve Margetts
service being resold between consumers. (For example a rail operator must make it impossible for someone paying a "cheap fare" to resell to someone expected to pay a higher fare. This is easier in the provision of services rather than goods. The costs of separating the market and selling to different groups (or market segments) must not be prohibitive.
• Elasticity of demand - There must be a different price elasticity of demand for the product in each group of consumers. This allows the firm to charge a higher price to those consumers with a relatively inelastic demand and a lower price to those with a relatively elastic demand. The firm will then be able to extract more consumer surplus which will lead to additional revenue and profit.
EXAMPLES OF PRICE DISCRIMINATION There are numerous good examples of discriminatory pricing policies. We must be careful to distinguish between discrimination (based on consumer's willingness to pay) and product differentiation - where price differences might also reflect a different quality or standard of service. Some examples of discrimination worth considering include:
• Cinemas and theatres cutting prices to attract younger and older audiences
• Student discounts for rail travel, nightclubs, restaurant meals and holidays
• Happy hour in bars • Expensive taxi fares during the night • Hotels offering cheap weekend breaks and winter discounts
THE AIMS OF PRICE DISCRIMINATION It must be remembered that the main aim of price discrimination is to increase the total revenue and hopefully the profits of the supplier. It helps them to off-load excess capacity and can also be used as a technique to take market share away from rival firms. It is possible to demonstrate on a diagram how a monopolist is able to earn greater profits by discriminating. Assume that a monopolist is able to divide its market into two - A and B - and that the costs of production are identical in each market. The firm needs to allocate production between the two markets so that the marginal revenue in each market is identical in order to maximise profit. This occurs because if the firm was earning more in market A it could earn more revenue by switching goods from B to A. If MR in market A is £10 and market B £6, the firm could gain an extra £4 by switching the marginal unit of production from B to A. It will keep doing this until there is no more advantage in doing so, which is when the MRs are even.
www.revisionguru.co.uk Page 49
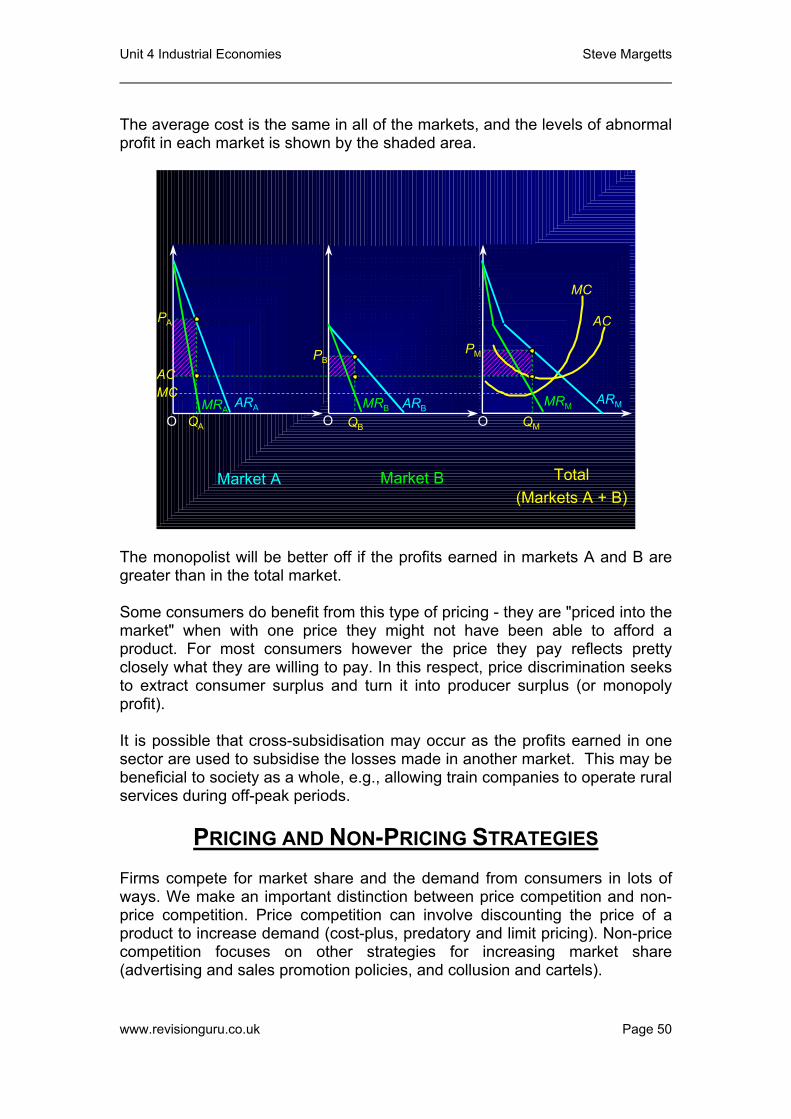
We draw the MRs and ARs in markets A and B first. These are then horizontally summed to give the total market. The profit maximising monopolist will produce where MC=MR across the whole market at an output level QM. This output is then split between the two markets (QA and QB) so that the MR is equal (MR). The AR curve in each of the markets will determine the relevant price (PA, PB and PM).
Unit 4 Industrial Economies Steve Margetts
The average cost is the same in all of the markets, and the levels of abnormal profit in each market is shown by the shaded area.
���������������������������������������������������������������
����������������������
��������������������������������������������������
O O OMRM
MC
Market A Market B Total(Markets A + B)
ARM
AC
ARBARA MRBMRAQMQBQA
PA
PBPM
ACMC
The monopolist will be better off if the profits earned in markets A and B are greater than in the total market. Some consumers do benefit from this type of pricing - they are "priced into the market" when with one price they might not have been able to afford a product. For most consumers however the price they pay reflects pretty closely what they are willing to pay. In this respect, price discrimination seeks to extract consumer surplus and turn it into producer surplus (or monopoly profit). It is possible that cross-subsidisation may occur as the profits earned in one sector are used to subsidise the losses made in another market. This may be beneficial to society as a whole, e.g., allowing train companies to operate rural services during off-peak periods.
PRICING AND NON-PRICING STRATEGIES Firms compete for market share and the demand from consumers in lots of ways. We make an important distinction between price competition and non-price competition. Price competition can involve discounting the price of a product to increase demand (cost-plus, predatory and limit pricing). Non-price competition focuses on other strategies for increasing market share (advertising and sales promotion policies, and collusion and cartels).
www.revisionguru.co.uk Page 50
Unit 4 Industrial Economies Steve Margetts
COST-PLUS PRICING Average cost pricing is defined as where a firm charges a price explicitly with reference to average costs plus a percentage profit mark-up. PREDATORY PRICING Predatory pricing is defined as a situation where a firm is prepared to deliberately make a loss in the short run with the aim of driving a rival(s) out of the market. In the long-run this will enable the firm to raise its price more than it has previously been reduced. LIMIT PRICING Limit pricing can be defined as a situation where an established firm tries to forestall new entry in a situation typically where economies of scale exist. ADVERTISING AND SALES PROMOTION POLICIES Consider the example of the UK supermarket sector where non-price competition has become important in the battle for sales
• Traditional advertising / marketing • Store Loyalty cards • Banking and other Services (including travel insurance) • In-store chemists and post offices • Home delivery systems • Discounted petrol at hypermarkets • Extension of opening hours (24 hour shopping) • Innovative use of technology for shoppers including self-scanning and
internet shopping services COLLUSION AND CARTELS. See previous notes.
CONTESTABLE MARKETS The contestable markets approach to competition represents an alternative to the neo-classical theory of the firm. It came to prominence in the early 1980s, largely through the work of the American economist William Baumol. The threat posed by the possibility of new firms entering the market is taken to be a key determinant of the behaviour of existing firms. Accordingly, barriers to entry and exit play a crucial role. Contestability is a measure of the extent to which a market is open to new entry. At the extreme, a market with no barriers to entry or exit is perfectly contestable. The existence of supernormal profit, no matter how small, would trigger new entry in such a market. On the basis of the assumption that existing firms wish to deter new entry, the logical conclusion is that they will set prices at such a level that only normal profits are made. They will also produce at lowest possible average cost. If they did not, a new entrant would be able to do so and use the cost saving to undercut the existing firm on price
www.revisionguru.co.uk Page 51
Unit 4 Industrial Economies Steve Margetts
and capture some of the market. In a perfectly contestable market, therefore, we expect firms to be productively efficient (production occurs where AC is at its minimum). Allocative efficiency is also achieved; the conditions of normal profit (AR = AC) and least cost production (where MC = AC) combine to give AR = MC. Since average revenue is the same as the price, we derive P = MC, the standard criterion for allocative efficiency. The conclusions of the previous paragraph are striking. If firms act in the way predicted, a market could continue as a monopoly or oligopoly even if no barriers to entry exist to protect the position of incumbent firms. This breaks the link between barriers to entry and market concentration assumed by neo-classical theory. Perhaps more significantly, in the absence of actual competition, the desirable properties of perfectly competitive markets can be attained if there are no entry or exit barriers. The standard charge that monopolists exploit consumers by reducing output, raising prices and earning supernormal profits would not be relevant in a market without barriers to entry and exit, if they did other firms would enter the market and erode the market share of the incumbent. This observation is important for it suggests that competition policy should be as much concerned with the levels of barriers to entry and exit in a market as with existing levels of competition. CONTESTABILITY IN PRACTICE As Baumol himself admits “...perfectly contestable markets do not populate the world of reality any more than perfectly competitive markets do”. There are few, if any, markets in which no barriers to entry or exit exist at all. In practice then, just like perfect competition, contestability is a matter of degree: the question “is market X contestable?” requires more than a “yes” or “no” answer. In general, a market will be more contestable (more open to new entry):
• The higher the profit levels available; • The lower the barriers to entry; • The lower the barriers to exit.
A major barrier to exit is sunk costs. Indeed, it was suggested by Baumol that markets would be contestable provided there were no sunk costs. Sunk costs will be low where the firm can sell or in other ways dispose of its capital equipment without cost. For example, a new airline might lease aircraft rather than purchase them and can then leave the industry at the end of the lease period without the costs of having to sell its aircraft. This being so, there are a number of avenues available to incumbent firms wishing to prevent new entry. The first is to reduce profit levels by pricing below the short-term profit maximising point. We would expect firms to set the price at the highest level compatible with deterring new entry, a strategy known as entry limit pricing.
www.revisionguru.co.uk Page 52
Unit 4 Industrial Economies Steve Margetts
As we have already seen, in a perfectly contestable market this would entail pricing at a level where only normal profits are made. Where existing firms have some protection because of barriers to entry or exit, however, they will be able to make supernormal profits. The extent of these supernormal profits depends largely on the height of the barriers. The link between barriers to entry and profit levels forged by neo-classical theory is thus reinforced. Even in the short run, the fear of triggering new entry results in firms making only that level of profit that entry barriers will protect into the long run. A second policy is to construct artificial entry barriers. This should be viewed as complementary to entry limit pricing: the more successful the firm is in erecting barriers, the higher the price it will be able to charge without inducing new entry. Advertising and brand proliferation are possibilities, but artificial barriers can be more subtle in nature. The possibility of existing firms adopting the following courses of action, for example, raises doubts about whether the discipline imposed on firms by the threat of competition is really as strong as that imposed by actual competition:
• Undertaking predatory action in the event of new entry. This entails temporarily reducing prices until the new firm is forced out of the market. By acquiring a reputation for predatory pricing, existing firms effectively create a new barrier to entry.
• Building up over-capacity, so as to be able to flood the market with cheap output in the event of new competition. This signals to potential entrants that incumbent firms intend to resist any new challenge.
Markets which are highly contestable are likely to be vulnerable to “hit and run competition”. Consider a situation where incumbent firms are pricing at above the entry-limit level. Even in the event that existing firms react in a predatory style, new entry will be profitable as long as there is a time lag between entry and the implementation of such action. Having made a profit in the intervening period, the new entrant can then leave the industry at little cost (remember: there are no sunk costs where markets are perfectly contestable). This allows us to arrive at a number of generalised assumptions that are made in the theory of contestable markets:
• There are low barriers to entry, which means that there is both freedom of entry and exit into the marketplace.
• The number of firms in the market can vary from one with complete control of the market, to many, with each firm having no significant share of the marketplace.
• Firms compete with each other, therefore there is no collusion within the marketplace.
• Firms are short run profit maximisers, producing where MC=MR. • Firms may produce a homogeneous or heterogeneous good. • There is perfect knowledge in the market.
CONCLUSIONS Barriers to entry are clearly crucial in determining the outcome produced by the market. To the extent that contestable markets theory is correct in www.revisionguru.co.uk Page 53
Unit 4 Industrial Economies Steve Margetts
assuming that the threat of competition is a key determinant of the behaviour of existing firms, it reinforces the link between barriers to entry and profit, but removes the link between barriers to entry and market concentration. The suggestion that efficiency can be achieved in the absence of entry and exit barriers, but without actual competition, is highly significant for policy makers. MARKETS THAT HAVE BECOME MORE CONTESTABLE IN RECENT YEARS
• Internet Service Providers (including the entry of "free" ISPs - over 200 of these in September 1999
• Online Communications (including video conferencing; virtual reality games; publishing; home shopping; travel services; information services; databases)
• Home Banking and Financial Services • Electricity and Gas Supply • Parcel delivery • Opticians • Low cost domestic airlines • Road Haulage Companies
CREAM-SKIMMING IN THE MARKET FOR SAVINGS AND LOANS One feature of a contestable market is that new entrants may seek to “cream skim” the most profitable segments of an industry. The trick is to identify which sectors of a market offer the best returns and then successfully target existing customers. The largest UK banks make profits of hundreds of millions of pound every year – but most of this money comes from user-services such as foreign exchange commission and high interest loans to a relatively small number of customers. Many accounts in high street banks are loss-makers – particularly those held by people with tiny savings balances who rarely use other bank services.
COMPETITION POLICY IN THE UK AND EU Why are competitive markets seen as beneficial for consumers and the economy as a whole? The Labour Government published its latest White Paper on International Competitiveness in July 2001. The introductory section made it clear that the government regards creating a competitive environment for UK and overseas businesses as a cornerstone of its supply-side economic policies. "Vigorous competition between firms is the lifeblood of strong and effective markets. Competition helps consumers get a good deal. It encourages firms to innovate by reducing slack, putting downward pressure on costs and providing incentives for the efficient organisation of production. As such,
www.revisionguru.co.uk Page 54
Unit 4 Industrial Economies Steve Margetts
competition is a central driver for productivity growth in the economy, and hence the UK's international competitiveness" Competitive markets exist when there is genuine choice for consumers in terms of who supplies the goods and services they demand. Competitive markets are characterised by various forms of price and non-price competition between sellers who are bidding to increase or protect their market share. What are the potential gains from increased market competition?
• Lower prices for consumers • A greater discipline on producers/suppliers to keep their costs down • Improvements in technology with positive effects on production
methods and costs • A greater variety of products (giving more choice) • A faster pace of invention and innovation • Improvements to the quality of service for consumers • Better information for consumers allowing people to make more
informed choices The overall impact of increased competition should be an improvement in economic welfare. OPENING UP MARKETS - LIBERALISATION Creating more competition in markets involves breaking down the barriers to competition that invariably exist in each industry. Perfectly contestable markets are rare. One of the key strategies of governments over the last twenty years has been to liberalise markets by cutting the statutory monopoly power of businesses. Two good examples of this have been in gas and electricity supply, and also telecommunications. ENERGY MARKET LIBERALISATION Liberalisation of energy markets has led to lower costs through increased efficiency and lower prices for consumers. The UK gas and electricity markets are already fully liberalised, with all types of customer able to choose their own supplier. For example: More than 30% of domestic gas customers and 25% of electricity customers have switched suppliers and domestic electricity prices have fallen as markets have opened up. TELECOMMUNICATIONS UK consumers have benefited from rapid price falls as a result of the opening up of the UK market in telecoms: Mobile phone prices have fallen by 20% in 18 months from the beginning of 1999. And, the cost of international calls has fallen dramatically over the past decade. TOUGHER REGULATION Privatisation and liberalisation of markets has opened many sectors to greater competition. A second strand to current government policy is to toughen up the regulation of markets through competition policy.
www.revisionguru.co.uk Page 55
Unit 4 Industrial Economies Steve Margetts
The Competition Act 1998 prohibits cartels and other anti-competitive agreements and other abuses of dominant market position. Firms which breach the prohibitions in the Competition Act can be subject to penalties of up to 10% of UK turnover in the relevant market, for up to three years of an infringement. They also face the prospect of actions for damages against them by third parties that have been harmed by their illegal acts. The Office of Fair Trading is now responsible for taking decisions on day-to-day competition cases.
REGULATION OF PRIVATISED INDUSTRIES By 1997, when the Conservative government left office, the only remaining industries left in public control within the UK were the Post Office and Air Traffic Control. Privatisation had been pursued with an almost religious fervour. It was seen as a way of revitalising inefficient industries and opening up hitherto closed markets to competition, thereby benefiting the consumer. Privatisation took many forms, it involved selling state-owned industries, such as telecoms, steel, gas and electricity, water and railways. It also included the tendering of services in the public sector and the creation of public/private partnerships. For the critics, however, privatisation created new problems. In order to ensure a successful flotation, many of the nationalised industries were privatised as virtual monopolies (e.g. gas, electricity supply, water and steel) or, at best, as oligopolies (e.g. electricity generation and telecoms). What happened was that the public monopoly was simply transferred into private hands. For the critics, the potential for lower prices and better services was unlikely to be fully realised, if at all. HAS UK PRIVATISATION BEEN SUCCESSFUL? Between 1979 and 1997, the proceeds from privatisation were some £90 billion. Firms which were loss making under public ownership now began turning a profit. A recent study of 33 privatised enterprises found that, prior to privatisation, they absorbed £500 million of public funds annually and £1 billion in loan finance. By 1987, once privatised, the 33 contributed £8 billion per year to the Treasury. As well as greater profitability, bills have also fallen. Telecom bills have fallen by 49 per cent between 1984 and 2000, gas by 31 per cent between 1986 and 2000, and electricity by 20 per cent between 1998 and 2000. Given these figures, it would seem to be very hard to argue against privatisation. For some of these industries, however, it was not the power of competition that brought such success, but rather the power of regulation and control over business actions. In other words, it was only with continued government intervention that such benefits have been realised. The regulatory framework put in place following privatisation was designed to look after the interests of consumers and to ensure that the privatised utilities did not exploit their dominant market position. www.revisionguru.co.uk Page 56
Unit 4 Industrial Economies Steve Margetts
REGULATION IN THE UK All the major utilities have a regulator, such as OFTEL for telecommunications, and OFGEM for gas and electricity. The system of regulation in the UK has four pillars:
• Price-cap regulation. Regulators, via a price-setting formula, determine the prices that can be charged by the utility. In its simplest form, the formula is RPI – X. This means that permitted prices increases are determined by the percentage rise in the retail price index (RPI) minus an amount X, where X is the reduction in price required for the industry as a result of expected improvements in efficiency. So for telecoms, between 1997 and 2000 the price formula was RPI – 4.5 per cent. This means that if inflation was 6 per cent, BT would be allowed to raise its prices by only 6% – 4.5% = 1.5%. If inflation was 3 per cent, BT would have to put its price down by 1.5% (i.e. 3% – 4.5%). Further elements might be added to the formula, such that it might take the form RPI – X + Y + Z , where Y is an allowance for unseen business costs, e.g. a rise in fuel costs. Y is not determined in advance but varies as cost changes. Z is an allowance for taking into account the cost of meeting environmental standards. The privatised water companies are allowed a Z factor.
• Licensing. The regulator, as well as determining a utility’s price, controls other aspects of the company’s service provision. For example, the Strategic Rail Authority (SRA) specifies the number of trains that a train-operating company must run and the percentage that must be on time.
• Behavioural rules. To ensure flexibility, the regulator can change provisions within the licence in the light of experience. For example, new environmental standards or safety considerations could be incorporated.
• Attempts to increase competition. Regulators also impose and monitor levels of competition within an industry. They can impose a ceiling on the share of a market that might be controlled by a dominant producer. For example, British Gas is only allowed 40 per cent of the market for industrial gas users. OFTEL has recently extended price controls over BT for holding back competition in the sector. It has threatened to cap BT’s profits if its market share fails to fall further.
www.revisionguru.co.uk Page 57
Unit 4 Industrial Economies Steve Margetts
STRENGTHS OF THE UK REGULATORY SYSTEM The price-cap system of regulation used in the UK has a number of strengths. These include the following:
• The regulators are independent. They do not have to answer to government or the firms involved, and have the discretion to act as they choose. They have specialist knowledge and understanding of the industry they regulate, and, on this basis, it can be argued they are the best people to decide whether the industry is acting in the public interest.
• It is flexible. The price formula (the value of X) and the licensing provision applied to the industry are not fixed: they can be changed if circumstances change. For example, the impact of fibre optics on the costs of providing telecoms services had been considerably underestimated by OFTEL. As a result, OFTEL raised the X factor from 3 to 4.5 per cent in 1989, from 4.5 to 6.25 per cent in 1991 and from 6.25 to 7.5 per cent in 1993, to ensure that some of the cost savings were passed on to the consumer.
• It offers an incentive for efficiency. The privatised utilities always have an incentive to be efficient. Any cost savings greater than X means that they make greater profits. Alternatively, if they do not manage to reduce costs as much as X then their profits will be lower and they could even make a loss.
WEAKNESSES OF THE UK REGULATORY SYSTEM There are three main weaknesses with the UK regulatory system.
• In order for businesses to plan long term, they require a degree of stability, especially concerning price. If the regulator gets X wrong and subsequently changes it, this will disrupt any planning the business may have done based on current prices. This may as a consequence breed an element of short-termism into the regulated utility. Equally, if the utility feels that that any profit it makes will result in the regulator setting a higher X next time, it may refrain from cutting costs as far as it might.
• Regulators make decisions within imperfect markets and with imperfect information. When setting a price cap, the regulator does so based on estimates for potential efficiency gains. There is a real chance that any price determined in this way may be incorrect. Furthermore, the more complex the pricing formula becomes, the greater the chance there is of this occurring.
• There is also the potential problem of ‘regulatory capture’. As regulators work closely with those they regulate, there is a danger that they may come to see things from the managers’ perspective or have the ‘wool pulled over their eyes’. This might seriously compromise the public-interest requirements that regulators are supposed to uphold.
As a result of these weaknesses, there has been a move, wherever possible, to replace regulation with competition.
www.revisionguru.co.uk Page 58
Unit 4 Industrial Economies Steve Margetts
HOW IS COMPETITION TO BE INTRODUCED AND WHAT PROBLEMS ARE THERE WITH IT? In most cases, when we refer to a public utility as being a ‘natural monopoly’, we are in fact only referring to that part of the business which is based around some kind of grid. In the case of gas and water it is the pipelines. With railways it is the track. With electricity it is the power lines. Other parts of the industry are potentially competitive. Even when there is a natural monopoly, it can be made more contestable. One way of doing this is by franchising. Here operators are given a license for a specific time period, where they will act as a monopoly supplier. Each of the rail companies has a regional franchise and thus has a monopoly over all or most services within the region. The awarding of such franchises can, however, be highly competitive: rival companies bid against each other in respect to fare prices, the number of trains they will operate and the quality of the service they will provide. With the grid or natural monopoly element separated from general supply, it is possible to introduce competition. Take electricity, any number of energy generators might supply the market, so long as they have access to the electricity grid. The same case could be made for suppliers of gas, so long as there was access to a supply pipe competition might be vigorous. So as to prevent market dominance, say through progressive mergers and acquisitions, regulators have set limits to the share of the market that dominant firms are permitted to own. As mentioned, BT and British Gas have been subject to such restrictions. Is it then possible to dispense with regulation completely and rely upon the market to deliver a fair outcome? The answer to this is that it is probably highly unlikely. Competition has its own problems. One of the problems of franchising became apparent recently when the rail operators came to renew their franchising contracts. The contracts were to be extended from 7 to 15 years, the reasoning being that many rail operators were not prepared to invest long term with a franchise of only 7 years, given that they did not know whether their franchise would be renewed beyond that. The difficulty here is that the more secure the franchise operator is, the less it will be conditioned by the forces of competition. Other problems with competition are that it might fail to take adequate account of environmental or social objectives. Thus electricity generation can have detrimental effects on the environment and thus a regulator might insist on the use of cleaner technology. A public utility should provide public services, many of which, when supplied, go beyond the mere pursuit of economic profit (e.g. the provision of loss-making public transport to rural areas). Also, the natural monopoly element in grids and the limited number of firms in other parts of the industries concerned, will inevitably demand some regulatory presence to ensure that the public interest is not compromised and that industry behaviour is constantly monitored.
www.revisionguru.co.uk Page 59
Unit 4 Industrial Economies Steve Margetts
Thus, although the market may replace many aspects of regulation, it is unlikely that regulation will ever be totally abandoned.
www.revisionguru.co.uk Page 60
Unit 4 Industrial Economies Steve Margetts
INDEX Abnormal profits, 12 Advertising And Sales Promotion
Policies, 51 agriculture industry, 20 Allocative Efficiency, 37 Alternative Objectives of the Firm,
14 Average cost, 6 Baumol, 51 Behavioural theories, 16 Cartels, 34 Collusion And Cartels, 34 Competition Policy in the UK and
EU, 54 Contestable Markets, 51 Cost-Plus Pricing, 50 Costs, 4 diminishing marginal returns, 17 diseconomies of scale, 18 Dutch auction, 46 Economic Efficiency, 37 economic profit, 12 Economies of Scale, 17 excess capacity, 47 External economies of scale, 18 External growth, 2 Financial economies, 18 First Degree Price Discrimination.,
46 Fixed costs, 5 Growth of Firms, 2 Increasing dimensions, 18 Interdependence, 32 Internal economies of scale, 17 Internal growth, 2 Joint Ventures, 3 Kinked demand curve theory, 33 Liberalisation, 55 Limit Pricing, 51 Longrun, 16 Loss Making Firm, 12 loss minimising, 12 Managerial economies, 17 Managerial Theories, 16 Marginal Cost, 6
Marketing economies, 18 Measures Of Market
Concentration, 45 Merger, 2 minimum efficient scale (MES),, 18 Monopolistic Competition, 28 Monopoly, 25 Monopoly And The Public Interest,
42 Non-price competition, 33 normal profit, 12 Oligopolistic Markets, 32 Perfect Competition, 20 Predatory Pricing, 51 Price competition, 33 Price Discrimination, 46 price-fixing, 36 Pricing and Non-Pricing Strategies,
50 Prisoners’ Dilemma, 37 Productive Efficiency, 40 Profit, 9 Profit Maximising, 10 Purchasing economies, 18 Regulation of Privatised Industries,
56 Revenue, 7 Revenue Maximisation, 14 Sales Maximisation, 15 Second Degree Price
Discrimination, 47 Shortrun, 16 Social Efficiency, 42 specialization, 17 Static Efficiency, 37 Sweezy, 33 TAKEOVER, 2 Technical economies, 17 Third Degree Price Discrimination,
48 Total Costs, 5 Total Fixed Costs, 5 Total Variable Costs, 5 Variable costs, 5 X-inefficiency, 18
www.revisionguru.co.uk Page 61
Related Documents


![Presentatie Ties Top M-Wise · Audio & multimedia aasisonderdelen Bedienings apparatuur Behuizingen CD & DVD Computers Digitale camera's Diversen Gaming Harae scnl]ven Mobiele opslag](https://static.cupdf.com/doc/110x72/60167d32019d5977836da3fc/presentatie-ties-top-m-wise-audio-multimedia-aasisonderdelen-bedienings-apparatuur.jpg)