Production environment and husbandry practices Workneh Ayalew ILRI, Addis Ababa 25 February 2003

Production environment and husbandry practices Workneh Ayalew ILRI, Addis Ababa 25 February 2003.
Dec 26, 2015
Welcome message from author
This document is posted to help you gain knowledge. Please leave a comment to let me know what you think about it! Share it to your friends and learn new things together.
Transcript
Production environment and husbandry practices
Workneh AyalewILRI, Addis Ababa
25 February 2003
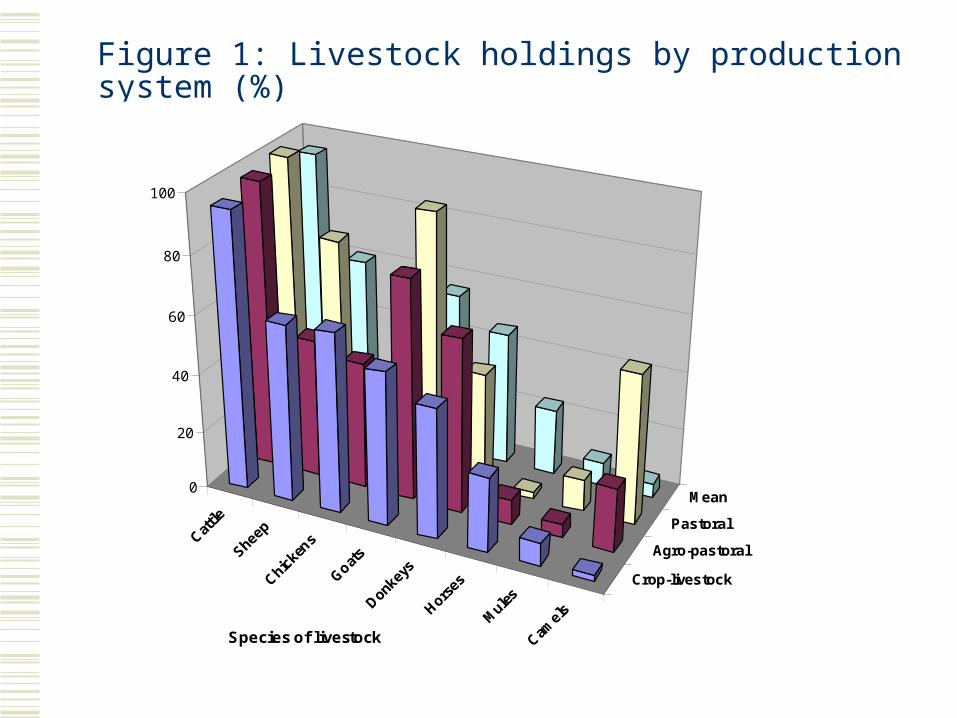
Figure 1: Livestock holdings by production system (%)
Crop-livestock
Agro-pastoral
Pastoral
Mean0
20
40
60
80
100
Species of livestock
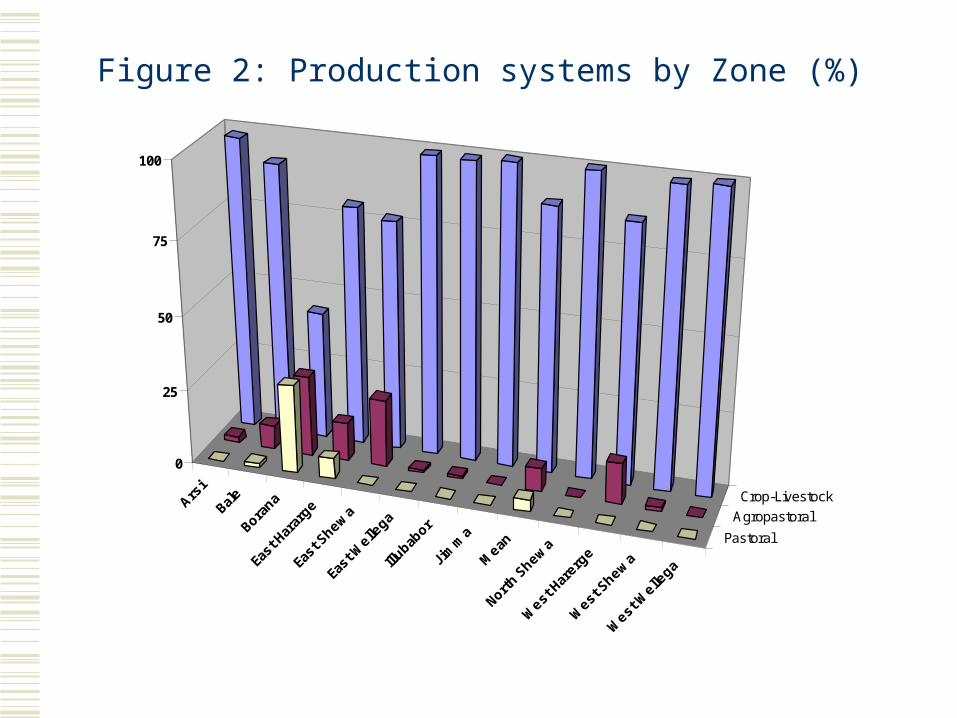
Figure 2: Production systems by Zone (%)
Crop-Livestock
Agropastoral
Pastoral
0
25
50
75
100
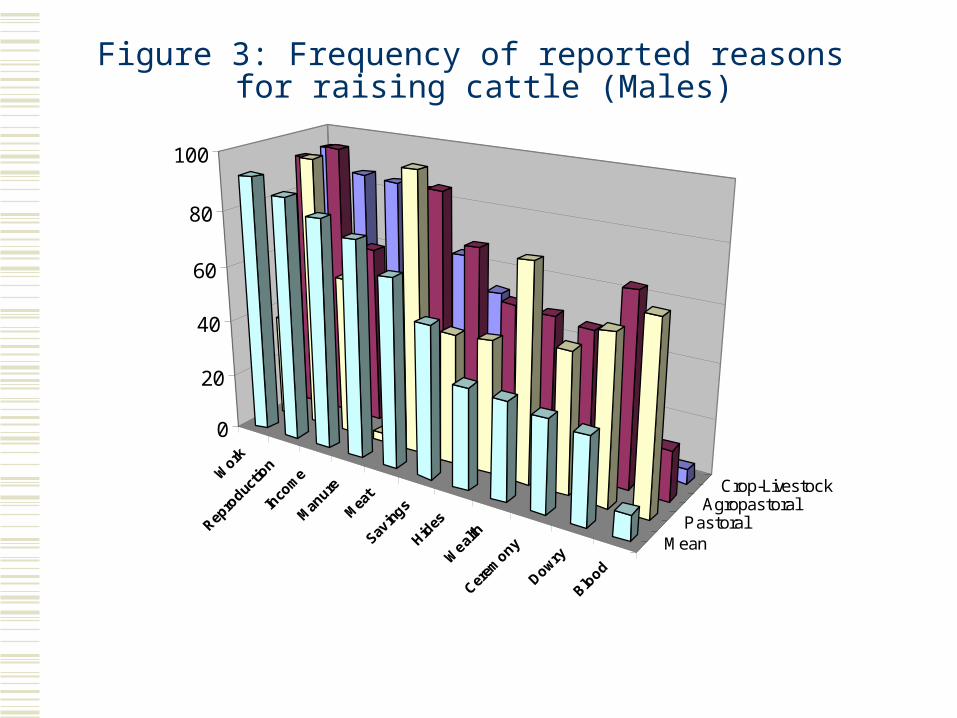
Figure 3: Frequency of reported reasons for raising cattle (Males)
Work
Repro
ductio
n
Inco
me
Man
ure
Mea
t
Savin
gs
Hides
Weal
th
Cerem
ony
Dowry
Blood
Crop-Livestock Agropastoral
Pastoral Mean
0
20
40
60
80
100
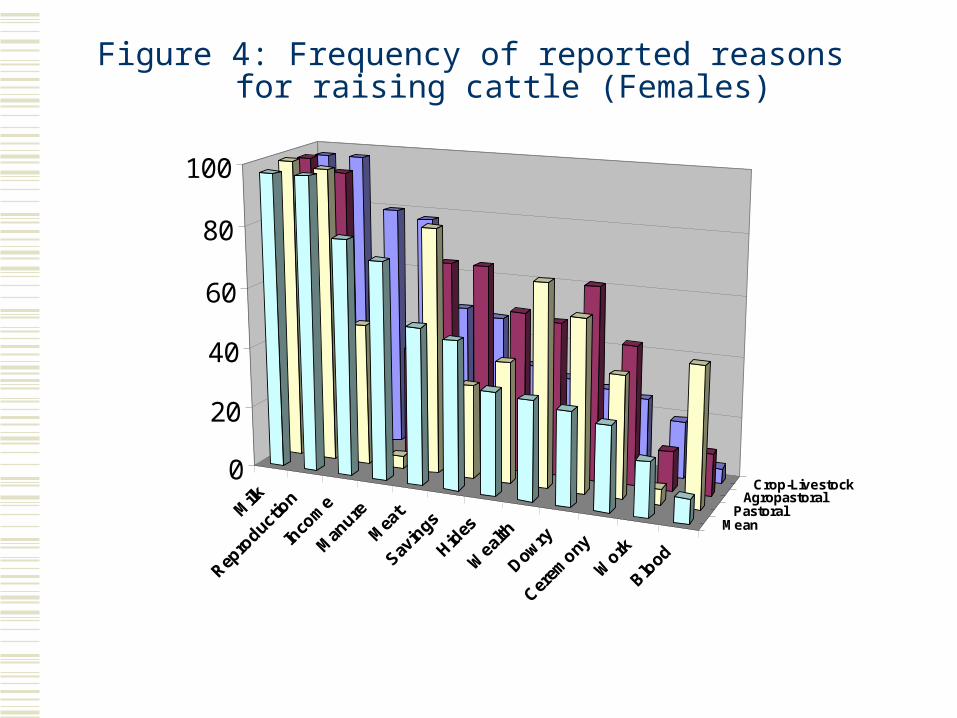
Figure 4: Frequency of reported reasons for raising cattle (Females)
Milk
Repro
ductio
n
Inco
me
Man
ure
Mea
t
Savin
gs
Hides
Wea
lth
Dowry
Cerem
ony
Work
Blood
Crop-Livestock Agropastoral
Pastoral Mean
0
20
40
60
80
100
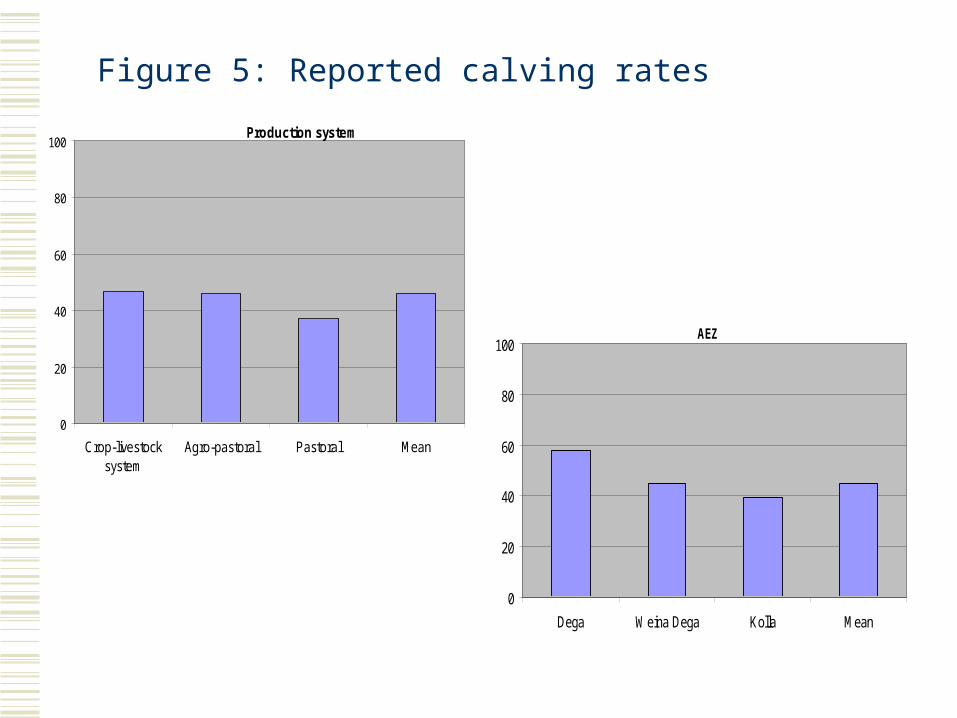
Figure 5: Reported calving rates
0
20
40
60
80
100
Crop-livestocksystem
Agro-pastoral Pastoral Mean
Production system
0
20
40
60
80
100
Dega Weina Dega Kolla Mean
AEZ
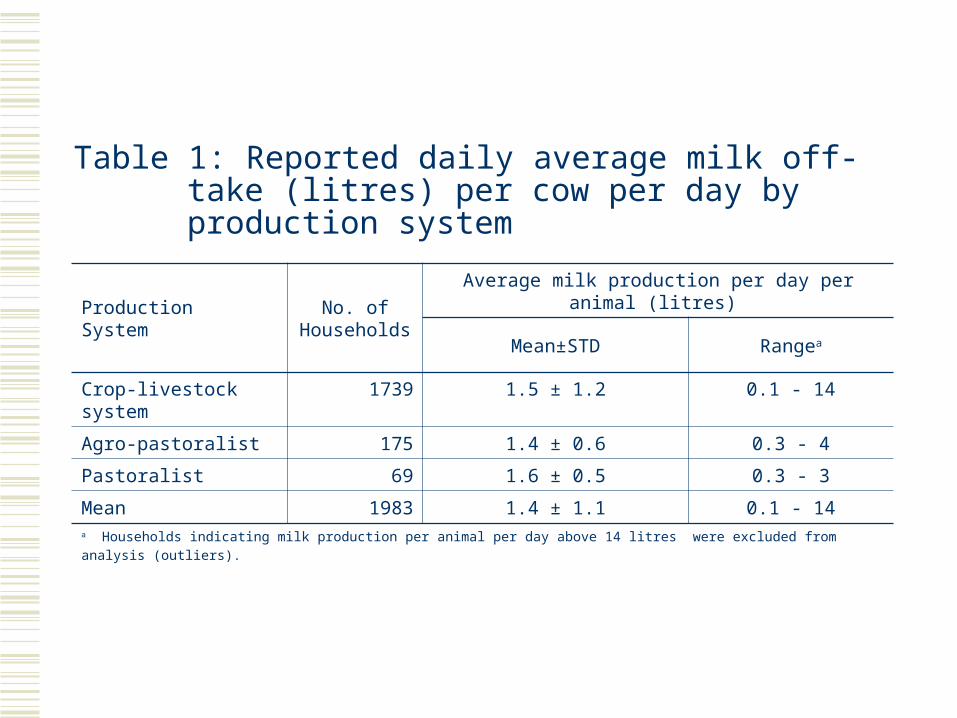
Table 1: Reported daily average milk off-take (litres) per cow per day by production system
Production SystemNo. of
Households
Average milk production per day per animal (litres)
Mean±STD Rangea
Crop-livestock system 1739 1.5 ± 1.2 0.1 - 14
Agro-pastoralist 175 1.4 ± 0.6 0.3 - 4
Pastoralist 69 1.6 ± 0.5 0.3 - 3
Mean 1983 1.4 ± 1.1 0.1 - 14a Households indicating milk production per animal per day above 14 litres were excluded from analysis (outliers).
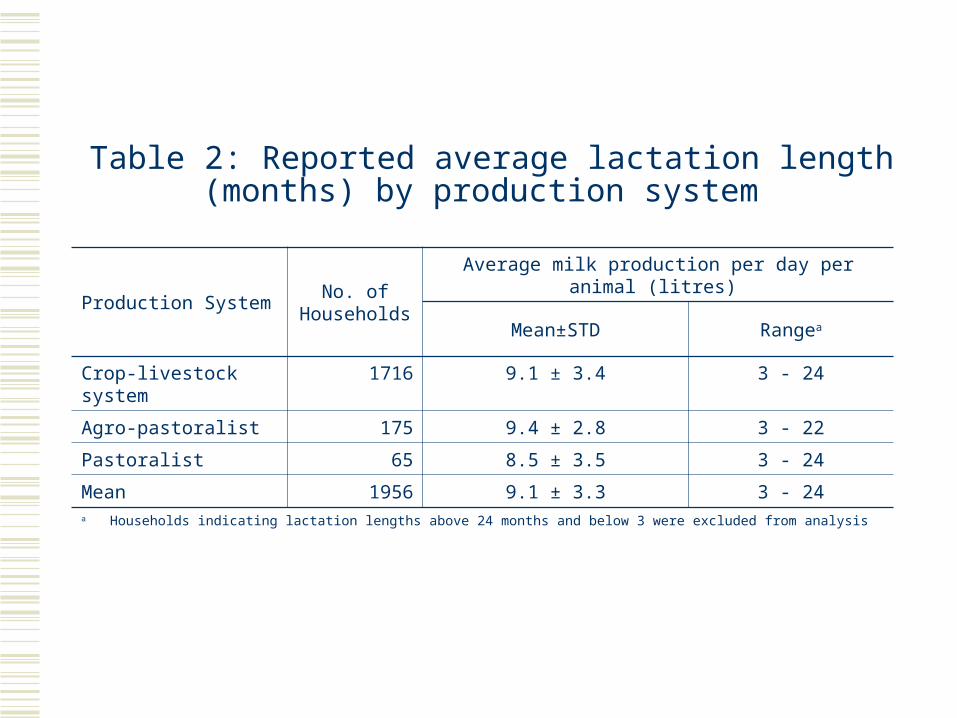
Table 2: Reported average lactation length (months) by production system
Production SystemNo. of
Households
Average milk production per day per animal (litres)
Mean±STD Rangea
Crop-livestock system 1716 9.1 ± 3.4 3 - 24
Agro-pastoralist 175 9.4 ± 2.8 3 - 22
Pastoralist 65 8.5 ± 3.5 3 - 24
Mean 1956 9.1 ± 3.3 3 - 24a Households indicating lactation lengths above 24 months and below 3 were excluded from analysis
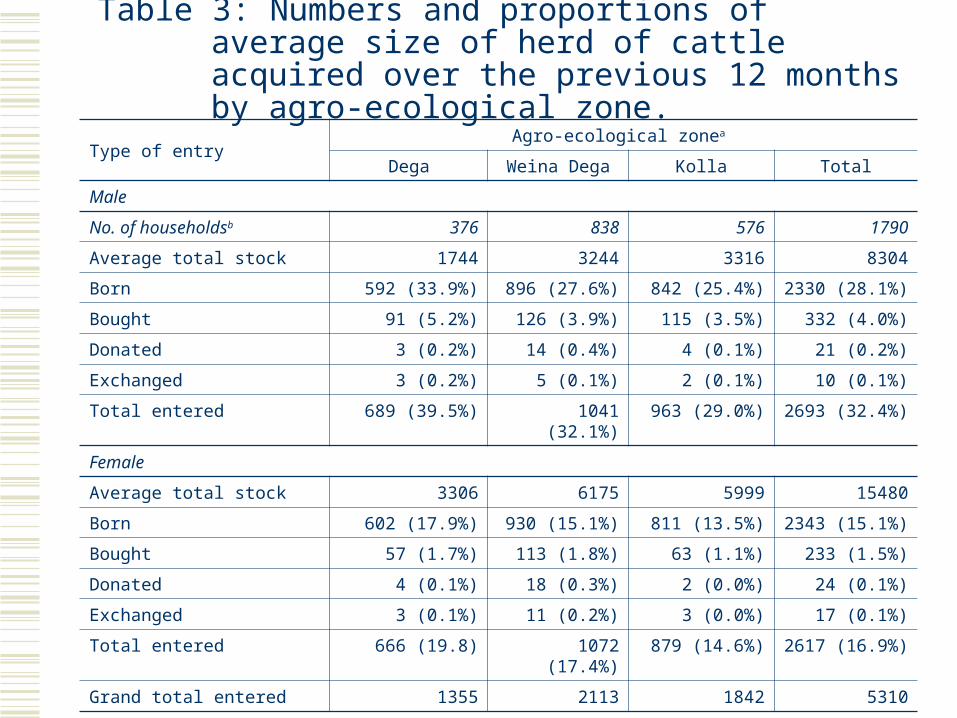
Table 3: Numbers and proportions of average size of herd of cattle acquired over the previous 12 months by agro-ecological zone.
Type of entryAgro-ecological zonea
Dega Weina Dega Kolla Total
Male
No. of householdsb 376 838 576 1790
Average total stock 1744 3244 3316 8304
Born 592 (33.9%) 896 (27.6%) 842 (25.4%) 2330 (28.1%)
Bought 91 (5.2%) 126 (3.9%) 115 (3.5%) 332 (4.0%)
Donated 3 (0.2%) 14 (0.4%) 4 (0.1%) 21 (0.2%)
Exchanged 3 (0.2%) 5 (0.1%) 2 (0.1%) 10 (0.1%)
Total entered 689 (39.5%) 1041 (32.1%) 963 (29.0%) 2693 (32.4%)
Female
Average total stock 3306 6175 5999 15480
Born 602 (17.9%) 930 (15.1%) 811 (13.5%) 2343 (15.1%)
Bought 57 (1.7%) 113 (1.8%) 63 (1.1%) 233 (1.5%)
Donated 4 (0.1%) 18 (0.3%) 2 (0.0%) 24 (0.1%)
Exchanged 3 (0.1%) 11 (0.2%) 3 (0.0%) 17 (0.1%)
Total entered 666 (19.8) 1072 (17.4%) 879 (14.6%) 2617 (16.9%)
Grand total entered 1355 2113 1842 5310a Dega=Highland, Weina Dega=Midland, and Kolla=Lowland. b Numbers of households are presented in Italics to distinguish them from the frequencies
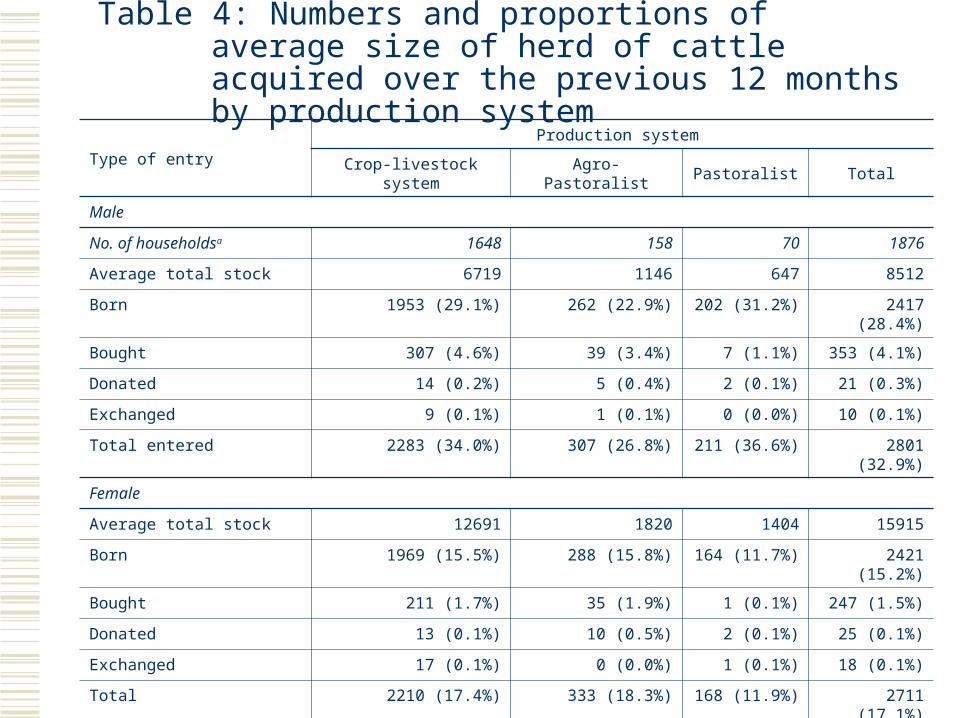
Table 4: Numbers and proportions of average size of herd of cattle acquired over the previous 12 months by production system
Type of entryProduction system
Crop-livestock system Agro-Pastoralist Pastoralist Total
Male
No. of householdsa 1648 158 70 1876
Average total stock 6719 1146 647 8512
Born 1953 (29.1%) 262 (22.9%) 202 (31.2%) 2417 (28.4%)
Bought 307 (4.6%) 39 (3.4%) 7 (1.1%) 353 (4.1%)
Donated 14 (0.2%) 5 (0.4%) 2 (0.1%) 21 (0.3%)
Exchanged 9 (0.1%) 1 (0.1%) 0 (0.0%) 10 (0.1%)
Total entered 2283 (34.0%) 307 (26.8%) 211 (36.6%) 2801 (32.9%)
Female
Average total stock 12691 1820 1404 15915
Born 1969 (15.5%) 288 (15.8%) 164 (11.7%) 2421 (15.2%)
Bought 211 (1.7%) 35 (1.9%) 1 (0.1%) 247 (1.5%)
Donated 13 (0.1%) 10 (0.5%) 2 (0.1%) 25 (0.1%)
Exchanged 17 (0.1%) 0 (0.0%) 1 (0.1%) 18 (0.1%)
Total 2210 (17.4%) 333 (18.3%) 168 (11.9%) 2711 (17.1%)
Grand total entered 4493 (35.4%) 640 (35.2%) 379 (27.0%) 5512 (34.6%)
a Numbers of households are presented in Italics to distinguish them from the frequencies
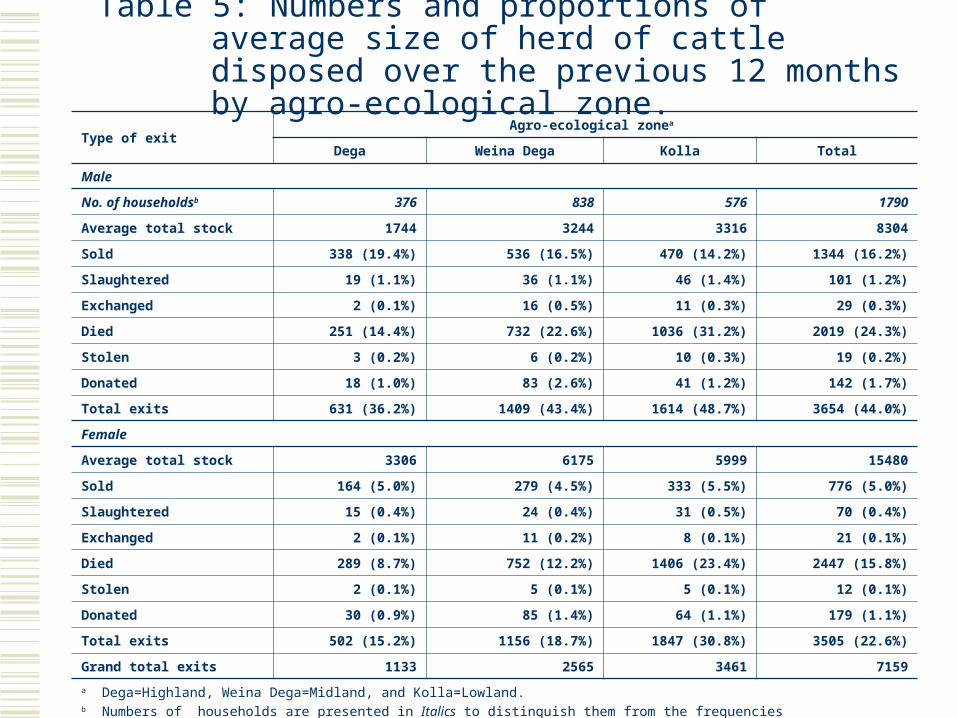
Table 5: Numbers and proportions of average size of herd of cattle disposed over the previous 12 months by agro-ecological zone.
Type of exitAgro-ecological zonea
Dega Weina Dega Kolla Total
Male
No. of householdsb 376 838 576 1790
Average total stock 1744 3244 3316 8304
Sold 338 (19.4%) 536 (16.5%) 470 (14.2%) 1344 (16.2%)
Slaughtered 19 (1.1%) 36 (1.1%) 46 (1.4%) 101 (1.2%)
Exchanged 2 (0.1%) 16 (0.5%) 11 (0.3%) 29 (0.3%)
Died 251 (14.4%) 732 (22.6%) 1036 (31.2%) 2019 (24.3%)
Stolen 3 (0.2%) 6 (0.2%) 10 (0.3%) 19 (0.2%)
Donated 18 (1.0%) 83 (2.6%) 41 (1.2%) 142 (1.7%)
Total exits 631 (36.2%) 1409 (43.4%) 1614 (48.7%) 3654 (44.0%)
Female
Average total stock 3306 6175 5999 15480
Sold 164 (5.0%) 279 (4.5%) 333 (5.5%) 776 (5.0%)
Slaughtered 15 (0.4%) 24 (0.4%) 31 (0.5%) 70 (0.4%)
Exchanged 2 (0.1%) 11 (0.2%) 8 (0.1%) 21 (0.1%)
Died 289 (8.7%) 752 (12.2%) 1406 (23.4%) 2447 (15.8%)
Stolen 2 (0.1%) 5 (0.1%) 5 (0.1%) 12 (0.1%)
Donated 30 (0.9%) 85 (1.4%) 64 (1.1%) 179 (1.1%)
Total exits 502 (15.2%) 1156 (18.7%) 1847 (30.8%) 3505 (22.6%)
Grand total exits 1133 2565 3461 7159
a Dega=Highland, Weina Dega=Midland, and Kolla=Lowland. b Numbers of households are presented in Italics to distinguish them from the frequencies
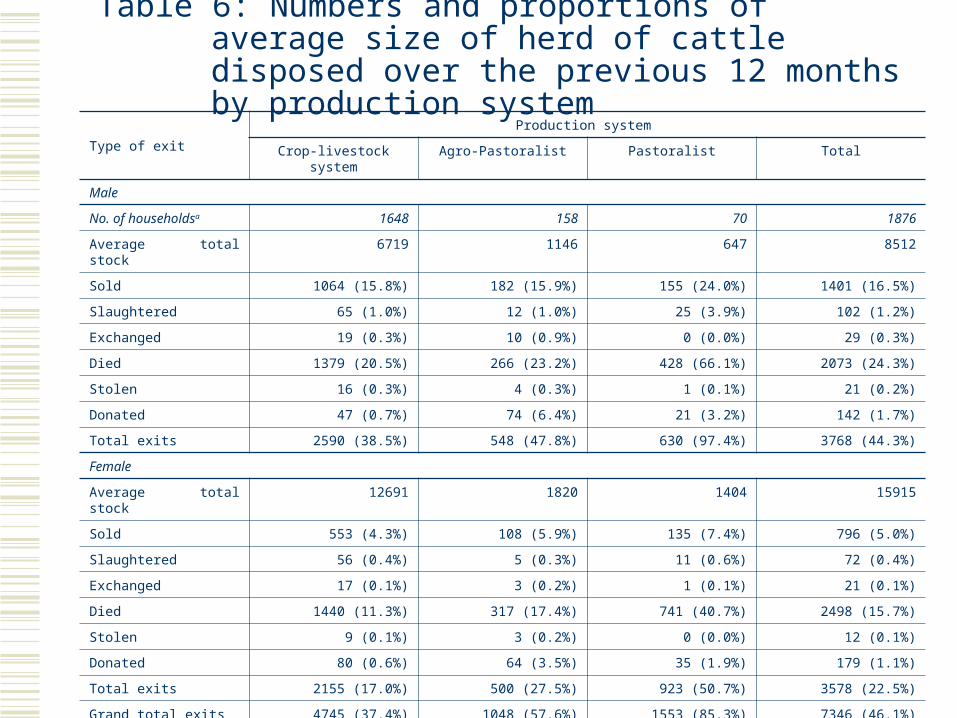
Table 6: Numbers and proportions of average size of herd of cattle disposed over the previous 12 months by production system
Type of exitProduction system
Crop-livestock system Agro-Pastoralist Pastoralist Total
Male
No. of householdsa 1648 158 70 1876
Average total stock 6719 1146 647 8512
Sold 1064 (15.8%) 182 (15.9%) 155 (24.0%) 1401 (16.5%)
Slaughtered 65 (1.0%) 12 (1.0%) 25 (3.9%) 102 (1.2%)
Exchanged 19 (0.3%) 10 (0.9%) 0 (0.0%) 29 (0.3%)
Died 1379 (20.5%) 266 (23.2%) 428 (66.1%) 2073 (24.3%)
Stolen 16 (0.3%) 4 (0.3%) 1 (0.1%) 21 (0.2%)
Donated 47 (0.7%) 74 (6.4%) 21 (3.2%) 142 (1.7%)
Total exits 2590 (38.5%) 548 (47.8%) 630 (97.4%) 3768 (44.3%)
Female
Average total stock 12691 1820 1404 15915
Sold 553 (4.3%) 108 (5.9%) 135 (7.4%) 796 (5.0%)
Slaughtered 56 (0.4%) 5 (0.3%) 11 (0.6%) 72 (0.4%)
Exchanged 17 (0.1%) 3 (0.2%) 1 (0.1%) 21 (0.1%)
Died 1440 (11.3%) 317 (17.4%) 741 (40.7%) 2498 (15.7%)
Stolen 9 (0.1%) 3 (0.2%) 0 (0.0%) 12 (0.1%)
Donated 80 (0.6%) 64 (3.5%) 35 (1.9%) 179 (1.1%)
Total exits 2155 (17.0%) 500 (27.5%) 923 (50.7%) 3578 (22.5%)
Grand total exits 4745 (37.4%) 1048 (57.6%) 1553 (85.3%) 7346 (46.1%)
a Numbers of households are presented in Italics to distinguish them from the frequencies
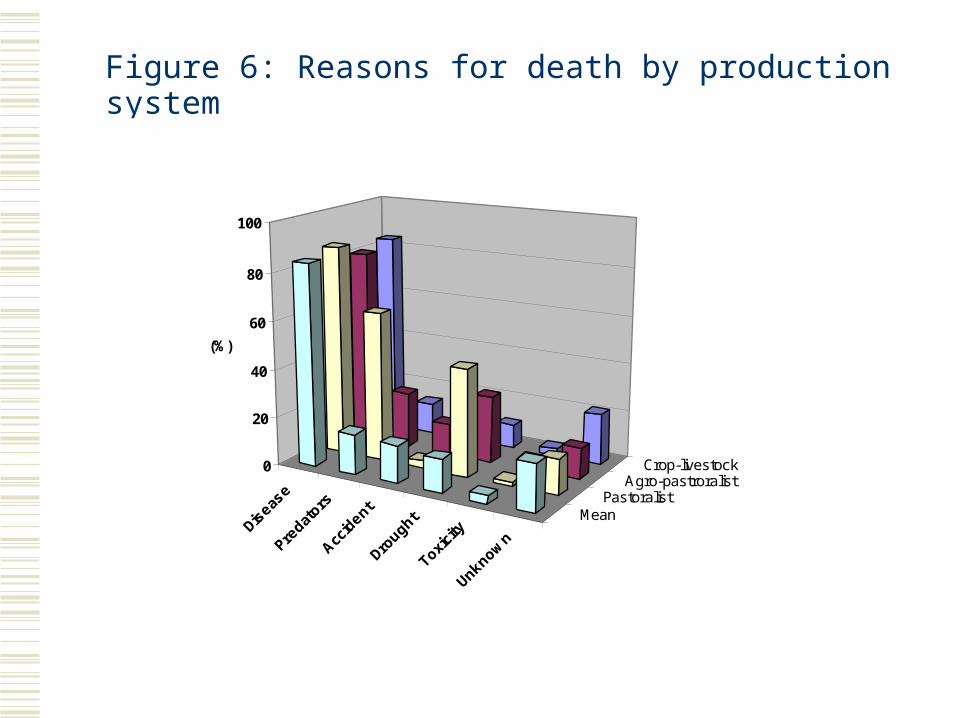
Figure 6: Reasons for death by production system
Diseas
e
Predat
ors
Accid
ent
Drought
Toxici
ty
Unknown
Crop-livestockAgro-pastroralist
PastoralistMean
0
20
40
60
80
100
(%)
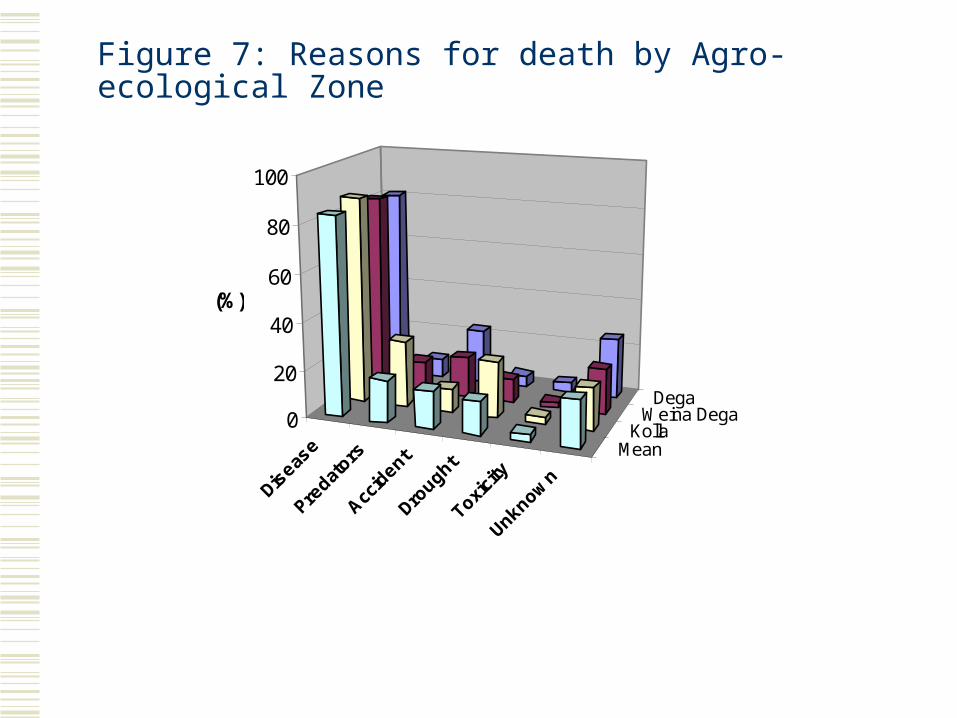
Figure 7: Reasons for death by Agro-ecological Zone
DegaWeina Dega
KollaMean
0
20
40
60
80
100
(%)
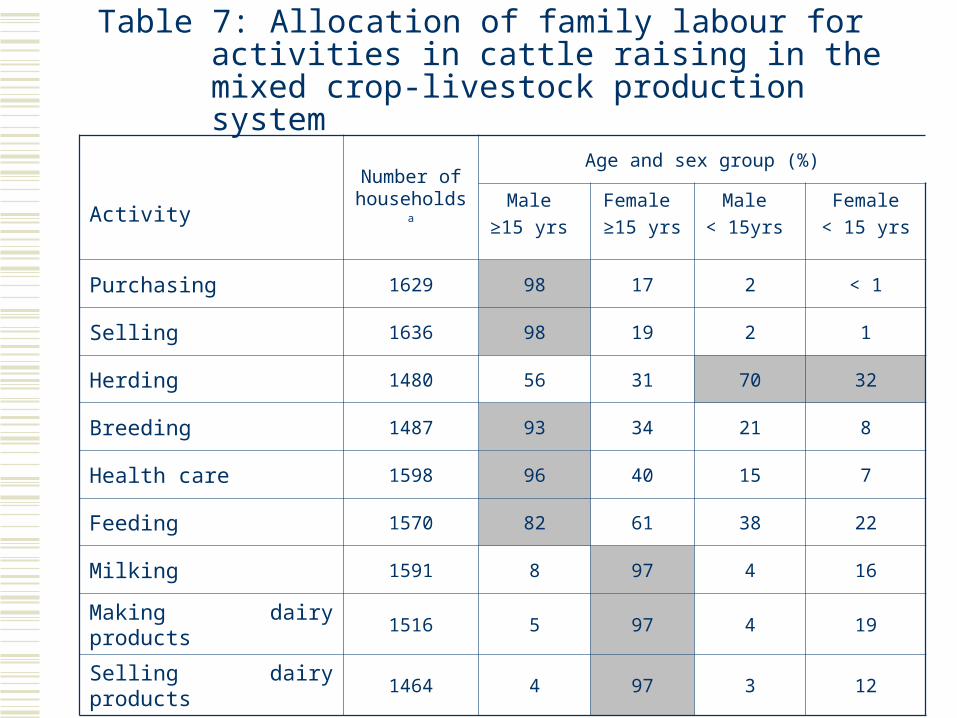
Table 7: Allocation of family labour for activities in cattle raising in the mixed crop-livestock production system
ActivityNumber of
householdsa
Age and sex group (%)
Male
≥15 yrs
Female
≥15 yrs
Male
< 15yrs
Female
< 15 yrs
Purchasing 1629 98 17 2 < 1
Selling 1636 98 19 2 1
Herding 1480 56 31 70 32
Breeding 1487 93 34 21 8
Health care 1598 96 40 15 7
Feeding 1570 82 61 38 22
Milking 1591 8 97 4 16
Making dairy products 1516 5 97 4 19
Selling dairy products 1464 4 97 3 12
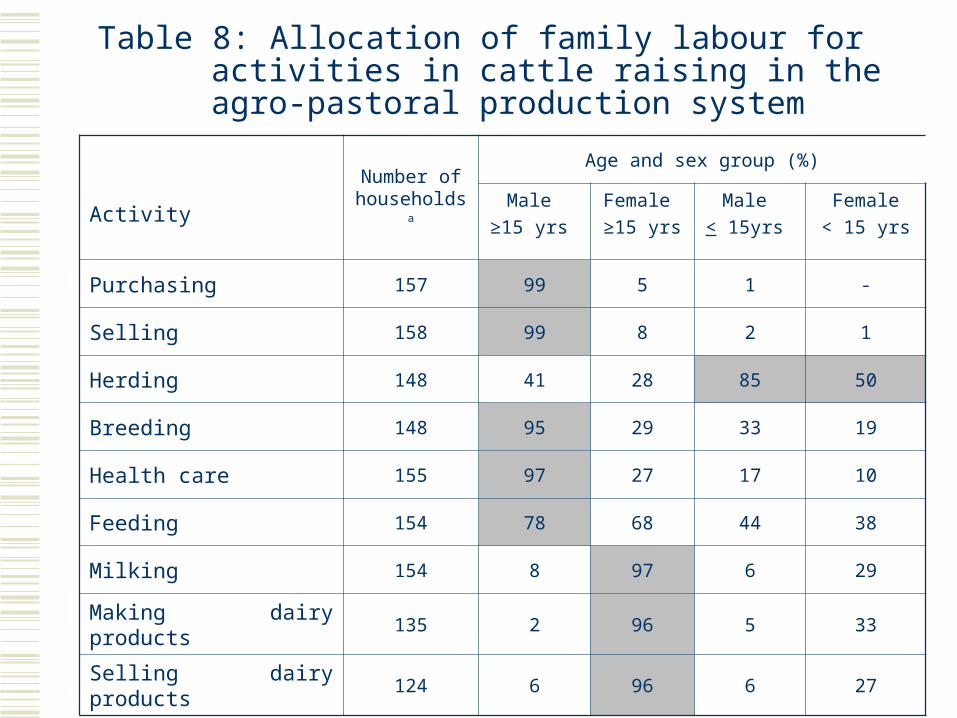
Table 8: Allocation of family labour for activities in cattle raising in the agro-pastoral production system
ActivityNumber of
householdsa
Age and sex group (%)
Male
≥15 yrs
Female
≥15 yrs
Male
< 15yrs
Female
< 15 yrs
Purchasing 157 99 5 1 -
Selling 158 99 8 2 1
Herding 148 41 28 85 50
Breeding 148 95 29 33 19
Health care 155 97 27 17 10
Feeding 154 78 68 44 38
Milking 154 8 97 6 29
Making dairy products 135 2 96 5 33
Selling dairy products 124 6 96 6 27
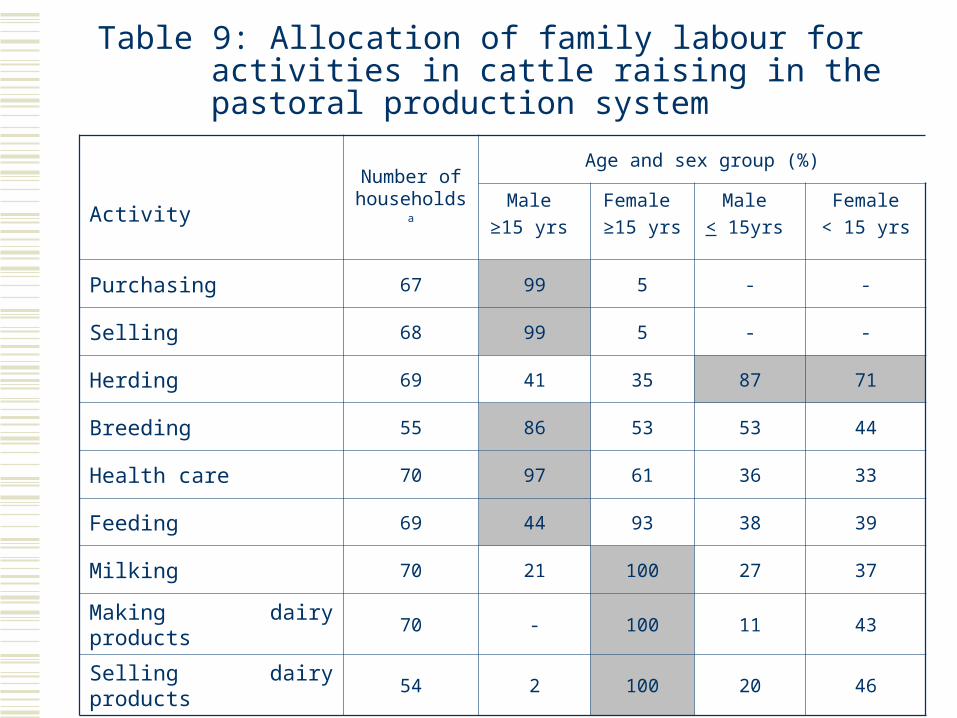
Table 9: Allocation of family labour for activities in cattle raising in the pastoral production system
ActivityNumber of
householdsa
Age and sex group (%)
Male
≥15 yrs
Female
≥15 yrs
Male
< 15yrs
Female
< 15 yrs
Purchasing 67 99 5 - -
Selling 68 99 5 - -
Herding 69 41 35 87 71
Breeding 55 86 53 53 44
Health care 70 97 61 36 33
Feeding 69 44 93 38 39
Milking 70 21 100 27 37
Making dairy products 70 - 100 11 43
Selling dairy products 54 2 100 20 46
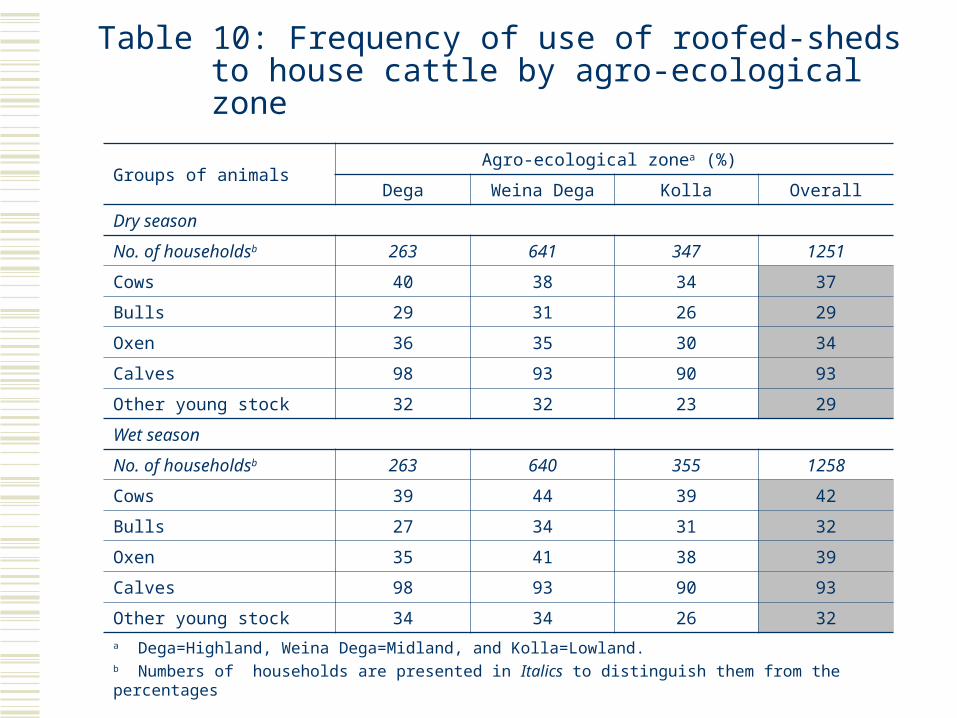
Table 10: Frequency of use of roofed-sheds to house cattle by agro-ecological zone
Groups of animalsAgro-ecological zonea (%)
Dega Weina Dega Kolla Overall
Dry season
No. of householdsb 263 641 347 1251
Cows 40 38 34 37
Bulls 29 31 26 29
Oxen 36 35 30 34
Calves 98 93 90 93
Other young stock 32 32 23 29
Wet season
No. of householdsb 263 640 355 1258
Cows 39 44 39 42
Bulls 27 34 31 32
Oxen 35 41 38 39
Calves 98 93 90 93
Other young stock 34 34 26 32
a Dega=Highland, Weina Dega=Midland, and Kolla=Lowland. b Numbers of households are presented in Italics to distinguish them from the percentages
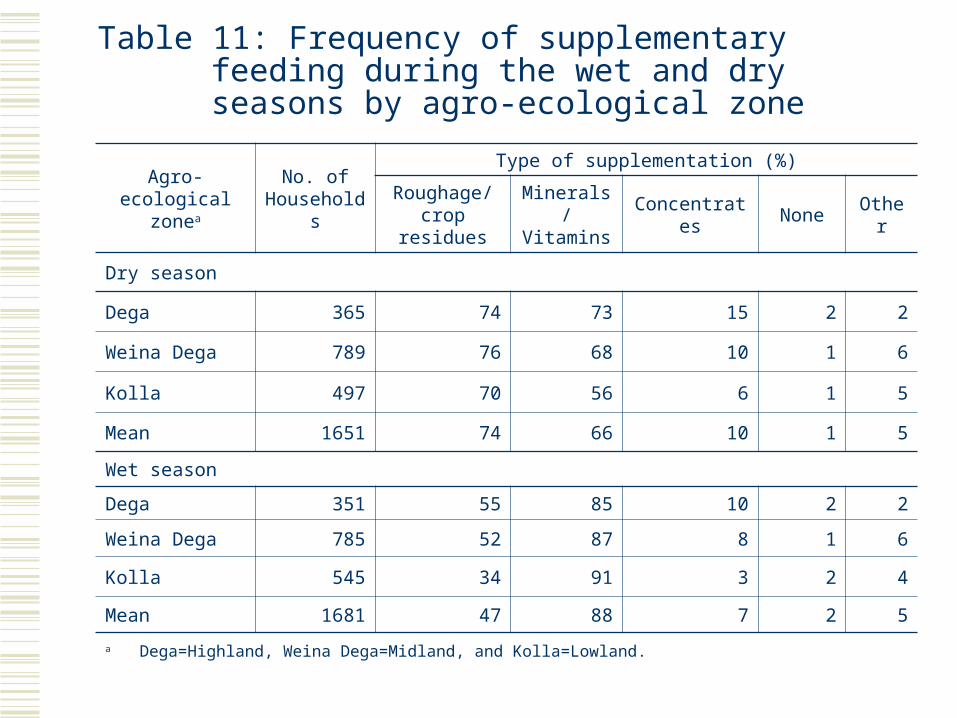
Table 11: Frequency of supplementary feeding during the wet and dry seasons by agro-ecological zone
Agro-ecological zonea
No. of Households
Type of supplementation (%)
Roughage/ crop residues
Minerals/ Vitamins
Concentrates None Other
Dry season
Dega 365 74 73 15 2 2
Weina Dega 789 76 68 10 1 6
Kolla 497 70 56 6 1 5
Mean 1651 74 66 10 1 5
Wet season
Dega 351 55 85 10 2 2
Weina Dega 785 52 87 8 1 6
Kolla 545 34 91 3 2 4
Mean 1681 47 88 7 2 5
a Dega=Highland, Weina Dega=Midland, and Kolla=Lowland.
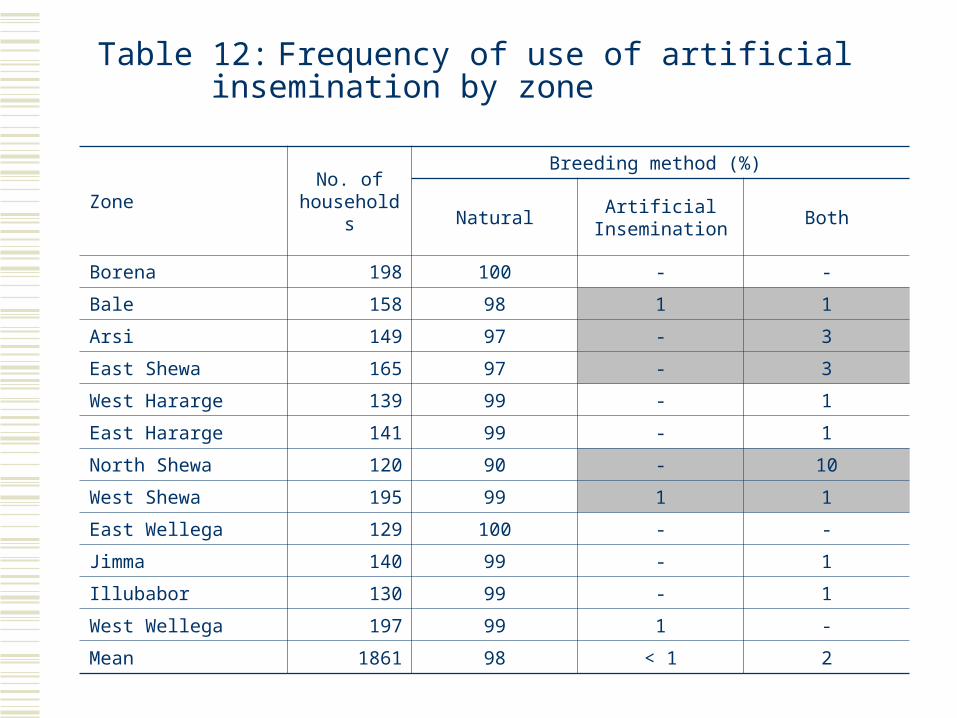
Table 12: Frequency of use of artificial insemination by zone
ZoneNo. of
households
Breeding method (%)
NaturalArtificial
InseminationBoth
Borena 198 100 - -
Bale 158 98 1 1
Arsi 149 97 - 3
East Shewa 165 97 - 3
West Hararge 139 99 - 1
East Hararge 141 99 - 1
North Shewa 120 90 - 10
West Shewa 195 99 1 1
East Wellega 129 100 - -
Jimma 140 99 - 1
Illubabor 130 99 - 1
West Wellega 197 99 1 -
Mean 1861 98 < 1 2
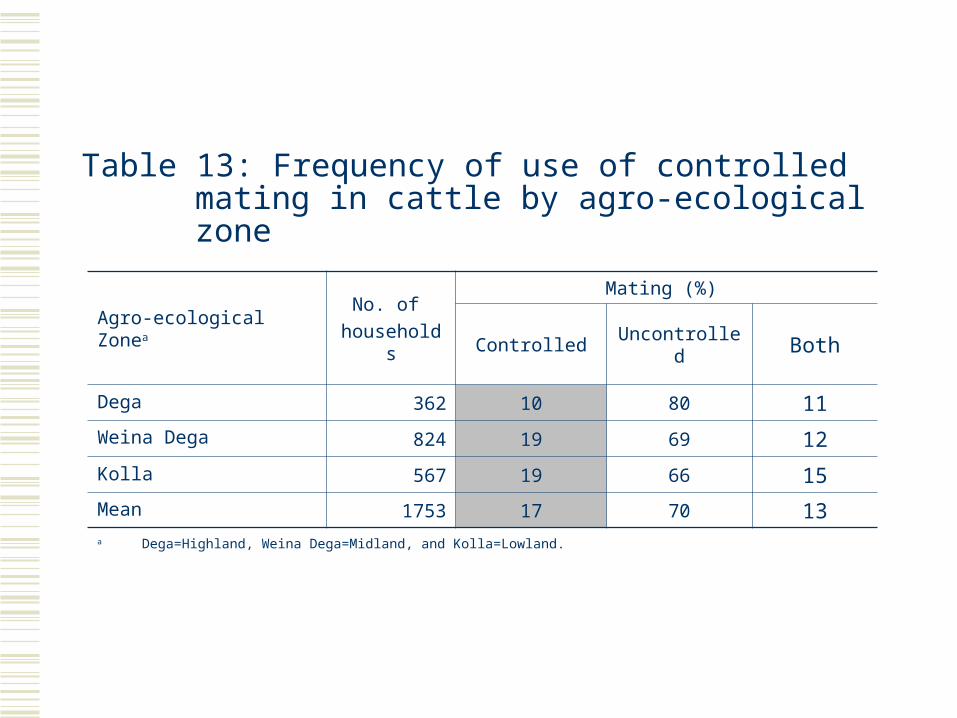
Table 13: Frequency of use of controlled mating in cattle by agro-ecological zone
Agro-ecological ZoneaNo. of
households
Mating (%)
Controlled Uncontrolled Both
Dega 362 10 80 11
Weina Dega 824 19 69 12
Kolla 567 19 66 15
Mean 1753 17 70 13a Dega=Highland, Weina Dega=Midland, and Kolla=Lowland.
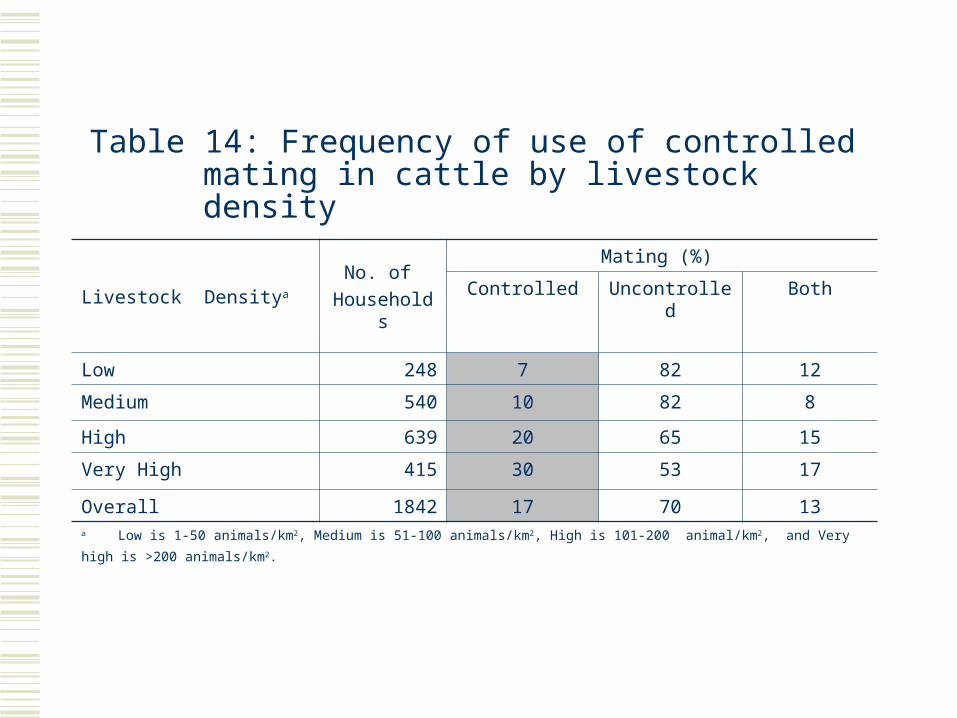
Table 14: Frequency of use of controlled mating in cattle by livestock density
Livestock DensityaNo. of
Households
Mating (%)
Controlled Uncontrolled Both
Low 248 7 82 12
Medium 540 10 82 8
High 639 20 65 15
Very High 415 30 53 17
Overall 1842 17 70 13
a Low is 1-50 animals/km2, Medium is 51-100 animals/km2, High is 101-200 animal/km2, and Very high is >200 animals/km2.
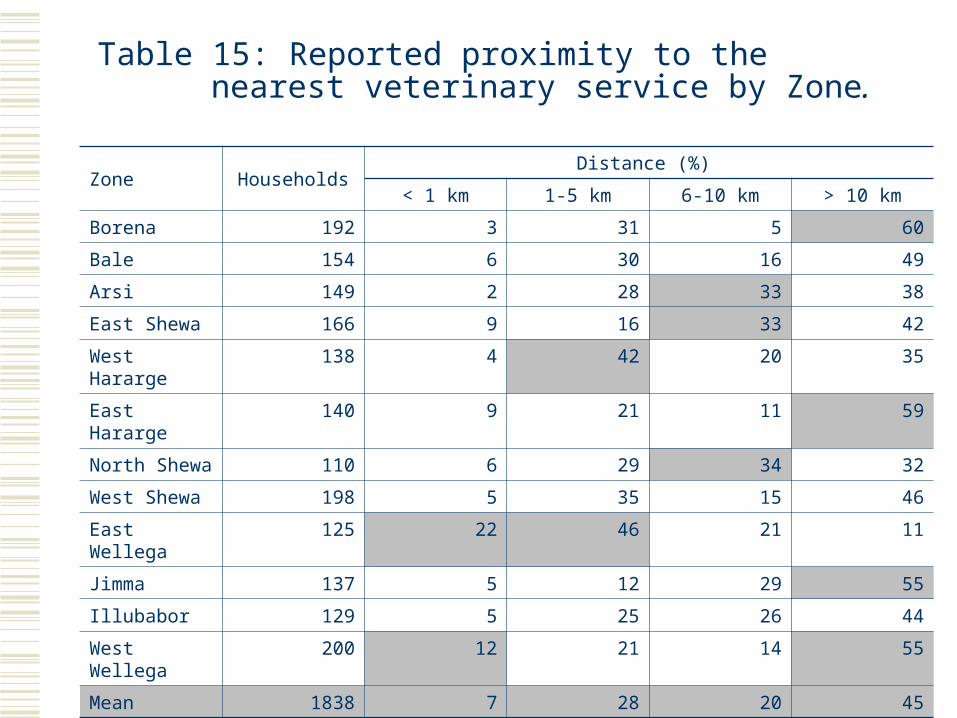
Table 15: Reported proximity to the nearest veterinary service by Zone.
Zone HouseholdsDistance (%)
< 1 km 1-5 km 6-10 km > 10 km
Borena 192 3 31 5 60
Bale 154 6 30 16 49
Arsi 149 2 28 33 38
East Shewa 166 9 16 33 42
West Hararge 138 4 42 20 35
East Hararge 140 9 21 11 59
North Shewa 110 6 29 34 32
West Shewa 198 5 35 15 46
East Wellega 125 22 46 21 11
Jimma 137 5 12 29 55
Illubabor 129 5 25 26 44
West Wellega 200 12 21 14 55
Mean 1838 7 28 20 45
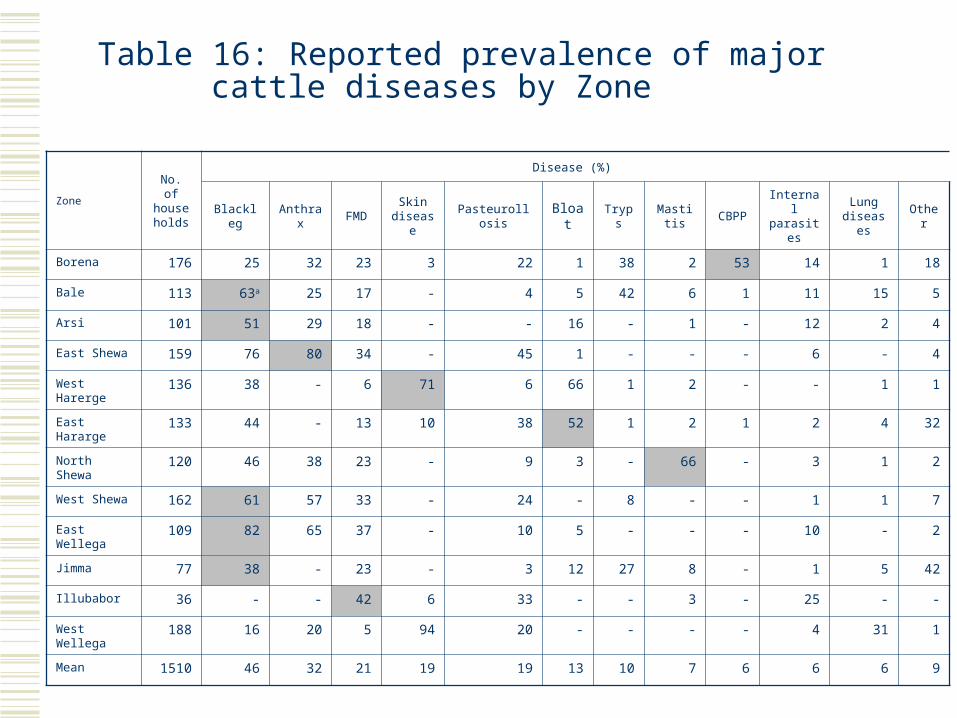
Table 16: Reported prevalence of major cattle diseases by Zone
ZoneNo. of house holds
Disease (%)
Blackleg Anthrax FMDSkin
diseasePasteurollosis Bloat Tryps Mastitis CBPP
Internal parasites
Lung diseases
Other
Borena 176 25 32 23 3 22 1 38 2 53 14 1 18
Bale 113 63a 25 17 - 4 5 42 6 1 11 15 5
Arsi 101 51 29 18 - - 16 - 1 - 12 2 4
East Shewa 159 76 80 34 - 45 1 - - - 6 - 4
West Harerge 136 38 - 6 71 6 66 1 2 - - 1 1
East Hararge 133 44 - 13 10 38 52 1 2 1 2 4 32
North Shewa 120 46 38 23 - 9 3 - 66 - 3 1 2
West Shewa 162 61 57 33 - 24 - 8 - - 1 1 7
East Wellega 109 82 65 37 - 10 5 - - - 10 - 2
Jimma 77 38 - 23 - 3 12 27 8 - 1 5 42
Illubabor 36 - - 42 6 33 - - 3 - 25 - -
West Wellega 188 16 20 5 94 20 - - - - 4 31 1
Mean 1510 46 32 21 19 19 13 10 7 6 6 6 9
Related Documents