PRELIMINARY INVESTIGATIONS INTO OSTRICH MYCOPLASMAS: IDENTIFICATION OF VACCINE CANDIDATE GENES AND IMMUNITY ELICITED BY POULTRY MYCOPLASMA VACCINES Elizabeth Frances van der Merwe Thesis presented in partial fulfilment of the requirements for the degree of Master of Science in Biochemistry at the University of Stellenbosch. Study leader: Prof D.U. Bellstedt December 2006

Welcome message from author
This document is posted to help you gain knowledge. Please leave a comment to let me know what you think about it! Share it to your friends and learn new things together.
Transcript
PRELIMINARY
INVESTIGATIONS INTO OSTRICH MYCOPLASMAS: IDENTIFICATION OF
VACCINE CANDIDATE GENES AND IMMUNITY ELICITED BY POULTRY MYCOPLASMA VACCINES
Elizabeth Frances van der Merwe
Thesis presented in partial fulfilment of the requirements for the degree of Master of Science in
Biochemistry at the University of Stellenbosch.
Study leader: Prof D.U. Bellstedt
December 2006

i
Declaration
I, the undersigned, hereby declare that the work contained in this thesis is my own original work
and has not previously in its entirety or in part been submitted at any university for a degree.
Signature: Date:

ii
Summary
Ostrich farming is of significant economical importance in South Africa. Three ostrich mycoplasmas,
Ms01, Ms02 and Ms03 have been identified previously, and were provisionally named ‘Mycoplasma
struthiolus’ (Ms) after their host Struthio camelus. Ostrich mycoplasmas are the major causative
organisms of respiratory diseases, and they cause stock losses, reduced production and
hatchability, and downgrading of carcasses and therefore lead to large economic losses to the
industry. In order to be pathogenic to their host, they need to attach through an attachment
organelle, the so-called tip structure. This structure has been identified in the poultry mycoplasma,
M. gallisepticum, and is made up of the adhesin GapA and adhesin-related CrmA. Currently, no
ostrich mycoplasma vaccine is commercially available and for this reason the need to develop one
has arisen. Therefore the first part of this study was dedicated to the identification and isolation of
vaccine candidate genes in the three ostrich mycoplasmas. Four primer approaches for polymerase
chain reactions (PCR’s), cloning and sequencing, were used for the identification of adhesin or
adhesin-related genes from Ms01, Ms02 and Ms03. The primer approaches revealed that the target
genes could not be identified due to the high diversity of sequences that were generated. Therefore
sequences were also compared with those of other mycoplasma species in BLAST searches.
Results showed that the most significant hit was with the human pathogen M. hominis oppD, which
is located in the same operon as the membrane protein P100 involved in adhesion. Other hits were
with ABC transporters which may also play a role in cytadhesion.
The second part of this study was aimed at testing whether two poultry mycoplasma vaccines, M.
synoviae and M. gallisepticum, can be used in ostriches to elicit immune responses until an ostrich
mycoplasma vaccine has been developed. Ostriches on three farms of different age groups in the
Oudsthoorn district were therefore vaccinated with these vaccines in a vaccine trial. The enzyme-
linked immunosorbent assay (ELISA) was used to test the level of antibody response. Results
showed that both vaccines elicited an immune response in all three age groups. A high percentage
of the ostriches reacted positively, which indicates that both vaccines elicit antibody responses and
may therefore give protection against ostrich mycoplasma infections.
iii
Opsomming
Volstruisboerdery is ‘n belangrike ekonomiese sektor in Suid-Afrika. Drie volstruismikoplasmas,
Ms01, Ms02 en Ms03, is voorheen geïdentifiseer en voorlopig ‘Mycoplasma struthiolus’ (Ms)
benaam na aanleiding van hul gasheer, Struthio camelus. Volstruismikoplasmas is die grootste
oorsaaklike organismes van respiratoriese siektes, kudde verliese en die afgradering van karkasse
wat lei tot groot ekonomiese verliese in die volstruisbedryf. Ten einde patogenies vir die gasheer te
wees, moet mikoplasmas deur middel van ‘n aanhegtingsmeganisme vasheg – die sogenaamde
puntvormige struktuur. Hierdie struktuur is in die pluimvee mikoplasma M. gallisepticum
geïdentifiseer, en bestaan uit aanhegting proteïen GapA en die aanhegting verwante proteïen
CrmA. Tans is geen volstruismikoplasma entstof kommersieel beskikbaar nie, en derhalwe het die
behoefte ontstaan om so ‘n entstof te ontwikkel. Die eerste gedeelte van hierdie studie is dus gewy
aan die identifisering en isolering van entstof kandidaat gene in al drie volstruismikoplasmas. Vier
inleier benaderings vir polimerase ketting reaksies (PKR), klonering asook geenopeenvolging
bepalings vir die identifisering van aanhegting of aanhegting verwante gene vanuit Ms01, Ms02 en
Ms03 is gebruik. Die inleier benaderings het getoon dat die teikengene nie geïdentifiseer kon word
nie as gevolg van hoë variasie in die gegenereerde geenopeenvolgings. Derhalwe is
geenopeenvolgings met ander mikoplasma spesies deur middel van BLAST soektogte vergelyk.
Resultate het getoon dat die betekenisvolste ooreenstemming dié met die menslike patogeen M.
hominis oppD was, wat deel vorm van die membraan proteïen P100 operon wat betrokke is by
aanhegting. Ander ooreenstemmings sluit ABC transporters in wat moontlik betrokke kan wees by
aanhegting.
Die tweede gedeelte van hierdie studie het ten doel gehad om te toets of twee pluimvee
mikoplasma entstowwe, M. synoviae en M. gallisepticum, gebruik kan word in volstruise om
immuunresponse te ontlok tot tyd en wyl ‘n volstruismikoplasma entstof ontwikkel is. Volstruise
vanaf drie plase in verskillende ouderdomsgroepe in die Oudtshoorn distrik was ingeënt met hierdie
entstowwe in ‘n entstof proefneming. Die ensiem-afhanklike immuno-absorpsie essaï (ELISA) was
gebruik om antiliggaam response te toets. Die resultate het getoon dat beide entstowwe
immuunresponse ontlok het in al drie ouderdomsgroepe. ‘n Groot persentasie van die volstruise het
positief gereageer wat ‘n aanduiding is dat beide entstowwe immuunresponse ontlok het en kan
dus beskerming bied teen volstruismikoplasma infeksies.

iv
Acknowlegements
I would like to express my sincere appreciation to the following people:
Prof. D.U. Bellstedt for his guidance and support as study leader, and also the opportunity to
have been part of this research project in his laboratory.
Dr. A. Botes for sharing her knowledge on mycoplasmas, and working with her on this project.
Prof. T. McCutchan for broadening our knowledge on how to use the BLAST tools more
efficiently.
Mnr. W. Botes for the statistical analysis of the ELISA results.
Klein Karoo Group for financial support.
Very special thanks to Jim, Elsabé & Carel van der Merwe, and Salmien & Chris Symeonidis for
their constant love and support.
Wilhelm Uys for his patience and help with the editing, and his love and support.
God, for making all things possible.

Table of Contents
v
Table of Contents
Declaration .......................................................................................................................................... i Summary ............................................................................................Error! Bookmark not defined. Opsomming ........................................................................................Error! Bookmark not defined. Acknowledgements ............................................................................Error! Bookmark not defined. List of Figures...................................................................................................................................viii List of Tables ...................................................................................................................................... x Abbreviations..................................................................................................................................... xi 1. Introduction..................................................................................................................................1
1.1 Objectives of the Study....................................................................................................2 2. Avian Mycoplasmas
2.1 Introduction ......................................................................................................................4 2.2 Early mycoplasma identification and taxonomy...............................................................4 2.3 Distribution of mycoplasmas............................................................................................5 2.4 Evolution and Taxonomy .................................................................................................5 2.5 Phylogenetic Studies Using Mycoplasma Ribosomal Genes ..........................................7
2.5.1 rRNA and tRNA genes .........................................................................................7 2.5.2 Use of 16S rRNA as phylogenetic marker ...........................................................8 2.5.3 Ostrich specific mycoplasmas..............................................................................9
2.6 Morphology and Biochemistry .......................................................................................11 2.7 Mycoplasmas Affecting Domestic Poultry......................................................................13
2.7.1 Epidemiology......................................................................................................13 2.7.1.1 Natural host ..........................................................................................13 2.7.1.2 Infection................................................................................................14 2.7.1.3 Transmission ........................................................................................15
2.7.2 Clinical signs and lesions ...................................................................................16 2.7.3 Diagnosis ...........................................................................................................18
2.7.3.1 Diagnostic samples ..............................................................................19 2.7.3.2 Identification of a mycoplasma infection...............................................19 2.7.3.3 Serology ...............................................................................................21
2.7.4 Treatment with antibiotics ..................................................................................22 2.7.5 Prevention and control of poultry mycoplasmas ................................................23
2.8 The South African Ostrich..............................................................................................24 2.8.1 Respiratory system and respiration....................................................................24 2.8.2 Mycoplasma infections in the ostrich .................................................................25 2.8.3 Other respiratory diseases in the ostrich............................................................26
2.9 Poultry Mycoplasma Vaccines.......................................................................................28 2.9.1 Vaccines.............................................................................................................30
2.9.1.1 Killed vaccines (bacterins)....................................................................30 2.9.1.2 Live vaccines........................................................................................30 2.9.1.3 M. gallisepticum vaccines.....................................................................31 2.9.1.4 M. synoviae vaccines ...........................................................................32

Table of Contents
vi
2.9.1.5 DNA vaccines.......................................................................................32 2.9.2 Administration of vaccine ...................................................................................33
2.9.2.1 Individual vaccination ...........................................................................33 2.9.2.2 Flock vaccination..................................................................................34
2.9.3 Previous studies with poultry mycoplasma vaccines .........................................35 2.9.4 Antibody response .............................................................................................37
2.10 Pathogenicity of Mycoplasmas ......................................................................................38 2.10.1 Adhesion to host cell ..........................................................................................38 2.10.2 Interaction with the host immune system ...........................................................40 2.10.3 Other possible virulence causal factors .............................................................41
2.11 The Mycoplasma Genome.............................................................................................42 2.11.1 General characteristics of the genome ..............................................................42 2.11.2 The M. gallisepticum strain Rlow genome .........................................................44 2.11.3 The genes and proteins involved in host cell adhesion......................................46
3. Genomic Investigations towards Vaccine Candidate Genes against Ostrich Mycoplasmas 3.1 Introduction ....................................................................................................................52
3.2 Materials and Methods ..................................................................................................53 3.2.1 Gene order comparisons of mycoplasma genomes...........................................53 3.2.2 Primer development ...........................................................................................54
3.2.2.1 Primer approach 1................................................................................54 3.2.2.2 Primer approach 2................................................................................56 3.2.2.3 Primer approach 3................................................................................58 3.2.2.4 Primer approach 4................................................................................60
3.2.3 Isolation of genomic DNA...................................................................................61 3.2.4 PCR amplification...............................................................................................62 3.2.5 Detection of PCR products.................................................................................64 3.2.6 Cloning of PCR products....................................................................................64
3.2.6.1 Ligation of PCR product into pGEM-T Easy Vector .............................66 3.2.6.2 Transformation of E. coli with ligation products....................................66 3.2.6.3 Diagnostic PCR....................................................................................67 3.2.6.4 Overnight culture of recombinant colonies ...........................................67 3.2.6.5 Isolation of recombinant plasmid DNA .................................................68 3.2.6.6 Insert check PCR .................................................................................68
3.2.7 Sequencing ........................................................................................................68 3.2.7.1 Sequencing of PCR products ...............................................................68 3.2.7.2 Sequencing of isolated plasmid DNA...................................................69
3.2.8 Analysis of sequences .......................................................................................69 3.2.9 Comparison of mycoplasma sequences using BLAST ......................................70
3.3 Results...........................................................................................................................71 3.3.1 Gene order comparisons of mycoplasma genomes...........................................71 3.3.2 PCR amplification...............................................................................................72
3.3.2.1 Primer approach 1................................................................................73 3.3.2.2 Primer approach 2................................................................................75 3.3.2.3 Primer approach 3................................................................................77 3.3.2.4 Primer approach 4................................................................................78
3.3.3 Cloning of PCR products....................................................................................80 3.3.4 Alignment of sequences.....................................................................................82 3.3.5 Sequence analysis of cloned DNA fragments using BLAST..............................83
3.4 Discussion .....................................................................................................................88
Table of Contents
vii
4. Trials with Poultry Mycoplasma Vaccines in Ostriches 4.1 Introduction ....................................................................................................................92
4.2 Material and Methods ....................................................................................................93 4.2.1 Poultry mycoplasma vaccines used in study......................................................93 4.2.2 Serum from ostriches included in the vaccine trial .............................................93 4.2.3 Enzyme-linked immunosorbent assay ...............................................................94
4.2.3.1 Isolation and biotinylation of rabbit anti-ostrich Ig ..................................................94 4.2.3.2 ELISA for detection of humoral Ig antibodies to M. synoviae.................................95
4.2.4 Statistical analysis..............................................................................................96
4.3 Results...........................................................................................................................96 4.3.1 Adaptation of ELISA...........................................................................................96 4.3.2 Statistical analysis of ELISA results ...................................................................97 4.3.3 Immune response of ostrich chicks....................................................................98
4.3.3.1 Farm 1: 3 month old ostrich chicks.......................................................98 4.3.3.2 Farm 2: 4-5 month old ostrich chicks .................................................100 4.3.3.3 Farm 3: 6-7 month old ostrich chicks .................................................101
4.4 Discussion ...................................................................................................................102 5. Conclusion and Future Perspectives ....................................................................................106 Literature Cited.............................................................................................................................109 Appendix A Nucleotide sequence alignment of domain B.......................................................120 Appendix B Vaccine trial in ostriches: ELISA results...............................................................124 Appendix C Statistical analysis of ELISA results using SAS ...................................................132
List of Figures
viii
List of Figures Figure 2.1 Phylogenetic analysis of the 16S rRNA gene of avian mycoplasmas.. .......................... 10 Figure 2.2 Complete genome of M. gallisepticum strain Rlow (Papazisi et al., 2003). ..................... 45 Figure 2.3 The gapA operon of M. gallisepticum............................................................................. 47 Figure 2.4 Operon of M. pneumoniae surface adhesin P1.............................................................. 48 Figure 2.5 The MgPa operon of M. genitalium.. .............................................................................. 49 Figure 2.6 The M. hominis opp operon consisting of P100 and OppBCDF downstream of it.. ....... 49 Figure 3.1 Primer approach 1: Primer pairs used for amplification of M. gallisepticum GapA and
CrmA (Papazisi et al., 2000)..................................................................................................... 55 Figure 3.2 Amino acid alignment of the domain B region of mycoplasma cytadhesin as well as
cytadhesin-related molecules.. ................................................................................................. 56 Figure 3.3 Primer approach 2: Primers developed from the nucleotide as well as amino acid
alignment of mycoplasma cytadhesin and cytadhesin-related sequences.. ............................. 57 Figure 3.4 Nucleotide alignment of M. synoviae (Synoviae) against M. gallisepticum GapA and
domain B (GapA and GapADB respectively). ........................................................................... 59 Figure 3.5 Primer approach 3: Primer E2R was developed for the area between EF and DR, but still
in M. gallisepticum GapA domain B.......................................................................................... 60 Figure 3.6 Primer approach 4: Primers E2F and E3R were developed from the alignment of M.
synoviae with M. gallisepticum GapA. ...................................................................................... 61 Figure 3.7 The pGEM-T Easy Vector circle map used for cloning of PCR products.. ..................... 65 Figure 3.8 Comparison of mycoplasma genomes using the Gene plot tool on the NCBI website. . 72 Figure 3.9 Gel electrophoresis of amplification products during optimisation of PCR reactions for
primer approach 1..................................................................................................................... 74 Figure 3.10 Gel electrophoresis of amplification products during optimisation of PCR reactions for
primer approach 2. ................................................................................................................... 76 Figure 3.11 Gel electrophoresis of amplification products for primer approach 3 with DNA from
Ms01 and Ms03 using primer combination EF+E2R.. .............................................................. 78 Figure 3.12 Gel electrophoresis of amplification products during optimisation of PCR reactions at 36
ºC for primer approach 4. ........................................................................................................ 79 Figure 3.13 Gel electrophoresis of insert check PCR using primers T7 and SP6. ......................... 81 Figure 4.1 ELISA for detection of humoral Ig antibodies to M. synoviae......................................... 95 Figure 4.2 Average antibody response to M. synoviae of 3 month old ostrich chicks on Farm 1. . 99 Figure 4.3 Average antibody response to M. synoviae of 4-5 month old ostrich chicks on Farm 2.
................................................................................................................................................ 100

List of Figures
ix
Figure 4.4 Average antibody response to M. synoviae of 6-7 month old ostrich chicks on Farm 3.
................................................................................................................................................ 101

List of Tables
x
List of Tables Table 2.1 Molecular characteristics and taxonomy of the class Mollicutes. ...................................... 7 Table 3.1 Primers A – E used in primer approach 1. Base pair positions given are relative to the M.
gallisepticum gapA and crmA genes. ....................................................................................... 55 Table 3.2 Sequence of the primers used in primer approach 2, as well as their base pair positions
relative to the M. gallisepticum gapA and crmA genes............................................................. 58 Table 3.3 Sequence of primer E2R developed for primer approach 3 and primer EF, as well as
their base pair positions relative to the M. gallisepticum gapA and crmA genes...................... 60 Table 3.4 Sequence of primers developed for primer approach 4, as well as their base pair
positions relative to the M. gallisepticum gapA and crmA genes.............................................. 61 Table 3.5 T7 and SP6 promoter primers used for sequencing of cloned inserts. The bp-position is
that of the pGEM-T Easy vector. .............................................................................................. 65 Table 3.6 Summary of master mix for individual primer combinations............................................ 63 Table 3.7 PCR programs used in DNA amplification reactions for Ms01, Ms02 and Ms03.. .......... 64 Table 3.8 Protocol for the ligation reaction of standard reactions for cloning PCR products into
pGEM-T Easy Vector (Promega), as well as positive control and background control.. .......... 66 Table 3.9 Expected amplification products as well as actual amplification products obtained with
primers A – E for primer approach 1......................................................................................... 73 Table 3.10 Expected amplification products as well as actual amplification products obtained with
primers used in primer approach 2.. ......................................................................................... 75 Table 3.11 Amplification products expected as well as products obtained from primer combination
for primer approach 3.. ............................................................................................................. 77 Table 3.12 Expected amplification products as well as products amplified with primer combinations
used in primer approach 4.. ...................................................................................................... 79 Table 3.13 Summary of the PCR products of the four primer approaches that were used for cloning
with the pGEM-T Easy Vector System.. ................................................................................... 80 Table 3.14 Summary of significant hits of Ms01 with Mycoplasma species with BLASTN search.. 84 Table 3.15 Summary of most significant hits of Ms01 sequences with Mycoplasma species with the
TBLASTX search ...................................................................................................................... 85 Table 4.1 Summary of the ostriches used in the poultry mycoplasma vaccine trial. ....................... 94 Table 4.2 Fraction and percentage of the ostriches on Farm 1 that reacted to vaccination............ 99 Table 4.3 Fraction and percentage of the ostriches on Farm 2 that reacted to vaccination.......... 101 Table 4.4 Fraction and percentage of the ostriches on Farm 3 that reacted to vaccination.......... 102

Abbreviations
xi
Abbreviations
A+T adenine and thymine ABTS 2,2’-Azino-di(3-ethylbenzthiazoline sulphonic acid-6) ANOVA analysis of variance AVPO streptavidin peroxidase Biotin biotinamidocaproate N-Hydroxysuccinimide ester BLAST Basic Local Alignment Search Tool bp base pairs CDS coding DNA sequences crm cytadherence-related molecule DAPSA DNA and protein sequence alignment DGGE denaturing gradient gel electrophoresis DNA deoxyribonucleic acid DMF N,N Dimethylformamid EDTA ethylene diamine tetra-acetic acid di-sodium salt ELISA enzyme-linked immunosorbent assay EU European Union E-value Expect value G+C guanine and cytosine GLM general linear model h hours HI haemagglutination inhibition HMW high-molecular-weight protein HPAI high-pathogenic avian influenza HRPO horseradish peroxidase Ig immunoglobulin IPTG isopropyl ß-D-thiogalactopyranoside
Abbreviations
xii
kb kilobase pairs kDa kilo Dalton LB Luria-Bertani LSD least significant difference MHC major histocompatibility complex min minutes mol% molecular percentage NCBI National Center for Biotechnology Information nr non-redundant nt nucleotide Opp oligopeptide permease oriC origin of replication ORF open reading frame PBS phosphate buffered saline PCR polymerase chain reaction RB reaction buffer RNA ribonucleic acid rpm resolutions per minute rRNA ribosomal RNA SAS Statistical Analysis System SDS-PAGE sodium dodecyl sulphate-polyacrylamide gel electrophoresis sec seconds SPA serum plate agglutination TA tube agglutination Tc cytotoxic T-cells TCA tricarboxylic acid Th T-helper cells Tm melting temperature

Abbreviations
xiii
tRNA transfer RNA UV ultra-violet
Introduction 1
1. Introduction
In South Africa, ostrich farming is of significant economical importance. The farming of domestic
ostriches, Struthio camelus, commenced in South Africa in 1857 and is still an important contributor
to the agricultural economy. In the twentieth century during World War I, the industry, which then
focused mainly on the marketing of feathers, experienced a decrease in demand and almost
collapsed. However, after World War II, it slowly recovered again and South Africa has ever since
been in control of the world ostrich industry (Van der Vyfer, 1992; Kimminau, 1993; Deeming,
1999). Even though the industry is mainly confined to the Oudsthoorn area in the Klein Karoo, its
importance as a foreign currency earner is expanding. With a yearly export income of R1,2 billion,
the ostrich production is one of the top twenty agro-based industries in South Africa. Employment
for a broad range of employees is also provided, specifically to the unskilled in areas where
employment would otherwise be scarce
(http://www.saobc.co.za/modules.php?name=News&file=article&sid=19).
Ostriches are not only of importance for the production of feathers. Ostrich leather is presently
considered to be a very glamorous product, and the meat is considered healthy since it contains
less fat, calories and cholesterol than any other meat (Kimminau, 1993). All these products as well
as fertile eggs and live ostriches are exported (Verwoerd, 2000). This export places an expanding
demand on the industry regarding product quality and disease control, in particular that the meat
does not contain any disease-forming organisms that might infect humans and poultry in the
European Union (EU). The recent outbreak of avian influenza in South Africa serves to illustrate
this point.
On 6 August 2004, the South African Department of Agriculture implemented a voluntary ban on
the export of ostriches and ostrich products due to the outbreak of avian influenza in the Eastern
Cape on two farms. On 11 August 2004, the EU confirmed that the ban was restricted to the import
of live ostriches, ostrich meat and ostrich eggs. The resumption of imports was approved by the EU
in November 2005 after the voluntary ban on ostrich meat exports was lifted by the Department of
Agriculture on 13 September 2005. Exports have been resumed since November 2005. However,
losses to the industry ran into millions of rands (Gerber, 2005;
http://www.saobc.co.za/modules.php?name=News&file=article&sid=51;
http://www.saobc.co.za/modules.php?name=News&file=article&sid=32;
http://www.saobc.co.za/modules.php?name=News&file=article&sid=31).
Introduction 2 Diseases, especially respiratory diseases, also cause significant losses in ostrich production, not
only in South Africa but also in the rest of the world. Mycoplasmas are one of the causative
organisms of respiratory diseases (Botes et al., 2005b). They cause high mortalities in ostrich
chicks and are responsible for downgrading of carcasses in slaughter ostriches, which has a
meaningful effect on the production of ostrich products. Although there are serious concerns about
the transmissibility of mycoplasmas via ostrich products, there has been no indication that
mycoplasmas spread through the meat (Verwoerd, 2000). In spite of this, serious concerns exist
about the transmission of mycoplasmas to other countries via contaminated meat and it is for this
reason that meat exports have to be kept under control.
In previous studies in this laboratory, three ostrich specific mycoplasmas have been identified
(Botes et al., 2004, 2005a). Mycoplasma infections are seasonal, mostly during winter and when
rapid changes in temperature occur, such as from winter to summer. Although vaccines and
antibiotics against poultry mycoplasmas are available, currently no registered mycoplasma vaccine
specific for use in ostriches exists.
1.1 Objectives of the Study
In order to overcome mycoplasma infections the ostrich industry took a decision to investigate
vaccine strategies against these organisms. Strategies include, firstly, the development of
specific vaccines against the three ostrich mycoplasmas, and, secondly, an investigation into
the effectiveness of poultry mycoplasma vaccines against ostrich mycoplasmas.
The objectives of this study, based on the strategies, were therefore:
the identification of an attachment organelle gene with a possible role in virulence;
the isolation of the attachment organelle gene once it has been identified with a view
to use it as a vaccine candidate gene; and
testing whether existing poultry mycoplasma vaccines could elicit an immune
response in ostriches
In this thesis, a literature review regarding mycoplasmas and the importance of genes related
to adhesion, and possibly pathogenicity, with specific focus on poultry mycoplasmas is given
in Chapter 2. Chapter 3 deals with a genomic investigation towards finding candidate genes
with a possible role in virulence from the three ostrich mycoplasmas, identified by Botes et al.
(2004, 2005a). Chapter 4 describes a vaccine trial using poultry mycoplasma vaccines in

Introduction 3
ostriches in the Oudtshoorn area. A brief summary and future perspectives are given in
Chapter 5.
Avian Mycoplasmas 4
2. Avian Mycoplasmas
2.1 Introduction
In order to understand the biochemical processes that allow mycoplasmas to survive and
grow, it is necessary to understand their origin and development. How they evolved, as well
as their characteristics and morphology, their distribution in nature and how they attach to
their host cell in order to be pathogenic, has been studied extensively.
Mycoplasmas are widespread in nature and infect many vertebrate and invertebrate
organisms. In this literature review, general information regarding mycoplasma species will be
discussed, including how they evolved. Thereafter the focus will move to avian mycoplasmas
and more specifically the four major poultry pathogens. The diseases that they cause as well
as available treatments, which include different methods of vaccination, will be outlined. Since
this research project focuses on mycoplasmas in the South African ostrich, other respiratory
diseases in ostriches will also be discussed briefly. A short discussion on their morphology
and characteristics, with special reference to pathogenicity and survival in their hosts, will
follow this. Finally, the genes as well as proteins involved in adhesion will be discussed.
2.2 Early mycoplasma identification and taxonomy
Mycoplasmas are the smallest self-replicating organisms and have been a popular research
topic since the 1800’s. These fascinating organisms were cultivated successfully for the first
time in 1898 by E. Nocard and E.R. Roux at the Pasteur Institute in Paris (Edward et al. 1967
as referred to in Razin, 1992). The name “mycoplasma” is derived from the Greek mykes
(fungus) and plasma (something molded or formed) (Edward et al. 1967 as referred to in
Razin, 1992), which is ironic as mycoplasmas are not fungi. At first, mycoplasmas were
believed to be viruses because of their small size as they could pass through filters with a
pore size of 450 nm. However, when the characteristics of a true virus were clarified in the
1930’s, this theory proved to be wrong. Later on it was implied that mycoplasmas were stable
L-phase variants of common bacteria, but this relationship was also ruled out in the late
1960’s (Razin, 1992; Rottem and Barile, 1993; as referred to in Baum, 2000).
In 1967, the wall-less prokaryotes were divided from the eubacteria into a class of their own,
namely the Mollicutes, for which the trivial name mycoplasmas is used (Freundt, 1973; Razin,
1978). The name Mollicutes was derived from the Latin mollis (soft) and cutis (skin) which
Avian Mycoplasmas 5
implies the absence of a cell wall (Razin et al., 1998). It is now accepted that mycoplasmas
are a group of eubacteria that evolved from Gram-positive bacteria and maintain the unique
position of being the smallest self-replicating prokaryote lacking a cell wall (Razin, 1992;
Rottem and Barile, 1993; Dybvig and Voelker, 1996).
2.3 Distribution of mycoplasmas
Mycoplasmas have a wide variety of hosts which include humans, domestic and wild
mammals, birds, plants, reptiles, fish, arthropods and insects (Razin and Freundt, 1984;
Razin, 1992; Razin et al., 1998). All mycoplasmas, of which there are over 180 species, are
parasites, commensals or saprophytes, and many are pathogenic (Razin and Freundt, 1984;
Razin et al., 1998; Rottem, 2002). They cause chronic, generally mild infections, but rarely kill
their host which makes them an ideal parasite (Razin, 1999). They are relatively strict host,
organ and tissue specific organisms through which their obligate parasitic mode of life and
nutritionally exacting nature is revealed. Exceptions are also possible where a mycoplasma is
found in a host, organ or tissue other than its natural habitat (Razin, 1992; Coetzer et al.,
1994; Razin et al., 1998).
Human and animal mycoplasmas are primarily found to occur in the mucous surfaces of the
respiratory and urogenital tracts, the eyes, alimentary canal, mammary glands and joints
(Coetzer et al., 1994; Razin et al., 1998).
2.4 Evolution and Taxonomy
One hypothesis was that the mycoplasma genome evolved several times, as early as 590 to
600 million years ago from the Clostridium – Lactobacillus – Streptococcal branch from an
organism with a genome size about 2000 kb. Approximately 450 million years ago the
mycoplasma phylogenetic tree split into two major branches, possibly from an organism with
genome size of 1700 – 2000 kb. Mycoplasma sublines with genome sizes of 1200 – 1700 kb
evolved from both branches. Mycoplasma species with small genome sizes of 600 – 1100 kb
arose later on independently on several different sublines. However, the smallest genome on
each subline is 600 – 800 kb and this seems to be the lower limit for mycoplasma, and
probably cell, genome content (Maniloff, 1992, 1996). This hypothesis of multiple origin of the
genus proved to be incorrect and a different model was composed by Woese, Maniloff and
co-workers. In this they stated that the mycoplasma phylogenetic tree is monophyletic which
emerged from a branch of the Gram-positive bacterial phylogenetic tree. Mycoplasma

Avian Mycoplasmas 6
evolution has been by attrition, identified by rapid evolution and reduced physiological and
genetic complexity. This is illustrated to some extent by the fact that species currently
included in the genus Mycoplasma are polyphyletic (Maniloff, 1992).
In 1956, Edward and Freundt allocated all known mycoplasmas into one family,
Mycoplasmataceae, with only one genus, Mycoplasma, under the order Mycoplasmatales. At
that stage no more than 15 mycoplasma species were recognized. The Mycoplasmatales,
which was previously placed as order X of the class Schizomycetes, was separated into a
new class in 1967. This new class of microbes was named Mollicutes. In 1969 and 1970 they
suggested a second family and genus, Acholeplasmataceae and Acholeplasma, for a species
which was up until then known under the name of M. laidlawii. The main rule to distinguish
between these two families was the need versus no need for cholesterol or other sterols as
growth factors (Freundt, 1973).
Currently, eight genera of Mollicutes in five families are recognized (Dybvig and Voelker,
1996) as shown in Table 2.1. Some families have certain characteristics which distinguishes
them from the other families. Members of Spiroplasmataceae have a helical morphology,
rotating motility and chemotaxis, and members of Ureaplasma are capable of hydrolyzing
urea (Razin and Freundt, 1984; Razin et al., 1998). It is believed that acholeplasmas and
anaeroplasmas were the first Mollicutes that evolved from Gram-positive bacteria by
reductive evolution. Spiroplasmas evolved from an early split of the acholeplasmal branch,
and it is believed that mycoplasmas and ureaplasmas have a spiroplasmal ancestor (Razin et
al., 1998).
The class Mollicutes is presently the only one in the division Tenericutes (wall-less bacteria)
which forms one of the four divisions of the kingdom Procaryotae. The other three divisions
are the Gram-positive bacteria, Firmicutes, the Gram-negative bacteria, Gracilicutes, and the
archaebacteria, Mendosicutes (Razin et al., 1998). The current taxonomic scheme for the
class Mollicutes is presented in Table 2.1.
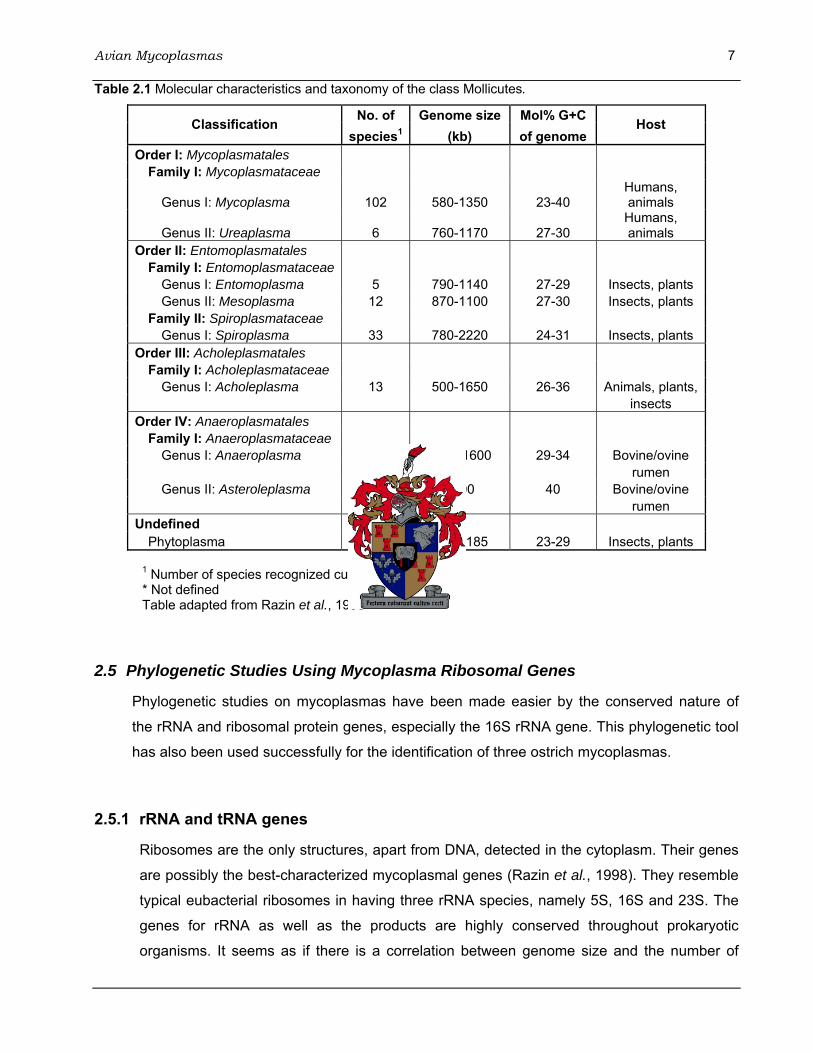
Avian Mycoplasmas 7 Table 2.1 Molecular characteristics and taxonomy of the class Mollicutes.
No. of Genome size Mol% G+C Classification species1 (kb) of genome
Host
Order I: Mycoplasmatales Family I: Mycoplasmataceae
Genus I: Mycoplasma 102 580-1350 23-40 Humans, animals
Genus II: Ureaplasma 6 760-1170 27-30 Humans, animals
Order II: Entomoplasmatales Family I: Entomoplasmataceae
Genus I: Entomoplasma 5 790-1140 27-29 Insects, plants Genus II: Mesoplasma 12 870-1100 27-30 Insects, plants
Family II: Spiroplasmataceae Genus I: Spiroplasma 33 780-2220 24-31 Insects, plants
Order III: Acholeplasmatales Family I: Acholeplasmataceae
Genus I: Acholeplasma 13 500-1650 26-36 Animals, plants, insects
Order IV: Anaeroplasmatales Family I: Anaeroplasmataceae
Genus I: Anaeroplasma 4 1500-1600 29-34 Bovine/ovine rumen Genus II: Asteroleplasma 1 1500 40 Bovine/ovine rumen
Undefined Phytoplasma ND* 640-1185 23-29 Insects, plants
1 Number of species recognized currently * Not defined Table adapted from Razin et al., 1998
2.5 Phylogenetic Studies Using Mycoplasma Ribosomal Genes
Phylogenetic studies on mycoplasmas have been made easier by the conserved nature of
the rRNA and ribosomal protein genes, especially the 16S rRNA gene. This phylogenetic tool
has also been used successfully for the identification of three ostrich mycoplasmas.
2.5.1 rRNA and tRNA genes
Ribosomes are the only structures, apart from DNA, detected in the cytoplasm. Their genes
are possibly the best-characterized mycoplasmal genes (Razin et al., 1998). They resemble
typical eubacterial ribosomes in having three rRNA species, namely 5S, 16S and 23S. The
genes for rRNA as well as the products are highly conserved throughout prokaryotic
organisms. It seems as if there is a correlation between genome size and the number of

Avian Mycoplasmas 8
rRNA genes since mycoplasmas carry only one or two sets of rRNA genes, but there is no
strict relationship. The Escherichia coli (Gram-negative) genome can carry seven individual
rRNA transcription units for 16S and 23S rRNAs, and its 5S and 16S rRNAs are larger than
those of the mycoplasmas. In mycoplasmas, the order of the rRNA genes is similar to that
found in prokaryotes, namely 16S-23S-5S, and they function as an operon. The genes are
close to each other and take up a chromosomal segment of about 5 kb (Glaser et al., 1992;
Bové, 1993; Razin et al., 1998).
The tRNAs are also highly conserved molecules regarding size, composition and function,
but their structure might be closer to Gram-positive than Gram-negative bacteria. The low
G+C content of the mycoplasma genome is not reflected in the G+C content of the tRNAs
(Razin, 1978). Gene duplicates are very rare and the number of genes is kept to a minimum.
The number of anticodons in Mycoplasma pneumoniae is only 32 compared to the 86 in the
E. coli K-12 genome (Razin et al., 1998).
2.5.2 Use of 16S rRNA as phylogenetic marker
To qualify as the best candidate gene to be phylogenetically useful, certain criteria has to be
met. These include (Maniloff, 1992):
(i) every organism must contain the gene, thus, the gene must be universally
distributed;
(ii) the product of the gene must be functionally constant in every organism and
therefore under the same selective pressure;
(iii) the gene must not be exposed to significant lateral transfer as this would prevent its
use as phylogenetic measure;
(iv) the gene base sequence must change slowly with time in order to preserve
phylogenetic changes (random base changes) over long genealogical times; and
(v) gene or gene product must be isolated and sequenced without difficulty for it to be an
experimentally practical phylogenetic measure
Since rRNA genes are conserved between mycoplasmas and are ideal to use as probes in
mycoplasma detection and identification (Weisburg et al., 1989; Glaser et al., 1992). The
16S rRNA gene is an effective phylogenetic tool since certain parts evolved slowly and thus
provides a phylogenetic measure of deep genealogical events. Other parts evolved more

Avian Mycoplasmas 9
quickly and measure more recent genealogical events. The smaller 5S rRNA gene evolved
faster and is therefore not apt as a phylogenetic measure (Maniloff, 1992).
In order to describe a new mycoplasma species, its 16S rDNA sequence has to be included
(Razin et al., 1998). Phylogenetically, the Mollicutes and their walled relatives consist of six
definite clades: (i) the pneumoniae group, (ii) the hominis group, (iii) the spiroplasma group,
(iv) the anaeroplasma group, (v) the asteoleplasma group, and (vi) the walled relatives. Of
these groups, the hominis group is the largest within the mycoplasmas (Weisburg et al.,
1989; Pettersson et al., 2000). Figure 2.1 illustrates the 16S rRNA gene tree of avian
mycoplasmas as determined by Botes et al. (2005a). The three hitherto unnamed species
identified by Botes et al. (2005a) are also included namely Ms01, Ms02 and Ms03. They are
ostrich specific mycoplasmas and more detail will be given on them in section 2.5.3.
Although 16S rRNA sequences are viewed to be the most effective tool for phylogeny and
taxonomy of bacteria, additional phylogenetic markers have been identified to verify
conclusions based on the 16S rRNA data. These include conserved ribosomal protein
genes, the heat shock protein gene hsp70, the elongation factor EF-Tu (tuf) gene, and the
16S/23S rRNA intergenic sequences (Razin et al., 1998). Denaturing gradient gel
electrophoresis (DGGE), which theoretically can detect single-base mutations in DNA, has
also been used successfully combined with polymerase chain reaction (PCR) amplification
of the 16S rRNA gene (McAuliffe et al., 2003, 2005).
2.5.3 Ostrich specific mycoplasmas
Three ostrich mycoplasmas, Ms01, Ms02 and Ms03, were identified by Botes et al. (2004,
2005a) using 16S rRNA gene sequencing. They were provisionally named ‘Mycoplasma
struthiolus’ (Ms) after their host, Struthio camelus, until formally described. Sequence
similarity between Ms01 and Ms02 is 88.4%, sequence similarity between Ms01 and Ms03
is 88.7% and sequence similarity between Ms02 and Ms03 is 93.1% respectively as shown
by alignment data (Botes 2004; Botes et al. 2005a). The 16S rRNA sequences of Ms01,
Ms02 as well as Ms03 are available in GenBank under accession numbers DQ223545 for
Ms01, DQ223546 for Ms02 and DQ223547 for Ms03 (Botes et al., 2005a).
Phylogenetic analysis (see Figure 2.1) showed Ms02 and Ms03 to fall together in one clade
with Ms02 closely related to M. synoviae (92.2% sequence similarity) and Ms03 closely
related to M. gallinaceum (94.6% sequence similarity). Ms01 falls into a separate clade with
Avian Mycoplasmas 10
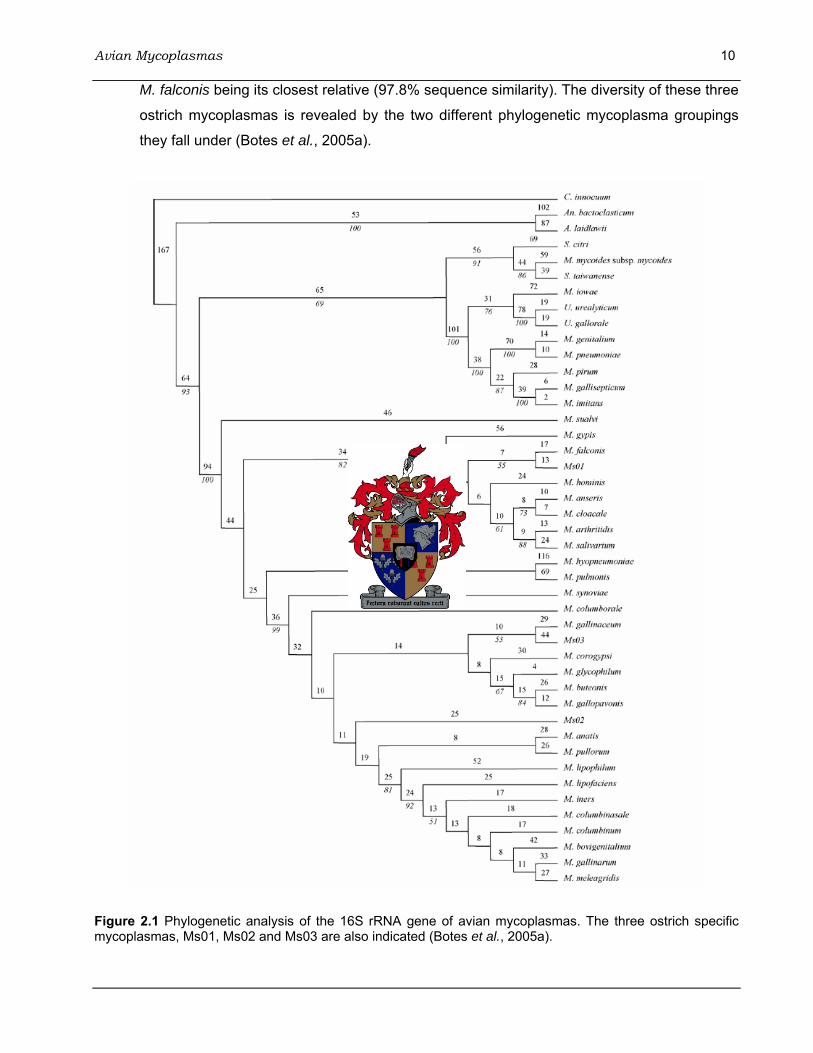
M. falconis being its closest relative (97.8% sequence similarity). The diversity of these three
ostrich mycoplasmas is revealed by the two different phylogenetic mycoplasma groupings
they fall under (Botes et al., 2005a).
Figure 2.1 Phylogenetic analysis of the 16S rRNA gene of avian mycoplasmas. The three ostrich specific mycoplasmas, Ms01, Ms02 and Ms03 are also indicated (Botes et al., 2005a).
Avian Mycoplasmas 11 2.6 Morphology and Biochemistry
The most outstanding characteristic of a mycoplasma is the absence of a cell wall. However,
this is not the only characteristic that describes its uniqueness. Other aspects include their
pleomorphic shape which varies from spherical or pear-shaped cells (0.3 – 0.8 μm in
diameter) to branched or helical filaments with a length from a few to 150 μm. Coccoidal and
diploform patterns have also been reported (Freundt, 1973; Klainer and Pollack, 1973; Razin
and Freundt, 1984; Carson et al., 1992; Rottem and Barile, 1993; Coetzer et al., 1994).
Although mycoplasmas evolved from Gram-positive bacteria, they stain negative in the Gram
test. Genome replication is not synchronized with cell division, and therefore budding forms
and chains of beads as well as typical binary fission is often observed. Cytoplasmic division,
which should be synchronized with genome replication for binary fission to occur, may lag
behind genome replication in the case of mycoplasmas and multinucleate filaments are a
result of this. Thus, cells are either divided by regular binary fission, or elongate first to
multinucleate filaments which break into coccoid bodies afterwards (Morowitz and Wallace,
1973; Razin, 1978; Razin and Freundt, 1984; Rottem and Barile, 1993).
Mycoplasmas are dependent on their hosts for many nutrients since they have restricted
biosynthetic capabilities due to their small genome size. For growth most species require
cholesterol, related sterols and fatty acids as they have lost the ability to synthesise these
compounds, and they use either sugars or arginine as energy source (Freundt, 1973; Razin
and Freundt, 1984; Rottem and Barile, 1993; Rottem, 2002). Mycoplasmas are the only
prokaryotes dependent on cholesterol for growth. It is believed that their inability to regulate
membrane fluidity through fatty acid synthesis is compensated through their ability to take up
large quantities of cholesterol into their membranes (Rottem, 2002). It seems that the shape
of the cell is determined by the growth medium’s nutritional qualities, osmotic pressure as well
as the growth phase of the culture. Some species are obligate anaerobes and are killed when
in contact with low levels of oxygen, however, most species are facultatively anaerobic. When
grown on solid media, mycoplasmas tend to penetrate deeply and grow inside the media.
Colonies formed are generally much smaller than 1 mm in diameter, and have a characteristic
“fried egg” appearance (Freundt, 1973; Razin and Freundt, 1984; Rottem and Barile, 1993).
They can be differentiated without difficulty from other bacteria because of their particular
colony shape and inability to be scraped off easily from the media surface (Rottem and Barile,
1993). Another feature of mycoplasmas is their resistance to penicillin and lysozyme due to
the fact that they lack a cell wall. They are, however, usually susceptible to antibiotics such as

Avian Mycoplasmas 12
tetracyclines and chloramphenicol that inhibits protein synthesis in prokaryotes (Freundt,
1973; Razin and Freundt, 1984).
The cell membrane of mycoplasmas is a typical prokaryotic plasma membrane, consisting of
lipids (phospholipids, glycolipids, lipoglycans and sterols) and proteins. A capsular material or
nap covers the cell surface of many mycoplasma species. Through thin sections of
mycoplasmas it was observed that the cells are made up of only three vital organelles,
namely the cell membrane, the ribosomes and a typical prokaryotic genome (Razin, 1978;
Razin and Freundt, 1984). No intracellular membranous structures, such as mesosomes, are
indicated (Razin and Freundt, 1984). One structure that has been detected in different
species is a specialized cell membrane tip structure. These cell surface tip structures, in the
form of short, dense rodlets, play a vital role in attachment of mycoplasmas to host cells as
well as in their gliding motility (Razin and Freundt, 1984; Razin and Jacobs, 1992;
Trachtenberg, 1998).
Although mycoplasmas lack flagella and are generally nonmotile, a gliding motility has been
reported in some species (Razin and Freundt, 1984; Trachtenberg, 1998; Wolgemuth et al.,
2003). Mycoplasmas are also capable of performing contractile cell movements
(Trachtenberg, 1998). The tip structure which determines the direction of movement is
situated at the leading end, which never changes (Razin, 1978; Razin and Freundt, 1984;
Trachtenberg, 1998). Mycoplasmas usually move individually and not as a mass, and their
moving pattern consists primarily of circles and narrow bends (Razin, 1978). The
mycoplasma motility mechanism is still unclear, but it is acceptable to presume that motility
plays a role in the penetration of the mucous layer of the host (Razin and Jacobs, 1992;
Razin et al., 1998).
As mentioned previously, mycoplasmas acquire needed nutrients from their host and
environment due to their limited anabolic capabilities. Most species have a glycolytic pathway
that supplies energy through glycolysis. It is believed that species lacking this ability, obtain
energy via the arginine hydrolase pathway or through urea catabolism. ATP synthesis is most
likely substrate-level phosphorylation since cytochromes and quinones are absent in
mycoplasmas. Enzymes involved in de novo biosynthesis of purines and pyrimidines, and
also in the tricarboxylic acid (TCA) cycle are also absent since no genes encode for them
(Dybvig and Voelker, 1996; Razin et al., 1998). This means the nucleic acid precursors must
be obtained from the medium or the host.
Avian Mycoplasmas 13
Mycoplasmas developed from the Clostridium branch and metabolic pathways were lost due
to the attrition of genes necessary for metabolism. Since mycoplasmas have a parasitic
lifestyle, they are able to steal the necessary nutrients from their host. Thus the loss of the
metabolic pathways has no influence on their survival. The loss of a cell wall is also typical of
the parasitic lifestyle.
2.7 Mycoplasmas Affecting Domestic Poultry
Several mycoplasma species are of economical importance in the poultry industry because of
their association with disease and reduced production. The implication of mycoplasma
infections in diseases in other avian species still needs to be determined (Jordan, 1979). To
date, seventeen avian mycoplasmas have been identified of which four are pathogenic to
poultry, namely M. gallisepticum, M. synoviae, M. meleagridis and M. iowae (Jordan, 1990a,
1996). These four poultry pathogens are mainly responsible for respiratory and locomotory
disorders. However, they are not limited to clinical disorders; they are also responsible for
reduced hatchability in breeders, reduced egg production in breeders, and reduced
production and carcass downgrading in broilers (Bradbury, 2005). An overview of the four
pathogenic mycoplasmas with specific reference to their epidemiology, diagnosis and control
will be given in the subsequent sections.
2.7.1 Epidemiology
As in the case of many mycoplasma species, the poultry pathogens may have more than
one natural host which they infect. Sometimes more than one mycoplasma species is
responsible for an infection. Under this section dealing with epidemiology, the four poultry
mycoplasmas’ natural host and diseases that they cause, target organ or tissue for infection
in the host, as well as method of transmission and thus spreading of infection between
poultry, will be discussed.
2.7.1.1 Natural host
M. gallisepticum occurs naturally in chickens and turkeys worldwide. It is the causative
organism of diseases in the respiratory complex resulting in suboptimal egg production in
layers, downgrading of carcasses of broilers and turkeys, and reduced hatchability of
chicks and poults (turkey chicks). Sometimes it is associated with encephalopathy in

Avian Mycoplasmas 14
turkeys and with salpingitis, arthritis and tenosynovitis in chickens (Jordan, 1979; Yoder,
1984; Jordan 1990a, 1996; Ley and Yoder, 1997; Levisohn and Kleven, 2000).
Respiratory diseases in chickens, turkeys, fowl and guinea fowl are also caused by M.
synoviae. This includes a mild upper respiratory disease or chronic airsacculitis. The
chicken is more susceptible to infection than the turkey. M. synoviae is also associated
with joint lesions and lameness and retarded growth in broilers, pullets and turkeys
(Olson, 1984; Jordan, 1990a; Kleven, 1997). Arthritis can also be caused by M. synoviae
as well as infection of the eyes (Cline et al., 1997; Nicholas et al., 2002).
M. meleagridis is a turkey specific pathogen. It is generally associated with poor growth,
airsacculitis, osteodystrophy, crooked necks, reduced hatchability in breeding birds, and
abnormalities of the primary wing feathers. This pathogen has not been isolated from any
other avian species (Jordan, 1979, 1990a, 1996; Yamamoto and Ghazikhanian, 1997).
The natural host of M. iowae is turkeys, but chickens and free-flying birds have also been
shown to be infected. Reduced hatchability and embryo mortality is caused by this
mycoplasma in turkeys (Jordan, 1990a, 1996; Kleven and Baxter-Jones, 1997).
2.7.1.2 Infection
Environmental factors influence mycoplasma infections. During the cold winter months,
diseases due to mycoplasma infections are of longer duration and often more severe
(Yoder, 1984; Simecka et al., 1992).
In the case of M. gallisepticum infection, the respiratory tract is the main target. The route
of infection, which could be entrance through the host’s respiratory tract or via the infected
embryo, influences the degree of pathogenicity (Yoder, 1984; Jordan, 1990a). Embryos
may be weakened by M. gallisepticum infection, resulting in difficulty in hatching or low-
quality chicks (Levisohn and Kleven, 2000). An infection may remain dormant until
debilitating factors occur. These factors include for example nutritional deficiency,
excessive environmental dust and ammonia, limited effects of antibiotic treatment as well
as stressing the bird (Jordan, 1979, 1990a; Simecka et al., 1992; Winner et al., 2000). The
eyes of the birds may also be infected (Nicholas et al., 2002). Resistance to M.
gallisepticum increases with age, and some protection is provided by an immune
response upon infection (Jordan, 1979, 1990a).

Avian Mycoplasmas 15
M. synoviae gains entry through the respiratory tract of its host or via the infected embryo
and may last for several years. In combination with M. meleagridis, it may cause a more
severe coryza in turkeys than on its own (Jordan, 1990a, 1996). Diseases caused by M.
synoviae only are associated with infection in very young chicks or poults (Jordan, 1996).
Acute infection occurs in adult chickens from time to time. Chronic infection, which follows
the acute phase, may persist for longer than 5 years (Olson, 1984).
M. meleagridis enters its host either congenitally or through the respiratory tract. It may be
harboured in the bursa of Fabricius and cloaca of poults, and in the case of mature birds
on the phallus, in the oviduct as well as the upper respiratory tract where it may remain
dormant for several months. Respiratory diseases due to infection with M. meleagridis can
be aggrevated by a high concentration of atmospheric dust (Jordan, 1979, 1990a).
In turkey poults, M. iowae is harboured in the cloaca and upper respiratory tract. In the
case of mature stock, it is harboured in the oviduct, cloaca and the phallus. No diseases
are caused in any of these tissues (Jordan, 1990a). The pathogenicity and virulence of the
M. iowae strains also vary (Kleven and Baxter-Jones, 1997).
Mycoplasma diseases are also subject to the concomitant presence of other respiratory
viruses and bacteria. These include the viruses of infectious bronchitis, Newcastle
disease, and turkey rhinotracheitis as well as the pathogenic strains of E. coli and
Avibacterium (formerly Haemophilus) paragallinarum. The presence of these pathogens
can also cause secondary complications during mycoplasma infections (Jordan, 1979;
Olson, 1984; Jordan, 1990a, 1996; Ley and Yoder, 1997).
2.7.1.3 Transmission
Transmission of M. gallisepticum infection may occur horizontally by direct contact from
bird to bird, or vertically (in ovo) from an infected breeder flock, chicken or turkey, to the
progeny (Jordan, 1990a; Ley and Yoder, 1997; Levisohn and Kleven, 2000). It can be
spread by droplets, dust and contaminated equipment (Yoder, 1984; Cline et al., 1997).
Intercurrent infections may influence egg transmission and airborne spread since it
stimulates multiplication of the mycoplasma (Jordan, 1979).
M. synoviae infection spreads through infected eggs or laterally from bird to bird.
Contaminated equipment, droplets and dust spreads the infection (Jordan, 1990a; Cline et
Avian Mycoplasmas 16
al., 1997; Kleven, 1997). Transmission through the egg is variable and is most prevalent
early after infection of adult stock, it can also occur at a low rate (Jordan, 1979).
The primary route of transmission of M. meleagridis is through the egg. The egg probably
became infected in the oviduct, which may have been infected from the air sacs or cloaca
or from infected semen at insemination. Venereal transmission is very important in
sustaining infection of the oviduct which implies that the male is a significant contributor to
the spread of infection. Eggs laid early are less likely to be infected, as well as eggs laid
late in the laying cycle. Lateral transmission is also an important means of spread and can
occur from bird to bird. Airborne transmission usually results in a high infection rate which
persists in the sinus and trachea. Indirect spread occurs through human handling of stock
at sexing, artificial insemination and vaccination (Jordan, 1979, 1990a; Yamamoto and
Ghazikhanian, 1997; Bradbury, 2005).
Transmission of M. iowae also occurs through the egg which probably became infected in
the oviduct. As with M. meleagridis, venereal transmission is of considerable importance,
but lateral spread probably occurs between sister hens and stags housed together due to
unhygienic conditions during insemination. Eggs laid late in the laying season are less
prone to infection probably because of the development of a protective immune response
(Jordan, 1990a; Kleven and Baxter-Jones, 1997; Bradbury, 2005).
2.7.2 Clinical signs and lesions
Several clinical signs and gross lesions are associated with M. gallisepticum infection of the
respiratory tract. At the acute stage of infection, the level of M. gallisepticum is at its highest
in the trachea even before any serological responses can be observed (Levisohn and
Kleven, 2000). Clinical signs include coryza, which is an inflammation of the mucous
membrane usually associated with nasal discharge, sneezing, coughing, tracheal rales and
breathing through a partially open beak. If only the air sacs are affected no respiratory signs
are visible. Reduced feed consumption results in the birds losing weight (Jordan 1979;
Yoder, 1984; Jordan 1990a, 1996; Ley and Yoder, 1997). Mild conjunctivitis can be a sign of
coryza, which is more severe in turkeys than in chickens, or the early stages of a more
severe disease (Jordan, 1990a). Bulging eyes with caseous material under the eyelids,
corneal oedema, watery conjunctivitis and sometimes large corneal ulcers are signs of
infected eyes (Nicholas et al., 2002). Sometimes the eyes close partially or completely as a
result of severe sinus swelling (Ley and Yoder, 1997). Ataxia in the turkey and lameness as

Avian Mycoplasmas 17
well as swelling of the hock in chickens is not seen very often (Jordan, 1990a). Male
chickens often have the most pronounced signs (Yoder, 1984; Ley and Yoder, 1997).
Intercurrent infections influences morbidity, and when they occur, the signs may be more
severe and prolonged (Jordan, 1979, 1990a; Ley and Yoder, 1997).
Gross lesions due to M. gallisepticum infection are seen most frequently in the respiratory
tract, less often in the oviduct and rarely in the hocks. Lesions of the respiratory tract can be
very mild and almost unnoticeable, or consist primarily of excess mucous or catarrhal
exudates in the trachea and lungs, nares, and oedema of air sac walls (Jordan, 1979,
1990a; Ley and Yoder, 1997). Sinusitis is normally most common in turkeys, but is also
observed in chickens. Some degree of pneumonia has also been observed (Ley and Yoder,
1997). Mortality due to M. gallisepticum infection is, however, relatively rare in poultry
(Jordan, 1979, 1990a).
When clinical signs occur due to M. synoviae infection, they take on an arthritic or
respiratory form. In the acute arthritic form there is paleness of the face and comb, marked
depression, swelling of the joints and rapid loss of condition. The hock joints and feet are
affected in particular and accompanied by lameness. Feathers become ruffled and the comb
shrinks as the disease progresses. Other clinical signs include retarded growth, birds
becoming listless, dehydrated, emaciated and droppings have a greenish discolouration due
to the large amounts of uric acid and urates it contains. Clinical signs for infection of the
eyes are the same as for M. gallisepticum (Olson, 1984; Jordan, 1990a, 1996; Kleven,
1997). Recovery from the acute signs is very slow, but synovitis may remain for life in the
flock. In the chronic form, swelling of the joints occurs without severe systemic disturbance,
but with lameness. Lameness is also the most prominent sign in turkeys (Olson, 1984;
Jordan, 1990a, 1996; Kleven, 1997). In the respiratory form, mild rales and coryza may
occur, as well as swelling of the infraorbital sinuses in turkeys. This may occur
independently of joint lesions. Lesions in the respiratory form are similar to those with M.
gallisepticum infection, but generally none are seen in the upper respiratory tract. Oedema
and thickening of periarticular tissues occurs when synoviae and joints are involved, the foot
and hock joints are often affected. The spleen of some chickens in an affected flock is
enlarged, the liver mottled green or dark red in colour and swollen, the kidneys are also pale
or mottled and swollen, and the bursa of Fabricius and thymus are atrophied (Jordan, 1979;
Olson, 1984; Jordan, 1990a; Kleven, 1997).
Avian Mycoplasmas 18
In the case of chickens with a M. synoviae infection, the morbidity varies from 2-75% and
mortality is usually low, ranging from less than 1-10%. Morbidity in infected turkey flocks is
usually low, 1-20%, but mortality may be significant from trampling and cannibalism (Olson,
1984).
M. meleagridis infections cause no clinical signs in mature birds, but there may be reduced
hatchability. Infection in young poults may also occur without clinical signs. In spite of a high
rate of airsacculitis in poults, respiratory signs are rarely noticed. Lesions due to airsacculitis
are usually not seen after 12-16 weeks of age. The initial infection of the thoracic air sacs
spreads to the cervical and abdominal sacs. Skeletal lesions of osteodystrophy are seen
and synovitis and oedema have also been reported. Although none of the clinical signs or
gross lesions is specific to M. meleagridis infection, poor growth and feathering, airsacculitis
and leg abnormalities in young poults are indicative of an infection (Jordan, 1990a;
Yamamoto and Ghazikhanian, 1997). Even though M. meleagridis has a high infectivity,
mortality due to this infection is low. M. meleagridis thus has an ideal host-parasite
relationship (Yamamoto and Ghazikhanian, 1997).
No clinical signs are caused by M. iowae infections in mature birds, only reduced
hatchability and abnormal feathering are observed (Jordan, 1990a; Kleven and Baxter-
Jones, 1997). Gross lesions of affected embryos consist primarily of congestion and
stunting, with various degrees of oedema, hepatitis, splenomegaly and sometimes a down
abnormality. None of the lesions can be considered as pathognomic. Lesions due to
airsacculitis in inoculated turkeys and chickens are normally mild to moderate and similar to
those caused by other mycoplasmas. Inoculation of poults with M. iowae leads to several
lesions, which include stunting, tenosynovitis, poor feathering, and several leg abnormalities
such as toe deviations. Experimental chicks show similar leg lesions, but overall their lesions
are less severe. Bursal atrophy may be a result of inoculation of turkey poults. Under field
conditions, such severe lesions have not been reported, possibly since infected embryos do
not hatch. Mortality due to M. iowae infections have only been observed in turkey embryos
(Kleven and Baxter-Jones, 1997).
2.7.3 Diagnosis
None of the clinical signs or gross or histological lesions are pathognomic for any
mycoplasma infection. They are simply an indication of an infection by one of the
mycoplasma species (Jordan, 1990a). Samples can be isolated from various places

Avian Mycoplasmas 19
depending on the mycoplasma being tested for. Several techniques that are available for
testing the mycoplasma isolate will be discussed briefly. It is important that these diagnostic
methods are rapid and precise.
2.7.3.1 Diagnostic samples
M. gallisepticum can be isolated from the oropharynx of the embryo or newly hatched bird,
or in the case of an older bird from the respiratory tract, infraorbital sinus and cloaca
(Jordan, 1990a). When infection occurs in the eye, M. gallisepticum can be isolated from
the conjunctiva (Nicholas et al., 2002). Fresh carcasses can also be used to take samples
from a variety of organs, usually from the reproductive or respiratory tract (Levisohn and
Kleven, 2000). The organism has also been isolated from cockerel and turkey semen as
well as the oviduct of fowls and turkey hens (Jordan, 1996).
Samples of M. synoviae can be isolated from the trachea, joint lesions, and lungs and air
sacs (Jordan, 1990a). M. synoviae can also be isolated from the transparent membrane
covering the eyeball (Nicholas et al., 2002).
In order to identify infection with M. meleagridis, isolates are usually taken from the
respiratory tract or cloaca in the poults. In breeding birds, M. meleagridis can be isolated
from the cloaca, oviduct or semen (Jordan, 1990a; Simecka et al., 1992).
M. iowae can be isolated from the oviduct, cloaca and phallus of mature stock, and in the
case of recently hatched stock from the oropharynx, cloaca and air sacs. Only the vent is
a suitable site for isolating M. iowae from turkeys in the age group between these ages.
Because of its widespread nature its effects may pass unrecognized and therefore has to
be closely monitored (Jordan, 1990a, 1996; Kleven and Baxter-Jones, 1997).
2.7.3.2 Identification of a mycoplasma infection
After collecting a sample of a possible mycoplasma infection, it can be used to inoculate a
suitable solid agar or broth medium of choice (Ley and Yoder, 1997). Several techniques
are available for the identification or confirmation of a mycoplasma infection. These
techniques are listed below:

Avian Mycoplasmas 20
• Antibody-based procedure: Antigens are prepared from isolates and tested
against known antiserum. This method is rarely satisfactory when testing
recently isolated cultures (Ley and Yoder, 1997).
• In vivo bioassay: Mycoplasma free poultry is inoculated with the isolate and
their serum tested with a known mycoplasma antiserum (Jordan, 1996; Ley
and Yoder, 1997).
• Direct or indirect immunofluorescence: Mycoplasma colonies from the surface
of agar plates or colony imprints are used, and this is a very effective method
for culture identification (Jordan, 1996; Ley and Yoder, 1997).
• Agar gel precipitin test: In this test cultures are identified by using mycoplasma
species specific antibodies (Ley and Yoder, 1997).
• Direct immunoperoxidase test: This test, of which the principle is very similar to
the immunofluorescence test, is a very effective technique for indicating the
presence of as well as identification of M. gallisepticum and M. synoviae
cultures (Ley and Yoder, 1997).
• Compare protein banding patterns: Results from sodium dodecyl sulphate-
polyacrylamide gel electrophoresis (SDS-PAGE) are used for comparison (Ley
and Yoder, 1997).
• Restriction fragment length polymorphism (RFLP) of DNA: The sensitivity of
this technique is greater than that of SDS-PAGE for differentiating strains of
the same species from each other (Ley and Yoder, 1997).
• DNA and rRNA gene probes: Although the gene probes are highly sensitive, it
is not in widespread use due to insensitivity for many clinical applications (Ley
and Yoder, 1997).
• PCR: Specific DNA nucleotide sequences are employed in this rapid and
sensitive technique. Clinical swabs can be directly tested (Ley and Yoder,
1997; Levisohn and Kleven, 2000; Nicholas et al., 2002).
Up until now there is no single generic test to identify mycoplasmas to species level.
Denaturing gradient gel electrophoresis (DGGE) of the 16S rRNA gene could distinguish
almost all mycoplasmas within a host animal group, but other bacteria will also generate a
band on DGGE gel which may give confusing results (McAuliffe et al., 2003). This

Avian Mycoplasmas 21
disadvantage can be overcome by designing mycoplasma-specific primers (McAuliffe et
al., 2003).
2.7.3.3 Serology
Serological tests are used to demonstrate the presence of a specific antibody. They are
used to aid in diagnosis and are also useful for flock monitoring in control programs
(Yoder, 1984; Ley and Yoder, 1997). These tests are listed below:
• Serum plate agglutination (SPA) test: It is a commercially available, quick,
relatively inexpensive and sensitive test. Widely used to indicate infection in a
flock rather than an individual infection, and detects IgM (Jordan, 1979; Ley
and Yoder, 1997; Levisohn and Kleven, 2000; Butcher, 2002). Non-specific
reactions do occur in some flocks that have a M. gallisepticum infection, or
were recently vaccinated with oil emulsion vaccines or that is of tissue culture
origin. Cross-reactions do occur between M. gallisepticum and M. synoviae
which complicates serological detection (Jordan, 1979; Ley and Yoder, 1997;
Levisohn and Kleven, 2000).
• Tube agglutination (TA) test: Takes longer to perform than the SPA test and
although it is more accurate, it is rarely used anymore (Jordan, 1990a; Ley and
Yoder, 1997).
• Haemagglutination-inhibition (HI) test: This test is time consuming, its reagents
are not commercially available and it is not very sensitive. The test is highly
specific, but it may take up to three or four weeks after infection to detect
diagnostically significant titres. The HI test detects IgG levels. It is used
routinely to confirm SPA, TA and ELISA tests (Yoder, 1984; Jordan, 1990a;
Ley and Yoder, 1997; Levisohn and Kleven, 2000; Butcher, 2002).
• Enzyme-linked immunosorbent assay (ELISA): This test is more sensitive and
specific than the SPA and HI test, and can also be used to detect levels of
different classes of immunoglobulins. It is used commonly as an initial
screening test for flock monitoring and sero-diagnosis, but false positive and
negative reactions may occur (Jordan, 1990a; Ley and Yoder, 1997; Levisohn
and Kleven, 2000; Butcher, 2002; McAuliffe et al., 2003).

Avian Mycoplasmas 22
Serological tests for determining flock status also have some pitfalls, namely (i) antibodies
may be transient, (ii) the development of the immune response may be influenced by
another flock treatment, and (iii) the onset of a detectable serological response may be
delayed by immune suppressive agents (Levisohn and Kleven, 2000). In some cases the
symptoms observed in the poultry are not unique to a mycoplasma infection. Both
serological and cultural test procedures are then necessary to differentiate between a
mycoplasma infection and another infecting agent (Ley and Yoder, 1997).
2.7.4 Treatment with antibiotics
Antibiotic therapy can reduce the severity of mycoplasma diseases and is thus very useful in
treatment. However, neither termination of infection nor eradication of colonization is
affected by treatment (Ellison et al., 1992). Resistance to antibiotics can also develop as a
result of gene mutation, acquisition of new genetic material, or it can be innate to the
species, genus or family. Mycoplasmas have shown all three types of resistance to
antibiotics (Roberts, 1992).
Mycoplasmas are known to be resistant to penicillin as well as other antibiotics that inhibit
cell wall biosynthesis. However, they are susceptible to fluoroquinolones, macrolides,
tetracyclines, and other antibiotics (Levisohn and Kleven, 2000). Tetracyclines are effective
against almost all the mycoplasma species. It is a broad-spectrum antibiotic, has relatively
low toxicity, causes few side effects, and prevents the proper functioning of the ribosomes
by binding to them. Fluoroquinolones are active against a broad range of bacteria, and is a
potent synthetic agent. Its primary target is DNA gyrase and thus blocks DNA replication
(Roberts, 1992). They are known to kill bacteria rapidly, but decreased killing has been
observed in mycoplasmas when present at high concentrations. Mycoplasmas are generally
not treated with chloramphenicol because of its potential toxicity (Roberts, 1992). Antibiotics
that have been used in poultry mycoplasma infections include the following:
M. gallisepticum infection: It is susceptible to streptomycin, erythromycin, lincomycin,
oxytetracycline, magnamycin, spectinomycin, chlortetracycline, spiramycin and
tylosin. Some isolates, however, are quite resistant to tylosin, streptomycin,
spiramycin and erythromycin (Yoder, 1984; Jordan, 1996; Ley and Yoder, 1997).
M. synoviae infection: It is susceptible to chlortetracycline, lincomycin, tetracycline,
danofloxacin, oxytetracycline, tiamulin, enrofloxacin, spiromycin, spectinomycin, and

Avian Mycoplasmas 23
tylosin among others. Isolates do appear to have resistance to erythromycin (Kleven,
1997).
M. meleagridis infection: Hatching eggs are treated effectively with antimicrobials
(Jordan, 1990a, 1996).
M. iowae infection: Enrofloxacin has been used for egg treatment. Tiamulin and
danofloxacin have also been found to be effective (Jordan, 1996; Kleven and Baxter-
Jones, 1997).
Although antibiotics are often used, it is still better to keep the flock free from mycoplasma
infection or to use a vaccine if necessary (Perelman, 1999).
2.7.5 Prevention and control of poultry mycoplasmas
Eradication of infection is the most efficient means of control for all four poultry pathogens. It
is not always possible or wise to slaughter all the poultry, and therefore better to limit the
spread of infection. Control in breeding stocks involves the following:
minimum contact between the host and the pathogen (Jordan, 1979);
treatment of hatching eggs to reduce transmission, for example by manual injection
into the air sac or dipping them in a solution of a suitable drug (Jordan, 1990a, 1996;
Ley and Yoder, 1997);
keeping progeny flocks in flocks of small numbers and isolated from other flocks
(Yoder, 1984; Jordan, 1990a; Ley and Yoder, 1997); and
monitoring the progeny for infection (Jordan, 1990a)
Several antibiotics and vaccines, both live and killed (bacterins) are available that protect
against mild falls in egg production in layers. Methods of vaccination and commercially
available vaccines will be discussed in more detail in section 2.9.
Biosecurity is the preferred method of control in poultry to exclude an infection from stock.
Immunization or anti-microbial medication may be required in instances where infection
cannot be readily excluded by economically sustainable biosecurity (Whithear, 1996;
Perelman, 1999).
Avian Mycoplasmas 24
Flocks are considered free of infection when serologically negative progeny have been
derived from negative parent birds and hatching eggs, and none of the generations have
been subjected to antimycoplasma treatment (Jordan, 1996).
2.8 The South African Ostrich
The ostrich, Struthio camelus, is a ratite, paleognathic (primitive) bird and also the largest
living bird presently in Southern Africa (Huchzermeyer, 1998a; Bezuidenhout, 1999).
Ostriches are flightless running birds and their feathers lack the typical interlinked structure of
flying birds. They are mainly herbivores, can swim and have two toes. Ostrich eggs weigh 1-
1.5 kg, and the chicks hatch after 42 days of incubation. An adult ostrich can weigh between
120 and 160 kg (Huchzermeyer, 1998a).
The main focus of this dissertation is on mycoplasmas as causative agents of respiratory
diseases in the ostrich. However, they are not the only organisms causing respiratory
diseases in the ostrich. In this section, the respiratory system as target of mycoplasmas will
be discussed briefly to give an overview of the areas where the diseases occur. A discussion
of mycoplasma infections in the South African ostrich will follow as well as other respiratory
diseases with reference to their symptoms and treatment available where possible.
2.8.1 Respiratory system and respiration
The glottis (laryngeal opening) is situated close to the front of the mouth, but the mucous
membrane surrounding it as well as the larynx lacks papillae. From the larynx, the trachea
extends to the syrinx, which is uncomplicated and consists of the last tracheal rings. The
lungs are attached to the rib cage, and so firmly that deep grooves have developed on the
lung surfaces. Ostriches have ten air sacs similar to those of other avian species. These
include: cervical air sacs, paired lateral clavicular air sacs, paired cranial thoracic air sacs,
paired caudal thoracic air sacs and a right and left abdominal air sac (Huchzermeyer, 1998a;
Bezuidenhout, 1999).
Ostriches use a costal pump for ventilation rather than a diaphragmatic pump. The series of
air sacs connected to each lung forms the basis of three distinctive avian respiratory
characteristics. Firstly, the lungs are more efficient than the mammalian lung since air flows
through continuously in one direction. Secondly, breathing is slower and deeper due to the
large residual volume provided. And thirdly, the large source of air provided can be used for

Avian Mycoplasmas 25
gaseous exchange as well as transfer of heat by evaporation. The air sac system of the
ostrich is well developed, and together with the lungs it can hold a total volume of about 15
litres for an ostrich of 100 kg. As in other birds, air flow during inspiration and expiration is in
the same direction with little change in the volume of the lungs. The lungs have thinner walls
which permit more efficient gaseous exchange, and the air sacs are responsible for pumping
air. An increase in respiration rate is not necessarily related to an increase in the oxygen
consumption rate (Skadhauge and Dawson, 1999).
2.8.2 Mycoplasma infections in the ostrich
Ostriches in South Africa as well as other countries worldwide have been found to be
affected by mycoplasmas. None of these infections were identified as poultry mycoplasmas
and knowledge on mycoplasma-associated diseases in ostriches is also very limited
(Shivaprasad, 1993; Botes et al., 2005a). However, Cline et al. (1997) could induce clinical
signs of infection by experimentally infecting ostriches with M. gallisepticum, but not by
infecting them with M. synoviae. For this reason, keeping both chickens and ostriches in
close proximity is not recommended, and it was thought that poultry mycoplasmas may be
transmitted to the ostriches.
In a study done by Botes et al. (2005b), samples from ostriches in South Africa were
analysed to evaluate the correlation between disease symptoms and mycoplasma
occurrence. As described previously, three ostrich specific mycoplasmas were identified by
Botes et al. (2005a), namely Ms01, Ms02 and Ms03. In these studies, the samples were
divided into two groups, the first consisting of 206 samples that were used for mycoplasma
cultivation and the second consisting of 162 samples that were used directly for PCR
testing. None of these samples were found to contain poultry mycoplasmas. From the first
group, 185 out of the 206 isolates tested ostrich mycoplasma positive, and in some samples
a combination of Ms01/03 or Ms02/03 infection was present. Of the 185 mycoplasma
positive samples, 184 were isolated from the upper respiratory system, namely trachea,
sinus, air sac, choana and eye, and only one was isolated from the caecum. From the
second group, 85 out of the 162 samples tested positive for Ms01, Ms02 or Ms03
respectively and only eight had an Ms01/03 infection. Seventy-seven of the 85 samples
were isolated from the respiratory tract, namely the trachea, sinus, air sac, choana and eye.
Only seven samples were isolated from the alimentary tract, namely the cloaca, and one
was from yolk. These results strongly implicate mycoplasmas as one of the most important
organisms in respiratory diseases in ostriches.
Avian Mycoplasmas 26
Huchzermeyer (1994) found that mycoplasmas in the South African ostriches are associated
with respiratory infections in feedlot birds during winter causing rhino-tracheitis, or air-
sacculitis as an extension of nasal infections. From the study by Botes et al. (2005b), it was
observed that the three ostrich mycoplasmas occur throughout the year. However, the
highest incidence seems to be at the beginning of the cold winter months and again at the
beginning of summer. The ostriches in which respiratory tract mycoplasmas were detected,
also exhibited respiratory diseases such as rhinitis, tracheitis, sinusitis and air-sacculitis
(Huchzermeyer, 1994; Botes et al., 2005b). Pathological, as well as respiratory lesions
characteristic of poultry mycoplasma infections also occurred in many of the sampled
ostriches. Since no poultry mycoplasmas were observed, these lesions provide further
evidence implicating that Ms01, Ms02, or Ms03 caused the infection (Botes et al., 2005b).
Symptoms of this respiratory disease can be reduced by treatment with the mycoplasma
specific antibiotic tylosin. Tylosin can be administered orally via the feed, dosed orally, or
injected (Botes et al., 2005b). However, it has been recommended that the use of antibiotics
as well as other antibacterials should be kept to the absolute minimum (Huchzermeyer,
1998a). Although antibiotics are often used, it is better to keep the flock free from
mycoplasma infection or use a vaccine if necessary. Antibiotics should not be used in young
birds for the prevention of infection. Long-term use of antibiotics predisposes birds to fungal
infections of the mouth and digestive tract, and therefore should be avoided (Perelman,
1999).
In the case of ostriches, biosecurity is the preferred method of control to exclude an infection
from stock. Immunization or anti-microbial medication may be required in instances where
infection cannot be readily excluded by economically sustainable biosecurity (Whithear,
1996; Perelman, 1999).
2.8.3 Other respiratory diseases in the ostrich
Ostriches are very sensitive to stress and this creates the ideal environment for an organism
to cause disease. No ostrich-specific infectious or contagious disease exists, but the
wireworm, Libyostrongylus, and the tapeworm, Houttuynia, are the only ostrich-specific
pathogens (Huchzermeyer, 1998b, 1999, 2002). Diseases that have no respiratory
involvement include (i) Newcastle disease, which affects the nervous system; (ii) fading
chick syndrome, which is characterised by a halt in growth and loss of weight; (iii) tibiotarsal
rotation, which is the outward rotation of the lower tibiotarsus; and (iv) enteritis, which is

Avian Mycoplasmas 27
characterised by an abnormal intestinal flora of the chicks (Huchzermeyer, 1998b, 1999,
2002).
Infections are usually transmitted by domestic or wild birds, but flies, lice and ticks are also
important in transmitting infectious diseases. Humans can also act as passive carriers. As
with mycoplasma infections, high dust and ammonia levels, and cold conditions are
important factors involved in respiratory disease. The ostrich’s immune system can be
depressed by these and other stressors, making the birds more sensitive to bacteria, fungi
or viral agents (Huchzermeyer, 1994, 1998b, 1999). Symptoms that are generally
associated with respiratory diseases are:
upper respiratory infections that affects the nasal passages (rhinitis), the infraorbital
sinuses (sinusitis), the conjunctivae (conjunctivitis), larynx (laryngitis) and trachea
(tracheitis). The lungs are constructed in such a way that bacteria and spores that
were inhaled move through to the air sacs, which make them affected less frequently
(Huchzermeyer, 1998b, 1999); and
airsacculitis caused by agents, like dust particles, aerosols and fungi, are carried with
the air and deposited in the air sacs. This happens because they bypass the gas
exchange areas of the lung during inhalation. Aspiration airsacculitis occurs in
feedlot ostriches (Huchzermeyer, 1998b)
Respiratory diseases, other than those caused by mycoplasmas are listed below:
Aspergillosis – mycosis of the air sacs: It is caused by a build-up of contamination in
the environment by fungal spores produced by moulds, particularly those of
Aspergillus spp. Nodular lesions are caused in the trachea, air sacs, lungs, nasal
passages as well as on the conjunctivae. Fumigation or aerosol of the room with
enilkonazole is a successful method of treatment when the birds are present.
Avoidance of mouldy conditions, good ventilation, keeping the birds warm as well as
avoiding stress and malnutrition also helps the prevention of aspergillosis
(Huchzermeyer, 1994, 1998b, 1999, 2002).
Bacteria related to respiratory diseases that have been isolated from ostriches
include: Pasteurella haemolytica, Pseudomonas aeruginosa, Bordetella spp.,
Haemophilus spp., Staphylococcus spp., Streptococcus viridans, Corynebacterium
pyogenes, Mycoplasma spp. and Chlamydia psittaci (Huchzermeyer, 1994, 1998b,
1999).

Avian Mycoplasmas 28
Chlamydia psittaci: Conjunctivitis has been reported in ostriches due to infection with
these bacteria. Fibrinopurulent tracheitis, pneumonia, pericarditis and perihepatitis
have been reported in the case of a generalized disease. Treatment is available
through a prolonged course of tetracyclines (Huchzermeyer, 1994, 1999).
Avian influenza: Several strains of the virus, namely H7N1 (1991 and 1992), H5N9
(1994) and H9N2 (1995) have been isolated from ostriches in South Africa
(Huchzermeyer, 1999, 2002). More recently in 2004, the high-pathogenic avian
influenza virus (HPAI) H5N2 was isolated from ostriches in the Eastern Cape
(http://www.saobc.co.za/modules.php?name=News&file=article&sid=32). However,
not all strains are equally pathogenic, and its severeness depends on the age of the
bird as well as complicating secondary respiratory infections. Respiratory signs,
ocular discharge, green urine and severe depression are clinical signs of avian
influenza. It is important to treat the secondary infections since no treatment or
vaccine is available for avian influenza due to its strain variability (Huchzermeyer,
1999, 2002).
Filariae: Very long and thin roundworms that have been found in the lungs and air
sacs of ostriches. Struthiofilaria megalocephala have been isolated from the air sacs
of a South African ostrich. Isolations have been rare and they appear to be harmless
(Huchzermeyer, 1994, 1999).
Chaetotoxy: Rhinitis, sinusitis and airsacculitis were found in an ostrich infested with
quill mites that normally cause severe damage to the feathers. Treatment with
ivermectin relieves the respiratory symptoms of chaetotoxy (Huchzermeyer, 1994,
1998b).
Pneumonia: It is relatively rare in ostriches due to the construction of the lungs
(Huchzermeyer, 1998b).
Anthracosis: Anthracosis and pneumoconiosis have been found to cause
encapsulated granulomata in the lungs (Huchzermeyer, 1998b).
2.9 Poultry Mycoplasma Vaccines
Several vaccines for the treatment of poultry mycoplasmas, as well as methods of
administering a vaccine are available. However, none of these vaccines have specifically
been developed for ostriches which emphasize the need for the development, trial and
registration of a specific vaccine.
Avian Mycoplasmas 29
Vaccines have four immunological requirements, and according to Ada (1994) they are:
(i) antigen processing and interleukin production must be initiated by the activation of
antigen-presenting cells;
(ii) a high yield of memory cells by activation of T and B cells;
(iii) variation in immune response in the population due to major histocompatibility
complex (MHC) polymorphism must be overcome by the generation of Th and Tc cells
to several epitopes; and
(iv) antibodies must be continually present
Immunization must also be successful, and therefore the following criteria according to Ellison
et al. (1992) must be met:
(i) the vaccine must contain protective immunogen(s);
(ii) if a live vaccine, it must be genetically and phenotypically stable;
(iii) a protective respiratory mucosal immune response must be elicited via the route and
presentation; and
(iv) protection of the vaccine must not induce toxic reactions or adverse immune
abnormalities
The above mentioned requirements are applicable to all vaccines for humans and animals.
However, the question still stands on what the ideal poultry and ostrich mycoplasma vaccine
should be like. Whithear (1996) suggested the following regarding poultry mycoplasmas, and
this is therefore also relevant for an ostrich mycoplasma vaccine. The ideal mycoplasma
vaccine should be safe to use and cost-effective. Safety is more important in the case of live
vaccines than with bacterins. Live vaccines should not cause disease in the vaccinated
animal, or spread to neighbouring flocks and cause disease. Regression to a virulent form
should not occur in an attenuated strain. Lifelong immunity, preferably from a single dose,
must be initiated by the vaccine. Manufacture of the vaccine must be cheap, and it must be
derived from properly defined seed stock with a consistently high potency and purity.
Administration of the vaccine to a large number of birds should be cheap and convenient. In
the case of a flock, performance should improve to exceed the cost of purchase and
administration. The ideal mycoplasma vaccine does not exist yet, since vaccines currently
available still have disadvantages associated with their use (Whithear, 1996).

Avian Mycoplasmas 30 2.9.1 Vaccines
Two types of vaccines are available for poultry, namely killed whole cells (bacterins) or living
cultures, both having their advantages and uses (Jordan, 1990b; Pattison and Cook, 1996).
At the Onderstepoort Veterinary Institute, South Africa, vaccines for the following diseases
have been used in ostriches: anthrax, botulism and clostridial enterotoxaemia, but none for
mycoplasmas (Huchzermeyer, 1998b). Live vaccines have been developed for M.
gallisepticum and M. synoviae strains, but antibiotics have also been used as treatment for
poultry mycoplasmas.
2.9.1.1 Killed vaccines (bacterins)
Bacterins are made up of inactivated organisms suspended either in aluminium hydroxide
adjuvants or an aqueous oil emulsion. They provide high and extended levels of immunity,
and must be injected (Jordan, 1990b; Pattison and Cook, 1996; Whithear, 1996). An
advantage of using bacterins above live vaccines is that they are non-infectious, and thus
will not revert to virulence or cross-infect to other stock. However, they are expensive and
birds need to be vaccinated individually. Bacterins of M. gallisepticum are used
commercially in several countries, but bacterins of M. synoviae are not used widely in the
poultry industry (Whithear, 1996; Levisohn and Kleven, 2000). Oil emulsion bacterins are
not recommended for use in ostriches, since they cause large abscesses and granulomas
underneath the skin. If they are to be used, the vaccine must be centrifuged in advance in
order for the oil to be separated. The oil level is removed and the oil free vaccine can then
be used for subcutaneous injection (Dr. A. Botes, 2005, personal communication).
2.9.1.2 Live vaccines
Live vaccines usually contain only one antigen which can either be a naturally occurring
strain of moderate virulence, or an artificially attenuated strain of low virulence. These
vaccines can be administered through various methods to an individual bird or a flock.
The mycoplasma replicates rapidly in the target organ(s) and therefore only a small
amount of antigen is required (Jordan, 1990b; Pattison and Cook, 1996; Whithear, 1996).
A significant quality of a live mycoplasma vaccine strain is that it should provide long-term
immunity without causing disease or spreading to other vulnerable birds. The ability of
certain mycoplasma species to interact synergistically with other infectious agents
complicates this delicate balance. Severe diseases can be produced from these

Avian Mycoplasmas 31
synergistic interactions if the birds are subjected to physiological and/or environmental
stress (Whithear, 1996).
2.9.1.3 M. gallisepticum vaccines
When using a M. gallisepticum vaccine, there are three definite objectives that protection
should be provided for, namely (i) disease in the respiratory tract, (ii) fall in egg
production, and (iii) transmission of M. gallisepticum through the egg (Whithear, 1996).
Currently, there are four strains of live M. gallisepticum vaccines that are used
commercially worldwide. These are the F strain, ts-11 and 6/85.
The F strain occurs naturally, has moderate virulence in chickens and high virulence in
turkeys. Transmissibility of this strain is also low. Administering of the F strain vaccine can
be via several routes including intranasal, intraocular and drinking water, but coarse spray
is used most often. Vaccination with this strain prevents egg production losses effectively,
and it stimulates immunity against infection by challenge or wild-type infection (Whithear,
1996; Levisohn and Kleven, 2000).
Strain ts-11 is an artificially attenuated strain with low virulence and low tendency to
spread between birds. Administering of this vaccine is via eye drops. Protection is induced
after challenge with M. gallisepticum through the development of circulating antibodies.
The ts-11 strain provides lifelong immunity by remaining in the upper respiratory tract for
the rest of the life of the vaccinated flock (Whithear, 1996; Levisohn and Kleven, 2000).
Strain 6/85 is also artificially attenuated, has low virulence and does not spread easily
from bird to bird. This vaccine induces resistance against virulent M. gallisepticum. No
humoral antibody response is stimulated although the vaccine can be detected in the
upper respiratory tract for four to eight weeks after administration by spray. The primary
use of this vaccine is to prevent egg production losses (Whithear, 1996; Levisohn and
Kleven, 2000).
The newly available Nobilis MG 6/85 vaccine, a live M. gallisepticum vaccine which is a
commercially available from Intervet, appears to be an almost ideal vaccine. Research
has shown that it is genetically stable, non-pathogenic, suitable for convenient storage as
Avian Mycoplasmas 32
well as mass administration, and it also prevents drops in egg production related to M.
gallisepticum (Nobilis MG 6/85, 2005).
The ts-11 and 6/85 strains are preferred to the F strain because of their low virulence as
well as low potential to be transmitted to unvaccinated flocks.
Control of stock is the preferred method of keeping them free from M. gallisepticum
infection, but in cases where this is not possible, vaccination is the alternative method
(Levisohn and Kleven, 2000). Current vaccines do have a disadvantage, namely that
there is no serological technique that can accurately distinguish between a naturally
infected and vaccinated flock (Whithear, 1996).
2.9.1.4 M. synoviae vaccines
Currently, the MS-H strain, an attenuated strain of M. synoviae, is used as a vaccine
against M. synoviae. It is administered by eye drops, after which it colonises the
respiratory tract of chickens, stimulates a measurable serum antibody response, and
remains in the respiratory tract for at least 55 weeks after vaccination. No lesions were
caused after inoculating it into the air sacs or by administration via aerosol to chickens. At
the time of vaccination, the success of the MS-H strain depends on the bird being free
from exposure to the wild-type M. synoviae (Whithear, 1996).
2.9.1.5 DNA vaccines
Wolff et al. (1990) originally described the concept of a DNA vaccine. Although details
regarding the mechanisms of action of a DNA vaccine are still unclear, the principle is
relatively simple. Genes encoding the immunogenic protein(s) are inserted into a suitable
eukaryotic expression plasmid that can be replicated in bacteria. After large-scale
production and purification steps, the DNA vaccine can be directly inoculated, usually by
intramuscular injection, into the animal to be vaccinated. Subsequently the plasmid insert
is expressed by the host cells and the protein produced initiates an immune response
(Wolff et al., 1990).
The use of a DNA vaccine is a very powerful tool and it has several advantages as well as
disadvantages. Advantages of DNA immunization include the following: (i) it mimics live
attenuated vaccination; (ii) correct MHC I presentation of antigen is provided; (iii)

Avian Mycoplasmas 33
concurrent administration is allowed; (iv) genetic stability of immunizing plasmid; and (v)
modification of the immune response may be permitted (Webster, 1998; Oshop et al.,
2002).
Disadvantages of DNA immunization include (i) induction of tolerance; (ii) integration of
the DNA into the host genome; and (iii) induction of auto-immunity and anti-DNA
antibodies (Webster, 1998; Oshop et al., 2002).
Although the concept of DNA vaccination is still in its early stages in the poultry industry, it
has been found to be advantageous. Progeny have high levels of maternal antibodies due
to vaccination of the hens, and interference of passive maternal antibodies is also minimal
(Oshop et al., 2002).
2.9.2 Administration of vaccine
As mentioned above, two types of vaccines are available for poultry, namely killed or live
vaccines. Although there are several ways of administering a vaccine, a killed vaccine must
be injected and a live vaccine can be sprayed over the facial area. Live vaccines can also be
administered via the drinking water, through eye drops or injection. Killed vaccines are
normally supplied in suspension or emulsion, whilst live vaccines are normally supplied in a
freeze-dried form in vials (Jordan, 1990b; Pattison and Cook, 1996). Administration of
vaccines and medication for an individual bird as well as a flock will be discussed briefly.
2.9.2.1 Individual vaccination
The individual bird, or ostrich, can be vaccinated via one of the following ways:
• Dosing by mouth: Also known as drenching. Liquid is poured over the larynx
into the oesophagus, and care must be taken not to pour it down the trachea
(Huchzermeyer, 1998a).
• Injection: Killed or live vaccines are either given intramuscularly, into the breast
or leg, or subcutaneously under the loose skin at the back of the neck. In the
case of the ostrich, injections are given subcutaneously and the leg muscles
must be avoided at all times since it is the most valuable meat, and injection
marks downgrade the skin. A less diluted vaccine can cause kidney damage
due to premature excretion of the vaccine via the renal portal system which
Avian Mycoplasmas 34
drains the posterior half of the ostrich’s body (Jordan, 1990b; Pattison and
Cook, 1996; Huchzermeyer, 1998a).
• Eye drop: The most effective method of administering a live vaccine is through
eye drops or the intranasal route. Accuracy is important which makes
immunisation a bit time consuming (Jordan, 1990b; Pattison and Cook, 1996).
• Wing web: This method, via the wing web, is the principal method of
administration of the fowl pox vaccine. Seven to fourteen days post-vaccination
a slightly raised and swollen area should appear at the application site. This
indicates that the vaccine was absorbed (Jordan, 1990b; Pattison and Cook,
1996).
• In ovo: One of the vaccination methods that have not been used widely in
ostriches but would be possible is vaccination via the egg. An example of this
method is the administration of Marek’s disease vaccines via inoculation of
fertile chicken eggs at 18 days. This system will hopefully some day be
suitable for administration of various live vaccines (Pattison and Cook, 1996).
2.9.2.2 Flock vaccination
In some cases, individual vaccination is not necessary and the whole flock can be
vaccinated at the same time. Administration methods for the flock include the following:
• Drinking water: Live vaccines in particular, can be administered via drinking
water. They should be reconstituted in clean cold water containing powdered
milk. The powdered milk acts as a stabilizer and protects the live vaccine from
harmful substances that might occur in the water. Vaccines are usually diluted
according to the age of the birds, but the water consumption of the bird also
has to be considered (Jordan, 1990b; Pattison and Cook, 1996). In the case of
the ostrich, this route of administering live vaccines is not recommended. Their
drinking behaviour is irregular, the water troughs are exposed to the ultraviolet
rays of the sun and the life span of the vaccine virus is shortened in the water
(Huchzermeyer, 1998a; Perelman, 1999).
• In feed: This method is the best in cases where medication has to be given
over a prolonged period, and has been used to distribute live Newcastle
disease vaccine to small backyard flocks. The results, however, have been
quite variable (Pattison and Cook, 1996; Huchzermeyer, 1998a).
Avian Mycoplasmas 35
• Spray or aerosol: The live vaccine, reconstituted in distilled water, can also be
administered by spray or aerosol over the facial area. Droplet sizes of less
than 5 μm in diameter can penetrate the respiratory system into the lungs. A
coarse spray contacts only the upper respiratory tract with droplet sizes being
larger than 10 μm. This method of vaccination is normally more efficient in a
controlled environment than in an open sided house (Jordan, 1990b; Pattison
and Cook, 1996).
• Inhalation: By fogging or fumigating an enclosed room with ostrich chicks,
antifungals and antimicrobials can be administered to them (Huchzermeyer,
1998a).
2.9.3 Previous studies with poultry mycoplasma vaccines
One of the first persons to detect that chickens had immunity to M. gallisepticum infection,
was Nelson in 1935 (as referred to in Adler and Lamas Da Silva, 1970). He noted that after
recovery from chronic coryza caused by M. gallisepticum in the chickens, they were
resistant to a second exposure (Adler and Lamas Da Silva, 1970). However, birds that have
some degree of immunity after recovery from an infection still carry the organism and can
transmit the disease to susceptible stock either by contact or through egg transmission to
their progeny. It has also been observed that antibodies remained in chickens that
recovered from an infection by M. gallisepticum, and they had a faster rate of M.
gallisepticum elimination upon re-exposure (Yoder, 1984; Ley and Yoder, 1997).
Although Lin and Kleven (1984) stated that while the use of bacterins as vaccines does not
provide effective immunity against challenge with M. gallisepticum, they do have the
advantage of not reverting to virulence or cause vaccine reactions. Bacterins also elicit a
more consistent and reliable immune response (Droual et al., 1990). Panigrahy and co-
workers did a study in 1981 in which they compared the immunogenic potency of an oil
emulsion bacterin versus an aqueous preparation. They found that oil emulsified M.
gallisepticum bacterins are highly antigenic and they also induce significantly higher
antibody titers than the aqueous preparation (Panigrahy et al., 1981).
One disadvantage of using a bacterin is the lesions that are sometimes caused when
injecting chickens intramuscularly. These lesions, which are mostly cysts with thin fibrous
capsules, are sometimes associated with lymphocytic aggregates but less often with a

Avian Mycoplasmas 36
granulomatous reaction (Droual et al., 1990). From another study by Droual et al. (1993), it
was suggested that the vaccine materials follow paths of least resistance, hence the
negative effect they can have depending on the route of injection. Therefore it is better to
inject oil-adjuvanted killed vaccines subcutaneously rather than intramuscularly in the leg
which could lead to lameness (Droual et al., 1993). In the case of ostriches, the forming of
abscesses under the skin is also seen with the use of oil emulsion bacterins. Despite the
disadvantages of oil-adjuvanted bacterins, they are associated with stronger immunogenic
responses as found by Droual et al. (1993) which make these vaccines popular for use.
As discussed previously, the live M. gallisepticum F-strain vaccine occurs naturally and has
high virulence to turkeys but only moderate virulence to chickens (Lin and Kleven, 1984;
Whithear, 1996; Levisohn and Kleven, 2000; Ferraz and Danelli, 2003). In a study done by
Lin and Kleven (1984), they noticed that eye-drop vaccination of the F-strain possibly does
not provide adequate immunity against M. gallisepticum. Penetration of the vaccine might
not be deep enough into the respiratory tract and multiply as rapidly and therefore the
immune system has less exposure to the antigen. The use of aerosol is recommended as
vaccination method rather than vaccination via eye-drop (Lin and Kleven, 1984).
All three live M. gallisepticum vaccines were compared to each other in a study by Abd-El-
Motelib and Kleven (1993) in young chickens. They found that the F-strain was more virulent
than the ts-11 and 6/85 strains which elicited little or no vaccination reaction. The F-strain
provided better protection against air sacculitis and was also more effective in preventing
colonization by challenge strains.
In a recent study by Birό et al. (2005) on the M. gallisepticum ts-11 vaccine, their results
showed that the ts-11 vaccine is safe to use, and it does not cause any pathological lesions
or clinical signs. Their results were based on a challenge with the virulent M. gallisepticum R
strain. However, Ferraz and Danelli (2003) found that it is difficult to distinguish between a
vaccinated and naturally infected flock with the use of the ts-11 strain since no molecular
marker is available. Noormohammadi et al. (2002a) failed to detect antibodies after ts-11
vaccination, but they found that after administering higher doses of vaccine higher antibody
levels were produced.
The M. gallisepticum 6/85 strain is safe to use due to its low virulence. Spreading of the 6/85
vaccine from bird to bird is also very poor. Its safety was evaluated by Zaki et al. (2004), and

Avian Mycoplasmas 37
they found that its pathogenicity might be slightly more for turkeys than for chickens. No
evidence of reversion to virulence was observed.
The avirulent M. gallisepticum strain Rhigh, was reconstituted to form the live M. gallisepticum
vaccine GT5. GT5 expresses the major cytadhesin GapA on its surface, yet has low levels
of in vitro cytoadherence. During a study to test its efficacy, Papazisi et al. (2002b) found
that GT5 could stimulate a protective immune response. Two weeks after vaccination only
modest amounts of IgG and little, if any, secretory IgA or IgM anti-M. gallisepticum were
found in tracheal washings. After challenge with virulent M. gallisepticum strain Rlow, ample
amounts of specific IgA were found which suggests its role in clearing the infection rather
than giving protection. It is thus hypothesized that tracheal IgG gives protection against Rlow
since it was elicited by GT5 vaccination. Immunization with GT5 thus provides short term
protection against challenge with wild type M. gallisepticum Rlow.
In the case of M. synoviae vaccines, the live attenuated MS-H strain vaccine was studied by
Noormohammadi et al. (2002b) in order to determine whether low levels of antibodies in
vaccinated chickens were due to a reduced capability of the antigen in detecting antibodies,
or the limited ability of the vaccine to elicit antibodies. They found that the antigens used in
serological tests were unable to detect the antibodies, hence the lower levels, and the
highest detectable level of antibody response was only seen after 100 days of vaccination.
2.9.4 Antibody response
Infectious diseases usually have a classic antibody response which can be divided into three
phases: (i) during weeks 1 to 3 of the disease, antibodies are produced rapidly; (ii) the
antibody levels peak at 2 to 4 weeks after infection; and (iii) antibody levels show a gradual
decrease months to years after recovery from the infection (Kenny, 1992).
In a study by Blignaut et al. (2000), the antibody response to Newcastle disease virus (NDV)
in South African ostriches was tested. Two vaccine trials were launched in which birds for
slaughtering (age 2.5 months up to 14 months) as well as young birds (age 5 weeks up to
2.5 months) were vaccinated at different time intervals. From the results that were obtained
for both trials, a peak in antibody response could already be seen after 14 days, thus 2
weeks, but the response was better after 21 days, thus 3 weeks. The assumption could be
made that the antibody response against mycoplasma infections in the ostriches would be
more or less the same.

Avian Mycoplasmas 38
The occurrence of antibodies to M. gallisepticum and M. synoviae as well as other common
avian pathogens was determined in a study by Ley et al., (2000) in 163 commercially raised
slaughter-age ostriches in Ohio and Indiana. They found that these ostriches had minimal
exposure to any of the pathogens and therefore no antibody reaction. These results
confirmed earlier findings by Shane and Tully in 1996, where no M. gallisepticum or M.
synoviae-positive serum was reported in any common commercial ratite species. In contrast
to this, 11% of 149 ostriches in Zimbabwe had antibodies that bound to M. gallisepticum
and/or M. synoviae coating antigens in an ELISA test (Ley et al., 2000).
2.10 Pathogenicity of Mycoplasmas
Mycoplasmas are known as the ideal parasite because they seldom kill their host and rather
live in harmony. In order to be a successful pathogen, it must have a way of entering its host,
reach the target tissue and possibly adhere to the target. It should invade the target tissue
and multiply whilst evading the host defences and causing some damage to the host. Finally,
it must be able to escape and move on to a fresh host (Bradbury, 2005). The first report in
humans of mycoplasmas as infectious agent was in the 1930’s and 1940’s, and since then
the impact of mycoplasma species on emerging diseases have increased in humans as well
as animals (Baseman and Tully, 1997). Through adhesion, mycoplasmas are pathogenic to
their hosts.
2.10.1 Adhesion to host cell
For a mycoplasma to colonize and infect a host, adhesion is essential. Its pathogenicity is
dependent on adhesion to the host, and without adhesion the mycoplasma is avirulent
(Razin and Jacobs, 1992; Rottem, 2003). The process of adhesion is multifactorial and
accessory membrane proteins are also involved (Razin et al., 1998). When a mycoplasma
attaches to its host, it can interact with membrane receptors or adjust transport mechanisms.
The cell membrane of the host is also sensitive to toxic materials, such as hydrogen
peroxide and superoxide radicals, generated by adhering mycoplasmas. It is believed that
they cause oxidative stress in the host cell which leads to damage to the cell membrane
(Rottem and Naot, 1998; Rottem, 2003).
The cell components responsible for attachment are proteins and are termed adhesins, and
are part of the cell membrane (Razin and Jacobs, 1992). Surface-exposed adhesins have
been identified in Mycoplasma pneumoniae, namely P1 and P30, as well as accessory

Avian Mycoplasmas 39
proteins named HMW1, HMW2, HMW3, A, B and C. P1 is regarded as the main M.
pneumoniae adhesin, but shares a number of characteristics with P30. The accessory
proteins are necessary for proper functioning of the adhesins, but they could not be defined
as adhesins as they are not directly involved in cell adherence. Without P1, M. pneumoniae
is unable to attach properly to its host and is therefore avirulent (Razin and Jacobs, 1992;
Krause, 1998; Razin et al., 1998; Krause and Balish, 2001; Chaudhry et al., 2005;
www.mgc.ac.cn/, 2005). In M. genitalium the major adhesin is termed MgPa which is the
counterpart or analogue of P1, and their roles in attachment are apparantly similar (Carson
et al., 1992; Razin and Jacobs, 1992; Razin et al., 1998; Razin, 1999). Other adhesins that
have been identified include those of M. gallisepticum, namely GapA and CrmA
(cytadherence-related molecule), and M. pirum which is named P1-like adhesin (Papazisi et
al., 2000). In the case of M. fermentans and M. hominis no tip structure is present (Razin et
al., 1998), but M. hominis can adhere to its host via two cytoadhesins, namely the
membrane proteins P50 and P100 (Henrich et al., 1993).
On the host cell membrane, receptors responsible for mycoplasma attachment have been
identified as sialoglycoconjugates (Razin and Jacobs, 1992; Razin et al., 1998;
www.mgc.ac.cn/, 2005). These are receptors for M. pneumoniae, M. genitalium, M.
gallisepticum as well as M. synoviae (Razin and Jacobs, 1992). For M. pneumoniae as well
as the other mycoplasmas there is more than one type of receptor (Razin, 1999; Rottem,
2003; www.mgc.ac.cn/, 2005). It has been found that several mycoplasma species are able
to survive in nonphagocytic cells (Rottem and Naot, 1998). It is believed that mycoplasmas
stay on the epithelial cell’s surface, but a few that are not naturally pathogenic have evolved
mechanisms to penetrate host cells (Rottem, 2003). In the case of M. penetrans, invasion of
the host cell begins by binding to the cell surface which is followed by internalization.
Immediate and intimate contact between the mycoplasma membrane and cytoplasmic
membrane of the host cell is due to the absence of a rigid cell wall, and this may lead to cell
fusion. Mycoplasmas requiring unesterified cholesterol for growth have fusogenic activity
(Rottem and Naot, 1998; Rottem, 2003). M. pneumoniae, M. genitalium, M. fermentans and
the poultry mycoplasma M. gallisepticum are, however, all known to be surface parasites
(Rottem, 2003).
For a mycoplasma to survive in its host, it has to elude the immune system. One way of
escaping the host’s immune system, is by varying its antigenic repertoire which prevents it
from being recognized which is commonly used by a variety of other pathogens as well.
Avian Mycoplasmas 40
Antigenic variation includes variation by homopolymeric repeats, variation by reiterated
coding sequence domains or variation by chromosomal repeats. Molecular mimicry and
phenotypic plasticity are also mechanisms which guarantee that mycoplasmas are not
entirely or efficiently recognized by the host’s immune system (Wise, 1993; Rottem and
Naot, 1998; Rottem, 2003). Although some mycoplasmas can reside intracellularly, their
ability to multiply within the host cell still needs credible evidence (Rottem, 2003).
2.10.2 Interaction with the host immune system
Mycoplasma-induced specific acquired immunity as well as non-specific innate immunity is
involved when a mycoplasma interacts with a host’s immune system. The host’s immune
system can either be activated or suppressed by certain mycoplasma species. These are
the actions used to evade host immune responses (Razin et al., 1998; Nicolson et al., 1999).
Specific mechanisms of acquired immunity include stimulation of cell-mediated immunity,
production of local as well as systemic anti-mycoplasmal antibodies, and phagocytosis and
opsonization of organisms. Non-specific immune reactions have an effect on cells making
up the immune system. Influences include inducing B-cell differentiation, inhibiting or
stimulating development of normal lymphocyte subsets; inducing cytokines which include
tumour necrosis factor-α (TNFα), interferons, interleukin-1 (IL-1), IL-2, IL-4, IL-6, and
granulocyte macrophage-colony stimulating factor (GM-CSF) from B-cells as well as other
cell types; increasing the cytotoxicity of T cells, macrophages and natural killer cells;
enhanced expression of cell receptors; and activation of the complement cascade.
Mycoplasmas can also secrete soluble factors that inhibit growth and differentiation of
immune competent cells or stimulate maturation (Razin et al., 1998; Nicolson et al., 1999).
Immune-modulating substances, for example the mycoplasmal lipoprotein spiralin, can be
secreted by mycoplasmas in human and murine species. Apoptosis can also be initiated or
enhanced by mycoplasmas that suppress the host immune system directly, such as the
AIDS-associated mycoplasma, M. fermentans (Nicolson et al., 1999).
Knowledge on interactions between the avian mycoplasmas and the host immune system is
very limited. It has been reported that M. gallisepticum can induce transient
immunosuppression in turkeys infected with avian pneumovirus, and M. meleagridis as well
as M. iowae can cause immunosuppression in turkeys. More recently it was shown that a

Avian Mycoplasmas 41
virulent strain of M. gallisepticum can cause temporary T cell suppression in infected
chickens (Bradbury, 2005).
The mycoplasma’s ability to either suppress or stimulate the host’s immune system
contributes to its pathogenic properties. A chronic, persistent infection is the result of the
mycoplasma being able to evade or suppress the host defence mechanism. Therefore,
clinical symptoms in humans and animals are more indicative of damage due to the immune
and inflammatory responses of the host itself, than to the direct toxic effects of mycoplasma
cell components (Razin et al., 1998; Bradbury, 2005).
Responses from the major antibody classes, IgM, IgG, IgA and IgE are also elicited upon
mycoplasma infection. IgM and IgG are found in the serum of infected animals and humans
and could therefore be used for serodiagnosis of mycoplasma infection. In the case of IgM
responses, they decline after the infection is cleared and can only be used as an indication
of an active infection. On the other hand, IgG responses can remain high for a considerable
time after an infection is resolved. Antibody responses due to mucosal infections in the
airways are associated with IgA and IgE. Attachment of pathogens to the mucosal surface is
blocked by IgA. IgE binds to receptors on mast cells which results in the local release of
inflammatory substances upon contact with the mycoplasma. Therefore the tip structure
which aids in attachment is the ideal target for a vaccine against mycoplasmas (Simecka,
2005).
2.10.3 Other possible virulence causal factors
Other characteristics that have been implied as virulence causal factors of mycoplasmas
include (Simecka et al., 1992; Baseman and Tully, 1997):
(i) the cause of oxidative stress and host cell membrane damage by adhering
mycoplasmas due to the generation of hydrogen peroxide and superoxide radicals;
(ii) disruption of host cell maintenance and function for competition and depletion of
nutrients or biosynthetic precursors;
(iii) increased integrity of the mycoplasma surface and immunoregulatory activities due
to the existence of capsule-like material and electron-dense surface layers or
structures;
Avian Mycoplasmas 42
(iv) surface diversity and potential of escaping the host’s immune defence through high-
frequency phase and antigenic variation;
(v) localized tissue disruption, disorganization and chromosomal aberrations in the host
cell milieu because of secretion or introduction of mycoplasmal enzymes; and
(vi) circumventing of mycoplasmicidal immune mechanisms and selective drug therapies
through intracellular residence
Although mycoplasmas have multiple pathways of interactions, the tip structure, the primary
adhesion organelle, is still the key to its infectivity. Without adhesion, no adaptation to host
microenvironment accompanied by rapid changes in the cell surface adhesion receptor for
better binding and entry as well as antigen mimicry can take place, and hence no
pathogenicity (Nicolson et al., 1999). For this reason, the objective of this study is to target
the tip structure components as potential vaccine candidates, similar molecules to GapA in
M. gallisepticum in the ostrich mycoplasmas are good vaccine candidates as they represent
the first step in pathogenicity. The mycoplasma genome and genes involved in adhesion will
therefore be discussed next.
2.11 The Mycoplasma Genome
As outlined before, mycoplasma genomes can be very small and they survive with a minimum
amount of genes. In this section, characteristics that feature in all mycoplasma genomes will
be discussed first as this is key to their survival. The genome of M. gallisepticum will be
discussed thereafter in greater detail since it is a poultry mycoplasma and the research done
in this project was largely based on M. gallisepticum and the results achieved compared to it.
This will be followed by a comparison of genes that are involved in the structuring of
attachment organelles, such as GapA of M. gallisepticum and P1 of M. pneumoniae, as well
as membrane proteins of M. hominis. As mentioned before, these are very important as they
enable the mycoplasma to attach to its host (Razin et al., 1998).
2.11.1 General characteristics of the genome
The first large-scale attempts to sequence entire mycoplasma genomes commenced around
1990 (Razin et al., 1998). The circular double-stranded mycoplasma genome is the smallest
of all prokaryotes and is approximately a quarter of the size of E. coli (4 700 kb). Genome
sizes have been found to vary from 580 to 1 350 kb. The smallest reported mycoplasma
Avian Mycoplasmas 43
genome is that of the human pathogen M. genitalium with a size of 580 kb (Herrmann, 1992;
Dybvig and Voelker, 1996). The largest genome sequenced so far is that of M. penetrans,
with a size of 1 358 kb. In M. synoviae, the genome size is 800 kb which is smaller than the
genomes of obligate intracellular pathogens (Bencina, 2002; Papazisi et al., 2003). The
genome size can even vary between strains of the same species (Razin et al., 1998). Eight
genomes of the genus Mycoplasma have been sequenced successfully, and this includes
those of M. pneumoniae, M. genitalium, M. penetrans and M. gallisepticum (Razin et al.,
1998; Binnewies et al., 2005). Recently, the sequencing of the genome of M. synoviae has
also been completed (Vasconcelos et al., 2005).
It has been found that there is no correlation between the size of the genome and the
average G+C content, which is in the range of 24 to 33 mol% with a few exceptions, such as
M. pneumoniae with the highest value of 41% (Razin, 1992; Bové, 1993; Rottem and Barile,
1993). This is still low when compared to other bacteria, such as E. coli with a 48 to 52
mol% G+C. In the case of the poultry mycoplasmas, their mol% G+C is 31.8-35.7% for M.
gallisepticum, 25.0% for M. iowae, 27.0-28.6% for M. meleagridis and 28% for M. synoviae
(Herrmann, 1992; Vasconcelos et al., 2005). The distribution of the G+C content in the
genome is very uneven. Due to the low G+C content, the genome is exceptionally A+T rich
(Rottem and Barile, 1993; Razin et al., 1998).
Another characteristic of the mycoplasma genome is the fact that the structure and
organization of important genes is highly conserved between different species. Thus
according to Rottem and Barile (1993) groups of genes are conserved within the genome.
This statement is in contradiction with Rocha and Blanchard (2002) who stated that the gene
order is poorly conserved, and thus the relative position of a gene in the genome is not
conserved.
The variation from the universal genetic code is also an important characteristic. UGA, which
is the universal termination codon, is read as a tryptophan by mycoplasmas (Rottem and
Barile, 1993). Only UAA and UAG are used as termination codons with preference to UAA
(Bové, 1993; Razin et al., 1998; Marin and Oliver, 2003). The start codon, AUG, is at the
beginning of most of the mycoplasmal genes’ coding regions, but GUG and UUG have been
found as substitute start codons (Dybvig and Voelker, 1996). Codons with an A and U
specifically in the wobble (3’) position are favoured, but also in the first and second position
(Razin et al., 1998; Fadiel et al., 2005). This results in fewer Gly, Pro, Ala and Arg residues
in mycoplasmal proteins (Razin et al., 1998).
Avian Mycoplasmas 44
Through genome analysis it has been found that many proteins with functions associated
with catabolism and metabolite transport are encoded by mycoplasmal genes, whereas only
a few anabolic proteins are encoded. This is in accordance with the fact that mycoplasmas
acquire the necessary nutrients from their host and environment as a result of their limited
anabolic capabilities. Pathways used in order to supply energy, their ATP synthesis as well
as essential enzymes that are absent have been discussed under Morphology and
Biochemistry in section 2.6. Through an approximate calculation using theoretical and
experimental approaches, it was determined that the minimum number of important genes
for a mycoplasma is between 265 and 350 (Papazisi et al., 2003).
In the following section, more detail will be given on the genome of M. gallisepticum since it
is a poultry mycoplasma.
2.11.2 The M. gallisepticum strain Rlow genome
The complete genome of M. gallisepticum strain Rlow has been sequenced and is available
in GenBank under accession number AE015450. General features of the genome are
illustrated in Figure 2.2 and discussed below.
The M. gallisepticum genome consists of 996 422 bp with a total G+C content of 31 mol%. It
includes 742 reported coding DNA sequences (CDSs) which represents a 91% coding
density. Only 469 of the CDSs have a function assigned to them, 150 are conserved
hypothetical proteins and thus similar to genes in other bacterial species, and 123 are
unique hypothetical proteins (Papazisi et al., 2003; Browning and Markham, 2004). The
average CDS G+C content is 32 mol% (17-45 mol%), and the average CDS length 1 206 nt
(108-5 928 nt). The average of the third nucleotide position containing a G/C is 24%. Thirty-
three tRNA genes were identified and they are complementary to all of the typically found
twenty amino acids. As in the other mycoplasma species, only UAA and UAG are used as
termination codons. Two copies of the rRNA genes are present in the genome: one set is
arranged as an operon with 16S, 23S and 5S genes beside each other; and upstream of the
5S gene is a second copy of the 16S rRNA gene (Papazisi et al., 2003).
The origin of replication (oriC) of mycoplasma genomes is believed to be supposed DnaA
boxes in the area nearby the dnaA gene, which is the oriC for most bacteria. The gene order
of the oriC region in the phylogenetic cluster, which contains M. gallisepticum, seems to be
conserved (Papazisi et al., 2003).
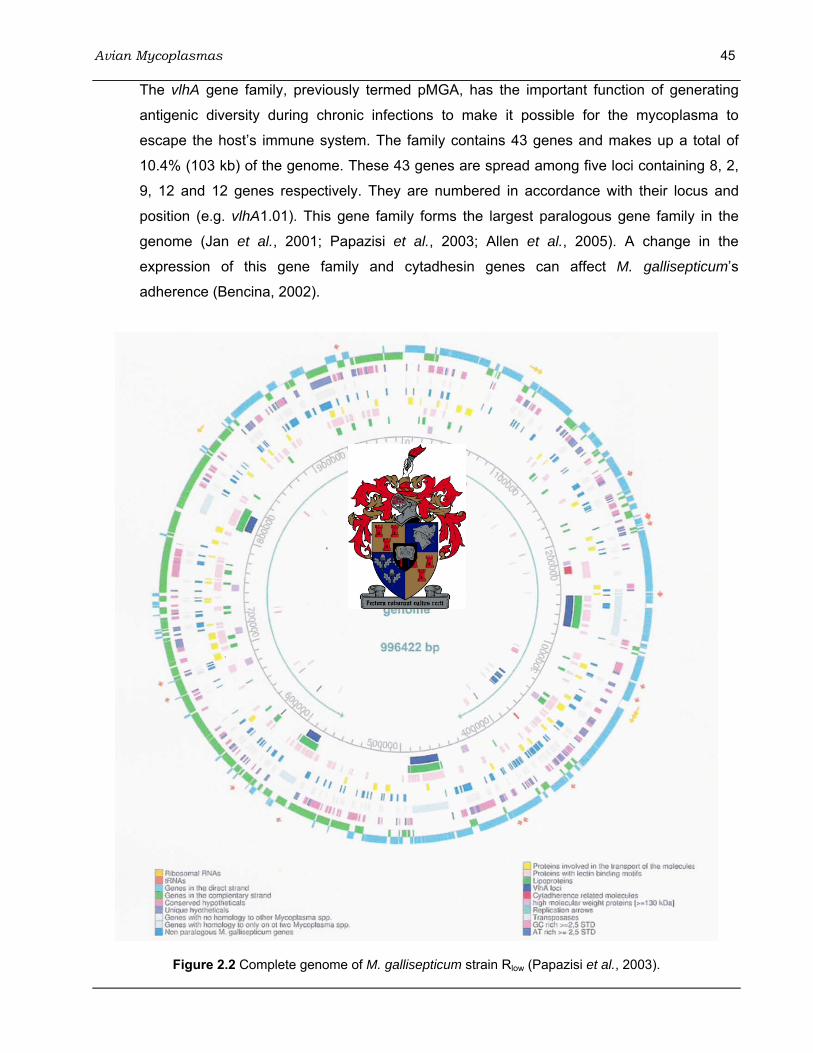
Avian Mycoplasmas 45
The vlhA gene family, previously termed pMGA, has the important function of generating
antigenic diversity during chronic infections to make it possible for the mycoplasma to
escape the host’s immune system. The family contains 43 genes and makes up a total of
10.4% (103 kb) of the genome. These 43 genes are spread among five loci containing 8, 2,
9, 12 and 12 genes respectively. They are numbered in accordance with their locus and
position (e.g. vlhA1.01). This gene family forms the largest paralogous gene family in the
genome (Jan et al., 2001; Papazisi et al., 2003; Allen et al., 2005). A change in the
expression of this gene family and cytadhesin genes can affect M. gallisepticum’s
adherence (Bencina, 2002).
Figure 2.2 Complete genome of M. gallisepticum strain Rlow (Papazisi et al., 2003).

Avian Mycoplasmas 46
In M. gallisepticum, expression of both the gapA and crmA gene is necessary for
cytadherence and pathogenesis (Papazisi et al., 2003). Through an experimental infection in
chickens with different M. gallisepticum strains, it was found that a low (Rlow) as well as high-
passage population (Rhigh) of strain R colonizes the trachea, but only Rlow causes air sac
lesions. Their ability to invade non-phagocytic eukaryotic cells in vitro also differs (Winner et
al., 2000; Much et al., 2002). It is also the expression of GapA that distinguishes Rlow from
Rhigh in which it is absent (Much et al., 2002). The gapA gene is the equivalent of M.
pneumoniae cytadhesin P1, and crmA shows 41% amino acid homology with the ORF6
protein of M. pneumoniae which also plays an accessory role in cytadherence. Downstream
of the gapAcrmA operon are two CDSs, crmB and crmC, that encode proteins possibly
sharing homology to GapA and CrmA (Papazisi et al., 2003). Another alleged cytadhesin-
related protein in M. gallisepticum is PvpA. This adhesin molecule is variable in size among
strains and exists only as a single chromosomal copy (Boguslavsky et al., 2000; Liu et al.,
2001).
A large percentage of the genome is dedicated to membrane-associated molecules. Ten
percent of all CDSs are assumed to be lipoproteins normally revealed on the mycoplasma
surface, and almost 20% contain multiple transmembrane domains (Papazisi et al., 2003;
Browning and Markham, 2004). The ABC transporter molecules make up the second-largest
paralogous family in M. gallisepticum with 24 CDSs (Papazisi et al., 2003).
Although almost one-third of the genes are still undefined in terms of function, approximately
17% of the M. gallisepticum genes seem to be unique. Further studies into the genomics
and metabolism of this pathogen will clarify the role of genes in its virulence mechanisms
(Papazisi et al., 2003; Browning and Markham, 2004).
2.11.3 The genes and proteins involved in host cell adhesion
The poultry mycoplasmas M. gallisepticum and M. synoviae, as well as other mycoplasmas,
possess the ability to adhere to their respective hosts, and this ability allows them to become
pathogenic. It must be assumed that the ostrich mycoplasmas, Ms01, Ms02 and Ms03,
possess adherence mechanisms to enable them to be pathogenic. As one of the objectives
of this study is to identify a gene(s) in the ostrich mycoplasmas, Ms01, Ms02 and Ms03, with
a role in cytadherence and possibly pathogenesis, an overview of the present knowledge of
mycoplasma adherence will be given.
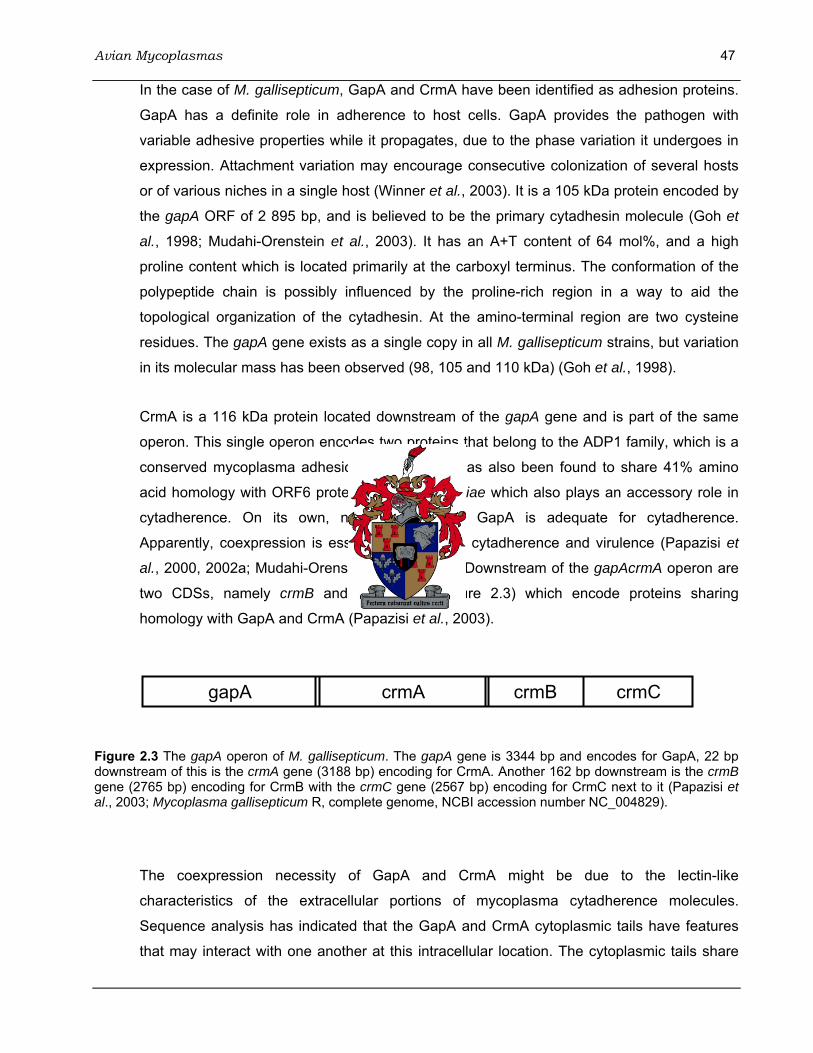
Avian Mycoplasmas 47
In the case of M. gallisepticum, GapA and CrmA have been identified as adhesion proteins.
GapA has a definite role in adherence to host cells. GapA provides the pathogen with
variable adhesive properties while it propagates, due to the phase variation it undergoes in
expression. Attachment variation may encourage consecutive colonization of several hosts
or of various niches in a single host (Winner et al., 2003). It is a 105 kDa protein encoded by
the gapA ORF of 2 895 bp, and is believed to be the primary cytadhesin molecule (Goh et
al., 1998; Mudahi-Orenstein et al., 2003). It has an A+T content of 64 mol%, and a high
proline content which is located primarily at the carboxyl terminus. The conformation of the
polypeptide chain is possibly influenced by the proline-rich region in a way to aid the
topological organization of the cytadhesin. At the amino-terminal region are two cysteine
residues. The gapA gene exists as a single copy in all M. gallisepticum strains, but variation
in its molecular mass has been observed (98, 105 and 110 kDa) (Goh et al., 1998).
CrmA is a 116 kDa protein located downstream of the gapA gene and is part of the same
operon. This single operon encodes two proteins that belong to the ADP1 family, which is a
conserved mycoplasma adhesion family. CrmA has also been found to share 41% amino
acid homology with ORF6 protein of M. pneumoniae which also plays an accessory role in
cytadherence. On its own, neither CrmA nor GapA is adequate for cytadherence.
Apparently, coexpression is essential for efficient cytadherence and virulence (Papazisi et
al., 2000, 2002a; Mudahi-Orenstein et al., 2003). Downstream of the gapAcrmA operon are
two CDSs, namely crmB and crmC (see Figure 2.3) which encode proteins sharing
homology with GapA and CrmA (Papazisi et al., 2003).
Figure 2.3 The gapA operon of M. gallisepticum. The gapA gene is 3344 bp and encodes for GapA, 22 bp downstream of this is the crmA gene (3188 bp) encoding for CrmA. Another 162 bp downstream is the crmB gene (2765 bp) encoding for CrmB with the crmC gene (2567 bp) encoding for CrmC next to it (Papazisi et al., 2003; Mycoplasma gallisepticum R, complete genome, NCBI accession number NC_004829).
The coexpression necessity of GapA and CrmA might be due to the lectin-like
characteristics of the extracellular portions of mycoplasma cytadherence molecules.
Sequence analysis has indicated that the GapA and CrmA cytoplasmic tails have features
that may interact with one another at this intracellular location. The cytoplasmic tails share
gapA crmA crmC crmB
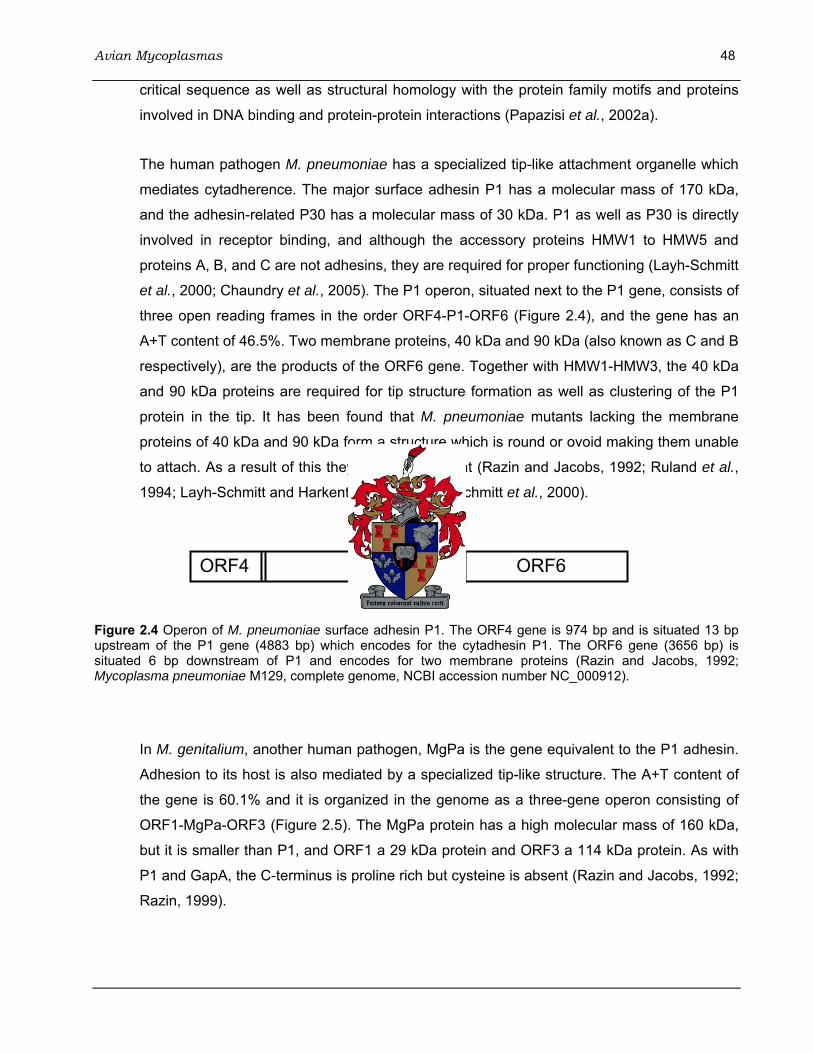
Avian Mycoplasmas 48
critical sequence as well as structural homology with the protein family motifs and proteins
involved in DNA binding and protein-protein interactions (Papazisi et al., 2002a).
The human pathogen M. pneumoniae has a specialized tip-like attachment organelle which
mediates cytadherence. The major surface adhesin P1 has a molecular mass of 170 kDa,
and the adhesin-related P30 has a molecular mass of 30 kDa. P1 as well as P30 is directly
involved in receptor binding, and although the accessory proteins HMW1 to HMW5 and
proteins A, B, and C are not adhesins, they are required for proper functioning (Layh-Schmitt
et al., 2000; Chaundry et al., 2005). The P1 operon, situated next to the P1 gene, consists of
three open reading frames in the order ORF4-P1-ORF6 (Figure 2.4), and the gene has an
A+T content of 46.5%. Two membrane proteins, 40 kDa and 90 kDa (also known as C and B
respectively), are the products of the ORF6 gene. Together with HMW1-HMW3, the 40 kDa
and 90 kDa proteins are required for tip structure formation as well as clustering of the P1
protein in the tip. It has been found that M. pneumoniae mutants lacking the membrane
proteins of 40 kDa and 90 kDa form a structure which is round or ovoid making them unable
to attach. As a result of this they are also avirulent (Razin and Jacobs, 1992; Ruland et al.,
1994; Layh-Schmitt and Harkenthal, 1999; Layh-Schmitt et al., 2000).
Figure 2.4 Operon of M. pneumoniae surface adhesin P1. The ORF4 gene is 974 bp and is situated 13 bp upstream of the P1 gene (4883 bp) which encodes for the cytadhesin P1. The ORF6 gene (3656 bp) is situated 6 bp downstream of P1 and encodes for two membrane proteins (Razin and Jacobs, 1992; Mycoplasma pneumoniae M129, complete genome, NCBI accession number NC_000912).
In M. genitalium, another human pathogen, MgPa is the gene equivalent to the P1 adhesin.
Adhesion to its host is also mediated by a specialized tip-like structure. The A+T content of
the gene is 60.1% and it is organized in the genome as a three-gene operon consisting of
ORF1-MgPa-ORF3 (Figure 2.5). The MgPa protein has a high molecular mass of 160 kDa,
but it is smaller than P1, and ORF1 a 29 kDa protein and ORF3 a 114 kDa protein. As with
P1 and GapA, the C-terminus is proline rich but cysteine is absent (Razin and Jacobs, 1992;
Razin, 1999).
ORF4 P1 ORF6
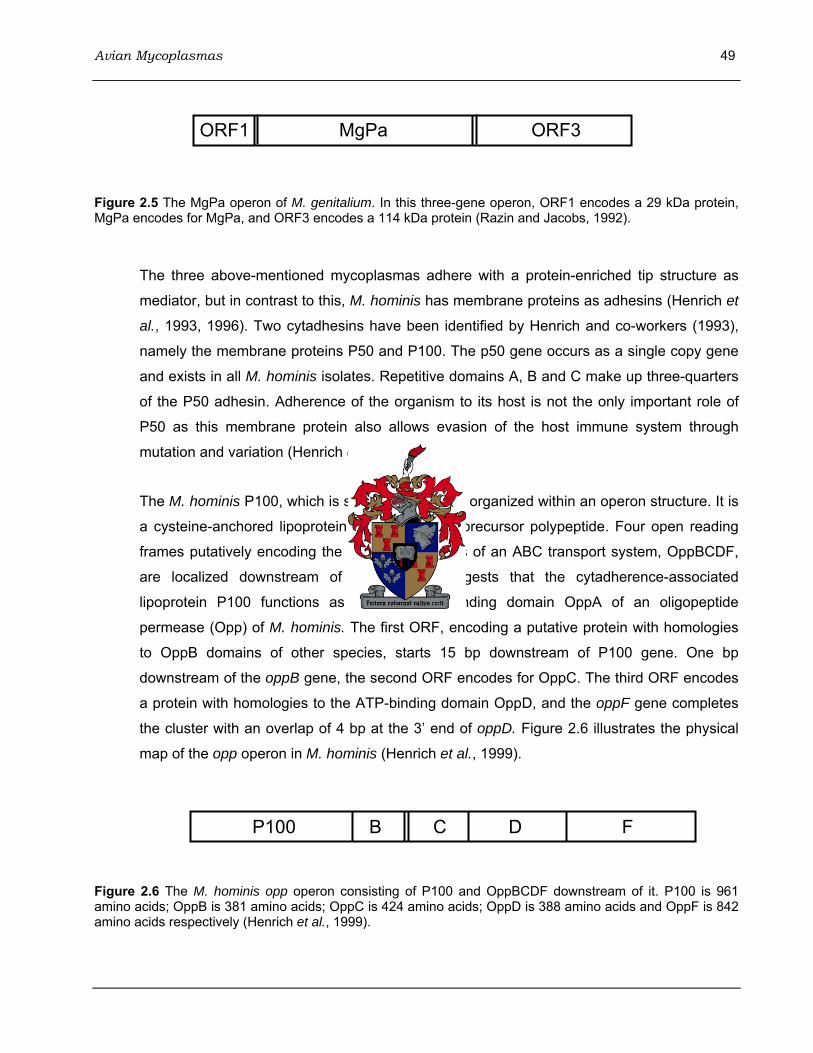
Avian Mycoplasmas 49
Figure 2.5 The MgPa operon of M. genitalium. In this three-gene operon, ORF1 encodes a 29 kDa protein, MgPa encodes for MgPa, and ORF3 encodes a 114 kDa protein (Razin and Jacobs, 1992).
The three above-mentioned mycoplasmas adhere with a protein-enriched tip structure as
mediator, but in contrast to this, M. hominis has membrane proteins as adhesins (Henrich et
al., 1993, 1996). Two cytadhesins have been identified by Henrich and co-workers (1993),
namely the membrane proteins P50 and P100. The p50 gene occurs as a single copy gene
and exists in all M. hominis isolates. Repetitive domains A, B and C make up three-quarters
of the P50 adhesin. Adherence of the organism to its host is not the only important role of
P50 as this membrane protein also allows evasion of the host immune system through
mutation and variation (Henrich et al., 1998).
The M. hominis P100, which is species specific, is organized within an operon structure. It is
a cysteine-anchored lipoprotein expressed as a precursor polypeptide. Four open reading
frames putatively encoding the four core domains of an ABC transport system, OppBCDF,
are localized downstream of P100. This suggests that the cytadherence-associated
lipoprotein P100 functions as the substrate-binding domain OppA of an oligopeptide
permease (Opp) of M. hominis. The first ORF, encoding a putative protein with homologies
to OppB domains of other species, starts 15 bp downstream of P100 gene. One bp
downstream of the oppB gene, the second ORF encodes for OppC. The third ORF encodes
a protein with homologies to the ATP-binding domain OppD, and the oppF gene completes
the cluster with an overlap of 4 bp at the 3’ end of oppD. Figure 2.6 illustrates the physical
map of the opp operon in M. hominis (Henrich et al., 1999).
Figure 2.6 The M. hominis opp operon consisting of P100 and OppBCDF downstream of it. P100 is 961 amino acids; OppB is 381 amino acids; OppC is 424 amino acids; OppD is 388 amino acids and OppF is 842 amino acids respectively (Henrich et al., 1999).
F D C B P100
ORF1 MgPa ORF3
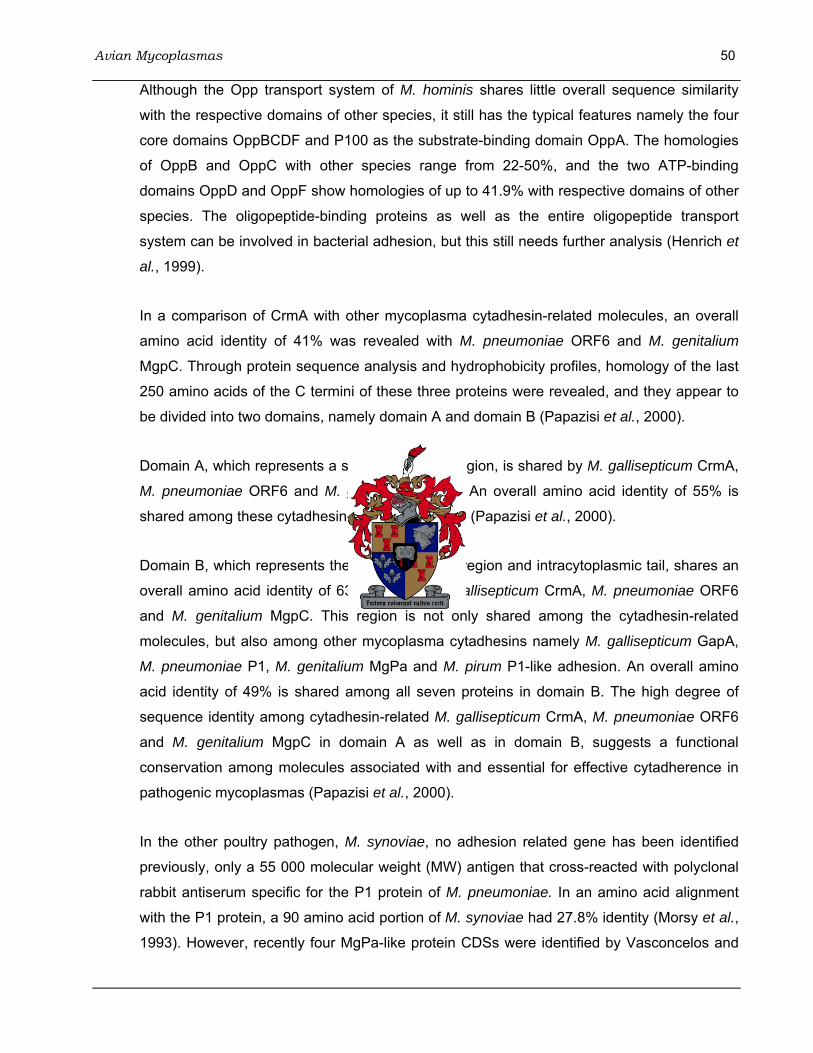
Avian Mycoplasmas 50
Although the Opp transport system of M. hominis shares little overall sequence similarity
with the respective domains of other species, it still has the typical features namely the four
core domains OppBCDF and P100 as the substrate-binding domain OppA. The homologies
of OppB and OppC with other species range from 22-50%, and the two ATP-binding
domains OppD and OppF show homologies of up to 41.9% with respective domains of other
species. The oligopeptide-binding proteins as well as the entire oligopeptide transport
system can be involved in bacterial adhesion, but this still needs further analysis (Henrich et
al., 1999).
In a comparison of CrmA with other mycoplasma cytadhesin-related molecules, an overall
amino acid identity of 41% was revealed with M. pneumoniae ORF6 and M. genitalium
MgpC. Through protein sequence analysis and hydrophobicity profiles, homology of the last
250 amino acids of the C termini of these three proteins were revealed, and they appear to
be divided into two domains, namely domain A and domain B (Papazisi et al., 2000).
Domain A, which represents a surface exposed region, is shared by M. gallisepticum CrmA,
M. pneumoniae ORF6 and M. genitalium MgpC. An overall amino acid identity of 55% is
shared among these cytadhesin-related molecules (Papazisi et al., 2000).
Domain B, which represents the transmembrane region and intracytoplasmic tail, shares an
overall amino acid identity of 63% between M. gallisepticum CrmA, M. pneumoniae ORF6
and M. genitalium MgpC. This region is not only shared among the cytadhesin-related
molecules, but also among other mycoplasma cytadhesins namely M. gallisepticum GapA,
M. pneumoniae P1, M. genitalium MgPa and M. pirum P1-like adhesion. An overall amino
acid identity of 49% is shared among all seven proteins in domain B. The high degree of
sequence identity among cytadhesin-related M. gallisepticum CrmA, M. pneumoniae ORF6
and M. genitalium MgpC in domain A as well as in domain B, suggests a functional
conservation among molecules associated with and essential for effective cytadherence in
pathogenic mycoplasmas (Papazisi et al., 2000).
In the other poultry pathogen, M. synoviae, no adhesion related gene has been identified
previously, only a 55 000 molecular weight (MW) antigen that cross-reacted with polyclonal
rabbit antiserum specific for the P1 protein of M. pneumoniae. In an amino acid alignment
with the P1 protein, a 90 amino acid portion of M. synoviae had 27.8% identity (Morsy et al.,
1993). However, recently four MgPa-like protein CDSs were identified by Vasconcelos and

Avian Mycoplasmas 51
co-workers (2005) in the genome of M. synoviae. CDSs that encode for most of the other tip
organelle components were not identified (Vasconcelos et al., 2005).
By using the comparisons made in the literature, it was possible to develop a strategy for the
isolation of genes from the three ostrich mycoplasmas encoding for proteins involved in
cytadherence. These approaches will be outlined in Chapter 3.
Genomic Investigations towards Vaccine Candidate Genes 52
3. Genomic Investigations towards Vaccine Candidate Genes against Ostrich Mycoplasmas
3.1 Introduction
Three ostrich mycoplasmas have been identified in the South African ostrich, namely Ms01,
Ms02 and Ms03 (Botes et al., 2005a). It has been established that these mycoplasmas are
pathogenic (Botes et al., 2005b) and cause significant economical losses in the ostrich
industry. For this reason, the development of suitable vaccines against ostrich mycoplasmas
has become a primary research objective for the ostrich industry. As ostrich mycoplasmas are
difficult to cultivate, and no attenuated strains are known, both live and killed vaccine
approaches cannot be considered at present. Instead, the development of DNA vaccines
based on membrane attachment protein genes, also referred to as cytadhesin genes, was
investigated.
Possible vaccine candidate genes include the genes and proteins involved in host cell
adhesion. These have been discussed in section 2.11.3 and will only be mentioned again. In
the poultry mycoplasma M. gallisepticum, GapA has been identified as cytadhesin protein and
CrmA, CrmB and CrmC as cytadhesin-related proteins (Papazisi et al., 2003). In the case of
M. pneumoniae P1 is a vaccine candidate gene (Razin and Jacobs, 1992), for M. pirum P1-
like (Papazisi et al., 2000), MgPa for M. genitalium (Razin and Jacobs, 1992; Razin 1999)
and in the case of M. hominis the membrane proteins P100 oppBCDF and P50 (Henrich et
al., 1993) could serve as target.
In the isolation of such genes, the order of genes in the mycoplasma genome is important in
an isolation strategy. If gene order was conserved, primers that bind to genes adjacent to
membrane attachment protein genes could be designed, and used for their amplification and
subsequent isolation. Contradictory opinions about the order of genes in the mycoplasma
genome exist. Rottem and Barile (1993) stated that the structure and organization of
important genes are highly conserved in the genomes of different mycoplasma species. In
contradiction with this, Rocha and Blanchard (2002) stated that the gene order is poorly
conserved.
Papazisi et al. (2000) in a study of the M. gallisepticum cytadhesin genes of the Rlow and Rhigh
strains, developed primers for the amplification of overlapping segments of the whole of the
Genomic Investigations towards Vaccine Candidate Genes 53
gapA gene. Potentially these primers could therefore be used for the amplification of the
gapA and related genes of other mycoplasmas.
The objective of this study was to isolate cytadhesin genes from ostrich mycoplasmas, with
the eventual goal of using these genes in DNA vaccines. In the development of a strategy for
the isolation of cytadhesin genes, it was important to determine whether or not the gene order
of mycoplasma genomes is conserved. For this reason, gene plots were performed on the
fully sequenced genomes of a number of mycoplasma species. Secondly, several primer
approaches with primers for adhesins based on those designed by Papazisi et al. (2000) and
Henrich et al. (1996), as well as primers that were developed from sequence alignments,
were used in polymerase chain reactions (PCRs) with ostrich mycoplasma DNA. These PCR
products were used for sequencing. Thirdly, some of the PCR products were cloned, and
subsequently sequenced. Finally, all the generated sequences were compared to genes, and
more specifically adhesin genes, of other mycoplasma species by alignment and by using the
Basic Local Alignment Search Tool (BLAST) with a view to identifying the cytadhesin genes
of ostrich mycoplasmas.
3.2 Materials and Methods
3.2.1 Gene order comparisons of mycoplasma genomes
In the development of a strategy to identify cytadhesin genes or cytadhesin-related genes in
the ostrich mycoplasmas Ms01, Ms02 and Ms03, it would be essential to know whether or
not the order of genes is conserved within the mycoplasma genome. If the gene order is
conserved, neighbouring genes can be targeted for primer binding regardless of their
relatedness to adhesion genes. If no conservation is observed, the search for a gene should
be limited to the adhesin operon.
In order to test this, a comparison of the gene order in different mycoplasmas was
undertaken using the Gene plot tool on the National Center for Biotechnology Information
(NCBI) website (www.ncbi.nlm.nih.gov/). This tool compares the order of genes of different
genomes with each other, and can also be used to compare the order of genes in the
genomes of different species with each other.
The genomes of M. gallisepticum R (poultry), M. hyopneumoniae 232 (pig) and M. pulmonis
UAB CTP (human) were compared with the Gene plot tool. Only fully annotated genomes
Genomic Investigations towards Vaccine Candidate Genes 54
such as the above three can be compared with the Gene plot tool. For this reason, none of
the other poultry mycoplasma genomes that have been sequenced could be compared to M.
gallisepticum. The genome of M. gallisepticum was compared to M. gallisepticum itself, and
to M. hyopneumoniae and M. pulmonis. M. hyopneumoniae and M. pulmonis were also
compared to each other since they are closely related (they fall in the same phylogenetic
clade, see Figure 2.1) and therefore their gene order could be expected to be very similar.
3.2.2 Primer development
Four primer approaches were followed in this study. The mycoplasma genome is very A+T
rich and therefore primers were developed with the least amount of A’s and T’s next to each
other to minimize random annealing. All of these approaches were aimed at the
amplification of genes or gene segments in adhesin gene operons. Several primer
combinations were used in the PCR reactions.
Primers for the first approach were developed by Papazisi et al. (2000) for the amplification
of M. gallisepticum GapA and CrmA. DAPSA was used for the alignment of mycoplasma
sequences with M. gallisepticum domain B in order to develop primers for the second primer
approach within the gapA domain B region as well as crmA. The primer developed in the
third primer approach was based on the alignment of M. synoviae against M. gallisepticum
GapA domain B. Two more primers, one in M. gallisepticum GapA and the other M.
gallisepticum GapA domain B, were developed in the fourth primer approach.
The melting temperature (Tm) of each primer was calculated with Primer Designer (V1.01).
All four primer approaches were used for the amplification of fragments from the genomes of
Ms01, Ms02 and Ms03.
3.2.2.1 Primer approach 1
Papazisi et al. (2000) used a set of primers for the amplification of the M. gallisepticum
GapA and CrmA genes. These primers were named A – E respectively and used in
different combinations with each other. The position of primers A to E relative to gapA and
crmA as well as their expected product sizes are illustrated in Figure 3.1. A summary of
these primers and their relative positions are given in Table 3.1.

Genomic Investigations towards Vaccine Candidate Genes 55
Figure 3.1 Primer approach 1: Primer pairs used for amplification of M. gallisepticum GapA and CrmA (Papazisi et al., 2000). Primers A – E (F = forward, R = reverse) as well as combinations are illustrated relative to the genes. The expected product sizes are indicated beneath the line. The two conserved areas referred to as domain A and B, are indicated by “A” and “B” respectively.
Table 3.1 Primers A – E used in primer approach 1. Base pair positions given are relative to the M. gallisepticum gapA and crmA genes.
Primer Sequence bp-position Tm (ºC)* AF 5' AGA CCA AAC TTC CCT AAC '3 1a 58 AR 5' TAG TGC TGC TGG AGG AGG '3 990a 67 BF 5' GCC GGA TTG ATT TGT ATG '3 644a 64 BR 5' TC CTA CTG CTT CTA CTT CTG '3 1086a 60 CF 5' TGA TAA TCC TAA TGC TGT '3 1407a 55 CR 5' GG AAA CAC AAA ACA AGT '3 2155a 54 DF 5' ATT AGT AAG CCA GCT GGT '3 2137a 60 DR 5' CA ATG TCT CAA AAC CGT AAG '3 3452b 64 EF 5' TAA CGT AAT CGG TCA AGG TGC '3 3042a 71 ER 5' CT AAG TGA TGA TTT TGC TGG '3 4072c 64
*Tm calculated with Primer Designer (V1.01)
F = Forward primer, R = Reverse primer aBased on gene sequence of M. gallisepticum gapA bBased on gene sequence of M. gallisepticum gapA (Domain B) cBased on gene sequence of M. gallisepticum crmA
In this primer approach these primers were used for the amplification of such fragments
from the genomes of Ms01, Ms02 and Ms03.
gapA gene crmA gene B B A
BF BR
± 462 bp
AF AR
± 1000 bp CF CR
± 725 bp
DF DR
± 1100 bp
EF ER
± 1000 bp
BF CR
± 1500 bp

Genomic Investigations towards Vaccine Candidate Genes 56 3.2.2.2 Primer approach 2
In the second primer approach, the computer program for DNA and Protein Sequence
Alignment (DAPSA) was used to align the sequences of M. gallisepticum GapA and
CrmA, M. pneumoniae P1 and ORF6, M. genitalium MgpB and MgpC, as well as M. pirum
P1-like (DNA sequences were retrieved from GenBank). The sequences were aligned
manually with the M. gallisepticum GapA (domain B) on nucleotide as well as amino acid
level. DAPSA was used to convert the DNA sequences to amino acid sequences. From
the nucleotide and amino acid alignments, conserved areas were revealed in the
cytadhesin and cytadhesin-related molecules. The conserved areas are highlighted in the
amino acid alignment which is illustrated in Figure 3.2. The nucleotide alignment is added
as Appendix A, and the conserved areas are also highlighted.
60 GapA ---------- ---------- --QEFTGFDA LPGYVLPVAI SIPIIIIALA LALGLGIGIP pneuP1 ---------- ---------- -------.NQ W.D....L.. TV..VV.V.S VT...A.... mgpB ---------- ---------G PQTV.QP.NQ WAD....LIV TV..VV.I.S VT...T.... pirumP1 ---------- -----KINVI NNSI.A..S. MADWI...V. A...VLV..I IG..CS.... crmA ---------- ---------- ----YNN.A. ..SW.V.T.. GSTLG.L.IM II...A.... orf6 ---------- ---------F PSRI.A..A. ..SW.I..SV GSSVG.LLIL .I........ mgpC ---------- ---------- -----A..A. ..AW.I..SV GSSVG.LFIL .V........
120 GapA MSQNRKMLKQ GFAISNKKVD ILTTAVGSVF KQIINRTSVT NIKKTPQMLQ ANKKDGASSP pneuP1 .HK.KQA..A ...L..Q... V..K...... .E.....GIS QAP.RLKQTS .A.PGAPRP. mgpB .HR.K.A.QA ..DL...... V..K...... .E.....GIS .AP.KLKQAT PT.PTPKTP. pirumP1 .AKHK.AI.V ..ELQHD..G T..S...G.. .K..DN.NSN .V.SK....K .AA.KPNTV. crmA LRAQ..LQDK ..KTTF.... T..A.....Y .K..TQ.ANV KK.PAALGAG KSGDKKPLLL orf6 .YKV..LQDS S.VDVF.... T........Y .K..TQ...I KKAPSALKAA N.AAPK.PVK mgpC .YRV..LQDA S.VNVF.... T........Y .K..TQ.G.- ---------- ----------
GapA SKPSAPAAKK PAGPTKPSAP GAKPTAPAKP KAPAPTKKIE pneuP1 VP.KPG.P.P .VQ.P.KP.- ---------- ---------- mgpB KP.VKQ---- ---------- ---------- ---------- pirumP1 PAR.QLTNDS VSR..P..S- ---------- ---------- crmA LNLLLQLNHL HQKLAHQLN- ---------- ---------- orf6 PAAPTAPRPP VQP.K.A--- ---------- ---------- mgpC ---------- ---------- ---------- ----------
Figure 3.2 Amino acid alignment of the domain B region of mycoplasma cytadhesin as well as cytadhesin-related molecules. The computer program DAPSA was used for manual multiple sequence alignment of the protein sequences of M. gallisepticum GapA and CrmA (GapA and crmA), M. pneumoniae P1 and ORF6 (pneuP1 and orf6), M. genitalium MgpB and MgpC (mgpB and mgpC) and M. pirum P1-like (pirumP1). Primers were developed within the conserved areas which are highlighted in the alignment.
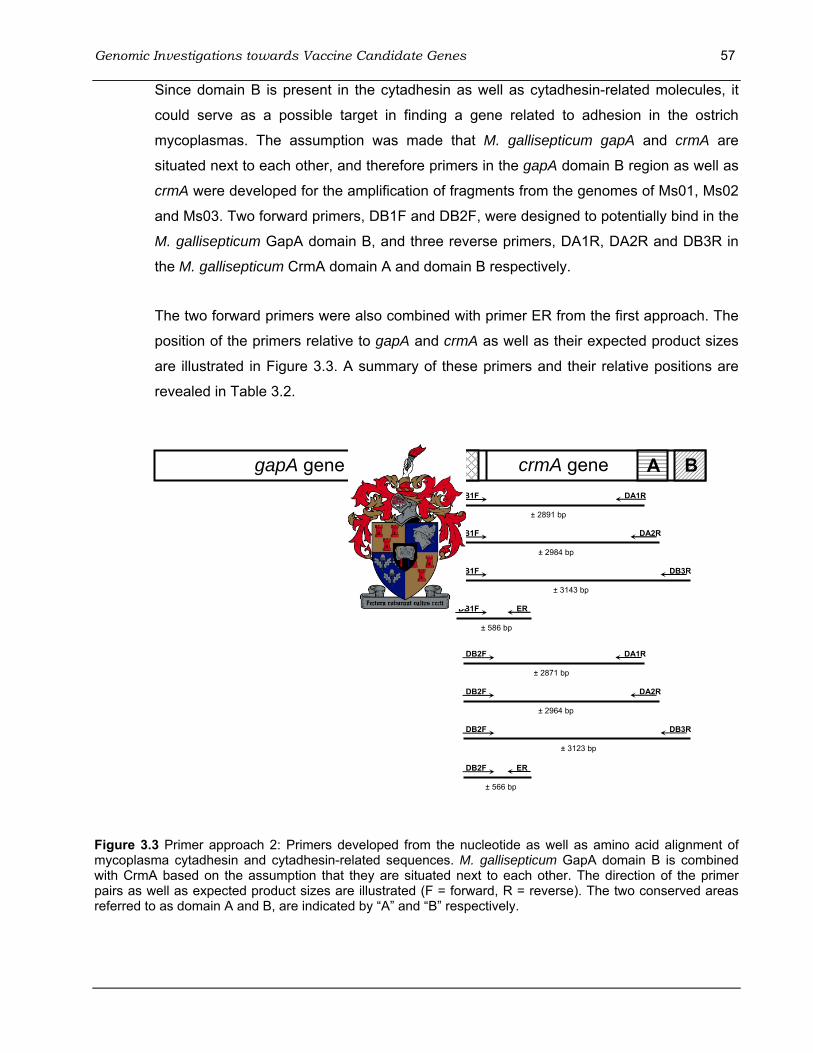
Genomic Investigations towards Vaccine Candidate Genes 57
Since domain B is present in the cytadhesin as well as cytadhesin-related molecules, it
could serve as a possible target in finding a gene related to adhesion in the ostrich
mycoplasmas. The assumption was made that M. gallisepticum gapA and crmA are
situated next to each other, and therefore primers in the gapA domain B region as well as
crmA were developed for the amplification of fragments from the genomes of Ms01, Ms02
and Ms03. Two forward primers, DB1F and DB2F, were designed to potentially bind in the
M. gallisepticum GapA domain B, and three reverse primers, DA1R, DA2R and DB3R in
the M. gallisepticum CrmA domain A and domain B respectively.
The two forward primers were also combined with primer ER from the first approach. The
position of the primers relative to gapA and crmA as well as their expected product sizes
are illustrated in Figure 3.3. A summary of these primers and their relative positions are
revealed in Table 3.2.
Figure 3.3 Primer approach 2: Primers developed from the nucleotide as well as amino acid alignment of mycoplasma cytadhesin and cytadhesin-related sequences. M. gallisepticum GapA domain B is combined with CrmA based on the assumption that they are situated next to each other. The direction of the primer pairs as well as expected product sizes are illustrated (F = forward, R = reverse). The two conserved areas referred to as domain A and B, are indicated by “A” and “B” respectively.
gapA gene crmA gene B B A
DB1F ER
± 586 bp
DB2F ER
± 566 bp
DB1F DA1R
± 2891 bp
DB1F DA2R
± 2984 bp
DB1F DB3R
± 3143 bp
DB2F DA1R
± 2871 bp
DB2F DA2R
± 2964 bp
DB2F DB3R
± 3123 bp

Genomic Investigations towards Vaccine Candidate Genes 58 Table 3.2 Sequence of the primers used in primer approach 2, as well as their base pair positions relative to the M. gallisepticum gapA and crmA genes.
Primer Sequence bp-position Tm (ºC)* DB1F 5' AA(A/G) GTT GAT (A/G)(T/C)(T/C/G/A) (C/T)TG AC(A/C/T) '3 3506b 51 DB2F 5' GC(C/G/A/T) GTT GGT AGT GT(G/C/T) '3 3536b 56 DA1R 5' ATT AGC (A/T)GG (A/G)GT GAA '3 6382d 47 DA2R 5' CAT CTA AGT A(T/C)T (C/G)GA TC '3 6472d 39 DB3R 5' TA(A/T) (A/T)GG (A/G)AT (A/T/C)CC (G/A)AT '3 6634e 48
*Tm calculated with Primer Designer (V1.01)
F = Forward primer, R = Reverse primer bBased on gene sequence of M. gallisepticum gapA (Domain B) dBased on gene sequence of M. gallisepticum crmA (Domain A) eBased on gene sequence of M. gallisepticum crmA (Domain B)
In this primer approach these primers were used for the amplification of such fragments
from the genomes of Ms01, Ms02 and Ms03.
3.2.2.3 Primer approach 3
This approach was an extension of primer approach 1. A reverse primer in the area
between EF and DR, but still in domain B (see Figure 3.1), was required in order to
potentially obtain a smaller and single product. Therefore, for the third primer approach,
M. synoviae sequences were used since it is related to Ms02 (from the phylogenetic
relationship, Figure 2.1) and the 55 000 MW antigen cross-reacted with antiserum for M.
pneumoniae P1 (see page 50). It was aligned manually against M. gallisepticum GapA
and M. gallisepticum GapA domain B using DAPSA. The nucleotide alignment of the
domain B region is illustrated in Figure 3.4.
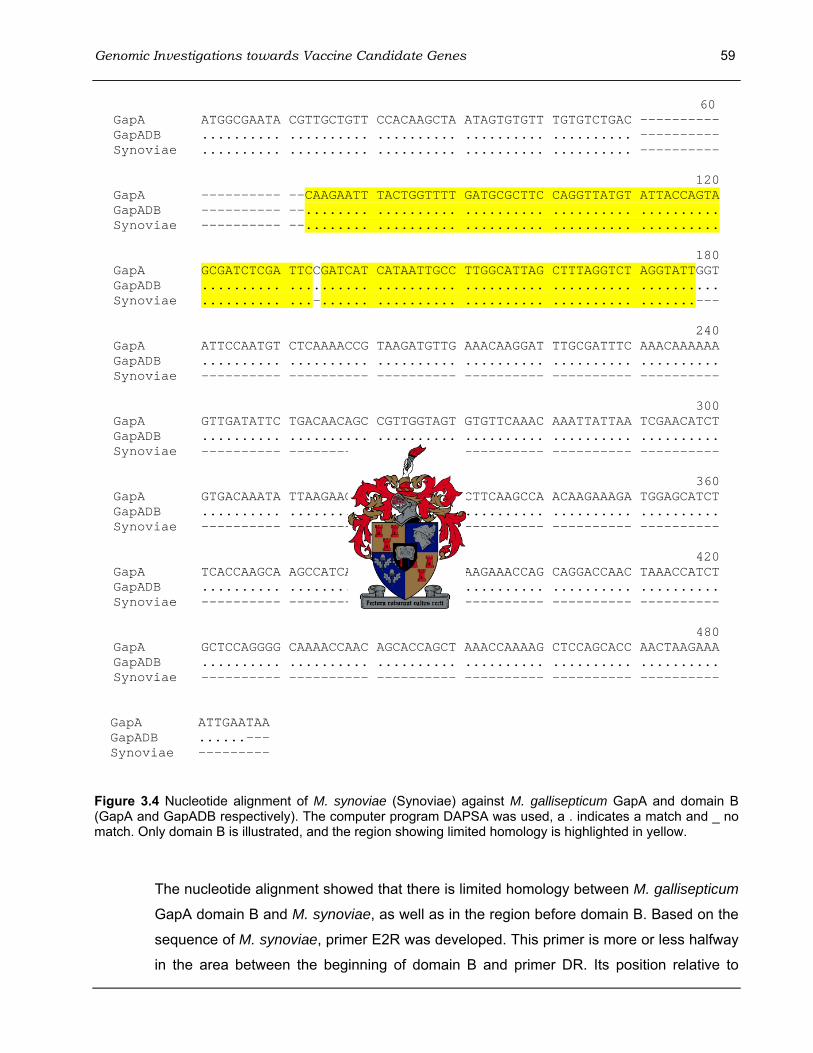
Genomic Investigations towards Vaccine Candidate Genes 59
60 GapA ATGGCGAATA CGTTGCTGTT CCACAAGCTA ATAGTGTGTT TGTGTCTGAC ---------- GapADB .......... .......... .......... .......... .......... ---------- Synoviae .......... .......... .......... .......... .......... ----------
120 GapA ---------- --CAAGAATT TACTGGTTTT GATGCGCTTC CAGGTTATGT ATTACCAGTA GapADB ---------- --........ .......... .......... .......... .......... Synoviae ---------- --........ .......... .......... .......... ..........
180 GapA GCGATCTCGA TTCCGATCAT CATAATTGCC TTGGCATTAG CTTTAGGTCT AGGTATTGGT GapADB .......... .......... .......... .......... .......... .......... Synoviae .......... ...-...... .......... .......... .......... .......---
240 GapA ATTCCAATGT CTCAAAACCG TAAGATGTTG AAACAAGGAT TTGCGATTTC AAACAAAAAA GapADB .......... .......... .......... .......... .......... .......... Synoviae ---------- ---------- ---------- ---------- ---------- ----------
300 GapA GTTGATATTC TGACAACAGC CGTTGGTAGT GTGTTCAAAC AAATTATTAA TCGAACATCT GapADB .......... .......... .......... .......... .......... .......... Synoviae ---------- ---------- ---------- ---------- ---------- ----------
360 GapA GTGACAAATA TTAAGAAGAC YCCACAAATG CTTCAAGCCA ACAAGAAAGA TGGAGCATCT GapADB .......... .......... .......... .......... .......... .......... Synoviae ---------- ---------- ---------- ---------- ---------- ----------
420 GapA TCACCAAGCA AGCCATCAGC TCCAGCTGCT AAGAAACCAG CAGGACCAAC TAAACCATCT GapADB .......... .......... .......... .......... .......... .......... Synoviae ---------- ---------- ---------- ---------- ---------- ----------
480 GapA GCTCCAGGGG CAAAACCAAC AGCACCAGCT AAACCAAAAG CTCCAGCACC AACTAAGAAA GapADB .......... .......... .......... .......... .......... .......... Synoviae ---------- ---------- ---------- ---------- ---------- ----------
GapA ATTGAATAA GapADB ......--- Synoviae ---------
Figure 3.4 Nucleotide alignment of M. synoviae (Synoviae) against M. gallisepticum GapA and domain B (GapA and GapADB respectively). The computer program DAPSA was used, a . indicates a match and _ no match. Only domain B is illustrated, and the region showing limited homology is highlighted in yellow.
The nucleotide alignment showed that there is limited homology between M. gallisepticum
GapA domain B and M. synoviae, as well as in the region before domain B. Based on the
sequence of M. synoviae, primer E2R was developed. This primer is more or less halfway
in the area between the beginning of domain B and primer DR. Its position relative to

Genomic Investigations towards Vaccine Candidate Genes 60
gapA and crmA as well as expected product size in combination with EF is illustrated in
Figure 3.5. The relative positions of these primers are shown in Table 3.3.
Figure 3.5 Primer approach 3: Primer E2R was developed for the area between EF and DR, but still in M. gallisepticum GapA domain B. This primer is based on the sequence of M. synoviae which shares homology with Ms02 as well as M. gallisepticum domain B. The expected product size in combination with EF is illustrated (F = forward, R = reverse). The two conserved areas referred to as domain A and B, are indicated by “A” and “B” respectively.
Table 3.3 Sequence of primer E2R developed for primer approach 3 and primer EF, as well as their base pair positions relative to the M. gallisepticum gapA and crmA genes.
Primer Sequence bp-position Tm (ºC)* EF 5' TAA CGT AAT CGG TCA AGG TGC '3 3042a 71 E2R 5' CGG AAT CGA GAT CGC TAC TG 3' 3383b 71
*Tm calculated with Primer Designer (V1.01)
F = Forward primer, R = Reverse primer aBased on gene sequence of M. gallisepticum gapA bBased on gene sequence of M. gallisepticum gapA (Domain B)
In this primer approach these primers were used for the amplification of such fragments
from the genomes of Ms01, Ms02 and Ms03.
3.2.2.4 Primer approach 4
Based on the sequence alignment of M. synoviae with M. gallisepticum GapA that was
done for primer approach three, two new primers were developed, namely E2F and E3R.
The forward primer, E2F, is situated in the M. gallisepticum GapA region before EF. The
reverse primer, E3R, is situated before E2R but still in domain B since it is a conserved
area. These primers were used in combination with EF and E2R, and their positions
relative to gapA and crmA as well as expected product size is illustrated in Figure 3.6. A
gapA gene crmA gene B B A
EF E2R
± 450 bp

Genomic Investigations towards Vaccine Candidate Genes 61
summary of the two primers developed for this approach, primers E2F and E3R, and their
relative positions is given in Table 3.4.
Figure 3.6 Primer approach 4: Primers E2F and E3R were developed from the alignment of M. synoviae with M. gallisepticum GapA. Domain B is still included in the primer area since it is a conserved area. These primers were also combined with primers EF and E2R (F = forward, R = reverse). The expected product sizes are also illustrated. The two conserved areas referred to as domain A and B, are indicated by “A” and “B” respectively.
Table 3.4 Sequence of primers developed for primer approach 4, as well as their base pair positions relative to the M. gallisepticum gapA and crmA genes.
Primer Sequence bp-position Tm (ºC)* E2F 5' GCG CTT ACT TAT CAT CAA CTG G '3 2660a 70 E3R 5' GTG GAA CAG CAA CGT ATT CG '3 3294a 69
*Tm calculated with Primer Designer (V1.01)
F = Forward primer, R = Reverse primer aBased on gene sequence of M. gallisepticum gapA
In this primer approach these primers were used for the amplification of such fragments
from the genomes of Ms01, Ms02 and Ms03.
3.2.3 Isolation of genomic DNA
For the isolation of genomic DNA from ostrich mycoplasma-containing solid agar, the N-
cetyl-N,N,N-trimethyl ammonium bromide (CTAB) method of Doyle and Doyle (1987),
originally developed for the extraction of genomic DNA from fresh plant tissue, was used. To
the mycoplasma-containing agar, 500 μl of 2 x CTAB buffer (100 mM Tris-HCl, pH 8.0; 1.4
M NaCl; 20 mM EDTA, pH 8.0; 2% v/v, CTAB; 0.2%, v/v, 2-mercaptoethanol) was added
gapA gene crmA gene B B A
E2F E3R
± 624 bp
E2F E2R
± 713 bp
EF E3R
± 239 bp

Genomic Investigations towards Vaccine Candidate Genes 62
and incubated at 60 ºC for 1 h. After incubation, 500 μl chloroform-isoamylalcohol (24:1, v/v)
was added and mixed gently for 10 min followed by centrifugation at 7 000 x g for 5 min. The
upper aqueous phase was removed and a 2/3 volume of cold isopropanol was added to this
and mixed gently. To allow the precipitation of nucleic acids, the sample was incubated
overnight at -20 ºC. The sample was subsequently centrifuged at 3 000 x g for 2 min. After
the supernatant was decanted, the pellet was resuspended in 1.5 ml wash buffer (40 mM
ammonium acetate:absolute ethanol, 1:3) and incubated at room temperature for 20 min.
The incubation was followed by centrifugation at 3 000 x g for 1 min, after which the
supernatant was once again decanted and the pellet air-dried to remove any ethanol. The
DNA pellet was finally redissolved overnight at 4 ºC in 250 μl TE-buffer (10 mM Tris-HCl, pH
8.0; 1 mM EDTA, pH 8.0).
Using this procedure, genomic DNA of Ms01, Ms02 and Ms03 was isolated. The identity of
these mycoplasmas was confirmed by 16S rRNA sequencing (Botes et al., 2005a). This also
ensured that contamination with any other mycoplasma DNA could be excluded. As this
DNA was subsequently used for PCR amplification of adhesin genes using primers based
on M. gallisepticum sequences, it would have been advantageous to have used M.
gallisepticum DNA as a positive control. However, M. gallisepticum does not infect ostriches,
for which reason it could not be obtained from our collaborators at the Klein Karoo Group.
The Western Cape Regional Veterinary Laboratory in Stellenbosch (Department of
Agriculture, Western Cape) was approached to obtain a M. gallisepticum culture from them.
Unfortunately, they could not supply this material, as there is very strong control over M.
gallisepticum infection in poultry as a result of which it is rarely isolated. Although this may
be a serious disadvantage in the primer approaches, the lack of a positive control was not
viewed to be essential for the initial investigations.
3.2.4 PCR amplification
For each primer combination, amplification reactions were carried out in 20 μl volumes.
Table 3.5 summarises the master mix for each primer pair as well as annealing temperature
and PCR program that was used. For each primer combination reaction, 2 μl 10 x Reaction
Buffer (RB, JMR-Holdings, USA) was used and the reaction volume increased to 20 μl with
deionized water. Each PCR amplification reaction contained 2 μl DNA sample from Ms01,
Ms02 or Ms03. In the case of primer pair E2F+E3R, the DNA sample was diluted 10 x with
sterilised MilliQ water. All the primers were synthesized by the DNA Synthesis Laboratory,
Department of Molecular and Cellular Biology, University of Cape Town. The

Genomic Investigations towards Vaccine Candidate Genes 63
deoxynucleotides (dATP, dGTP, dCTP and dTTP) were supplied by Advanced
Biotechnologies Ltd., UK, and the MgCl2 as well as Super-therm Taq polymerase by JMR-
Holdings, USA.
Table 3.5 Summary of master mix for individual primer combinations. PCR amplification reactions were carried out in 20 μl volumes. In addition to products in the table, each reaction contained 2 μl 10 x RB Buffer, 2 μl DNA sample and the reaction volume increased to 20 μl with deionized water.
Primer Annealing PCR dNTP Primer MgCl2 Taq
combination temp (ºC) program μM μl/20μl pmol/μl μl/20μl (mM) (U)
Primer approach 1 AF+AR 46+GRA 13 GapA1 250 4.0 20 0.4 2.5 1.5 BF+BR 45+GRA 14 GapA1 250 0.5 20 0.4 2.0 1.5 CF+CR 40+GRA 6 GapA1 250 4.0 20 0.4 2.5 1.5 DF+DR 45+GRA 15 GapA1 250 4.0 20 0.4 2.5 1.5 EF+ER 50+GRA 4 GapA1 250 4.0 20 0.4 2.5 1.5 BF+CR 40+GRA 8 GapA1 250 4.0 20 0.4 2.5 1.5
EF+DR 59+GRA 7 Domain 200 0.8 20 0.4 2.0 1.0
Primer approach 2 DB1F+DA1R 37.9 Domain 200 0.8 20 0.4 2.0 1.0 DB1F+DA2R 41.9 Domain 200 0.8 20 0.4 2.0 1.0 DB1F+DB3R 35.0 Domain 200 0.8 20 0.4 2.0 1.0 DB2F+DA1R 37.7 Domain 200 0.8 20 0.4 2.0 1.0 DB2F+DA2R 41.9 Domain 200 0.8 20 0.4 2.0 1.0 DB2F+DB3R 35.0 Domain 200 0.8 20 0.4 2.0 1.0 DB1F+ER 42.0 Domain 200 0.8 20 0.4 2.0 1.0
DB2F+ER 44.7 Domain 200 0.8 20 0.4 2.0 1.0
Primer approach 3
EF+E2R 30+GRA 10 GapA1 250 1.0 30 0.4 4.0 1.6
Primer approach 4 E2F+E3R 37.0 GapA2 200 0.8 20 0.4 4.0 1.0 E2F+E2R 34.0 GapA2 200 0.8 20 0.4 4.0 1.0
EF+E3R 36.0 GapA2 200 0.8 20 0.4 4.0 1.0
All the amplification reactions were performed in a P x 2 Thermal Cycler (Hybaid). In cases
where GRA is indicated in the annealing temperature column, a gradient was set. This
enabled the optimization of the amplification of DNA from Ms01, Ms02 and Ms03 in the
same cycle since their annealing temperatures differed only slightly. The three PCR
programs that were used, namely GapA1, Domain and GapA2, are summarised in Table
3.6.
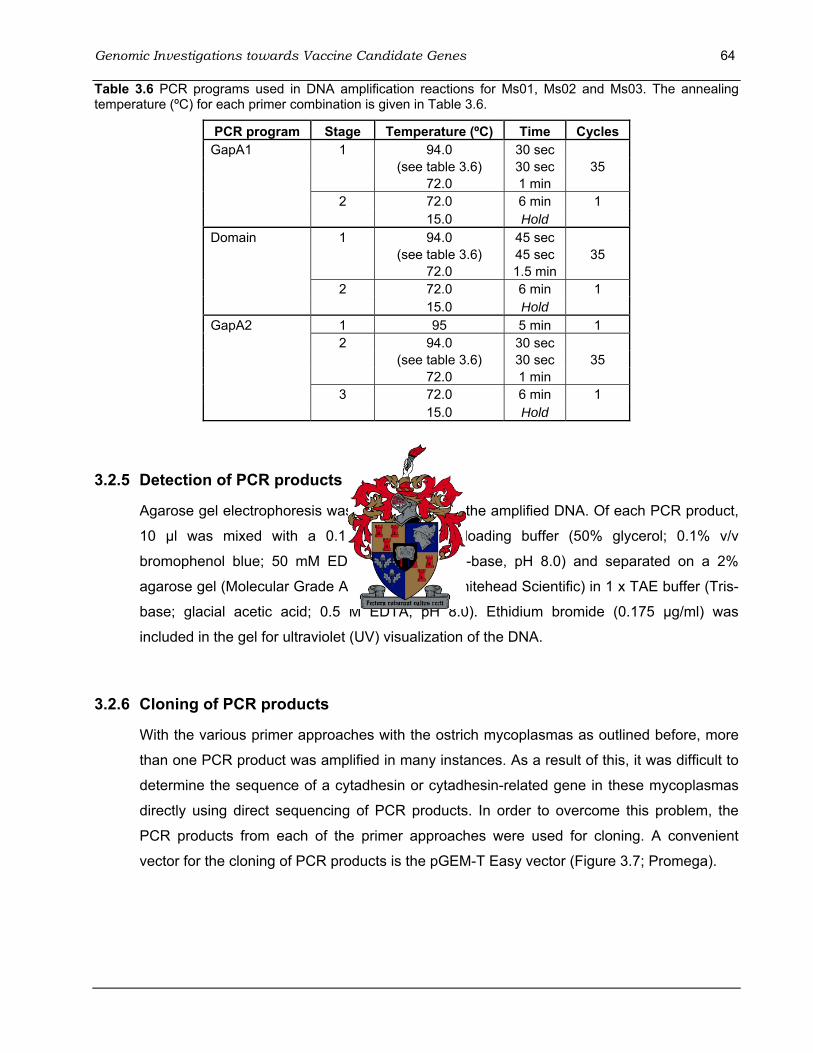
Genomic Investigations towards Vaccine Candidate Genes 64 Table 3.6 PCR programs used in DNA amplification reactions for Ms01, Ms02 and Ms03. The annealing temperature (ºC) for each primer combination is given in Table 3.6.
PCR program Stage Temperature (ºC) Time Cycles GapA1 1 94.0 30 sec (see table 3.6) 30 sec 35 72.0 1 min 2 72.0 6 min 1 15.0 Hold Domain 1 94.0 45 sec (see table 3.6) 45 sec 35 72.0 1.5 min 2 72.0 6 min 1 15.0 Hold GapA2 1 95 5 min 1 2 94.0 30 sec (see table 3.6) 30 sec 35 72.0 1 min 3 72.0 6 min 1 15.0 Hold
3.2.5 Detection of PCR products
Agarose gel electrophoresis was used to analyse the amplified DNA. Of each PCR product,
10 μl was mixed with a 0.1 volume of gel loading buffer (50% glycerol; 0.1% v/v
bromophenol blue; 50 mM EDTA; 100 mM Tris-base, pH 8.0) and separated on a 2%
agarose gel (Molecular Grade Agarose D1-LE, Whitehead Scientific) in 1 x TAE buffer (Tris-
base; glacial acetic acid; 0.5 M EDTA, pH 8.0). Ethidium bromide (0.175 μg/ml) was
included in the gel for ultraviolet (UV) visualization of the DNA.
3.2.6 Cloning of PCR products
With the various primer approaches with the ostrich mycoplasmas as outlined before, more
than one PCR product was amplified in many instances. As a result of this, it was difficult to
determine the sequence of a cytadhesin or cytadhesin-related gene in these mycoplasmas
directly using direct sequencing of PCR products. In order to overcome this problem, the
PCR products from each of the primer approaches were used for cloning. A convenient
vector for the cloning of PCR products is the pGEM-T Easy vector (Figure 3.7; Promega).

Genomic Investigations towards Vaccine Candidate Genes 65
Figure 3.7 The pGEM-T Easy Vector circle map used for cloning of PCR products. The transcription initiation site of T7 is at bp position 1 and that of SP6 at bp position 141. The T7 promoter (-17 to +3) is from bp position 2999-3 and the SP6 promoter (-17 to +3) from bp position 139-158 (www.promega.com/vectors/).
The high copy number pGEM-T Easy vector contains two RNA polymerase promoters, T7
and SP6, besides a multiple cloning region within the α-peptide coding region of the enzyme
β-galactosidase. Successful insertion of a PCR product inactivates the α-peptide coding
sequence and colonies containing the insert can be identified directly by colour screening on
indicator plates. Once the plasmid DNA has been isolated, the T7 and SP6 promoter
primers (Table 3.7) can be used for the sequencing of the cloned insert.
Table 3.7 T7 and SP6 promoter primers used for sequencing of cloned inserts. The bp-position is that of the pGEM-T Easy vector.
Primer Sequence bp-position T7 5' TAA TAC GAC TCA CTA TAG GG '3 2999-3 SP6 5' ATT TAG GTG ACA CTA TAG AA '3 139-158
Since there is only one insert per vector, the problem of multiple products as well as poor
sequencing was eliminated.
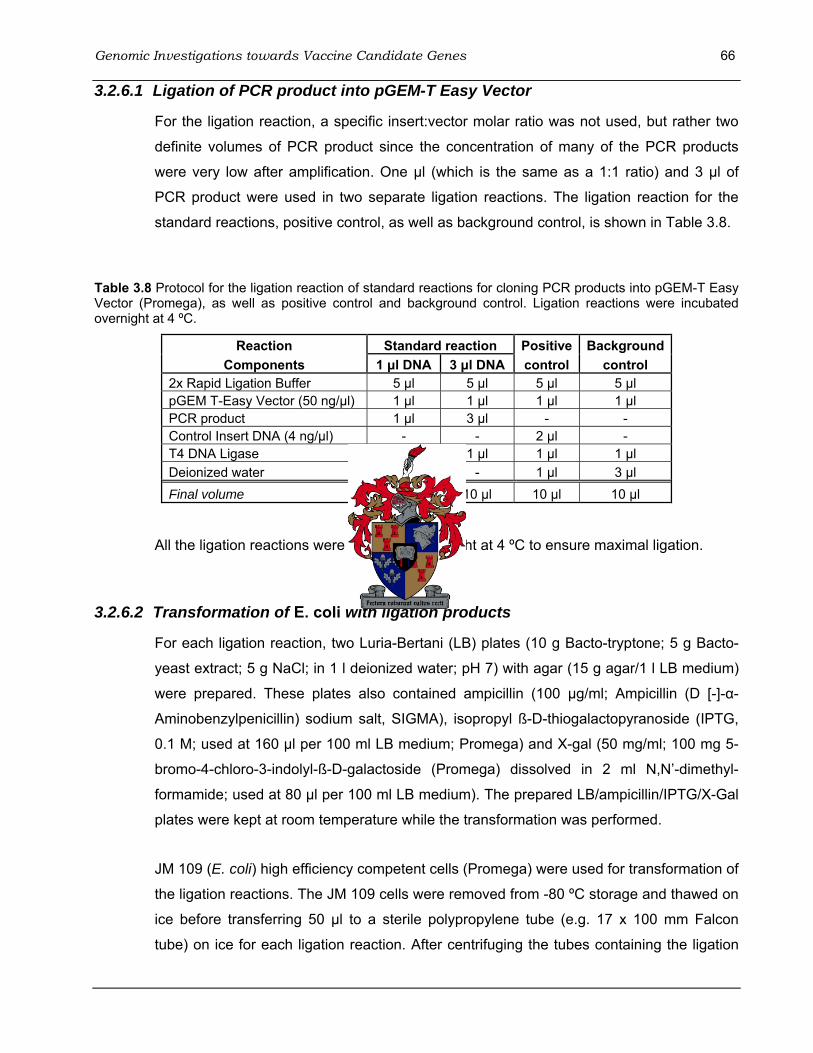
Genomic Investigations towards Vaccine Candidate Genes 66 3.2.6.1 Ligation of PCR product into pGEM-T Easy Vector
For the ligation reaction, a specific insert:vector molar ratio was not used, but rather two
definite volumes of PCR product since the concentration of many of the PCR products
were very low after amplification. One μl (which is the same as a 1:1 ratio) and 3 μl of
PCR product were used in two separate ligation reactions. The ligation reaction for the
standard reactions, positive control, as well as background control, is shown in Table 3.8.
Table 3.8 Protocol for the ligation reaction of standard reactions for cloning PCR products into pGEM-T Easy Vector (Promega), as well as positive control and background control. Ligation reactions were incubated overnight at 4 ºC.
Reaction Standard reaction Positive BackgroundComponents 1 μl DNA 3 μl DNA control control
2x Rapid Ligation Buffer 5 μl 5 μl 5 μl 5 μl pGEM T-Easy Vector (50 ng/μl) 1 μl 1 μl 1 μl 1 μl PCR product 1 μl 3 μl - - Control Insert DNA (4 ng/μl) - - 2 μl - T4 DNA Ligase 1 μl 1 μl 1 μl 1 μl Deionized water 2 μl - 1 μl 3 μl Final volume 10 μl 10 μl 10 μl 10 μl
All the ligation reactions were incubated overnight at 4 ºC to ensure maximal ligation.
3.2.6.2 Transformation of E. coli with ligation products
For each ligation reaction, two Luria-Bertani (LB) plates (10 g Bacto-tryptone; 5 g Bacto-
yeast extract; 5 g NaCl; in 1 l deionized water; pH 7) with agar (15 g agar/1 l LB medium)
were prepared. These plates also contained ampicillin (100 μg/ml; Ampicillin (D [-]-α-
Aminobenzylpenicillin) sodium salt, SIGMA), isopropyl ß-D-thiogalactopyranoside (IPTG,
0.1 M; used at 160 μl per 100 ml LB medium; Promega) and X-gal (50 mg/ml; 100 mg 5-
bromo-4-chloro-3-indolyl-ß-D-galactoside (Promega) dissolved in 2 ml N,N’-dimethyl-
formamide; used at 80 μl per 100 ml LB medium). The prepared LB/ampicillin/IPTG/X-Gal
plates were kept at room temperature while the transformation was performed.
JM 109 (E. coli) high efficiency competent cells (Promega) were used for transformation of
the ligation reactions. The JM 109 cells were removed from -80 ºC storage and thawed on
ice before transferring 50 μl to a sterile polypropylene tube (e.g. 17 x 100 mm Falcon
tube) on ice for each ligation reaction. After centrifuging the tubes containing the ligation

Genomic Investigations towards Vaccine Candidate Genes 67
reactions, 2 μl of each ligation reaction was added to a tube with JM 109 cells and mixed
by gently flicking the tube. Incubation on ice for 20 min was followed by heat-shocking the
cells for 45-50 sec in a water bath at 42 ºC, and immediately returning the tubes to ice for
another 2 min. LB medium (950 μl, room temperature) was added to the tubes containing
cells transformed with ligation reactions and incubated at 37 ºC for 1.5 h while shaking
(200 rpm). A volume of 50 μl and 150 μl of each transformation mixture with a standard
reaction was plated onto the LB/ampicillin/IPTG/X-gal plates respectively. In the case of
the positive control and background control transformations, 100 μl was plated out in
duplicate onto the plates. The plates were incubated overnight (16-24 hours) at 37 ºC,
followed by further incubation at 4 ºC to facilitate blue colour development. A successful
transformation was indicated by a white colony. Plates were stored at 4 ºC afterwards.
3.2.6.3 Diagnostic PCR
A relatively quick method of testing for a successful insertion the pGEM plasmid in a white
colony is a diagnostic PCR. This was done by using a toothpick scrape of the colony in a
PCR amplification reaction. A blue colony was used as a negative control. Amplification of
the possible insert using primer pair T7 and SP6 was carried out in 10 μl volumes. Each
reaction mixture consisted of 1 μl 10 x RB, 0.4 μl of 5 mM of each deoxynucleotide (dATP,
dTTP, dCTP and dGTP), 0.5 μl of each primer (20 pmol/μl), 0.6 μl MgCl2, 0.1 μl of Super-
therm Taq polymerase (0.02 units), 6.9 μl deionized water and a toothpick scrape of the
selected colony.
The amplification was performed in a P x 2 Thermal Cycler programmed to preheat for 5
min at 94 ºC. This was followed by 25 cycles of 94 ºC (30 sec), 55 ºC (30 sec) and 72 ºC
(30 sec), followed by a final extension reaction for 7 min at 72 ºC. Detection of the PCR
product and hence cloned insert was analyzed by loading 10 μl of the PCR reaction onto
a 2% agarose gel. Gel electrophoresis was performed as described in section 3.2.5.
3.2.6.4 Overnight culture of recombinant colonies
After visualization of the diagnostic PCR gel under UV light and confirmation of the cloning
of the PCR product, colonies were selected to be cultured overnight. The recombinant
colonies with an insert, as well as a blue colony as negative control, were inoculated into a
17 x 100 mm Falcon tube containing 5 ml LB medium and 5 μl ampicillin (100 μg/ml). This
was incubated overnight (± 16 h) at 37 ºC while shaking at 200 rpm.
Genomic Investigations towards Vaccine Candidate Genes 68 3.2.6.5 Isolation of recombinant plasmid DNA
For isolation of the recombinant plasmid DNA from the overnight culture, the Plasmix
minipreps Protocol B (Talent), which is a plasmid DNA purification system from 1-3 ml of
bacterial culture, was used according to the manufacturer’s instructions. The isolated
plasmid DNA samples were each concentrated to 15-20 μl by centrifugal evaporation on a
Savant Speedvac. Only 1 μl of the plasmid DNA was loaded onto a 2% agarose gel and
analyzed by gel electrophoresis (as described in section 3.2.5) in order to ensure that
plasmid DNA was isolated successfully.
3.2.6.6 Insert check PCR
In order to verify the size of the insert DNA, a PCR amplification reaction was done with
the isolated plasmid DNA. This was necessary since the PCR product that was used for
cloning, sometimes had multiple bands as a product. A 10 μl volume PCR amplification
reaction was carried out using primer pair T7 and SP6. Each reaction mixture consisted of
1 μl 10 x RB, 0.4 μl of 5 mM of each deoxynucleotide (dATP, dTTP, dCTP and dGTP), 0.5
μl of each primer (20 pmol/μl), 0.6 μl MgCl2, 0.1 μl of Super-therm Taq polymerase (0.02
units), 5.9 μl deionized water and 1 μl of a 1000 x diluted isolated plasmid DNA.
Amplification was performed in a P x 2 Thermal Cycler programmed to preheat for 5 min
at 94 ºC. This was followed by 25 cycles of 94 ºC (30 sec), 55 ºC (30 sec) and 72 ºC (30
sec), followed by a final extension reaction for 7 min at 72 ºC. Detection of the isolated
plasmid DNA was analyzed by loading 10 μl of the PCR reaction onto a 2% agarose gel.
Gel electrophoresis was performed as described in section 3.2.5, but the gel was stained
afterwards with ethidium bromide for 20 min in order to visualize them under the UV light
since the bands were sometimes very faint.
3.2.7 Sequencing
3.2.7.1 Sequencing of PCR products
For sequencing of PCR products, the PCR products were electrophoresed on a 2%
agarose gel for 2 h at 150 V in 1 x TAE buffer containing ethidium bromide as described
previously. DNA containing bands in the expected product size area were excised under a
UV light. The Wizard SV Gel and PCR Clean-Up System (Promega) was used according
to the manufacturer’s instructions to purify the DNA from the excised band.
Genomic Investigations towards Vaccine Candidate Genes 69
Sequencing reactions were carried out in 10 μl reaction volumes using the ABI PRISM®
BigDyeTM Terminator v3.1 Cycle Sequencing Ready Reaction Kit (Applied Biosystems).
The sequencing reactions were done for each sample, one with the forward primer and
the other with the reverse primer. Each sequencing reaction mixture contained 5 μl 5 x
Sequencing buffer, 2 μl Terminator mix, 1 μl primer (0.8 pmol/μl), 0.5 μl, 1 μl or 1.5 μl DNA
depending on the intensity of the band on the gel, and filled up to 10 μl with deionized
water.
Amplifications were performed in a P x 2 Thermal Cycler programmed to perform 35
cycles of 96 ºC (10 sec), 52 ºC (30 sec) and 60 ºC (4 min), followed by a final extension
reaction for 10 min at 60 ºC. Analysis of the sequencing PCR reaction products were
performed on an ABI PRISM® 373 DNA Sequencer at the DNA sequencing facility of the
University of Stellenbosch.
3.2.7.2 Sequencing of isolated plasmid DNA
Isolated plasmid DNA, which was the final product of the cloning procedure, was also
used for sequencing. A 10 μl sequencing reaction contained 4 μl Terminator mix, 3 μl of
primer T7 (3.3 pmol/μl) and 3 μl isolated plasmid DNA.
Amplifications were performed in a P x 2 Thermal Cycler programmed to perform 35
cycles of 96 ºC (10 sec), 52 ºC (30 sec) and 60 ºC (4 min), followed by a final extension
reaction for 10 min at 60 ºC. Analysis of the isolated plasmid DNA sequencing products
were performed on an ABI PRISM® 373 DNA Sequencer at the DNA sequencing facility of
the University of Stellenbosch.
3.2.8 Analysis of sequences
Sequences of the PCR products as well as isolated plasmid DNA, were compared to each
other using the DNA and Protein Sequence Alignment (DAPSA) program (Harley, 1998). In
the case of sequences of the isolated plasmid DNA, the vector sequences were trimmed off
the ends. The automatic alignment function was used, but manual alignment of sequences
was used to refine the alignments. Sequences were also aligned manually with the following
sequences: M. gallisepticum GapA, domain A and domain B of M. gallisepticum CrmA,
domain B of M. gallisepticum GapA, M. pneumoniae P1 as well as M. synoviae.
Genomic Investigations towards Vaccine Candidate Genes 70 3.2.9 Comparison of mycoplasma sequences using BLAST
The BLAST search engine, which is available on-line on the NCBI website
(http://www.ncbi.nlm.nih.gov/blast), was used for sequence similarity searches. Several
BLAST search programs, each with a different search strategy, are available. For this study,
BLASTN, which compares a nucleotide query sequence against a nucleotide sequence
database, as well as TBLASTX, which compares a translated nucleotide query sequence
against a translated nucleotide sequence database, was used. These searches were done
in order to see whether any of the generated sequences of Ms01, Ms02 or Ms03 showed
similarity to other mycoplasma species, especially with cytadhesin or cytadhesin-related
genes of avian mycoplasmas.
One of the most important parameters in a BLAST search is the Expect (E)-value. This
indicates the statistical significance of an alignment between the query sequence and a
sequence in a database. The default E-threshold setting is 10, which means that for a
particular query, all possible alignments for which 10 or less hits of similar bit score are
expected to occur by chance in a database of similar size will be returned in the search. A
bit score reflects the length of the alignment between a query sequence and a sequence in a
database.
The E-value of a particular match is dependent on the bit score and the size of the
database. The lower the E-value, the more likely it is that the alignment did not occur
randomly, but reflects true sequence similarity. In most cases, results with E-values higher
than 0.1 as well as bit scores lower than 50, are not regarded to reflect statistically
significant sequence similarity.
The BLASTN 2.2.12 program was used with the nr database (all non-redundant
GenBank+EMBl+DDBJ+PDB nucleotide sequences, excluding EST, STS, GSS or HTGS
sequences), comparisons were made with all organisms and the default Expect (E) value
threshold was 10 for all searches. Default search settings were used throughout.
A TBLASTX 2.2.12 search was also done with all the sequences of Ms01, Ms02 and Ms03.
The nr database and genetic code 4, which include the Mycoplasma/Spiroplasma code, was
used to translate the query. The Expect (E) value was changed to 1 and Blosum62 was
selected as matrix option since it is the best for detecting weak protein similarities.

Genomic Investigations towards Vaccine Candidate Genes 71
For the BLASTN as well as TBLASTX results, comparisons with an E value higher than 0.1
and a bit score lower than 50 were not regarded as statistically significant.
3.3 Results
The results that were obtained during the study in order to find a vaccine candidate gene(s)
related to cytadhesion in the three ostrich mycoplasmas will be discussed next.
3.3.1 Gene order comparisons of mycoplasma genomes
From the results from Gene plot it is clear that a straight line will be produced if the gene
order is homologous in the genomes compared, as illustrated in Figure 3.8 A where M.
gallisepticum was compared and plotted against itself. The operon which includes the
cytadhesin genes GapA, CrmA, CrmB and CrmC is situated in the area where the two grey
lines cross. In the case where the genome of M. gallisepticum was compared to the
genomes of M. hyopneumoniae and M. pulmonis (Figure 3.8 B and C respectively), the dots
were placed largely at random. This indicates that there was no homology in the
arrangement of genes between these genomes. However, the order of the GapA, CrmA,
CrmB, CrmC operon remained the same, but the order of adjacent genes differed. The
genes that are positioned in the area where the two grey lines cross represent the GapA
operon, but the rest of the genome does not have the same gene order.

Genomic Investigations towards Vaccine Candidate Genes 72
A B
C D
Figure 3.8 Comparison of mycoplasma genomes using the Gene plot tool on the NCBI website. A: M. gallisepticum R versus M. gallisepticum R; B: M. gallisepticum R versus M. hyopneumoniae 232; C: M. gallisepticum R versus M. pulmonis UAB CTP; D: M. hyopneumoniae 232 versus M. pulmonis UAB CTP.
In the comparison of the genomes of M. hyopneumoniae and M. pulmonis (Figure 3.8 D)
only random dots were largely observed. This indicates that although they are placed in the
same clade, their genome order was not conserved. This analysis therefore supports the
conclusion of Rocha and Blanchard (2002) that the gene order is poorly conserved in
mycoplasma genomes. Thus, even though the operon encoding for proteins related to
cytadhesin was conserved, its position in the mycoplasma genome was not conserved.
Based on these results, it was assumed that the three ostrich mycoplasmas would also not
show a conserved gene order. Therefore adjacent genes should not be used as targets, but
rather genes “within” the operon, for example a cytadhesin gene such as GapA and a
cytadhesin-related gene such as CrmA of M. gallisepticum.
3.3.2 PCR amplification
The gene approaches that were followed included several primer combinations. For each
primer approach that was followed, the sequence of the primer, annealing temperature
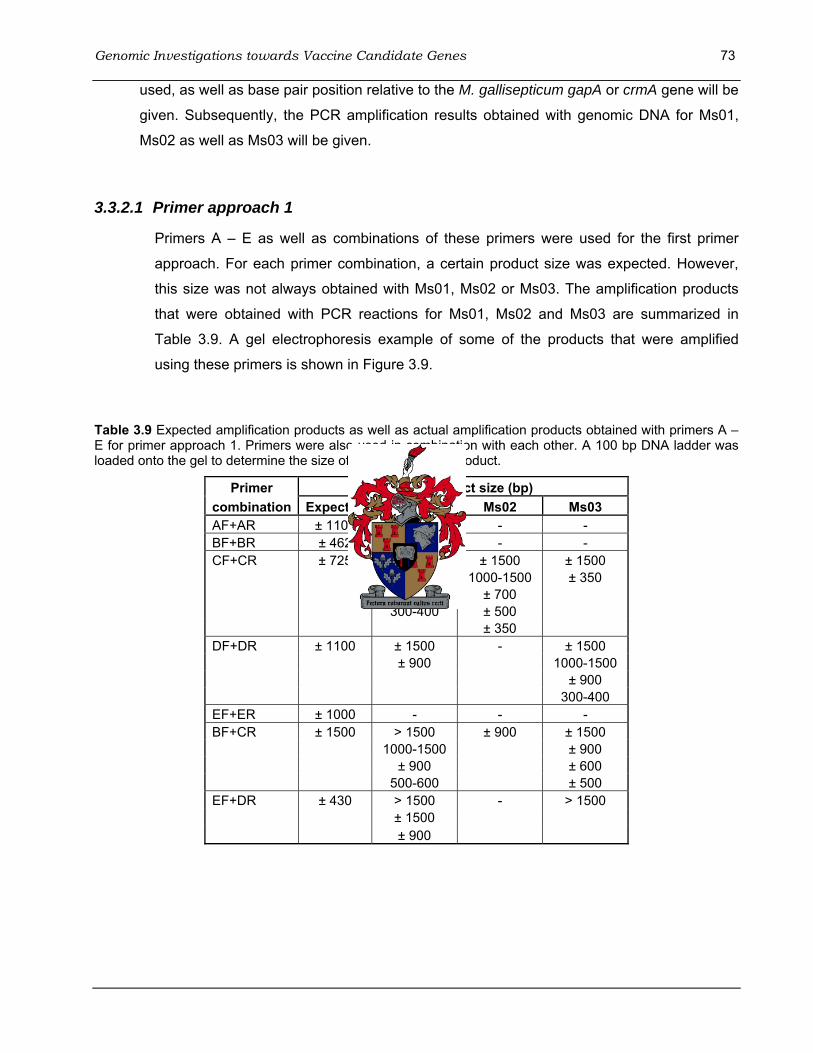
Genomic Investigations towards Vaccine Candidate Genes 73
used, as well as base pair position relative to the M. gallisepticum gapA or crmA gene will be
given. Subsequently, the PCR amplification results obtained with genomic DNA for Ms01,
Ms02 as well as Ms03 will be given.
3.3.2.1 Primer approach 1
Primers A – E as well as combinations of these primers were used for the first primer
approach. For each primer combination, a certain product size was expected. However,
this size was not always obtained with Ms01, Ms02 or Ms03. The amplification products
that were obtained with PCR reactions for Ms01, Ms02 and Ms03 are summarized in
Table 3.9. A gel electrophoresis example of some of the products that were amplified
using these primers is shown in Figure 3.9.
Table 3.9 Expected amplification products as well as actual amplification products obtained with primers A – E for primer approach 1. Primers were also used in combination with each other. A 100 bp DNA ladder was loaded onto the gel to determine the size of the amplification product.
Primer PCR Product size (bp) combination Expected Ms01 Ms02 Ms03 AF+AR ± 1100 - - - BF+BR ± 462 - - - CF+CR ± 725 > 1500 ± 1500 ± 1500 ± 1500 1000-1500 ± 350 ± 700 ± 700 300-400 ± 500 ± 350 DF+DR ± 1100 ± 1500 - ± 1500 ± 900 1000-1500 ± 900 300-400 EF+ER ± 1000 - - - BF+CR ± 1500 > 1500 ± 900 ± 1500 1000-1500 ± 900 ± 900 ± 600 500-600 ± 500 EF+DR ± 430 > 1500 - > 1500 ± 1500 ± 900
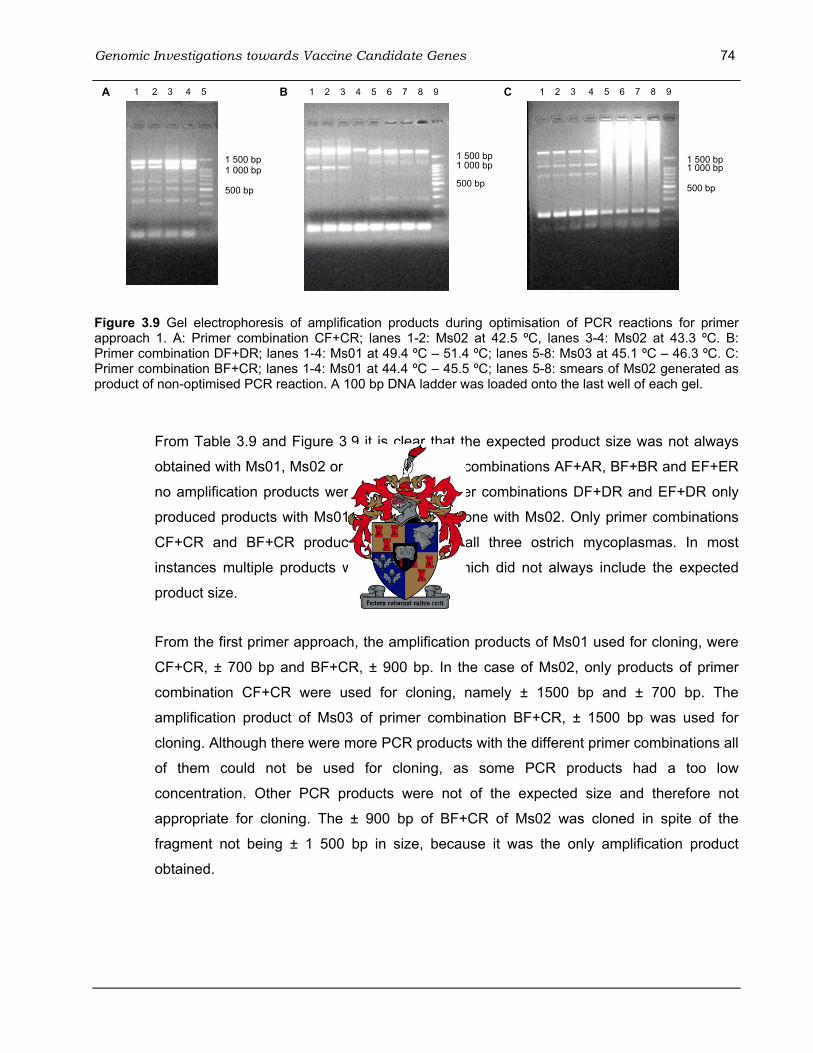
Genomic Investigations towards Vaccine Candidate Genes 74
Figure 3.9 Gel electrophoresis of amplification products during optimisation of PCR reactions for primer approach 1. A: Primer combination CF+CR; lanes 1-2: Ms02 at 42.5 ºC, lanes 3-4: Ms02 at 43.3 ºC. B: Primer combination DF+DR; lanes 1-4: Ms01 at 49.4 ºC – 51.4 ºC; lanes 5-8: Ms03 at 45.1 ºC – 46.3 ºC. C: Primer combination BF+CR; lanes 1-4: Ms01 at 44.4 ºC – 45.5 ºC; lanes 5-8: smears of Ms02 generated as product of non-optimised PCR reaction. A 100 bp DNA ladder was loaded onto the last well of each gel.
From Table 3.9 and Figure 3.9 it is clear that the expected product size was not always
obtained with Ms01, Ms02 or Ms03. For primer combinations AF+AR, BF+BR and EF+ER
no amplification products were produced. Primer combinations DF+DR and EF+DR only
produced products with Ms01 and Ms03, but none with Ms02. Only primer combinations
CF+CR and BF+CR produced products for all three ostrich mycoplasmas. In most
instances multiple products were produced, which did not always include the expected
product size.
From the first primer approach, the amplification products of Ms01 used for cloning, were
CF+CR, ± 700 bp and BF+CR, ± 900 bp. In the case of Ms02, only products of primer
combination CF+CR were used for cloning, namely ± 1500 bp and ± 700 bp. The
amplification product of Ms03 of primer combination BF+CR, ± 1500 bp was used for
cloning. Although there were more PCR products with the different primer combinations all
of them could not be used for cloning, as some PCR products had a too low
concentration. Other PCR products were not of the expected size and therefore not
appropriate for cloning. The ± 900 bp of BF+CR of Ms02 was cloned in spite of the
fragment not being ± 1 500 bp in size, because it was the only amplification product
obtained.
1 500 bp 1 000 bp
500 bp
A 1 2 3 4 5
1 500 bp 1 000 bp
500 bp
B 1 2 3 4 5 6 7 8 9
1 500 bp 1 000 bp
500 bp
C 1 2 3 4 5 6 7 8 9
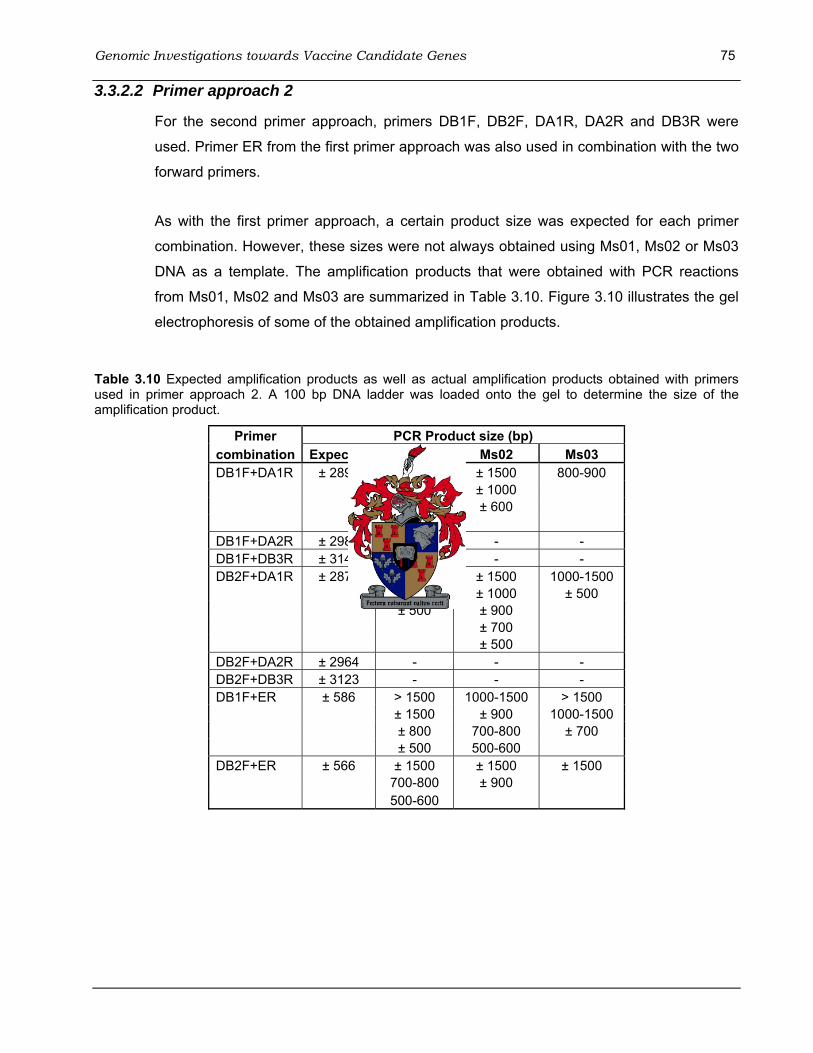
Genomic Investigations towards Vaccine Candidate Genes 75 3.3.2.2 Primer approach 2
For the second primer approach, primers DB1F, DB2F, DA1R, DA2R and DB3R were
used. Primer ER from the first primer approach was also used in combination with the two
forward primers.
As with the first primer approach, a certain product size was expected for each primer
combination. However, these sizes were not always obtained using Ms01, Ms02 or Ms03
DNA as a template. The amplification products that were obtained with PCR reactions
from Ms01, Ms02 and Ms03 are summarized in Table 3.10. Figure 3.10 illustrates the gel
electrophoresis of some of the obtained amplification products.
Table 3.10 Expected amplification products as well as actual amplification products obtained with primers used in primer approach 2. A 100 bp DNA ladder was loaded onto the gel to determine the size of the amplification product.
Primer PCR Product size (bp) combination Expected Ms01 Ms02 Ms03 DB1F+DA1R ± 2891 ± 1500 ± 1500 800-900 ± 1000 ± 1000 ± 600 ± 600 300-400 DB1F+DA2R ± 2984 - - - DB1F+DB3R ± 3143 ± 1000 - - DB2F+DA1R ± 2871 ± 1500 ± 1500 1000-1500 900-1000 ± 1000 ± 500 ± 500 ± 900 ± 700 ± 500 DB2F+DA2R ± 2964 - - - DB2F+DB3R ± 3123 - - - DB1F+ER ± 586 > 1500 1000-1500 > 1500 ± 1500 ± 900 1000-1500 ± 800 700-800 ± 700 ± 500 500-600 DB2F+ER ± 566 ± 1500 ± 1500 ± 1500 700-800 ± 900 500-600

Genomic Investigations towards Vaccine Candidate Genes 76
Figure 3.10 Gel electrophoresis of amplification products during optimisation of PCR reactions for primer approach 2. A: a temperature gradient of 37.3 ºC – 44.2 ºC was used in both primer combinations; lanes 1-12: primer combination DB1F+DA1R; lanes 1-4: Ms01; lanes 5-8: Ms02; lanes 9-12: Ms03; lanes 13-19: primer combination DB2F+DA1R; lanes 13-16: Ms01; lanes 17-19: Ms02. B: lanes 1-3: primer combination DB1F+ER at 40.9 ºC; lane 1: Ms01; lane 2: Ms02; lane 3: Ms03; lanes 4-6: primer combination DB2F+ER at 44.7 ºC; lane 4: Ms01; lane 5: Ms02; lane 6: Ms03. A 100 bp DNA ladder was loaded onto both gels.
The expected product sizes from the primer combinations used for primer approach 2
were quite large in four cases (Table 3.10). From Table 3.10 and Figure 3.10 it can be
seen that the results obtained with Ms01, Ms02 and Ms03 were unsatisfactory when
compared to the expected results. A possible explanation for this is that primer
combinations which work in one mycoplasma genome would not necessarily work as well
in another mycoplasma genome. Another possible reason is that the degeneracy of the
primers lead to mispriming especially since mycoplasmas are very A+T rich. The third
reason may be that the product sizes were underestimated because a ladder with a
maximum product size of 1 500 bp was used. For primer approach 2, primer combinations
DB1F+DA1R and DB2F+DA1R amplified products with all three ostrich mycoplasmas, but
none were of the expected size. Primer combination DB1F+DB3R only amplified a
product with Ms01, and primer combinations DB2F+DA2R and DB2F+DB3R amplified no
products with the ostrich mycoplasmas.
When the two forward primers were used separately in combination with primer ER from
the first primer approach, the expected product sizes were much smaller and PCR
products were amplified from all three ostrich mycoplasmas. Amplification products of
Ms01, Ms02 as well as Ms03 were used for cloning and these include the following for
Ms01: for primer combination DB1F+ER products of ± 1 500 bp, ± 800 bp and ± 500 bp
were used, and for primer combination DB2F+ER a 500-600 bp product was used. In
1 500 bp 1 000 bp
500 bp
A 1 2 3 4 5 6 7 8 9 10 11 12 13 14 15 16 17 18 19 20
1 500 bp 1 000 bp
500 bp
B 1 2 3 4 5 6 7

Genomic Investigations towards Vaccine Candidate Genes 77
spite of the fragments for DB1F+ER not being the expected ± 586 bp in size, these were
the only amplification products obtained. Cloning of products of Ms02 included the
following: for primer combination DB2F+DA1R ± 500 bp and for primer combination
DB1F+ER products of 1 000-1 500 bp and ± 900 bp were used. In the case of Ms03,
products 1 000-1 500 bp and ± 500 bp from primer combination DB2F+DA1R, as well as
products of 1 000-1 500 bp from primer combination DB1F+ER were used for cloning.
3.3.2.3 Primer approach 3
In the third primer approach, primer E2R was developed and used in combination with
primer EF in order to potentially obtain a smaller and single product. A single PCR product
of ± 450 bp was expected for this primer combination. The products that were amplified
with Ms01, Ms02 and Ms03 are summarized in Table 3.11. Gel electrophoresis of the
amplified DNA of Ms01 and Ms03 is illustrated in Figure 3.11.
Table 3.11 Amplification products expected as well as products obtained from primer combination for primer approach 3. A 100 bp DNA ladder was loaded onto the gel to determine the size of the amplification product.
Primer PCR Product size (bp) combination Expected Ms01 Ms02 Ms03 EF+E2R ± 450 > 1500 - 1000-1500 1000-1500 ± 900 ± 800 800-900 650-700 700-800 550-600 600-700 400-500 ± 500
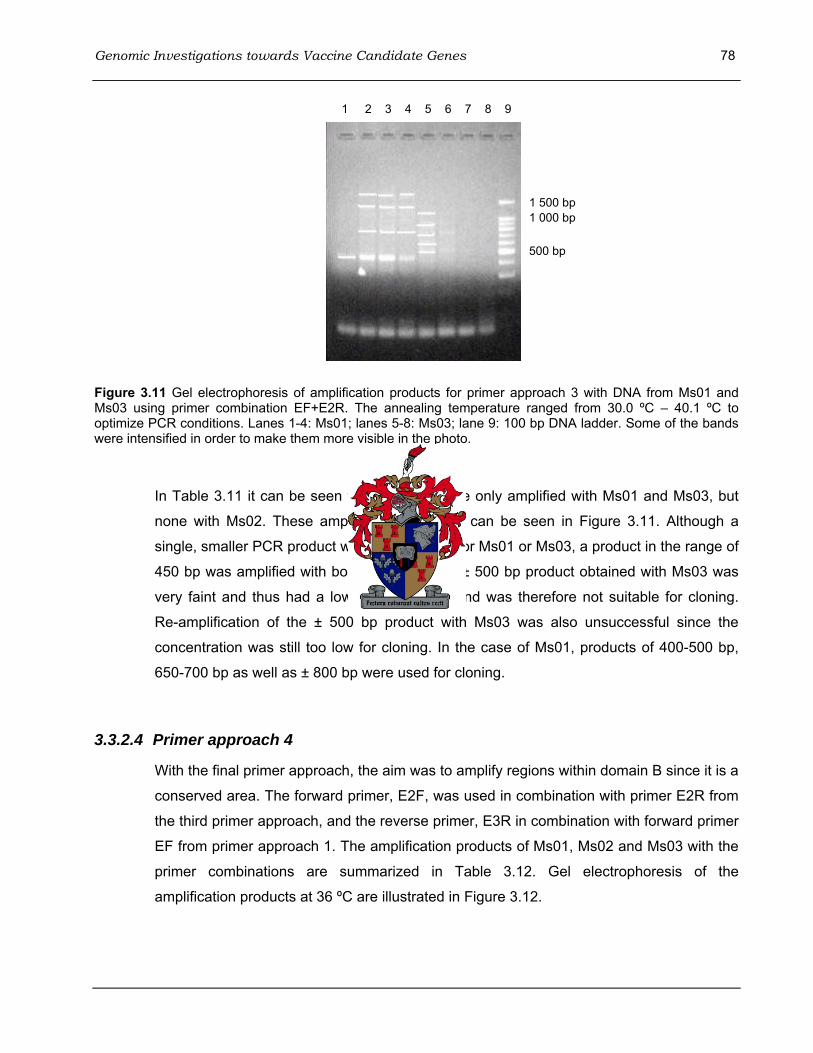
Genomic Investigations towards Vaccine Candidate Genes 78
Figure 3.11 Gel electrophoresis of amplification products for primer approach 3 with DNA from Ms01 and Ms03 using primer combination EF+E2R. The annealing temperature ranged from 30.0 ºC – 40.1 ºC to optimize PCR conditions. Lanes 1-4: Ms01; lanes 5-8: Ms03; lane 9: 100 bp DNA ladder. Some of the bands were intensified in order to make them more visible in the photo.
In Table 3.11 it can be seen that products were only amplified with Ms01 and Ms03, but
none with Ms02. These amplification products can be seen in Figure 3.11. Although a
single, smaller PCR product was not amplified for Ms01 or Ms03, a product in the range of
450 bp was amplified with both. However, the ± 500 bp product obtained with Ms03 was
very faint and thus had a low concentration, and was therefore not suitable for cloning.
Re-amplification of the ± 500 bp product with Ms03 was also unsuccessful since the
concentration was still too low for cloning. In the case of Ms01, products of 400-500 bp,
650-700 bp as well as ± 800 bp were used for cloning.
3.3.2.4 Primer approach 4
With the final primer approach, the aim was to amplify regions within domain B since it is a
conserved area. The forward primer, E2F, was used in combination with primer E2R from
the third primer approach, and the reverse primer, E3R in combination with forward primer
EF from primer approach 1. The amplification products of Ms01, Ms02 and Ms03 with the
primer combinations are summarized in Table 3.12. Gel electrophoresis of the
amplification products at 36 ºC are illustrated in Figure 3.12.
1 500 bp 1 000 bp
500 bp
1 2 3 4 5 6 7 8 9
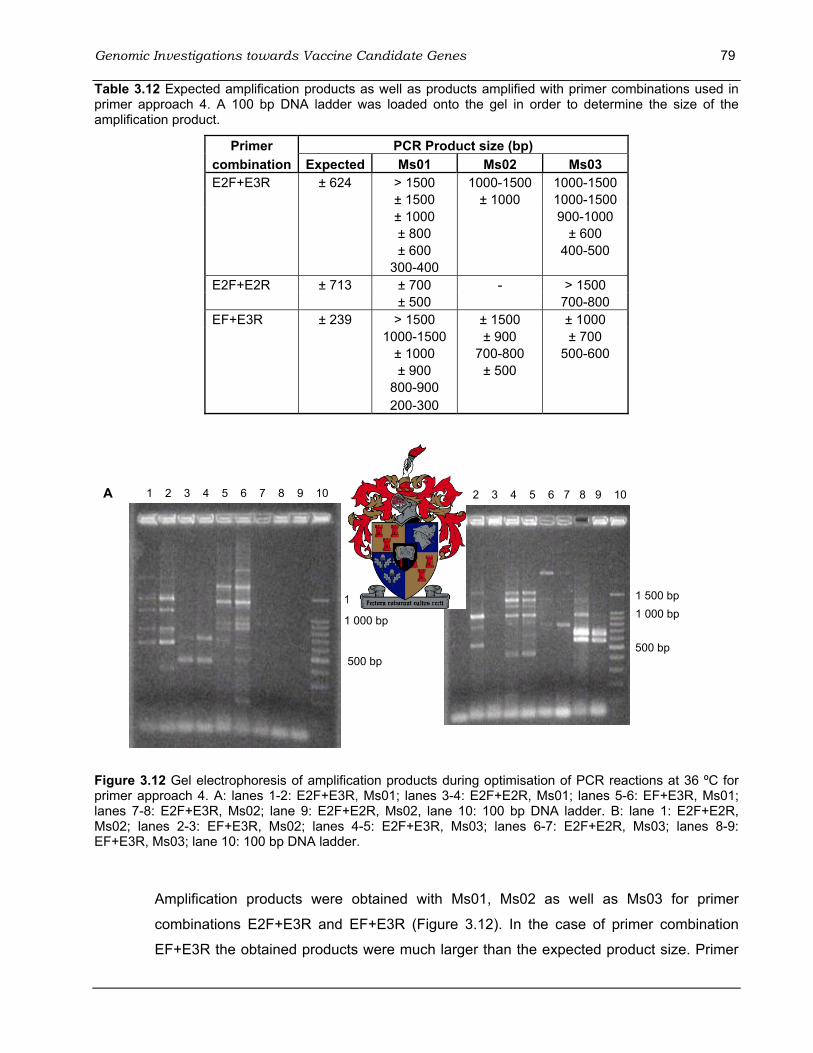
Genomic Investigations towards Vaccine Candidate Genes 79 Table 3.12 Expected amplification products as well as products amplified with primer combinations used in primer approach 4. A 100 bp DNA ladder was loaded onto the gel in order to determine the size of the amplification product.
Primer PCR Product size (bp) combination Expected Ms01 Ms02 Ms03 E2F+E3R ± 624 > 1500 1000-1500 1000-1500 ± 1500 ± 1000 1000-1500 ± 1000 900-1000 ± 800 ± 600 ± 600 400-500 300-400 E2F+E2R ± 713 ± 700 - > 1500 ± 500 700-800 EF+E3R ± 239 > 1500 ± 1500 ± 1000 1000-1500 ± 900 ± 700 ± 1000 700-800 500-600 ± 900 ± 500 800-900 200-300
Figure 3.12 Gel electrophoresis of amplification products during optimisation of PCR reactions at 36 ºC for primer approach 4. A: lanes 1-2: E2F+E3R, Ms01; lanes 3-4: E2F+E2R, Ms01; lanes 5-6: EF+E3R, Ms01; lanes 7-8: E2F+E3R, Ms02; lane 9: E2F+E2R, Ms02, lane 10: 100 bp DNA ladder. B: lane 1: E2F+E2R, Ms02; lanes 2-3: EF+E3R, Ms02; lanes 4-5: E2F+E3R, Ms03; lanes 6-7: E2F+E2R, Ms03; lanes 8-9: EF+E3R, Ms03; lane 10: 100 bp DNA ladder.
Amplification products were obtained with Ms01, Ms02 as well as Ms03 for primer
combinations E2F+E3R and EF+E3R (Figure 3.12). In the case of primer combination
EF+E3R the obtained products were much larger than the expected product size. Primer
1 500 bp
1 000 bp
500 bp
1 2 3 4 5 6 7 8 9 10 A B 1 2 3 4 5 6 7 8 9 10
1 500 bp 1 000 bp
500 bp
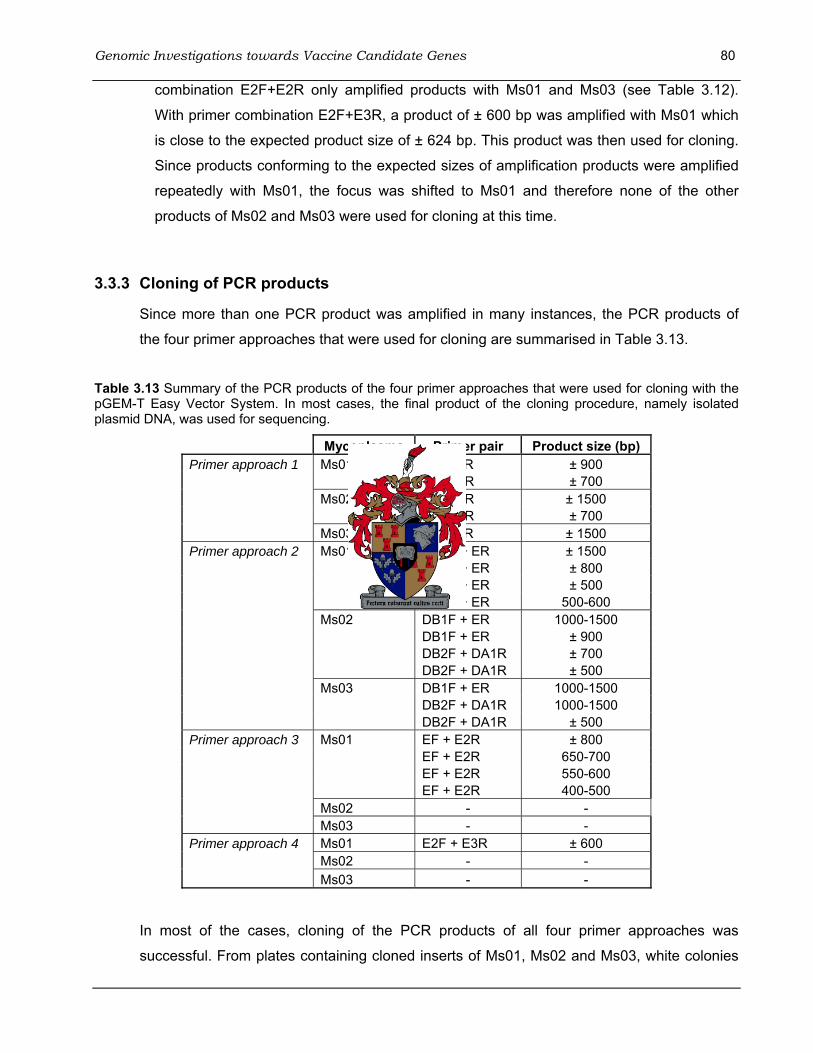
Genomic Investigations towards Vaccine Candidate Genes 80
combination E2F+E2R only amplified products with Ms01 and Ms03 (see Table 3.12).
With primer combination E2F+E3R, a product of ± 600 bp was amplified with Ms01 which
is close to the expected product size of ± 624 bp. This product was then used for cloning.
Since products conforming to the expected sizes of amplification products were amplified
repeatedly with Ms01, the focus was shifted to Ms01 and therefore none of the other
products of Ms02 and Ms03 were used for cloning at this time.
3.3.3 Cloning of PCR products
Since more than one PCR product was amplified in many instances, the PCR products of
the four primer approaches that were used for cloning are summarised in Table 3.13.
Table 3.13 Summary of the PCR products of the four primer approaches that were used for cloning with the pGEM-T Easy Vector System. In most cases, the final product of the cloning procedure, namely isolated plasmid DNA, was used for sequencing.
Mycoplasma Primer pair Product size (bp) Primer approach 1 Ms01 BF + CR ± 900 CF + CR ± 700 Ms02 CF + CR ± 1500 CF + CR ± 700 Ms03 BF + CR ± 1500 Primer approach 2 Ms01 DB1F + ER ± 1500 DB1F + ER ± 800 DB1F + ER ± 500 DB2F + ER 500-600 Ms02 DB1F + ER 1000-1500 DB1F + ER ± 900 DB2F + DA1R ± 700 DB2F + DA1R ± 500 Ms03 DB1F + ER 1000-1500 DB2F + DA1R 1000-1500 DB2F + DA1R ± 500 Primer approach 3 Ms01 EF + E2R ± 800 EF + E2R 650-700 EF + E2R 550-600 EF + E2R 400-500 Ms02 - - Ms03 - - Primer approach 4 Ms01 E2F + E3R ± 600 Ms02 - - Ms03 - -
In most of the cases, cloning of the PCR products of all four primer approaches was
successful. From plates containing cloned inserts of Ms01, Ms02 and Ms03, white colonies

Genomic Investigations towards Vaccine Candidate Genes 81
were randomly selected to perform diagnostic PCRs. In most instances, a single bright PCR
band was observed, and compared to the diagnostic PCR of a blue colony – which has no
insert – an increase in size indicated that an insert was present in the clone. The white
colonies with an insert from Ms01, Ms02 and Ms03, were then cultured overnight, after
which the plasmid DNA was isolated. The isolated plasmid DNA was then used in an insert
check PCR in order to determine if the size of the insert was approximately the size of the
original PCR product. Figure 3.13 is an example of the gel electrophoresis after an insert
check PCR was performed using primers T7 and SP6. Successful (lanes 1-3, 5, 7 and 8) as
well as unsuccessful (lanes 4, 6 and 9) cloning with DNA from a PCR product is illustrated.
Figure 3.13 Gel electrophoresis of insert check PCR using primers T7 and SP6. DNA from Ms01, primer combination EF+E2R was used in this cloning reaction. A 400-500 bp PCR product (lanes 1-3) and a 650-700 bp PCR product (lanes 4-9) was used in the ligation reaction. Products of successful cloning, lanes 1-3, 5, 7 and 8, were subsequently used in sequencing reactions. Lanes 4, 6 and 9 indicate unsuccsessful cloning and only the vector area between T7 and SP6 (170 bp) was amplified. A 100 bp DNA ladder was used to estimate the product sizes.
It was expected that the isolated plasmid DNA of Ms02 or Ms03 would give better PCR
results than that of Ms01 since they are more closely related to the poultry mycoplasmas.
However, the insert check PCR results with Ms01’s cloned DNA were better since the band
intensity was brighter and the results could be repeated. In the case of Ms02 and Ms03, the
band intensity of the insert check PCR product of the plasmid DNA was either very low, or
the PCR product was absent. This was probably due to the low concentration of the DNA
that was used for cloning. For the purpose of sequencing, most of the isolated plasmid DNA
products of Ms01 were used, but only those of Ms02 and Ms03 of which the insert check
PCR product, with primers SP6 and T7, could still be seen clearly.
1 2 3 4 5 6 7 8 9 10
1 500 bp 1 000 bp
500 bp
200 bp

Genomic Investigations towards Vaccine Candidate Genes 82 3.3.4 Alignment of sequences
For all the mycoplasma DNA that was submitted for sequencing, either from a PCR product
or a cloning product, a printout of the sequence was also requested. This printout was used
as a quick method to determine whether the sequence was “good” or “bad”. A “good”
sequence was identified by the correct short cloning vector sequence at the start and the
end of amplification product, by the identification of the primer pair at the both ends of the
amplification product that was used and by the length of the sequence which had to
correspond to the expected insert size and by mostly single peaks i.e. unambiguous base
calling. On the other hand, a sequence in which the correct short cloning vector sequence at
the start and the end of amplification product could not be identified, or in which both primers
could not be identified at the ends of the amplification product, or of which the amplification
product was not of the correct size, or in which there were significant numbers of ambiguities
were regarded as a “bad” sequence and these sequences were not analysed further. In a
number of instances inserts were detected in which only one primer could be identified, or in
which the forward and reverse primer had simply joined to each other by apparent blunt end
fusion, or in which vector sequences were largely present, and these were rejected.
Alignment of the “good” sequences was done with the computer program DAPSA. All
alignments were done manually, since the automatic alignment of the unknown sequences
with known sequences was unsatisfactory which was in all likelihood the result of a lack of
even short stretches of identical sequence. For alignment purposes the following sequences
of other mycoplasma species were available from GenBank: M. gallisepticum GapA (whole
sequence), M. gallisepticum CrmA, M. gallisepticum GapA domain B, M. pneumoniae P1, M.
pneumoniae ORF 6, M. synoviae, M. genitalium MgpB, M. genitalium MgpC and M. pirum
P1-like.
After editing of the ostrich mycoplasma sequences of Ms01, Ms02 and Ms03 to remove
cloning vector sequences, alignment with the above sequences with other mycoplasma
species was undertaken. Sequences were mostly aligned with M. gallisepticum GapA, CrmA
as well as domain B of GapA since it is one of the most important poultry mycoplasmas in
which the adhesion genes have been identified. With the manual alignment of the
sequences many spaces had to be inserted into the unknown sequence in order to align
with M. gallisepticum, especially GapA and CrmA. As a result of this, the ostrich
mycoplasma sequences were cut up into short sequences with many deletions in between,
but without these deletions the percentage sequence similarity was very low (under 40%).
Genomic Investigations towards Vaccine Candidate Genes 83
This was a problem with the sequences of Ms01, Ms02 as well as Ms03. For this reason,
additional alignments were done in order to compare the ostrich mycoplasma sequences not
only with M. gallisepticum, but also with other mycoplasma species. For this purpose a
BLAST search was done and will be discussed in the next section. (Refer to Appendix A for
sequence alignment example)
3.3.5 Sequence analysis of cloned DNA fragments using BLAST
BLAST searches, which included a BLASTN as well as TBLASTX, were performed using the
sequences obtained directly from PCR fragments and from the cloned DNA fragments.
Sequences generated directly from PCR products of Ms01, Ms02 and Ms03 only gave hits
with the primers used in the amplifications. When the primer sequences were trimmed from
the sequences, no significant hits with other mycoplasma species were found. Sequences
from the cloned DNA fragments in which the functional part could easily be isolated were
subsequently used in the BLAST searches. Firstly, only sequences generated with primer
pairs CF+CR, EF+E2R and E2F+E3R from Ms01 were used in the searches. A total of 71
sequences from Ms01 were used in the searches. Sequences generated with primers from
Ms02 and Ms03 were all identified as “bad” sequences (see page 82 for definition) and were
therefore not used in the BLAST searches.
The settings that were used for the BLASTN and TBLASTX searches are summarised in
section 3.2.9. In both searches, several mycoplasma species had sequences which showed
similarity to the different sequences generated from Ms01. Although Ms01 is not related to
poultry mycoplasmas, it was hoped that the sequences would align with any of the adhesin
or adhesin-related genes of the mycoplasma species, or one of the poultry mycoplasmas. In
the BLASTN searches, only M. synoviae was hit with sequences of PCR products generated
with primers CF+CR, with sequences of PCR products generated with primers EF+E2R only
M. gallisepticum was hit, and with sequences of PCR products generated with primers
E2F+E3R, the poultry mycoplasmas M. synoviae and M. gallisepticum were hit. In both
cases where M. gallisepticum sequences were hit, the alignment was not regarded as
significant. In the case of the TBLASTX search with sequences of PCR products generated
with primers CF+CR as well as primers EF+E2R M. synoviae sequences were hit, and with
sequences of PCR products generated with primers E2F+E3R M. synoviae as well as M.
gallisepticum sequences were hit. Once again the hits with M. gallisepticum were not
significant. None of the hits were with M. gallisepticum GapA or CrmA although most of the
primers were developed from their gene sequences.
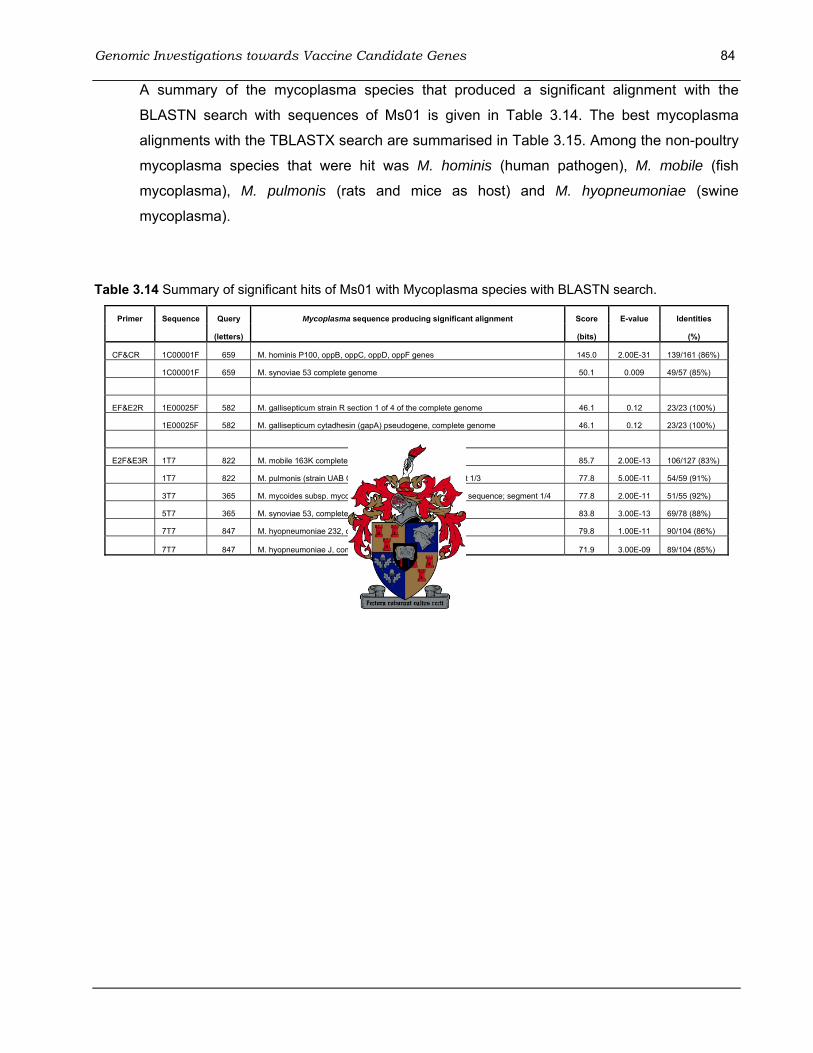
Genomic Investigations towards Vaccine Candidate Genes 84
A summary of the mycoplasma species that produced a significant alignment with the
BLASTN search with sequences of Ms01 is given in Table 3.14. The best mycoplasma
alignments with the TBLASTX search are summarised in Table 3.15. Among the non-poultry
mycoplasma species that were hit was M. hominis (human pathogen), M. mobile (fish
mycoplasma), M. pulmonis (rats and mice as host) and M. hyopneumoniae (swine
mycoplasma).
Table 3.14 Summary of significant hits of Ms01 with Mycoplasma species with BLASTN search.
Primer Sequence Query Mycoplasma sequence producing significant alignment Score E-value Identities
(letters) (bits) (%)
CF&CR 1C00001F 659 M. hominis P100, oppB, oppC, oppD, oppF genes 145.0 2.00E-31 139/161 (86%)
1C00001F 659 M. synoviae 53 complete genome 50.1 0.009 49/57 (85%)
EF&E2R 1E00025F 582 M. gallisepticum strain R section 1 of 4 of the complete genome 46.1 0.12 23/23 (100%)
1E00025F 582 M. gallisepticum cytadhesin (gapA) pseudogene, complete genome 46.1 0.12 23/23 (100%)
E2F&E3R 1T7 822 M. mobile 163K complete genome 85.7 2.00E-13 106/127 (83%)
1T7 822 M. pulmonis (strain UAB CTIP) complete genome, segment 1/3 77.8 5.00E-11 54/59 (91%)
3T7 365 M. mycoides subsp. mycoides SC genomic DNA, complete sequence; segment 1/4 77.8 2.00E-11 51/55 (92%)
5T7 365 M. synoviae 53, complete genome 83.8 3.00E-13 69/78 (88%)
7T7 847 M. hyopneumoniae 232, complete genome 79.8 1.00E-11 90/104 (86%)
7T7 847 M. hyopneumoniae J, complete genome 71.9 3.00E-09 89/104 (85%)

Genomic Investigations towards Vaccine Candidate Genes 85
Table 3.15 Summary of most significant hits of Ms01 sequences with Mycoplasma species with the TBLASTX search
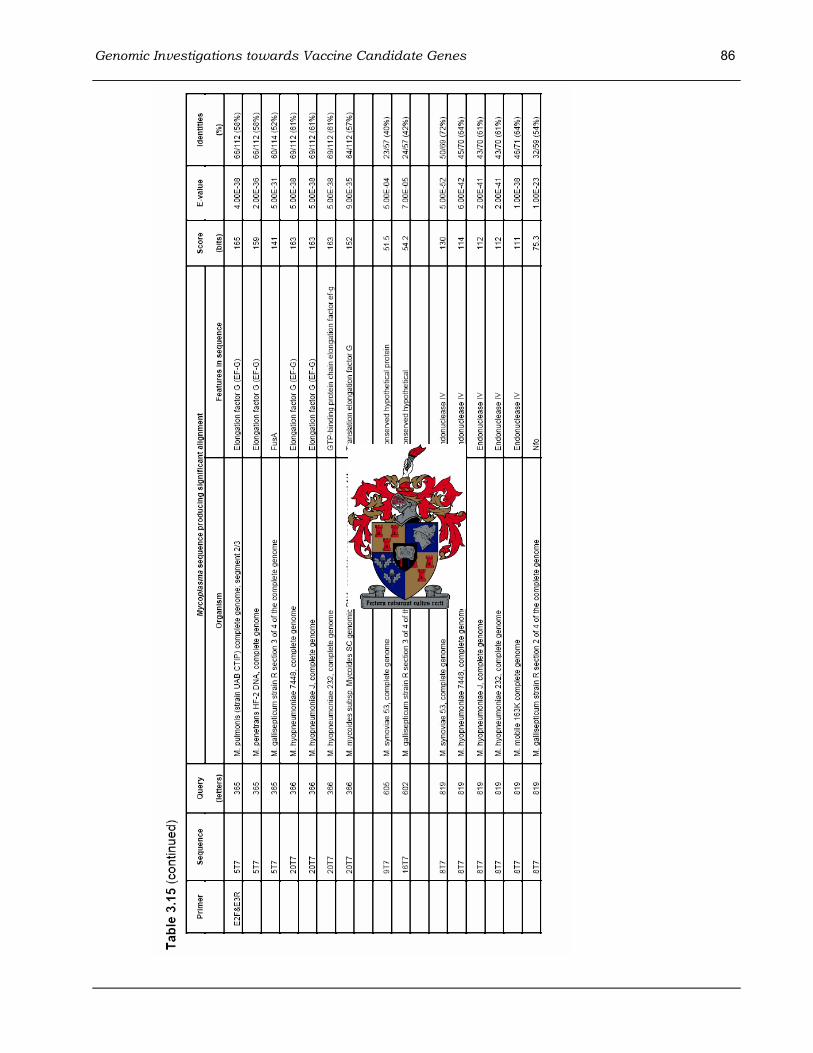
Genomic Investigations towards Vaccine Candidate Genes 86
Genomic Investigations towards Vaccine Candidate Genes 87
In Table 3.14 and 3.15 the query indicates the length of the sequence that was entered for
the search. The identities indicate the length, and percentage, of the Ms01 sequence that
aligned with the sequence of the mycoplasma species. In general, the score bits as well as
E-values of the TBLASTX search were higher and more significant than that of the BLASTN
search. Although the percentage identity of the BLASTN search was higher, the alignments
with the TBLASTX search were even better. With the TBLASTX, amino acids that these
gene regions encode for were aligned with each other, and the three base pairs that
represent the amino acid might not be the same between the mycoplasma species, and
therefore the percentage identity is lower.
The most significant hit of a Ms01 sequence with the BLASTN as well as TBLASTX was with
the M. hominis P100, oppB, oppC, oppD, oppF genes. M. hominis P100 is a membrane
protein, and the ABC transport system oppBCDF is located downstream of it in the same
operon. With BLASTN the hit was with sequence 1C00001F (primers CF+CR), and with
TBLASTX the hit was with sequence 1C00004F (also primers CF+CR). An alignment of the
two sequences in DAPSA showed that sequence 1C00004F is the same as 1C00001F. It
was surprising that M. hominis genes were hit since the primer pairs were originally
developed for identification of M. gallisepticum GapA and CrmA. On the other hand, Ms01
falls in the M. hominis clade (see Figure 2.1) which could support this result. The BLAST
statistics of these hits showed that the BLASTN score was 145, and out of the 659 bp that
were submitted, 139 bp aligned with 161 bp of M. hominis. Using the TBLASTX the score
was 380, and out of the 654 bp that was submitted, 159 bp aligned with 201 bp of M.
hominis. In order to find out exactly which part of M. hominis P100, oppB, oppC, oppD, oppF
genes aligned with the sequence of Ms01, the bp position (also given as part of the search
result) of M. hominis was compared with the complete sequence available on GenBank
(access number X99740). This revealed that when using BLASTN as well as TBLASTX the
M. hominis oppD gene, which is 1 166 bp and has an oligopeptide transport ATP-binding
protein homolog as product, aligned 79% with the sequence of Ms01. The shorter sequence
of the BLASTN search was in the same region as the sequence of the TBLASTX search.
The second best hit of Ms01 was also with primer pair CF+CR (sequence 1C00001F and
1C00004F), and the hit was with M. synoviae. The TBLASTX search identified it as an ABC
transporter, ATP-binding protein of an as yet unknown function. The search results did not
specify the position of this hit, and therefore it is possible that this ABC transporter gene can
be part of an adhesion gene, or it could be adjacent to an adhesin gene(s). For this reason,
Genomic Investigations towards Vaccine Candidate Genes 88
the position of an adhesin gene relative to the ABC transporter, ATP-binding protein was
investigated in other mycoplasma species. Only mycoplasma species of which the complete
genomes are available could be examined, and those that were used included M.
gallisepticum (adhesin gene gapA), M. pneumoniae (adhesin gene P1) and M. genitalium
(adhesin gene mgpA). Twenty genes and their products upstream as well as downstream of
the adhesin gene were examined. In the case of M. gallisepticum and M. pneumoniae, no
ABC transporter gene was found in this region. In the genome of M. genitalium, three ABC
transporter genes were found in the area close to the adhesin gene mgpA. Two of these
ABC transporters were permease proteins which were respectively 1 132 bp and 2 060 bp
upstream of the adhesin gene. The ATP-binding protein was situated 3 052 bp upstream
from the adhesin gene. Thus it appears that in some mycoplasma species the adhesin gene
may contain an ABC transporter ATP-binding motif, but in other species the location of the
ATP-binding protein is not necesserily adjacent or close to the adhesin gene.
With sequences 1E00005F, 1E00012F and 1E00025F (primer pair EF+E2R), no significant
hits were found with M. synoviae (results not shown in table). Ms01 sequences 2T7, 6T7
and 8T7 (primer pair E2F+E3R) had significant hits with M. synoviae and these were the
following: glucose inhibited division protein A, tyrosyl tRNA synthetase and endonuclease
IV. Significant hits of sequences 5T7, 8T7 and 19T7 (primer pair E2F+E3R) with M.
gallisepticum were the following: GidA (glucose inhibited division protein A), FusA
(translation elongation and release factors) and Nfo. As with the ABC transporter genes in
M. gallisepticum, none of these products are situated in the region 20 genes upstream or
downstream of the adhesin gene gapA.
3.4 Discussion
One of the objectives of this study was to identify an adhesin, or adhesin-related gene in the
three ostrich mycoplasmas Ms01, Ms02 and Ms03. In order to do this, the first step was to
determine whether or not the gene order of mycoplasma genomes is conserved. This would
reveal if adjacent genes could be used to target an adhesin gene. However, a comparison
with Gene plot of those mycoplasma genomes which have been sequenced fully showed that
the gene order is not conserved within mycoplasma genomes. The sequence of genes in
operons in mycoplasma genomes was, however, found to be conserved. As a result, a search
for an adhesin gene with primers must be restricted to the genes within an operon.

Genomic Investigations towards Vaccine Candidate Genes 89
PCR’s were performed in four primer approaches and this included several primer
combinations. Primers for the first approach were based on the sequences of the M.
gallisepticum gapA and crmA genes (Papazisi et al., 2000), and primers for the three other
approaches were developed from the alignment of several adhesin and adhesin-related
genes of mycoplasma species. Within the adhesin and adhesin-related genes, conserved
areas, referred to as domain A and B, were recognised which are possibly also conserved in
the adhesin genes of the ostrich mycoplasmas. Genomic DNA of Ms01, Ms02 as well as
Ms03 was used in all the primer approaches and produced a range of PCR products. In most
instances multiple PCR products were produced with DNA from all three ostrich
mycoplasmas, and not only a single product of the expected size. Sequences that were
generated directly from the PCR products were not satisfactory, and could not be used in
BLAST searches.
In an attempt to generate readable sequences, PCR products of Ms01, Ms02 and Ms03 that
were of the expected product size for a specific primer pair, were cloned into the pGEM-T
Easy Vector. The cloning procedure was successful with PCR products from all three ostrich
mycoplasmas. Sequences were generated from the final cloning product, namely the isolated
plasmid DNA. Sequences from Ms01 were very good in that the functional part could be
easily recognised. In the case of Ms02 and Ms03, the sequences were poor and could not be
used successfully in BLAST searches.
Manual alignment of the sequences of Ms01 with those of M. gallisepticum gapA and crmA
was, however, poor, and therefore better searches for matching mycoplasma sequences
were needed. For this purpose BLASTN and TBLASTX searches were performed. In the
BLASTN as well as TBLASTX searches, the most significant matches of Ms01 sequences
with other mycoplasma species was with the M. hominis P100, oppB, oppC, oppD, oppF
genes. Further comparisons of the position of the area that was hit with the complete
sequence of M. hominis P100, oppB, oppC, oppD, oppF identified it as oppD, which is an
oligopeptide transport ATP-binding protein homolog (Henrich et al., 1999). This was true for
the nucleic acid alignment as well as amino acid alignment. Although it was not M.
gallisepticum GapA or one of its adhesin-related genes that was hit, the product of M. hominis
P100 is also a membrane protein involved in adhesin. The oppB, oppC, oppD, oppF genes
which are located in the same operon, forms the ABC transport system.
ABC transport systems have been shown to be involved in the ATP-dependent transport of
nutrients into microbial cells (Rottem, 2002). The M. hominis P100, oppBCDF operon
Genomic Investigations towards Vaccine Candidate Genes 90
therefore appears to code for proteins involved in attachment and active transport as
functional unit (Henrich et al., 1993). From this finding it can be deduced that searches for
ABC transporters may therefore also reveal attachment genes and was further examined in
the subsequent gene searches in this study.
One of the poultry mycoplasmas that had a significant match with the sequences of Ms01
was M. synoviae, and it was also overall the second best hit with BLASTN and TBLASTX.
The product of the M. synoviae gene that was hit with the TBLASTX is also an ABC
transporter, ATP-binding protein. Thus it appears that the hits of M. hominis oppD and M.
synoviae are similar in function. Further investigations revealed that in two other species, M.
gallisepticum and M. pneumoniae, ABC transporter ATP-binding proteins are not adjacent to
their adhesin genes (gapA and P1 respectively), adhesin-related genes, or in the nearby
area. In the case of M. genitalium, the closest ABC transporter, ATP-binding protein is 3 052
bp upstream of its adhesin gene mgpA. This illustrates once again that the gene order of the
mycoplasma genome is not conserved.
In the BLASTN and TBLASTX searches with other mycoplasma species, the hits were often
with different lengths of the submitted Ms01 sequences. This could be because the genomic
rearrangement between species is quite large, but this appears not to be a problem since the
functional part of the sequence is short. With the primer approaches, the adhesin genes of
other mycoplasma species were also amplified, which indicates that they possibly share
conserved motives in the functional part of the membrane insertion and attachment genes,
such as the domain A and B areas in M. gallisepticum gapA and crmA. This may explain why
the M. hominis oppD gene was such a significant hit with the primers based on M.
gallisepticum gapA.
The importance that these adhesin and adhesin-related proteins play in pathogenicity of
mycoplasmas has recently been highlighted by the research done by Papazisi and co-
workers (2000, 2002a, 2002b, 2003). They found that the expression of the adhesin and
adhesin-related genes was essential for cytadherence and pathogenesis. If the gapA gene
was expressed and the crmA gene was not, the mycoplasma lost its pathogenicity, but IgA
antibodies that specifically bound to GapA were elicited after vaccination, and these in turn
gave protection to infection with virulent strain (which expressed both GapA and CrmA)
(Papazisi et al., 2002b). This shows that the approach followed in this study, which has as its
final goal to develop a DNA-vaccine against a specific adhesin shows considerable promise,
as the vaccine would elicit immunity, but not cause pathogenesis.

Genomic Investigations towards Vaccine Candidate Genes 91
In conclusion, it was found that the genes between mycoplasma species are not homologous,
which is probably due to their different hosts. The primer approaches that were performed
were not specific enough in that an adhesin or adhesin-related gene(s) was not found in the
ostrich mycoplasmas, Ms01, Ms02 or Ms03. However, it forms a good basis for future studies
since M. hominis oppD, which has 79% sequence identity with the sequence of Ms01, was
identified as a possible probe for adhesin genes. Genomic mycoplasma DNA can be cut with
a suitable restriction enzyme and the fragments cloned into a suitable plasmid vector, such as
pSK Bluescript to generate a DNA library. Clones containing the adhesin genes could then be
screened with the oppD probe. A suitably labelled oppD probe could then be used to select
these clones through Southern Blotting. The M. hominis oppD gene is in the same operon as
P100, which is the membrane protein involved in adhesion, and should therefore be an
appropriate probe for the identification of a P100-like gene. Chromosome walking could then
be used to reach the true adhesin genes of each of the ostrich mycoplasmas Ms01, Ms02
and Ms03, based on the assumption that their adhesin-related genes are in the same operon
as their adhesin gene.
Once the adhesin operons of Ms01, Ms02 and Ms03 are isolated, they may be inserted into
suitable DNA vaccine vectors and vaccines can be developed. Since Ms02 and Ms03 are
more closely related to the poultry mycoplasmas, poultry mycoplasma vaccines can be used
against them in the meantime. For this reason, a poultry vaccine trial was launched at
Oudtshoorn in order to test whether or not mycoplasma vaccines elicit an efficient immune
response. This vaccine trial will be discussed in Chapter 4.
Trials with Poultry Mycoplasma Vaccines in Ostriches 92
4. Trials with Poultry Mycoplasma Vaccines in Ostriches
4.1 Introduction
Currently, no registered vaccine is available against ostrich mycoplasmas. Due to the close
relationship between the ostrich mycoplasma Ms02 and the poultry mycoplasma M. synoviae
(see Figure 2.1), the possibility exists that anti-M. synoviae antibodies may cross-react with
Ms02. In the initial phases of trying to identify which mycoplasmas infected ostriches,
immunofluorescence antibody tests using antibodies against M. synoviae were found to
recognise and bind to certain ostrich mycoplasmas. The initial deduction from this result was
that ostriches were in actual fact infected with M. synoviae. The subsequent identification of
the specific ostrich mycoplasmas and of the relationship of Ms02 and Ms03 to M. synoviae
(Botes et al. 2004, 2005a) can however also explain this anomaly. Therefore a M. synoviae
vaccine has the potential to elicit an effective immune response which may give protection
against Ms02 and Ms03.
Several mycoplasma vaccines, bacterins and live vaccines, as well as vaccination methods
are available. These subjects and previous studies with poultry mycoplasma vaccines have
been discussed in Chapter 2, section 2.9. As M. gallisepticum is an important poultry
pathogen, there has been an ongoing improvement in M. gallisepticum vaccines which give
protection against this pathogen in poultry. Although M. gallisepticum has not been found in
ostriches and is not closely related to any of the ostrich mycoplasmas, the advanced M.
gallisepticum vaccines that were available warranted a trial in which their ability to elicit
immune responses in ostriches was established.
Since the development of the enzyme-linked immunosorbent assay (ELISA) by Engvall and
Perlmann (1971) this method has been widely used for the detection of antibodies to antigens
immobilized on solid phases such as microtiter plates. In order to test the immune responses
of vaccinated poultry, ELISA tests are therefore routinely used. Advantages of using ELISA
as a testing method include its simplicity, specificity, rapidity, sensitivity and low cost. ELISA
kits are also commercially available and adaptable (Crowther, 2000).
The objective of this study was to test whether poultry mycoplasma vaccines could be used
effectively until an ostrich mycoplasma vaccine is available. In order to test whether poultry
mycoplasma vaccines may elicit immune responses in ostriches, a vaccine trial using a M.
synoviae vaccine and a M. gallisepticum vaccine, was launched at Oudtshoorn. In order to
Trials with Poultry Mycoplasma Vaccines in Ostriches 93
test the level of antibody response in ostriches, a commercially available ELISA kit for the
detection of M. synoviae antibodies in chicken and turkey serum was used and adapted in
order to detect ostrich antibodies against M. synoviae.
4.2 Material and Methods
The following section describes the poultry mycoplasma vaccines used in the trial, the setup
for the vaccine trial as well as adaptation of the commercial available ELISA kit that was
used.
4.2.1 Poultry mycoplasma vaccines used in study
Two poultry mycoplasma vaccines were used in the trial, namely M. synoviae and M.
gallisepticum. Both vaccines were obtained from Fort Dodge Animal Health, USA. Both
vaccines were developed from field strains, the M. gallisepticum vaccine was isolated by
West Virginia University and is referred to as Mg-bac, and the M. synoviae vaccine strain is
unspecified and is referred to as Ms-bac.
Both vaccines were inactivated, oil emulsified vaccines and thus unable to multiply or spread
to other birds. In the choice of vaccines, inactivated vaccines were purposely chosen so that
live poultry mycoplasmas were not inadvertently introduced into ostriches. In the case of oil
emulsified vaccines, the oil must be removed prior to use in ostriches in order to prevent
granulomas and abscesses underneath the skin. The oil is removed by centrifuging the
vaccine, but in the process the antigens are concentrated which could lead to a difference in
the amount of antigen.
For immunization, 500 ml of both the M. synoviae as well as the M. gallisepticum bacterin,
the vaccine was divided into 5 x 100 ml bottles, centrifuged and the oil removed.
4.2.2 Serum from ostriches included in the vaccine trial
Ostriches from three farms in the Oudtshoorn district were selected to be included in the
vaccine trial. None of the ostriches that were used for the vaccine trial had mycoplasma
symptoms (e-mail Dr A. Olivier, August 2005). On each farm, the ostriches were divided into
the three groups, namely A, B and Control. The group of ostriches designated as Group A
was vaccinated with M. synoviae vaccine, a Group B was vaccinated with M. gallisepticum

Trials with Poultry Mycoplasma Vaccines in Ostriches 94
vaccine and a Control group was not vaccinated. Every ostrich on each farm, group, and
age group was injected with a dosage of 1 ml oil free vaccine whilst the control group was
not vaccinated. A summary of the ostriches used in the vaccine trial is presented in Table
4.1.
Table 4.1 Summary of the ostriches used in the poultry mycoplasma vaccine trial.
Age of ostrich chicks Group A Group B Control Farm 1 3 months 10 10 10 Farm 2 4 - 5 months 10 10 10 Farm 3 6 - 7 months 20 20 20
Serum samples were taken on day 0, 7, 14 and 21 from each ostrich in each group. The
serum was stored at 4 ºC, and for long term storage at -20 ºC. All the serum samples were
used in the ELISA test in order to test the antibody response.
4.2.3 Enzyme-linked immunosorbent assay
Firstly for the ELISA test, rabbit anti-ostrich Ig was isolated and biotinylated. This was
followed by the modified protocol of the ELISA test with a Mycoplasma synoviae Antibody
Test Kit, namely FlockChek Ms (IDEXX, Dehteq).
4.2.3.1 Isolation and biotinylation of rabbit anti-ostrich Ig
To precipitate the Ig fraction, 500 μl of day 74 rabbit anti-ostrich Ig serum was added to 1
ml PBS (0.15 M, pH 7.2) and 1.5 ml saturated ammonium sulphate. The sample was
incubated at 4 ºC for 20 min followed by centrifugation at 27 200 x g (Model J-21B
Centrifuge, Beckman) for 20 min. The supernatant was decanted, the pellet redissolved in
1 ml PBS, and 1 ml saturated ammonium sulphate was added. This mixture was
incubated for 20 min at 4 ºC followed by centrifugation at 27 200 x g for 20 min.
Supernatant was decanted once again and the remaining pellet redissolved in 500 μl
PBS. The Ig fraction was dialyzed at 4 ºC overnight, ± 19 h, against carbonate buffer (0.1
M, pH 8.3). Changing of the carbonate buffer was done 4 h after starting dialysis (Hudson
and Hay, 1980).
The Ig concentration was determined by absorption at 280 nm. Carbonate buffer was
used as a blank, and the Ig sample was diluted 10 x in carbonate buffer. To obtain a 5
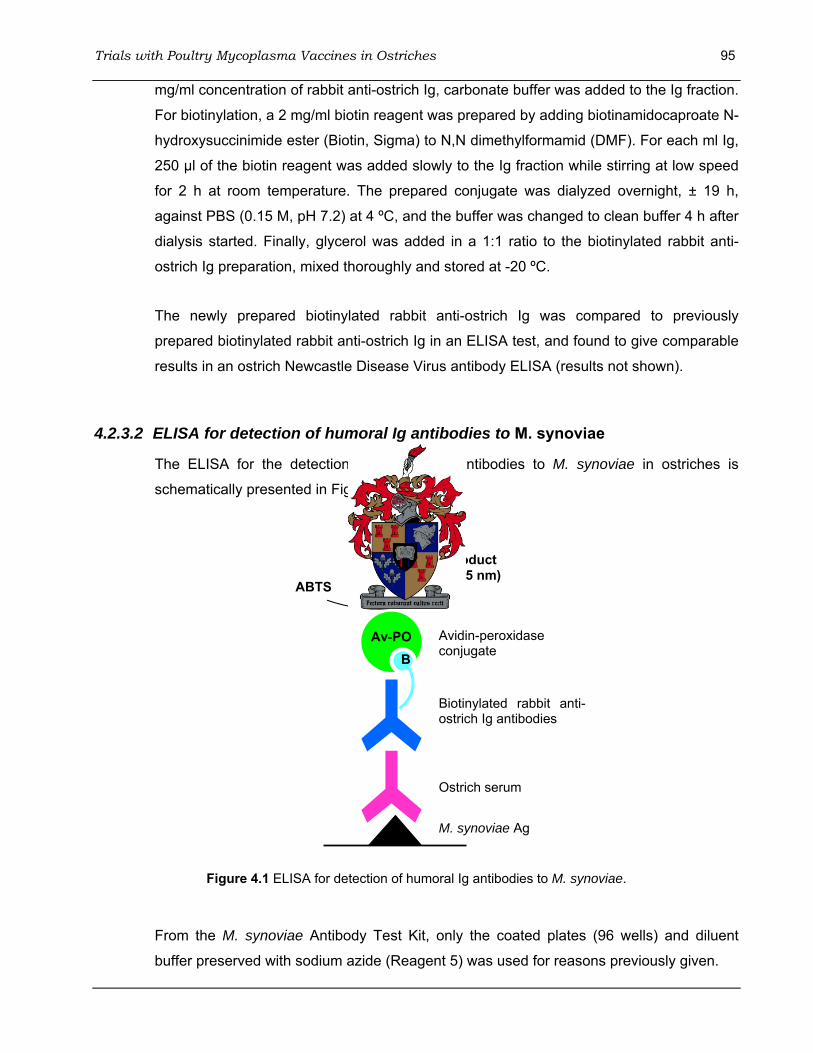
Trials with Poultry Mycoplasma Vaccines in Ostriches 95
mg/ml concentration of rabbit anti-ostrich Ig, carbonate buffer was added to the Ig fraction.
For biotinylation, a 2 mg/ml biotin reagent was prepared by adding biotinamidocaproate N-
hydroxysuccinimide ester (Biotin, Sigma) to N,N dimethylformamid (DMF). For each ml Ig,
250 μl of the biotin reagent was added slowly to the Ig fraction while stirring at low speed
for 2 h at room temperature. The prepared conjugate was dialyzed overnight, ± 19 h,
against PBS (0.15 M, pH 7.2) at 4 ºC, and the buffer was changed to clean buffer 4 h after
dialysis started. Finally, glycerol was added in a 1:1 ratio to the biotinylated rabbit anti-
ostrich Ig preparation, mixed thoroughly and stored at -20 ºC.
The newly prepared biotinylated rabbit anti-ostrich Ig was compared to previously
prepared biotinylated rabbit anti-ostrich Ig in an ELISA test, and found to give comparable
results in an ostrich Newcastle Disease Virus antibody ELISA (results not shown).
4.2.3.2 ELISA for detection of humoral Ig antibodies to M. synoviae
The ELISA for the detection of humoral Ig antibodies to M. synoviae in ostriches is
schematically presented in Figure 4.1.
Figure 4.1 ELISA for detection of humoral Ig antibodies to M. synoviae.
From the M. synoviae Antibody Test Kit, only the coated plates (96 wells) and diluent
buffer preserved with sodium azide (Reagent 5) was used for reasons previously given.
Av-PO B
ABTS H2O2
Product (405 nm)
M. synoviae Ag
Ostrich serum
Biotinylated rabbit anti-ostrich Ig antibodies
Avidin-peroxidase conjugate
Trials with Poultry Mycoplasma Vaccines in Ostriches 96
Ostrich serum from day 0, 7, 14 and 21 for each ostrich chick in each group from each
farm, was prediluted 1:500 in the diluent buffer. Of the diluted serum, 100 μl was pipetted
in duplicate into the wells, and the plate incubated for 3 h at 37 ºC. The serum was
decanted from the plate, and the wells washed three times with PBS-Tween (PBS buffer
with 0.1 % Tween-20).
Biotinylated rabbit anti-ostrich Ig were diluted 100 x in casein-Tween (0.5 % casein, 0.15
M NaCl, 0.01 M Tris-HCl, 0.02 % thiomersal, pH 7.6 with 0.1 % Tween), added to the
plate, 100 μl/well, and incubated for 1 h at 37 ºC. The content of the plate was decanted
before washing it three times with PBS-Tween.
After washing the plate, 100 μl of streptavidin peroxidase (AVPO), diluted 100 x in casein-
Tween, was added to each well. The plate was incubated for 1 h at 37 ºC, after which the
contents were decanted and the plate washed three times with PBS-Tween.
Finally, 100 μl of the substrate solution (0.05 % ABTS, 0.015 % H2O2 in 0.1 M citrate
buffer, pH 5) was added to each well. After incubation for 30 min at 37 ºC, the absorbance
was measured at 405 nm on a Titertek Multiscan spectrophotometer.
4.2.4 Statistical analysis
The immune response data were analysed using the Statistical Analysis System (SAS)
software, Version 8 of the SAS system for Unix. The General Linear Model (GLM) procedure
was used to perform an analysis of variance (ANOVA) and averages and least significant
difference (LSD) values compiled. LSD values give a cumulative measure of the variation
within a whole experiment, i.e. between treatments and over time. Comparisons between
the average values in a single data can then be made, and if they differ by a value that is
greater than the LSD, differences are significant, whilst if they differ by a value smaller than
the LSD, it does not differ significantly.
4.3 Results
4.3.1 Adaptation of ELISA
Plates were coated with M. synoviae antigen by the manufacturer and were ready for use.
Antibodies against mycoplasma antigens present in the ostrich serum will bind to the M.

Trials with Poultry Mycoplasma Vaccines in Ostriches 97
synoviae antigen on these plates. Along with the kit, (goat) anti-chicken/(goat) anti-turkey:
horseradish peroxidase conjugate (HRPO) was supplied as secondary antibodies, but from
previous experience it is known that antibodies against chicken antibodies do not react with
ostrich antibodies (Blignaut et al., 2000). Therefore, detection of the antibodies was by
specific secondary antibodies, namely biotinylated rabbit anti-ostrich Ig antibodies, to which
a strepavidin-enzyme conjugate was bound. The advantage of using the biotin-avidin
system is its high sensitivity in amplifying the eventual signal and the low background levels
it produces. A colourless substrate, 2,2’-Azino-di(3-ethylbenzthiazoline sulphonic acid-6)
(ABTS) in combination with H2O2, that is converted to the radical cation of ABTS, and which
in turn forms an azodication product with an absorbance maximum at 414 nm, was used for
detecting the presence of the enzymes. The green coloured product could easily be
detected at 405 nm (Figure 4.1).
As no ostrich sera containing antibodies to M. synoviae were available (no ostriches have
been immunized with M. synoviae vaccines before) a number of preliminary experiments
using the above ELISA were performed in an effort to validate it. Previously an ELISA
procedure for the detection of antibodies against Newcastle Disease Virus (NDV) in poultry
was adapted for use in ostriches in this laboratory (Blignaut et al., 2000) and a similar
approach was followed in the adaption of this ELISA procedure in that the same rabbit anti-
ostrich antibodies as used in the anti-NDV ELISA were used here. In previous research it
was found that high antibody levels against NDV could be detected 21 days after
immunisation in 3 month old ostriches. Consequently, in this research, five randomly
selected serum samples from birds taken before immunization and 21 days after
immunization from Farm 1, i.e. birds that were three months old, and were used in the
ELISA procedure for the detection of M. synoviae antibodies. In a comparison of the
absorbance values obtained in the ELISA before and after immunization, it was also found
that large differences in absorbance values could be measured in a majority of cases. The
absorbance values obtained in this ELISA were similar to those obtained in the ELISA for
NDV-specific antibodies in ostriches. As the ELISA plates were coated with M. synoviae
antigens, it was concluded that the differences in absorbance values measured were an
indication of specific antibody levels to the M. synoviae antigens.
4.3.2 Statistical analysis of ELISA results
The ELISA results that were used for statistical analysis with SAS are attached as Appendix
B. The statistical analysis of the ELISA data with the SAS system (Appendix C) revealed

Trials with Poultry Mycoplasma Vaccines in Ostriches 98
that although the treatments on Farm 1, 2 and 3 did not differ, the coefficient of variance was
very large. With such a large difference it is difficult to compare the three farms directly to
each other and treat it as one experiment, therefore each individual farm was analysed
separately.
From the statistical analysis of the individual farms, the computed LSD value can be used as
an indication of a statistically significant difference between the three groups. On Farm 1
(LSD value = 0.1937), there was no statistically significant difference between Group A,
which received the M. synoviae vaccine, and Group B which received the M. gallisepticum
vaccine. The difference between Group C, which received no vaccine, and Group A and
Group B was statistically significant. On Farm 2 (LSD value = 0.1438), the difference
between Group A and Group B is not statistically significant, but their difference with Group
C was statistically significant. On Farm 3 (LSD value = 0.0568), the difference between
Group A and Group B was also not statistically significant, but their difference with Group C
was statistically significant. Thus no statistically significant differences were observed
between the responses elicited by the two poultry mycoplasma vaccines on any of the three
farms, but all the vaccinated ostriches elicited an immune response in comparison to the
unimmunised controls.
4.3.3 Immune response of ostrich chicks
In the following section, the results of the ELISA tests for each farm are presented as
graphs. For each graph, the average immune response of the group (A, B or Control) was
plotted against time. The results of each bird at each time point were also analysed. Birds
with a serum titer above 0.2 were regarded to have given a significant antibody response,
and a titer value below 0.2 as a negative antibody response. The fraction of ostriches in
each group on each farm that reacted to vaccination is summarised in tables.
4.3.3.1 Farm 1: 3 month old ostrich chicks
Figure 4.2 illustrates the average antibody response of the three groups to M. synoviae on
the first farm in ostrich chicks which were 3 months old.

Trials with Poultry Mycoplasma Vaccines in Ostriches 99
Figure 4.2 Average antibody response to M. synoviae of 3 month old ostrich chicks on Farm 1. Group A received M. synoviae vaccine (1 ml), Group B received M. gallisepticum vaccine (1 ml) and the Control group received no vaccine. The LSD value for Farm 1 is 0.1937.
From Figure 4.2 it can be seen that both vaccines elicited an immune response. Group B,
which received M. gallisepticum vaccine had a tendency to a higher antibody response
than Group A which received M. synoviae vaccine but the difference was not statistically
significant. The antibody response rose significantly between days 7 and 14, and
increased up to 21 days. Table 4.2 summarises the number of ostriches in each group
that had an ELISA titer greater than 0.2.
Table 4.2 Fraction and percentage of the ostriches on Farm 1 that reacted to vaccination. For each group, only the ostriches with a positive antibody response, thus a titer greater than 0.2, on the respective days are indicated.
Day 0 Day 7 Day 14 Day 21 Fraction % Fraction % Fraction % Fraction % Group A 0/10 0.00 0/10 0.00 3/10 30.00 5/10 50.00 Group B 0/10 0.00 0/9 0.00 7/9 77.78 9/9 100.00 Control 0/10 0.00 0/10 0.00 0/10 0.00 1/10 10.00
Although only 3 ostriches in Group A had a titer greater than 0.2 on day 14, the average of
all 10 ostriches were still higher than 0.2 (see Figure 4.2). In Group B, 7 out of 9 ostriches
had a positive antibody response with the M. gallisepticum vaccine after 14 days. After 21
0.000
0.200
0.400
0.600
0.800
1.000
1.200
0 5 10 15 20 25
Time (days)
Avg
resp
onse
(abs
orba
nce
@ 4
05nm
)
Group A
Group B
Control
LSD value 0.1937

Trials with Poultry Mycoplasma Vaccines in Ostriches 100
days all the ostriches of Group B had a positive antibody response, but only 50% of Group
A. In the Control group, one ostrich had a positive response after 21 days, and the other
ostriches responded negatively.
4.3.3.2 Farm 2: 4-5 month old ostrich chicks
The average antibody response to M. synoviae of the 4-5 month old ostrich chicks on the
second farm is illustrated in Figure 4.3. These ostriches have a larger body mass than
those of Farm 1, and since all the ostriches received the same dosage of vaccine, namely
1 ml, the dosage per body mass is lower.
Figure 4.3 Average antibody response to M. synoviae of 4-5 month old ostrich chicks on Farm 2. Group A received M. synoviae vaccine (1 ml), Group B received M. gallisepticum vaccine (1 ml), and the Control group received no vaccine. The LSD value for Farm 2 is 0.1438.
The average antibody response of Group A, which received the M. synoviae vaccine was
better than the average antibody response of Group B which received the M. gallisepticum
vaccine, but the difference was not significantly different. A slight rise in average antibody
response could be seen after 14 days. After 21 days the average antibody response
showed a drastic increase in Group A and Group B. The fraction as well as percentage of
the ostriches in each group that responded to vaccination is summarised in Table 4.3.
0.000
0.200
0.400
0.600
0.800
1.000
1.200
0 5 10 15 20 25
Time (days)
Avg
resp
onse
(abs
orba
nce
@ 4
05nm
)
Group AGroup BControl
LSD value 0.1438
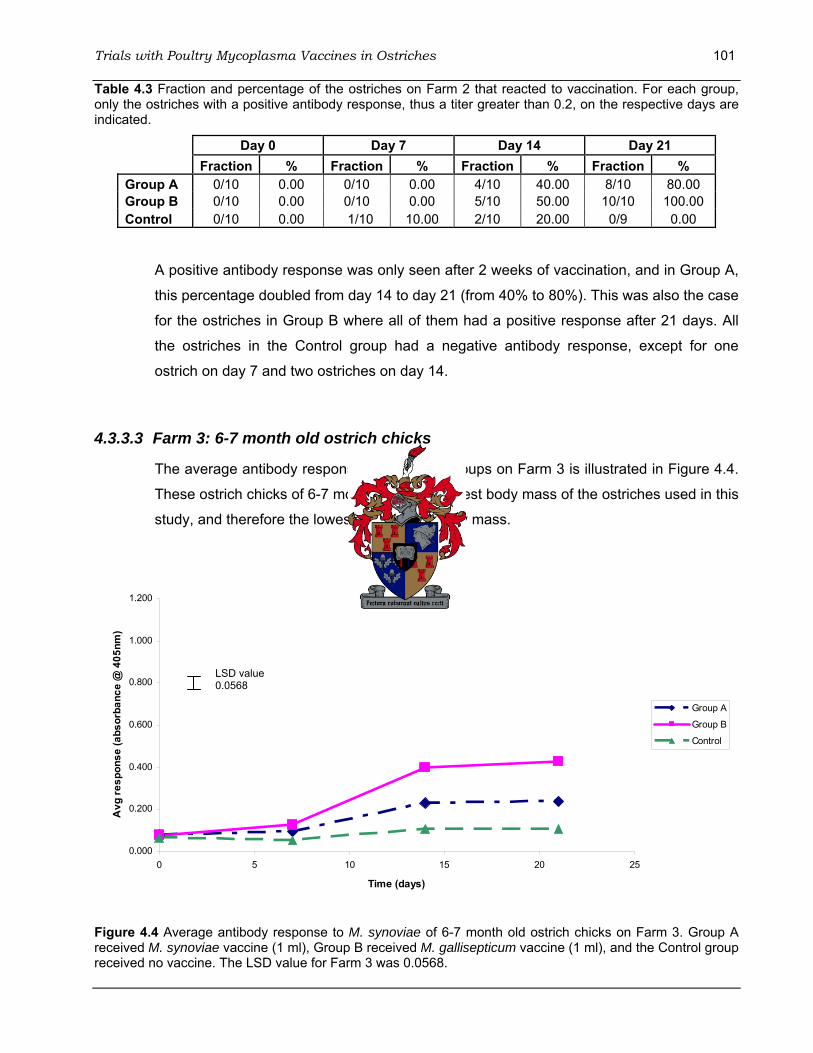
Trials with Poultry Mycoplasma Vaccines in Ostriches 101 Table 4.3 Fraction and percentage of the ostriches on Farm 2 that reacted to vaccination. For each group, only the ostriches with a positive antibody response, thus a titer greater than 0.2, on the respective days are indicated.
Day 0 Day 7 Day 14 Day 21 Fraction % Fraction % Fraction % Fraction % Group A 0/10 0.00 0/10 0.00 4/10 40.00 8/10 80.00 Group B 0/10 0.00 0/10 0.00 5/10 50.00 10/10 100.00 Control 0/10 0.00 1/10 10.00 2/10 20.00 0/9 0.00
A positive antibody response was only seen after 2 weeks of vaccination, and in Group A,
this percentage doubled from day 14 to day 21 (from 40% to 80%). This was also the case
for the ostriches in Group B where all of them had a positive response after 21 days. All
the ostriches in the Control group had a negative antibody response, except for one
ostrich on day 7 and two ostriches on day 14.
4.3.3.3 Farm 3: 6-7 month old ostrich chicks
The average antibody response of the three groups on Farm 3 is illustrated in Figure 4.4.
These ostrich chicks of 6-7 months had the largest body mass of the ostriches used in this
study, and therefore the lowest dosage per body mass.
Figure 4.4 Average antibody response to M. synoviae of 6-7 month old ostrich chicks on Farm 3. Group A received M. synoviae vaccine (1 ml), Group B received M. gallisepticum vaccine (1 ml), and the Control group received no vaccine. The LSD value for Farm 3 was 0.0568.
0.000
0.200
0.400
0.600
0.800
1.000
1.200
0 5 10 15 20 25
Time (days)
Avg
resp
onse
(abs
orba
nce
@ 4
05nm
)
Group A
Group B
Control
LSD value 0.0568

Trials with Poultry Mycoplasma Vaccines in Ostriches 102
The ostriches of Group B, which received the M. gallisepticum vaccine, had a better
antibody response than Group A, but the difference was not large nor statistically different.
An increase in antibody response could be seen from day 7 to 14, but after 21 days no
further significant increase could be observed. The average of Group A was slightly above
0.2, and thus a positive antibody response. Table 4.4 summarises the number of ostriches
in each group that had a positive antibody response.
Table 4.4 Fraction and percentage of the ostriches on Farm 3 that reacted to vaccination. For each group, only the ostriches with a positive antibody response, thus a titer greater than 0.2, on the respective days are indicated.
Day 0 Day 7 Day 14 Day 21 Fraction % Fraction % Fraction % Fraction % Group A 0/20 0.00 1/20 5.00 7/20 35.00 9/20 45.00 Group B 0/20 0.00 2/20 10.00 13/20 65.00 14/20 70.00 Control 0/20 0.00 0/20 0.00 0/19 0.00 3/19 15.79
In Group A, one ostrich had a positive antibody response after 7 days, but after 21 days
less than half of the group (45%) had a positive antibody response. In Group B, 65% of
the ostriches had a positive antibody response after 14 days, but this only increased to
70% after 21 days. Three ostriches in the Control group had a positive antibody response
after 21 days.
4.4 Discussion
The objective of this study was to test whether two poultry mycoplasma vaccines can elicit an
immune response in ostriches since no mycoplasma vaccines have been tested in ostriches
to date, nor are any mycoplasma vaccines registered for use in ostriches. The ELISA test
results showed that the M. synoviae vaccine as well as the M. gallisepticum vaccine can be
used to successfully elicit immune responses in ostriches. On two of the three farms, the M.
gallisepticum vaccine had a tendency to elicit a higher immune response than the M.
synoviae vaccine whilst on the third farm the opposite tendency was found. It must however
be mentioned that these differences were never statistically significant.
A minimum antibody level in order to give effective protection against mycoplasmas could not
be determined as the immunized birds could not be challenged. However, a cut-off value of
0.2 proved to be an indicator of protection against NDV in the vaccination trials in ostriches
done by Blignaut et al. (2000). For this reason, this cut-off value was also used in this vaccine
Trials with Poultry Mycoplasma Vaccines in Ostriches 103
trial. If M. synoviae vaccination is compared with M. gallisepticum vaccination, M.
gallisepticum vaccination results in a higher percentage of birds that give significant immune
responses.
As antibody responses to vaccination with M. synoviae and M. gallisepticum vaccines were
measured using M. synoviae antigen coated plates, it could be expected that the measured
responses to M. synoviae vaccination should be higher than M. gallisepticum vaccinations.
Thus the antibody levels elicited by M. gallisepticum vaccination may be much higher than
have been measured in these trials. However, this trial does show that the M. gallisepticum
vaccines used does elicit immune responses in ostriches. The question of protection by these
vaccines against the closely related ostrich mycoplasmas Ms02 and Ms03, will have to be
determined by challenging ostriches vaccinated with the Mg-bac vaccine with live Ms02 and
Ms03. However, as Ms02 and Ms03 have been found to be difficult to cultivate, they were not
available for the challenging the ostriches vaccinated in this study.
In a comparison of three live M. gallisepticum vaccines, namely the F-, ts-11 and 6/85 strain,
Abd-El-Motelib and Kleven (1993) found that the F-strain vaccine elicited strong serological
responses and gave good protection to vaccinated birds, whilst the ts-11 and 6/85 strains
were less effective. Birό et al. (2005) found that the ts-11 vaccine did elicit protective
immunity in poultry and no pathological lesions were caused as a result of using this live M.
gallisepticum vaccine. The M. gallisepticum 6/85 strain is also safe to use in poultry since it
has a low virulence and spreads poorly from bird to bird whilst eliciting protective immunity
(Zaki et al., 2004). Another live M. gallisepticum vaccine GT5, which was reconstituted from
the avirulent M. gallisepticum strain Rhigh, could also stimulate a protective immune response
(Papazisi et al., 2002b). In the case of M. synoviae vaccines, a study of the live attenuated
MS-H strain by Noormohammadi et al. (2002b) revealed that the highest detectable level of
antibody response was only seen after 100 days of vaccination since the antigens that were
used in serological tests were unable to detect the antibodies. As live vaccine strains persist
in birds after vaccination, the ostrich industry felt that it was a risk to use these vaccines in
South African ostriches, as these live mycoplasma vaccine strains could perhaps establish
themselves permanently leading to additional problems.
Although live vaccines could stimulate protective immune responses, killed bacterin vaccines
are usually associated with more consistent and stronger immunogenic responses without the
associated problems of strain persistence (Droual et al., 1990, 1993). The M. gallisepticum
bacterin, Mg-bac, has been used effectively in the vaccination of one-week-old chickens

Trials with Poultry Mycoplasma Vaccines in Ostriches 104
(Karaca and Lam, 1987). For this reason, it was felt that this vaccine may also be effective in
eliciting immune responses in ostriches. However, by removing the oil as was done in this
vaccine trial, the effectiveness of the vaccine could have been influenced (Panigrahy et al.,
1981). This study shows that, in spite of the removal of the oil, the vaccine is capable of
eliciting an immune response in ostriches.
From the results it is clear that the age and the mass of the ostrich chicks play a role in the
immune responses after vaccination. All the ostriches received the same dosage of vaccine,
and as their age increased, their body mass increased. The lower antibody response of the
older ostrich chicks could have been influenced by their larger body mass and therefore a
lower vaccine volume relative to the body mass. This dosage effect was also seen when
ostriches were vaccinated with NDV vaccines (Blignaut et al., 2000).
Over and above differences in age and therefore mass of the vaccinated ostriches, other
factors that may have played a role in the differences in immune responses on the three
farms, are genetic and environmental factors. As ostriches in the Oudtshoorn district are
largely genetically uniform and environmental factors are the same on the three farms, it is
unlikely that the differences in the immune responses between the farms can be ascribed to
these factors.
In this vaccine trial only a single vaccination was given and the primary antibody response,
and thus humoral response (B-cells), that followed was analysed. In order to test the
secondary response, in which the antibody response is usually elicited faster, the ostriches
should be vaccinated for a second time. After the two vaccinations, they should be
challenged with live mycoplasmas. Currently there have been difficulties in culturing live
mycoplasmas, and therefore a challenge could not have been performed in the trials
conducted as part of this study. The amount of live mycoplasmas to be used and the route of
administration in order to make the challenge effective also need to be determined. When
challenging flocks of ostriches it is important to administer the live mycoplasmas via a natural
route, and therefore a spray could be used. This route of infection would also be better for
eliciting IgA responses.
In conclusion, both poultry mycoplasma vaccines can be used to vaccinate ostriches and will
elicit significant immune responses if immunized in sufficient amounts in relation to age and
body mass. In the future, a second vaccine trial with these poultry mycoplasma vaccines,

Trials with Poultry Mycoplasma Vaccines in Ostriches 105
which include booster vaccinations, should be performed, followed by challenging the
ostriches with live mycoplasmas to test the efficacy of vaccination.

Conclusion and Future Perspectives 106
5. Conclusion and Future Perspectives
Three ostrich specific mycoplasmas, Ms01, Ms02 and Ms03, have been identified by Botes et al.
(2004, 2005a) as causative organisms of respiratory diseases in ostriches. For this reason, a need
for effective vaccine(s) against these three ostrich mycoplasmas has arisen. Two potential
approaches can be used to address this need, i.e. to develop a vaccine(s) and/or to use existing
poultry vaccines to elicit protective immunity against these mycoplasmas. DNA vaccines have
shown promise in poultry and for this reason a decision was taken to investigate this possibility. In
DNA vaccine development, a suitable candidate gene encoding a protein involved in virulence has
to be identified, isolated and inserted into the DNA vaccine vector. This preliminary investigation
was therefore launched to (a) identify and isolate such candidate genes from the three ostrich
mycoplasmas, and (b) to investigate whether poultry mycoplasma vaccines elicit immune
responses in ostriches.
From the literature it was found that a specialized tip structure is involved in mycoplasma adhesion,
and several adhesin as well as adhesin-related genes have been identified. These include M.
gallisepticum gapA and crmA, of which coexpression is necessary for cytadherence and
pathogenesis (Papazisi et al., 2003). In the human pathogen M. pneumoniae, P1 mediates
attachment and accessory proteins which are necessary for cytadherence and pathogenesis (Razin
and Jacobs, 1992). In M. genitalium, mgpA is involved in adhesion (Razin and Jacobs, 1992).
Membrane proteins can also be involved in adhesion, such as M. hominis P100 (Henrich et al.,
1993, 1996). Through a comparison of the adhesin as well as adhesin-related genes of M.
gallisepticum, M. pneumoniae and M. genitalium, it was found that two conserved areas, known as
domain A and B within these genes, are shared between these species (Papazisi et al., 2000).
The strategy that was followed to address the first objective of the study started off with an
investigation to determine if the gene order of the mycoplasma genome is conserved between
species or not. By using the Gene plot tool available on the NCBI website, it was found that the
genome order is not conserved, but operons were. Therefore, in order to identify an adhesin or
adhesin-related gene(s) in the ostrich mycoplasmas, genes adjacent to these gene(s) should not be
used as target, but rather a gene that is part of the operon, such as M. gallisepticum gapA or crmA.
For this purpose, four primer approaches were developed that included several primer
combinations in PCR reactions. The first primer approach consisted of primers developed by
Papazisi et al. (2000) for the amplification of M. gallisepticum gapA and crmA. In the second primer
approach, the domain B region of a number of mycoplasma adhesin and adhesin-related genes
were aligned. Primers were developed in the gapA domain B and crmA domain B region, based on
Conclusion and Future Perspectives 107 the assumption that these two M. gallisepticum genes are situated next to each other. It was also
assumed that the adhesin and adhesin-related genes of the three ostrich mycoplasmas are situated
next to each other in the same operon. In the third primer approach, alignment of two poultry
mycoplasmas M. gallisepticum and M. synoviae, which shares sequence similarity with Ms02,
revealed homology in the domain B region. Another primer, to be used in combination with primers
from the previous approaches, was developed in this area. In the fourth and final primer approach,
two more primers were developed based on the alignment done in primer approach three. All the
primer combinations of the four primer approaches were used for the amplification of fragments
from the genomes of Ms01, Ms02 and Ms03.
Direct sequencing of the PCR products generated using the above primer approaches were not
successful due to the heterogenicity thereof. For this reason, PCR products of Ms01, Ms02 and
Ms03 were cloned into the pGEM-T Easy Vector System. Subsequently, sequences were
generated from the cloned DNA of Ms01, Ms02 and Ms03. Manual alignment of these sequences in
DAPSA with their parent sequences was poor, most probably as a result of an accumulation of
mutations between these mycoplasmas over time. Consequently, these sequences were used in
the web-based search engine BLAST to perform BLASTN and TBLASTX searches. Using these
searches it was found that the primer approaches that were followed in this study were not specific
enough to identify an adhesin or adhesin-related gene(s) in the three ostrich mycoplasmas, Ms01,
Ms02 and Ms03. This illustrated that what works in one mycoplasma genome would not necessarily
work in another mycoplasma genome since the genes are not sufficiently homologous between
species. Sequences that were generated had a high diversity, but the M. hominis oppD gene
sequence that was found to be the most significant hit (79% sequence identity) may be used as an
appropriate probe in the future. The fact that oppD is in the same operon as P100, makes it even
more advantageous. In future studies, DNA libraries constructed from Ms01, Ms02 as well as Ms03
could be screened using this fragment as probe, and although it is a long process it is currently the
best next step in the search for vaccine candidate genes.
The second objective of this study was to isolate the adhesin or adhesin-related gene(s) after it has
been identified in the three ostrich mycoplasmas. Since the first objective could not be achieved,
this objective can only be accomplished once the DNA libraries for Ms01, Ms02 and Ms03 are
compiled. The whole operon involved in adhesion could then be isolated for ostrich mycoplasmas
Ms01, Ms02 as well as Ms03.
The third objective of this study was to test whether poultry mycoplasma vaccines can elicit an
immune response in ostriches. In a vaccine trial, two inactivated oil emulsified vaccines of M.

Conclusion and Future Perspectives 108 synoviae and M. gallisepticum, were used. It was found that both vaccines elicited an immune
response, and a high percentage of the ostriches responded to it. It was found that younger ostrich
chicks gave higher antibody responses than older ostrich chicks when immunized with the same
vaccine dose. The most likely reason for this was that they received a lower dosage of vaccine per
body mass. Further investigations should include optimisation of the vaccine dosage as well as a
second vaccine trial in which booster vaccinations are given, after which the ostriches are
challenged with live mycoplasmas to test their efficacy.
This study has therefore contributed to the knowledge of vaccine candidate genes in ostrich
mycoplasmas. It has also laid the groundwork for future studies into the development of an effective
vaccine against ostrich mycoplasmas. This study also documents that poultry mycoplasma
vaccines have the potential of protecting ostriches against ostrich mycoplasma infections. Both of
these aspects of this study may therefore be of direct benefit to the South African ostrich industry.

Literature Cited 109
Literature Cited Abd-El-Motelib, T.Y. and Kleven, S.H. (1993). A comparative study of Mycoplasma gallisepticum vaccines
in young chickens. Avian Dis., 37: 981-987.
Ada, G.L. (1994). Vaccines and immune response. In: Webster, R.G. and Granoff, A. (eds), Encyclopedia of
Virology (Vol. 3), pp. 1503-1507. Academic Press, London.
Adler, H.E. and Lamas Da Silva, J.M. (1970). Immunization against Mycoplasma gallisepticum. Avian Dis.,
14: 763-769.
Allen, J.L., Noormohammadi, A.H. and Browning, G.F. (2005). The vlhA loci of Mycoplasma synoviae are
confined to a restricted region of the genome. Microbiology, 151: 935-940.
Baseman, J.B. and Tully, J.G. (1997). Mycoplasmas: Sophisticated, reemerging, and burdened by their
notoriety. Emerg. Infect. Dis., 3(1): 21-32.
Baum, S.G. (2000). Introduction to Mycoplasma diseases. In: Mandell, G.L, Bennett, J.E. and Dolin, R. (eds),
Principles and practice of Infectious Diseases, pp. 2015-2018. Churchill Livingstone, Philadelphia, USA.
Bencina, D. (2002). Haemagglutinins of pathogenic avian mycoplasmas. Avian Pathol., 31: 535-547.
Bezuidenhout, A.J. (1999). Anatomy. In: Deeming, D.C. (ed), The Ostrich: Biology, production and health,
pp. 13-50. CAB International, Cambridge.
Binnewies, T.T., Hallin, P.F., Staerfeldt, H-H. and Ussery, D.W. (2005). Genome update: proteome
comparisons. Microbiology, 151: 1-4.
Birό, J., Povazsan, J., Korösi, L, Glavits, R., Hufnagel, L. and Stipkovits, L. (2005). Safety and efficacy of
Mycoplasma gallisepticum TS-11 vaccine for the protection of layer pullets against challenge with virulent
Mycoplasma gallisepticum R-strain. Avian Pathol., 34: 341-347.
BLAST searches: www.ncbi.nlm.nih.gov/blast (Accessed several times).
Blignaut, A., Burger, W.P., Morley, A.J. and Bellstedt, D.U. (2000). Antibody response to La Sota strain
vaccines of Newcastle Disease virus in ostriches (Struthio camelus) as detected by enzyme-linked
immunosorbent assay. Avian Dis., 44: 390-398.
Boguslavsky, S., Menaker, D., Lysnyansky, I., Liu, T., Levisohn, S., Rosengarten, R., Garcia, M. and Yogev, D. (2000). Molecular characterization of the Mycoplasma gallisepticum pvpA gene which encodes a
putative variable cytadhesin protein. Infect. Immun., 68(7): 3956-3964.

Literature Cited 110 Botes, A. (2004). Immunological and epidemiological investigations in South African ostriches and penguins.
PhD, University of Stellenbosch, Stellenbosch: 63-108.
Botes, A., Peyrot, B.M., Olivier, A.J., Burger, W.P. and Bellstedt, D.U. (2005a). Identification of three
novel mycoplasma species from ostriches in South Africa. Vet. Microbiol., 111: 159-169.
Botes, A., Peyrot, B.M., Olivier, A.J., Burger, W.P. and Bellstedt, D.U. (2005b). Investigations into
mycoplasma infections in South African ostriches. Proceedings of the 3rd International Ratite Science
Symposium, 14-16 October, Madrid, Spain.
Bové, J.M. (1993). Molecular features of Mollicutes. Clin. Infect. Dis., 17(Suppl1): S10-31.
Bradbury, J.M. (2005). Poultry mycoplasmas: sophisticated pathogens in simple guise. Br. Poult. Sci., 46(2):
125-136.
Browning, G.F. and Markham, P.F. (2004). Determination of the genomic sequence of Mycoplasma
gallisepticum. Rural Industries Research and Development Corporation, 4: 1-8.
Butcher, G.D. (2002). Factors to consider in serologic testing for Mycoplasma gallisepticum (MG) and
Mycoplasma synoviae (MS). Available: http://edis.ifas.ufl.edu (Accessed on 30 September 2005).
Carson, J.L., Hu, P-C and Collier, A.M. (1992). Cell structural and functional elements. In: Maniloff, J.,
McElhaney, E.D., Finch, L.R. and Baseman, J.B. (eds), Mycoplasmas Molecular Biology and Pathogenesis,
pp. 63-72. American Society for Microbiology, Washington, D.C..
Chaudhry, R., Nisar, N., Hora, B., Chirasani, S.R. and Malhotra, P. (2005). Expression and immunological
characterization of the carboxy-terminal region of the P1 adhesin protein of Mycoplasma pneumoniae. J. Clin.
Microbiol., 43(1): 321-325.
Cline, J.L., Turner, K.S., O'Connor, R.J., Gomez, L.B. Jr., Kleven, S.H.and Rowland, G.N. (1997).
Determination of colonization of Mycoplasma gallisepticum and Mycoplasma synoviae in ostriches. Am.
Ostrich, Special Annual Research Issue, April: 12-13.
Coetzer, J.A.W., Thomson, G.R. and Tustin, R.C. (1994). Mycoplasmas. In: Coetzer, J.A.W., Thomson,
G.R. and Tustin, R.C. (eds), Infectious Diseases of livestock with special reference to South Africa (Vol. 2),
pp. 1483-1484. Oxford University Press, Cape Town, South Africa.
Crowther, J.R. (2000). Preface. In: Walker, J.M. (series ed), The ELISA guidebook, Methods in molecular
biology, Vol 149, pp. vii. Humana Press, Totowa, New Jersey.
Deeming, D.C. (1999). Introduction. In: Deeming, D.C. (ed), The Ostrich: Biology, production and health, pp.
1-11. CAB International, Cambridge.
Literature Cited 111 Doyle, J. and Doyle, J. (1987). A rapid DNA isolation procedure for small quantities of fresh leaf tissue.
Phytochem. Bull., 19: 11-15.
Droual, R., Bickford, A.A., Charlton, B.R. and Kuney, D.R. (1990). Investigation of problems associated
with intramuscular breast injection of oil-adjuvanted killed vaccines in chickens. Avian Dis., 34: 473-478.
Droual, R., Bickford, A.A and Cutler, G.J. (1993). Local reaction and serologic response in commercial
layer chickens injected intramuscularly in the leg with oil-adjuvanted Mycoplasma gallisepticum bacterin.
Avian Dis., 37: 1001-1008.
Dybvig, K. and Voelker, L.L. (1996). Molecular biology of Mycoplasmas. Annu. Rev. Microbiol., 50: 25-57.
Ellison, J.S., Olson, L.D. and Barile, M.F. (1992). Immunity and vaccine development. In: Maniloff, J.,
McElhaney, E.D., Finch, L.R. and Baseman, J.B. (eds), Mycoplasmas Molecular Biology and Pathogenesis,
pp. 491-504. American Society for Microbiology, Washington, D.C..
Engvall, E. and Perlmann, P. (1971). Enzyme-linked immunosorbent assay (ELISA) quantitative assay of
immunoglobulin G. Immunochem., 8: 871-874.
Fadiel, A., Lithwick, S. and Naftolin, F. (2005). The influence of environmental adaptation on bacterial
genome structure. Lett. Appl. Microbiol, 40: 12-18.
Ferraz, P.N. and Danelli, M.d.G.M. (2003). Phenotypic and antigenic variation of Mycoplasma gallisepticum
vaccine strains. Braz. J. Microbiol., 34: 238-241.
Freundt, E.A. (1973). Principles of Mycoplasma classification. In: Maramorosch, K. (ed), Mycoplasma and
Mycoplasma-like agents of human, animal and plant diseases, pp. 7-13. N.Y. Acad. Sci., New York, USA.
Gerber, A. (2005). Vraag na volstruis in SA 5 keer groter ná verbod. Die Burger, 7 Nov: 14.
Glaser, G., Hyman, H.C. and Razin, S. (1992). Ribosomes. In: Maniloff, J., McElhaney, E.D., Finch, L.R.
and Baseman, J.B. (eds), Mycoplasmas Molecular Biology and Pathogenesis, pp. 169-177. American Society
for Microbiology, Washington, D.C..
Goh, M.S., Gorton, T.S., Forsyth, M.H., Troy, K.E. and Geary, S.J. (1998). Molecular and biochemical
analysis of a 105 kDa Mycoplasma gallisepticum cytadhesin (GapA). Microbiology, 144: 2971-2978.
Harley, E.H. (1998). DNA and Protein Sequence Alignment DAPSA. Computer Program Distributed as
Shareware by the Author. University of Cape Town, Cape Town, South Africa.
Henrich, B., Feldman, R-C. and Hadding, U. (1993). Cytoadhesins of Mycoplasma hominis. Infect. Immun.,
61(7): 2945-2951.
Literature Cited 112 Henrich, B., Hopfe, M., Kitzerow, A. and Hadding, U. (1999). The adherence-associated lipoprotein P100,
encoded by an opp operon structure, functions as the oligopeptide-binding domain OppA of a putative
oligopeptide transport system in Mycoplasma hominis. J. Bacteriol., 181(16): 4873-4878.
Henrich, B., Kitzerow, A., Feldmann, R-C., Schaal, H. and Hadding, U. (1996). Repetitive elements of the
Mycoplasma hominis adhesin p50 can be differentiated by monoclonal antibodies. Infect. Immun., 64(10):
4027-4034.
Henrich, B., Lang, K., Kitzerow, A., MacKenzie, C. and Hadding, U. (1998). Truncation as a novel form of
variation of the p50 gene in Mycoplasma hominis. Microbiology, 144: 2979-2985.
Herrmann, R. (1992). Genome structure and organization. In: Maniloff, J., McElhaney, E.D., Finch, L.R. and
Baseman, J.B. (eds), Mycoplasmas Molecular Biology and Pathogenesis, pp. 157-168. American Society for
Microbiology, Washington, D.C..
Huchzermeyer, F.W. (1994). Transmissible diseases. In: Huchzermeyer, F.W., Ostrich diseases, pp. 7-45.
Agricultural Research Council, South Africa.
Huchzermeyer, F.W. (1998a). The ostrich and other ratites. In: Huchzermeyer, F.W., Diseases of Ostriches
and other Ratites, pp. 26-76. Agricultural Research Council, South Africa.
Huchzermeyer, F.W. (1998b). Transmissible diseases. In: Huchzermeyer, F.W., Diseases of Ostriches and
other Ratites, pp. 149-195. Agricultural Research Council, South Africa.
Huchzermeyer, F.W. (1999). Veterinary problems. In: Deeming, D.C. (ed), The Ostrich: Biology, production
and health, pp. 293-320. CAB International, Cambridge.
Huchzermeyer, F.W. (2002). Diseases of farmed crocodiles and ostriches. Rev. sci. tech. Off. Int. Epiz.,
21(2): 265-276.
Hudson, L. and Hay, F.C. (1980). Initial preparations. In: Hudson, L. and Hay, F.C. (eds), Practical
Immunology, 2nd edition, pp. 1-23. Blackwell Scientific Publications, Oxford, UK.
Jan, G., Le Henaff, M., Fontenelle, C. and Wroblewski, H. (2001). Biochemical and antigenic
characterisation of Mycoplasma gallisepticum membrane proteins P52 and P67 (pMGA). Arch. Microbiol.,
177: 81-90.
Jordan, F.T.W. (1979). Avian Mycoplasmas. In: Tully, J.G. and Whitcomb, R.F. (eds), The Mycoplasmas, Vol
2, Human and animal mycoplasmas, pp. 1-48. Academic Press Inc., New York.
Jordan, F.T.W. (1990a). Avian Mycoplasmoses. In: Jordan, F.T.W. (ed), Poultry Diseases, 3rd edition, pp. 74-
85. Bailliere Tindall, Great Britain.

Literature Cited 113 Jordan, F.T.W. (1990b). Vaccines and Vaccination. In: Jordan, F.T.W. (ed), Poultry Diseases, 3rd edition, pp.
418-429. Bailliere Tindall, Great Britain.
Jordan, F.T.W. (1996). Avian Mycoplasmosis. In: Jordan, F.T.W. and Pattison, M. (eds), Poultry Diseases,
4th Edition, pp. 81-93. W.B. Saunders Company Ltd., London.
Karaca, K. and Lam, K.M. (1987). Efficacy of commercial Mycoplasma gallisepticum bacterin (MG-Bac) in
preventing air-sac lesions in chickens. Avian Dis., 31: 202-203.
Kenny, G.E. (1992). Serodiagnosis. In: Maniloff, J., McElhaney, E.D., Finch, L.R. and Baseman, J.B. (eds),
Mycoplasmas Molecular Biology and Pathogenesis, pp. 505-512. American Society for Microbiology,
Washington, D.C..
Kimminau, K.M. (1993). Introducing the Ostrich. Vet. Technician, 14(8): 459-467.
Klainer, A.S. and Pollack, J.D. (1973). Scanning electron microscopy techniques in the study of the surface
structure of mycoplasmas. In: Maramorosch, K. (ed), Mycoplasma and Mycoplasma-like agents of human,
animal and plant diseases, pp. 236-245. N.Y. Acad. Sci., New York, USA.
Kleven, S.H. (1997). Mycoplasma synoviae infection. In: Calnek, B.W. (ed), Diseases of Poultry, 10th Edition,
pp. 220-228. The Iowa State University Press, Iowa, USA.
Kleven, S.H. and Baxter-Jones, C. (1997). Mycoplasma iowae infection. In: Calnek, B.W. (ed), Diseases of
Poultry, 10th Edition, pp. 228-232. The Iowa State University Press, Iowa, USA.
Krause, D.C. (1998). Mycoplasma pneumoniae cytadherence: organization and assembly of the attachment
organelle. Trends Microbiol., 6(1): 15-18.
Krause, D.C. and Balish, M.F. (2001). Structure, function, and assembly of the terminal organelle of
Mycoplasma pneumoniae. FEMS Microbiol. Lett., 198: 1-7.
Layh-Schmitt, G. and Harkenthal, M. (1999). The 40- and 90-kDa membrane proteins (ORF6 gene product)
of Mycoplasma pneumoniae are responsible for the tip structure formation and P1 (adhesin) association with
the Triton shell. FEMS Microbiol. Lett., 174:143-149.
Layh-Schmitt, G., Podtelejnikov, A. and Mann, M. (2000). Proteins complexed to the P1 adhesin of
Mycoplasma pneumoniae. Microbiology, 146:71-747.
Levisohn, S. and Kleven, S.H. (2000). Avian mycoplasmosis (Mycoplasma gallisepticum). Rev. sci. tech.
Off. Int. Epiz., 19(2): 425-442.
Ley, D.H. and Yoder, H.W. Jr. (1997). Mycoplasma gallisepticum infection. In: Calnek, B.W. (ed), Diseases
of Poultry, 10th Edition, pp. 194-205. The Iowa State University Press, Iowa, USA.
Literature Cited 114 Ley, E.C., Morishita, T.Y., Harr, B.S., Mohan, R. and Brisker, T. (2000). Serologic survey of slaughter-age
ostriches (Struthio camelus) for antibodies to selected avian pathogens. Avian Dis., 44: 989-992.
Lin, M.Y. and Kleven, S.H. (1984). Evaluation of attenuated strains of Mycoplasma gallisepticum as
vaccines in young chickens. Avian Dis., 28: 88-99.
Liu, T., Garcia, M., Levisohn, S., Yogev, D. and Kleven, S.H. (2001). Molecular variability of the adhesin-
encoding gene pvpA among Mycoplasma gallisepticum strains and its application in diagnosis. J. Clin.
Microbiol., 39(5): 1882-1888.
Maniloff, J. (1992). Phylogeny of mycoplasmas. In: Maniloff, J., McElhaney, E.D., Finch, L.R. and Baseman,
J.B. (eds), Mycoplasmas Molecular Biology and Pathogenesis, pp. 549-559. American Society for
Microbiology, Washington, D.C..
Maniloff, J. (1996). The minimal cell genome: "On being the right size". Proc. Natl. Acad. Sci. USA, 93:
10004-10006.
Marin, A. and Oliver, J.L. (2003). GC-Biased mutation pressure and ORF lengthening. J. Mol. Evol., 56:
371-372.
McAuliffe, L., Ellis, R.J., Ayling, R.D. and Nicholas, R.A.J. (2003). Differentiation of Mycoplasma species
by 16S Ribosomal DNA PCR and denaturing gradient gel electrophoresis fingerprinting. J. Clin. Microbiol.,
41(10): 4844-4847.
McAuliffe, L., Ellis, R.J., Lawes, J.R., Ayling, R.D. and Nicholas, R.A.J. (2005). 16S rDNA PCR and
denaturing gradient gel electrophoresis; a single generic test for detecting and differentiating Mycoplasma
species. J. Med. Microbiol., 54: 731-739.
Morowitz, H.J. and Wallace, D.C. (1973). Genome size and life cycle of the mycoplasma. In: Maramorosch,
K. (ed), Mycoplasma and Mycoplasma-like agents of human, animal and plant diseases, pp. 62-73. N.Y.
Acad. Sci., New York, USA.
Morsy, M.A., Panangala, V.S., Van Santen, V.L. and Bird, R.C. (1993). Cloning and partial sequence
analysis of a Mycoplasma synoviae DNA fragment encoding epitopes shared with the major adhesin P1
protein of Mycoplasma pneumoniae. Avian Dis., 37: 1105-1112.
Much, P., Winner, F., Stipkovits, L., Rosengarten, R. and Citti, C. (2002). Mycoplasma gallisepticum:
influence of cell invasiveness on the outcome of experimental infection in chickens. FEMS Immunol. Med.
Microbiol., 34: 181-186.
Mudahi-Orenstein, S., Levisohn, S., Geary, S.J. and Yogev, D. (2003). Cythadherence-deficient mutants
of Mycoplasma gallisepticum generated by transposon mutagenesis. Infect. Immun., 71(7): 3812-3820.
Literature Cited 115 Nicholas, R.A.J., Ayling, R.D., Bidewell, C.A. and Daykin, J.M. (2002). Mycoplasmas affecting the eyes of
poultry. Vet. Rec., 150(4): 119-120.
Nicolson, G.L., Nasralla, M.Y. and Nisolson, N.L. (1999). The pathogenesis and treatment of Mycoplasmal
infections. Antimicrob. Infect. Dis. News., 17(11): 81-88.
Noormohammadi, A.H., Browning, G.F., Cowling, P.J., O'Rourke, D., Whithear, K.G. and Markham, P.F. (2002a). Detection of antibodies to Mycoplasma gallisepticum vaccine ts-11 by an autologous pMGA
enzyme-linked immunosorbent assay. Avian Dis., 46: 405-411.
Noormohammadi, A.H., Browning, G.F., Jones, J. and Whithear, K.G. (2002b). Improved detection of
antibodies to Mycoplasma synoviae vaccine MS-H using an autologous recombinant MSPB enzyme-linked
immunosorbent assay. Avian Pathol., 31: 611-617.
Olson, N.O. (1984). Mycoplasma synoviae infection. In: Hofstad, M.S. (ed), Diseases of Poultry, 8th Edition,
pp. 212-220. The Iowa State University Press, Iowa, USA.
Oshop, G.L., Elankumaran, S. and Heckert, R.A. (2002). DNA vaccination in the avian. Vet. Immunol.
Immunopathol., 89:1-12.
Panigrahy, B., Grumbles, L.C. and Hall, C.F. (1981). Immunogenic potency of oil-emulsified Mycoplasma
gallisepticum bacterins. Avian Dis., 25: 821-826.
Papazisi, L., Frasca, S., Gladd, M., Jr., Liao, X., Yogev, D. and Geary, S.J. (2002a). GapA and CrmA
coexpression is essential for Mycoplasma gallisepticum cytadherence and virulence. Infect. Immun., 70(12):
6839-6845.
Papazisi, L., Gorton, T.S., Kutish, G., Markham, P.F., Browning, G.F., Nguyen, D.K., Swartzell, S., Madan, A., Mahairas, G. and Geary, S.J. (2003). The complete genome sequence of the avian pathogen
Mycoplasma gallisepticum strain Rlow. Microbiology, 149: 2307-2316.
Papazisi, L., Silbart, L.K., Frasca, S. Jr., Rood, D., Liao, X., Gladd, M., Javed, M.A. and Geary, S.J. (2002b). A modified live Mycoplasma gallisepticum vaccine to protect chickens from respiratory disease.
Vaccine, 20: 3709-3719.
Papazisi, L., Troy, K.E., Gorton, T.S., Liao, X. and Geary, S.J. (2000). Analysis of cytadherence-deficient,
GapA-negative Mycoplasma gallisepticum strain R. Infect. Immun., 68(12): 6643-6649.
Pattison, M. and Cook, J.K.A. (1996). Vaccines and Vaccination. In: Jordan, F.T.W. and Pattison, M. (eds),
Poultry Diseases, 4th Edition, pp. 469-483. W.B. Saunders Company Ltd., London.
Perelman, B. (1999). Health management and veterinary procedures. In: Deeming, D.C. (ed), The Ostrich:
Biology, production and health, pp. 321-346. CAB International, Cambridge.
Literature Cited 116 Pettersson, B., Tully, J.G., Bolske, G. and Johansson, K-E. (2000). Updated phylogenetic description of
the Mycoplasma hominis cluster (Weisburg et al. 1989) based on 16S rDNA sequences. Int. J. Syst. Evol.
Microbiol., 50: 291-301.
Razin, S. (1978). The Mycoplasmas. Microbiol. Rev., 42(2): 414-470.
Razin, S. (1992). Mycoplasma taxonomy and ecology. In: Maniloff, J., McElhaney, E.D., Finch, L.R. and
Baseman, J.B. (eds), Mycoplasmas Molecular Biology and Pathogenesis, pp. 3-22. American Society for
Microbiology, Washington, D.C..
Razin, S. (1999). Adherence of pathogenic Mycoplasmas to host cells. Biosci. Rep., 19(5): 367-372.
Razin, S. and Freundt, E.A. (1984). The Mycoplasmas. In: Krieg, N.R (ed), Bergey's Manual of Systematic
Bacteriology (Vol 1), pp. 740-770. Williams & Wilkins, Baltimore, USA.
Razin, S. and Jacobs, E. (1992). Mycoplasma adhesion. J. Gen. Microbiol., 138(3): 407-422.
Razin, S., Yogev, D. and Naot, Y. (1998). Molecular biology and pathogenicity of Mycoplasmas. Microbiol.
Mol. Biol. Rev., 62(4): 1094-1156.
Roberts, M.C. (1992). Antibiotic resistance. In: Maniloff, J., McElhaney, E.D., Finch, L.R. and Baseman, J.B.
(eds), Mycoplasmas Molecular Biology and Pathogenesis, pp. 513-523. American Society for Microbiology,
Washington, D.C..
Rocha, E.P.C. and Blanchard, A. (2002). Genomic repeats, genome plasticity and the dynamics of
Mycoplasma evolution. Nucleic Acids Res., 30(9): 2031-2042.
Rottem, S. (2002). Sterols and acylated proteins in Mycoplasmas. Biochem. Biophys. Res. Commun., 292:
1289-1292.
Rottem, S. (2003). Interaction of Mycoplasmas with host cells. Physiol. Rev., 83: 417-432.
Rottem, S. and Barile, M.F. (1993). Beware of mycoplasmas. Trends Biotechnol., 11: 143-151.
Rottem, S. and Naot, Y. (1998). Subversion and exploitation of host cells by mycoplasmas. Trends
Microbiol., 6(11): 436-440.
Ruland, K., Himmelreich, R. and Herrmann, R. (1994). Sequence divergence in the ORF6 gene of
Mycoplasma pneumoniae. J. Bacteriol., 176(17): 5202-5209.
Shivaprasad, H.L. (1993). Neonatal mortality in ostriches: An overview of possible causes. Proceedings of
the Annual Conference of the Association of Avian Veterinarians, Nashville, 31 Aug - 4 Sept, pp. 282-293.
Literature Cited 117 Simecka, J.W. (2005). Immune responses following mycoplasma infection. In: Blanchard, A. and Browning,
G. (eds), Mycoplasmas Molecular Biology Pathogenicity and Strategies for Control, pp. 485-534. Horizon
Bioscience, Norfolk, UK.
Simecka, J.W., Davis, J.K., Davidson, M.K., Ross, S.E., Städtlander, C.T.K.-H. and Cassell, G.H. (1992).
Mycoplasma diseases of animals. In: Maniloff, J., McElhaney, E.D., Finch, L.R. and Baseman, J.B. (eds),
Mycoplasmas Molecular Biology and Pathogenesis, pp. 391-415. American Society for Microbiology,
Washington, D.C..
Skadhauge, E. and Dawson, A. (1999). Physiology. In: Deeming, D.C. (ed), The Ostrich: Biology,
production and health, pp. 51-82. CAB International, Cambridge.
Trachtenberg, S. (1998). Mollicutes - Wall-less bacteria with internal cytoskeletons. J. Struct. Biol., 124: 244-
256.
Van der Vyfer, A. (1992). Viewpoint: The world ostrich industry: will South Africa maintain its domination?.
Agrekon., 31(1): 47-49.
Vasconcelos A.T.R., Ferreira, H.B., Bizarro, C.V., Bonatto, S.L., Carvalho, M.O., Pinto, P.M., Almeida, D.F., Almeida, L.G.P., Almeida, R., Alves-Filho, L., Assuncao, E.N., Azevedo, V.A.C., Bogo, M.R., Brigido, M.M., Brocchi, M., Burity, H.A., Camargo, A.A., Camargo, S.S., Carepo, M.S., Carraro, D.M., de Mattos Cascardo, J.C., Castro, L.A., Cavalcanti, G., Chemale, G., Collevatti, R.G., Cunha, C.W., Dallagiovanna, B., Dambros, B.P., Dellagostin O.A., Falcao, C., Fantinatti-Garboggini, F., Felipe, M.S.S., Fiorentin, L., Franco, G.R., Freitas, N.S.A., Frias, D., Grangeiro, T.B., Grisard, E.C., Guimaraes, C.T., Hungria, M., Jardim, S.N., Krieger, M.A., Laurino, J.P., Lima, L.F.A., Lopes, M.I., Loreto, E.L.S., Madeira, H.M.F., Manfio, G.P., Maranhao, A.Q., Martinkovics, C.T., Medeiros, S.R.B., Moreira, M.A.M., Neiva, M., Ramalho-Neto, C.E., Nicolas, M.F., Oliveira, S.C., Paixao, R.F.C., Pedrosa, F.O., Pena, S.D.J., Pereira, M., Pereira-Ferrari, L., Piffer, I., Pinto, L.S., Potrich, D.P., Salim, A.C.M., Santos, F.R., Schmitt, R., Schneider, M.P.C., Schrank, A., Schrank, I.S., Schuck, A.F., Seuanez, H.N., Silva, D.W., Silva, R., Silva, S.C., Soares, C.M.A., Souza, K.R.L., Souza, R.C., Staats, C.C., Steffens, M.B.R., Teixeira, S.M.R., Urmenyi, T.P., Vainstein, M.H., Zuccherato, L.W., Simpson, A.J.G. and Zaha, A. (2005). Swine and
poultry pathogens: the complete genome sequences of two strains of Mycoplasma hyopneumoniae and a
strain of Mycoplasma synoviae. J. Bacteriol., 187(16): 5568-5577.
Verwoerd, D.J. (2000). Ostrich diseases. Rev. sci. tech. Off. Int. Epiz., 19(2): 638-661.
Webster, R.G. (1998). DNA Vaccination: a Potential Future Strategy. In: Nichlolson, K.G., Webster, R.G. and
Hay, A.J (eds), Textbook of Influenza, pp. 410-421. Blackwell Science.

Literature Cited 118 Weisburg, W.G., Tully, J.G., Rose, D.L., Petzel, J.P., Oyaizu, H., Yang, D., Mandelco, L., Sechrest, J., Lawrence, T.G., Van Etten, J., Maniloff, J. and Woese, R. (1989). A phylogenetic analysis of
Mycoplasmas: basis for their classification. J. Bacteriol., 171(12): 6455-6467.
Whithear, K.G. (1996). Control of avian mycoplasmoses by vaccination. Rev. sci. tech. Off. Int. Epiz., 15(4):
1527-1553.
Winner, F., Markova, I., Much, P., Lugmair, A., Siebert-Gulle, K., Vogl, G., Rosengarten, R. and Citti, C. (2003). Phenotypic switching in Mycoplasma gallisepticum hemadsorption is governed by a high-frequency,
reversible point mutation. Infect. Immun., 71(3): 1265-1273.
Winner, F., Rosengarten, R. and Citti, C. (2000). In vitro cell invasion of Mycoplasma gallisepticum. Infect.
Immun., 68(7): 4238-4244.
Wise, K.S. (1993). Adaptive surface variation in mycoplasmas. Trends Microbiol., 1(2): 59-63.
Wolff, J.A., Malone, R.W., Williams, P., Chong, W., Acsadi, G., Jani, A. and Felgner, P.L. (1990) Direct
gene transfer into mouse muscle in vivo. Science, 247: 1465-1468.
Wolgemuth, C.W., Igoshin, O. and Oster, G. (2003). The motility of Mollicutes. Biophys. J., 85: 828-842.
www.mgc.ac.cn/cgibin/VFs/vfs.cgi?Genus=Mycoplasma&Keyword=Adherence, Identified virulence factors of
Mycoplasma: Adherence. (Accessed on 6 October 2005).
www.promega.com/vectors (Accessed on 22 July 2004).
www.saobc.co.za/modules.php?name=News&file=article&sid=19, The South African ostrich industry (9 May
2004). (Accessed on 19 December 2005).
www.saobc.co.za/modules.php?name=News&file=article&sid=31, Voëlgriep lei tot verbod op uitvoer (9
Augustus 2004). (Accessed on 19 December 2005).
www.saobc.co.za/modules.php?name=News&file=article&sid=32, Verbod deur Europese Unie (12 Augustus
2004). (Accessed on 19 December 2005).
www.saobc.co.za/modules.php?name=News&file=article&sid=51, The European Union (EU) approved the
resumption of imports (3 November 2005). (Accessed on 19 December 2005).
Yamamoto, R. and Ghazikhanian, G.Y. (1997). Mycoplasma meleagridis infection. In: Calnek, B.W. (ed),
Diseases of Poultry, 10th Edition, pp. 208-219. The Iowa State University Press, Iowa, USA.
Yoder, H.W. Jr. (1984). Mycoplasma gallisepticum infection. In: Hofstad, M.S. (ed), Diseases of Poultry, 8th
Edition, pp. 190-201. The Iowa State University Press, Iowa, USA.

Literature Cited 119 Zaki, M.M., Ferguson, N., Leiting, V. and Kleven, S.H. (2004). Safety of Mycoplasma gallisepticum vaccine
strain 6/85 after backpassage in turkeys. Avian Dis., 48: 642-646.

Appendix A 120
A
Appendix A Nucleotide sequence alignment of domain B
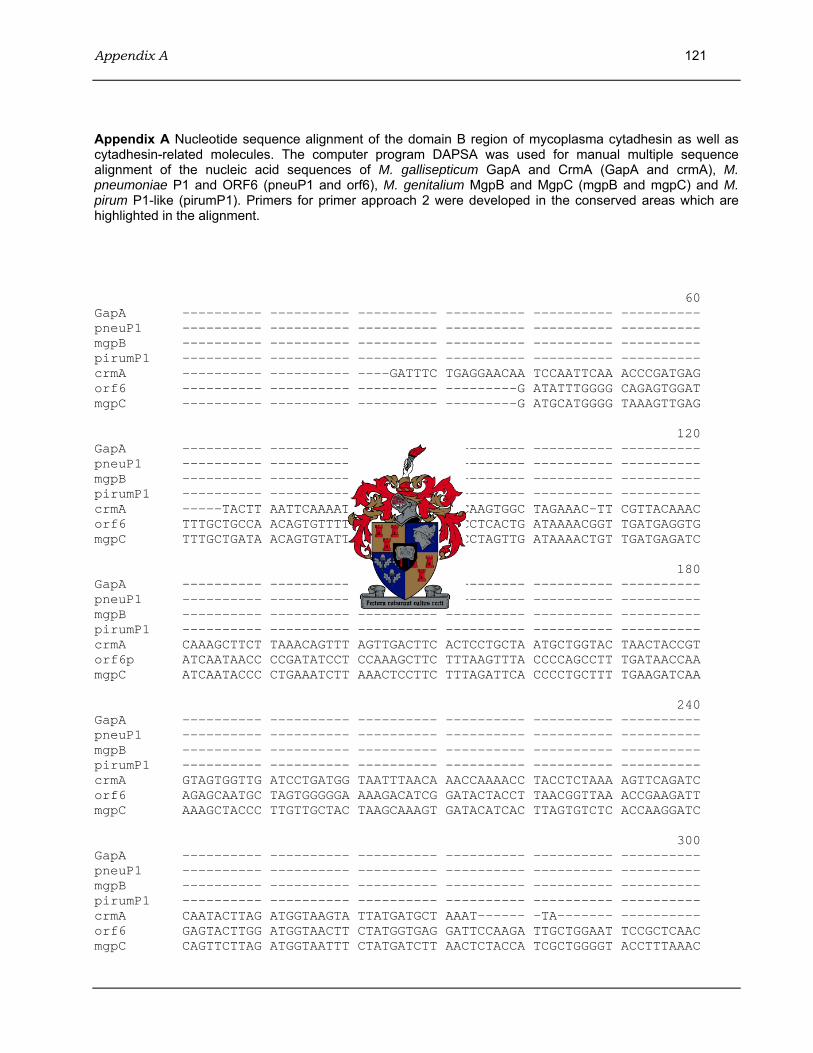
Appendix A 121
Appendix A Nucleotide sequence alignment of the domain B region of mycoplasma cytadhesin as well as cytadhesin-related molecules. The computer program DAPSA was used for manual multiple sequence alignment of the nucleic acid sequences of M. gallisepticum GapA and CrmA (GapA and crmA), M. pneumoniae P1 and ORF6 (pneuP1 and orf6), M. genitalium MgpB and MgpC (mgpB and mgpC) and M. pirum P1-like (pirumP1). Primers for primer approach 2 were developed in the conserved areas which are highlighted in the alignment. 60 GapA ---------- ---------- ---------- ---------- ---------- ---------- pneuP1 ---------- ---------- ---------- ---------- ---------- ---------- mgpB ---------- ---------- ---------- ---------- ---------- ---------- pirumP1 ---------- ---------- ---------- ---------- ---------- ---------- crmA ---------- ---------- ----GATTTC TGAGGAACAA TCCAATTCAA ACCCGATGAG orf6 ---------- ---------- ---------- ---------G ATATTTGGGG CAGAGTGGAT mgpC ---------- ---------- ---------- ---------G ATGCATGGGG TAAAGTTGAG 120 GapA ---------- ---------- ---------- ---------- ---------- ---------- pneuP1 ---------- ---------- ---------- ---------- ---------- ---------- mgpB ---------- ---------- ---------- ---------- ---------- ---------- pirumP1 ---------- ---------- ---------- ---------- ---------- ---------- crmA -----TACTT AATTCAAAAT GGGTTCACTA GTCAAGTGGC TAGAAAC-TT CGTTACAAAC orf6 TTTGCTGCCA ACAGTGTTTT GCAAGCGCGT AACCTCACTG ATAAAACGGT TGATGAGGTG mgpC TTTGCTGATA ACAGTGTATT GCAAGCAAGA AACCTAGTTG ATAAAACTGT TGATGAGATC 180 GapA ---------- ---------- ---------- ---------- ---------- ---------- pneuP1 ---------- ---------- ---------- ---------- ---------- ---------- mgpB ---------- ---------- ---------- ---------- ---------- ---------- pirumP1 ---------- ---------- ---------- ---------- ---------- ---------- crmA CAAAGCTTCT TAAACAGTTT AGTTGACTTC ACTCCTGCTA ATGCTGGTAC TAACTACCGT orf6p ATCAATAACC CCGATATCCT CCAAAGCTTC TTTAAGTTTA CCCCAGCCTT TGATAACCAA mgpC ATCAATACCC CTGAAATCTT AAACTCCTTC TTTAGATTCA CCCCTGCTTT TGAAGATCAA 240 GapA ---------- ---------- ---------- ---------- ---------- ---------- pneuP1 ---------- ---------- ---------- ---------- ---------- ---------- mgpB ---------- ---------- ---------- ---------- ---------- ---------- pirumP1 ---------- ---------- ---------- ---------- ---------- ---------- crmA GTAGTGGTTG ATCCTGATGG TAATTTAACA AACCAAAACC TACCTCTAAA AGTTCAGATC orf6 AGAGCAATGC TAGTGGGGGA AAAGACATCG GATACTACCT TAACGGTTAA ACCGAAGATT mgpC AAAGCTACCC TTGTTGCTAC TAAGCAAAGT GATACATCAC TTAGTGTCTC ACCAAGGATC 300 GapA ---------- ---------- ---------- ---------- ---------- ---------- pneuP1 ---------- ---------- ---------- ---------- ---------- ---------- mgpB ---------- ---------- ---------- ---------- ---------- ---------- pirumP1 ---------- ---------- ---------- ---------- ---------- ---------- crmA CAATACTTAG ATGGTAAGTA TTATGATGCT AAAT------ -TA------- ---------- orf6 GAGTACTTGG ATGGTAACTT CTATGGTGAG GATTCCAAGA TTGCTGGAAT TCCGCTCAAC mgpC CAGTTCTTAG ATGGTAATTT CTATGATCTT AACTCTACCA TCGCTGGGGT ACCTTTAAAC
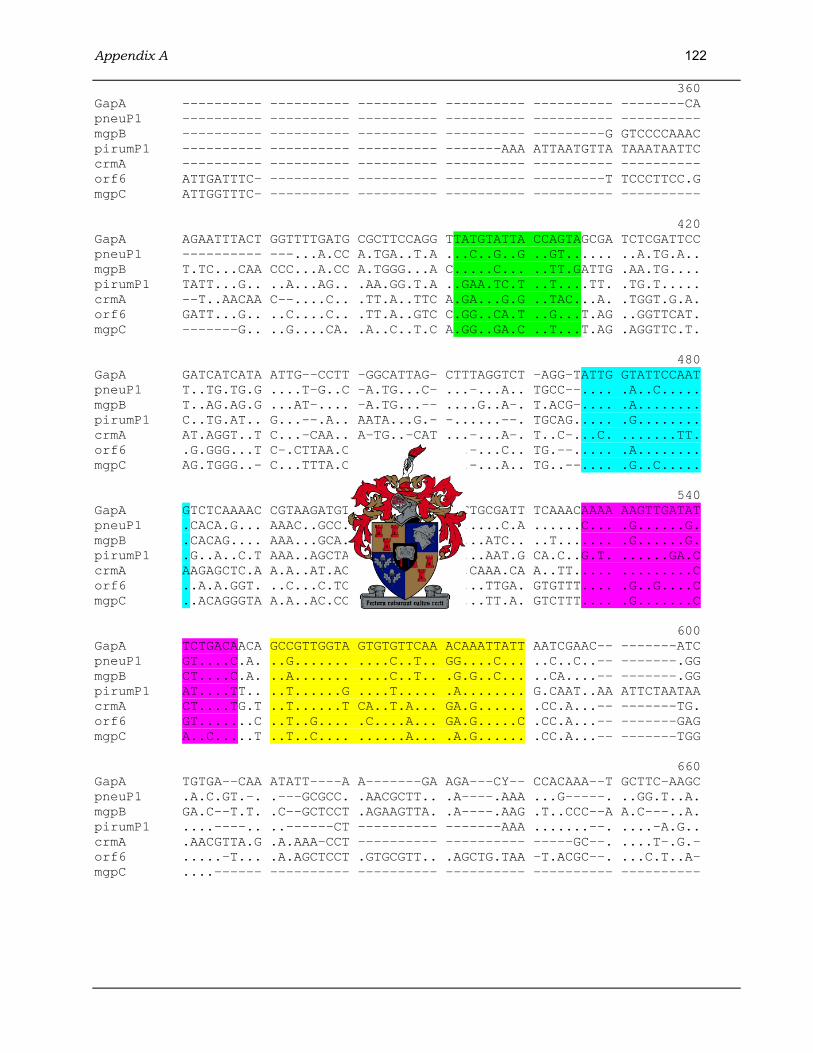
Appendix A 122
360 GapA ---------- ---------- ---------- ---------- ---------- --------CA pneuP1 ---------- ---------- ---------- ---------- ---------- ---------- mgpB ---------- ---------- ---------- ---------- ---------G GTCCCCAAAC pirumP1 ---------- ---------- ---------- -------AAA ATTAATGTTA TAAATAATTC crmA ---------- ---------- ---------- ---------- ---------- ---------- orf6 ATTGATTTC- ---------- ---------- ---------- ---------T TCCCTTCC.G mgpC ATTGGTTTC- ---------- ---------- ---------- ---------- ---------- 420 GapA AGAATTTACT GGTTTTGATG CGCTTCCAGG TTATGTATTA CCAGTAGCGA TCTCGATTCC pneuP1 ---------- ---...A.CC A.TGA..T.A ...C..G..G ..GT...... ..A.TG.A.. mgpB T.TC...CAA CCC...A.CC A.TGGG...A C.....C... ..TT.GATTG .AA.TG.... pirumP1 TATT...G.. ..A...AG.. .AA.GG.T.A ..GAA.TC.T ..T....TT. .TG.T..... crmA --T..AACAA C--....C.. .TT.A..TTC A.GA...G.G ..TAC...A. .TGGT.G.A. orf6 GATT...G.. ..C....C.. .TT.A..GTC C.GG..CA.T ..G...T.AG ..GGTTCAT. mgpC -------G.. ..G....CA. .A..C..T.C A.GG..GA.C ..T...T.AG .AGGTTC.T. 480 GapA GATCATCATA ATTG--CCTT -GGCATTAG- CTTTAGGTCT -AGG-TATTG GTATTCCAAT pneuP1 T..TG.TG.G ....T-G..C -A.TG...C- ...-...A.. TGCC--.... .A..C..... mgpB T..AG.AG.G ...AT-.... -A.TG...-- ....G..A-. T.ACG-.... .A........ pirumP1 C..TG.AT.. G...--.A.. AATA...G.- -......--. TGCAG..... .G........ crmA AT.AGGT..T C...-CAA.. A-TG..-CAT ...-...A-. T..C-...C. .......TT. orf6 .G.GGG...T C-.CTTAA.C -CTGC.-CAT ...-...C.. TG.--..... .A........ mgpC AG.TGGG..- C...TTTA.C -TTG-....T ...-...A.. TG..--.... .G..C..... 540 GapA GTCTCAAAAC CGTAAGATGT TGAAACAAGG ATTTGCGATT TCAAACAAAA AAGTTGATAT pneuP1 .CACA.G... AAAC..GCC. ....GGCT.. G......C.A ......C... .G......G. mgpB .CACAG.... AAA...GCA. .AC..GC... G....ATC.. ..T....... .G......G. pirumP1 .G..A..C.T AAA..AGCTA .T...GTT.. T....AAT.G CA.C..G.T. ......GA.C crmA AAGAGCTC.A A.A..AT.AC AAG.CA.... G..CAAA.CA A..TT..... .........C orf6 ..A.A.GGT. ..C...C.TC AAG.CTCCA. C....TTGA. GTGTTT.... .G..G....C mgpC ..ACAGGGTA A.A..AC.CC AAG.TGC.TC G....TT.A. GTCTTT.... .G.......C 600 GapA TCTGACAACA GCCGTTGGTA GTGTGTTCAA ACAAATTATT AATCGAAC-- -------ATC pneuP1 GT....C.A. ..G....... ....C..T.. GG....C... ..C..C..-- -------.GG mgpB CT....C.A. ..A....... ....C..T.. .G.G..C... ..CA....-- -------.GG pirumP1 AT....TT.. ..T......G ....T..... .A........ G.CAAT..AA ATTCTAATAA crmA CT....TG.T ..T......T CA..T.A... GA.G...... .CC.A...-- -------TG. orf6 GT.......C ..T..G.... .C....A... GA.G.....C .CC.A...-- -------GAG mgpC A..C.....T ..T..C.... ......A... .A.G...... .CC.A...-- -------TGG 660 GapA TGTGA--CAA ATATT----A A-------GA AGA---CY-- CCACAAA--T GCTTC-AAGC pneuP1 .A.C.GT.-. .---GCGCC. .AACGCTT.. .A----.AAA ...G-----. ..GG.T..A. mgpB GA.C--T.T. .C--GCTCCT .AGAAGTTA. .A----.AAG .T..CCC--A A.C---..A. pirumP1 ....----.. ..------CT ---------- -------AAA .......--. ....-A.G.. crmA .AACGTTA.G .A.AAA-CCT ---------- ---------- -----GC--. ....T-.G.- orf6 .....-T... .A.AGCTCCT .GTGCGTT.. .AGCTG.TAA -T.ACGC--. ...C.T..A- mgpC ....------ ---------- ---------- ---------- ---------- ----------
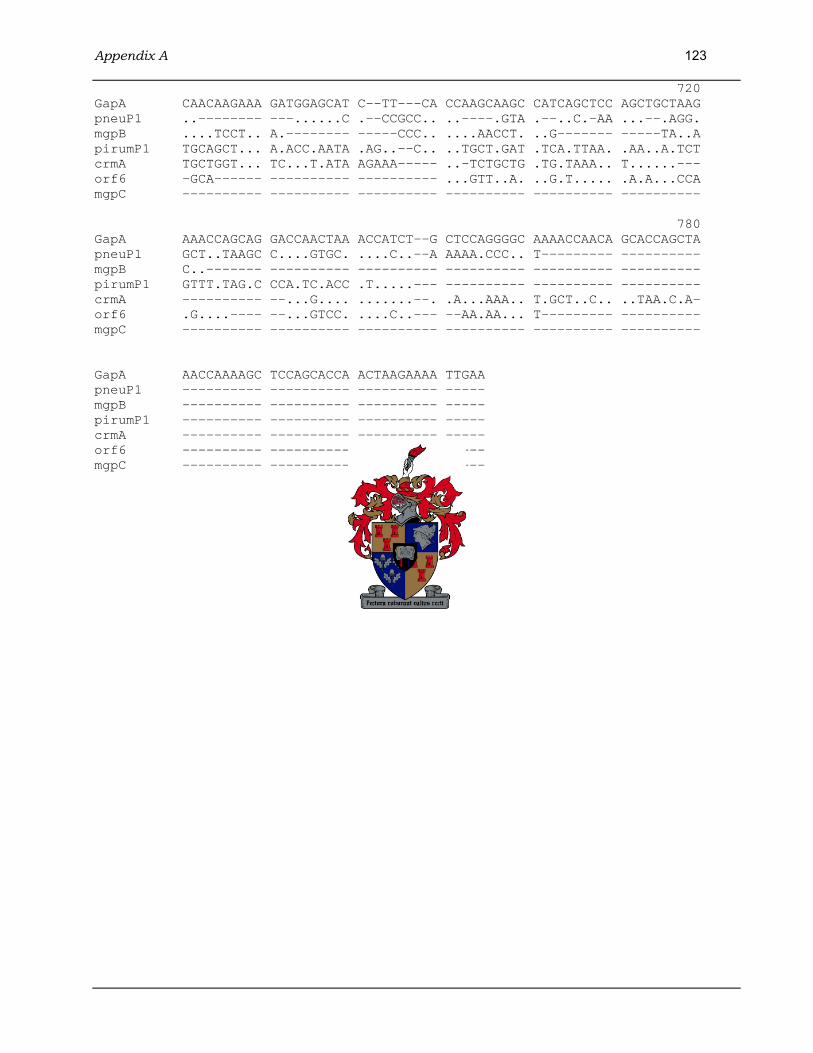
Appendix A 123
720 GapA CAACAAGAAA GATGGAGCAT C--TT---CA CCAAGCAAGC CATCAGCTCC AGCTGCTAAG pneuP1 ..-------- ---......C .--CCGCC.. ..----.GTA .--..C.-AA ...--.AGG. mgpB ....TCCT.. A.-------- -----CCC.. ....AACCT. ..G------- -----TA..A pirumP1 TGCAGCT... A.ACC.AATA .AG..--C.. ..TGCT.GAT .TCA.TTAA. .AA..A.TCT crmA TGCTGGT... TC...T.ATA AGAAA----- ..-TCTGCTG .TG.TAAA.. T......--- orf6 -GCA------ ---------- ---------- ...GTT..A. ..G.T..... .A.A...CCA mgpC ---------- ---------- ---------- ---------- ---------- ---------- 780 GapA AAACCAGCAG GACCAACTAA ACCATCT--G CTCCAGGGGC AAAACCAACA GCACCAGCTA pneuP1 GCT..TAAGC C....GTGC. ....C..--A AAAA.CCC.. T--------- ---------- mgpB C..------- ---------- ---------- ---------- ---------- ---------- pirumP1 GTTT.TAG.C CCA.TC.ACC .T.....--- ---------- ---------- ---------- crmA ---------- --...G.... .......--. .A...AAA.. T.GCT..C.. ..TAA.C.A- orf6 .G....---- --...GTCC. ....C..--- --AA.AA... T--------- ---------- mgpC ---------- ---------- ---------- ---------- ---------- ---------- GapA AACCAAAAGC TCCAGCACCA ACTAAGAAAA TTGAA pneuP1 ---------- ---------- ---------- ----- mgpB ---------- ---------- ---------- ----- pirumP1 ---------- ---------- ---------- ----- crmA ---------- ---------- ---------- ----- orf6 ---------- ---------- ---------- ----- mgpC ---------- ---------- ---------- -----
Appendix B 124
B
Appendix B Vaccine trial in ostriches: ELISA results
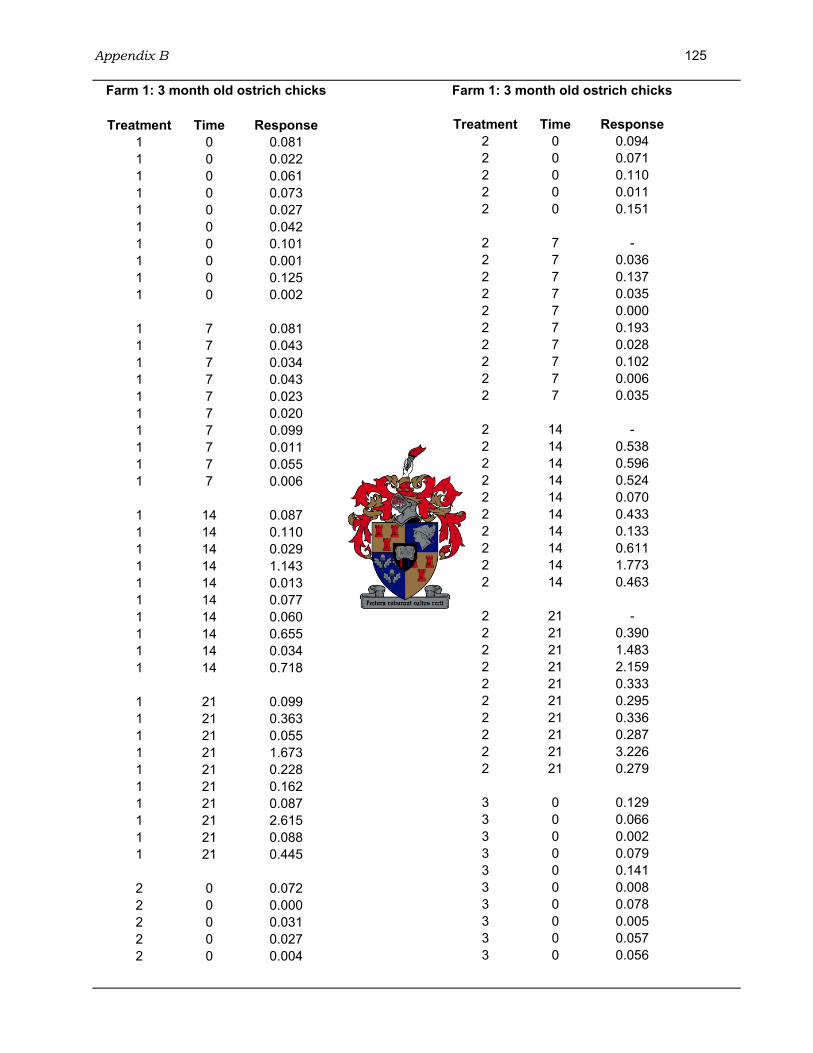
Appendix B 125
Farm 1: 3 month old ostrich chicks
Treatment Time Response 1 0 0.081 1 0 0.022 1 0 0.061 1 0 0.073 1 0 0.027 1 0 0.042 1 0 0.101 1 0 0.001 1 0 0.125 1 0 0.002
1 7 0.081 1 7 0.043 1 7 0.034 1 7 0.043 1 7 0.023 1 7 0.020 1 7 0.099 1 7 0.011 1 7 0.055 1 7 0.006
1 14 0.087 1 14 0.110 1 14 0.029 1 14 1.143 1 14 0.013 1 14 0.077 1 14 0.060 1 14 0.655 1 14 0.034 1 14 0.718
1 21 0.099 1 21 0.363 1 21 0.055 1 21 1.673 1 21 0.228 1 21 0.162 1 21 0.087 1 21 2.615 1 21 0.088 1 21 0.445
2 0 0.072 2 0 0.000 2 0 0.031 2 0 0.027 2 0 0.004
Farm 1: 3 month old ostrich chicks
Treatment Time Response 2 0 0.094 2 0 0.071 2 0 0.110 2 0 0.011 2 0 0.151
2 7 - 2 7 0.036 2 7 0.137 2 7 0.035 2 7 0.000 2 7 0.193 2 7 0.028 2 7 0.102 2 7 0.006 2 7 0.035
2 14 - 2 14 0.538 2 14 0.596 2 14 0.524 2 14 0.070 2 14 0.433 2 14 0.133 2 14 0.611 2 14 1.773 2 14 0.463
2 21 - 2 21 0.390 2 21 1.483 2 21 2.159 2 21 0.333 2 21 0.295 2 21 0.336 2 21 0.287 2 21 3.226 2 21 0.279
3 0 0.129 3 0 0.066 3 0 0.002 3 0 0.079 3 0 0.141 3 0 0.008 3 0 0.078 3 0 0.005 3 0 0.057 3 0 0.056

Appendix B 126
Farm 1: 3 month old ostrich chicks
Treatment Time Response 3 7 0.118 3 7 0.027 3 7 0.000 3 7 0.069 3 7 0.054 3 7 0.045 3 7 0.026 3 7 0.001 3 7 0.075 3 7 0.041
3 14 0.056 3 14 0.024 3 14 0.017 3 14 0.150 3 14 0.115 3 14 0.031 3 14 0.048 3 14 0.027 3 14 0.019 3 14 0.045
3 21 0.071 3 21 0.097 3 21 0.128 3 21 0.228 3 21 0.070 3 21 0.160 3 21 0.044 3 21 0.048 3 21 0.079 3 21 0.068
KEY 1 = Group A (M. synoviae vaccine) 2 = Group B (M. gallisepticum vaccine) 3 = Control (no vaccine)
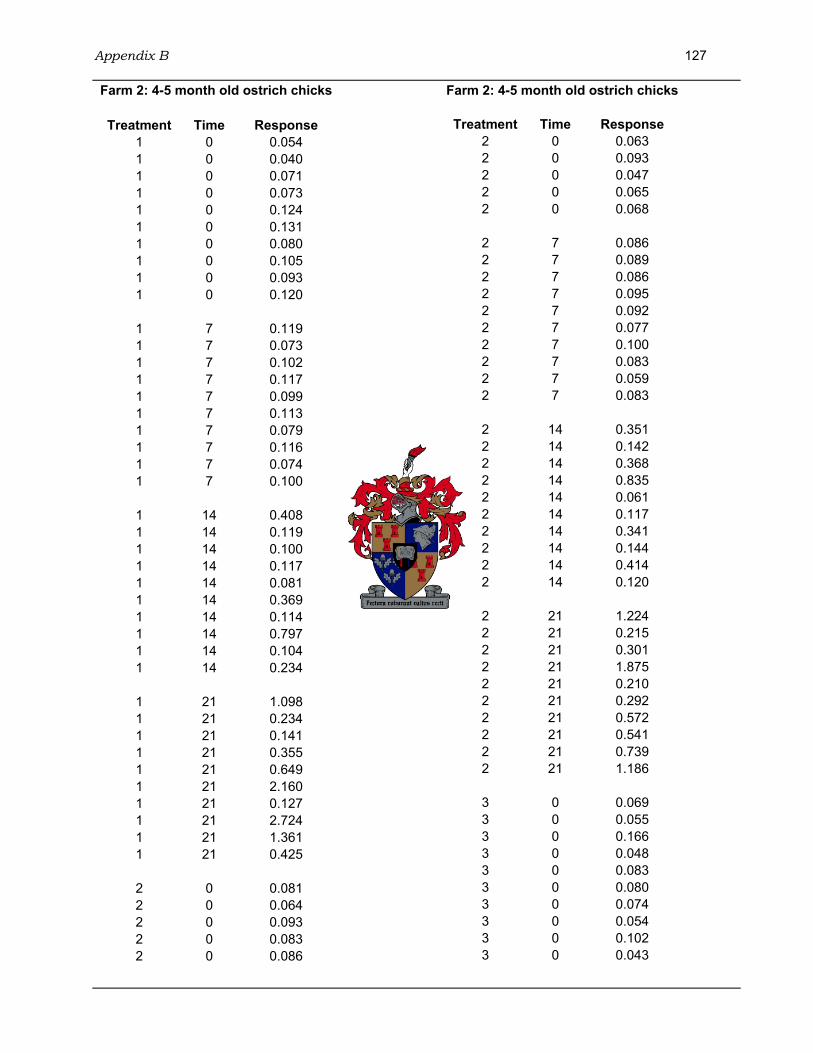
Appendix B 127
Farm 2: 4-5 month old ostrich chicks
Treatment Time Response 1 0 0.054 1 0 0.040 1 0 0.071 1 0 0.073 1 0 0.124 1 0 0.131 1 0 0.080 1 0 0.105 1 0 0.093 1 0 0.120
1 7 0.119 1 7 0.073 1 7 0.102 1 7 0.117 1 7 0.099 1 7 0.113 1 7 0.079 1 7 0.116 1 7 0.074 1 7 0.100
1 14 0.408 1 14 0.119 1 14 0.100 1 14 0.117 1 14 0.081 1 14 0.369 1 14 0.114 1 14 0.797 1 14 0.104 1 14 0.234
1 21 1.098 1 21 0.234 1 21 0.141 1 21 0.355 1 21 0.649 1 21 2.160 1 21 0.127 1 21 2.724 1 21 1.361 1 21 0.425
2 0 0.081 2 0 0.064 2 0 0.093 2 0 0.083 2 0 0.086
Farm 2: 4-5 month old ostrich chicks
Treatment Time Response 2 0 0.063 2 0 0.093 2 0 0.047 2 0 0.065 2 0 0.068
2 7 0.086 2 7 0.089 2 7 0.086 2 7 0.095 2 7 0.092 2 7 0.077 2 7 0.100 2 7 0.083 2 7 0.059 2 7 0.083
2 14 0.351 2 14 0.142 2 14 0.368 2 14 0.835 2 14 0.061 2 14 0.117 2 14 0.341 2 14 0.144 2 14 0.414 2 14 0.120
2 21 1.224 2 21 0.215 2 21 0.301 2 21 1.875 2 21 0.210 2 21 0.292 2 21 0.572 2 21 0.541 2 21 0.739 2 21 1.186
3 0 0.069 3 0 0.055 3 0 0.166 3 0 0.048 3 0 0.083 3 0 0.080 3 0 0.074 3 0 0.054 3 0 0.102 3 0 0.043

Appendix B 128
Farm 2: 4-5 month old ostrich chicks
Treatment Time Response 3 7 0.120 3 7 0.108 3 7 0.252 3 7 0.107 3 7 0.184 3 7 0.116 3 7 0.125 3 7 0.083 3 7 0.085 3 7 0.052
3 14 0.183 3 14 0.340 3 14 0.204 3 14 0.053 3 14 0.165 3 14 0.148 3 14 0.163 3 14 0.067 3 14 0.167 3 14 0.118
3 21 0.023 3 21 0.045 3 21 0.114 3 21 0.049 3 21 0.127 3 21 - 3 21 0.115 3 21 0.038 3 21 0.088 3 21 0.026
KEY 1 = Group A (M. synoviae vaccine) 2 = Group B (M. gallisepticum vaccine) 3 = Control (no vaccine)
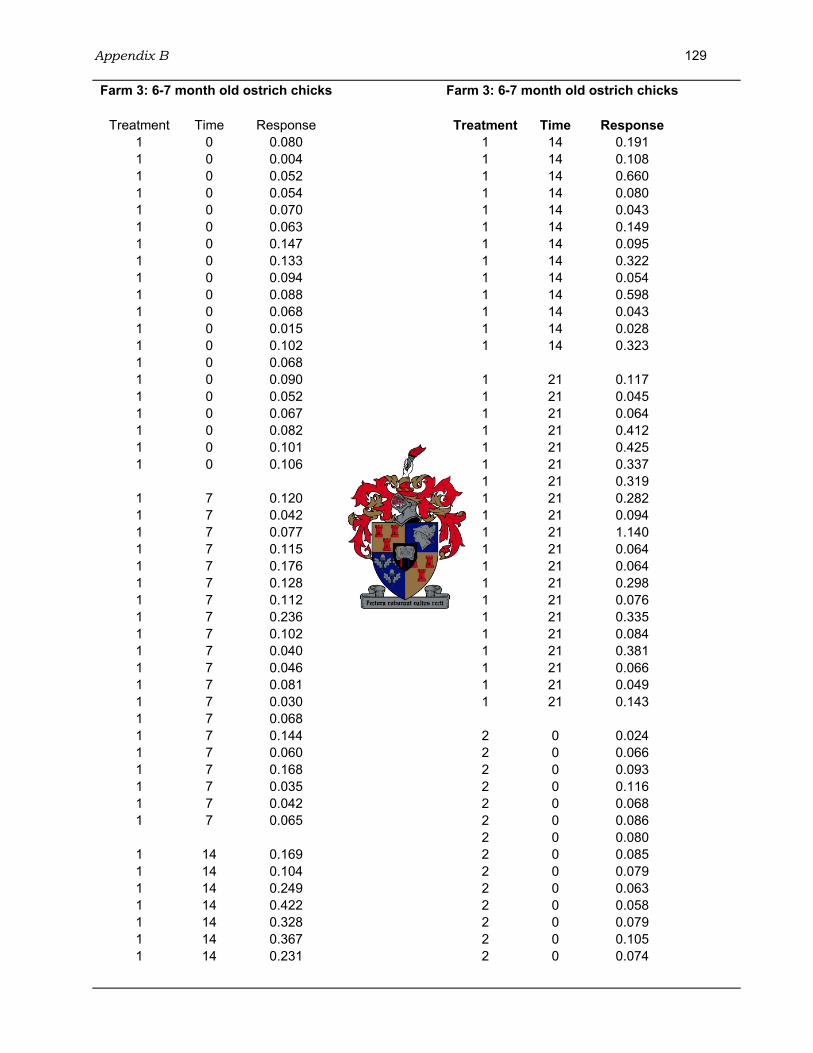
Appendix B 129
Farm 3: 6-7 month old ostrich chicks
Treatment Time Response 1 0 0.080 1 0 0.004 1 0 0.052 1 0 0.054 1 0 0.070 1 0 0.063 1 0 0.147 1 0 0.133 1 0 0.094 1 0 0.088 1 0 0.068 1 0 0.015 1 0 0.102 1 0 0.068 1 0 0.090 1 0 0.052 1 0 0.067 1 0 0.082 1 0 0.101 1 0 0.106
1 7 0.120 1 7 0.042 1 7 0.077 1 7 0.115 1 7 0.176 1 7 0.128 1 7 0.112 1 7 0.236 1 7 0.102 1 7 0.040 1 7 0.046 1 7 0.081 1 7 0.030 1 7 0.068 1 7 0.144 1 7 0.060 1 7 0.168 1 7 0.035 1 7 0.042 1 7 0.065
1 14 0.169 1 14 0.104 1 14 0.249 1 14 0.422 1 14 0.328 1 14 0.367 1 14 0.231
Farm 3: 6-7 month old ostrich chicks
Treatment Time Response 1 14 0.191 1 14 0.108 1 14 0.660 1 14 0.080 1 14 0.043 1 14 0.149 1 14 0.095 1 14 0.322 1 14 0.054 1 14 0.598 1 14 0.043 1 14 0.028 1 14 0.323
1 21 0.117 1 21 0.045 1 21 0.064 1 21 0.412 1 21 0.425 1 21 0.337 1 21 0.319 1 21 0.282 1 21 0.094 1 21 1.140 1 21 0.064 1 21 0.064 1 21 0.298 1 21 0.076 1 21 0.335 1 21 0.084 1 21 0.381 1 21 0.066 1 21 0.049 1 21 0.143
2 0 0.024 2 0 0.066 2 0 0.093 2 0 0.116 2 0 0.068 2 0 0.086 2 0 0.080 2 0 0.085 2 0 0.079 2 0 0.063 2 0 0.058 2 0 0.079 2 0 0.105 2 0 0.074

Appendix B 130
Farm 3: 6-7 month old ostrich chicks
Treatment Time Response 2 0 0.092 2 0 0.074 2 0 0.068 2 0 0.095 2 0 0.057 2 0 0.087
2 7 0.054 2 7 0.045 2 7 0.741 2 7 0.089 2 7 0.186 2 7 0.045 2 7 0.114 2 7 0.096 2 7 0.022 2 7 0.126 2 7 0.000 2 7 0.047 2 7 0.148 2 7 0.079 2 7 0.352 2 7 0.168 2 7 0.106 2 7 0.055 2 7 0.000 2 7 0.081
2 14 0.100 2 14 0.223 2 14 1.216 2 14 0.235 2 14 0.109 2 14 0.189 2 14 0.412 2 14 0.471 2 14 0.124 2 14 0.118 2 14 0.915 2 14 0.216 2 14 1.068 2 14 0.721 2 14 0.374 2 14 0.292 2 14 0.674 2 14 0.115 2 14 0.057 2 14 0.332
Farm 3: 6-7 month old ostrich chicks
Treatment Time Response 2 21 0.071 2 21 0.326 2 21 0.774 2 21 0.354 2 21 0.058 2 21 0.118 2 21 0.444 2 21 1.221 2 21 0.096 2 21 0.250 2 21 1.056 2 21 0.097 2 21 0.975 2 21 0.835 2 21 0.528 2 21 0.200 2 21 0.625 2 21 0.229 2 21 0.031 2 21 0.254
3 0 0.123 3 0 0.137 3 0 0.058 3 0 0.006 3 0 0.028 3 0 0.062 3 0 0.064 3 0 0.058 3 0 0.075 3 0 0.118 3 0 0.027 3 0 0.038 3 0 0.023 3 0 0.011 3 0 0.030 3 0 0.096 3 0 0.120 3 0 0.132 3 0 0.050 3 0 0.078
3 7 0.038 3 7 0.100 3 7 0.052 3 7 0.042 3 7 0.037 3 7 0.074 3 7 0.052

Appendix B 131
Farm 3: 6-7 month old ostrich chicks
Treatment Time Response 3 7 0.083 3 7 0.079 3 7 0.141 3 7 0.000 3 7 0.012 3 7 0.029 3 7 0.043 3 7 0.040 3 7 0.048 3 7 0.063 3 7 0.162 3 7 0.012 3 7 0.000
3 14 0.083 3 14 0.165 3 14 0.095 3 14 0.075 3 14 0.081 3 14 0.184 3 14 0.122 3 14 0.055 3 14 0.090 3 14 0.108 3 14 0.066 3 14 0.025 3 14 0.108 3 14 0.061 3 14 0.093 3 14 - 3 14 0.181 3 14 0.190 3 14 0.126 3 14 0.129
3 21 0.033 3 21 0.207 3 21 0.072 3 21 0.045 3 21 0.084 3 21 0.138 3 21 0.092 3 21 0.142 3 21 0.147 3 21 0.093 3 21 0.055 3 21 0.035 3 21 0.040 3 21 0.069
Farm 3: 6-7 month old ostrich chicks
Treatment Time Response 3 21 0.042 3 21 - 3 21 0.149 3 21 0.202 3 21 0.102 3 21 0.305
KEY 1 = Group A (M. synoviae vaccine) 2 = Group B (M. gallisepticum vaccine) 3 = Control (no vaccine)
Appendix C 132
C
Appendix C Statistical analysis of ELISA results using SAS
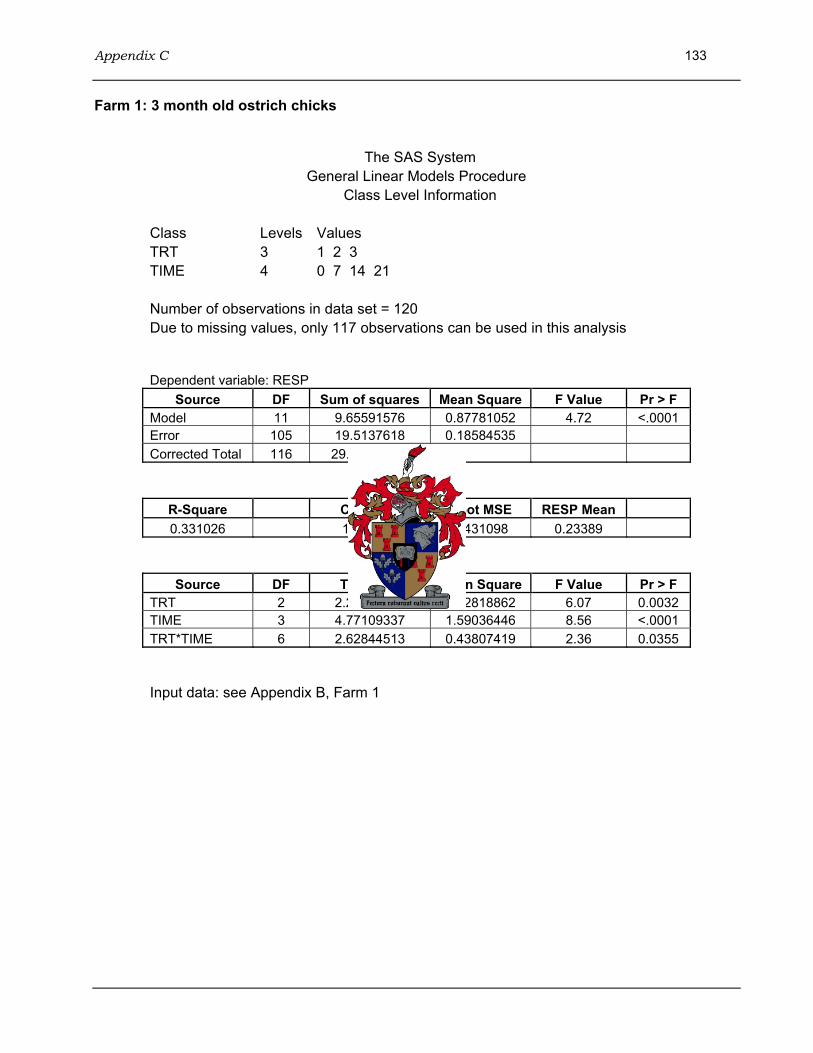
Appendix C 133
Farm 1: 3 month old ostrich chicks
The SAS System
General Linear Models Procedure Class Level Information Class Levels Values TRT 3 1 2 3 TIME 4 0 7 14 21 Number of observations in data set = 120 Due to missing values, only 117 observations can be used in this analysis Dependent variable: RESP
Source DF Sum of squares Mean Square F Value Pr > F Model 11 9.65591576 0.87781052 4.72 <.0001 Error 105 19.5137618 0.18584535 Corrected Total 116 29.16967756
R-Square Coeff Var Root MSE RESP Mean 0.331026 184.3174 0.431098 0.23389
Source DF Type I SS Mean Square F Value Pr > F TRT 2 2.25637725 1.12818862 6.07 0.0032 TIME 3 4.77109337 1.59036446 8.56 <.0001 TRT*TIME 6 2.62844513 0.43807419 2.36 0.0355 Input data: see Appendix B, Farm 1

Appendix C 134
Farm 2: 4-5 month old ostrich chicks
The SAS System
General Linear Models Procedure Class Level Information Class Levels Values TRT 3 1 2 3 TIME 4 0 7 14 21 Number of observations in data set = 120 Due to missing values, only 119 observations can be used in this analysis Dependent variable: RESP
Source DF Sum of squares Mean Square F Value Pr > F Model 11 8.66967587 0.78815235 7.55 <.0001 Error 107 11.16406752 0.10433708 Corrected Total 118 19.83374339
R-Square Coeff Var Root MSE RESP Mean 0.437117 130.3884 0.323013 0.247731
Source DF Type I SS Mean Square F Value Pr > F TRT 2 1.16945611 0.58472806 5.60 0.0048 TIME 3 4.74995194 1.58331731 15.18 <.0001 TRT*TIME 6 2.75026782 0.45837797 4.39 0.0005 Input data: see Appendix B, Farm 2

Appendix C 135
Farm 3: 6-7 month old ostrich chicks
The SAS System
General Linear Models Procedure Class Level Information Class Levels Values TRT 3 1 2 3 TIME 4 0 7 14 21 Number of observations in data set = 240 Due to missing values, only 238 observations can be used in this analysis Dependent variable: RESP
Source DF Sum of squares Mean Square F Value Pr > F Model 11 3.64548919 0.33140811 10.04 <.0001 Error 226 7.45659051 0.03299376 Corrected Total 237 11.10207970
R-Square Coeff Var Root MSE RESP Mean 0.328361 108.2989 0.181642 0.167723
Source DF Type I SS Mean Square F Value Pr > F TRT 2 1.20135840 0.60067920 18.21 <.0001 TIME 3 1.72300577 0.57433526 17.41 <.0001 TRT*TIME 6 0.72112501 0.12018750 3.64 0.0018 Input data: see Appendix B, Farm 3
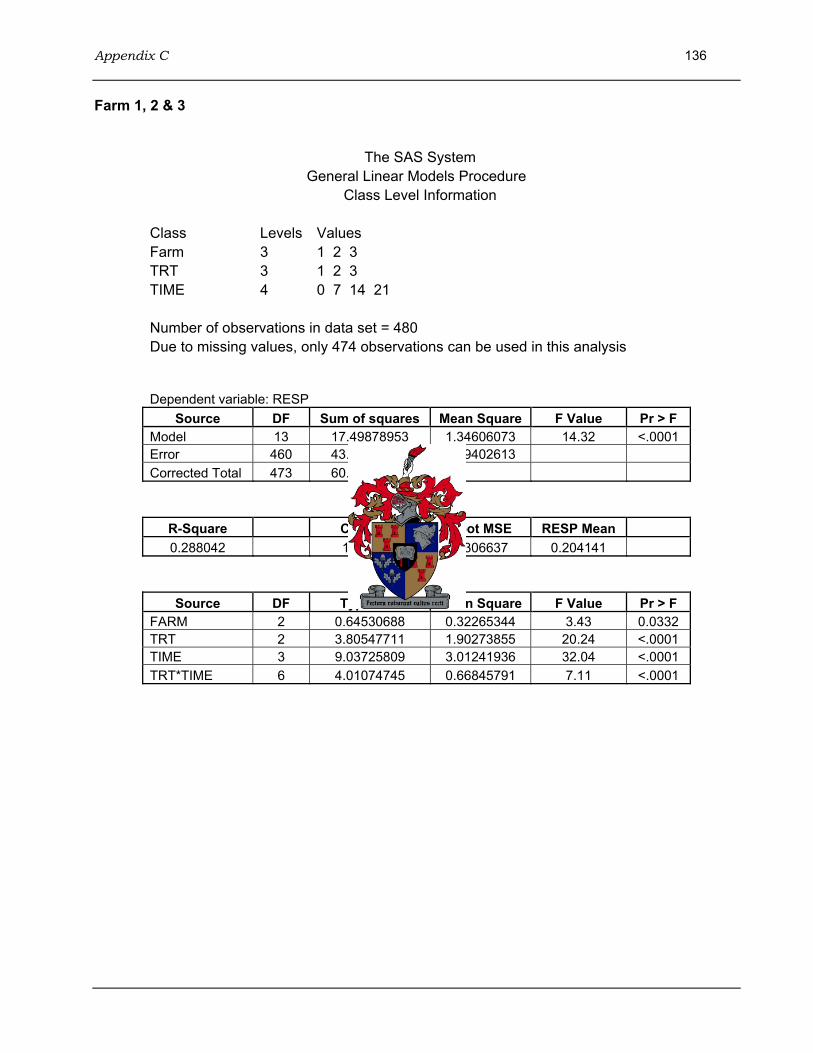
Appendix C 136
Farm 1, 2 & 3
The SAS System
General Linear Models Procedure Class Level Information Class Levels Values Farm 3 1 2 3 TRT 3 1 2 3 TIME 4 0 7 14 21 Number of observations in data set = 480 Due to missing values, only 474 observations can be used in this analysis Dependent variable: RESP
Source DF Sum of squares Mean Square F Value Pr > F Model 13 17.49878953 1.34606073 14.32 <.0001 Error 460 43.25201800 0.09402613 Corrected Total 473 60.75080753
R-Square Coeff Var Root MSE RESP Mean 0.288042 150.2081 0.306637 0.204141
Source DF Type I SS Mean Square F Value Pr > F FARM 2 0.64530688 0.32265344 3.43 0.0332 TRT 2 3.80547711 1.90273855 20.24 <.0001 TIME 3 9.03725809 3.01241936 32.04 <.0001 TRT*TIME 6 4.01074745 0.66845791 7.11 <.0001
Related Documents