PREDICTING PACKAGE DEFECTS: QUANTIFICATION OF CRITICAL LEAK SIZE by Matthew Joseph Gibney IV Thesis submitted to the Faculty of Virginia Polytechnic Institute and State University in partial fulfillment of the requirements for the degree of Master of Science in Food Science and Technology Dr. Joseph E. Marcy, Chair Dr. Cameron R. Hackney Dr. Barbara A. Blakistone Dr. Richey M. Davis June 30, 2000 Blacksburg, VA Keywords: threshold leak size, leakers, microbial ingress, package sterility, hermetic seal Copyright 2000, Matthew J. Gibney IV

Welcome message from author
This document is posted to help you gain knowledge. Please leave a comment to let me know what you think about it! Share it to your friends and learn new things together.
Transcript
PREDICTING PACKAGE DEFECTS: QUANTIFICATION OF CRITICAL LEAK SIZE
by
Matthew Joseph Gibney IV
Thesis submitted to the Faculty of Virginia Polytechnic Institute and State University in partial fulfillment of the requirements for the degree of
Master of Science
in
Food Science and Technology
Dr. Joseph E. Marcy, Chair
Dr. Cameron R. Hackney
Dr. Barbara A. Blakistone
Dr. Richey M. Davis
June 30, 2000
Blacksburg, VA Keywords: threshold leak size, leakers, microbial ingress, package sterility, hermetic seal
Copyright 2000, Matthew J. Gibney IV
ii
PREDICTING PACKAGE DEFECTS: QUANTIFICATION OF CRITICAL LEAK SIZE
Matthew Joseph Gibney IV
(ABSTRACT)
Threshold leak sizes and leak rates were calculated for a number of liquid food
products exhibiting a wide range of surface tension and viscosity values. From this data,
one can see that mathematically, under typical pressure differentials generated in food
packages (≤ ±34.5 kPa), a leak will never start through a 2 µm defect. The calculated
leak rates were compared to calculated evaporation rates. The evaporation rate exceeds
the leak rate at lower sized microholes (2, and 5 µm diameter) under typical pressure
differentials found in food packages. If the liquid, typically aqueous in food products, is
evaporating off faster than the leak itself, then there will be solids left behind that could
effectively plug the leak.
The critical leak size is the size micro-defect that allows microbial penetration
into the package. The critical leak size of air-filled defects was found to be 7 µm at all
pressures tested. This size is considerably important to food packagers because this is
when sterility of the package is lost. Previous leak studies have shown that the critical
leak size for liquid-filled defects coincide with the threshold leak size and pressure. If
this is in fact true, then air-filled defects should exhibit a larger critical leak size than the
liquid-filled defects. In this study, air-filled defects were examined. A bioaerosol
exposure chamber was used to test micro-defects, nickel microtubes of known diameters
2, 5, 7, 10, 20, and 50 µm hydraulic diameters, against pressure differentials of 0, -6.9, -
13.8, and -34.5 kPa.

iii
Acknowledgements
I would like to acknowledge my graduate committee members, Dr. Barbara Blakistone,
Dr. Richey Davis, and Dr. Cameron Hackney for being very insightful during the entire
research project. A special thanks goes to my graduate committee chairman Dr. Joe
Marcy for his advice and general wisdom. I would like to thank the Center for Aseptic
Packaging and Processing Studies (CAPPS) and the National Food Processors
Association (NFPA) for financial support of this project. I would like to thank Dr. Scott
Keller for all of his help, Harriet Williams, John Chandler, and Brian Smith for their help
with equipment. Thanks to Dr. George Lacy for the bacteria and to Dr. Hans Carter for
his expertise in biostatistics.
Thanks to the good folks in my office, Eric Suloff, Dan Martin, and Kali Phelps
for advice on homework and the thesis. Thanks to my good friends Valerie Green, Omid
Yamini, Paul Swanson, and Kristian Thor for the good times. Thanks to Selester Bennett
for both intellectual and not-so-intellectual conversation while puffing Excaliber stogies.
Thanks to my partners in music Cole Bolling, Jason Laughlin, and the wonderful voice of
Karen Creighton.
iv
TABLE OF CONTENTS
ABSTRACT.……………………………………………………………………………..ii
ACKNOWLEDGMENTS………………………………………………………………iii
LIST OF TABLES AND FIGURES…………………………………………………..vii
INTRODUCTION………………………………………………………………………..1
OBJECTIVES……………………………………………………………………………3
SECTION I LITERATURE REVIEW……………………………………………………………….4
Flexible and Semi-Rigid Packages………………………………………..4
Leakage Studies of Flexible Packages…………………………………….4
LEAKAGE……………………………………………………………...…………7
Leak Rate Specification…………………………………………………...8
Threshold Leak Size……………………………………………………….8
FLUID FLOW……………………………………………………………………10
Physical Properties of a Fluid……………………………………………10
Density…………………………………………………………………...11
Viscosity…………………………………………………………….……11
Surface Tension….………………………………………………………12
LEAKAGE EQUATIONS………………………………….……………………13
Threshold Leak Equation………………………………………………...13
Hagen-Poiselle Volumetric Flow Rate Equation……...…………………14
Evaporation Rate Equations……………………………………………...15
v
LEAK DETECTION METHODS……………………………………………….18
Visual Inspection…………………………………………………………18
Bubble Testing……………………………………………………...……18
Pressure/Vacuum Decay Testing………………………………………...19
Dye Penetration Testing………………………………………………….19
Chemical Tracer Testing…………………………………………………20
Electroconductivity and Capacitance Testing……………………………20
Helium Leak Testing………………………………………..……………20
Ultrasonic Leak Testing…………………………………….……………21
MICROBIAL CHALLENGE TESTING………………………………………...21
Immersion Biotesting…………………………………………………….22
Static Ambient Biotesting………………………………………………..22
Bioaerosol Testing……………………………………………………….22
BIOAEROSOLS…………………………………………………………………23
Bioaerosol Particle Size…………………………………………………24
Bioaerosol Particle Behavior…………………………………………….25
BASIC MECHANICS OF BIOAEROSOL MOVEMENT……………………...26
Brownian Motion………………………….……………………………..26
Thermophoresis……………………………………………..……………26
Turbulent Convection……………………………………………………26
Gravitational Sedimentation……………………………………………..27
PROBABILITY OF BIOAEROSOL ENTERING MICROTUBE………………28
Diffusive Flux of Bioaerosol in Still Air………………………………...28
vi
Convection of Bioaerosol Particle due to Air Flow……………………...28
REFERENCES…………………………………………………….……………………30
SECTION II ABSTRACT………………………………………………………………………..……36 INTRODUCTION………………………………………………………………………37
MATERIALS AND METHODS………………………………………………………39 RESULTS AND DISCUSSION………………………………………………..………52 CONCLUSIONS………………………………………………………..………………64 REFERENCES……………………………………………………….…………………65 VITA……………………………………………………………………..………………70
vii
LIST OF TABLES AND FIGURES
TABLES
Table 1 – Number of seconds required for one bacteria (s/CFU) to impact the microtube
of hydraulic diameter, Dh, due to air-flow into the microtube caused by pulling
a vacuum of 6.9, 13.8,or 34.5 kPa……………………………………….……29
Table 2 – Threshold pressures as calculated by equation {1} (31), in kPa, of products
with surface tension, σ, at each microtube hydraulic diameter (50, 20, 10, 7, 5,
and 2 µm)………….………………………………………………………..…53
Table 3 – Comparison of the experimentally observed values of the threshold leak
pressures (kPa) and the values calculated using the threshold leak pressure
equation {2} of soy sauce, wine, and deionized water using microtubes with
hydraulic diameters of 5, 10, and 50 µm……………………………………...54
Table 4 – Evaporation rates (cm3/day) at 80% relative humidity and room temperature,
calculated using equation {4} for liquids with varying soluble solids content
having a droplet radius of 25 µm and water activity of Aw………….………..58
Table 5 – Threshold leak pressure, PL, of Butterfield’s phosphate buffer for each
hydraulic diameter of microtube and volumetric flow rate, Q, of Butterfield’s
phosphate buffer. Units of cm3/exposure is the volume leaking through the
microtube during the 30 minute exposure…………………………………….61
Table 6 – Number of positives out of three replicates for microbial ingress at each
imposed pressure (0, -6.9, -13.8, and -34.5 kPa) for each microtube hydraulic
diameter (0, 2, 5, 7, 10, 20, and 50 µm)..…………………………………….61
viii
Table 7 – Critical Leak Size of an air-filled microtube at imposed pressures (0, -6.9,
-13.8, and -34.5 KPa). An ‘X’ represents at least one positive out of 3
replicates. A ‘-‘ represents zero positives……………………………………63
Table 8 – Critical Leak Sizes at different imposed pressures for a liquid-filled microtube
(31). The ‘X’ represents at least one positive out of 9 replicates and the ‘-‘
represents zero positives out of 9 replicates………………………………….63
FIGURES:
Figure 1– Graph of the threshold leak pressures at increasing hydraulic diameters of
deionized water, white Zinfandel wine, 2% milk, and safranin red dye. The
surface tension of these products is in order from highest (water) to lowest
(dye)…………………………………………………………………...………55
Figure 2 – Flow rate of deionized water through a 10 µm microhole. As calculated from
the Hagen-Poiselle flow rate equation {3}……………………………………56
Figure 3 – Flow rate of deionized water through a 20 µm microhole. As calculated from
the Hagen-Poiselle flow rate equation {3}……………………………………57
Figure 4 – Flow rate calculated using equation {3}, and evaporation rate calculated
using equation {4}, of water through a 2 µm microhole at room temperature
and 80% relative humidity. The shaded area represents evaporation. Any bar
that lies totally within the shaded area means that the evaporation rate
surpasses the flow rate. In this case, all flow rates are not fast enough to allow
leakage to occur………………………………………………………………59
ix
Figure 5 – Flow rate calculated using equation {3}, and evaporation rate calculated
using equation {4}, of water through a 5 µm microhole at room temperature
and 80% relative humidity. The shaded area represents evaporation. Any bar
that lies totally within the shaded area means that the evaporation rate
surpasses the flow rate. In this case, all flow rates are faster than the
evaporation rate, except the 1.72 KPa and 3.45 kPa pressure
differentials……………………………………………………………………59
1
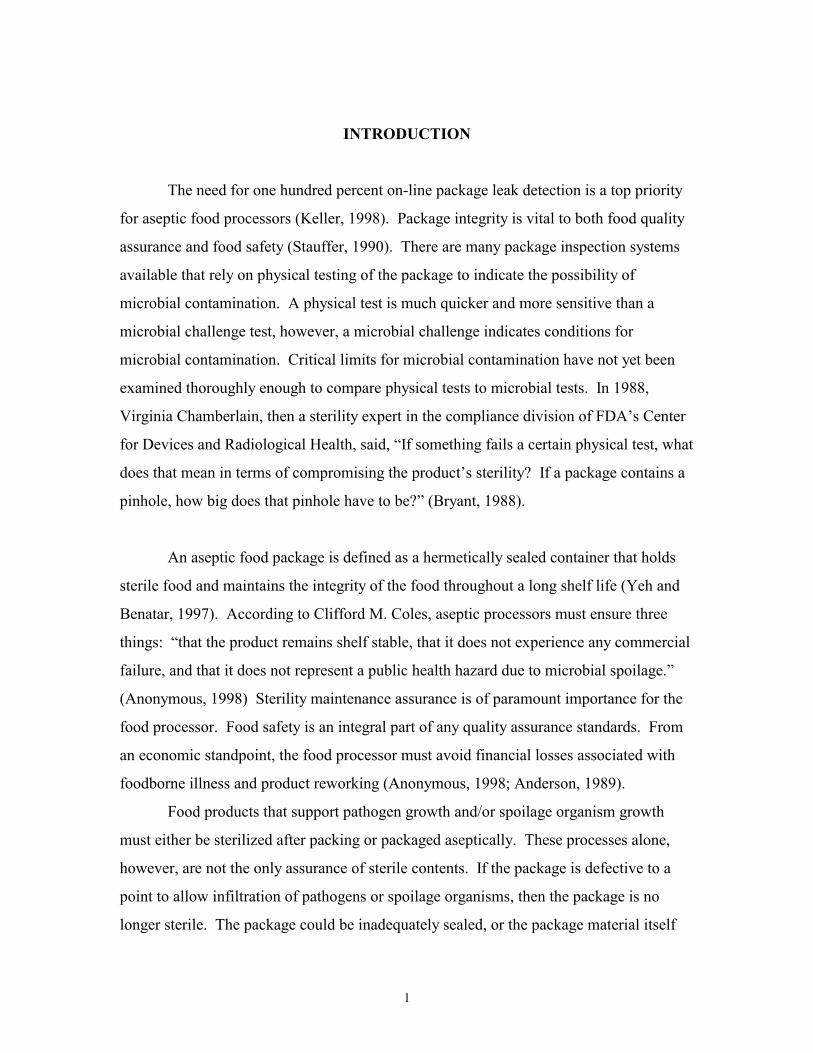
INTRODUCTION
The need for one hundred percent on-line package leak detection is a top priority
for aseptic food processors (Keller, 1998). Package integrity is vital to both food quality
assurance and food safety (Stauffer, 1990). There are many package inspection systems
available that rely on physical testing of the package to indicate the possibility of
microbial contamination. A physical test is much quicker and more sensitive than a
microbial challenge test, however, a microbial challenge indicates conditions for
microbial contamination. Critical limits for microbial contamination have not yet been
examined thoroughly enough to compare physical tests to microbial tests. In 1988,
Virginia Chamberlain, then a sterility expert in the compliance division of FDA’s Center
for Devices and Radiological Health, said, “If something fails a certain physical test, what
does that mean in terms of compromising the product’s sterility? If a package contains a
pinhole, how big does that pinhole have to be?” (Bryant, 1988).
An aseptic food package is defined as a hermetically sealed container that holds
sterile food and maintains the integrity of the food throughout a long shelf life (Yeh and
Benatar, 1997). According to Clifford M. Coles, aseptic processors must ensure three
things: “that the product remains shelf stable, that it does not experience any commercial
failure, and that it does not represent a public health hazard due to microbial spoilage.”
(Anonymous, 1998) Sterility maintenance assurance is of paramount importance for the
food processor. Food safety is an integral part of any quality assurance standards. From
an economic standpoint, the food processor must avoid financial losses associated with
foodborne illness and product reworking (Anonymous, 1998; Anderson, 1989).
Food products that support pathogen growth and/or spoilage organism growth
must either be sterilized after packing or packaged aseptically. These processes alone,
however, are not the only assurance of sterile contents. If the package is defective to a
point to allow infiltration of pathogens or spoilage organisms, then the package is no
longer sterile. The package could be inadequately sealed, or the package material itself
2
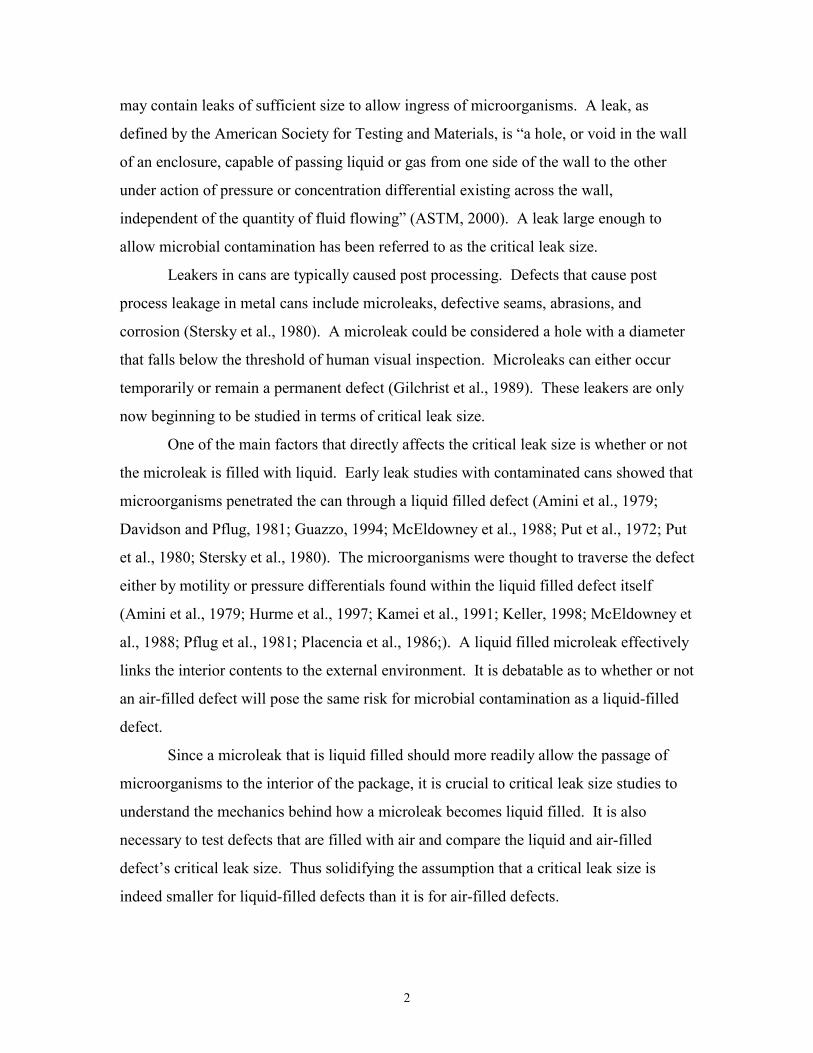
may contain leaks of sufficient size to allow ingress of microorganisms. A leak, as
defined by the American Society for Testing and Materials, is “a hole, or void in the wall
of an enclosure, capable of passing liquid or gas from one side of the wall to the other
under action of pressure or concentration differential existing across the wall,
independent of the quantity of fluid flowing” (ASTM, 2000). A leak large enough to
allow microbial contamination has been referred to as the critical leak size.
Leakers in cans are typically caused post processing. Defects that cause post
process leakage in metal cans include microleaks, defective seams, abrasions, and
corrosion (Stersky et al., 1980). A microleak could be considered a hole with a diameter
that falls below the threshold of human visual inspection. Microleaks can either occur
temporarily or remain a permanent defect (Gilchrist et al., 1989). These leakers are only
now beginning to be studied in terms of critical leak size.
One of the main factors that directly affects the critical leak size is whether or not
the microleak is filled with liquid. Early leak studies with contaminated cans showed that
microorganisms penetrated the can through a liquid filled defect (Amini et al., 1979;
Davidson and Pflug, 1981; Guazzo, 1994; McEldowney et al., 1988; Put et al., 1972; Put
et al., 1980; Stersky et al., 1980). The microorganisms were thought to traverse the defect
either by motility or pressure differentials found within the liquid filled defect itself
(Amini et al., 1979; Hurme et al., 1997; Kamei et al., 1991; Keller, 1998; McEldowney et
al., 1988; Pflug et al., 1981; Placencia et al., 1986;). A liquid filled microleak effectively
links the interior contents to the external environment. It is debatable as to whether or not
an air-filled defect will pose the same risk for microbial contamination as a liquid-filled
defect.
Since a microleak that is liquid filled should more readily allow the passage of
microorganisms to the interior of the package, it is crucial to critical leak size studies to
understand the mechanics behind how a microleak becomes liquid filled. It is also
necessary to test defects that are filled with air and compare the liquid and air-filled
defect’s critical leak size. Thus solidifying the assumption that a critical leak size is
indeed smaller for liquid-filled defects than it is for air-filled defects.
3
Previous research has linked the critical leak size of a micro-defect to the size
micro-defect that allows initiation of leakage at a particular pressure (Keller, 1998). An
equation was developed that shows that the initiation of a leak is dependent on the surface
tension of the liquid food product as well as the micro-defect size (Keller, 1998).
The first objective of this research was to quantify threshold leak pressures and
leak rates for liquid food products with a wide range of surface tensions, viscosities,
densities, and package size. This will allow the threshold leak size to be calculated for
typical internally generated pressures in the package.
The second objective of this research was to biotest air filled defects with a
bioaerosol exposure chamber to compare threshold leak size and critical leak size. Since
the critical leak size has been linked to the threshold leak size by bioaerosol testing
liquid-filled defects and comparing them to the threshold leak size (Keller, 1998), it is
necessary to test whether an air-filled defect will have a different critical leak size.
4
SECTION I
LITERATURE REVIEW
Flexible and Semi-Rigid Packages
Flexible and semi-rigid packages were developed as an alternative to cans. They
are generally constructed of layers of polymer, foil, and/or paperboard. Different
combinations of these materials yield different strength and flexibility profiles.
Flexible package applications have increased dramatically in the food and medical
industry. Packaging experts estimate that 50 to 70% of all recalls of medical devices are
due to packaging defects (Bryant, 1988). Early suggestions for the packaging leakers
included wrinkles in the seal area, or holes in the packaging material itself (Lampi, 1980).
It has also been rationalized that a defect can either occur temporarily or remain a
permanent defect. This is very common in flexible packages, in which an intentionally
formed pinhole can reduce in size due to the flexibility of the package (Gilchrist et al.,
1989).
Typically, in a flexible package, the seal area is coated with a heat sealable
coating. These films can be bonded together by the application of heat. The seal area is
where most leaks would be expected to occur. Leak studies done on the quality of
peanuts indicated that the rancidity was cause by increased oxygen levels entering the
package through leaks in the seal (Goode and Soutar, 1995). A wrinkle in the seal area
may form a channel leaker because the leaker length is significantly larger than the
diameter.
Leakage Studies of Flexible Packaging
Post-process contamination of cans and retort pouches is a major concern for food
safety and spoilage (Put et al., 1972). A study in 1983 showed that bacteria typically
contaminating the recycled cooling water of a still retort are of the Clostridium species
(Thompson, 1983). The early studies provided some guidelines on how to properly
handle packages after processing to avoid post-process contamination.

5
The correlation between post-process contamination with handling and storage
conditions was proved by testing the effect of post-process handling procedures on wet
and dry containers (Michels and Schram, 1979). Using holes punched with a needle of
100 µm diameter, it was shown that the incidence of post-process contamination was
90% if the package was manually removed from the retort and stored wet. The
occurrence of post-process contamination dropped sharply to 10% if the container was
removed manually while wet, then dried before storage. The contamination rate
decreased to less than 1% if the packages were cooled in chlorinated water and dried
before removal and storage (Michels and Schram, 1979).
Most of the early sterility assurance tests used the immersion biotest, in which a
package filled with food or bacterial media is submerged in a bath of bacteria. After a
given amount of time, the interior of the package is tested for bacterial penetration. The
concentration of bacteria used in an immersion biotest also dictates the probability of
microbial ingress (Anema and Schram, 1980; Blakistone et al., 1996). Using 100 µm
diameter holes, it was shown that the percentage of contaminated packages decreases
when the bacterial concentration decreases (Anema and Schram, 1980).
The pressure differential between the inside and outside of the container was
considered to be another factor involved in microbial infiltration. Early studies showed
that a can with a headspace vacuum of 400 mm Hg is more prone to microbial
contamination than one that is equilibrated to the atmosphere (Put et al., 1972). A study
in 1988 also showed this situation, as the number of bacteria passing through a filter with
a pore size of 5 µm increased as a vacuum was applied (Bankes and Stringer, 1988). This
study was also confirmed in a later study using a variety of pore sizes for the filter system
(McEldowney and Fletcher, 1990a). The higher the viscosity of the liquid in the
container being tested the lower the bacterial contamination rate. This is because the
actual flow rate is so slow that the highly viscous liquid could not reach the outside of the
package, thus it did not form a complete liquid channel (McEldowney and Fletcher,
1990b).
Early attempts at linking physical leak detection tests to microbial biotests in
flexible packages have failed to produce reproducible results. These failures can be
6
attributed to the deformity of flexible package material. When a micro-sized defect is
intentionally manufactured in this material, the flexibility of the package can either
increase or decrease the microhole size that was originally produced. This was the case
when an immersion biotest was compared to a fluorescent dye test and a helium test
(Gilchrist et al., 1989). The initial microhole sizes of the package ranged from 17 to 175
µm either formed by using a laser or a metal rod to drill through flexible retort pouches.
The fluorescent dye and helium tests both indicated leakage far more reliably than the
immersion biotest. Taken at face value, the critical leak size looked like it was 20 µm,
even though negatives for microbial ingress appeared at larger defect sizes. The question
as to why the microbial test did not match the physical tests was answered when the
defects were measured after the test. The initial hole sizes had all decreased by varying
degrees (Gilchrist et al., 1989). So when did the bacteria actually leak into the package?
It could have been at any size during the test knowing that the material is flexible.
The critical leak size for optimal microbial penetration could only be found using
a straight defect that does not change significantly in shape or size during a biotest. To
address this problem, an immersion biotest was done using semi-rigid aseptic cup lids
and retort trays with laser-drilled holes of diameters ranging from 10 - 20 µm. Microbial
ingress was found down to the 10 µm hole, so there cannot be a quantitative statement as
to what the critical leak size actually is (Hurme et al., 1997).
A package will never encounter such harsh conditions that are typically used in
immersion biotesting where the concentration of bacteria can approach 109 CFU/ml
(Guazzo, 1994). A newer test method that more closely represents conditions that a
package might experience is the spray cabinet - bioaerosol exposure method (Reich,
1985; Placencia et al., 1986; Chen et al., 1991; Guazzo, 1994; Keller et al., 1995, 1996,
1998).
In 1991, an immersion biotest was compared to a spray cabinet biotest (Chen et
al., 1991). The pinhole orifices were 5, 10, and 15 µm in diameter and made of a nickel
alloy with a specific pinhole through the middle. The spray cabinet results indicated
leakage at all micro-orifice sizes, however, the immersion method proved to be less
sensitive than the spray cabinet method (Chen et al., 1991). These results could be
7
attributed to the threshold leak pressure not being surpassed for each micro-orifice size in
the immersion test. The spray cabinet, however, was believed to generate a pressure on
the outside of the micro-orifices, thus aiding in microbial penetration (Chen et al., 1991).
The critical leak size was suggested to fall below 10 µm from examining results
from an immersion biotest done using nickel microtubes of 10 and 20 µm of lengths 5
and 10 mm sealed into plastic pouches tested against bacterial concentrations of 102
CFU/ml and 106 CFU/ml (Blakistone et al., 1996). The test concentration of 106 CFU/ml
was found to be significant for microbial ingress of motile organisms. The same
concentration was found to be significant using a bioaerosol exposure chamber testing the
same pouches with the same nickel microtube sizes (Keller et al., 1996).
The bioaerosol exposure method was also employed to study the critical leak size
of liquid-filled defects using nickel microtubes with known, unchanging diameters down
to 2 µm (Keller, 1998). The critical leak size was found to be the same as the threshold
leak size at the threshold leak pressure (Keller, 1998). There were also experiments to
determine the effect of motility and size of bacteria on the critical leak size. Three
different bacteria, Pseudomonas fragi Lacy-1052, Bacillus atrophaeus, and Enterobacter
aerogenes, were used. There were no significant differences found between the species
used and the critical leak size (Keller, 1998).
LEAKAGE
A leaker is a package that has a hole of sufficient size to allow passage of fluid
from the inside of the package across the wall of the package. The driving force of
leakage of liquids and gases is the pressure differential across the leak (Morton, 1987;
Guazzo, 1994).
Leakage is described in units of volume passing through the leak per unit time.
Typically, the units of measure used to indicate leakage rates are standard cubic
centimeters per second (std cm3/s). A std cm3/s means that the leak rate is for a quantity
of fluid at 1 atmosphere (101.3 kPa, 14.7 psi) and 20°C. Gas leakage requires the
pressure to be specified because gas is a compressible fluid. An increase in pressure of a
8
gas results in a significant volume change. Another common unit for gas leakage is
Pascal cubic meters per second (Pa⋅m3/s). Since liquid is an incompressible fluid, the
pressure term is not required and the leakage rate can be simply specified by volume over
time. The conversion factor of Pa·m3/s to cm3/s is 9.87. The research presented here uses
cm3/s, which is exactly equal to ml/s.
Leak Rate Specification
There are three different flow patterns associated with leakage. The most rapid
leakage is characterized by turbulent flow, followed by laminar flow, and the slowest leak
rate called molecular flow. Each of these different flow patterns is characterized by
different flow rates and shown below using gas flow rate units (Pa·m3/s). Turbulent flow
rates are typically greater than 10-3 Pa·m3/s (Anonymous, 1982; Morton, 1987). The
leakage rate for laminar flow is between 10-2 Pa·m3/s and 10-7 Pa·m3/s (Amini et al.,
1979; Anonymous, 1982; Eisenberg, 1979; Loeb, 1961; Morton, 1987). The equations
used for laminar flow rates are also applicable to the movement of liquid through
capillaries. Molecular flow is below 10-6 Pa·m3/s (Anonymous, 1982; Morton, 1987).
This type leakage is so slow that it only describes the leakage of gases (Guazzo, 1994).
For the microleaks that are considered in this paper (< 50 µm), the flow is laminar.
Turbulent flow is too fast and molecular flow is too slow.
A package is considered leak free when the leak rate is occurring below an
established leak rate specification. It has been argued that if a leak is so small that no
liquid can pass through, then no microorganisms will be able to pass through either
(Morton, 1989). With this frame of thinking, the lowest leak rate that could allow
microbial penetration into a package would be close to 10-5 Pa·m3/s (Anonymous, 1982).
Threshold Leak Size
Since a microleak that is liquid filled should more readily allow the passage of
microorganisms to the interior of the package (Amini et al., 1979; Hurme et al., 1997;
Kamei et al., 1991; McEldowney et al., 1988; Pflug et al., 1981; Placencia et al., 1986;
Keller, 1998), it is crucial to critical leak size studies to understand the mechanics behind
9
how a microleak becomes liquid filled (Keller, 1998). By mathematically modeling leak
situations, threshold leak sizes and threshold leak pressures can be theoretically described
for various packages and liquid food products. The threshold leak size is considered the
smallest size microhole that allows a liquid to leak from a package (Keller, 1998). This
term is different from the critical leak size although the critical leak size is generally the
same size as the threshold leak size. The threshold leak pressure is the pressure required
to initiate liquid flow into the microhole (Keller, 1998).
Once the leak is initiated, the liquid must flow through the defect at a rate that
exceeds the rate of evaporation of the liquid (Davis, 1999; Keller, 1998). This is quite
important with microleaks because the leakage rate is usually so slow that the liquid will
evaporate leaving solids behind that effectively block the flow, thus resealing the leak.
The direction of the flow is also very important. The pressure differential from
the inside of the package to the outside determines the flow rate and more importantly,
the direction of flow. Food packages can have positive pressure or negative pressure
(vacuum) inside the package. If the sum pressure on the inside of the package is greater
than the sum pressure on the outside of the package, then flow will be from the inside to
the outside (positive flow). If the sum pressure on the inside is less than the sum pressure
on the outside than the flow will be in the opposite direction (negative flow). This
“negative” flow is important in retort cooling water operations where the package is
cooled in a bath of water. The cooling water creates a vacuum on the inside of the
package as heat is lost and the gas on the inside of the package compresses. This results
in the ingress of cooling water into the package if a leak is present. If the cooling water is
contaminated with microorganisms, then the package sterility is jeopardized (Michels and
Schram, 1979; Put et al., 1972).
To quantify the initiation of flow, the flow rate (including the direction of flow),
and the evaporation rate of various liquid food products leaking from different packages,
a basic understanding of fluid flow mechanics is needed.
10
FLUID FLOW
A fluid can be defined as a material that continuously deforms under the
application of shear stress. The rate of deformation is proportional to the shear stress,
which means that it flows. When the stress is removed, the fluid does not retain nor
attempt to retain its original shape.
When a force acts perpendicular to a surface, it is termed normal stress, or
pressure. When a force acts parallel to the surface, the stress is considered shear stress.
The reaction of materials to shear stress lends to the broad categorization of materials as
plastic, elastic and fluid.
When shear stress is applied to a plastic material, it deforms continuously, the rate
of deformation being proportional to the shear stress, thus it flows. However, when the
stress is removed, the material partially recovers to its original shape. An elastic solid, on
the other hand, undergoes finite deformation, in other words, it does not flow. Upon
removal of the stress, the elastic solid returns to its original shape.
Both liquids and gases are considered fluid. Liquids are called incompressible
fluids because when normal stress (pressure) is applied to it there is no appreciable
volume change. A gas is called a compressible fluid because an increase in pressure
results in a significant volume change.
Physical Properties of a Fluid
The macroscopic properties of a fluid reflect its underlying molecular structure.
There are some physical properties that are very significant in indicating how a fluid
reacts to applied forces. The forces that are of prime interest in fluid mechanics are the
density, viscosity and surface tension. Other properties are not as closely coupled to fluid
motion.
11
Density
The density of a fluid is defined as the ratio of the fluid’s mass to its volume. The
symbol ρρρρ typically represents the property of density. It is usually expressed in kg/m3.
The density of a fluid determines the acceleration of a volume of fluid. Fluids of low
density, gases, accelerate more readily than high-density fluids, liquids, when the same
force is applied to the same volume. This is why it is more difficult to wade through
water than it is to walk through air.
The density of a fluid is a function of its temperature and pressure. If pressure is
held constant and the temperature is increased, then the density decreases because a fixed
mass of fluid expands with the increasing temperature. The opposite of this also holds
true. If the temperature is held constant and the pressure is increased, then the density
increases.
A hydrometer can be used to measure the specific gravity of a liquid. The specific
gravity is simply a ratio of the density, ρρρρ, of a liquid to the density of water at 4ºC, ρρρρref.
The density of water at this temperature is at its maximum and heating above or cooling
below this temperature causes the water to expand. If a hydrometer is used for density
measurements, then the specific gravity can be multiplied by the ρρρρref to obtain the density
of the fluid.
Viscosity
Viscosity, µµµµ, is the resistance of the internal layers of fluid to flow. One method
of understanding viscosity is through a basic experiment. A fluid filling a space h
between two parallel plates is subject to a simple shearing motion. The upper plate
moves with a speed V while the lower plate remains stationary. If the force, γγγγ, required to
move a plate at a speed, V, is measured, then it is seen that γγγγ is proportional to V and
inversely proportional to h for any given fluid. However, there is a proportionality
constant that is different for each fluid tested. This proportionality constant is referred to
as the viscosity, µµµµ.
12
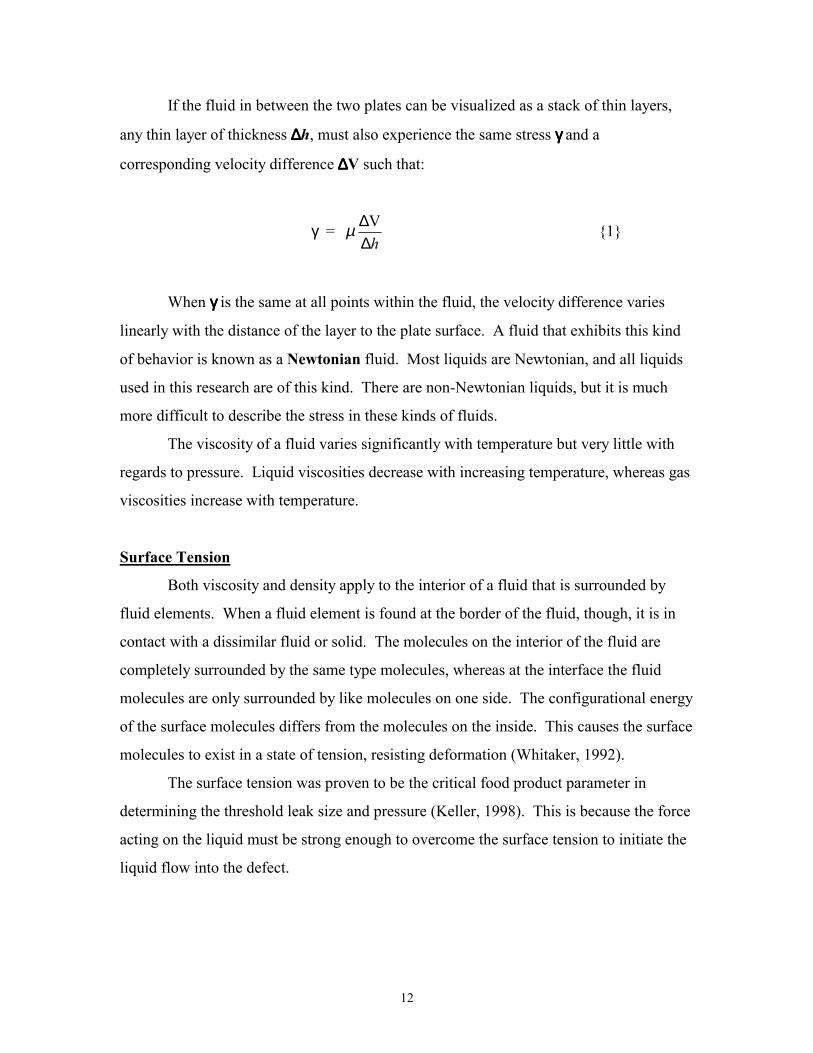
If the fluid in between the two plates can be visualized as a stack of thin layers,
any thin layer of thickness ∆∆∆∆h, must also experience the same stress γγγγ and a
corresponding velocity difference ∆∆∆∆V such that:
γ = h∆
∆Vµ {1}
When γγγγ is the same at all points within the fluid, the velocity difference varies
linearly with the distance of the layer to the plate surface. A fluid that exhibits this kind
of behavior is known as a Newtonian fluid. Most liquids are Newtonian, and all liquids
used in this research are of this kind. There are non-Newtonian liquids, but it is much
more difficult to describe the stress in these kinds of fluids.
The viscosity of a fluid varies significantly with temperature but very little with
regards to pressure. Liquid viscosities decrease with increasing temperature, whereas gas
viscosities increase with temperature.
Surface Tension
Both viscosity and density apply to the interior of a fluid that is surrounded by
fluid elements. When a fluid element is found at the border of the fluid, though, it is in
contact with a dissimilar fluid or solid. The molecules on the interior of the fluid are
completely surrounded by the same type molecules, whereas at the interface the fluid
molecules are only surrounded by like molecules on one side. The configurational energy
of the surface molecules differs from the molecules on the inside. This causes the surface
molecules to exist in a state of tension, resisting deformation (Whitaker, 1992).
The surface tension was proven to be the critical food product parameter in
determining the threshold leak size and pressure (Keller, 1998). This is because the force
acting on the liquid must be strong enough to overcome the surface tension to initiate the
liquid flow into the defect.
13
LEAKAGE EQUATIONS
Threshold Leak Equation
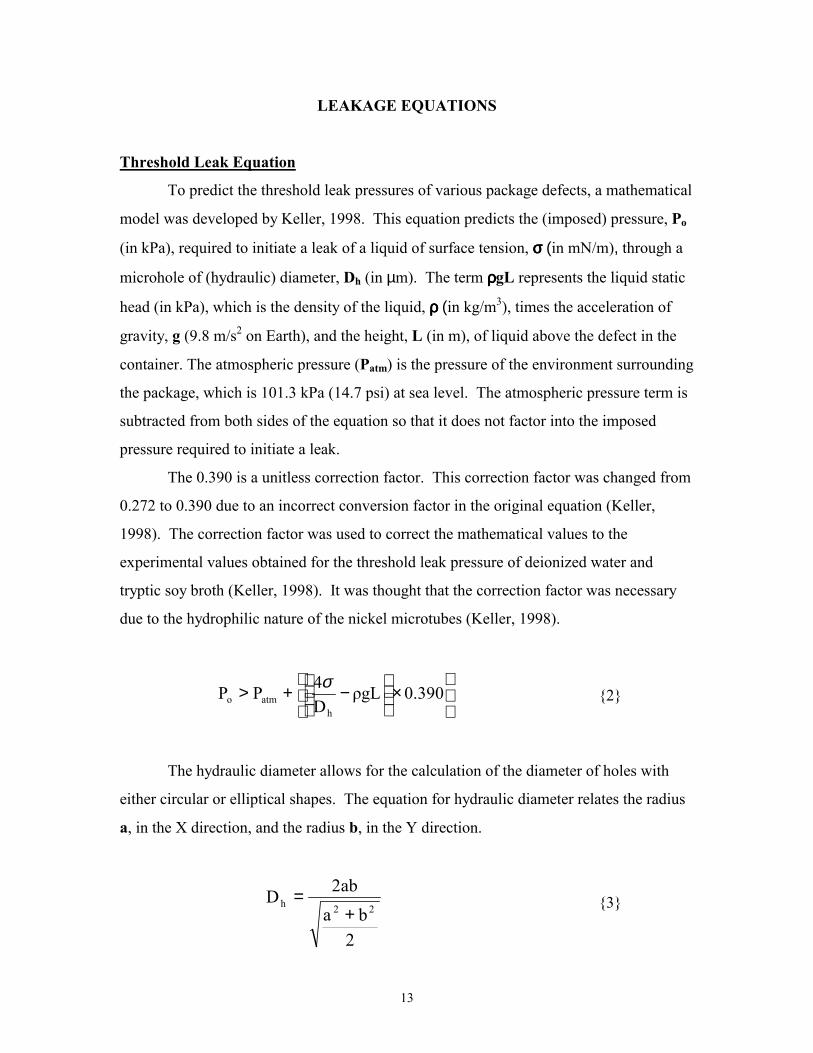
To predict the threshold leak pressures of various package defects, a mathematical
model was developed by Keller, 1998. This equation predicts the (imposed) pressure, Po
(in kPa), required to initiate a leak of a liquid of surface tension, σσσσ (in mN/m), through a
microhole of (hydraulic) diameter, Dh (in µm). The term ρρρρgL represents the liquid static
head (in kPa), which is the density of the liquid, ρ ρ ρ ρ (in kg/m3), times the acceleration of
gravity, g (9.8 m/s2 on Earth), and the height, L (in m), of liquid above the defect in the
container. The atmospheric pressure (Patm) is the pressure of the environment surrounding
the package, which is 101.3 kPa (14.7 psi) at sea level. The atmospheric pressure term is
subtracted from both sides of the equation so that it does not factor into the imposed
pressure required to initiate a leak.
The 0.390 is a unitless correction factor. This correction factor was changed from
0.272 to 0.390 due to an incorrect conversion factor in the original equation (Keller,
1998). The correction factor was used to correct the mathematical values to the
experimental values obtained for the threshold leak pressure of deionized water and
tryptic soy broth (Keller, 1998). It was thought that the correction factor was necessary
due to the hydrophilic nature of the nickel microtubes (Keller, 1998).
×
−+> 390.0ρgL
D4PP
hatmo
σ {2}
The hydraulic diameter allows for the calculation of the diameter of holes with
either circular or elliptical shapes. The equation for hydraulic diameter relates the radius
a, in the X direction, and the radius b, in the Y direction.
2ba
ab2D22h
+= {3}
14
Hagen-Poiselle Volumetric Flow Rate Equation
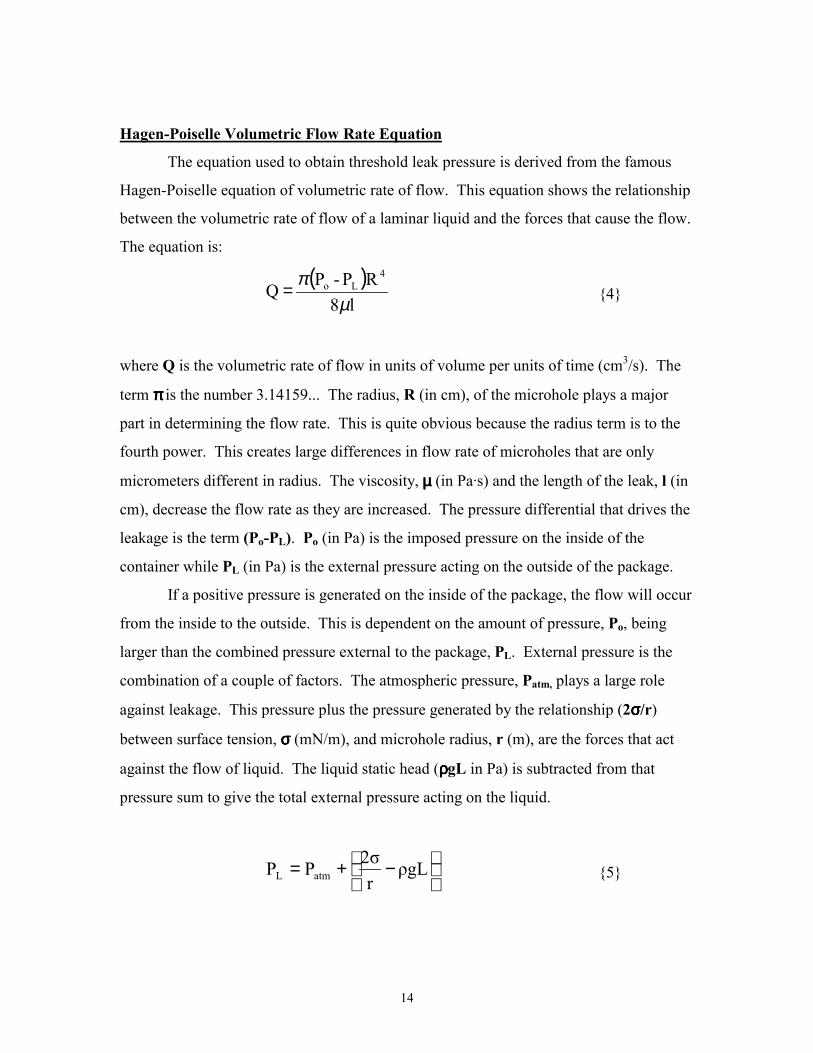
The equation used to obtain threshold leak pressure is derived from the famous
Hagen-Poiselle equation of volumetric rate of flow. This equation shows the relationship
between the volumetric rate of flow of a laminar liquid and the forces that cause the flow.
The equation is:
( )
l8RP-PQ
4Lo
µπ= {4}
where Q is the volumetric rate of flow in units of volume per units of time (cm3/s). The
term ππππ is the number 3.14159... The radius, R (in cm), of the microhole plays a major
part in determining the flow rate. This is quite obvious because the radius term is to the
fourth power. This creates large differences in flow rate of microholes that are only
micrometers different in radius. The viscosity, µµµµ (in Pa·s) and the length of the leak, l (in
cm), decrease the flow rate as they are increased. The pressure differential that drives the
leakage is the term (Po-PL). Po (in Pa) is the imposed pressure on the inside of the
container while PL (in Pa) is the external pressure acting on the outside of the package.
If a positive pressure is generated on the inside of the package, the flow will occur
from the inside to the outside. This is dependent on the amount of pressure, Po, being
larger than the combined pressure external to the package, PL. External pressure is the
combination of a couple of factors. The atmospheric pressure, Patm, plays a large role
against leakage. This pressure plus the pressure generated by the relationship (2σσσσ/r)
between surface tension, σσσσ (mN/m), and microhole radius, r (m), are the forces that act
against the flow of liquid. The liquid static head (ρρρρgL in Pa) is subtracted from that
pressure sum to give the total external pressure acting on the liquid.
−+= ρgL
r2σPP atmL {5}
15
The Hagen-Poiselle equation for volumetric flow rate not only determines the
flow rate, but also the direction of the flow. This is due to the pressure differential term
(Po-PL). If the pressure on the inside is greater than the combined pressures on the
outside, then the difference will be positive, indicating that the flow is from the inside to
the outside of the package. Another possibility is if the external pressures are larger than
the internal pressure of the package. The negative pressure differential draws liquid or air
surrounding the package into the package. The third alternative is for there to be no flow
in either direction. This will occur at the threshold pressure, when (Po-PL) = 0.
Evaporation Rate Equations
Evaporation should play a major role in the critical leak size determination for
various products. Mathematically, the leak rates tend to be so small that the leak rate
sometimes does not even surpass the evaporation rate of water. If this happens, it is
believed that soluble solids will remain after all of the liquid has evaporated and will
block the flow of liquid through the defect.
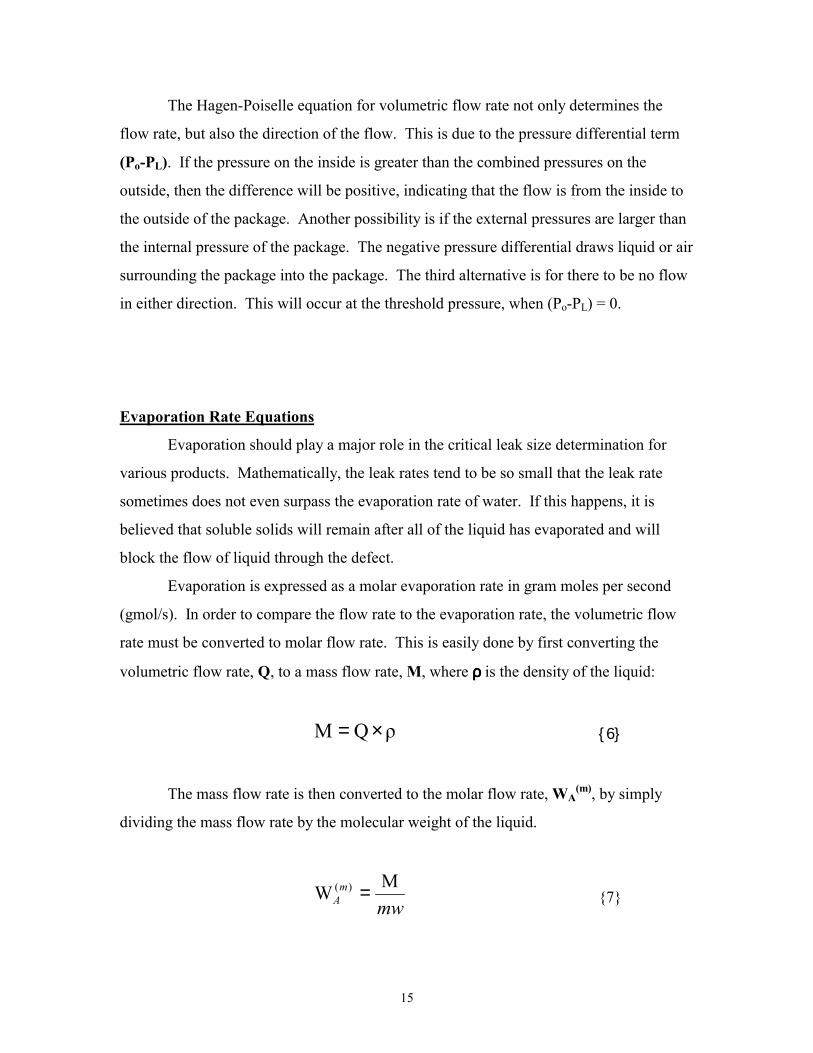
Evaporation is expressed as a molar evaporation rate in gram moles per second
(gmol/s). In order to compare the flow rate to the evaporation rate, the volumetric flow
rate must be converted to molar flow rate. This is easily done by first converting the
volumetric flow rate, Q, to a mass flow rate, M, where ρρρρ is the density of the liquid:
ρQM ×= {6}
The mass flow rate is then converted to the molar flow rate, WA(m), by simply
dividing the mass flow rate by the molecular weight of the liquid.
mwm
AMW )( = {7}
16
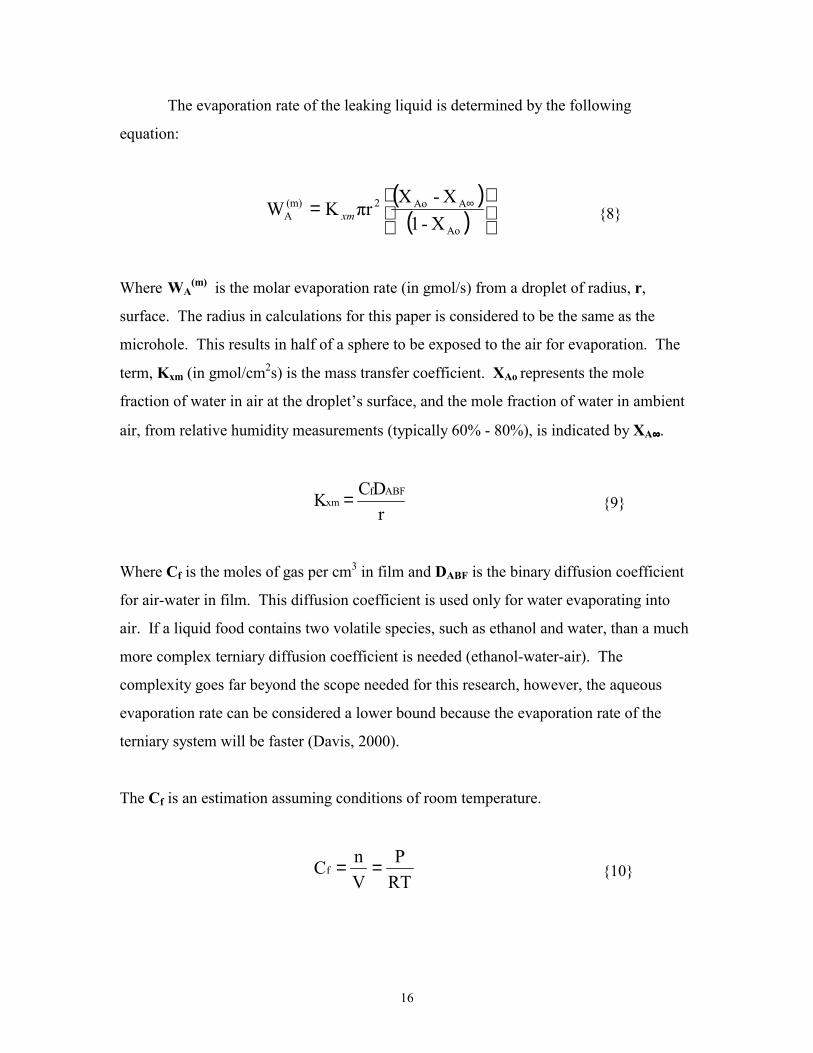
The evaporation rate of the leaking liquid is determined by the following
equation:
( )
( )
= ∞
Ao
AAo2(m)A X-1
X-XπrKW xm {8}
Where WA(m) is the molar evaporation rate (in gmol/s) from a droplet of radius, r,
surface. The radius in calculations for this paper is considered to be the same as the
microhole. This results in half of a sphere to be exposed to the air for evaporation. The
term, Kxm (in gmol/cm2s) is the mass transfer coefficient. XAo represents the mole
fraction of water in air at the droplet’s surface, and the mole fraction of water in ambient
air, from relative humidity measurements (typically 60% - 80%), is indicated by XA∞∞∞∞.
r
DCK ABFfxm = {9}
Where Cf is the moles of gas per cm3 in film and DABF is the binary diffusion coefficient
for air-water in film. This diffusion coefficient is used only for water evaporating into
air. If a liquid food contains two volatile species, such as ethanol and water, than a much
more complex terniary diffusion coefficient is needed (ethanol-water-air). The
complexity goes far beyond the scope needed for this research, however, the aqueous
evaporation rate can be considered a lower bound because the evaporation rate of the
terniary system will be faster (Davis, 2000).
The Cf is an estimation assuming conditions of room temperature.
RTP
VnCf == {10}
17
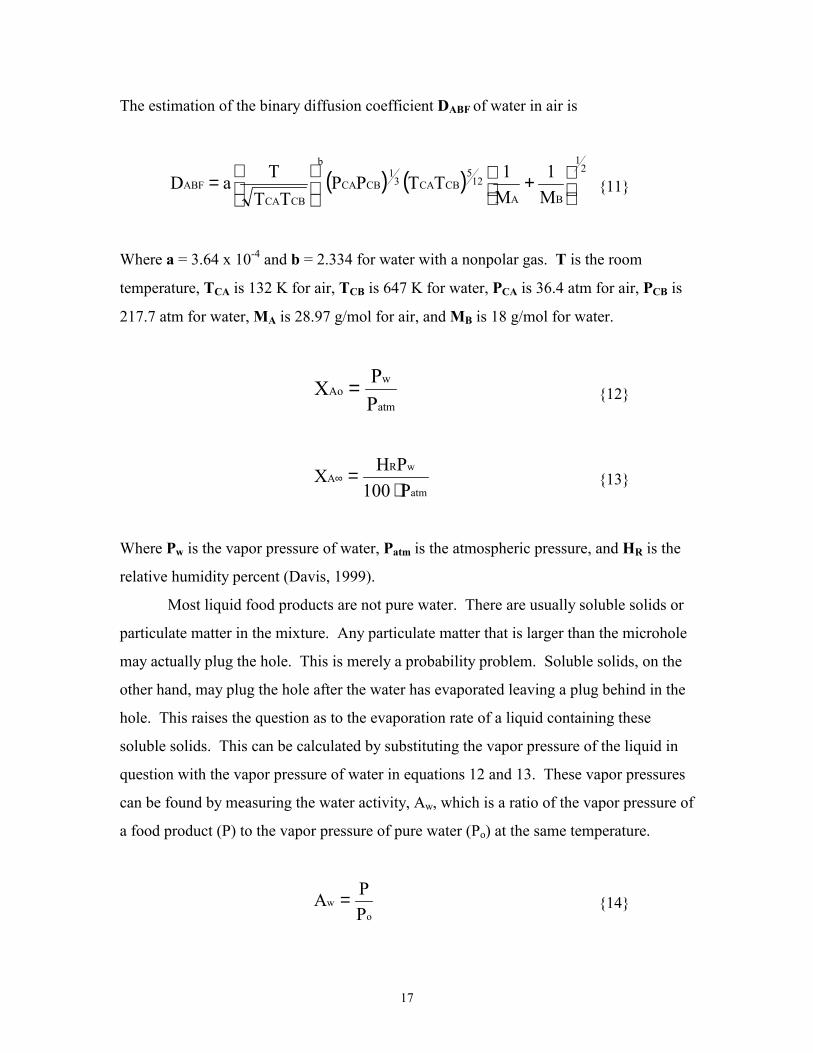
The estimation of the binary diffusion coefficient DABF of water in air is
( ) ( )2
1
BA
125
CBCA31
CBCA
b
CBCAABF
M1
M1TTPP
TTTaD
+
= {11}
Where a = 3.64 x 10⁻⁴ and b = 2.334 for water with a nonpolar gas. T is the room
temperature, TCA is 132 K for air, TCB is 647 K for water, PCA is 36.4 atm for air, PCB is
217.7 atm for water, MA is 28.97 g/mol for air, and MB is 18 g/mol for water.
atm
wAo
PPX = {12}
atm
wRA
P100PHX⋅
=∞ {13}
Where Pw is the vapor pressure of water, Patm is the atmospheric pressure, and HR is the
relative humidity percent (Davis, 1999).
Most liquid food products are not pure water. There are usually soluble solids or
particulate matter in the mixture. Any particulate matter that is larger than the microhole
may actually plug the hole. This is merely a probability problem. Soluble solids, on the
other hand, may plug the hole after the water has evaporated leaving a plug behind in the
hole. This raises the question as to the evaporation rate of a liquid containing these
soluble solids. This can be calculated by substituting the vapor pressure of the liquid in
question with the vapor pressure of water in equations 12 and 13. These vapor pressures
can be found by measuring the water activity, Aw, which is a ratio of the vapor pressure of
a food product (P) to the vapor pressure of pure water (Po) at the same temperature.
ow
PPA = {14}
18
LEAK DETECTION METHODS
Nondestructive leak testing equipment relies on physical testing methods because
of their fast test speed, reliability, and repeatability. Most of the current on-line leak
testing equipment is based on a variation of the pressure decay test (Kelsey, 1990). A
package is enclosed in an air tight chamber, the air around the package is evacuated, and a
pressure-transducer system measures any change in the package internal pressure.
Ultrasonic leak detection equipment is becoming very favorable to food packagers
because it can detect leaks at least as small as 1 µm and operates at the speed of sound
(Kelsey, 1990; Jarrosson, 1992). There are other laboratory physical tests that are even
more sensitive such as the tracer gas leak and helium leak test (Guazzo, 1994; Morton,
1987; Gilchrist et al., 1985). Dye penetration tests, chemical tracer tests and bubble tests
are the most popular destructive leak tests performed in the laboratory (Guazzo, 1994;
Hackett, 1996; Morton, 1987; Gilchrist, 1989).
Visual Inspection
This is by far the least sensitive method of leak detection. A human leak inspector
looks for leaks on the package. The obvious limitation of visual leak inspection is the
human ocular resolution, which has been indicated at 50 µm (Morris, 1999; Harper et al.,
1995). Human visual inspection also is prone to operator skill variability, fatigue and
error (Morris, 1999). Generally speaking, human visual leak inspection has a sensitivity
of 10-2 Pa·m3/s (Morton, 1987; Guazzo, 1994). There is simply not enough sensitivity
with this inspection method to be solely relied on in an industrial food packaging line.
Bubble Testing
The bubble test is a quick and inexpensive way to determine if a leak is present.
The bubble test gives a rough estimate of the leak rate by immersing the container in a
water bath that may or may not contain detergent to aid in bubble formation and then
counting the number of bubbles that emanate from a hole during a certain period of time.
19
The number of bubbles can be approximated to a volume and then divided by the time in
seconds. The sensitivity of this test ranges between 10-2 Pa·m3/s and 10-6 Pa·m3/s
depending on the length of time allowed for observation, the differential pressure applied,
the lighting, background contrast and whether a pressure or vacuum is applied (Guazzo,
1994). The bubble test cannot be used as a 100% leak detection test for food packages
because of package wetting (Morton, 1987).
Pressure/Vacuum Decay Testing
The pressure decay test identifies leakers by applying a pressure or vacuum to the
package and then measuring the pressure change within the container. Typically a
vacuum is applied. This causes the package to “balloon out” if there are no large leaks
present. This test is usually used as a quick test for seal integrity and is the most common
test used for on-line nondestructive leak testing (Kelsey, 1990). The sensitivity of this
test method is about 10-5 Pa·m3/s (Morton, 1987).
Dye Penetration Testing
The dye penetration test is a test that uses suitable dyes that penetrate surface
discontinuities to enable the defect to be visible. The dye used may be either detected
visually, by microscopy, or by UV illumination. Typically, the dye powder is solubilized
in a solvent of low surface tension and viscosity. This allows the dye to rapidly penetrate
the leak by capillary action. The package can either be submerged in the dye solution and
pulling a vacuum or imposing a pressure (Morton, 1987), or the dye can be applied to the
outside of the package in a suspected leakage area. Another dye test sometimes used is to
inject the dye into the package and allow it to settle to the lowest edge of the container,
then the dye will flow into a defect by liquid static head pressure (Hackett, 1996).
The dye test is considered a qualitative test, although it has been reported to have
a sensitivity of 10-7 Pa·m3/s (Morton, 1987). This may be too sensitive of a test if it is
being used to detect packages that may lose their hermetic seal. Theoretically, microbial
penetration should not occur if the leakage rate is below 10-5 Pa·m3/s (Guazzo, 1994).
20
The high sensitivity can be obtained by adding a detergent that lowers the surface tension
of the dye solution. A common detergent used is Triton X-100 at a concentration that
does not exceed its critical micelle formation concentration. This is the point at which
increasing the concentration of detergent does not further decrease the surface tension
(Hackett, 1996).
Chemical Tracer Testing
This test is similar to the dye penetration test, in that a chemical solution is
applied to one side of the package then tested for on the other side. These tests are more
sensitive than a dye test because detection techniques as sensitive as HPLC can be used.
Short-lived radionuclides such as technetium 99 and chromium 51 have also been used
for sensitive leak detection experiments (Butler et al., 1977)
Electroconductivity and Capacitance Testing
This method involves applying a high frequency voltage to the package. Any
liquid in a defect will increase the conductivity of the electricity. It is claimed to detect
pinholes down to 0.5 µm diameter (Guazzo, 1994). An electrical capacitance test
functions in much the same way. A small electrical charge is applied to the container,
any liquid present in a defect results in a greater dielectric constant reading than if no
liquid was present (Guazzo, 1994).
Helium Leak Testing
Gas leak detection tests are similar to the chemical tracer tests. The gas is applied
to one side of the container and is probed for on the other side. The gas test is much more
sensitive than a liquid test. Helium is the only gas that can leak through the smallest of
defects. It is so sensitive that it can sometimes be confused with diffusion of helium
through a material (Guazzo, 1994).
A leak test method using hydrogen as a tracer gas was used to detect microholes
down to at least 10 µm which was the lowest size microhole used in the experiment
(Hurme et al., 1998). It was also shown that the sensitivity and testing speed can be
21
increased if the concentration of hydrogen is increased. Using helium as a leak detection
method, micro-sized holes down to at least 1 µm were detected (Gilchrist et al., 1985).
The high sensitivity of the helium test method should be able to predict nano-sized holes.
Ultrasonic Leak Testing
Ultrasonic leak testing is done with a device that directs high frequency
soundwaves into the package material. Any discontinuity on the surface and subsurface
will cause the soundwave to be reflected. It has been said that the ultrasonic leak testers
can detect a leakers down to at least 1 µm diameter (Jarrosson, 1992). Since this test
makes use of soundwaves, the ultrasonic detection is the speed of sound, the testing
speed, of an entire package, is limited by the scanning equipment speed and the size of
the package (Jarrosson, 1992).
MICROBIAL CHALLENGE TESTING
Microbial challenge testing indicates the possibility of microbial contamination.
Containers filled with product or culture media are exposed to microorganisms and then
evaluated for sterility. Microbial challenge tests are obviously destructive, and could
never be used to test a package before sending it out to a consumer. There are three basic
variations of microbial challenge tests: immersion, static ambient, and bioaerosol
(Guazzo, 1994).
The microbial challenge test is what has been used in many studies to determine
conditions for post-process contamination and critical leak size (Anema and Schram,
1980; Bankes and Stringer, 1988; Chen et al., 1991; Hurme et al., 1997; Gilchrist et al.,
1989; Keller, 1998; McEldowney et al., 1988; McEldowney and Fletcher, 1990; Michels
and Schram, 1979; Put et al., 1972; Put et al., 1980; Stersky et al., 1980; Blakistone et al.,
1996; Keller et al., 1996).
22
Immersion Biotesting
Immersion biotesting consists of immersing a suspect leaker into a temperature
controlled water bath that contains a high concentration of indicator microorganisms.
The concentration of test organisms can be greater than 108 CFU/ml (Guazzo, 1994;
Keller, 1998; Jarrosson, 1992;). This concentration would never be found bombarding
the package during its normal shelf life. Therefore the immersion test is not a real world
scenario. Leakers are usually pre-screened for the immersion biochallenge by a simple
bubble test (Put et al., 1980).
Static Ambient Biotesting
Static ambient tests involve placing the product or media-filled packages in
storage and evaluating them over time for sterility. This is typically performed using
packaged culture media taken from the filling validation run for an aseptically filled
product (Guazzo, 1994). This type of biotest is the most similar to the conditions that a
package may encounter during its shelf life, however, it is not practical because of its
time consumption. However, in order to mimic the actual conditions a static ambient test
was done over the course of 7 - 14 days to determine sensory and microbial distribution
within aseptic packages containing artificial pinholes of 0.2 - 0.3 mm diameter (Kamei,
1991).
Bioaerosol Testing
A newer test method that more closely represents conditions that a package might
experience is the spray cabinet, bioaerosol exposure method (Reich, 1985; Placencia et
al., 1986; Chen et al., 1991; Guazzo, 1994; Keller et al., 1995, 1996, 1998). Bioaerosol
testing is swiftly moving to replace immersion biotesting. The bioaerosol represents a
closer match to the conditions that an aseptic package would face during its shelf life than
the immersion test (Blakistone et al., 1996; Guazzo, 1994).
A bioaerosol test is a test intended to mimic conditions that are typically
encountered by a package. A spray cabinet exposure chamber is used for the biotest. In
23
this spray cabinet is placed the sample. Then a suspension of bacteria at a known
concentration is aerosolized into the exposure chamber. It is important for the bacteria to
be evenly distributed throughout the exposure chamber to assure that all test surfaces of
the sample are bombarded by the same amount of bioaerosol. The method of bioaerosol
exposure used in this research is the dispersion of an aerosol of mean particle size 2.68
µm containing 106 CFU/ml motile Pseudomonas fragi Lacy-1052 into a test chamber of
6,125 cm3 for a period of 35 min (Keller, 1998).
BIOAEROSOLS
Bioaerosols, as defined by the American Conference of Governmental Industrial
Hygienists, are airborne particles, large molecules or volatile compounds that are living,
contain living organisms or were released from living organisms (Kowalski et al., 2000).
This definition includes pollen, spores, viruses, and bacteria. Since these are the main
types of living organisms that comprise bioaerosols, the size range of bioaerosols
typically falls between 0.01 µm to 100 µm diameter.
Bacteria can replicate while in a bioaerosol droplet (Dimmick et al., 1979). This
is not a large concern for this research because there is not enough time in the test to
allow replication. When the aerosol particle is approximately 4 - 6 µm, more than one
cell division occurred (Dimmick et al., 1979). The median aerodynamic particle size of
bioaerosols collected at a wastewater spray irrigation site was measured at 5 µm (Bausum
et al., 1982).
Bioaerosols are found in nature at low concentrations. However, there are
conditions that may increase the concentration of pathogenic organisms in the bioaerosol
mixed microbial population. Enteric microorganisms have been detected by air
monitoring procedures as far as 1,200 m from a wastewater treatment facility (Teltsch et
al., 1980). Also, there has been an increased incidence of enteric disease among residents
who reside in close proximity to a sewage treatment plant. This has been associated with
bioaerosols emanating from the wastewater treatment plant (Teltsch et al., 1980).
24
The bioaerosol concentrations in swine and poultry confinement areas was found
to be as high and sometimes higher than the concentrations found at a wastewater
treatment plant (Clark et al., 1983). Bioaerosols also have the ability to travel great
distances in air currents. Bacterial spores from the Black Sea area were found as far away
as Sweden and Finland (Bovallius et al., 1978).
In a food processing plant, bioaerosol concentrations can increase quite sharply
due to various processing methods used. A study in 1982 found that airborne levels of
bacteria at a poultry plant shackling line reached up to 6.5x10⁵ cfu/m3 (Lenhart et al.,
1982). Bioaerosol levels of bacteria in a food processing plant operating with concurrent
sanitation were measured to be 850 to 2500 cfu/m3. This was almost 10 times greater
than the plate counts for the production alone without concurrent sanitation. It was
believed that sanitation pressure washing was the major cause for the elevated levels of
bioaerosols (Sheehan and Giranda, 1994).
Bioaerosol Particle Size
The size of bioaerosol particles is generally indicated by an average or median
diameter. With an air flow of 8 L/min and the nebulizer set-up with all ports closed, the
mass median aerodynamic diameter of the particles is 2.68 µm. The radius is half of that,
1.34 µm, and, using the equation for volume of a sphere, the volume of the particle is
10.08 µm3. The density of a typical bioaerosol particle is approximately 1.1 g/ cm3 from
which the mass of the particle can be calculated at 1.11 x 10⁻¹¹g.
The bioaerosol particle is being considered a sphere for the basic calculations
necessary to predict the impact of a particle on the microtube opening. Most of the theory
used in aerosol particle physics is based on the assumption that the particle is spherical
(Leith, 1987; Hoppel and Frick, 1986). For aerosol particles, however, most are not
spheres. Among the shapes that are easiest to define, one might find and aerosol particle
in the shape of spheroids, needles, lenses, hemispheres, hollow spherical caps, toroids,
and rods; however, it has been said that most aerosols found in nature actually have much
more indescribable shapes. These intricate shapes make it impossible to calculate the
exact behavior of these particles (Leith, 1987). That is why, in this paper, the bioaerosol
25
particles are being considered as spheres for the purpose of a ball-park prediction of
impact probability.
Bioaerosol Particle Behavior
An aerosol is a system of small particles dispersed throughout a gaseous phase.
There are many mathematical explanations of aerosol behavior that can predict the nature
of the aerosolized particle. These calculations are quite tedious and are beyond the scope
of this research. However, the basic calculations are used to give a ball-park probability
of impact of a bioaerosol particle on the microtube opening.
To determine what kind of basic kinetics an aerosol particle may have, a
benchmark, unitless number, the Knudsen number, was developed. Very small particles
have Knudsen numbers that are greater than 1.0 and larger aerosol particles, such as
bioaerosols, have Knudsen numbers that are far below 1.0. When the Knudsen number is
as small as it typically is for bioaerosols (Gnanasekharan and Floros, 1995; Kowalski et
al., 2000), the particle diameter is much greater than the mean free path. The Knudsen
number is the ratio of the mean free path (λλλλ) and the radius of the particle (Rp).
pR
Kn λ= {15}
The mean free path is the average distance between collisions for gas molecules or
the much larger aerosol particles. The calculation takes into account the average relative
velocity between the particles, which is 2 times the amount of collisions achieved than
if the target particle were stationary. The mean free path equation depends on the
temperature (T, in Kelvins) and pressure (P in kPa) as well as the particle diameter (d in
meters). The universal gas constant, R, has a value of 8.3145 J/mol·K and Avogadro’s
Number, NA, is 6.0221 x 10²³ particles/mol (Nave, 2000).
PNd
RA
22T
πλ = {16}
26
BASIC MECHANICS OF BIOAEROSOL MOVEMENT
Brownian Motion
Brownian motion is the movement of micro-particles in an irregular path. Albert
Einstein explained Brownian motion as a response of larger suspended molecules to
impacts from the moving molecules of the fluid medium (Cutnell and Johnson, 1995).
For very small aerosol particles, Brownian motion is an important factor in the diffusion
of the particle through the air as it settles due to gravity. This diffusion of the small
particle through the air is not a straight path down, due to the Brownian motion.
Many of the initial studies of larger aerosol particle deposition neglect the
influence of inertia as well as Brownian motion (Pich, 1972). Given that the size of
bioaerosols is larger than most other aerosolized particles, Brownian motion does not play
a major role in the particle’s diffusion through the air, therefore it is neglected in the
impact probability calculations. The behavior of bioaerosols is described as transport due
to gravitational settling, thermophoresis, and turbulent convection.
Thermophoresis
Movement of bioaerosols can also be caused by thermal gradients. Particles can
move from high temperatures to low temperatures (Keller, 1998). Since the bioaerosol
exposure chamber is equilibrated to room temperature and the bioaerosol itself is room
temperature, there is no noticeable diffusion due to a temperature gradient because there
is simply no temperature differences in the chamber.
Turbulent Convection
Turbulent convection occurs when a bioaerosol particle may break out of the
laminar flow of air due to a curved or angled surface (Kowalski et al., 2000). This type of
diffusion is not being considered in the impact probability because the impact probability
is being calculated as if the conditions are stagnant. The reason is because the
concentration of bioaerosol in the exposure chamber takes 30 min to reach the target
27
concentration of 106 CFU/cm3, followed by a 5 min period of no bioaerosol influx. The
change in concentration during the initial 30 min cannot be easily added into the
equations. Since a ball-park figure is all that is required the initial 30 min increasing
concentration is being added to the 5 min stagnant concentration yielding the
concentration of bioaerosol to be estimated at 106 CFU/cm3 for 30 min.
Gravitational Sedimentation
Gravitational sedimentation is the transport due to gravity. This is the main factor
affecting the bioaerosol particles in the exposure chamber. Assuming laminar flow
conditions and using Stoke’s law, the equation to determine the gravitational settling
velocity (Vgs in cm/s) is (Gnanasekharan and Floros, 1995):
airµπ p
pgs
R6gm V = {17}
Where Rp is the radius of the bioaerosol particle (1.34 µm), µµµµair is the viscosity of air
(1.85 x 10⁻⁵ kg/m·s), g is the acceleration due to gravity (9800 cm/s2), and mp is the mass
of the bioaerosol particle (1.11 x 10⁻¹¹g). These factors result in a gravitational settling
velocity of 0.02 cm/s. This number can be converted to 8 x 10⁻⁶ cm3/s and since there are
approximately 106 cfu/cm3, that is a sedimentation rate of 8 cfu/s or 0.125 s/cfu. The
exposure section is 7 cm in height, and the microtubes, on average, extend 1 cm from the
floor of the exposure section. This means that it will take 300 s (5 min) for the topmost
particles to fall to the bottom where the microtubes are situated.
28
PROBABILITY OF BIOAEROSOL ENTERING MICROTUBE
Diffusive Flux of Bioaerosol in Still Air
The diffusive flux in stagnant air conditions of a particle down a microtube was
calculated to be 2 x 10⁻⁶ CFU/s. This number is quite low considering that if the inverse
is taken, then it would take 5 x 10⁵ s/CFU for one particle to move down a microtube of
7 mm length by 50 µm diameter. The calculation of the diffusive flux is according to
Fick’s Law (Davis, 2000).
LC-NA
∆∆= D {18}
Where ∆C is the difference in concentration of bacteria in the exposure chamber and in
the microtube. Since one bacteria is all that is needed in the microtube for sterility
compromise, ∆C is 106 CFU. The ∆L is the length of the microtube (7 mm). The
diffusion coefficient of the bioaerosol particle in still air, D, is calculated using viscosity,
µ, the radius of the microtube, R, and kT being equal to 4.11 x 10⁻⁴ J/mol,
R6kTπµ
=D {19}
Convection of Bioaerosol Particle due to Air Flow
The major factor involved in the initial ingress of one bioaerosol particle is the air
speed that the vacuum is pulling through the microhole, Qair . These velocities are quite
low considering the microscopic sizes of the microtube diameters. The calculation is
based on the Hagen-Poiselle volumetric flow rate equation {3} where the viscosity term,
µµµµ, is the viscosity of air (1.85 x 10⁻⁵ kg/m·s, which is equal to 1.85 x 10⁻⁵ Pa·s) and the
29
pressure differential, (Po - PL), is the imposed vacuum in pascals. The number of bacteria
that this air flow rate can pull into the microtube, MB in CFU/s, is calculated as
BairB CQM ⋅= {18}
Where CB is the concentration of bacteria, 106 CFU/cm3. The inverse of this number
equals the number of seconds that it takes for one bacteria to enter the microtube, t*
(s/CFU). Table 1 shows how many seconds are required for one CFU to impact upon the
microtube hydraulic diameter due to the air flow into the microtube caused by pulling a
vacuum of magnitude 6.9, 13.8, and 34.5 kPa. The equilibrium pressure (0 kPa)
mathematically shows zero impaction due to air flow, because there is no air flow at
exactly 0 psi. The actual pressure differential may be slightly higher or lower due to
pressure fluxuations (± 0.42 kPa) in the exposure chamber.
Table 1 – Number of seconds required for one bacteria, (s/CFU), to impact the microtube of hydraulic diameter due to air-flow into the microtube caused by pulling a vacuum of 6.9, 13.8, or 34.5 kPa.
IMPOSED VACUUM Hydraulic -6.9 kPa -13.8 kPa -34.5 kPa
Diameter (µµµµm) (s/CFU) (s/CFU) (s/CFU) 2 4.8E+01 2.4E+01 9.6E+00 5 1.2E+00 6.1E-01 2.5E-01 7 3.2E-01 1.6E-01 6.0E-02 10 8.0E-02 4.0E-02 2.0E-02 20 4.8E-03 2.4E-03 9.6E-04 50 1.2E-04 6.1E-05 2.5E-05
30
REFERENCES
Amini, M. A., and D. R. Morrow. 1979. Leakage and permeation: theory and practical applications. Package Dev. and Sys. May/June: 20-27.
Anderson, G. L. 1989. Leak testing. p.50-57. In 9th ed. Nondestructive evaluation and quality control: metals handbook. AOAC, Arlington, VA.
Anema, P. J., and B. L. Schram. 1980. Prevention of post-process contamination of semi-rigid and flexible containers. J. Food Prot. 43(6):461-464.
Anonymous. 1982. Leak Testing. In Nondestructive testing handbook, vol. 1. American Society for Nondestructive Testing, American Society for Metals.
Anonymous. 1998. An interview with Clifford M. Coles: advantages of sterility testing for aseptically processed foods. Food Testing & Analysis. Aug-Sep, 1998.
ASTM. 2000. Standard terminology for nondestructive examinations. standard no. E1316-99a. In American Society for Testing and Materials. West Conshohocken, PA. Bankes, P., and M. F. Stringer. 1988. The design and application of a model system to investigate physical factors affecting container leakage. Int. J. Food Micro. 6:281-286.
Bausum, H. T., S. A. Schaub, K. F. Kenyon, and M. J. Small. 1982. Comparison of coliophage and bacterial aerosols at a wastewater spray irrigation site. Appl. Environ. Microbiol. 43(1):28-38.
Blakistone, B. A., S. W. Keller, J. E. Marcy, G. H. Lacy, C. R. Hackney, and W. H. Carter, Jr. 1996. Contamination of flexible pouches challenged by immersion biotesting. J. Food Prot. 59(7):764-767.
Bovallius, A., B. Bucht, R. Roffey, and P. Anas. 1978. Long-range air transmission of bacteria. Appl. Environ. Microbiol. 35(6):1231-1232.
Bryant, M. 1988. Packaging failures: quality in design doesn’t end with the finished product. Med. Dev. & Diag. Ind. 10(8):30-33.
Butler, L. D., J. J. Coupal, and P. P. DeLuca. 1978. The detection of ampul leakers using short-lived radionuclides. Journal of the Parenteral Drug Association. 32(1): 2-9.
Chen, C., B. Harte, C. Lai, J. Pestka, and D. Henyon. 1991. Assessment of package integrity using a spray cabinet technique. J. Food Prot. 54(8):643-647.
31
Clark, S. R. Rylander, and L. Larsson. 1983. Airborne bacteria, endotoxin and fungi in dust in poutry and swine confinement buildings. Am. Ind. Hyg. Assoc. J. 44(7):537-541.
Cutnell, J. D., and K. W. Johnson (ed.). 1995. Physics 3rd ed. John Wiley and Sons, Inc. New York.
Davidson, P. M., and I. J. Pflug. 1981. Leakage potential of swelled cans of low-acid foods collected from supermarkets. J. Food. Prot. 44(9):692-695.
Davis, R. M. 1999. Personal Communication. Associate Professor, Chemical Engineering, Virginia Polytechnic Institute and State University, Blacksburg, VA.
Davis, R. M. 2000. Personal Communication. Associate Professor, Chemical Engineering, Virginia Polytechnic Institute and State University, Blacksburg, VA.
Dimmick, R. L., H. Wolochow, and M. A. Chatigny. 1979. Evidence for more than one division of bacteria within airborne particles. Appl. Environ. Microbiol. 38(4):642-643.
Eisenberg, D., and D. M. Crothers. 1979. Physical chemistry with applications to the life sciences. p.726. Benjamin/Cummings Publishing Co. Menlo Park, CA.
Gilchrist, J. E., U. S. Rhea, R. W. Dickerson, and J. E. Campbell. 1985. Helium leak test for micron-sized holes in canned foods. J. Food Prot. 48(10):856-860.
Gilchrist, J. E., D. B. Shah, D. C. Radle, and R. W. Dickerson, Jr. 1989. Leak detection in flexible retort pouches. J. Food Prot. 52(6):412-415.
Gnanasekharan, V., and J. D. Floros. 1995. A theoretical perspective on the minimum leak size for package integrity evaluation. p.55-65. In B. A. Blakistone, and C. L. Harper (eds.). Plastic package integrity testing - assuring seal quality. IOPP. Herndon, VA.
Goode, Jr., J. E., and A. M. Souter. 1995. Rancidity in Packaged nuts: end-use technical service. J. Plastic Film and Sheeting. 11(7):235-247.
Guazzo, D.M. 1994. Package Integrity Testing, p. 247-276. In M. J. Akers (ed.), Parenteral quality control: sterility, pyrogen, particulate, and package integrity testing, 2nd ed Mercel Dekker, New York.
Hackett, E. T. 1996. Dye penetration effective for detecting package seal defects. Packag. Tech. Eng. 8:49-52.
32
Harper, C. L., B. A. Blakistone, J. B. Litchfield, S. A. Morris. 1995. Developments in food packaging integrity testing. Trends in Food Sci. and Technol. 6(10):336-340.
Hoppel, W. A., and G. M. Frick. 1986. Ion-aerosol attachment coefficients and the steady-state charge distribution on aerosols in a bipolar ion environment. Aerosol Sci. and Technol. 5:1-21.
Howard, G., and R. Duberstein. 1980. A case of penetration of 0.2 mm rated membrane filters by bacteria. J. Parenter. Drug Assoc. 34(2):95-102.
Hurme, E. U., G. Wirtanen, L. Axelson-Larsson, N. A. M. Pachero, and R. Ahvenainen. 1997. Penetration of bacteria through microholes in semirigid aseptic and retort packages. J. Food Prot. 60(5):520-524.
Hurme, E. U., and R. Ahvenainen. 1998. A nondestructive leak detection method for flexible food packages using hydrogen as a tracer gas. J. Food Prot. 61(9):1165-1169.
Jarrosson, B. P. 1992. Closure integrity testing of heat sealed aseptic packaging using scanning acoustic microscopy. M.S. Thesis, Virginia Polytechnic Institute and State University, Blacksburg, VA.
Kamei, T., J. Sato, A. Natsume, and K. Noda. 1991. Microbiological quality of aseptic packaging and the effect of pinholes on sterility of aseptic products. Pack. Technol. and Sci. 4:185-193.
Keller, S., J. E. Marcy, B. A. Blakistone, and G. H. Lacy. 1995. Package integrity biotesting: aerosol versus immersion. In T. Ohlsson (ed.). Proceedings of the International Symposium Advances in Aseptic Processing and Packaging Technologies. SIK, Goteborg, Sweden.
Keller, S., J. E. Marcy, B. A. Blakistone, G. H. Lacy, C. R. Hackney, and W. H. Carter, Jr. 1996. Bioaerosol exposure method for package integrity testing. J. Food Prot. 59(7):768-771.
Keller, S. 1998. Determination of the leak size critical to package sterility maintenance. Ph.D. Dissertation, Virginia Polytechnic Institute and State University, Blacksburg, VA.
Kelsey, R. J. 1990. The status of leak detection. Food and Drug Pack. 11:8-21.
Kowalski, W. J., W. P. Bahnfleth, and T. S. Whittam. 2000. “Bioaerosols and bioaerosol dynamics,” (Aerobiological Engineering at The Pennsylvania State University), [Internet, WWW], ADDRESS: http://www.engr.psu.edu/www/dept/arc/server/WJKAEROB.HTML
33
Lake, D. E., R. R. Graves, R. S. Lesniewski, and J. E. Anderson. 1985. Post-processing spoilage of low-acid canned foods by mesophilic anaerobic sporeformers. J. Food Prot. 48(3):221-226. Lampi, R. A. 1980. Retort pouch: the development of a basic packaging concept in today’s high technology era. J. Food Process Eng. 4:1-18.
Lee, Y. K., and K. Hoon. 1995. “Surprise 95-brownian motion-the research goes on,” [Internet, WWW], ADDRESS: http://www-dse.doc.ic.ac.uk/~nd/surprise_95/journal/vol4/ykl/report.html
Leith, D. 1987. Drag on nonspherical objects. Aerosol Sci. and Technol. 6:153-161.
Lenhart, S. W., S. A. Olenchock, and E. C. Cole. 1982. Viable sampling for airborne bacteria in a poultry processing plant. J.Toxicol.Environ.Health. 10:613-619.
Loeb, L. B (ed.). 1961. The kinetic theory of gases, 3rd ed. p. 278-300. Dover Publications, New York.
McEldowney, S., and M. Fletcher. 1988. Bacterial desorption from food container and food processing surfaces. Microb. Ecol. 15:229-237.
McEldowney, S., and M. Fletcher. 1990a. A model system for the study of food container leakage. J. Appl. Bacteriol. 69:206-210.
McEldowney, S., and M. Fletcher. 1990b. The effect of physical and microbiological factors on food container leakage. J. Appl. Bacteriol. 69:190-205.
Michels, M. J. M., and B. L. Schram. 1979. Effect of handling procedures on the post-process contamination of retort pouches. J. Appl. Bacteriol. 47:105-111.
Morris, S. A., A. Ozguler, and W. D. O’Brien, Jr. May 21, 1999. “New sensors help improve heat-seal microleak detection.” (Packaging Technology and Engineering Feature). [Internet, WWW]. ADDRESS: http://www.napco.com/pte/0798sensors.html.
Morton, D. K. 1987. Container/closure integrity of parenteral vials. J. Parenter. Sci. Technol. 41(5):145-158.
Morton, D. K., N. G. Lordi, L. H. Troutman, and T. J. Ambrosio. 1989. Quantitative and mechanistic measurements of container/closure integrity: bubble, liquid, and microbial leakage tests. J. Parenter. Sci. Technol. 43:104-108.
34
Nave, C. R. 2000. “Mean free path and refinement of mean free path,” (Hyperphysics, Department of Physics and Astronomy at Georgia State University), [Internet, WWW], ADDRESS: http://www.230nscl.phy-astr.gsu.edu/hbase/kinetic/menfre.html
Pflug, I. J., P. M. Davidson, and R. G. Holcomd. 1981. Incidence of canned food spoilage at the retail level. J. Food Prot. 44(9):682-685.
Pich, J. 1972. Theory of gravitational deposition of particles from laminar flows in channels. J. Aerosol Sci. 3:351-361.
Placencia, A. M., G. S. Oxborrow, and J. T. Peeler. 1986. Package integrity methodology for testing the biobarrier of porous packaging. part II: FDA exposure-chamber method. Med. Dev. & Diag. Ind. 8(4)46-53.
Put, H. M. C., H. T. Witvoet, and W. R. Warner. 1980. Mechanism of microbiological leaker spoilage of canned foods: a review. J. Appl. Bacteriol. 35:7-27.
Put, H. M. C., H. T. Witvoet, and W. R. Warner. 1980. Mechanism of microbiological leaker spoilage of canned foods: biophysical aspects. J. Food Prot. 43(6):488-497.
Reich, R. R. 1985. A method for evaluating the microbial barrier properties of intact packages. Med. Dev. and Diag. Ind. 7(3):80-88.
Sheehan, M. J., and J. V. Giranda. 1994. Bioaerosol generation in a food processing plant: a comparison of production and sanitation operations. Appl. Occup. Environ. Hyg. 9(5):346-352.
Stauffer, T. 1990. Non-destructive testing on flexible packaging. J. pack. Technol. July/August:27-29.
Stersky, A., E. Todd, and H. Pivnick. 1980. Food poisoning associated with post process leakage (PPL) in canned foods. J. Food. Prot. 43(6):465-476.
Teltsch, B., H. I. Shuval, and J. Tadmor. 1980. Die-away knetics of aerosolized bacteria from sprinkler application of wastewater. Appl. Environ. Microbiol. 39(6):1191-1197.
Thompson, P. J., and M. A. Griffith. 1983. Identity of mesophilic anaerobic sporeformers cultured from recycled cannery cooling water. J. Food Prot. 46(5):400-402.
35
Whitaker, S. (ed.). 1992. Introduction to fluid mechanics, p. 21. Krieger Publishing Company. Malabar, FL.
Yeh, H. J., and A. Benatar. 1997. Technical evaluation: methods for sealing paper/foil aseptic food packages. TAPPI Journal. 80(6):197-203.
36
SECTION II
ABSTRACT
Threshold leak sizes and leak rates were calculated for a number of liquid food
products exhibiting a wide range of surface tension and viscosity values. From this data,
it can be seen that mathematically, under typical pressure differentials generated in food
packages (≤ ±34.5 kPa), a leak will not start through a 2 µm defect. The calculated leak
rates were compared to calculated evaporation rates of pure water. The evaporation rate
exceeds the leak rate at lower sized microholes (2 and 5 µm diameter) under typical
pressure differentials found in food packages. If the liquid, typically aqueous in food
products, is evaporating off faster than the leak itself, then there will be solids left behind
that could effectively plug the leak.
The critical leak size is the size micro-defect that allows microbial penetration
into the package. The critical leak size of air-filled defects was found to be 7 µm at all
pressures tested. This size is considerably important to food packagers because this is
when sterility of the package is lost. Previous leak studies have shown that the critical
leak size for liquid-filled defects coincide with the threshold leak size and pressure. If
this is in fact true, then air-filled defects should exhibit a larger critical leak size than the
liquid-filled defects. In this study, air-filled defects were examined. A bioaerosol
exposure chamber was used to test micro-defects, nickel microtubes of known diameters
2, 5, 7, 10, 20, and 50 µm hydraulic diameters, against pressure differentials of 0, -6.9, -
13.8, and -34.5 kPa.
37
INTRODUCTION Package integrity testing has been the focus of significant interest to the flexible
and semi-rigid packaging industry. It would be ideal for the industry to reach the same
levels of sterility maintenance assurance that has been reached for cans (6). More
companies are moving towards a 100% on-line nondestructive leak test that assures all
containers leaving the facility to be sterile. Leak testing in this manner ultimately
decreases the overall costs by reducing the number of reworked or recalled products (2,
53, 54). In order for an on-line leak tester to be efficient, the minimum leak size that is
critical to microbial ingress must be scientifically established (21).
Nondestructive leak testing equipment relies on physical testing methods because
of their fast test speed, reliability, and repeatability. Most of the on-line leak testing
equipment are base on a variation of the pressure decay test (33). A package is enclosed
in an air- tight chamber, the air around the package is evacuated, and a pressure-
transducer system measures any change in the package internal pressure. Ultrasonic leak
detection equipment is becoming very favorable to food packagers because it can detect
leaks at least as small as 1 µm and operates at the speed of sound (27, 33). There are
other laboratory physical tests that are even more sensitive such as the tracer gas leak and
helium leak test (18, 19, 43). Dye penetration tests, chemical tracer tests, and bubble tests
are the most popular destructive leak tests performed in the laboratory (4, 18, 19, 20, 43).
A physical test alone, however, does not indicate if the package’s sterility can
been breached (6, 9, 17, 18, 21, 29, 31, 52). The efficiency of a physical test must be
compared to that of a microbial biotest to indicate the conditions under which a package
will become susceptible to microbial contamination (6, 9, 21, 29, 31, 52).
The immersion biotest is a widely used method of determining if a package is
leaking to the extent of allowing microbial infiltration. The number of bacteria in the
immersion media affects the number of packages that will be contaminated (3, 7).
Typically, concentrations of bacteria in the immersion broth can be upwards of 109
CFU/ml (31). A package would never encounter this great a bacterial concentration
38
during its normal shelf life. An aseptic package will never be exposed to a liquid bath
like a retortable package (6).
In order to more closely mimic conditions encountered by an aseptic package, a
bioaerosol exposure test method has also been employed (12, 29, 30, 31, 46, 50). The
contact of an aseptic package by microorganism is going to be through aerosolized
particles in the air (6). Bioaerosols have become more prominent in the eyes of scientific
researchers as of late because of their potential of carrying pathogenic organisms. Many
studies have been done at wastewater treatment plants and farms that show that
aerosolized bacteria can in fact be hazardous to humans and animals (13, 56), carried
great distances through air currents (8, 56), and can replicate more than once in particles
of average size (5, 16). Levels of bioaerosol found at a poultry plant shackling line have
reached up to 6.5x10⁵ CFU/m3 (37). Bioaerosol levels of bacteria in a food processing
plant operating with concurrent sanitation were measured to be 850 to 2500 CFU/m3 (51).
Keller et al. found that using a bioaerosol chamber with 106 CFU/cm3 bacteria results in
faster test runs with significant differences between micro-defect diameters (30).
Research efforts have attempted to characterize conditions that lead to package
spoilage. Earlier leak studies have shown that microorganisms more readily traverse
defects that are filled with liquid by mechanism of motility or pressure differentials found
within the leak (1, 14, 19, 25, 28, 31, 38, 39, 43, 44, 45, 46, 47, 48, 55). Because of the
difficulty involved in manufacturing micron sized defects, many studies involved using
porous membranes of known sizes (4, 39, 40, 46, 50).
Post-process contamination studies led to suggestions on how to avoid
contamination after processing retort pouches (41, 47, 55). Immediately drying a
container after the retort cooling process decreases the contamination rate to less than 1%
(41). A study in 1983 showed that bacteria typically contaminating the recycled cooling
water of a still retort are of the Clostridium species (57).
The critical leak size of microbial contamination has been suggested many times.
It has fluctuated from being between 0.2 µm to 0.4 µm (23), to it being unlikely that the
critical leak size is less than 10 µm (36), to it being less than 10 µm (6, 7, 21, 24, 30, 31),
10 or 5 µm (12), considerably larger than 1 µm (35), and also 1 µm under certain
39
conditions (40, 46). It has also been 22 µm (18), and 11 µm (36). There are overlaps
and discrepancies both in these numbers. The critical leak size was correlated with the
threshold leak size under normal pressure differentials that may be encountered in food
packages (31). That is to say, the critical leak size is approximately the same size that
allows a micro-defect to become liquid-filled.
An equation was developed to predict the threshold leak size and pressure using
the surface tension of the liquid food product as the main factor involved in leak initiation
through micro-sized defects (31). Once the leak has been initiated, the flow rate and
evaporation rate become factors in leakage. If the flow rate is faster than the evaporation
rate, then leakage will occur. If the flow rate is below the evaporation rate, then it is
believed that soluble solids will plug the microhole (15, 31).
The first objective of this research was to quantify threshold leak pressures and
leak rates for liquid food products with a wide range of surface tensions, viscosities,
densities, and package size. This will allow the threshold leak size to be calculated for
typical internally generated pressures in the package.
The second objective of this research was to biotest air filled defects with a
bioaerosol exposure chamber to compare threshold leak size and critical leak size. Since
the critical leak size has been linked to the threshold leak size by bioaerosol testing
liquid-filled defects and comparing them to the threshold leak size (31), it is necessary to
test whether an air-filled defect will have a different critical leak size.
MATERIALS AND METHODS
Density Measurement
The densities of the liquids in this study were measured by weighing 1 ml of the
liquid on an analytical balance at room temperature. The weight of the 1 ml is the density
in g/ml, which can be multiplied by 1,000 to give the density in kg/m3. The density of the
liquid is used to calculate the liquid static head. These calculations yield numbers that do
40
not change the threshold leak pressure by more than 5% even in the largest container fill
height of 20 cm. Since the density of the liquid is not of major concern for this research,
the number achieved by this method is sufficient.
Viscosity Measurement
Capillary tube viscometers and rotational viscometers are the most common
methods of determining the viscosity of a liquid. The research presented here makes use
of a rotational viscometer.
A Brookfield LVT rotational viscometer (Brookfield Engineering Laboratories,
Inc., Stoughton, MA) was used for viscosity measurements. The rotational viscometer is
a cylinder inside of a slightly larger cylinder. The liquid to be tested is placed in between
the large and small cylinders. The inside (smaller) cylinder is rotated at a fixed number
of revolutions per minute. The viscometer measures the amount of torque required to
turn the inner cylinder at the specified rpm. The inside cylinder attachment used for all
samples except the corn syrup was the UL- 25 ml rotating cylinder. The corn syrup was
measured using the LV2 attachment. Two different speeds were used.
Surface Tension Measurement
Surface tensions were measured using a KSV Instruments Sigma 70 (Monroe,
CT) with computer interface. The machine reads the surface tension based on the du
Nouy ring method of surface tension measurement. All values were corrected by the
computer according to the Huh-Mason surface tension correction method. The platinum
ring used was the standard ring for the Sigma 70 (R = 9.545 mm, r = 0.185 mm, Wetted
Length = 119.9 mm). The vessel used to contain the test sample was the standard test
vessel as indicated for the Sigma 70 (Diameter = 66 mm, Max. Volume = 110 ml). The
amount of liquid used was between 80 - 100 ml per sample. The density of each sample
is entered into the computer before each run. The Sigma 70 constantly measures the
temperature of the room.
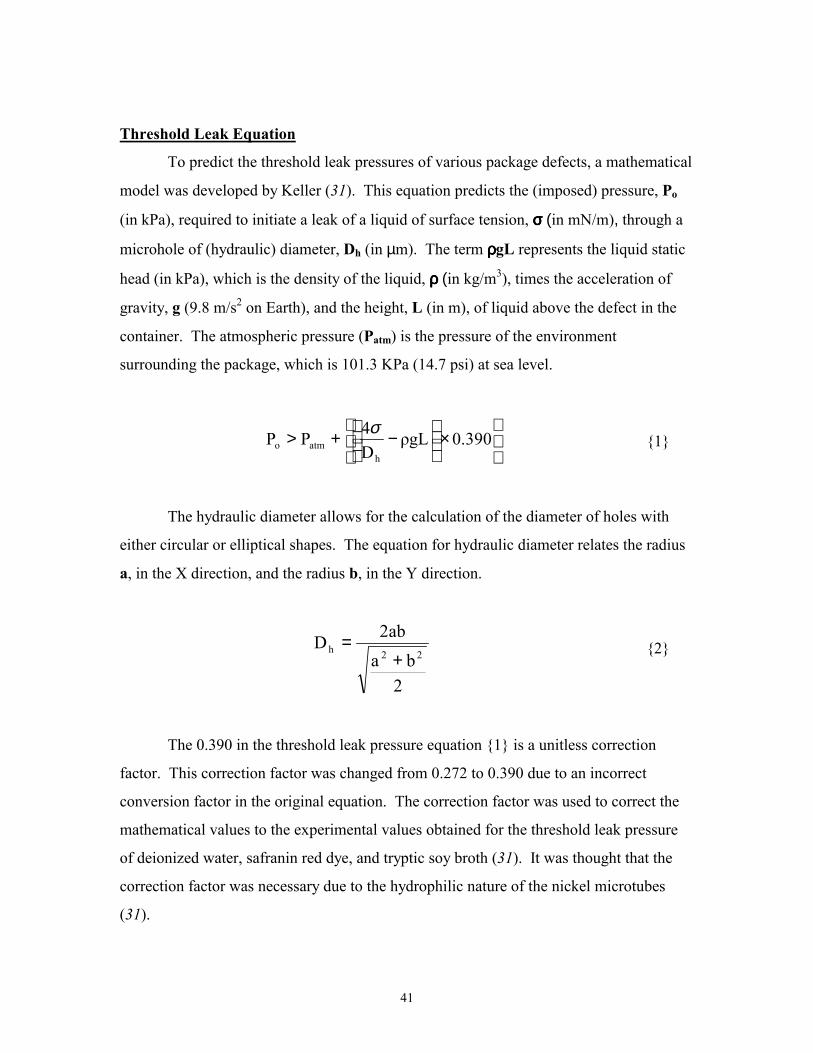
41
Threshold Leak Equation
To predict the threshold leak pressures of various package defects, a mathematical
model was developed by Keller (31). This equation predicts the (imposed) pressure, Po
(in kPa), required to initiate a leak of a liquid of surface tension, σσσσ (in mN/m), through a
microhole of (hydraulic) diameter, Dh (in µm). The term ρρρρgL represents the liquid static
head (in kPa), which is the density of the liquid, ρ ρ ρ ρ (in kg/m3), times the acceleration of
gravity, g (9.8 m/s2 on Earth), and the height, L (in m), of liquid above the defect in the
container. The atmospheric pressure (Patm) is the pressure of the environment
surrounding the package, which is 101.3 KPa (14.7 psi) at sea level.
×
−+> 390.0ρgL
D4PP
hatmo
σ {1}
The hydraulic diameter allows for the calculation of the diameter of holes with
either circular or elliptical shapes. The equation for hydraulic diameter relates the radius
a, in the X direction, and the radius b, in the Y direction.
2ba
ab2D22h
+= {2}
The 0.390 in the threshold leak pressure equation {1} is a unitless correction
factor. This correction factor was changed from 0.272 to 0.390 due to an incorrect
conversion factor in the original equation. The correction factor was used to correct the
mathematical values to the experimental values obtained for the threshold leak pressure
of deionized water, safranin red dye, and tryptic soy broth (31). It was thought that the
correction factor was necessary due to the hydrophilic nature of the nickel microtubes
(31).
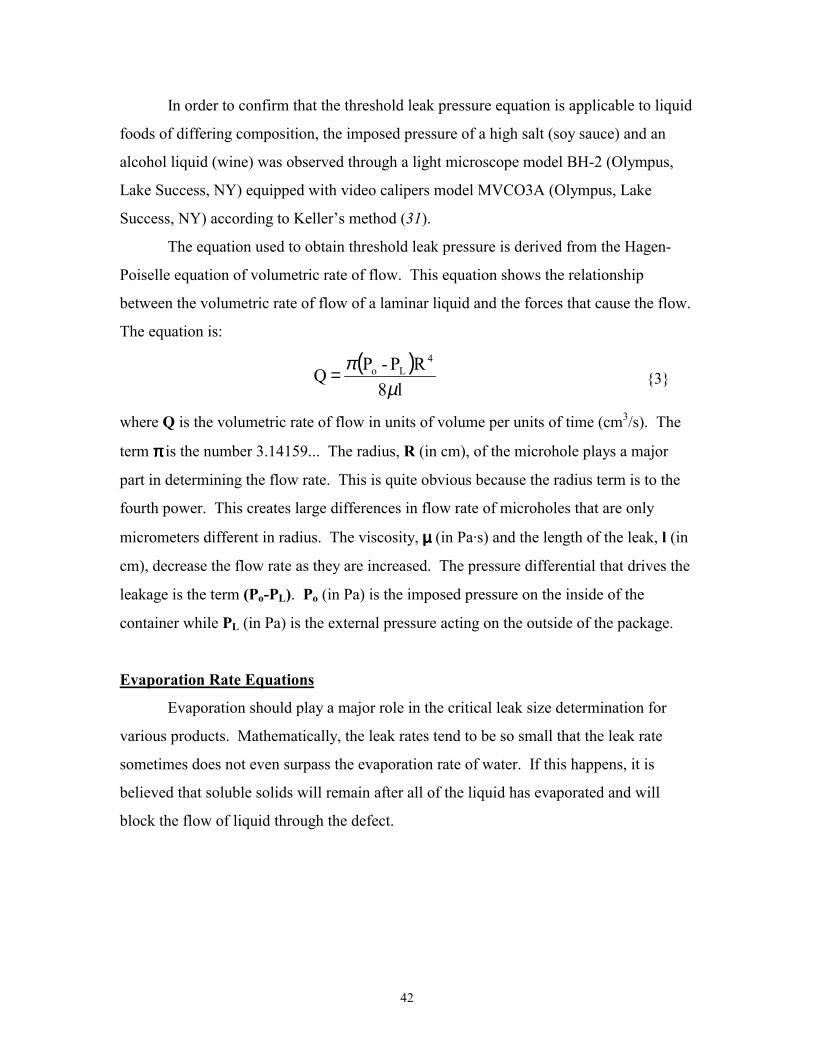
42
In order to confirm that the threshold leak pressure equation is applicable to liquid
foods of differing composition, the imposed pressure of a high salt (soy sauce) and an
alcohol liquid (wine) was observed through a light microscope model BH-2 (Olympus,
Lake Success, NY) equipped with video calipers model MVCO3A (Olympus, Lake
Success, NY) according to Keller’s method (31).
The equation used to obtain threshold leak pressure is derived from the Hagen-
Poiselle equation of volumetric rate of flow. This equation shows the relationship
between the volumetric rate of flow of a laminar liquid and the forces that cause the flow.
The equation is:
( )
l8RP-PQ
4Lo
µπ= {3}
where Q is the volumetric rate of flow in units of volume per units of time (cm3/s). The
term ππππ is the number 3.14159... The radius, R (in cm), of the microhole plays a major
part in determining the flow rate. This is quite obvious because the radius term is to the
fourth power. This creates large differences in flow rate of microholes that are only
micrometers different in radius. The viscosity, µµµµ (in Pa·s) and the length of the leak, l (in
cm), decrease the flow rate as they are increased. The pressure differential that drives the
leakage is the term (Po-PL). Po (in Pa) is the imposed pressure on the inside of the
container while PL (in Pa) is the external pressure acting on the outside of the package.
Evaporation Rate Equations
Evaporation should play a major role in the critical leak size determination for
various products. Mathematically, the leak rates tend to be so small that the leak rate
sometimes does not even surpass the evaporation rate of water. If this happens, it is
believed that soluble solids will remain after all of the liquid has evaporated and will
block the flow of liquid through the defect.
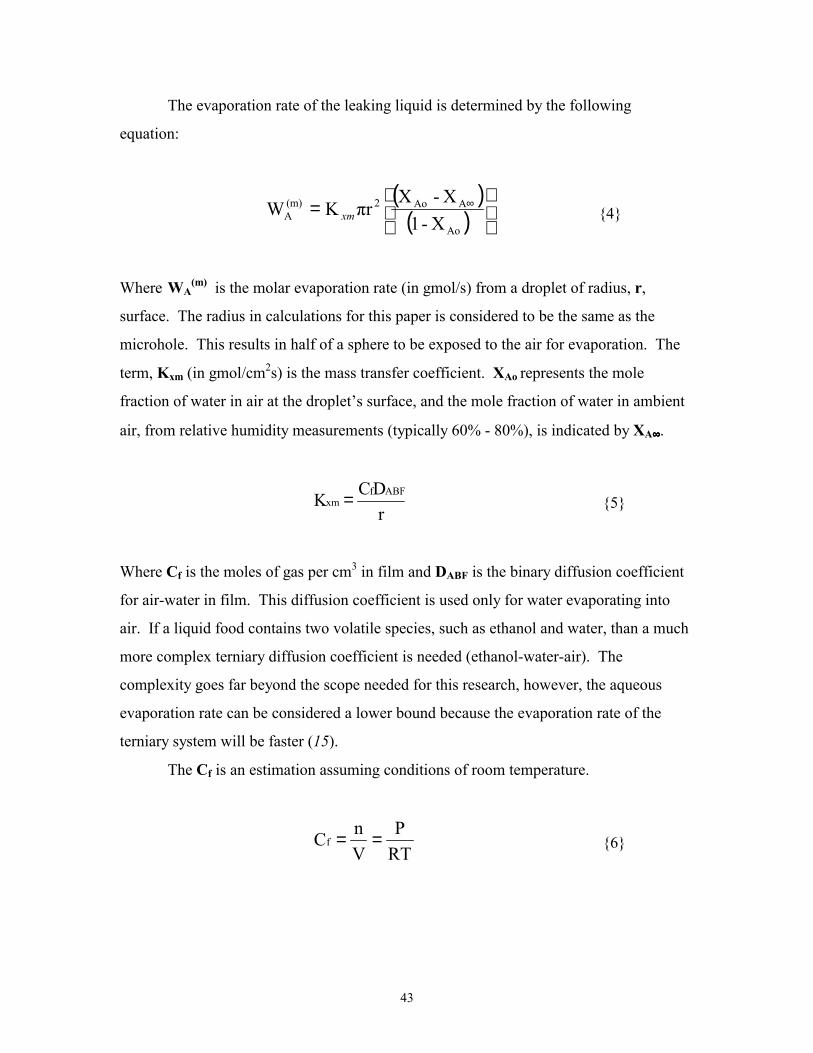
43
The evaporation rate of the leaking liquid is determined by the following
equation:
( )
( )
= ∞
Ao
AAo2(m)A X-1
X-XπrKW xm {4}
Where WA(m) is the molar evaporation rate (in gmol/s) from a droplet of radius, r,
surface. The radius in calculations for this paper is considered to be the same as the
microhole. This results in half of a sphere to be exposed to the air for evaporation. The
term, Kxm (in gmol/cm2s) is the mass transfer coefficient. XAo represents the mole
fraction of water in air at the droplet’s surface, and the mole fraction of water in ambient
air, from relative humidity measurements (typically 60% - 80%), is indicated by XA∞∞∞∞.
r
DCK ABFfxm = {5}
Where Cf is the moles of gas per cm3 in film and DABF is the binary diffusion coefficient
for air-water in film. This diffusion coefficient is used only for water evaporating into
air. If a liquid food contains two volatile species, such as ethanol and water, than a much
more complex terniary diffusion coefficient is needed (ethanol-water-air). The
complexity goes far beyond the scope needed for this research, however, the aqueous
evaporation rate can be considered a lower bound because the evaporation rate of the
terniary system will be faster (15).
The Cf is an estimation assuming conditions of room temperature.
RTP
VnCf == {6}
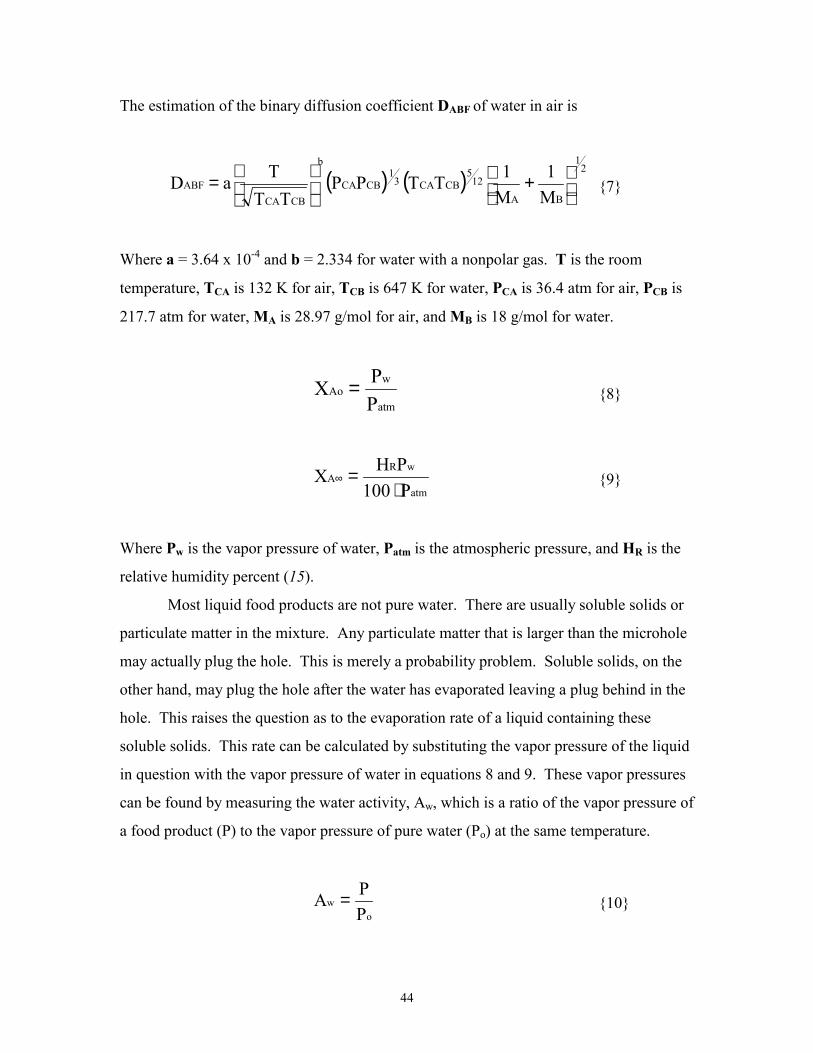
44
The estimation of the binary diffusion coefficient DABF of water in air is
( ) ( )2
1
BA
125
CBCA31
CBCA
b
CBCAABF
M1
M1TTPP
TTTaD
+
= {7}
Where a = 3.64 x 10⁻⁴ and b = 2.334 for water with a nonpolar gas. T is the room
temperature, TCA is 132 K for air, TCB is 647 K for water, PCA is 36.4 atm for air, PCB is
217.7 atm for water, MA is 28.97 g/mol for air, and MB is 18 g/mol for water.
atm
wAo
PPX = {8}
atm
wRA
P100PHX⋅
=∞ {9}
Where Pw is the vapor pressure of water, Patm is the atmospheric pressure, and HR is the
relative humidity percent (15).
Most liquid food products are not pure water. There are usually soluble solids or
particulate matter in the mixture. Any particulate matter that is larger than the microhole
may actually plug the hole. This is merely a probability problem. Soluble solids, on the
other hand, may plug the hole after the water has evaporated leaving a plug behind in the
hole. This raises the question as to the evaporation rate of a liquid containing these
soluble solids. This rate can be calculated by substituting the vapor pressure of the liquid
in question with the vapor pressure of water in equations 8 and 9. These vapor pressures
can be found by measuring the water activity, Aw, which is a ratio of the vapor pressure of
a food product (P) to the vapor pressure of pure water (Po) at the same temperature.
ow
PPA = {10}
45
In order to understand the difference in evaporation rate of pure water and a liquid
food containing soluble solids, the water activity of sodium chloride solutions as well as
soy sauce were measured using an Aqua Lab CX-2 (Pullman, Washington).
Materials for Bioaerosol Exposure
Glass Test Cells (Department of Food Science and Technology, Virginia Tech,
Blacksburg, VA)
Septa closures and silicone/Teflon septum 73818T-13 (Fisher Scientific, Atlanta, GA)
DAP 100% silicone rubber sealant (Dow Corning, Dayton, OH)
High Vacuum Grease (Dow Corning, Dayton, OH)
Teflon Thread Seal Tape ½ inch width
27 gauge syringe needles
Nickel Microtubes of approximate hydraulic diameters 0, 2, 5, 7, 10, 20, and 50 µm
(Phillips Laboratory, Fundamental Technology Division, Carbon Research
Laboratory, Edwards Air Force Base, CA)
Light microscope model BH-2 (Olympus, Lake Success, NY)
Video calipers model MVCO3A (Olympus, Lake Success, NY)
Bioaerosol Exposure Chamber (Department of Food Science and Technology, Virginia
Tech, Blacksburg, VA)
Black rubber tubing 14-158D (Fisher Scientific, Atlanta, GA)
Autoclavable plastic “Y” joints to fit black rubber tubing
Rubber Gaskets (approx. 6 cm OD x 2 cm ID)
6.9 m3 size E compressed air cylinders
CGA 346 air flow meters (Controls Corporation of America, Virginia Beach, VA)
In-line pressure gauge HHP701-2 (Omega Engineering, Inc., Stamford, CT)
Vacuum/compressor pump ROA-P131-AA (Gast, Benton Harbor, MI)
In-line bacterial vents (0.33 µm filters) product no. 4210 (Gelman, Ann Arbor, MI )
Nebulizer kit 2D0807 (Baxter Healthcare, Toronto, Ontario, Canada)
Two autoclavable 2.54 cm ID x 3.2 cm OD x 30 cm (L) clear PVC tubing (Fisher
Scientific, Atlanta, GA)
46
Pseudomonas fragi Lacy-1052 (Department of Plant Pathology, Physiology, and Weed
Science, Virginia Tech, Blacksburg, VA)
Tryptic Soy Broth 0370-17-3 (Difco Laboratories, Detroit, MI)
Tryptic Soy Agar 0370-17-6 (Difco Laboratories, Detroit, MI)
Kanamycin (5 mg/ml stock solution-made fresh each day required)
Tetracycline (1 mg/ml stock solution-made fresh each day required)
Butterfield’s Phosphate Buffer (0.25 M NaH2PO4, pH 6.8)
Bioaerosol Generator
Nebulizer kits model 2D0807 (Baxter Healthcare, Toronto, Ontario, Canada) with
a mass median aerodynamic diameter of 2.68 µm, geometric standard 1.85 µm, and mass
aerosol per minute of 1.1 µm and 4.7 µm were used to generate the bioaerosol. This type
of nebulizer is referred to as a Wright compressed air nebulizer, which operates by
impacting a high velocity liquid/air stream onto a baffle. This impaction aerosolizes the
liquid. The cell suspension to be aerosolized is drawn into the airflow that is emitted
from a 0.074 cm ID orifice. The flow is directed towards a small chamber and then
forced through a 0.16 cm ID orifice after which it travels a distance of 0.116 cm where it
is impinged upon an open-sided flat collector. Smaller droplets are able to make the
turns, whereas the larger droplets collect on the baffle (49). The large droplets deposited
on the baffle are forced by the airstream to the edge where they are aerosolized (31).
Airflow was 8 L/min. Two 6.9 m3 size E cylinders of compressed air, each
equipped with CGA 346 air flow meters (0-15 L/min range) (Controls Corporation of
America, Virginia Beach, VA) were used for air supply (31).
Microtubes
Nickel microtubes were developed by the Phillips Laboratory, Fundamental
Technology Division, Carbon Research Laboratory, Edwards Air Force Base, CA through
a Cooperative Research and Development Agreement (22). Microtube internal diameters
(IDs) were 2, 5, 7, 10, 20, and 50 µm. Solid microtubes (0 µm, ID) were used as negative
controls.
47
Test Cells
The glass test cells have overall dimensions of 8 cm [h] X 5 cm [d]. It is a glass
vial with septa lug for closure (45 mm [h] X 15 mm [d]) encased in an 85 ml glass water
jacket. The vial and jacket each have one entry port and one exit port (31). The septum
is made from silicone/ Teflon no. 73818T-13 (Fisher Scientific, Atlanta, GA)
Preparation of the test cells
Using the method developed by Keller, 1998, the glass test cells were prepared as
follows. A 27-gauge syringe needle was used to penetrate through the center of the
silicon/ Teflon septum. The microtube was inserted into the needle cavity where it was
held in place while the needle was removed, thus leaving the microtube through the
center of the septum. Care was taken to assure that the microtube was not bent during the
process. Internal diameters, x and y, were measured using a light microscope model BH-
2 (Olympus, Lake Success, NY) equipped with video calipers model MVCO3A
(Olympus, Lake Success, NY). The diameters were halved to become radii a and b,
respectively (31).
Once hydraulic diameters were confirmed by measurement, the septum containing
the microtube was positioned onto the glass lug of the test cell. The lug was then
wrapped with Teflon Thread tape overlapping the top outside circular edge of the
septum. The septa cap was then screwed down onto the lug. The surface around the
microtube and the contact around the septum-septa cap area were sealed with DAP
silicone sealer (Dow Corning, Dayton, OH) using extreme caution not to touch the top of
the microtube (31). A volume of 4 ml of tryptic soy broth is pipetted through one of the
entry ports into the center vial.
Bioaerosol Exposure Chamber
The bioaerosol exposure chamber developed by Keller, 1998, is constructed of
Lexan in dimensions of 35 cm (L) x 25 cm (W) x 25 cm (H). The internal area of the
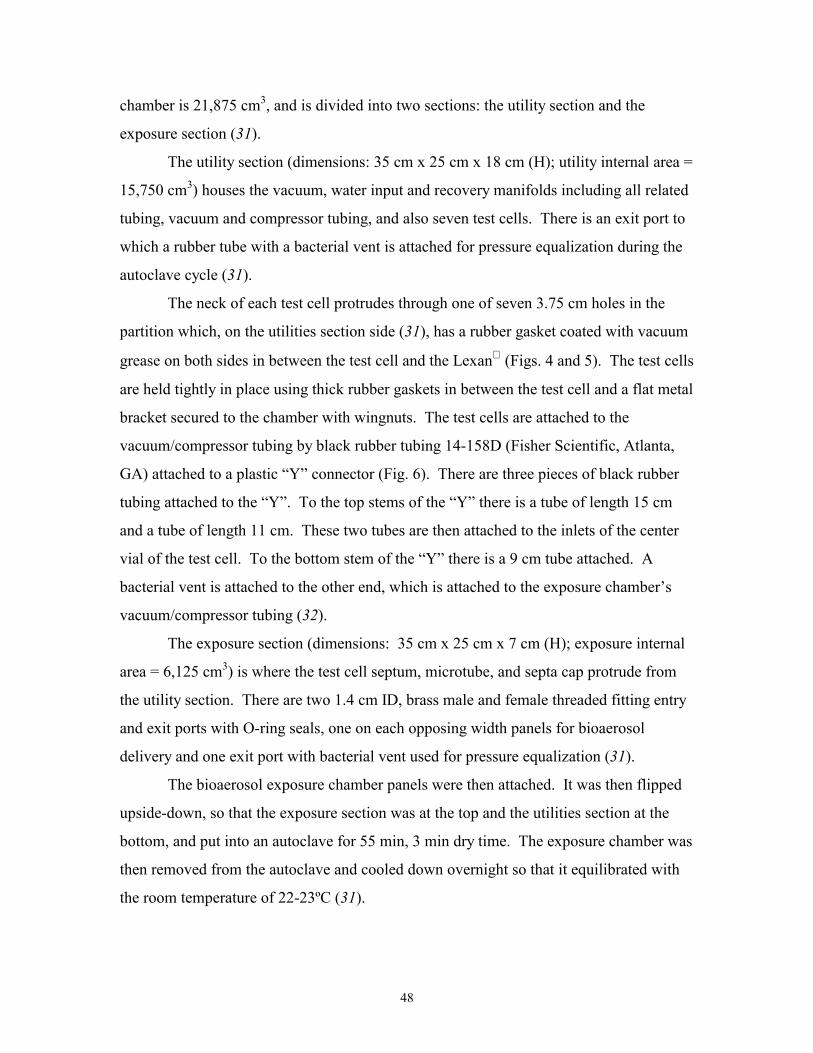
48
chamber is 21,875 cm3, and is divided into two sections: the utility section and the
exposure section (31).
The utility section (dimensions: 35 cm x 25 cm x 18 cm (H); utility internal area =
15,750 cm3) houses the vacuum, water input and recovery manifolds including all related
tubing, vacuum and compressor tubing, and also seven test cells. There is an exit port to
which a rubber tube with a bacterial vent is attached for pressure equalization during the
autoclave cycle (31).
The neck of each test cell protrudes through one of seven 3.75 cm holes in the
partition which, on the utilities section side (31), has a rubber gasket coated with vacuum
grease on both sides in between the test cell and the Lexan (Figs. 4 and 5). The test cells
are held tightly in place using thick rubber gaskets in between the test cell and a flat metal
bracket secured to the chamber with wingnuts. The test cells are attached to the
vacuum/compressor tubing by black rubber tubing 14-158D (Fisher Scientific, Atlanta,
GA) attached to a plastic “Y” connector (Fig. 6). There are three pieces of black rubber
tubing attached to the “Y”. To the top stems of the “Y” there is a tube of length 15 cm
and a tube of length 11 cm. These two tubes are then attached to the inlets of the center
vial of the test cell. To the bottom stem of the “Y” there is a 9 cm tube attached. A
bacterial vent is attached to the other end, which is attached to the exposure chamber’s
vacuum/compressor tubing (32).
The exposure section (dimensions: 35 cm x 25 cm x 7 cm (H); exposure internal
area = 6,125 cm3) is where the test cell septum, microtube, and septa cap protrude from
the utility section. There are two 1.4 cm ID, brass male and female threaded fitting entry
and exit ports with O-ring seals, one on each opposing width panels for bioaerosol
delivery and one exit port with bacterial vent used for pressure equalization (31).
The bioaerosol exposure chamber panels were then attached. It was then flipped
upside-down, so that the exposure section was at the top and the utilities section at the
bottom, and put into an autoclave for 55 min, 3 min dry time. The exposure chamber was
then removed from the autoclave and cooled down overnight so that it equilibrated with
the room temperature of 22-23ºC (31).
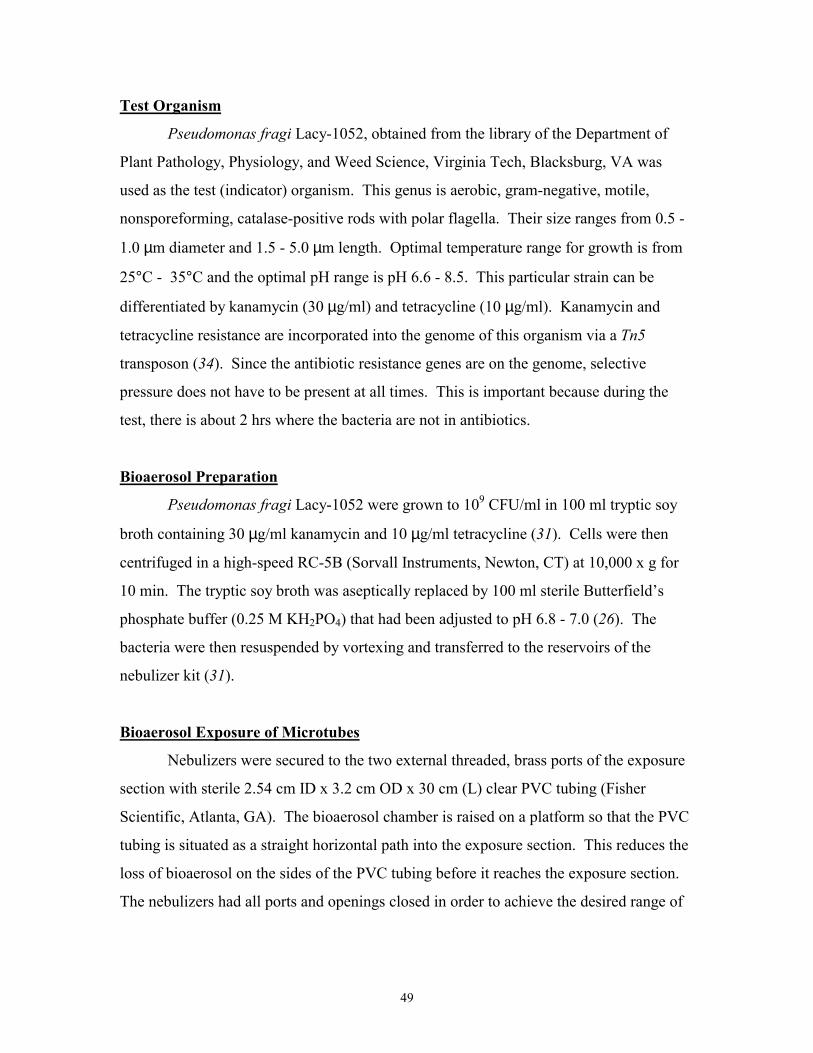
49
Test Organism
Pseudomonas fragi Lacy-1052, obtained from the library of the Department of
Plant Pathology, Physiology, and Weed Science, Virginia Tech, Blacksburg, VA was
used as the test (indicator) organism. This genus is aerobic, gram-negative, motile,
nonsporeforming, catalase-positive rods with polar flagella. Their size ranges from 0.5 -
1.0 µm diameter and 1.5 - 5.0 µm length. Optimal temperature range for growth is from
25°C - 35°C and the optimal pH range is pH 6.6 - 8.5. This particular strain can be
differentiated by kanamycin (30 µg/ml) and tetracycline (10 µg/ml). Kanamycin and
tetracycline resistance are incorporated into the genome of this organism via a Tn5
transposon (34). Since the antibiotic resistance genes are on the genome, selective
pressure does not have to be present at all times. This is important because during the
test, there is about 2 hrs where the bacteria are not in antibiotics.
Bioaerosol Preparation
Pseudomonas fragi Lacy-1052 were grown to 109 CFU/ml in 100 ml tryptic soy
broth containing 30 µg/ml kanamycin and 10 µg/ml tetracycline (31). Cells were then
centrifuged in a high-speed RC-5B (Sorvall Instruments, Newton, CT) at 10,000 x g for
10 min. The tryptic soy broth was aseptically replaced by 100 ml sterile Butterfield’s
phosphate buffer (0.25 M KH2PO4) that had been adjusted to pH 6.8 - 7.0 (26). The
bacteria were then resuspended by vortexing and transferred to the reservoirs of the
nebulizer kit (31).
Bioaerosol Exposure of Microtubes
Nebulizers were secured to the two external threaded, brass ports of the exposure
section with sterile 2.54 cm ID x 3.2 cm OD x 30 cm (L) clear PVC tubing (Fisher
Scientific, Atlanta, GA). The bioaerosol chamber is raised on a platform so that the PVC
tubing is situated as a straight horizontal path into the exposure section. This reduces the
loss of bioaerosol on the sides of the PVC tubing before it reaches the exposure section.
The nebulizers had all ports and openings closed in order to achieve the desired range of
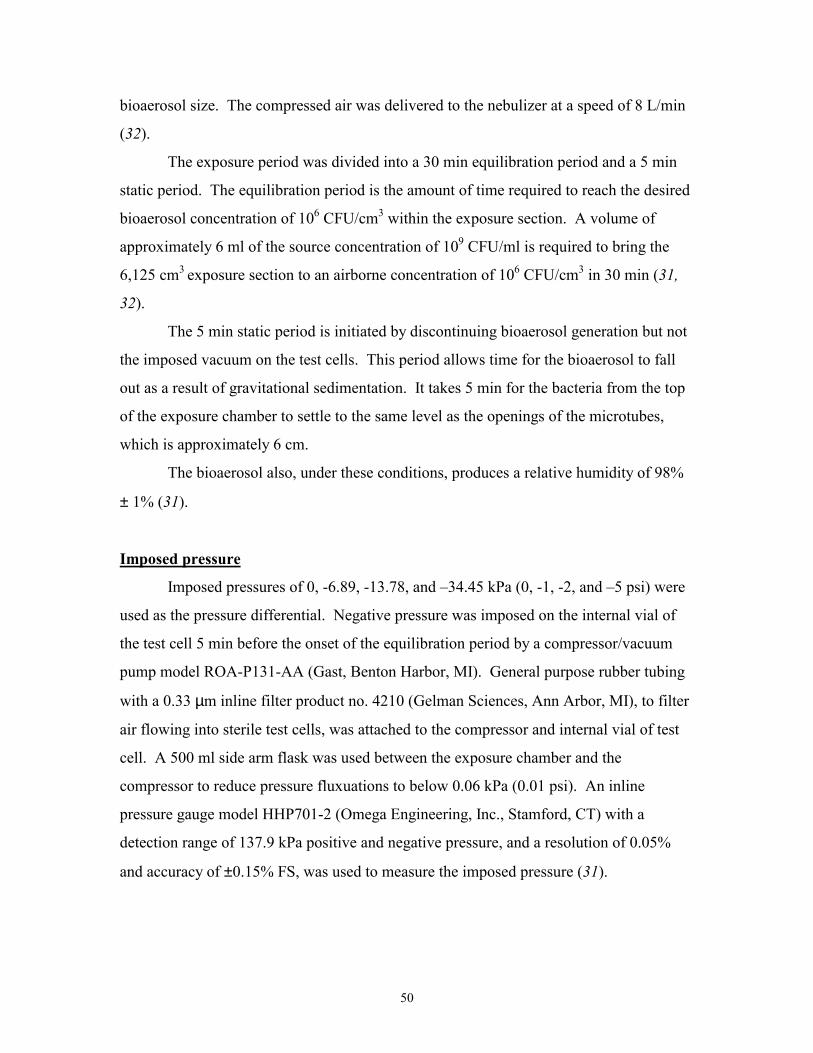
50
bioaerosol size. The compressed air was delivered to the nebulizer at a speed of 8 L/min
(32).
The exposure period was divided into a 30 min equilibration period and a 5 min
static period. The equilibration period is the amount of time required to reach the desired
bioaerosol concentration of 106 CFU/cm3 within the exposure section. A volume of
approximately 6 ml of the source concentration of 109 CFU/ml is required to bring the
6,125 cm3 exposure section to an airborne concentration of 106 CFU/cm3 in 30 min (31,
32).
The 5 min static period is initiated by discontinuing bioaerosol generation but not
the imposed vacuum on the test cells. This period allows time for the bioaerosol to fall
out as a result of gravitational sedimentation. It takes 5 min for the bacteria from the top
of the exposure chamber to settle to the same level as the openings of the microtubes,
which is approximately 6 cm.
The bioaerosol also, under these conditions, produces a relative humidity of 98%
± 1% (31).
Imposed pressure
Imposed pressures of 0, -6.89, -13.78, and –34.45 kPa (0, -1, -2, and –5 psi) were
used as the pressure differential. Negative pressure was imposed on the internal vial of
the test cell 5 min before the onset of the equilibration period by a compressor/vacuum
pump model ROA-P131-AA (Gast, Benton Harbor, MI). General purpose rubber tubing
with a 0.33 µm inline filter product no. 4210 (Gelman Sciences, Ann Arbor, MI), to filter
air flowing into sterile test cells, was attached to the compressor and internal vial of test
cell. A 500 ml side arm flask was used between the exposure chamber and the
compressor to reduce pressure fluxuations to below 0.06 kPa (0.01 psi). An inline
pressure gauge model HHP701-2 (Omega Engineering, Inc., Stamford, CT) with a
detection range of 137.9 kPa positive and negative pressure, and a resolution of 0.05%
and accuracy of ±0.15% FS, was used to measure the imposed pressure (31).
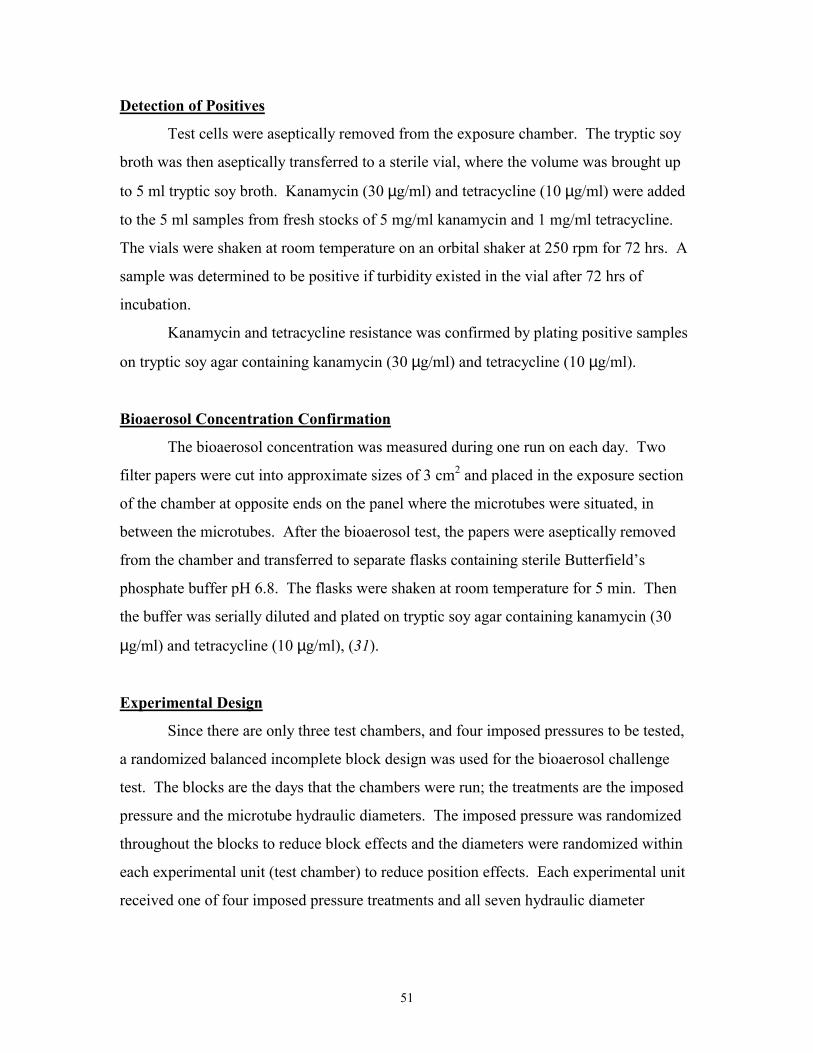
51
Detection of Positives
Test cells were aseptically removed from the exposure chamber. The tryptic soy
broth was then aseptically transferred to a sterile vial, where the volume was brought up
to 5 ml tryptic soy broth. Kanamycin (30 µg/ml) and tetracycline (10 µg/ml) were added
to the 5 ml samples from fresh stocks of 5 mg/ml kanamycin and 1 mg/ml tetracycline.
The vials were shaken at room temperature on an orbital shaker at 250 rpm for 72 hrs. A
sample was determined to be positive if turbidity existed in the vial after 72 hrs of
incubation.
Kanamycin and tetracycline resistance was confirmed by plating positive samples
on tryptic soy agar containing kanamycin (30 µg/ml) and tetracycline (10 µg/ml).
Bioaerosol Concentration Confirmation
The bioaerosol concentration was measured during one run on each day. Two
filter papers were cut into approximate sizes of 3 cm2 and placed in the exposure section
of the chamber at opposite ends on the panel where the microtubes were situated, in
between the microtubes. After the bioaerosol test, the papers were aseptically removed
from the chamber and transferred to separate flasks containing sterile Butterfield’s
phosphate buffer pH 6.8. The flasks were shaken at room temperature for 5 min. Then
the buffer was serially diluted and plated on tryptic soy agar containing kanamycin (30
µg/ml) and tetracycline (10 µg/ml), (31).
Experimental Design
Since there are only three test chambers, and four imposed pressures to be tested,
a randomized balanced incomplete block design was used for the bioaerosol challenge
test. The blocks are the days that the chambers were run; the treatments are the imposed
pressure and the microtube hydraulic diameters. The imposed pressure was randomized
throughout the blocks to reduce block effects and the diameters were randomized within
each experimental unit (test chamber) to reduce position effects. Each experimental unit
received one of four imposed pressure treatments and all seven hydraulic diameter
52
treatments. There are three replicates of each experimental unit randomized throughout
the incomplete block.
Data was analyzed by treating pressure and diameter as continuous variables in a
logistic regression (11) using JMP® (SAS Institute, Cary, NC).
RESULTS AND DISCUSSION
Threshold Leak Size
Different food products were used to determine a range of surface tensions and
densities to calculate threshold leak pressures. Package liquid fill heights were also
quantified to the nearest centimeter for liquid static head calculations (ρρρρgL). The leak
pressure was calculated as if the leak occurred at the bottom of the package, thus making
L equal to the fill height in the container. The values obtained for liquid static heads
were quite small. The largest container, the 5 liter wine box (approximately 20 cm fill
height), only had a static head of 2 kPa. This affects the threshold pressure by only a
small amount.
The major factors involved in the threshold leak pressure calculation are the
surface tension, σσσσ, and the microhole hydraulic diameter, Dh. Microhole hydraulic
diameters of 2, 5, 7, 10, 20, and 50 µm and length, l, of 7 mm were used to calculate leak
pressures (31).
Using the threshold leak pressure equation {1}, the threshold pressures for various
products were calculated for each microtube size (Table 3). Threshold leak size at a
pressure greater than 6.9 kPa, (or less than –6.9 kPa) is approximately 7 µm for liquids of
low surface tension (dyes, oil). The threshold leak size increases to 10 µm for mid-range
surface tension products (dairy, beer, orange juice), then increases to a value between 10
µm and 20 µm for high surface tension products (juices, water).
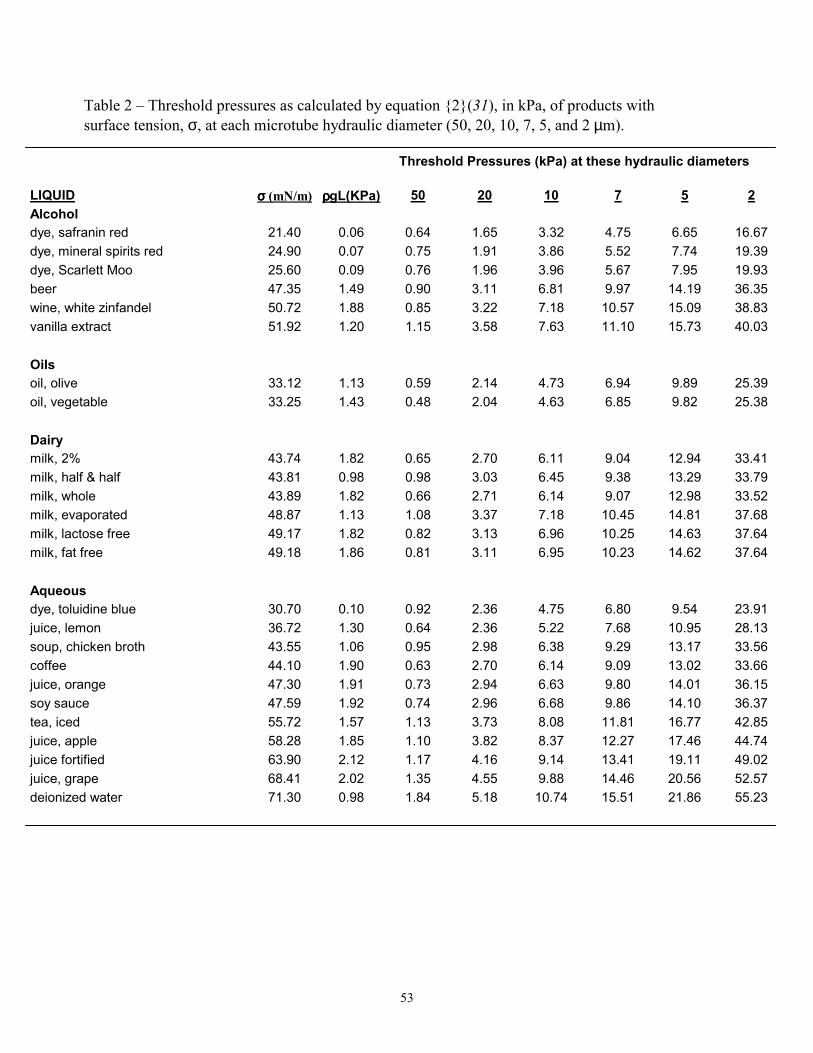
53
Table 2 – Threshold pressures as calculated by equation {2}(31), in kPa, of products with surface tension, σ, at each microtube hydraulic diameter (50, 20, 10, 7, 5, and 2 µm).
Threshold Pressures (kPa) at these hydraulic diameters
LIQUID σσσσ (mN/m) ρρρρgL(KPa) 50 20 10 7 5 2 Alcohol dye, safranin red 21.40 0.06 0.64 1.65 3.32 4.75 6.65 16.67 dye, mineral spirits red 24.90 0.07 0.75 1.91 3.86 5.52 7.74 19.39 dye, Scarlett Moo 25.60 0.09 0.76 1.96 3.96 5.67 7.95 19.93 beer 47.35 1.49 0.90 3.11 6.81 9.97 14.19 36.35 wine, white zinfandel 50.72 1.88 0.85 3.22 7.18 10.57 15.09 38.83 vanilla extract 51.92 1.20 1.15 3.58 7.63 11.10 15.73 40.03 Oils oil, olive 33.12 1.13 0.59 2.14 4.73 6.94 9.89 25.39 oil, vegetable 33.25 1.43 0.48 2.04 4.63 6.85 9.82 25.38 Dairy milk, 2% 43.74 1.82 0.65 2.70 6.11 9.04 12.94 33.41 milk, half & half 43.81 0.98 0.98 3.03 6.45 9.38 13.29 33.79 milk, whole 43.89 1.82 0.66 2.71 6.14 9.07 12.98 33.52 milk, evaporated 48.87 1.13 1.08 3.37 7.18 10.45 14.81 37.68 milk, lactose free 49.17 1.82 0.82 3.13 6.96 10.25 14.63 37.64 milk, fat free 49.18 1.86 0.81 3.11 6.95 10.23 14.62 37.64 Aqueous dye, toluidine blue 30.70 0.10 0.92 2.36 4.75 6.80 9.54 23.91 juice, lemon 36.72 1.30 0.64 2.36 5.22 7.68 10.95 28.13 soup, chicken broth 43.55 1.06 0.95 2.98 6.38 9.29 13.17 33.56 coffee 44.10 1.90 0.63 2.70 6.14 9.09 13.02 33.66 juice, orange 47.30 1.91 0.73 2.94 6.63 9.80 14.01 36.15 soy sauce 47.59 1.92 0.74 2.96 6.68 9.86 14.10 36.37 tea, iced 55.72 1.57 1.13 3.73 8.08 11.81 16.77 42.85 juice, apple 58.28 1.85 1.10 3.82 8.37 12.27 17.46 44.74 juice fortified 63.90 2.12 1.17 4.16 9.14 13.41 19.11 49.02 juice, grape 68.41 2.02 1.35 4.55 9.88 14.46 20.56 52.57 deionized water 71.30 0.98 1.84 5.18 10.74 15.51 21.86 55.23
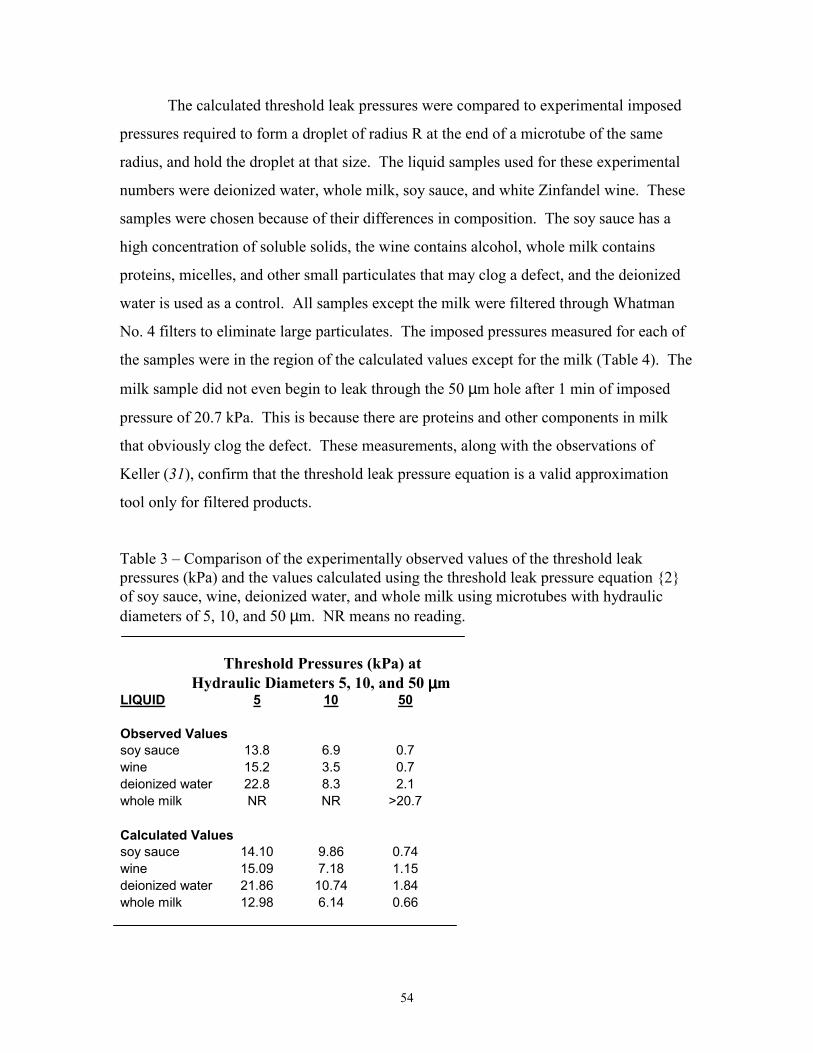
54
The calculated threshold leak pressures were compared to experimental imposed
pressures required to form a droplet of radius R at the end of a microtube of the same
radius, and hold the droplet at that size. The liquid samples used for these experimental
numbers were deionized water, whole milk, soy sauce, and white Zinfandel wine. These
samples were chosen because of their differences in composition. The soy sauce has a
high concentration of soluble solids, the wine contains alcohol, whole milk contains
proteins, micelles, and other small particulates that may clog a defect, and the deionized
water is used as a control. All samples except the milk were filtered through Whatman
No. 4 filters to eliminate large particulates. The imposed pressures measured for each of
the samples were in the region of the calculated values except for the milk (Table 4). The
milk sample did not even begin to leak through the 50 µm hole after 1 min of imposed
pressure of 20.7 kPa. This is because there are proteins and other components in milk
that obviously clog the defect. These measurements, along with the observations of
Keller (31), confirm that the threshold leak pressure equation is a valid approximation
tool only for filtered products.
Table 3 – Comparison of the experimentally observed values of the threshold leak pressures (kPa) and the values calculated using the threshold leak pressure equation {2} of soy sauce, wine, deionized water, and whole milk using microtubes with hydraulic diameters of 5, 10, and 50 µm. NR means no reading.
Threshold Pressures (kPa) at Hydraulic Diameters 5, 10, and 50 µµµµm
LIQUID 5 10 50 Observed Values soy sauce 13.8 6.9 0.7 wine 15.2 3.5 0.7 deionized water 22.8 8.3 2.1 whole milk NR NR >20.7 Calculated Values soy sauce 14.10 9.86 0.74 wine 15.09 7.18 1.15 deionized water 21.86 10.74 1.84 whole milk 12.98 6.14 0.66
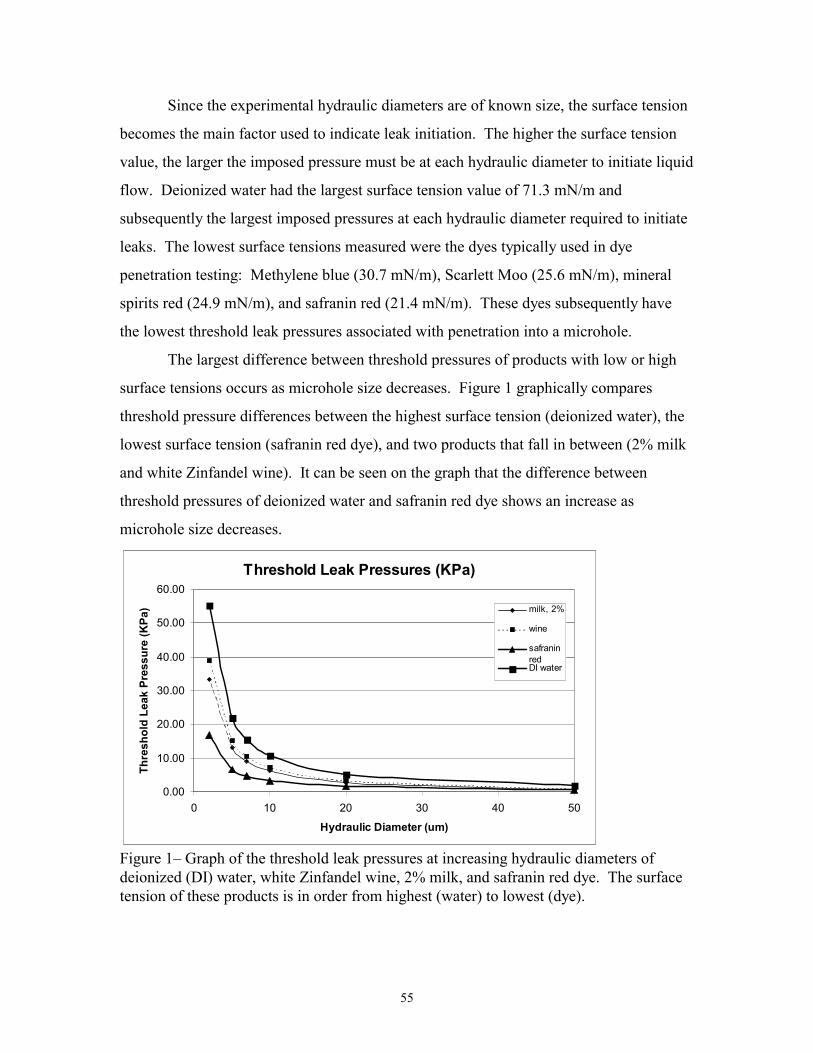
55
Since the experimental hydraulic diameters are of known size, the surface tension
becomes the main factor used to indicate leak initiation. The higher the surface tension
value, the larger the imposed pressure must be at each hydraulic diameter to initiate liquid
flow. Deionized water had the largest surface tension value of 71.3 mN/m and
subsequently the largest imposed pressures at each hydraulic diameter required to initiate
leaks. The lowest surface tensions measured were the dyes typically used in dye
penetration testing: Methylene blue (30.7 mN/m), Scarlett Moo (25.6 mN/m), mineral
spirits red (24.9 mN/m), and safranin red (21.4 mN/m). These dyes subsequently have
the lowest threshold leak pressures associated with penetration into a microhole.
The largest difference between threshold pressures of products with low or high
surface tensions occurs as microhole size decreases. Figure 1 graphically compares
threshold pressure differences between the highest surface tension (deionized water), the
lowest surface tension (safranin red dye), and two products that fall in between (2% milk
and white Zinfandel wine). It can be seen on the graph that the difference between
threshold pressures of deionized water and safranin red dye shows an increase as
microhole size decreases.
Threshold Leak Pressures (KPa)
0.00
10.00
20.00
30.00
40.00
50.00
60.00
0 10 20 30 40 50
Hydraulic Diameter (um)
Thre
shol
d Le
ak P
ress
ure
(KPa
) milk, 2%
wine
safraninredDI water
Figure 1– Graph of the threshold leak pressures at increasing hydraulic diameters of deionized (DI) water, white Zinfandel wine, 2% milk, and safranin red dye. The surface tension of these products is in order from highest (water) to lowest (dye).
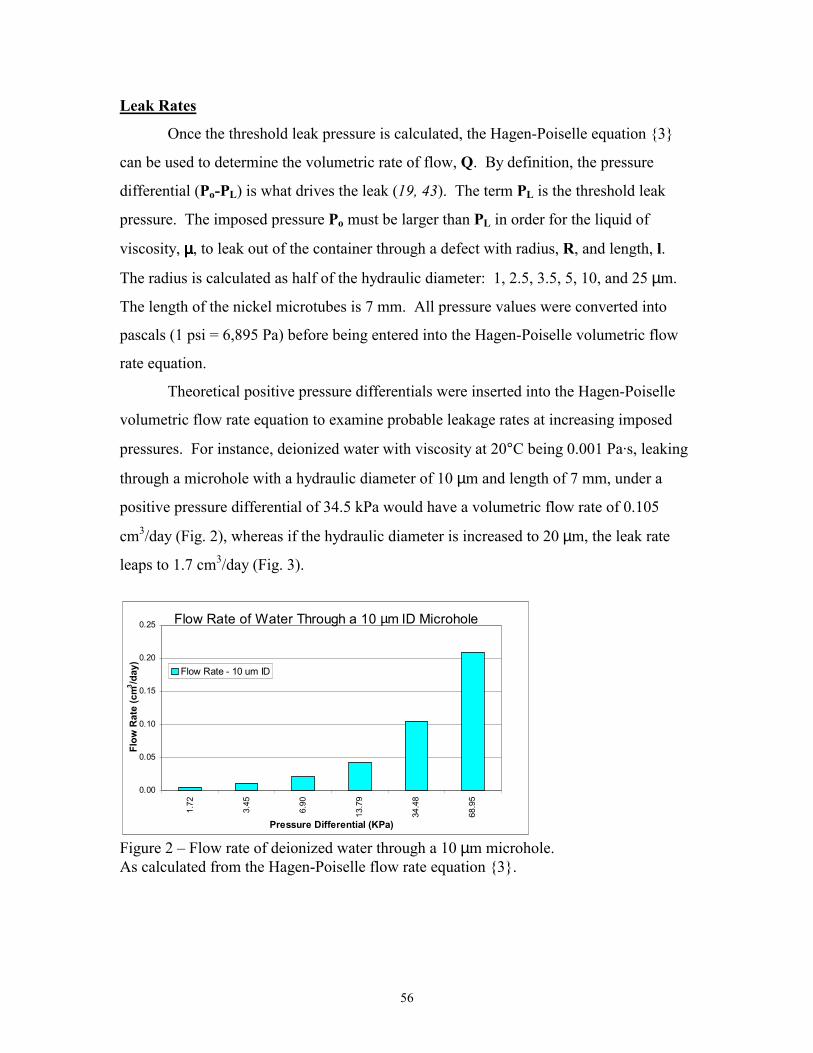
56
Leak Rates
Once the threshold leak pressure is calculated, the Hagen-Poiselle equation {3}
can be used to determine the volumetric rate of flow, Q. By definition, the pressure
differential (Po-PL) is what drives the leak (19, 43). The term PL is the threshold leak
pressure. The imposed pressure Po must be larger than PL in order for the liquid of
viscosity, µµµµ, to leak out of the container through a defect with radius, R, and length, l.
The radius is calculated as half of the hydraulic diameter: 1, 2.5, 3.5, 5, 10, and 25 µm.
The length of the nickel microtubes is 7 mm. All pressure values were converted into
pascals (1 psi = 6,895 Pa) before being entered into the Hagen-Poiselle volumetric flow
rate equation.
Theoretical positive pressure differentials were inserted into the Hagen-Poiselle
volumetric flow rate equation to examine probable leakage rates at increasing imposed
pressures. For instance, deionized water with viscosity at 20°C being 0.001 Pa·s, leaking
through a microhole with a hydraulic diameter of 10 µm and length of 7 mm, under a
positive pressure differential of 34.5 kPa would have a volumetric flow rate of 0.105
cm3/day (Fig. 2), whereas if the hydraulic diameter is increased to 20 µm, the leak rate
leaps to 1.7 cm3/day (Fig. 3).
Flow Rate of Water Through a 10 µm ID Microhole
0.00
0.05
0.10
0.15
0.20
0.25
1.72
3.45
6.90
13.7
9
34.4
8
68.9
5
Pressure Differential (KPa)
Flow
Rat
e (c
m3 /day
)
Flow Rate - 10 um ID
Figure 2 – Flow rate of deionized water through a 10 µm microhole. As calculated from the Hagen-Poiselle flow rate equation {3}.
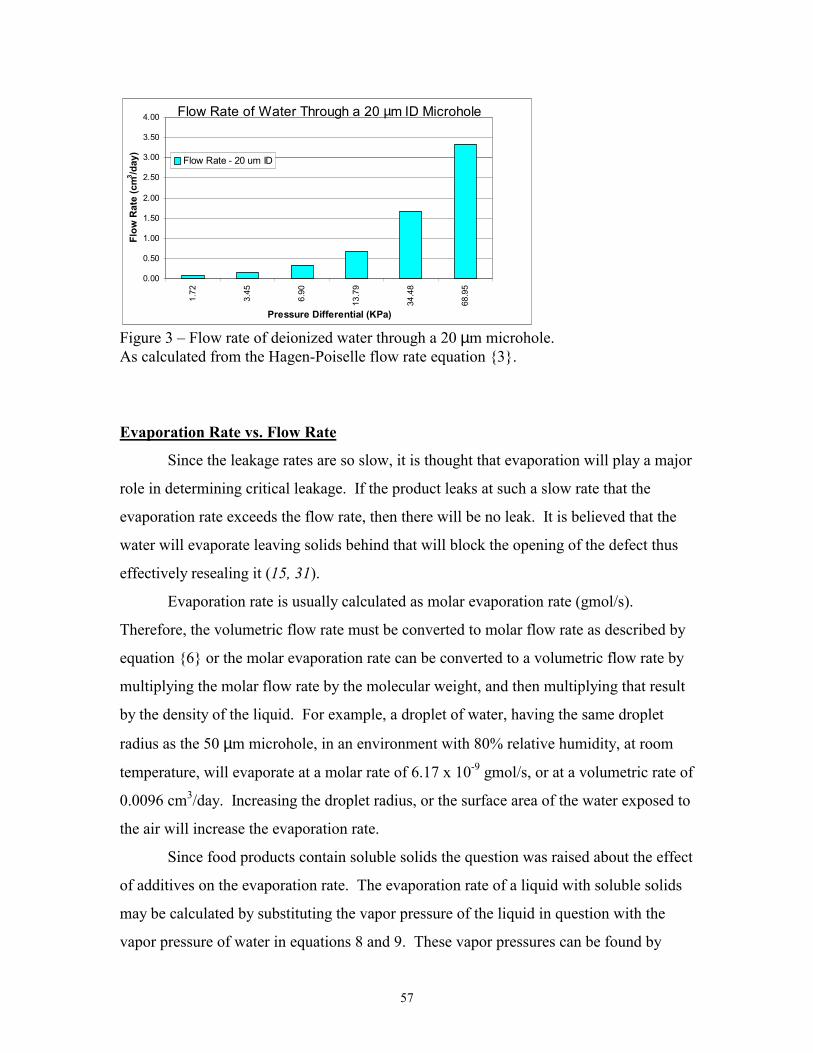
57
Flow Rate of Water Through a 20 µm ID Microhole
0.00
0.50
1.00
1.50
2.00
2.50
3.00
3.50
4.00
1.72
3.45
6.90
13.7
9
34.4
8
68.9
5
Pressure Differential (KPa)
Flow
Rat
e (c
m3 /day
)
Flow Rate - 20 um ID
Figure 3 – Flow rate of deionized water through a 20 µm microhole. As calculated from the Hagen-Poiselle flow rate equation {3}.
Evaporation Rate vs. Flow Rate
Since the leakage rates are so slow, it is thought that evaporation will play a major
role in determining critical leakage. If the product leaks at such a slow rate that the
evaporation rate exceeds the flow rate, then there will be no leak. It is believed that the
water will evaporate leaving solids behind that will block the opening of the defect thus
effectively resealing it (15, 31).
Evaporation rate is usually calculated as molar evaporation rate (gmol/s).
Therefore, the volumetric flow rate must be converted to molar flow rate as described by
equation {6} or the molar evaporation rate can be converted to a volumetric flow rate by
multiplying the molar flow rate by the molecular weight, and then multiplying that result
by the density of the liquid. For example, a droplet of water, having the same droplet
radius as the 50 µm microhole, in an environment with 80% relative humidity, at room
temperature, will evaporate at a molar rate of 6.17 x 10⁻⁹ gmol/s, or at a volumetric rate of
0.0096 cm3/day. Increasing the droplet radius, or the surface area of the water exposed to
the air will increase the evaporation rate.
Since food products contain soluble solids the question was raised about the effect
of additives on the evaporation rate. The evaporation rate of a liquid with soluble solids
may be calculated by substituting the vapor pressure of the liquid in question with the
vapor pressure of water in equations 8 and 9. These vapor pressures can be found by
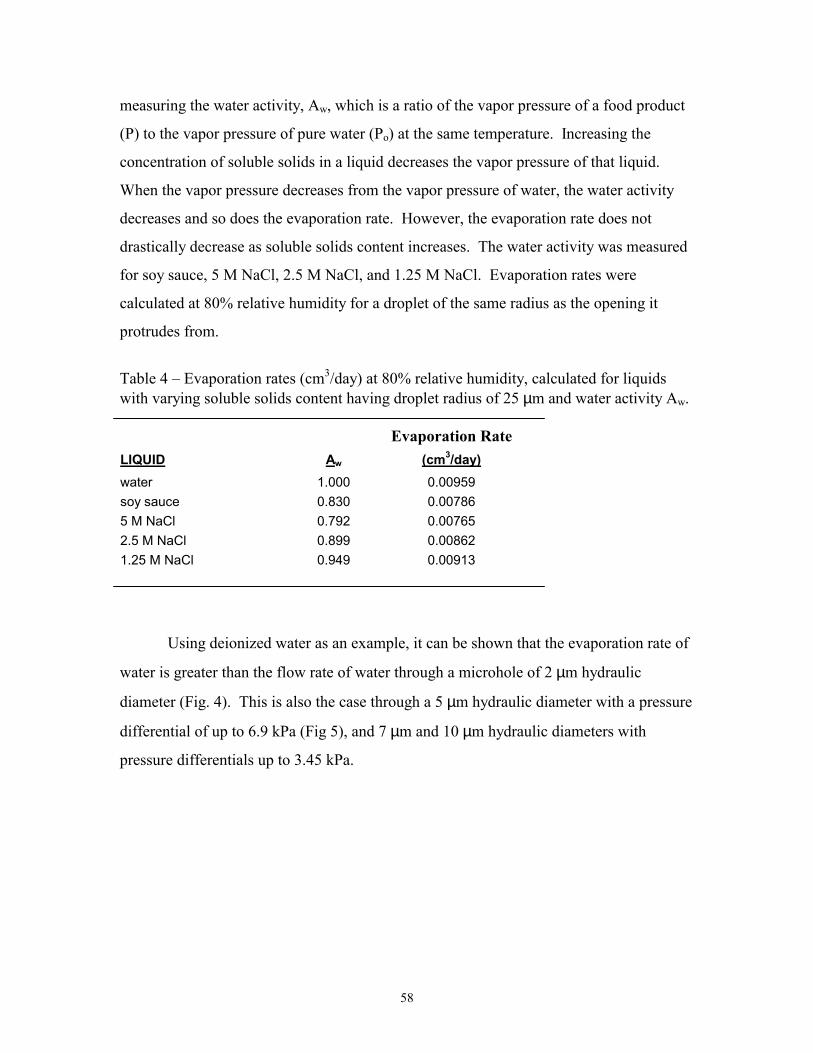
58
measuring the water activity, Aw, which is a ratio of the vapor pressure of a food product
(P) to the vapor pressure of pure water (Po) at the same temperature. Increasing the
concentration of soluble solids in a liquid decreases the vapor pressure of that liquid.
When the vapor pressure decreases from the vapor pressure of water, the water activity
decreases and so does the evaporation rate. However, the evaporation rate does not
drastically decrease as soluble solids content increases. The water activity was measured
for soy sauce, 5 M NaCl, 2.5 M NaCl, and 1.25 M NaCl. Evaporation rates were
calculated at 80% relative humidity for a droplet of the same radius as the opening it
protrudes from.
Table 4 – Evaporation rates (cm3/day) at 80% relative humidity, calculated for liquids with varying soluble solids content having droplet radius of 25 µm and water activity Aw.
Evaporation Rate
Using deionized water as an example, it can be shown that the evaporation rate of
water is greater than the flow rate of water through a microhole of 2 µm hydraulic
diameter (Fig. 4). This is also the case through a 5 µm hydraulic diameter with a pressure
differential of up to 6.9 kPa (Fig 5), and 7 µm and 10 µm hydraulic diameters with
pressure differentials up to 3.45 kPa.
LIQUID A w (cm3/day) water 1.000 0.00959 soy sauce 0.830 0.00786 5 M NaCl 0.792 0.00765 2.5 M NaCl 0.899 0.00862 1.25 M NaCl 0.949 0.00913
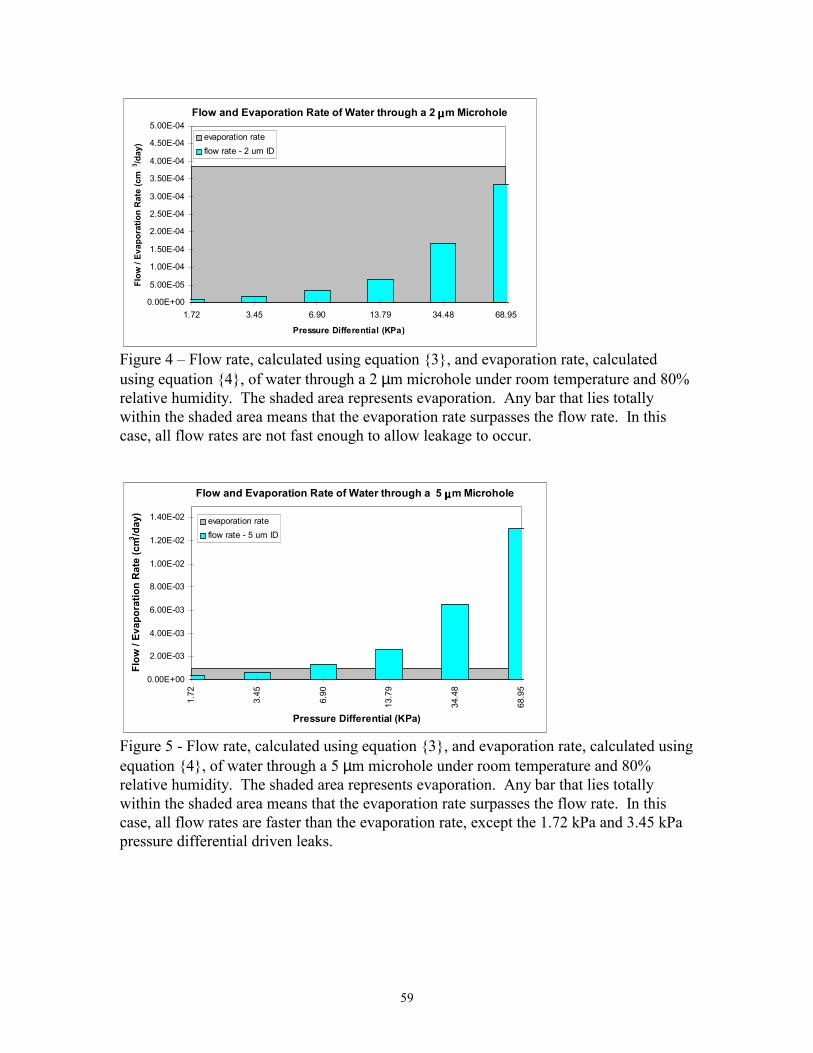
59
Flow and Evaporation Rate of Water through a 2 µµµµm Microhole
0.00E+00
5.00E-05
1.00E-04
1.50E-04
2.00E-04
2.50E-04
3.00E-04
3.50E-04
4.00E-04
4.50E-04
5.00E-04
1.72 3.45 6.90 13.79 34.48 68.95
Pressure Differential (KPa)
Flow
/ Ev
apor
atio
n R
ate
(cm
3 /day
)evaporation rateflow rate - 2 um ID
Figure 4 – Flow rate, calculated using equation {3}, and evaporation rate, calculated using equation {4}, of water through a 2 µm microhole under room temperature and 80% relative humidity. The shaded area represents evaporation. Any bar that lies totally within the shaded area means that the evaporation rate surpasses the flow rate. In this case, all flow rates are not fast enough to allow leakage to occur.
Flow and Evaporation Rate of Water through a 5 µµµµm Microhole
0.00E+00
2.00E-03
4.00E-03
6.00E-03
8.00E-03
1.00E-02
1.20E-02
1.40E-02
1.72
3.45
6.90
13.7
9
34.4
8
68.9
5
Pressure Differential (KPa)
Flow
/ Ev
apor
atio
n R
ate
(cm3 /d
ay)
evaporation rateflow rate - 5 um ID
Figure 5 - Flow rate, calculated using equation {3}, and evaporation rate, calculated using equation {4}, of water through a 5 µm microhole under room temperature and 80% relative humidity. The shaded area represents evaporation. Any bar that lies totally within the shaded area means that the evaporation rate surpasses the flow rate. In this case, all flow rates are faster than the evaporation rate, except the 1.72 kPa and 3.45 kPa pressure differential driven leaks.
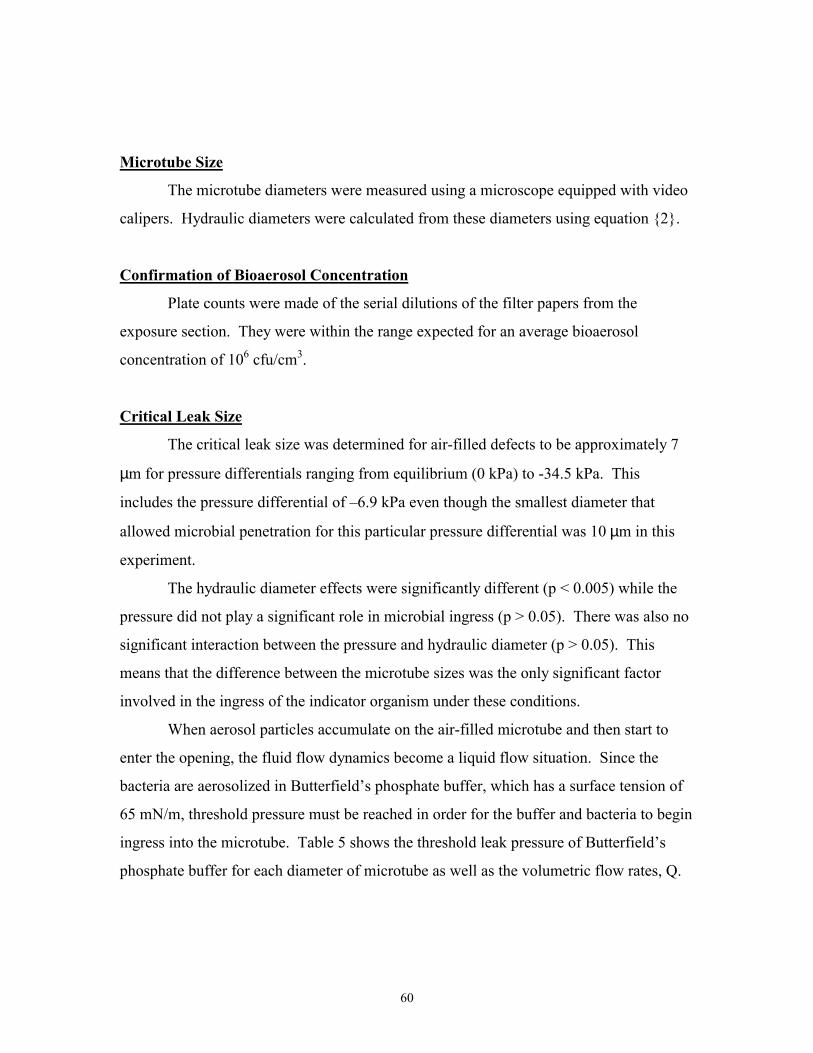
60
Microtube Size
The microtube diameters were measured using a microscope equipped with video
calipers. Hydraulic diameters were calculated from these diameters using equation {2}.
Confirmation of Bioaerosol Concentration
Plate counts were made of the serial dilutions of the filter papers from the
exposure section. They were within the range expected for an average bioaerosol
concentration of 106 cfu/cm3.
Critical Leak Size
The critical leak size was determined for air-filled defects to be approximately 7
µm for pressure differentials ranging from equilibrium (0 kPa) to -34.5 kPa. This
includes the pressure differential of –6.9 kPa even though the smallest diameter that
allowed microbial penetration for this particular pressure differential was 10 µm in this
experiment.
The hydraulic diameter effects were significantly different (p < 0.005) while the
pressure did not play a significant role in microbial ingress (p > 0.05). There was also no
significant interaction between the pressure and hydraulic diameter (p > 0.05). This
means that the difference between the microtube sizes was the only significant factor
involved in the ingress of the indicator organism under these conditions.
When aerosol particles accumulate on the air-filled microtube and then start to
enter the opening, the fluid flow dynamics become a liquid flow situation. Since the
bacteria are aerosolized in Butterfield’s phosphate buffer, which has a surface tension of
65 mN/m, threshold pressure must be reached in order for the buffer and bacteria to begin
ingress into the microtube. Table 5 shows the threshold leak pressure of Butterfield’s
phosphate buffer for each diameter of microtube as well as the volumetric flow rates, Q.
61
Table 5 – Threshold leak pressure, PL, of Butterfield’s phosphate buffer for each hydraulic diameter of microtube calculated using equation {1}, and volumetric flow rate calculated using equation {3}, Q, of Butterfield’s phosphate buffer. Units of cm3/exposure is the volume leaking through the microtube during the 30 minute exposure. Threshold Leak Pressure Volumetric Flow Rates
Hydraulic PL Q Q Diameter (µµµµm) (kPa) (cm3/s) (cm3/exposure)
50 1.59 3.43 x 10⁻⁵ 6.17 x 10⁻² 20 4.62 2.58 x 10⁻⁶ 4.65 x 10⁻³ 10 9.65 3.39 x 10⁻⁷ 6.11 x 10⁻⁴ 7 14.00 1.18 x 10⁻⁷ 2.12 x 10⁻⁴ 5 19.79 1.11 x 10⁻⁹ 2.00 x 10⁻⁶ 2 50.26 2.82 x 10⁻⁹ 5.07 x 10⁻⁶
Table 6 – Number of positives out of three replicates for microbial ingress at each imposed vacuum (0, -6.9, -13.8, -34.5 kPa) for each microtube hydraulic diameter (0, 2, 5, 7, 10, 20, and 50 µm).
Hydraulic Imposed Vacuums Diameter (µµµµm) 0 kPa -6.9 kPa -13.8 kPa -34.5 kPa
0 0/3 0/3 0/3 0/3 2 0/3 0/3 0/3 0/3 5 0/3 0/3 0/3 0/3 7 1/3 0/3 2/3 3/3 10 1/3 1/3 2/3 1/3 20 3/3 0/3 3/3 2/3 50 3/3 3/3 3/3 3/3
The findings of the experiment coincide with Table 5 only partially. At an
imposed pressure of 34.5 kPa, the threshold leak size appears to be 5 µm because it only
requires 19.79 kPa of pressure to initiate the leak. While this may be the case using the
threshold leak pressure equation {2}, other factors exist in this experimental set-up. The
leak rate, for instance, may not be fast enough in the allotted time of the test run to allow
the bacteria to traverse the microtube length. The leak rate at –34.5 kPa, through the 7
62
µm hole is 100 times faster than the leak rate of the 5 µm hole. This may be the reason
that microbial penetration is seen at the 7 µm and not the 5 µm.
At the imposed pressure of -6.9 kPa, the critical leak size appears to be 10 µm
from the experiment. The threshold leak pressure for the 10 µm hole is 9.65 kPa from
Table 5. How can a leak occur if the threshold pressure has not been achieved? This
question may be answered by simply stating that the threshold leak pressure equation is
an approximation. The threshold may be breached by the capillary action of the buffer
into the microtube or maybe the hole was large enough that the aerosol droplet did not
completely cover the opening of the microtube, therefore rendering the threshold leak
pressure equation inaccurate and non-predictive. Another explanation could be that
surface oxidation of the nickel microtubes may reduce the imposed pressure required to
initiate a leak (31).
This is also the case with the equilibrium, 0 kPa, pressure differential. From the
threshold leak pressure equation, there should be no leaking of buffer or bacteria into the
test cell. This, however, is not the observation from the experiment. The experimental
data shows that the critical leak size is 7 µm at 0 kPa (Table 4).
The critical leak size should be a conservative number. This is why 7 µm was
chosen as the critical leak size for all of the pressure differentials (Table 7). There is a
degree of probability associated with the entry, and penetration of a bioaerosol particle
through a microtube. This could explain the reason why one of the three replicates of the
0 kPa pressure differential was positive for microbial ingress at 7 µm and 10 µm, whereas
none of the three replicates at –6.9 kPa pressure differential and 7 µm and 20 µm saw
microbial penetration (Table 6).
To recap an earlier investigation (24), an immersion biotest was done using semi-
rigid aseptic cup lids and retort trays with laser-drilled holes of diameters ranging from 10
- 20 µm. The holes in the aseptic cup lids were drilled from the outside to the inside, and
the holes in the retort trays were drilled from the inside to the outside. The hole sizes
were then measured on the inside and outside of the package after the biotest. For the
aseptic cup lids, the hole on the outside was measured to be 10 µm before and after the
test. The inside of the lid showed the hole to be 7 µm after the test (24). The retort trays
63
hole sizes could not be confirmed after the test so an estimation from the measurements
of the aseptic cup lids hole sizes would be that the inside defect of the retort tray would
be 10 µm and the outside defect would be approximately 7 µm. The data from the
immersion test showed that the aseptic cup lids allowed microorganisms into the
container at a higher percentage than the tests with the retort trays (24). Since the defects
manufactured in the retort tray cannot be confirmed, a guess to their size would be less
than 7 µm and quite possibly less than 5 µm. The threshold leak size has not been
reached for the pressure that the liquid static head is exerting on the defect, so no liquid is
entering the defect, thus there is no microbial ingress.
Table 7 – Critical Leak Size of an air-filled microtube at imposed pressures (0, -6.9, -13.8, and –34.5 kPa). An ‘X’ represents at least one positive out of 3 replicates. A ‘-‘ represents zero positives.
Hydraulic IMPOSED PRESSURES Diameter (µµµµm) 0 kPa -6.9 kPa -13.8 kPa -34.5 kPa
0 - - - - 2 - - - - 5 - - - - 7 X - X X 10 X X X X 20 X - X X 50 X X X X
Table 8 – Critical leak sizes at different imposed pressures for a liquid-filled microtube (31). The ‘X’ represents at least one positive out of 9 replicates and the ‘-‘ represents zero positives out of 9 replicates.
Hydraulic IMPOSED PRESSURES Diameter (µµµµm) 20.7 kPa 13.8 kPa 6.9 kPa 0 kPa -6.9 kPa -13.8 kPa -20.7 kPa
0 - - - - - - - 2 - - - - - - - 5 X X - - - X X 7 X X - - - X - 10 X X - - - X X 20 X X X - - X X 50 X X X X X X X
64
Previous research has shown that the critical leak size of a liquid-filled defect,
where the bacteria must penetrate upwards into the test cell against gravity, ranges from 5
to 20 µm (31). Table 8 shows that the critical leak size of positive and negative pressure
with magnitudes of 13.8 and 20.7 kPa is 5 µm. When the pressure is reduced to between
6.9 and –6.9 kPa, the critical leak size drops to 20 and 50 µm (31). The reason that the
critical leak size increases so much at the lower pressures is because the threshold leak
size has not been reached, thus there is no liquid channel formed between the inside and
the outside of the test cell. Since the test cells are upside-down, the bacteria require a
medium by which to maneuver through the microtube and at the lower pressure
differentials, that medium is not present.
CONCLUSIONS
The threshold leak pressures were calculated from density and surface tension
measurements of a wide range of liquid food products and standard dyes used in dye
penetration testing of package integrity. The threshold leak pressure equation can only be
applied to liquid food products that have been filtered, as particulate matter in the liquid
will clog even a 50 µm defect. Considering typical pressures generated within a food
package (Po ≤ ±34.5 kPa), a defect with a 2 µm hydraulic diameter will never reach the
threshold pressure for most filtered liquid food products.
Even if the threshold pressure were breached, the leak rate would be slower than
the evaporation rate, resulting in no net leakage. Also, since most filtered liquid food
products are not pure water, if the evaporation rate is faster than the leak rate, then
soluble solids may also be left behind, thus effectively resealing the leak.
The critical leak size of an air-filled defect was experimentally determined, by
bioaerosol exposure, to be approximately 7 µm for pressure differentials ranging from
equilibrium (0 kPa) to -34.5 kPa. This is slightly different than the previous results of a
liquid-filled defect, in which the critical leak size coincided with the threshold leak size.
65
REFERENCES
1. Amini, M. A., and D. R. Morrow. 1979. Leakage and permeation: theory and practical
applications. Package Dev. and Sys. May/June: 20-27. 2. Anderson, G. L. 1989. Leak testing. p.50-57. In 9th ed. Nondestructive evaluation and
quality control: metals handbook. AOAC International, Rockville, MD. 3. Anema, P. J., and B. L. Schram. 1980. Prevention of post-process contamination of
semi-rigid and flexible containers. J. Food Prot. 43(6):461-464. 4. Bankes, P., and M. F. Stringer. 1988. The design and application of a model system to
investigate physical factors affecting container leakage. Int. J. Food Micro. 6:281-286. 5. Bausum, H. T., S. A. Schaub, K. F. Kenyon, and M. J. Small. 1982. Comparison of
coliophage and bacterial aerosols at a wastewater spray irrigation site. Appl. Environ. Microbiol. 43(1):28-38.
6. Blakistone, B. A. 1996. EU/USA status report: the current issues in plastic packaging
seal evaluation in Europe and the USA. Pack. Technol. 13(3): 7. Blakistone, B. A., S. W. Keller, J. E. Marcy, G. H. Lacy, C. R. Hackney, and W. H.
Carter, Jr. 1996. Contamination of flexible pouches challenged by immersion biotesting. J. Food Prot. 59(7):764-767.
8. Bovallius, A., B. Bucht, R. Roffey, and P. Anas. 1978. Long-range air transmission of
bacteria. Appl. Environ. Microbiol. 35(6):1231-1232. 9. Bryant, M. 1988. Packaging failures: quality in design doesn’t end with the finished
product. Med. Dev. & Diag. Ind. 10(8):30-33. 10. Butler, L. D., J. J. Coupal, and P. P. DeLuca. 1978. The detection of ampul leakers
using short-lived radionuclides. J. Parenter. Drug Assoc. 32(1): 2-9. 11. Carter, H. W. 2000. Personal Communication. Chair of Biostatistics Department,
Medical College of Virginia, Richmond, VA. 12. Chen, C., B. Harte, C. Lai, J. Pestka, and D. Henyon. 1991. Assessment of package
integrity using a spray cabinet technique. J. Food Prot. 54(8):643-647.
66
13. Clark, S. R. Rylander, and L. Larsson. 1983. Airborne bacteria, endotoxin and fungi in dust in poutry and swine confinement buildings. Am. Ind. Hyg. Assoc. J. 44(7):537-541.
14. Davidson, P. M., and I. J. Pflug. 1981. Leakage potential of swelled cans of low-acid
foods collected from supermarkets. J. Food. Prot. 44(9):692-695. 15. Davis, R. M. 1999. Personal Communication. Associate Professor, Chemical
Engineering, Virginia Polytechnic Institute and State University, Blacksburg, VA. 16. Dimmick, R. L., H. Wolochow, and M. A. Chatigny. 1979. Evidence for more than
one division of bacteria within airborne particles. Appl. Environ. Microbiol. 38(4):642-643.
17. Gilchrist, J. E., U. S. Rhea, R. W. Dickerson, and J. E. Campbell. 1985. Helium leak
test for micron-sized holes in canned foods. J. Food Prot. 48(10):856-860. 18. Gilchrist, J. E., D. B. Shah, D. C. Radle, and R. W. Dickerson, Jr. 1989. Leak
detection in flexible retort pouches. J. Food Prot. 52(6):412-415. 19. Guazzo, D.M. 1994. Package Integrity Testing, p. 247-276. In M. J. Akers (ed.),
Parenteral quality control: sterility, pyrogen, particulate, and package integrity testing, 2nd ed Mercel Dekker, New York.
20. Hackett, E. T. 1996. Dye penetration effective for detecting package seal defects.
Packag. Tech. Eng. 8:49-52. 21. Harper, C. L., B. A. Blakistone, J. B. Litchfield, S. A. Morris. 1995. Developments in
food packaging integrity testing. Trends in Food Sci. and Technol. 6(10):336-340. 22. Hoffman, W. 1996. Cooperative research and development agreement. Philips
Laboratory, OLAC PL/RKFE. Edwards, CA. 23. Howard, G., and R. Duberstein. 1980. A case of penetration of 0.2 mm rated
membrane filters by bacteria. J. Parenter. Drug Assoc. 34(2):95-102. 24. Hurme, E. U., G. Wirtanen, L. Axelson-Larsson, N. A. M. Pachero, and R.
Ahvenainen. 1997. Penetration of bacteria through microholes in semirigid aseptic and retort packages. J. Food Prot. 60(5):520-524.
25. Hurme, E. U., and R. Ahvenainen. 1998. A nondestructive leak detection method for
flexible food packages using hydrogen as a tracer gas. J. Food Prot. 61(9):1165-1169. 26. Jackson, G (ed.). 1995. Bacteriological Analytical Manual, 8th ed. p.3.64. Food and
Drug Administration. AOAC International, Rockville, MD.
67
27. Jarrosson, B. P. 1992. Closure integrity testing of heat sealed aseptic packaging using
scanning acoustic microscopy. M.S. Thesis, Virginia Polytechnic Institute and State University, Blacksburg, VA.
28. Kamei, T., J. Sato, A. Natsume, and K. Noda. 1991. Microbiological quality of
aseptic packaging and the effect of pinholes on sterility of aseptic products. Pack. Technol. and Sci. 4:185-193.
29. Keller, S., J. E. Marcy, B. A. Blakistone, and G. H. Lacy. 1995. Package integrity
biotesting: aerosol versus immersion. In T. Ohlsson (ed.). Proceedings of the International Symposium Advances in Aseptic Processing and Packaging Technologies. SIK, Goteborg, Sweden.
30. Keller, S., J. E. Marcy, B. A. Blakistone, G. H. Lacy, C. R. Hackney, and W. H.
Carter, Jr. 1996. Bioaerosol exposure method for package integrity testing. J. Food Prot. 59(7):768-771.
31. Keller, S. 1998. Determination of the leak size critical to package sterility
maintenance. Ph.D. Dissertation, Virginia Polytechnic Institute and State University, Blacksburg, VA.
32. Keller, S. Personal communication. 33. Kelsey, R. J. 1990. The status of leak detection. Food and Drug Pack. 11:8-21. 34. Lacy, G. H. 1999. Personal communication. Professor, Plant Pathology, Physiology
and Weed Science, Virginia Polytechnic Institute and State University, Blacksburg, VA.
35. Lake, D. E., R. R. Graves, R. S. Lesniewski, and J. E. Anderson. 1985. Post-processing spoilage of low-acid canned foods by mesophilic anaerobic sporeformers. J. Food Prot. 48(3):221-226.
36. Lampi, R. A. 1980. Retort pouch: the development of a basic packaging concept in today’s high technology era. J. Food Process Eng. 4:1-18.
37. Lenhart, S. W., S. A. Olenchock, and E. C. Cole. 1982. Viable sampling for airborne
bacteria in a poultry processing plant. J. Toxicol. Environ. Health. 10:613-619. 38. McEldowney, S., and M. Fletcher. 1988. Bacterial desorption from food container and
food processing surfaces. Microb. Ecol. 15:229-237. 39. McEldowney, S., and M. Fletcher. 1990a. A model system for the study of food
container leakage. J. Appl. Bacteriol. 69:206-210.
68
40. McEldowney, S., and M. Fletcher. 1990b. The effect of physical and microbiological
factors on food container leakage. J. Appl. Bacteriol. 69:190-205. 41. Michels, M. J. M., and B. L. Schram. 1979. Effect of handling procedures on the post-
process contamination of retort pouches. J. Appl. Bacteriol. 47:105-111. 42. Morris, S. A., A. Ozguler, and W. D. O’Brien, Jr. May 21, 1999. “New sensors help
improve heat-seal microleak detection.” (Packaging Technology and Engineering Feature). [Internet, WWW]. ADDRESS: http://www.napco.com/pte/0798sensors.html.
43. Morton, D. K. 1987. Container/closure integrity of parenteral vials. J. Parenter. Sci. Technol. 41(5):145-158.
44. Morton, D. K., N. G. Lordi, L. H. Troutman, and T. J. Ambrosio. 1989. Quantitative
and mechanistic measurements of container/closure integrity: bubble, liquid, and microbial leakage tests. J. Parenter. Sci. Technol. 43:104-108.
45. Pflug, I. J., P. M. Davidson, and R. G. Holcomd. 1981. Incidence of canned food
spoilage at the retail level. J. Food Prot. 44(9):682-685. 46. Placencia, A. M., G. S. Oxborrow, and J. T. Peeler. 1986. Package integrity
methodology for testing the biobarrier of porous packaging. part II: FDA exposure-chamber method. Med. Dev. & Diag. Ind. 8(4)46-53.
47. Put, H. M. C., H. T. Witvoet, and W. R. Warner. 1972. Mechanism of
microbiological leaker spoilage of canned foods: a review. J. Appl. Bacteriol. 35:7-27.
48. Put, H. M. C., H. T. Witvoet, and W. R. Warner. 1980. Mechanism of
microbiological leaker spoilage of canned foods: biophysical aspects. J. Food Prot. 43(6):488-497.
49. Raabe, O. G. (ed.). 1976. The generation of aerosols of fine particles. p.57-68. In Fine
particles, aerosol generation, measurement, sampling, and analysis. Academic Press, Inc. New York, NY.
50. Reich, R. R. 1985. A method for evaluating the microbial barrier properties of intact
packages. Med. Dev. and Diag. Ind. 7(3):80-88. 51. Sheehan, M. J., and J. V. Giranda. 1994. Bioaerosol generation in a food processing
plant: a comparison of production and sanitation operations. Appl. Occup. Environ. Hyg. 9(5):346-352.
69
52. Spitzley, J. 1993. How effective is microbial challenge testing for intact sterile packaging? Med. Dev. and Diag. Ind. 15(8):44-46.
53. Stauffer, T. 1990. Non-destructive testing on flexible packaging. J. Pack. Technol.
July/August:27-29. 54. Stauffer, T. 1995. On and off line leak detection of containers and packages. In
Activities report of the R & D associates. 47(1):8-18. Research and Development Associates for Military Food and Packaging Systems, Inc. New York, NY.
55. Stersky, A., E. Todd, and H. Pivnick. 1980. Food poisoning associated with post
process leakage (PPL) in canned foods. J. Food. Prot. 43(6):465-476. 56. Teltsch, B., H. I. Shuval, and J. Tadmor. 1980. Die-away knetics of aerosolized
bacteria from sprinkler application of wastewater. Appl. Environ. Microbiol. 39(6):1191-1197.
57. Thompson, P. J., and M. A. Griffith. 1983. Identity of mesophilic anaerobic
sporeformers cultured from recycled cannery cooling water. J. Food Prot. 46(5):400-402.
70
Vita The author, Matthew Joseph Gibney IV, was born in Biloxi, Mississippi on February 27, 1973. He is the first son out of six children born to Dr. Sheila A. Gibney and Dr. Matthew J. Gibney III who reside in McLean, Virginia. Matt graduated in 1991 from the Thomas Jefferson High School for Science and Technology. He matriculated to Virginia Polytechnic Institute and State University where he studied microbiology and immunology and earned a B. S. degree in 1995. During the spring semester of 1995, Matt began work at a biotechnology company, CropTech, in Blacksburg, Virginia. For the next four years he learned much about the biotechnological techniques required for creating transgenic tobacco plants and the recovery of the transgenic protein.
After learning of the lucrative careers in the food industry, Matt enrolled in the Food Science and Technology M. S. degree program at Virginia Tech in 1999. It was in this program where he became interested in the packaging aspects of food and pharmaceutical production.
Related Documents