Power, Gas and Certificates Trading Industry in Europe January 29, 2015 Presented by Elie El Haddad 1

Power, Gas and Certificates Trading Industry in Europe
Aug 15, 2015
Welcome message from author
This document is posted to help you gain knowledge. Please leave a comment to let me know what you think about it! Share it to your friends and learn new things together.
Transcript
Power, Gas and Certificates Trading Industry in Europe
January 29, 2015
Presented by Elie El Haddad
1
Agenda
Industry Overview ETRM Projects Requirements Comparative numbers
2
Why are the Power, Gas and Emissions always mentioned together?
• ETRM (Energy Trading and Risk Management) often refers to the power, gas and emissions trading.
• Why Gas traded as energy? Simply because its unit is the Watt.
• An energy producer, to be able to generate and trade power, needs to trade Gas and Emissions, Coal, Fuel Oil, etc. Plus some basic FX and MM trades.
• Nuclear combustibles like enriched uranium are not traded in open markets, but are part of more complex deals and agreements.
3
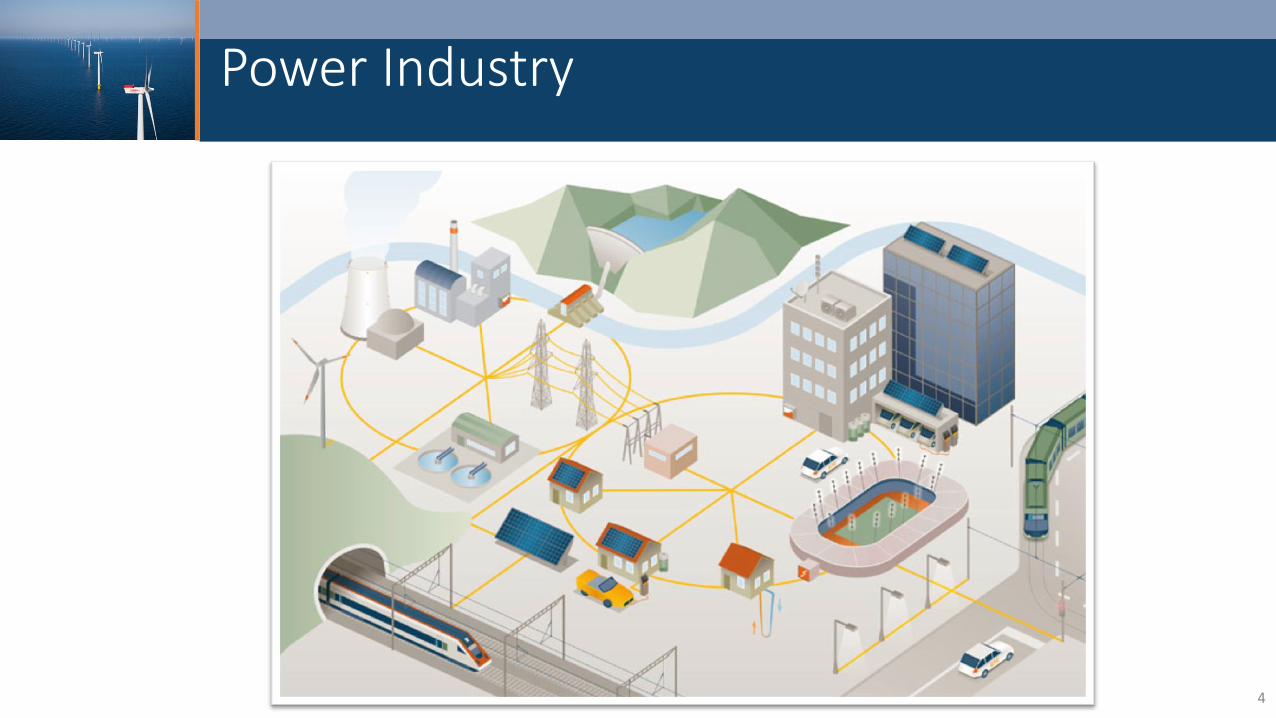
Power Industry
4
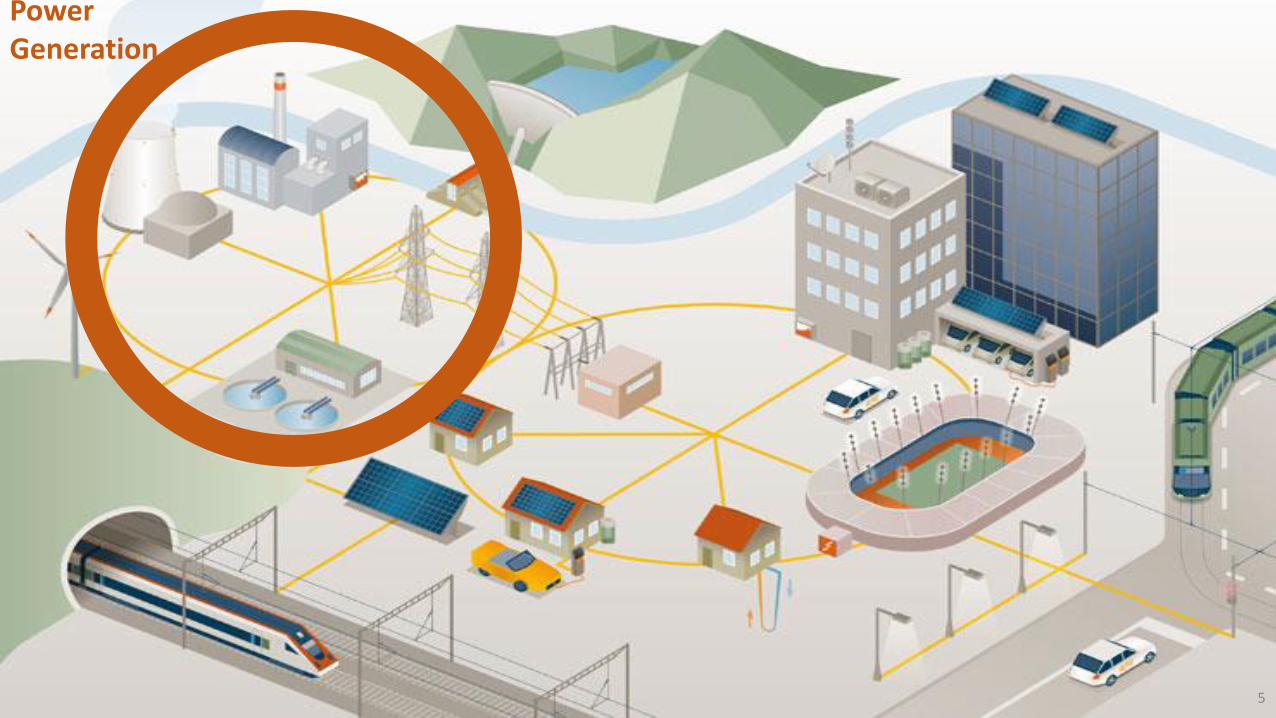
Power Generation
5
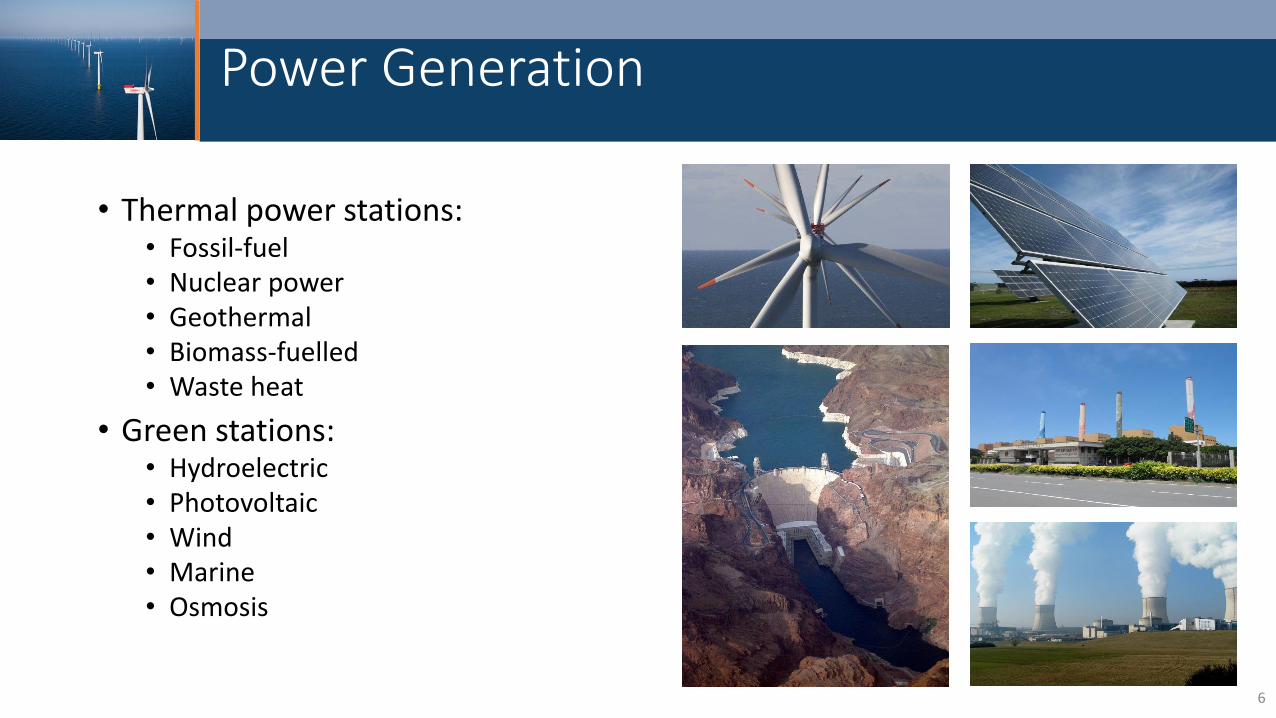
Power Generation
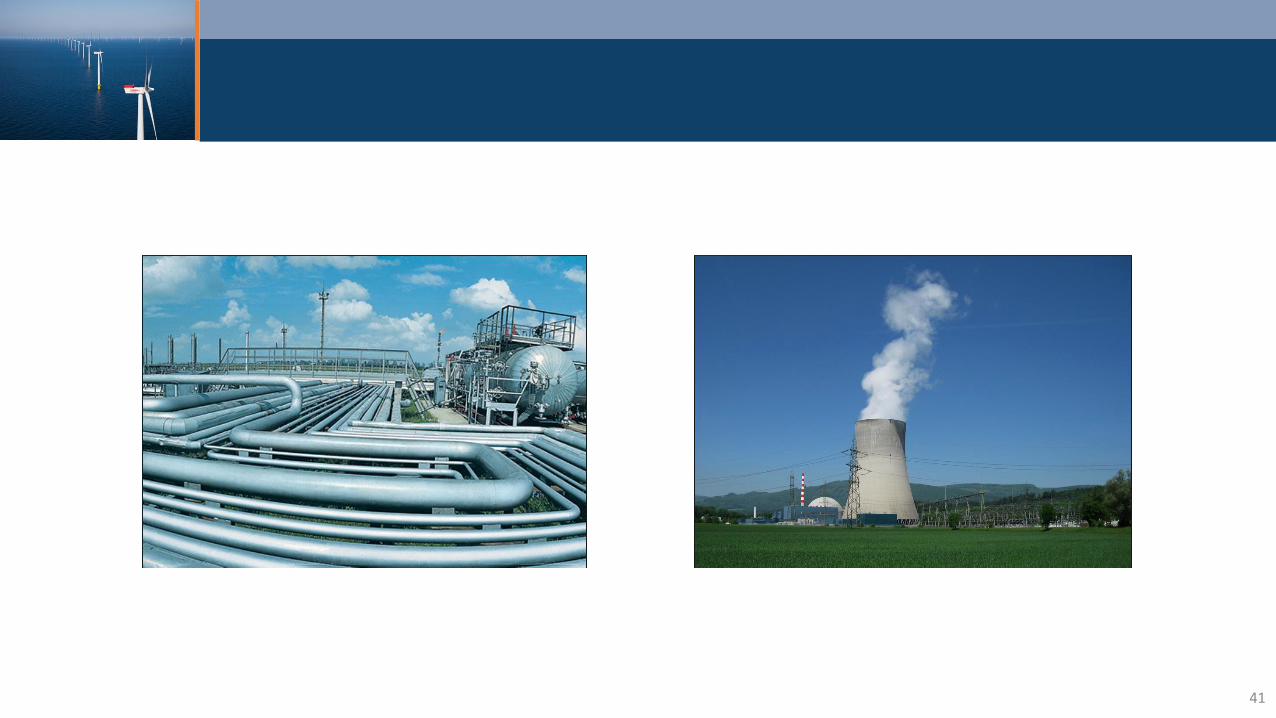
• Thermal power stations: • Fossil-fuel • Nuclear power • Geothermal • Biomass-fuelled • Waste heat
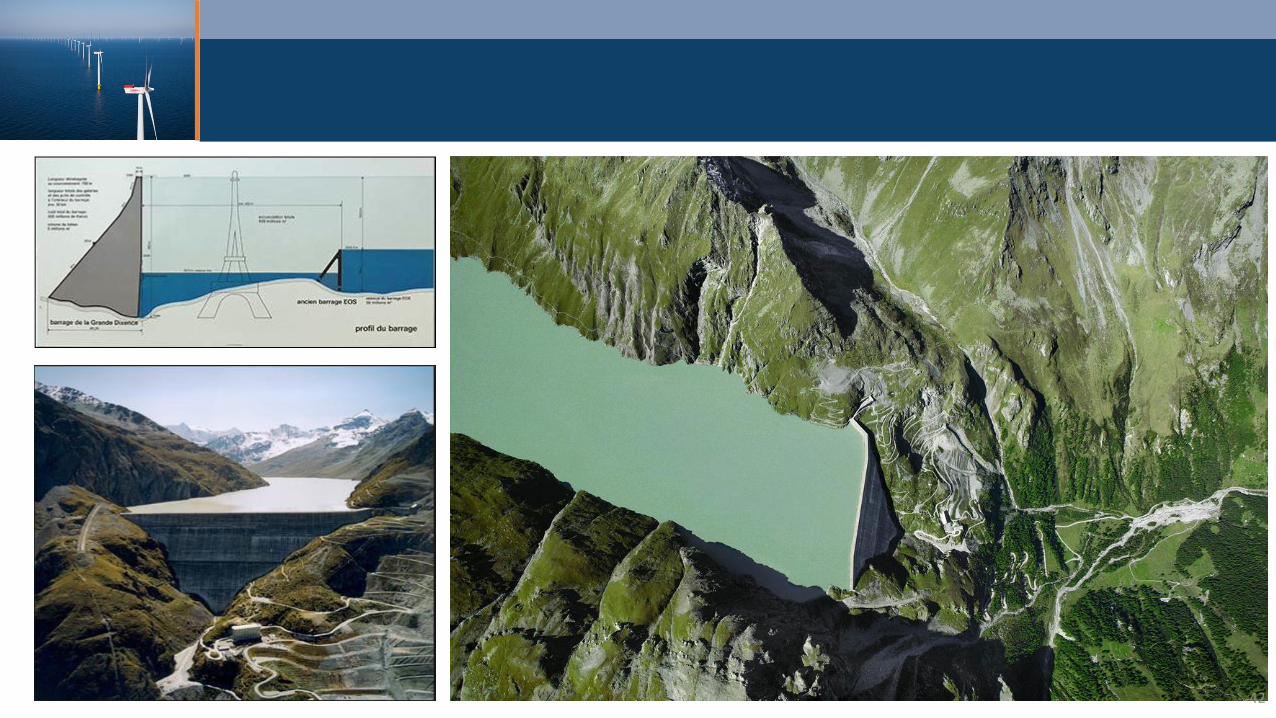
• Green stations: • Hydroelectric • Photovoltaic • Wind • Marine • Osmosis
6
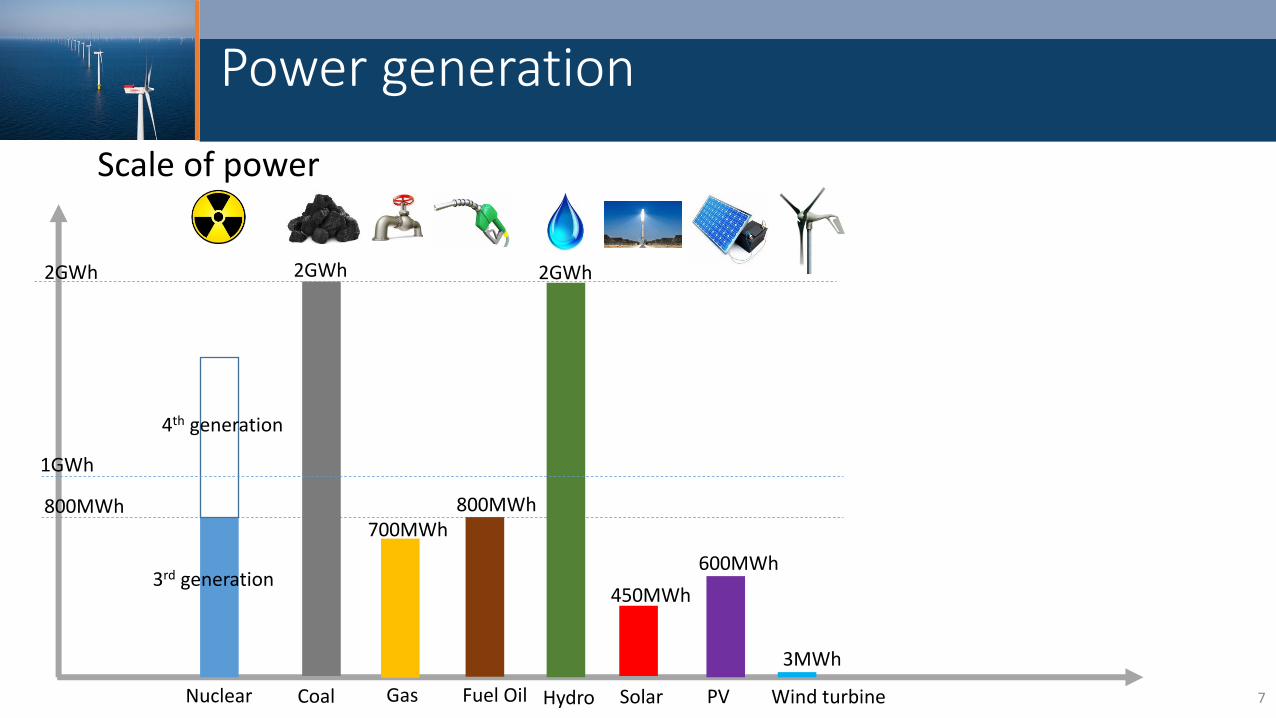
Power generation
Scale of power
800MWh
Nuclear
3MWh
Wind turbine
450MWh
Solar Hydro
2GWh 2GWh
Coal
4th generation
3rd generation
Gas
700MWh
600MWh
PV
800MWh
Fuel Oil
1GWh
2GWh
7
Power Generation
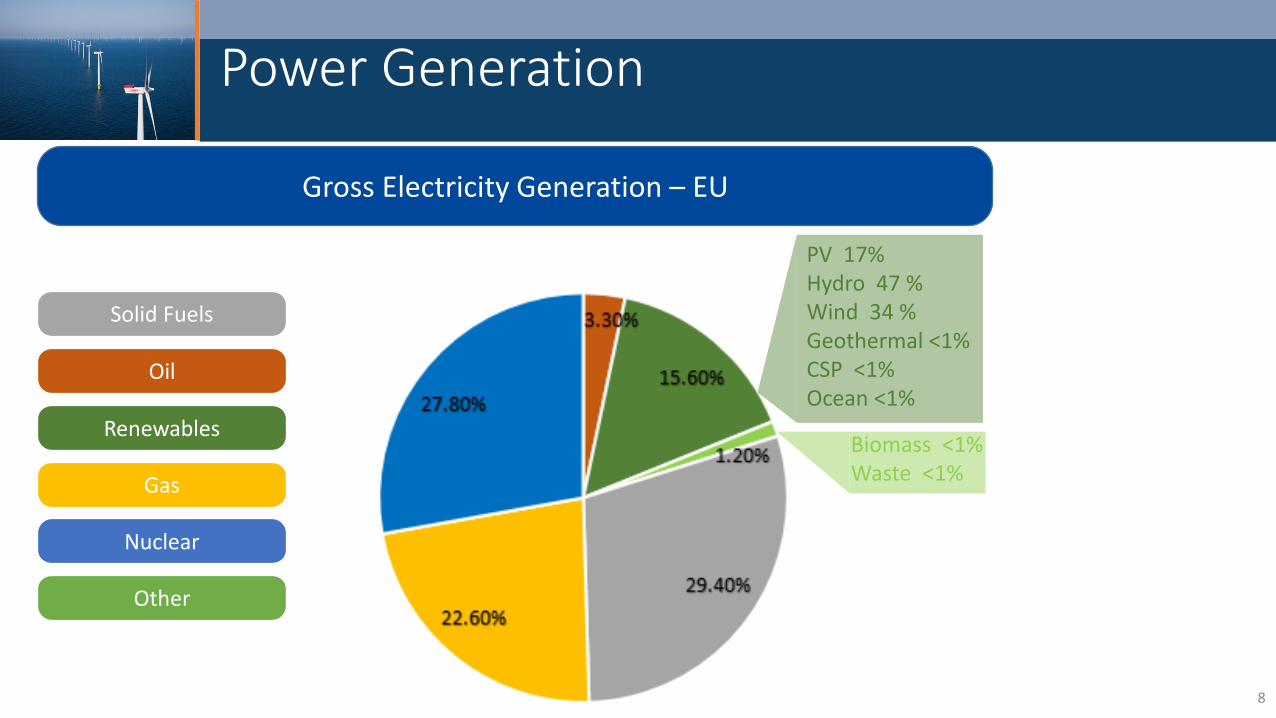
Gross Electricity Generation – EU
Solid Fuels
Oil
Renewables
Gas
Nuclear
Other
Biomass <1% Waste <1%
PV 17% Hydro 47 % Wind 34 % Geothermal <1% CSP <1% Ocean <1%
8
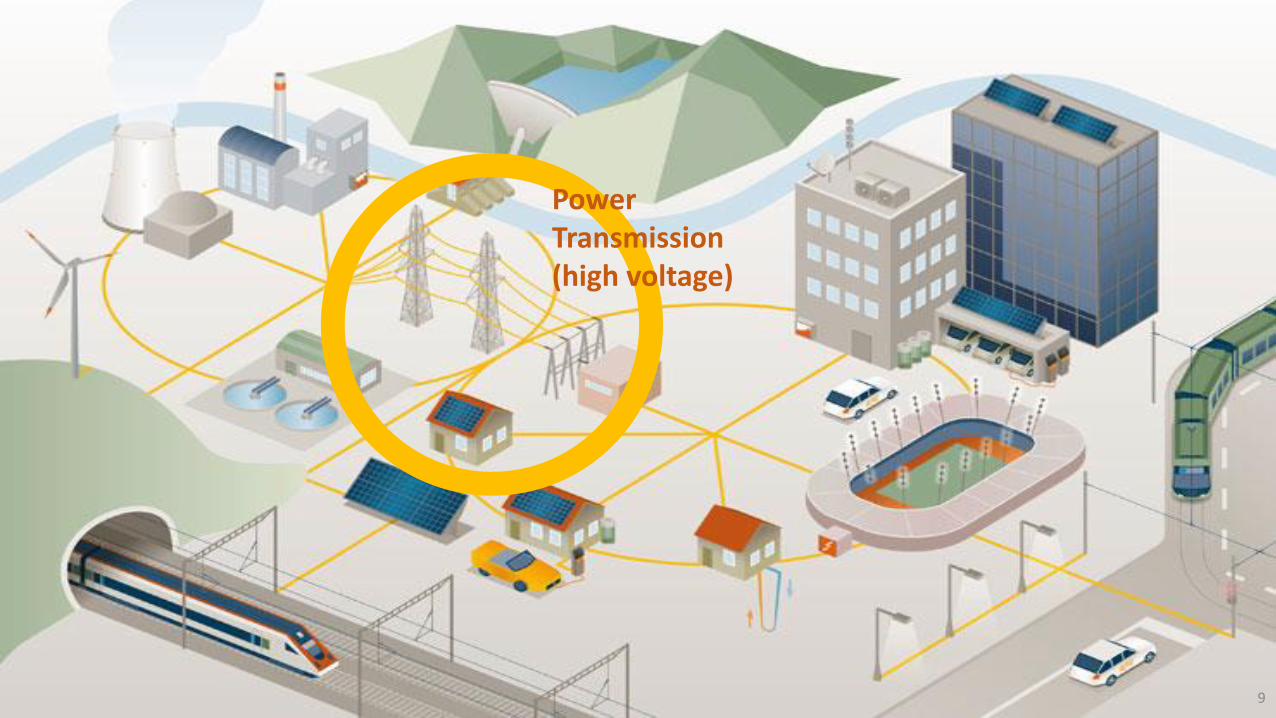
Power Transmission (high voltage)
9
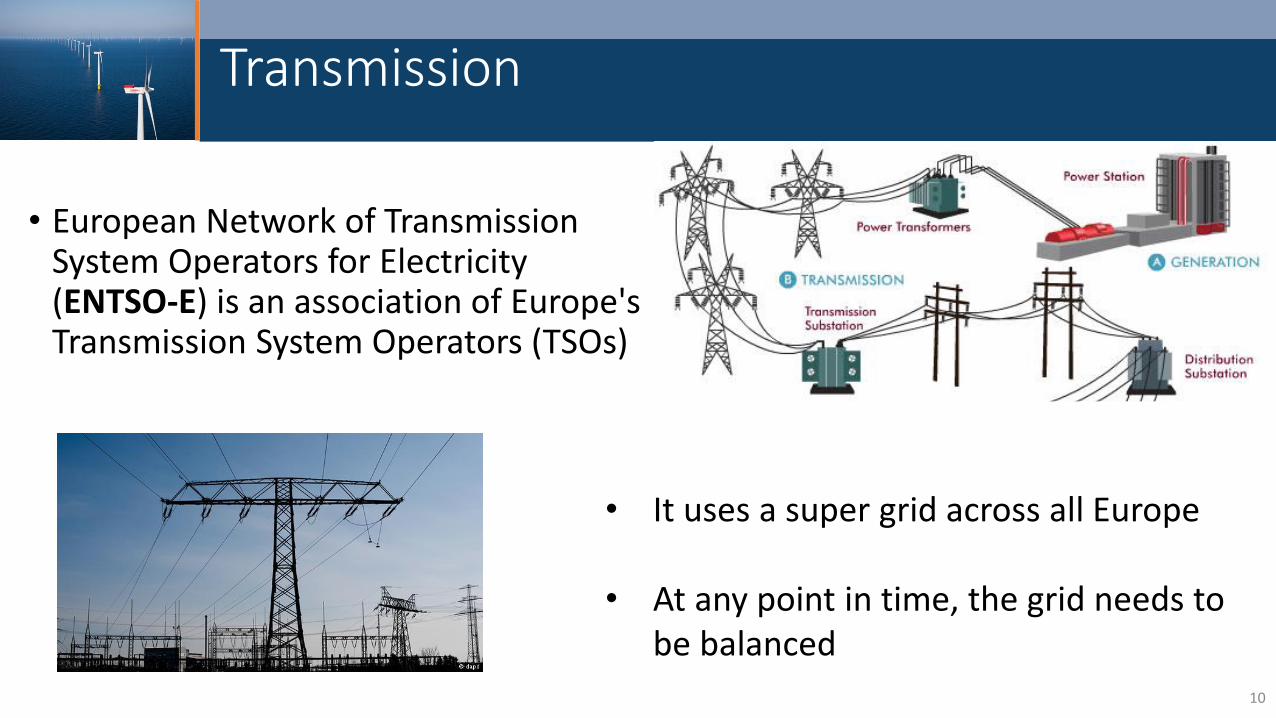
Transmission
• European Network of Transmission System Operators for Electricity (ENTSO-E) is an association of Europe's Transmission System Operators (TSOs)
• It uses a super grid across all Europe
• At any point in time, the grid needs to
be balanced
10
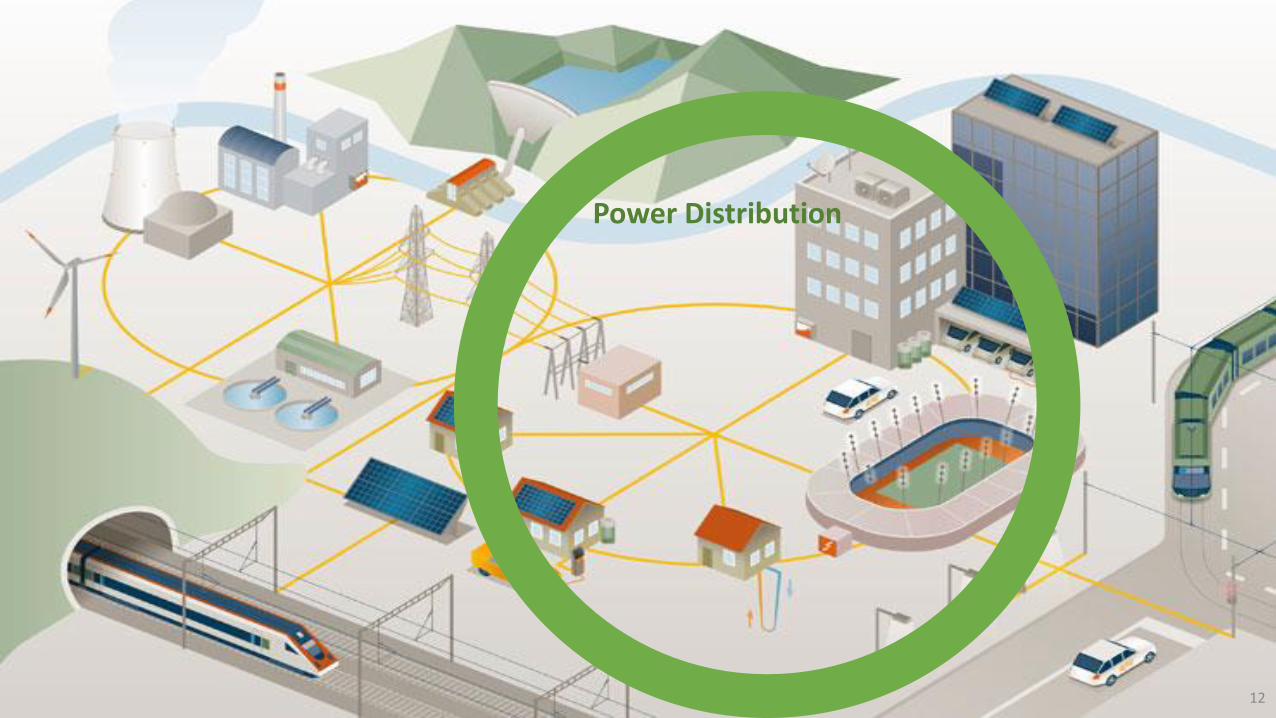
Power Distribution
12
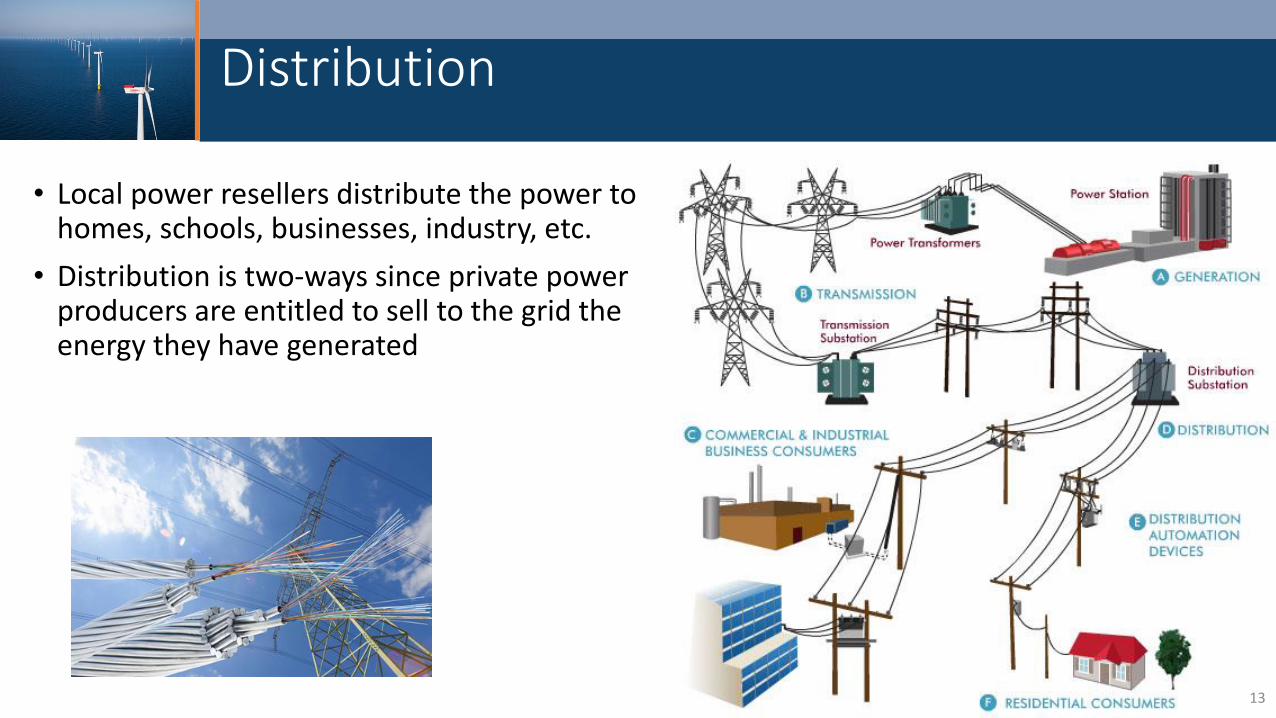
Distribution
• Local power resellers distribute the power to homes, schools, businesses, industry, etc.
• Distribution is two-ways since private power producers are entitled to sell to the grid the energy they have generated
13

ETRM Projects
Basically, what is required is to set up a platform to:
- Calculate the Risk
- Price the power
- Trade it
- Trade the other needed assets to produce the power
Except that we are dealing with the most complex machines ever built and exploited by man : Nuclear Reactors
And put under huge constraints in terms of availability and precision
14
What is the asset being traded?
• By nature, electricity cannot be “kept for later”
• This is what distinguishes it from other financial or physical assets:
Electric power must be consumed at the very moment and place it is produced
• Demand fluctuates, but supply is inflexible
• As a consequence, the total electricity grid must at any time and place be “in balance” In order to guarantee the overall balance, a framework is imposed on every participant
• Up-front: rules • Real-time: adjustments • After-event: penalties
15
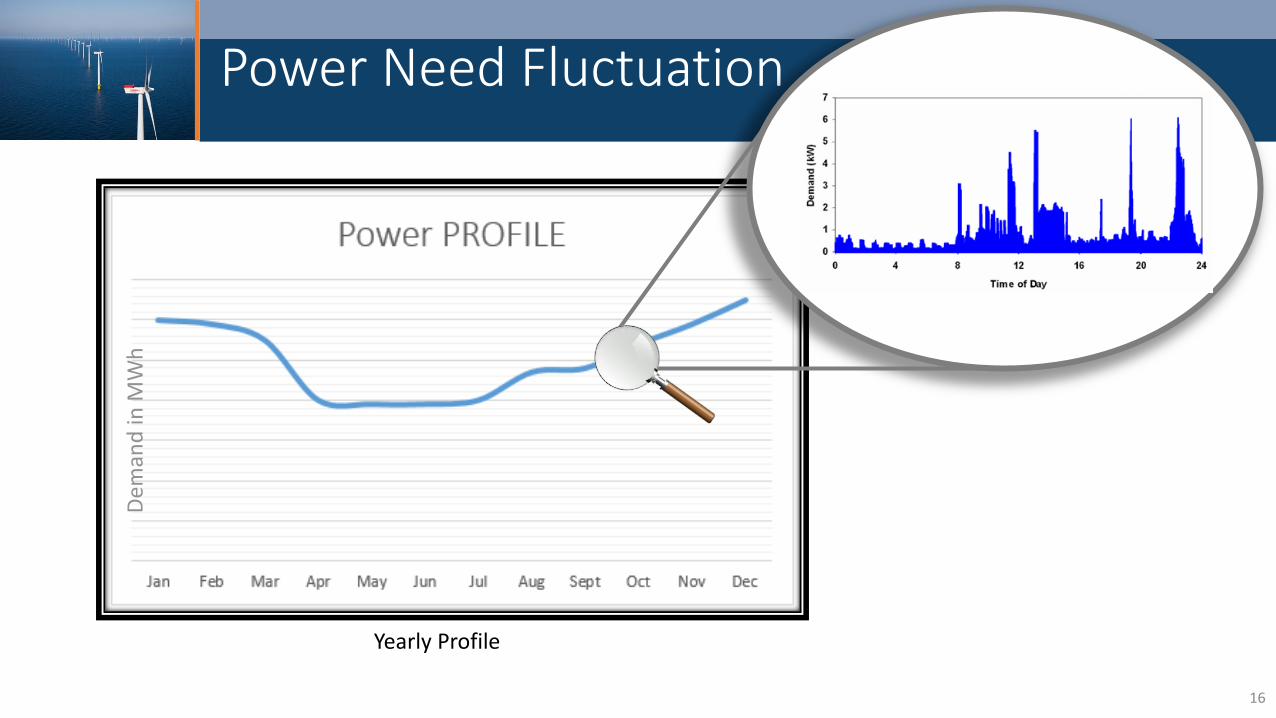
Power Need Fluctuation
Yearly Profile
Dem
and
in M
Wh
16
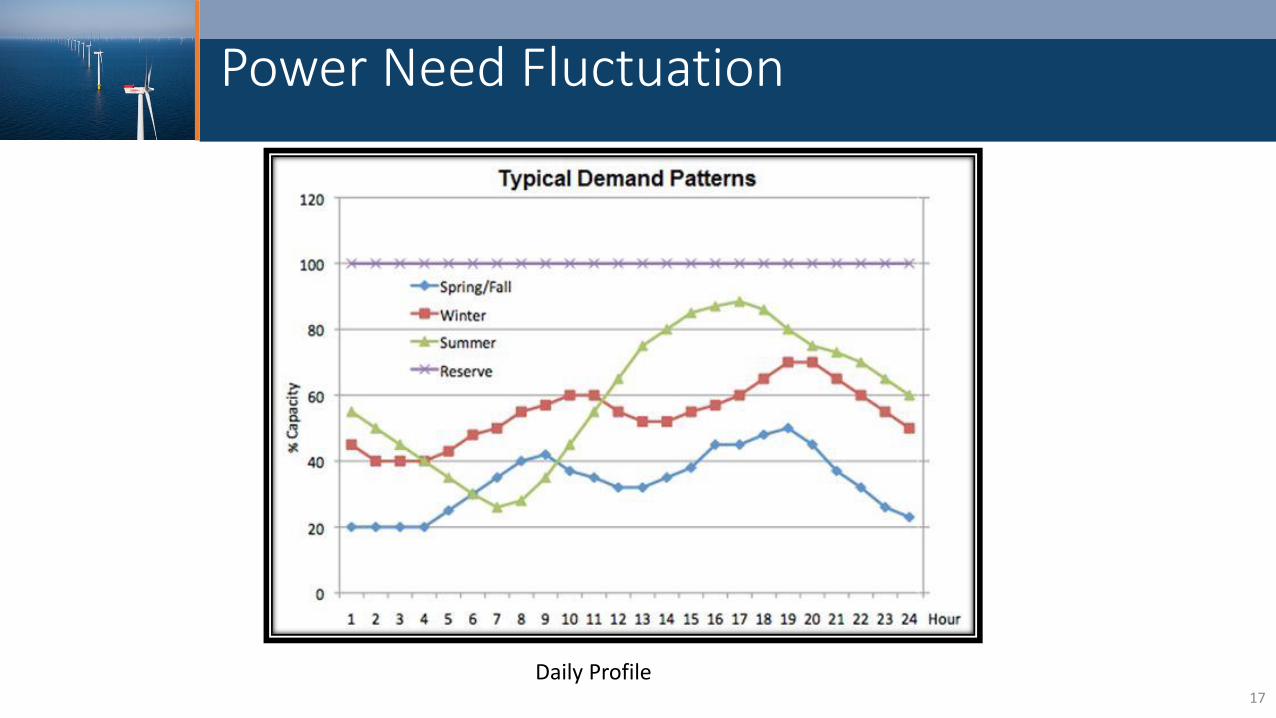
Power Need Fluctuation
Daily Profile 17
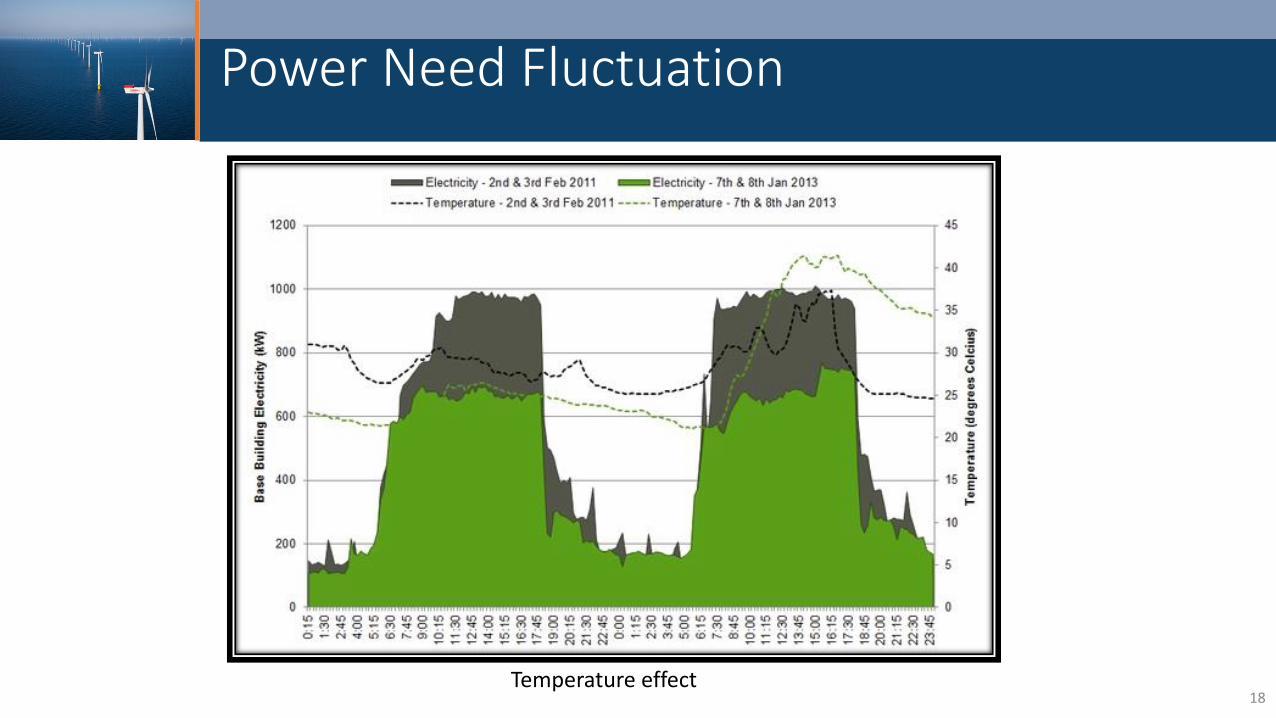
Power Need Fluctuation
Temperature effect 18
Power Need Fluctuation
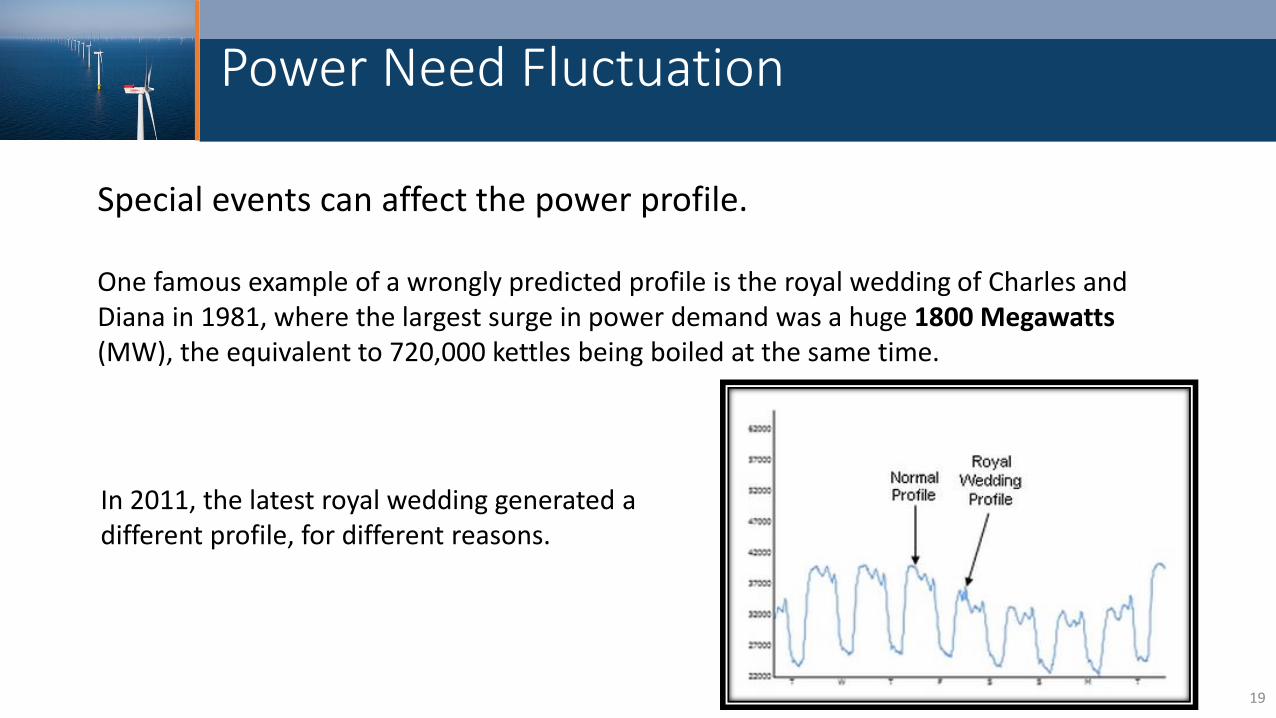
Special events can affect the power profile.
One famous example of a wrongly predicted profile is the royal wedding of Charles and Diana in 1981, where the largest surge in power demand was a huge 1800 Megawatts (MW), the equivalent to 720,000 kettles being boiled at the same time.
In 2011, the latest royal wedding generated a different profile, for different reasons.
19
Power Need Fluctuations
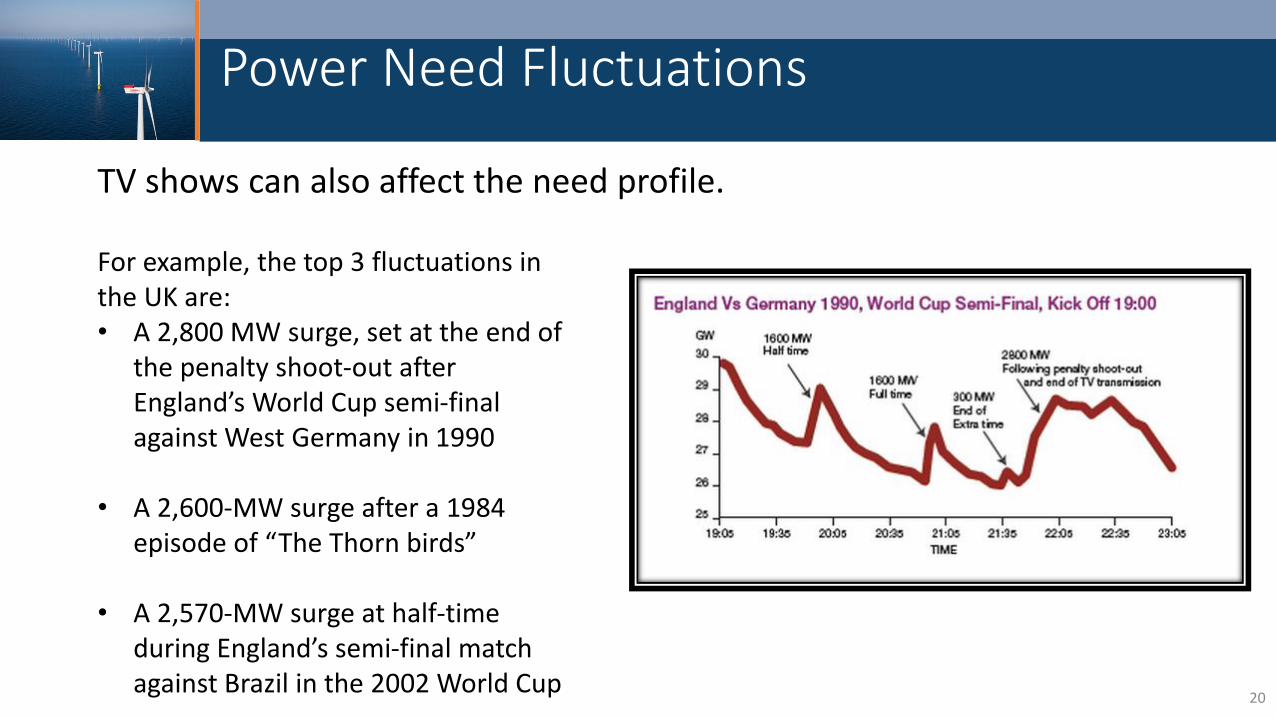
TV shows can also affect the need profile.
For example, the top 3 fluctuations in the UK are: • A 2,800 MW surge, set at the end of
the penalty shoot-out after England’s World Cup semi-final against West Germany in 1990
• A 2,600-MW surge after a 1984 episode of “The Thorn birds”
• A 2,570-MW surge at half-time during England’s semi-final match against Brazil in the 2002 World Cup
20
What happens when power need fluctuates?
When demand raises, power suppliers must provide power on the spot to their clients:
They use the ETRM to buy and sell power
21
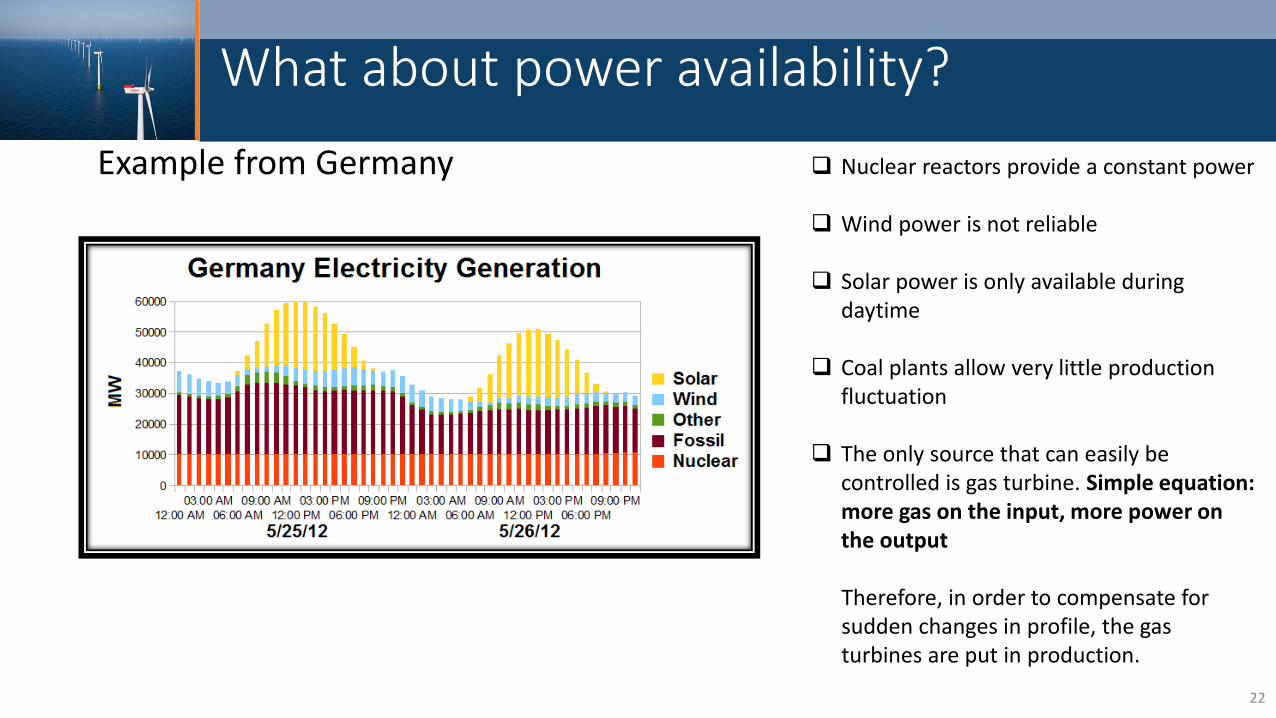
What about power availability?
Example from Germany Nuclear reactors provide a constant power
Wind power is not reliable
Solar power is only available during daytime
Coal plants allow very little production fluctuation
The only source that can easily be controlled is gas turbine. Simple equation: more gas on the input, more power on the output Therefore, in order to compensate for sudden changes in profile, the gas turbines are put in production.
22
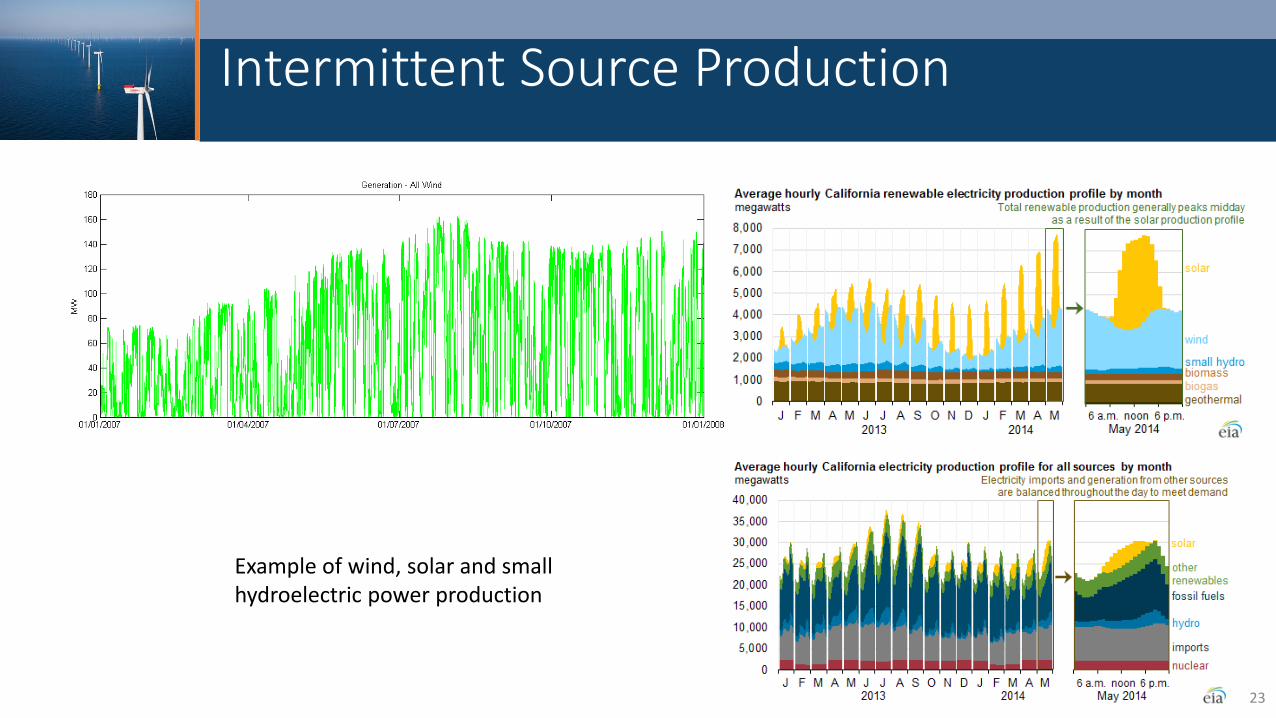
Intermittent Source Production
Example of wind, solar and small hydroelectric power production
23
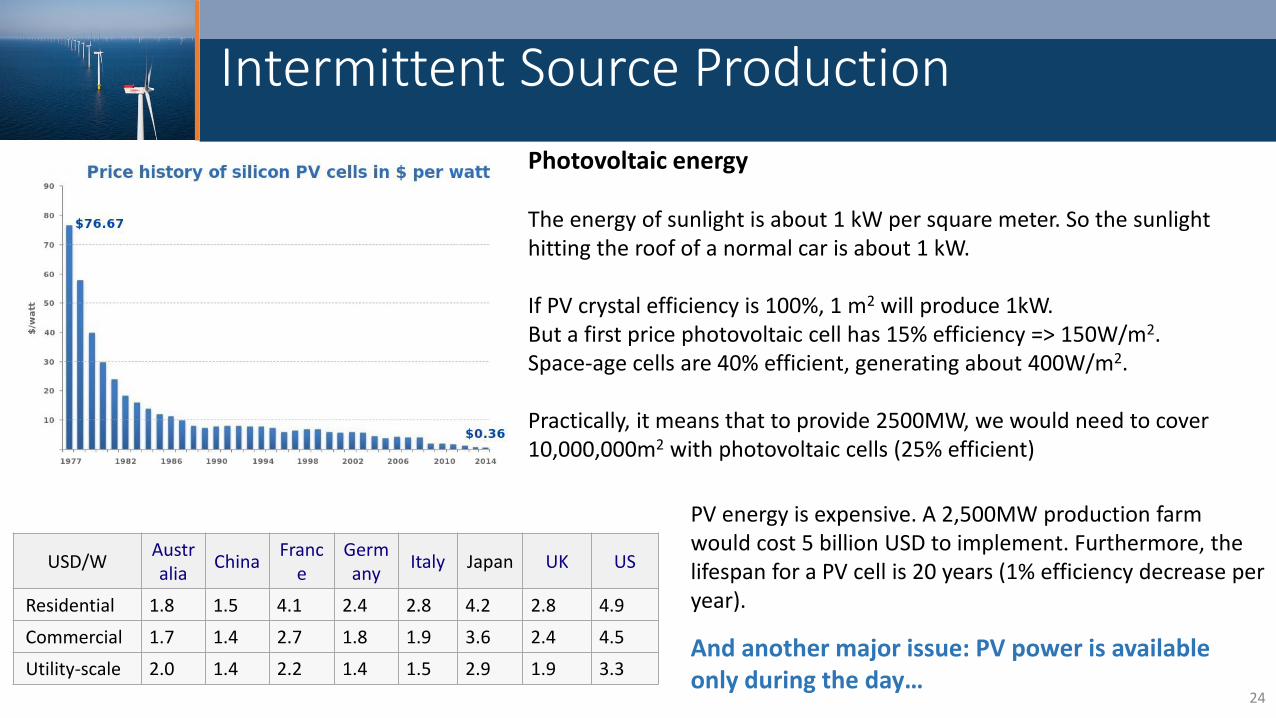
Intermittent Source Production
Photovoltaic energy The energy of sunlight is about 1 kW per square meter. So the sunlight hitting the roof of a normal car is about 1 kW. If PV crystal efficiency is 100%, 1 m2 will produce 1kW. But a first price photovoltaic cell has 15% efficiency => 150W/m2. Space-age cells are 40% efficient, generating about 400W/m2. Practically, it means that to provide 2500MW, we would need to cover 10,000,000m2 with photovoltaic cells (25% efficient)
USD/W Australia
China Franc
e Germany
Italy Japan UK US
Residential 1.8 1.5 4.1 2.4 2.8 4.2 2.8 4.9
Commercial 1.7 1.4 2.7 1.8 1.9 3.6 2.4 4.5
Utility-scale 2.0 1.4 2.2 1.4 1.5 2.9 1.9 3.3
PV energy is expensive. A 2,500MW production farm would cost 5 billion USD to implement. Furthermore, the lifespan for a PV cell is 20 years (1% efficiency decrease per year).
24
And another major issue: PV power is available only during the day…
How to price the power?
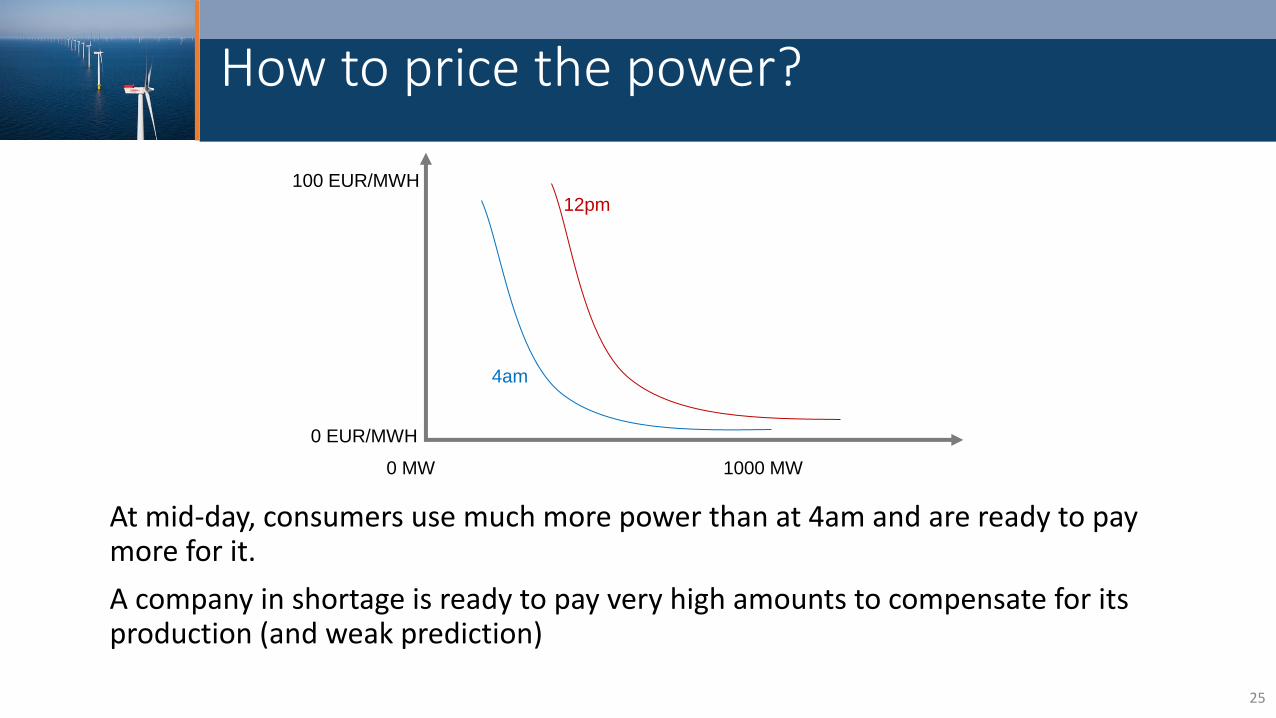
At mid-day, consumers use much more power than at 4am and are ready to pay more for it.
A company in shortage is ready to pay very high amounts to compensate for its production (and weak prediction)
0 MW 1000 MW
0 EUR/MWH
100 EUR/MWH
12pm
4am
25
How to price the power?
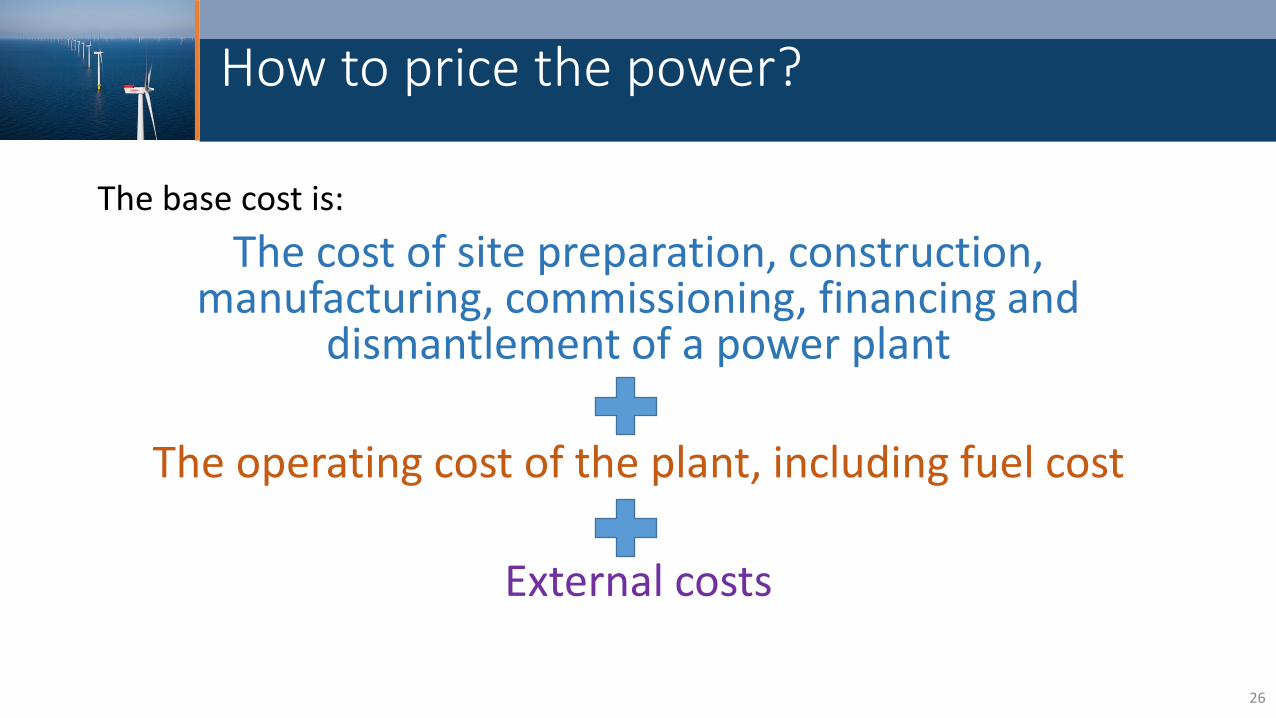
The base cost is:
The cost of site preparation, construction, manufacturing, commissioning, financing and
dismantlement of a power plant
The operating cost of the plant, including fuel cost
External costs
26
How to price the power?
However, many power plants produce much less power than their rated capacity
Some power plants produce much less power than their rated capacity because they use intermittent energy sources
Operators try to pull maximum available power from such power plants, because their marginal cost is practically zero, but their available power varies widely, e.g. it can be zero during heavy storms at night
In other cases operators deliberately produce less power for economical reasons
The cost of fuel to run a load following power plant may be relatively high, and the cost of fuel to run a peaking power plant is even higher.
Operators keep power plants turned off ("operational reserve") or running at minimum fuel consumption ("spinning reserve") most of the time
Operators feed more fuel into load following power plants only when the demand rises above what lower-cost plants (i.e., intermittent and base load plants) can produce, and then feed more fuel into peaking power plants only when the demand rises faster than the load following power plants can follow.
27

Trading pattern
During the day, power producers
Analyze the market, the risks, the weather conditions, fuel price changes, political situations, etc.
Assess the sales, the production versus the day profile based on historical data
Buy power or sell exceeding production
On scheduling cut off, they need to send a schedule of power production and injection into the grid with a granularity of up to 1 minute for the next day
They need to book capacity on the grid, via transport deals, to be able to deliver the power
The last 10 minutes before cut off witnesses a high trading with the highest price, in order for each producer to balance his schedule.
28
What if the scheduling failed?
If one operator’s scheduling fails, all the grid will be impacted, and thus all European clients.
29
A wrong prediction results in financial penalty for the first two times, and a ban from using the TSO grid after the third error
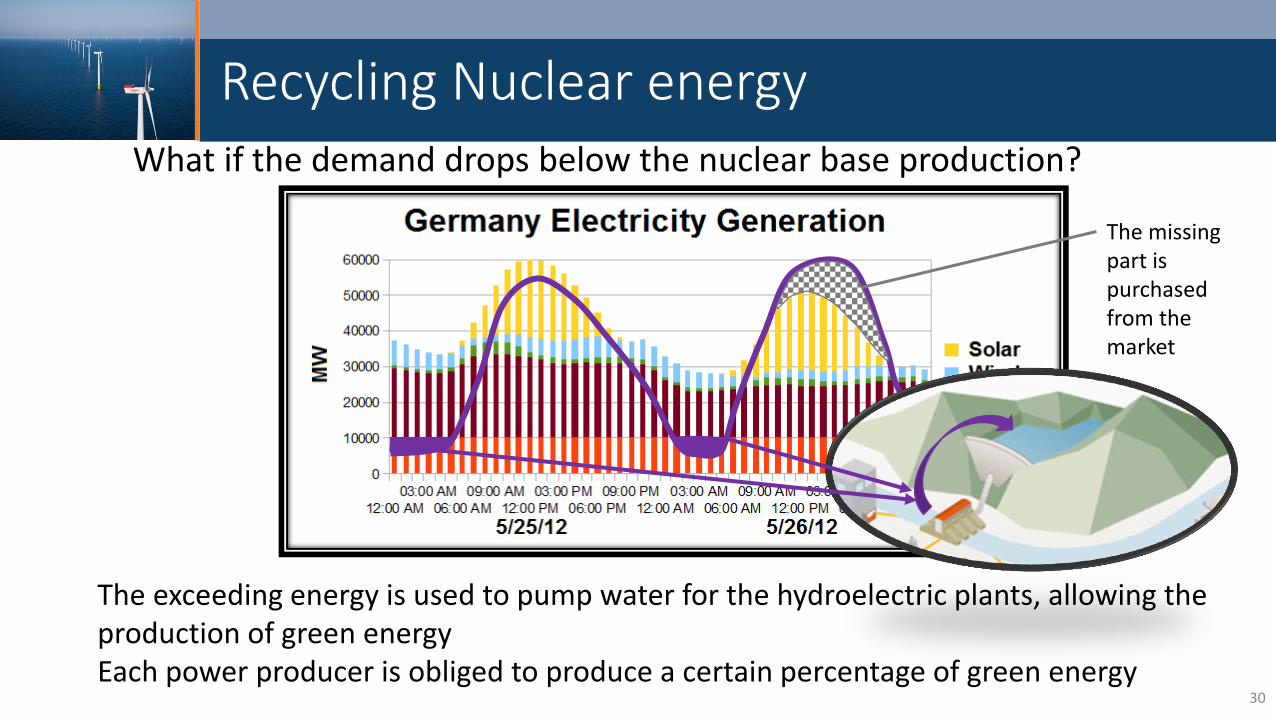
Recycling Nuclear energy What if the demand drops below the nuclear base production?
The exceeding energy is used to pump water for the hydroelectric plants, allowing the production of green energy Each power producer is obliged to produce a certain percentage of green energy
Demand
The missing part is purchased from the market
30
Gas Trading
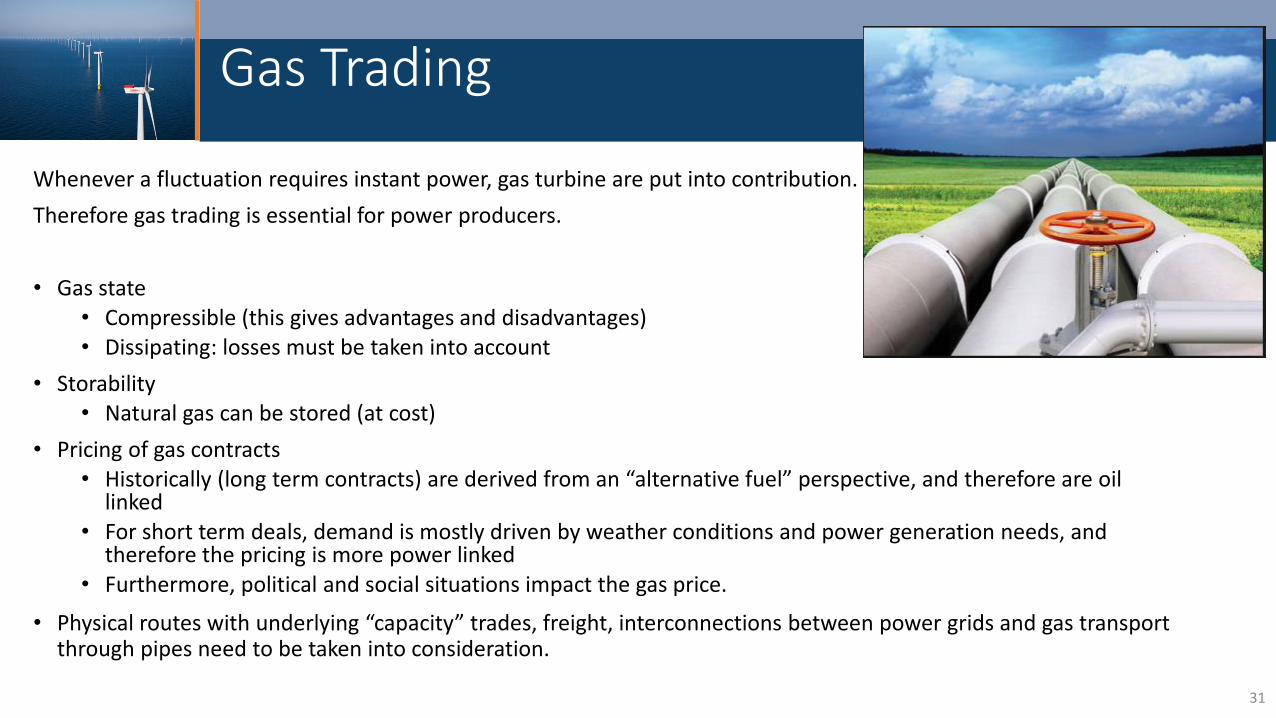
Whenever a fluctuation requires instant power, gas turbine are put into contribution.
Therefore gas trading is essential for power producers.
• Gas state • Compressible (this gives advantages and disadvantages) • Dissipating: losses must be taken into account
• Storability • Natural gas can be stored (at cost)
• Pricing of gas contracts • Historically (long term contracts) are derived from an “alternative fuel” perspective, and therefore are oil
linked • For short term deals, demand is mostly driven by weather conditions and power generation needs, and
therefore the pricing is more power linked • Furthermore, political and social situations impact the gas price.
• Physical routes with underlying “capacity” trades, freight, interconnections between power grids and gas transport through pipes need to be taken into consideration.
31
Emissions Trading
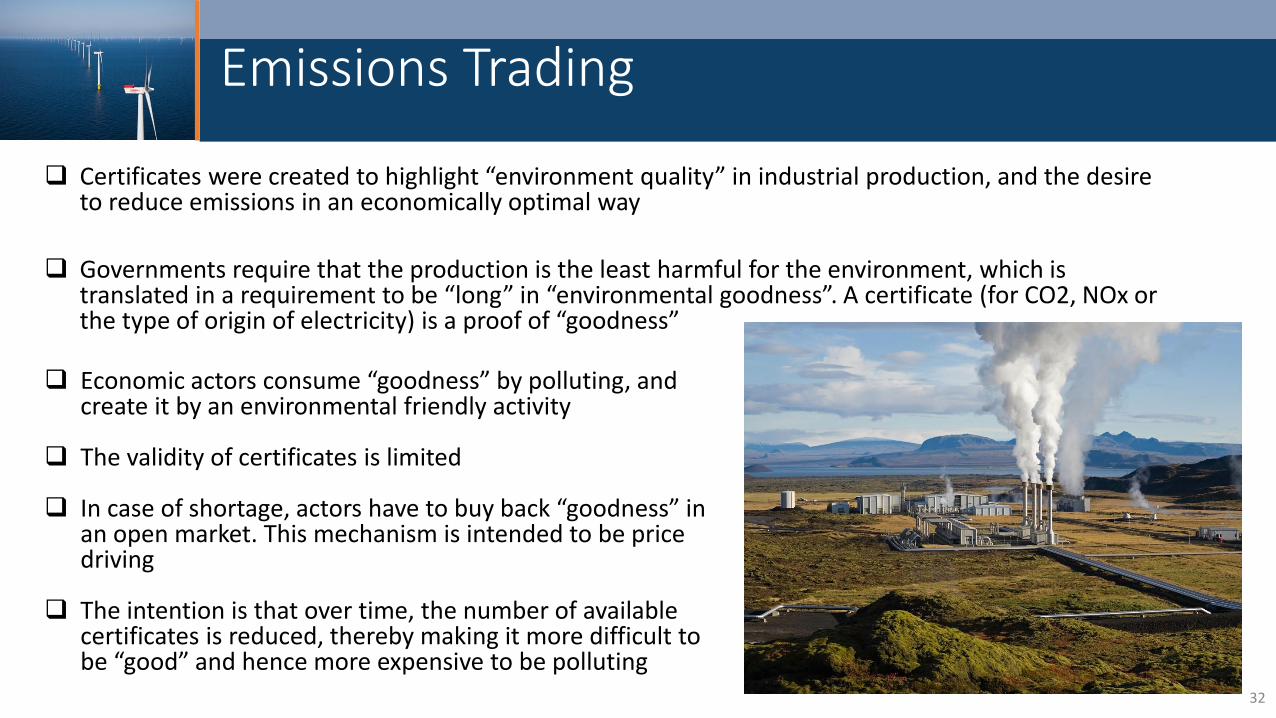
Certificates were created to highlight “environment quality” in industrial production, and the desire to reduce emissions in an economically optimal way
Governments require that the production is the least harmful for the environment, which is translated in a requirement to be “long” in “environmental goodness”. A certificate (for CO2, NOx or the type of origin of electricity) is a proof of “goodness”
Economic actors consume “goodness” by polluting, and create it by an environmental friendly activity
The validity of certificates is limited
In case of shortage, actors have to buy back “goodness” in an open market. This mechanism is intended to be price driving
The intention is that over time, the number of available certificates is reduced, thereby making it more difficult to be “good” and hence more expensive to be polluting
32
Risk Management
Pricing is closely linked to Risk Management. Higher risk, means higher margin and higher price.
In addition to the classic volatility and simulations, two reports are very important for the power pricing:
• VaR
• PaR
33
VaR and PaR
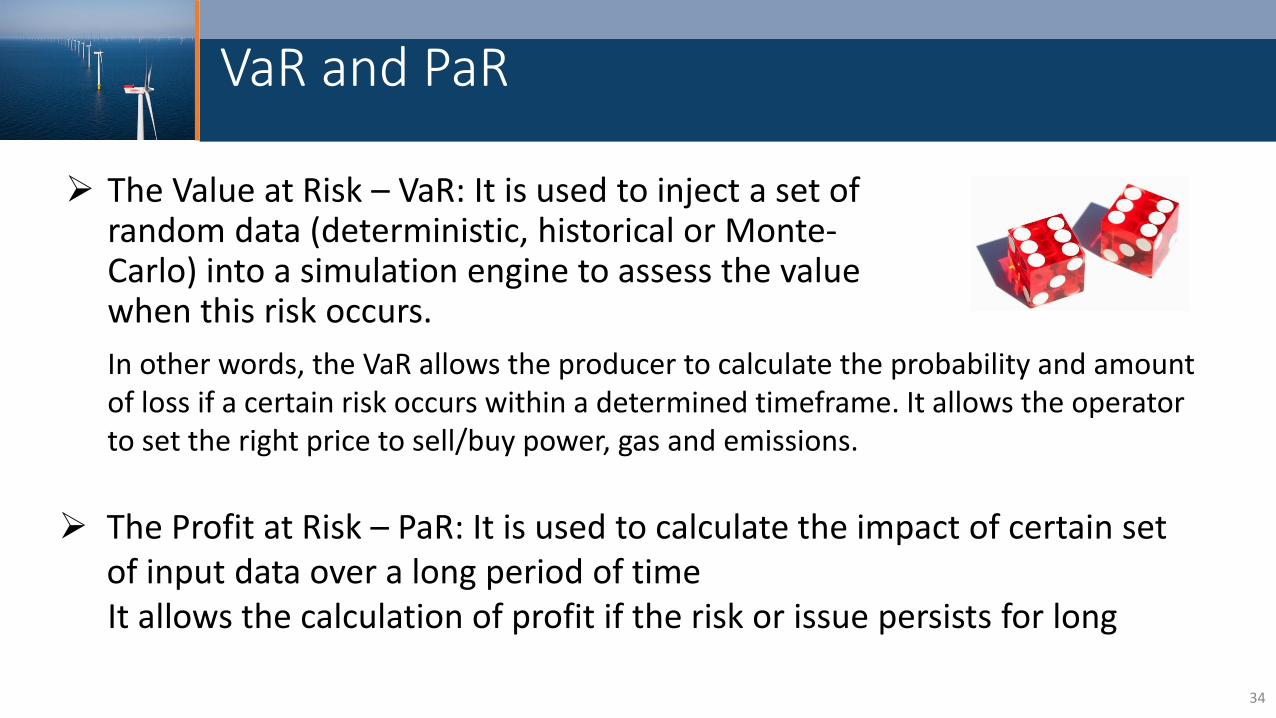
The Value at Risk – VaR: It is used to inject a set of random data (deterministic, historical or Monte-Carlo) into a simulation engine to assess the value when this risk occurs.
In other words, the VaR allows the producer to calculate the probability and amount of loss if a certain risk occurs within a determined timeframe. It allows the operator to set the right price to sell/buy power, gas and emissions.
The Profit at Risk – PaR: It is used to calculate the impact of certain set
of input data over a long period of time It allows the calculation of profit if the risk or issue persists for long
34
VaR and PaR
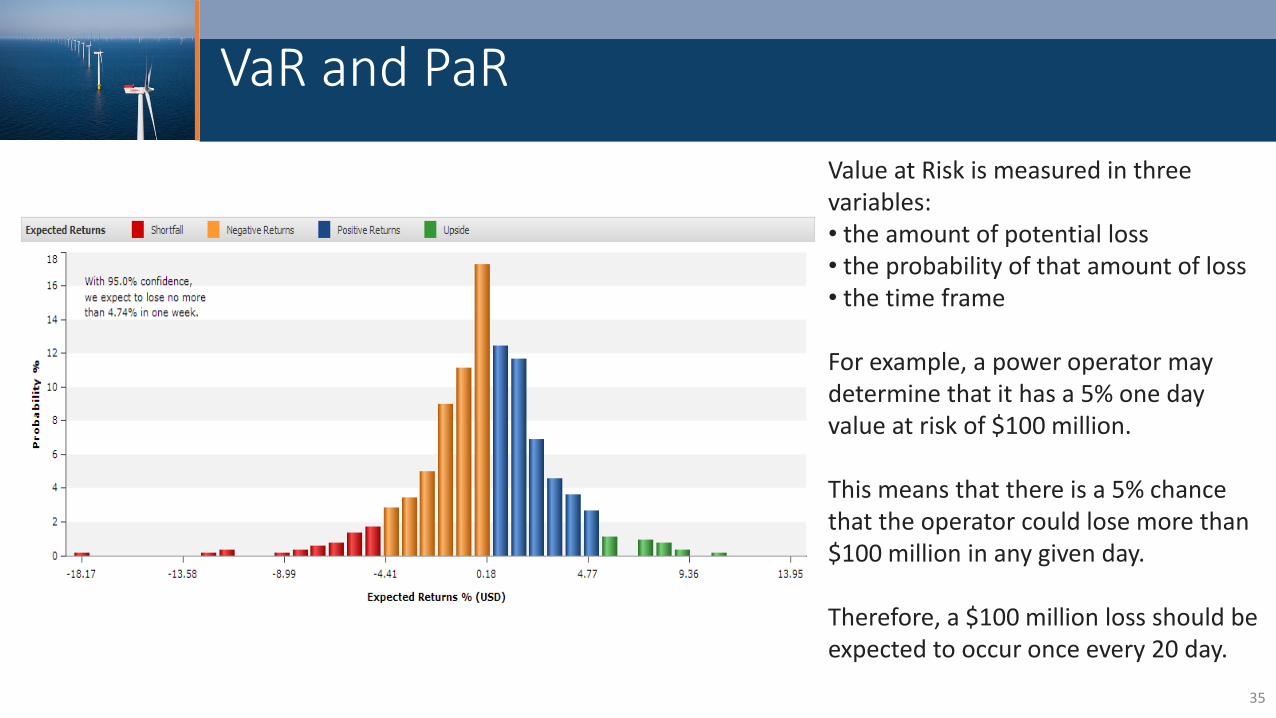
Value at Risk is measured in three variables: • the amount of potential loss • the probability of that amount of loss • the time frame
For example, a power operator may determine that it has a 5% one day value at risk of $100 million. This means that there is a 5% chance that the operator could lose more than $100 million in any given day. Therefore, a $100 million loss should be expected to occur once every 20 day.
35
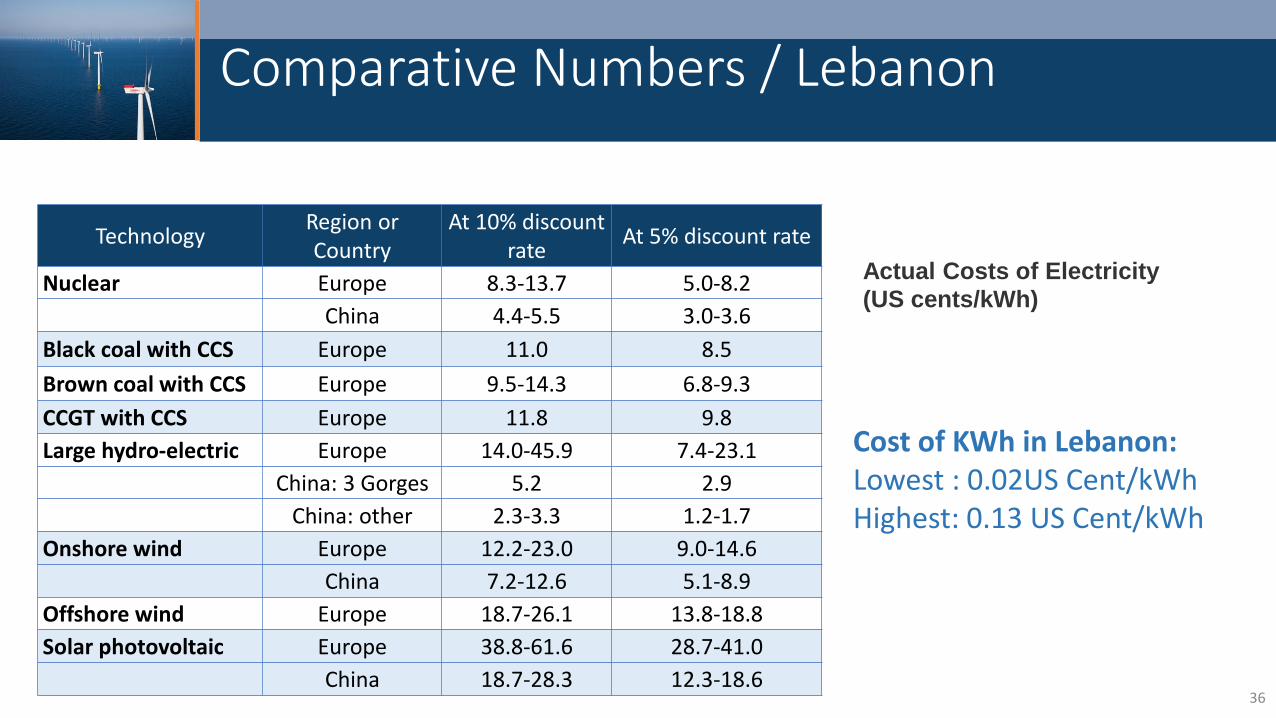
Comparative Numbers / Lebanon
Technology Region or Country
At 10% discount rate
At 5% discount rate
Nuclear Europe 8.3-13.7 5.0-8.2
China 4.4-5.5 3.0-3.6
Black coal with CCS Europe 11.0 8.5
Brown coal with CCS Europe 9.5-14.3 6.8-9.3
CCGT with CCS Europe 11.8 9.8
Large hydro-electric Europe 14.0-45.9 7.4-23.1
China: 3 Gorges 5.2 2.9
China: other 2.3-3.3 1.2-1.7
Onshore wind Europe 12.2-23.0 9.0-14.6
China 7.2-12.6 5.1-8.9
Offshore wind Europe 18.7-26.1 13.8-18.8
Solar photovoltaic Europe 38.8-61.6 28.7-41.0
China 18.7-28.3 12.3-18.6
Cost of KWh in Lebanon: Lowest : 0.02US Cent/kWh Highest: 0.13 US Cent/kWh
Actual Costs of Electricity
(US cents/kWh)
36
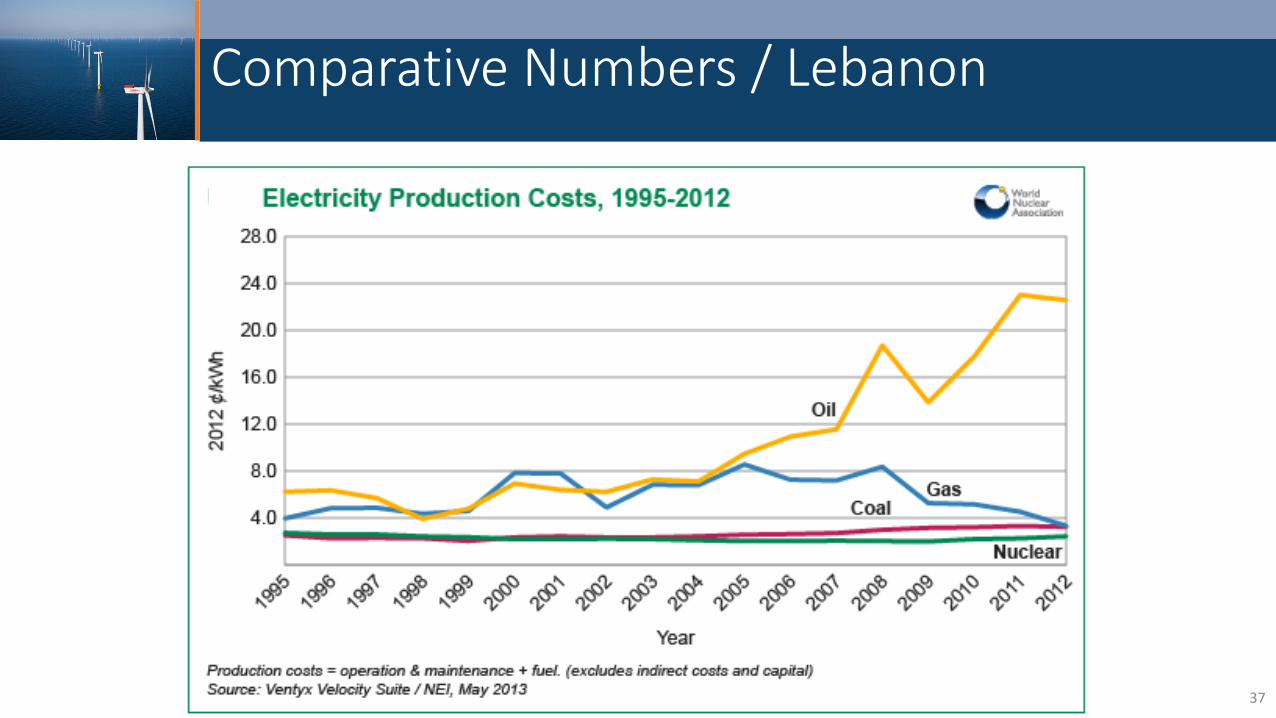
Comparative Numbers / Lebanon
37
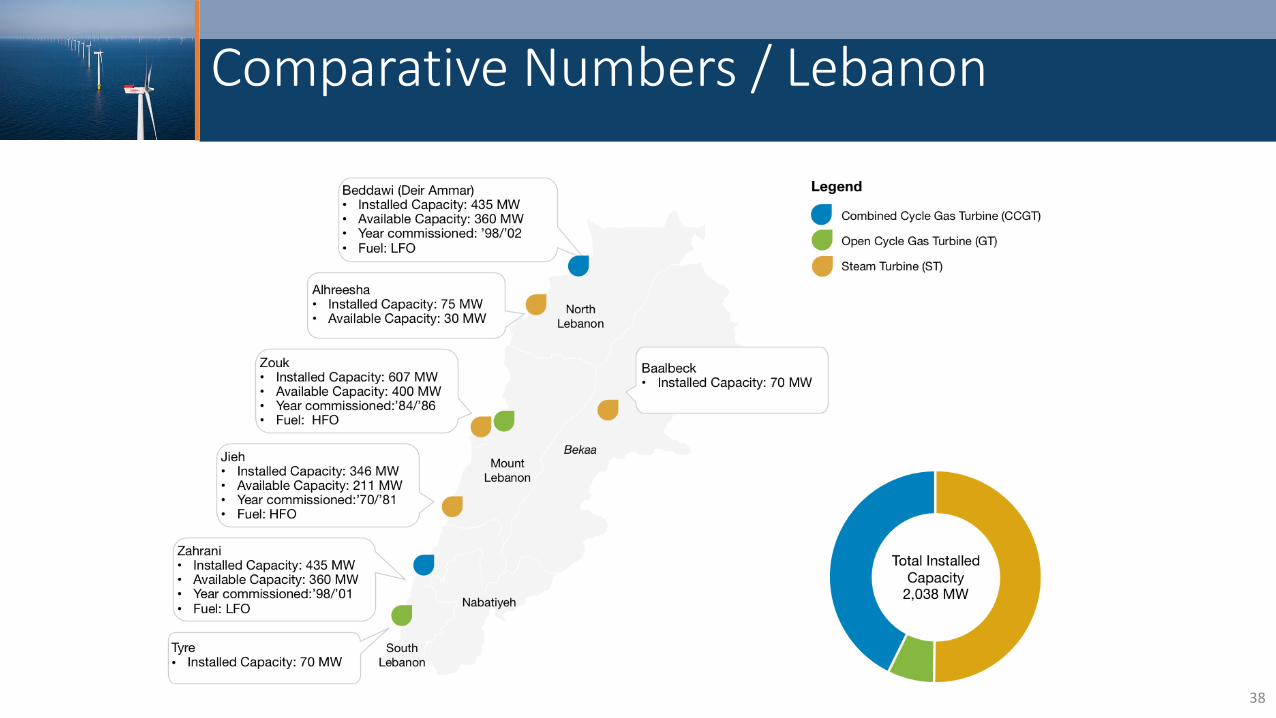
Comparative Numbers / Lebanon
38
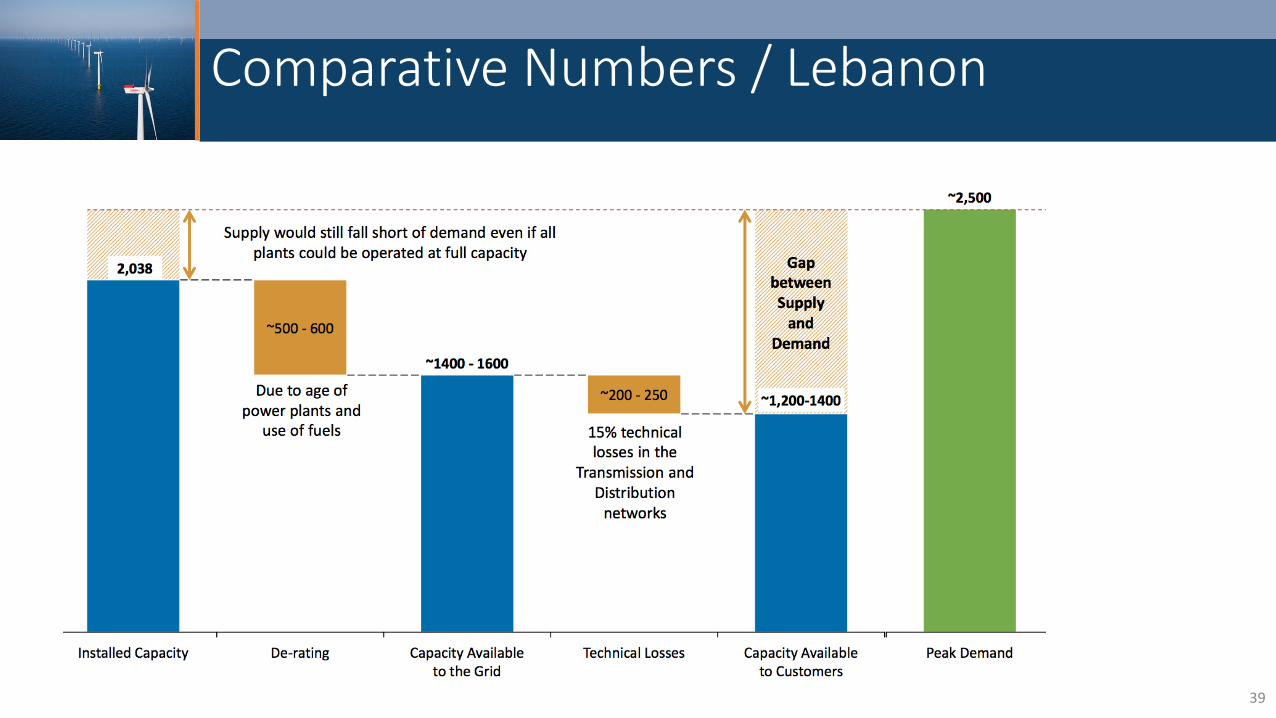
Comparative Numbers / Lebanon
39
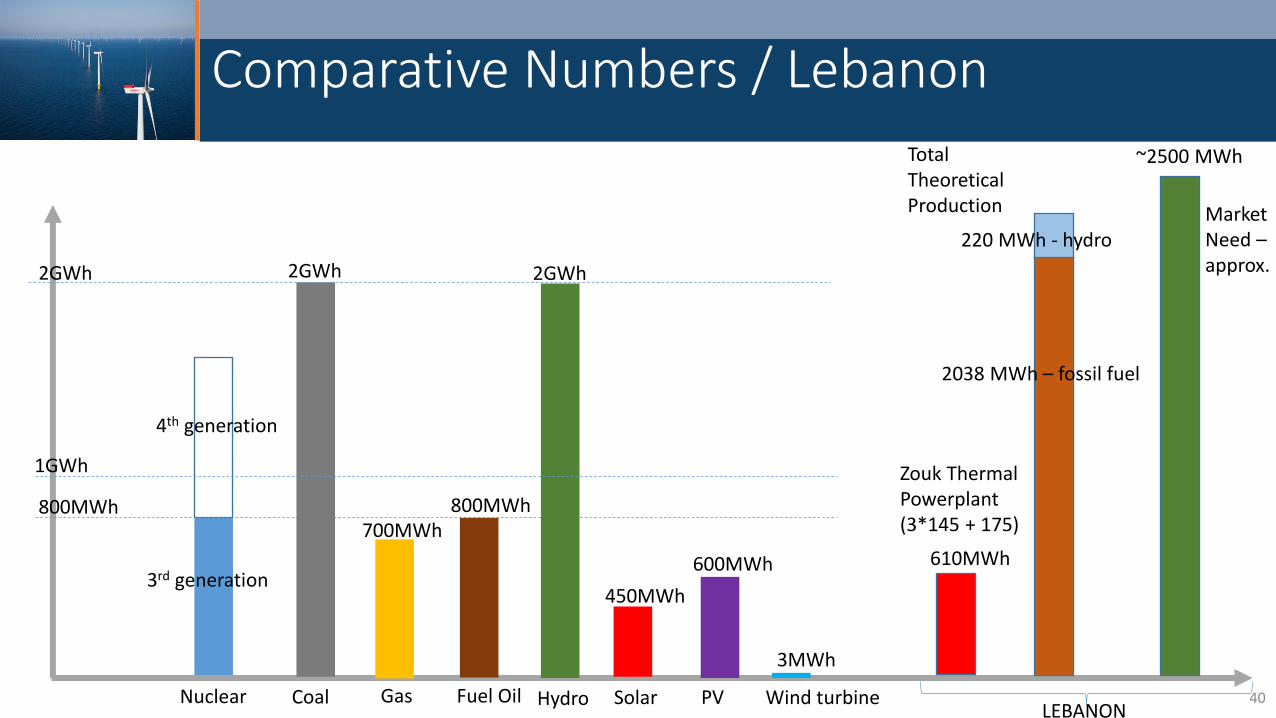
Comparative Numbers / Lebanon
800MWh
Nuclear
4th generation
3MWh
Wind turbine
450MWh
Solar Hydro
2GWh 2GWh
Coal
3rd generation
Gas
700MWh
600MWh
PV
800MWh
Fuel Oil
1GWh
2GWh
Zouk Thermal Powerplant (3*145 + 175)
610MWh
Total Theoretical Production
220 MWh - hydro
2038 MWh – fossil fuel
Market Need – approx.
~2500 MWh
LEBANON 40
41
42
43
• IEA
• EDL
• EDF
• Carboun
• Alpiq
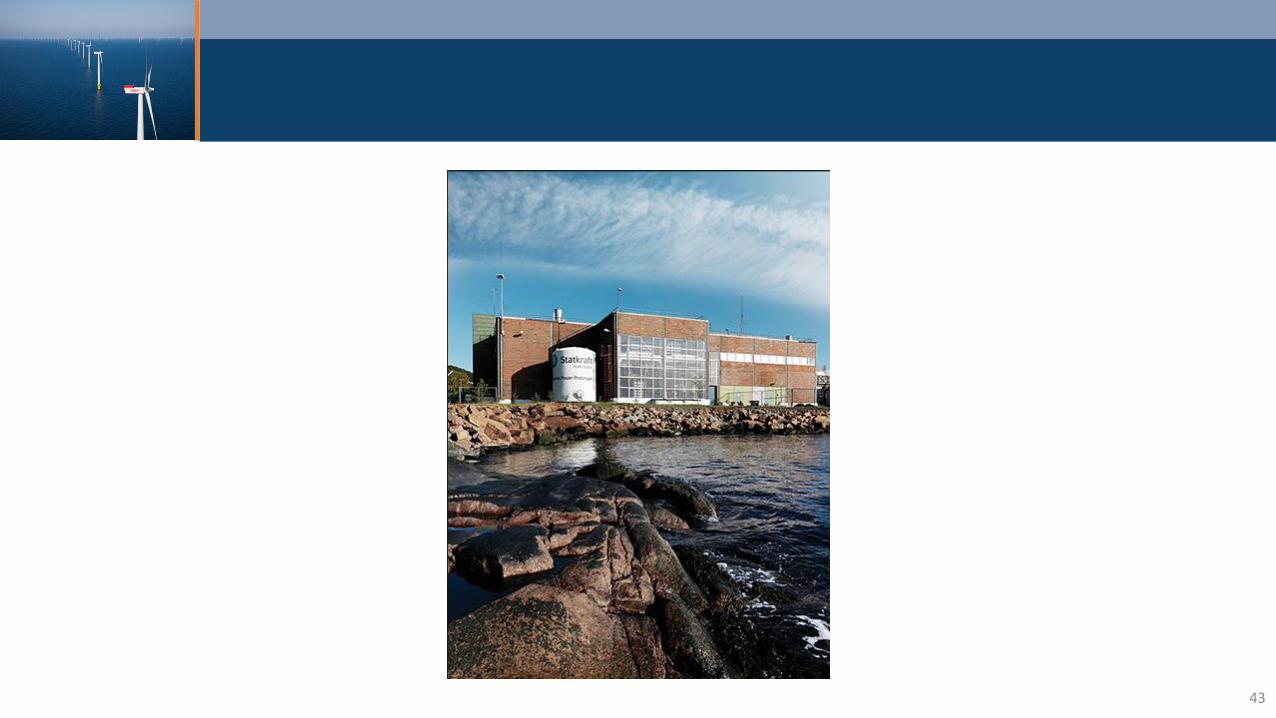
• Statkraft
• Bloomberg
• PWC
• Cap Gemini
• World Nuclear Association
• US Energy Information Administration
• Murex
Credits – data source and pictures
44
Related Documents