Welcome message from author
This document is posted to help you gain knowledge. Please leave a comment to let me know what you think about it! Share it to your friends and learn new things together.
Transcript
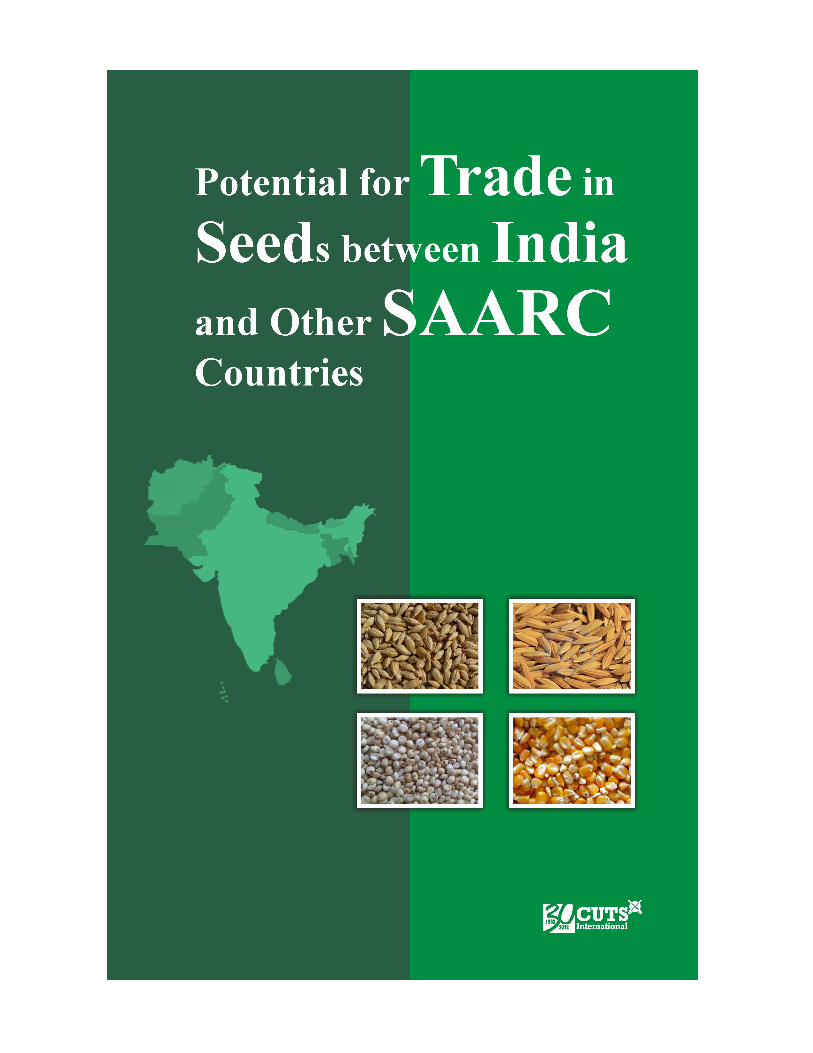

Potential for Trade in Seedsbetween India and
Other SAARC Countries


Potential for Trade in Seedsbetween India and
Other SAARC Countries
Nitesh Kumar SinghResearch AssistantCUTS International
D-217, Bhaskar Marg, Bani ParkJaipur 302016, India
Tel: +91.141.2282821, Fax: +91.141.2282485Email: [email protected]
Web site: www.cuts-international.org
With the support of
© CUTS International, 2013
First published: December 2013
This document has been produced with the financial assistance of the Bill andMelinda Gates Foundation under a project entitled �Addressing Barriers to Rice
Seeds Trade Between India and Bangladesh (RISTE)�. The views expressed here arethose of the author and can therefore in no way be taken to reflect the positions of
the Bill and Melinda Gates Foundation.
ISBN: 978-81-8257-204-1
Printed in India by Jaipur Printers Private Limited, Jaipur
#1331
Potential for Trade in Seedsbetween India and
Other SAARC Countries
Published by
Contents
Abbreviations i
Preface iii
Executive Summary v
1. Introduction 1
2. India�s Production and Trade in Seeds 5
Seed-related Initiatives 5
Institutional Set-up and Trend in Seed Acreage 5
Structure of Seed Industry 6
Trend in Seed Production 6
Requirements & Availability of Seeds 10
3. India�s Seed Trade with Other SAARC Countries 11
An Overview 16
Seed-related Sensitive List under SAFTA andApplied MFN Tariff 20
4. Potential of Seed Trade and Revealed Comparative Advantage 23
5. Conclusion and Policy Recommendations 25
References 27
Endnotes 29
Annexures 31

List of Figures and Tables
Figure 1: Mapping of Indian Seed Industry 7
Figure 2: Requirements and Availability of Seeds in India 10
Table 1: Production of Breeder, Foundation andCertified Seed in India 8
Table 2: State-wise Total Demand and Supply of Quality/Certified Seeds in India 9
Table 3: Trend in India�s Seed Trade within andoutside SAARC Region 12
Table 4: India�s Status as Net Exporter of Seed from the World 13
Table 5: SAARC Seed Import from the World 14
Table 6: India�s Share in SAARC Seed Import 15
Table 7: India�s Share in SAARC Seed Export 16
Table 8: Trend in Export of Seeds from India toOther SAARC Countries 17
Table 9: Trend in Import of Seeds by India fromother SAARC Countries 18
Table 10: Share of Other SAARC Countries in India�sImport and Export of Seeds 19
Table 11: Negative List of SAARC Member Countries 20
Table 12: Trade Potentials between India andOther SAARC Countries by RCA 24


Abbreviations
BTI : Bilateral Trade Intensity
CAGR : Compound Annual Growth Rate
FDI : Foreign Direct Investment
GDP : Gross Domestic Product
HYV : High Yielding Varieties
ICAR : Indian Council of Agricultural Research
MFN : Most Favoured Nation
NSAI : National Seed Associations of IndiaNSC : National Seeds Corporation
RCA : Revealed Comparative Advantage
SAARC : South Asian Association for Regional CooperationSAFTA : South Asian Free Trade AreaSAUs : State Agricultural UniversitiesSFCI : State Farm Corporation of IndiaSSCs : State Seed CorporationsSSTLs : State Seed Testing Laboratories
VAT : Value Added Tax


Preface
Because of their proximity, India and other South Asian countries offernatural markets for each other�s commodities. The South Asia region
enjoys mutual advantages of similar agro-climatic conditions, food habitsand common languages. Also, it has several advantages such as potentiallylow transaction cost, complementarity in production process. This isevident from significant informal trade in agricultural commodities. Atthe same time, formal intra-regional trade in agriculture and relatedcommodities is very low.
Therefore, these similarities and advantages are worthwhile to exploreso that there can be better opportunities for increasing formal trade inagricultural inputs such as seeds as well as outputs to meet an increasingdemand.
While food is a critical basic need, seed is a critical input for sustenanceand improvement in agricultural production. For better food security inSouth Asia, which is home to a disproportionately large number of peoplesuffering from poverty, hunger and malnutrition, adequate availabilityand accessibility to quality seeds play a significant role in addressing thisbasic need.
However, all countries in the region are not adequately sufficient inthe production and distribution of quality seeds. While some countriesare better placed in the production of a few varieties of quality seeds,they are disadvantageous in the production of other varieties. Suchdrawbacks at the country level call for increased cooperation amongstthese geographically contiguous countries. This is especially importantbecause good quality seeds are one of the most important inputs to increaseyields, which are, on an average, significantly low in South Asia ascompared to other countries of Asia.
Thus, this study is an attempt to analyse and understand how differentcountries in the region are placed vis-à-vis others with respect to theproduction and trade potentiality of seeds used for producing commoditiesdirectly or indirectly related to food security and other livelihood concerns

iv Potential for Trade in Seeds between India and Other SAARC Countries
faced by the region. They include rice, wheat, vegetables, fruits, oilseeds,maize, barley, sorghum and buckwheat.
It analyses the existing opportunity of trade in seeds from India toother SAARC countries. In respect to those seeds, it has computedbilateral trade intensity index and revealed comparative advantage indexfor all countries of region.
This paper is written under a project titled �Addressing Barriers toRice Seeds Trade between India and Bangladesh� (RISTE project), whichis supported by the Bill & Melinda Gates Foundation. I thank the GatesFoundation for its support and my colleagues, Nitesh Kumar Singh forwriting this paper under the guidance of Suresh Prasad Singh, PolicyAnalyst, CUTS International and Sushil Pandey, former Senior Scientist,International Rice Research Institute, Manila, The Philippines and Adviserto the CUTS RISTE project.
Being a reputed think-tank addressing a large number of issues, amongothers, in a sustained and dynamic manner for the betterment of intra-regional trade in South Asia through research-based policy advocacy andnetworking among like-minded groups, we will take forward the resultsof this study to the relevant policy-making community in South Asiancountries and to regional bodies, such as the Secretariat of the SouthAsian Association for Regional Cooperation, South Asian RegionalStandards Organisation.
Jaipur, India Bipul ChatterjeeDecember 2013 Deputy Executive Director
Executive Summary
India and other South Asian Association for Regional Cooperation(SAARC) countries offer natural markets for each other�s export
products. The South Asia region enjoys mutual advantages of trade carriedout within the group due to low transaction cost, scope for quickerdelivery, similar agro-climatic conditions and food habits and commonlanguages. These similarities are worthwhile to explore opportunities forincreasing formal trade to meet demand, especially in food items.
This paper explores potential for trade in seeds. It identifies nineimportant seeds that are directly or indirectly related to food security andlivelihood in the region. These include vegetables, fruits, oil, maize, wheat,rice, barley, grain sorghum and buckwheat.
The paper shows that though total trade (in nine identified seeds)between India and the other SAARC countries reveals an increasing trendduring the period 2001-11, the region holds much bigger potential andopportunity of seed trade. Among the South Asian countries, India holdsa place of prominence in seed trade, particularly export. The paper revealsthat India is a dominant player in the SAARC seed market, whose statuscan be understood by the fact that India�s total seed export to SAARCcountries constitutes over 93 percent of its total seed trade.
Overall, India�s export of seeds to other SAARC countries constituted1.87 percent of its total seed export to the world valued at US$165mn in2001. A significant change, however, is observed over the next 10-yearperiod � the share of South Asian countries jumped to over seven percentin India�s total seed export valued at US$713mn in 2011.
It is also revealed that total seed export from India to other SAARCcountries increased at a much faster rate (CAGR 33 percent) comparedto that of its seed exports to the world (CAGR 15 percent). In contrast,India�s seed import from other SAARC countries which constituted 1.12percent of the total import of US$17mn in 2001 declined to 0.47 percentduring the period 2001-11.

To analyse the existing opportunity of seed trade from India to otherSAARC countries, Bilateral Trade Intensity Index and RevealedComparative Advantage (RCA) Index has been computed. The bilateraltrade intensity index of seed trade shows that SAARC countriesparticularly Nepal, Bangladesh and Pakistan have emerged as good marketsfor India in last one-decade period.
The paper also computed comparative advantage and disadvantage inseed trade with revealed comparative method between India and otherSAARC countries. India has comparative advantage in export of eightseeds i.e., vegetable, fruit, oil, wheat, maize, grain sorghum, barley andrice seed to other SAARC countries while it has disadvantage in exportingof buckwheat seed to other SAARC countries.
vi Potential for Trade in Seeds between India and Other SAARC Countries
SAARC1 member-countries are predominantly agriculture-basedeconomies. All the SAARC countries derive their sustainability in
economic growth and development from agriculture to a large extent.SAARC, as per its mandate, seeks to facilitate cooperation andcollaboration between its member-countries in 11 areas. These includeagriculture, education, culture and sports; health, population and childwelfare; the environment and meteorology; rural development; tourism;transport; science and technology; and communications.
Any decline or stagnancy in agriculture growth not only impacts growthin gross domestic product (GDP), but also reduces per capita income andthus increases poverty and food insecurity. Though it is observed that thecontribution of the agriculture sector in GDP for all SAARC countries inthe last decade has declined2 except for Nepal and the contribution ofservice and manufacturing sector has increased, this in no way negatesimportance of agriculture for these countries. This is because agricultureis not only a contributor to GDP but it also provides employment andlivelihood to millions of people in the region.
Another feature of the SAARC countries is that agriculture yield andproduction is found to be low as compared to the other developing anddeveloped countries. At present, this region faces huge challenges onaccount of climate change, global warming and higher prices of food grains.
All these challenges coupled with lack of adequate irrigation facilitiesand declining agricultural productivity lead to the reduction in agricultureproduction which implies low level of food availability. It also results inincreased volatility in the food market. Besides, the region is popularlyknown for its low income and middle low-income status in the world.
It is accepted that India and other SAARC countries potentially offernatural markets for each other�s export products. Close proximity couldresult in low transaction costs. Other factors that create advantageous
1Introduction

2 Potential for Trade in Seeds between India and Other SAARC Countries
position include scope for quicker delivery, similar agro-climatic conditionsand food habits and common languages. In reality, however, the situationis not very conducive. It is observed that the region suffers from hightrade cost because of various factors. These primarily includeinfrastructure bottlenecks and also non-trade-related issues.
To address the issue of lack of cooperation, continuous efforts fromthe government of South Asian countries culminated in establishment ofthe South Asian Free Trade Area (SAFTA) agreement in January 2004 (atthe 12th SAARC summit in Pakistan). The agreement virtually created afree trade area of 1.8 billion people.
Under the agreement, it was agreed to reduce customs duties of alltraded goods to zero by the year 2016. The SAFTA agreement came intoforce on 1 January 2006 and is operational following the ratification ofthe agreement by the member-countries.
As far as real development and cooperation between the SAARCmember-countries is concerned, not much has changed despiteestablishment of SAARC and SAFTA. The region continues to remainone of the least integrated regions globally with less than 10 percent oftotal trade of the member-countries occurring within the group. This isobviously not because of lack of complementarity or lack of potential.Agriculture, including agricultural inputs, suffers from the same fate,despite looming threats to food security and climate change in the region.
Many Indian states share a border with some of the countries of theSAARC countries like Bihar with Nepal, West Bengal with Bangladesh,and Jammu and Kashmir and Rajasthan with Pakistan, indicating potentialto significantly enhance the level of people-to-people contact within theregion.
Needless to say, seed is the basic input in the enhancement ofagricultural production and productivity of different crops. The greenrevolution in India and other South Asian countries during the 1960s and1970s is clear evidence of this. Particularly in food grain production, Indiaand other South Asian countries got a tremendous boost.
The major achievement in wheat and also rice production was due toadoption of high-yielding varieties (HYV) of seeds by the farmers. InIndia, a similar development occurred during 2000s, when Bt cotton andhybrid maize seed showed spectacular results in the production of boththe crops.
The paper seeks to explore and understand the scope and potential fortrade in agricultural seeds within the region with a focus on India. Theselection of seeds as the focus for the paper stems from the fact that seed
Potential for Trade in Seeds between India and Other SAARC Countries 3
is one of the most important determinants of crop yields and thus foodsecurity in the region. The paper identifies nine important agriculturalproducts (seeds) that are directly or indirectly related to food securityand livelihood in the region. These include vegetable, fruit, oil, maize,wheat, rice, barley, grain sorghum and buckwheat seeds.
This paper consists of five sections. Section two deals India�s trade inseed and seed scenarios in India. Section three deals with India�s trade inseed in SAARC countries. Section four presents the results and findings.Section five provides the conclusion.

4 Potential for Trade in Seeds between India and Other SAARC Countries
2India�s Production andTrade in Seeds
Seed-related InitiativesIndia constitutes the fifth largest seed market measured in value terms
in the world.3 The share of Indian seed industry in the global seedproduction is 4.7 percent preceded by the US (28.1 percent), China (21.2percent), France (8.4 percent), and Brazil (6.2 percent). In terms of overalldemand-supply scenario, the Indian seed industry appears to be self-sufficient in a number of seeds categories such as flower, fruits, vegetablesand field crop. The future scenario also portends well.
According to an estimate done by the National Seed Associations ofIndia (NSAI), the seed industry will grow at an average of about 11 percenttill 2016. The growth would be primarily because of increase in demandand the need for increasing supplies of grain in the world. It is expectedthat grain productivity would gradually decline in many regions owing tolow seed replacement rates and other factors. Such a scenario would callfor initiatives to improve the seed replacement rate.
In addition, Indian seed policies and regulations are seemingly in favourof seed producer and exporter, and that might help the sector to grow incoming years. The industry is exempted from income tax, excise duty andvalue added tax (VAT). Besides, considering the importance of the sector,the government of India has allowed 100 percent foreign direct investment(FDI) in the development and production of seeds and planting materials.
Institutional Set-up and Trend in Seed AcreageIn India, it is noted that the supply of breeder seed4 by Indian Council
of Agricultural Research (ICAR) and state agricultural universities (SAUs)are available in sufficient quantity to meet the domestic demand of all
6 Potential for Trade in Seeds between India and Other SAARC Countries
breeder seed. There are, however, some issues with regard tomultiplication of breeder seed to foundation and certified seed.
It is often argued that the full potential is not realised. This might bedue to inadequate follow- up of recommended policy on seed multiplication,leading to low seed replacement rate in the country. The SAARC reporton seed (2009) shows that only 25 percent certified seed are distributedby the organised sector and rest of the remaining seed comes from thefarmer- saved seed/unorganised sector.
Despite some issues encountered, the seed sector in India has shownimpressive progress over the last few decades. The area under certifiedseeds for all crops has increased from less than 500 hectares in 1962-63to over 5 lakh hectares in 1999-2000. Even in the later years, impressivedevelopments have occurred with regard to requirement5 and availabilityof quality seeds. The requirement and availability of certified/quality seedwhich was 110.83 and 132.27 lakh quintals in 2004-05 increased to207.25 and 250.35 lakh quintals in 2008-09. In the four-year period, theincrease in requirement and availability was by a whopping 1.87 and 1.89times.
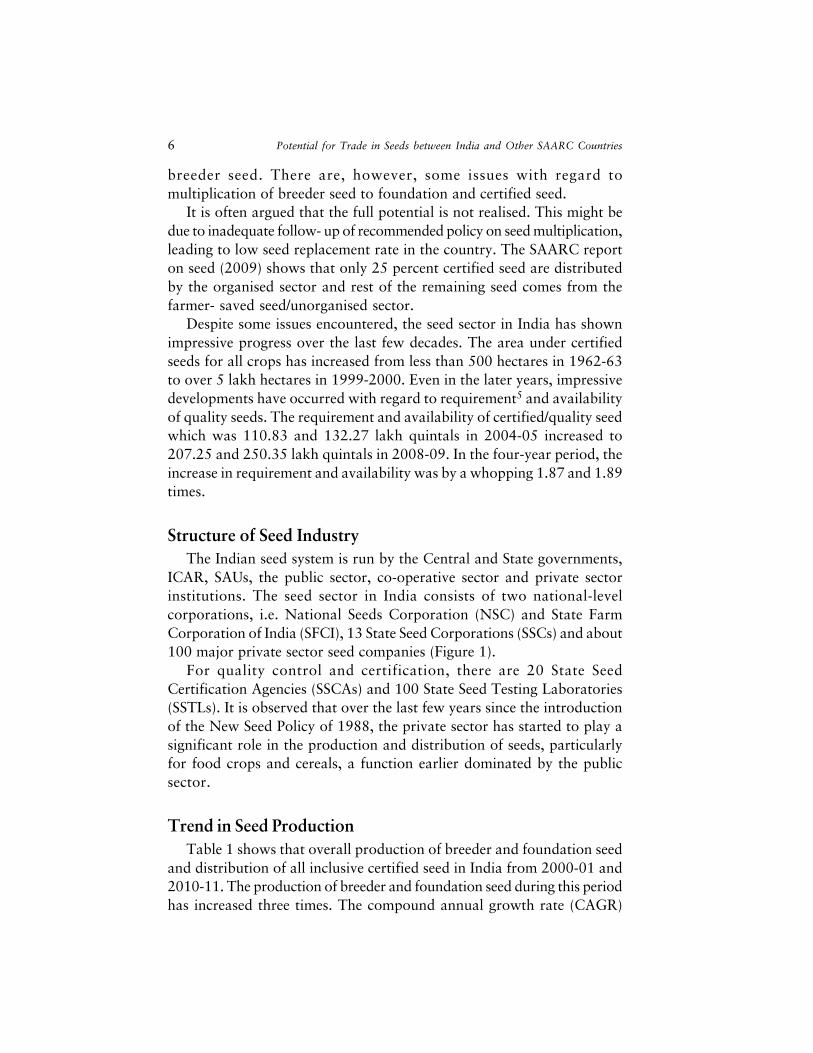
Structure of Seed IndustryThe Indian seed system is run by the Central and State governments,
ICAR, SAUs, the public sector, co-operative sector and private sectorinstitutions. The seed sector in India consists of two national-levelcorporations, i.e. National Seeds Corporation (NSC) and State FarmCorporation of India (SFCI), 13 State Seed Corporations (SSCs) and about100 major private sector seed companies (Figure 1).
For quality control and certification, there are 20 State SeedCertification Agencies (SSCAs) and 100 State Seed Testing Laboratories(SSTLs). It is observed that over the last few years since the introductionof the New Seed Policy of 1988, the private sector has started to play asignificant role in the production and distribution of seeds, particularlyfor food crops and cereals, a function earlier dominated by the publicsector.
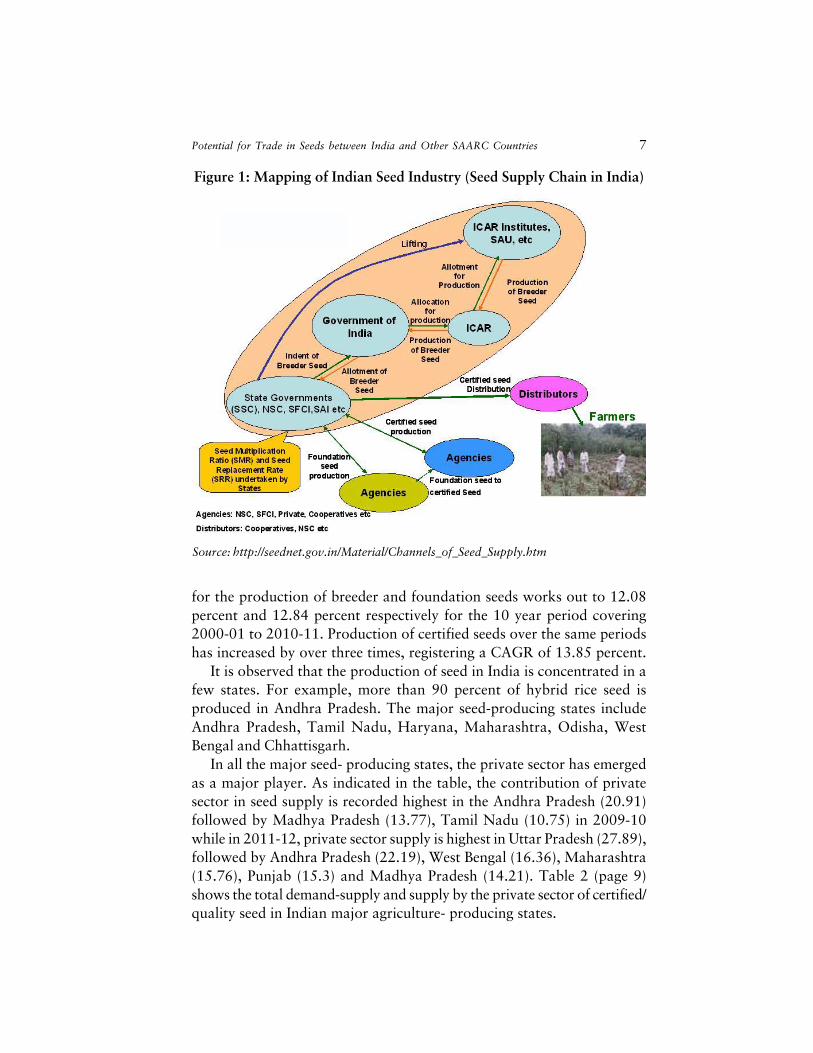
Trend in Seed ProductionTable 1 shows that overall production of breeder and foundation seed
and distribution of all inclusive certified seed in India from 2000-01 and2010-11. The production of breeder and foundation seed during this periodhas increased three times. The compound annual growth rate (CAGR)
Potential for Trade in Seeds between India and Other SAARC Countries 7
for the production of breeder and foundation seeds works out to 12.08percent and 12.84 percent respectively for the 10 year period covering2000-01 to 2010-11. Production of certified seeds over the same periodshas increased by over three times, registering a CAGR of 13.85 percent.
It is observed that the production of seed in India is concentrated in afew states. For example, more than 90 percent of hybrid rice seed isproduced in Andhra Pradesh. The major seed-producing states includeAndhra Pradesh, Tamil Nadu, Haryana, Maharashtra, Odisha, WestBengal and Chhattisgarh.
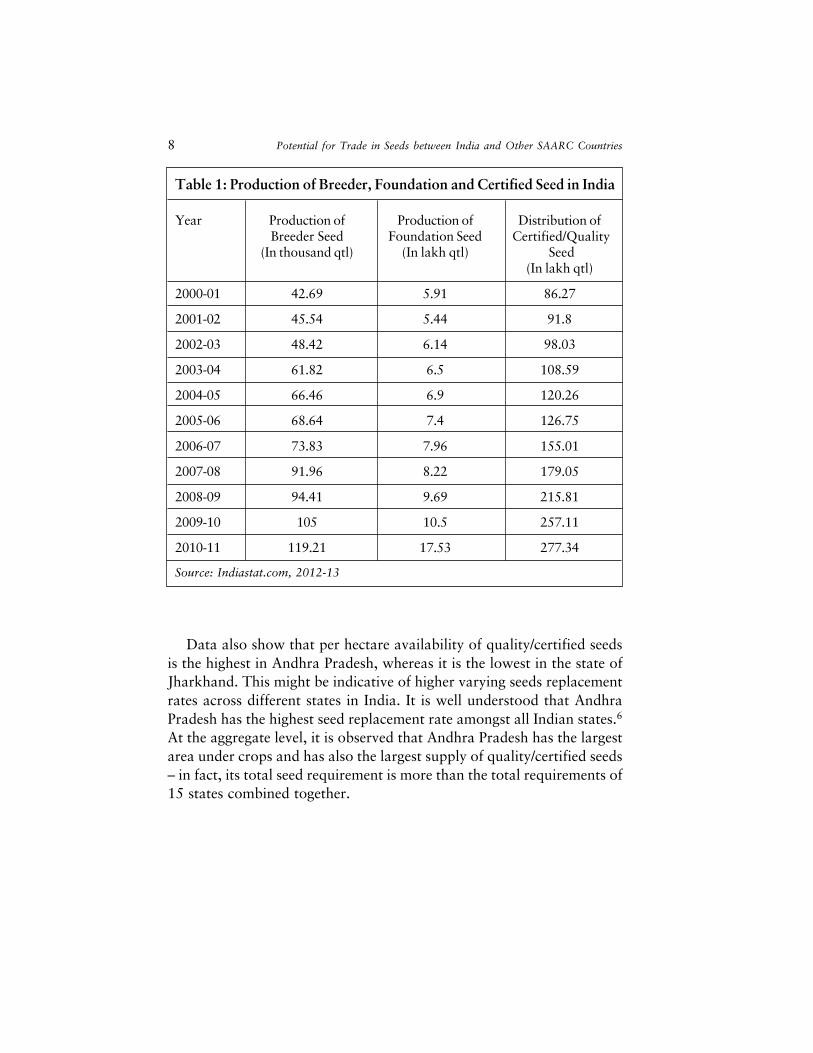
In all the major seed- producing states, the private sector has emergedas a major player. As indicated in the table, the contribution of privatesector in seed supply is recorded highest in the Andhra Pradesh (20.91)followed by Madhya Pradesh (13.77), Tamil Nadu (10.75) in 2009-10while in 2011-12, private sector supply is highest in Uttar Pradesh (27.89),followed by Andhra Pradesh (22.19), West Bengal (16.36), Maharashtra(15.76), Punjab (15.3) and Madhya Pradesh (14.21). Table 2 (page 9)shows the total demand-supply and supply by the private sector of certified/quality seed in Indian major agriculture- producing states.
Figure 1: Mapping of Indian Seed Industry (Seed Supply Chain in India)
Source: http://seednet.gov.in/Material/Channels_of_Seed_Supply.htm
8 Potential for Trade in Seeds between India and Other SAARC Countries
Table 1: Production of Breeder, Foundation and Certified Seed in India
Year Production of Production of Distribution ofBreeder Seed Foundation Seed Certified/Quality
(In thousand qtl) (In lakh qtl) Seed(In lakh qtl)
2000-01 42.69 5.91 86.27
2001-02 45.54 5.44 91.8
2002-03 48.42 6.14 98.03
2003-04 61.82 6.5 108.59
2004-05 66.46 6.9 120.26
2005-06 68.64 7.4 126.75
2006-07 73.83 7.96 155.01
2007-08 91.96 8.22 179.05
2008-09 94.41 9.69 215.81
2009-10 105 10.5 257.11
2010-11 119.21 17.53 277.34
Source: Indiastat.com, 2012-13
Data also show that per hectare availability of quality/certified seedsis the highest in Andhra Pradesh, whereas it is the lowest in the state ofJharkhand. This might be indicative of higher varying seeds replacementrates across different states in India. It is well understood that AndhraPradesh has the highest seed replacement rate amongst all Indian states.6
At the aggregate level, it is observed that Andhra Pradesh has the largestarea under crops and has also the largest supply of quality/certified seeds� in fact, its total seed requirement is more than the total requirements of15 states combined together.
Potential for Trade in Seeds between India and Other SAARC Countries 9
Andhra 44.01 14.43 55.02 48.04 22.19 69.51 145.12 0.48Pradesh
Bihar 13.13 6.61 13.68 15.8 8.95 17.06 41.60 0.41
Gujarat 8.11 6.56 9.2 13.76 10.82 14.14 122.47 0.12
Haryana 11.35 10.56 14.1 10.85 11.27 15.61 65.05 0.24
Jharkhand 3.39 2.78 5.25 5.65 0 1.01 12.49 0.08
Karnataka 11.04 4.32 15.3 11.6 5.11 13.48 130.62 0.10
Madhya 23.52 17.47 31.08 29.16 14.21 33.12 220.46 0.15Pradesh
Maharashtra 27.04 14.93 27.78 27.3 15.76 29.6 240.69 0.12
Odisha 6.86 0 7.64 8.35 0 6.24 54.29 0.11
Punjab 13.28 13.18 15.18 13.59 15.3 17.82 78.83 0.23
Rajasthan 18.42 9.62 19.25 20.42 12.04 24.99 260.02 0.10
Tamil Nadu 5.93 6.71 10 5.51 5.72 8.69 57.53 0.15
Uttar 55.25 24.74 46.63 61.95 27.89 51.02 253.83 0.20Pradesh
West Bengal 30.88 17.33 31.19 35.13 16.63 29.31 95.63 0.31
Other states* 18.86 6.66 20.06 23.3 7.07 22.01 194.93 0.11
Source: Indiastat.com, 2012-13
Note: *indicates the combined value of Arunachal Pradesh, Assam, Chhattisgarh, Goa, HimachalPradesh, Jammu and Kashmir, Kerala, Meghalaya, Manipur, Mizoram, Nagaland, Pondicherry,Sikkim, Tripura, Uttarakhand,
Table 2: State-wise Total Demand and Supply of Quality/CertifiedSeeds in India (Quantity, in lakh quintals)
Tota
lre
quire
men
ts
Supp
ly b
yPr
ivat
e Se
ctor
Tota
l Sup
ply
Tota
lre
quire
men
ts
Supp
ly b
yPr
ivat
e Se
ctor
Tota
l Sup
ply
Tota
l cro
pped
area
(lak
h ha
)
2010-11 2011-12 2010-11States/UT
Supply ofquality/certifiedseeds perhectare
(quintal)

10 Potential for Trade in Seeds between India and Other SAARC Countries
Requirements & Availability of SeedsFigure 2 shows the trend in requirement and availability of seeds in
India. Data shows that the requirement and availability of seeds in Indiais increasing every year and availability is much higher than the requirementfor each of the years. The figure also demonstrates that India hasmaintained seed surplus in all years.
Figure 2: Requirements and Availability of Seeds in India
3India�s Seed Tradewith Other SAARC Countries
Low level of economic integration has its impact on low level of tradeand cooperation. This is true for all the tradable products, but
particularly for agricultural trade, including seeds. Seed trade in SAARCcountries is very low compared to its potential7 and also when comparedto trade with other countries outside the region. India�s total export ofselected nine seeds to the world and also the other SAARC countriesmay be grouped into three categories: food grains including maize, wheat,rice, barely; vegetables and fruits and fibre. A detailed analysis is presentedin this section.
Overall, India�s seed trade with other SAARC constitutes less thanthree percent of its total seed trade. Similarly, intra-SAARC trade withIndia is also observed to be quite low accounting for less than two percentin 2011, a clear indication of low level of cooperation in seed.
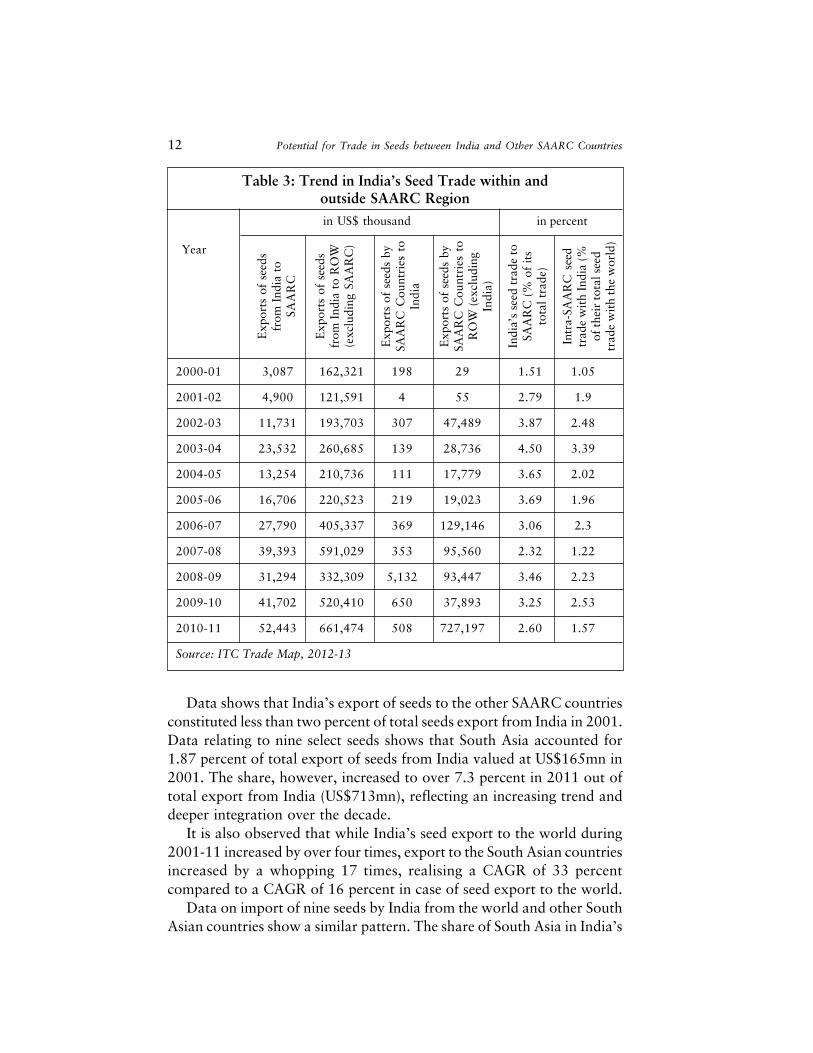
While the intra-regional cooperation is quite low, India has a dominantshare when it comes to SAARC�s overall trade in seeds. India, at present,accounts for almost three-fourths total seed export from the SAARCregion. In comparison, its share in total import is less than 20 percent(Table 3).
This export domination of India, however, shows a declining trendover the period 2001-11. Its share in seed export from the SAARC regionin 2001 was as high as 100 percent in 2001. In comparison to export, itsshare in total import is less than 20 percent. This establishes the fact thatwhile India�s seed industry has fared relatively better compared to otherSAARC countries; it has not been able to penetrate markets of otherSouth Asian countries optimally.
12 Potential for Trade in Seeds between India and Other SAARC Countries
Data shows that India�s export of seeds to the other SAARC countriesconstituted less than two percent of total seeds export from India in 2001.Data relating to nine select seeds shows that South Asia accounted for1.87 percent of total export of seeds from India valued at US$165mn in2001. The share, however, increased to over 7.3 percent in 2011 out oftotal export from India (US$713mn), reflecting an increasing trend anddeeper integration over the decade.
It is also observed that while India�s seed export to the world during2001-11 increased by over four times, export to the South Asian countriesincreased by a whopping 17 times, realising a CAGR of 33 percentcompared to a CAGR of 16 percent in case of seed export to the world.
Data on import of nine seeds by India from the world and other SouthAsian countries show a similar pattern. The share of South Asia in India�s
2000-01 3,087 162,321 198 29 1.51 1.05
2001-02 4,900 121,591 4 55 2.79 1.9
2002-03 11,731 193,703 307 47,489 3.87 2.48
2003-04 23,532 260,685 139 28,736 4.50 3.39
2004-05 13,254 210,736 111 17,779 3.65 2.02
2005-06 16,706 220,523 219 19,023 3.69 1.96
2006-07 27,790 405,337 369 129,146 3.06 2.3
2007-08 39,393 591,029 353 95,560 2.32 1.22
2008-09 31,294 332,309 5,132 93,447 3.46 2.23
2009-10 41,702 520,410 650 37,893 3.25 2.53
2010-11 52,443 661,474 508 727,197 2.60 1.57
Source: ITC Trade Map, 2012-13
Table 3: Trend in India�s Seed Trade within andoutside SAARC Region
Exp
orts
of
seed
sfr
om I
ndia
to
SAA
RC
Exp
orts
of
seed
sfr
om I
ndia
to
RO
W(e
xclu
ding
SA
AR
C)
Exp
orts
of
seed
s by
SAA
RC
Cou
ntri
es t
oIn
dia
Exp
orts
of
seed
s by
SAA
RC
Cou
ntri
es t
oR
OW
(ex
clud
ing
Indi
a)
Indi
a�s
seed
tra
de t
oSA
AR
C (
% o
f it
sto
tal t
rade
)
Intr
a-SA
AR
C s
eed
trad
e w
ith
Indi
a (%
of t
heir
tot
al s
eed
trad
e w
ith
the
wor
ld)
in US$ thousand in percent
Year

Potential for Trade in Seeds between India and Other SAARC Countries 13
import of nine seeds works out at a little over one percent (1.12 percentto be precise) out of total imports valued at US$17mn in 2001. Notably,this low share of South Asia further declined to 0.47 percent out of totalimports of these nine seeds valued at US$108mn in 2011. This impliesthat while India�s import of the selected nine seeds from the world hasincreased more than six times, it has decreased from the SAARC countries.
In other words, one can argue that while India was dependent on theworld market for 98 percent of its imported seeds in 2001, in the lateryears this dependency has further increased to almost 100 percent in2011.
Table 4 shows the net export and import of India�s seed trade with theworld. Data reveal that while India is a net exporter of fruit, oil, wheat,rice, maize, grain sorghum and barley seed; it is a net importer of vegetableseed (2011). It is also reflected that the net position of India has variedduring the period 2001-11 in case of buckwheat and wheat seeds.
Table 4 also reflects that the net export of vegetable seed8 from Indiahas declined over the period 2001-2011. The gap between export andimport of vegetable seed has widened by about four times. On the otherhand, net export from India in case of fruits, oil9 and maize seed hasincreased five times. In other cases also, net export situation hassignificantly improved.
Table 4: India�s Status as Net Exporter of Seed* from the World(US$ Thousand)
India�s net position as seed exporter
Types of seed 2001 2002 2003 2004 2005 2006 2007 2008 2009 2010 2011
Vegetable -4,409 -7,463 -9,560 -8,893 -13,208 -9,414 -8,743 -20,391 -29,498 -26,290 -18,158Seed
Fruit Seed 2,783 10,372 3,162 3,070 3,282 5,637 7,771 6,197 6,371 10,555 14628
Oil Seed 145,695 92,537 143,637 176,079 171,514 171,924 311,985 439,055 220,138 424,078 568,376
Wheat Seed 0 0 31,952 12,546 5,859 -24,221 1 28 0 14 35
Rice Seed 0 0 463 1,450 1,069 2,882 5,264 1,980 5,842 13,368 17,297
Maize Seed 3,665 7,797 8,860 66,787 12,198 11,746 15,896 75,187 28,172 19,865 16,924
Grain 0 0 1,834 862 764 2,181 1,430 4,308 5,905 14,608 5,971SorghumSeed
Barley Seed 0 0 9 1,245 32 34 24,200 20,533 5,542 153 57
Buckwheat 0 0 -8 -14 -89 -30 -302 -69 -101 -111 145Seed
Source: ITC Trade Map, 2012-13
*Net position is commputed by subtracting total import of nine seeds from total export of nine seeds.
14 Potential for Trade in Seeds between India and Other SAARC Countries
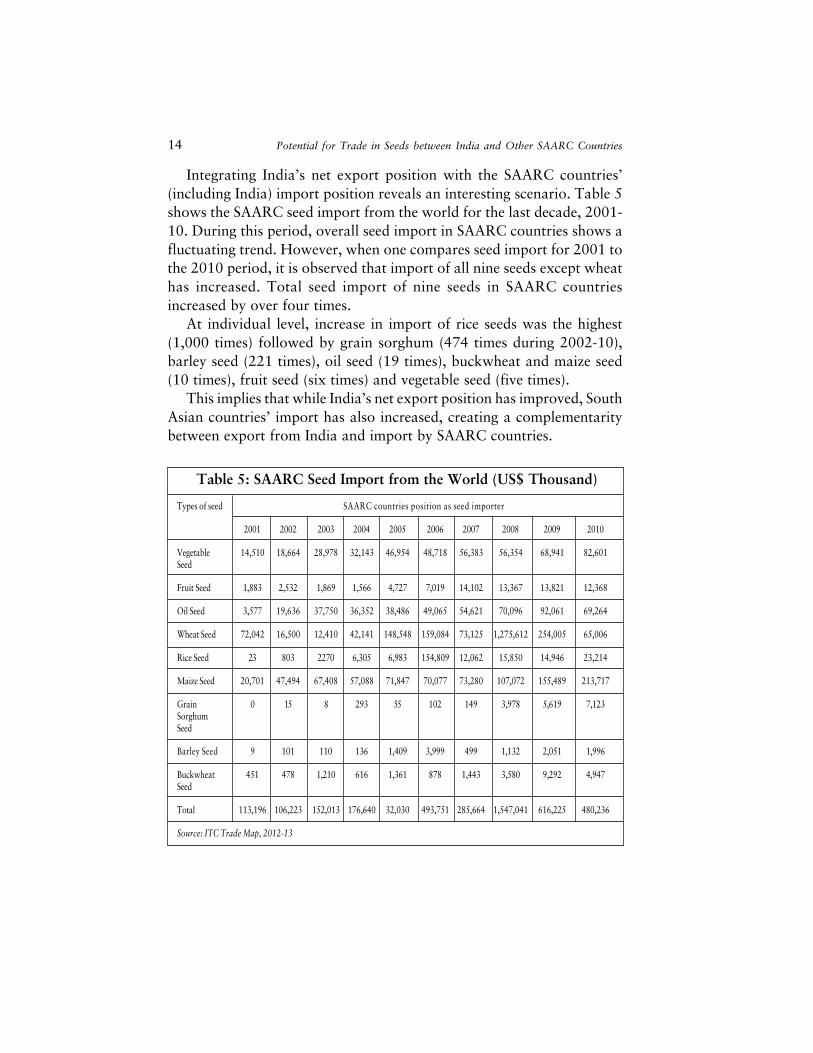
Integrating India�s net export position with the SAARC countries�(including India) import position reveals an interesting scenario. Table 5shows the SAARC seed import from the world for the last decade, 2001-10. During this period, overall seed import in SAARC countries shows afluctuating trend. However, when one compares seed import for 2001 tothe 2010 period, it is observed that import of all nine seeds except wheathas increased. Total seed import of nine seeds in SAARC countriesincreased by over four times.
At individual level, increase in import of rice seeds was the highest(1,000 times) followed by grain sorghum (474 times during 2002-10),barley seed (221 times), oil seed (19 times), buckwheat and maize seed(10 times), fruit seed (six times) and vegetable seed (five times).
This implies that while India�s net export position has improved, SouthAsian countries� import has also increased, creating a complementaritybetween export from India and import by SAARC countries.
Table 5: SAARC Seed Import from the World (US$ Thousand)
Types of seed SAARC countries position as seed importer
2001 2002 2003 2004 2005 2006 2007 2008 2009 2010
Vegetable 14,510 18,664 28,978 32,143 46,954 48,718 56,383 56,354 68,941 82,601Seed
Fruit Seed 1,883 2,532 1,869 1,566 4,727 7,019 14,102 13,367 13,821 12,368
Oil Seed 3,577 19,636 37,750 36,352 38,486 49,065 54,621 70,096 92,061 69,264
Wheat Seed 72,042 16,500 12,410 42,141 148,548 159,084 73,125 1,275,612 254,005 65,006
Rice Seed 23 803 2270 6,305 6,983 154,809 12,062 15,850 14,946 23,214
Maize Seed 20,701 47,494 67,408 57,088 71,847 70,077 73,280 107,072 155,489 213,717
Grain 0 15 8 293 55 102 149 3,978 5,619 7,123SorghumSeed
Barley Seed 9 101 110 136 1,409 3,999 499 1,132 2,051 1,996
Buckwheat 451 478 1,210 616 1,361 878 1,443 3,580 9,292 4,947Seed
Total 113,196 106,223 152,013 176,640 32,030 493,751 285,664 1,547,041 616,225 480,236
Source: ITC Trade Map, 2012-13
Potential for Trade in Seeds between India and Other SAARC Countries 15
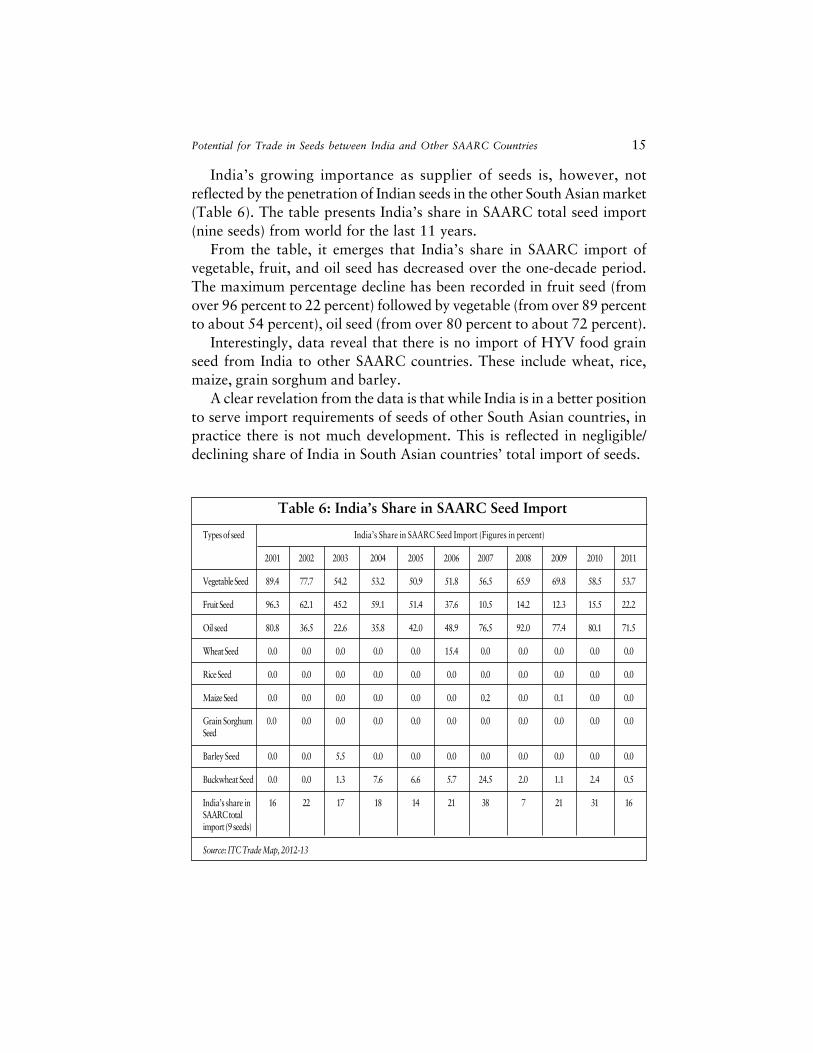
India�s growing importance as supplier of seeds is, however, notreflected by the penetration of Indian seeds in the other South Asian market(Table 6). The table presents India�s share in SAARC total seed import(nine seeds) from world for the last 11 years.
From the table, it emerges that India�s share in SAARC import ofvegetable, fruit, and oil seed has decreased over the one-decade period.The maximum percentage decline has been recorded in fruit seed (fromover 96 percent to 22 percent) followed by vegetable (from over 89 percentto about 54 percent), oil seed (from over 80 percent to about 72 percent).
Interestingly, data reveal that there is no import of HYV food grainseed from India to other SAARC countries. These include wheat, rice,maize, grain sorghum and barley.
A clear revelation from the data is that while India is in a better positionto serve import requirements of seeds of other South Asian countries, inpractice there is not much development. This is reflected in negligible/declining share of India in South Asian countries� total import of seeds.
Table 6: India�s Share in SAARC Seed Import
Types of seed India�s Share in SAARC Seed Import (Figures in percent)
2001 2002 2003 2004 2005 2006 2007 2008 2009 2010 2011
Vegetable Seed 89.4 77.7 54.2 53.2 50.9 51.8 56.5 65.9 69.8 58.5 53.7
Fruit Seed 96.3 62.1 45.2 59.1 51.4 37.6 10.5 14.2 12.3 15.5 22.2
Oil seed 80.8 36.5 22.6 35.8 42.0 48.9 76.5 92.0 77.4 80.1 71.5
Wheat Seed 0.0 0.0 0.0 0.0 0.0 15.4 0.0 0.0 0.0 0.0 0.0
Rice Seed 0.0 0.0 0.0 0.0 0.0 0.0 0.0 0.0 0.0 0.0 0.0
Maize Seed 0.0 0.0 0.0 0.0 0.0 0.0 0.2 0.0 0.1 0.0 0.0
Grain Sorghum 0.0 0.0 0.0 0.0 0.0 0.0 0.0 0.0 0.0 0.0 0.0Seed
Barley Seed 0.0 0.0 5.5 0.0 0.0 0.0 0.0 0.0 0.0 0.0 0.0
Buckwheat Seed 0.0 0.0 1.3 7.6 6.6 5.7 24.5 2.0 1.1 2.4 0.5
India�s share in 16 22 17 18 14 21 38 7 21 31 16SAARC totalimport (9 seeds)
Source: ITC Trade Map, 2012-13

16 Potential for Trade in Seeds between India and Other SAARC Countries
India�s importance as a growing seed market is fully demonstrated bythe share of India in SAARC total export (Table 7). India�s percentageshare in SAARC seed export to the world is over 94 percent in threeseeds, namely vegetable, fruits and oil seeds. In case of rice seeds also, theshare is quite high at over 72 percent.
However, in most of the cases, a fluctuating trend is observed. In onecase (maize), it is also observed that India�s share in SAARC total exportto the world is continuously declining from 24.8 percent in 2001 to 1.5percent in 2011. It implies that other SAARC countries, such asBangladesh, have emerged bigger players over the last decade.
Table 7: India�s Share in SAARC Seed Export
Types of Seed India�s Share in SAARC Seed Export (in percent)
2001 2002 2003 2004 2005 2006 2007 2008 2009 2010 2011
Vegetable Seed 99.9 100 93.3 92.2 95.9 94.4 96.5 99.0 98.4 97.4 97.9
Fruit Seed 100 99.9 90.9 95.0 97.5 98.5 99.6 97.4 88.9 94.4 97.3
Oil Seed 100 100 96.2 87.7 94.7 93.5 92.7 93.1 86.7 93.5 95.7
Wheat Seed 0.0 0.0 25.9 15.3 54.7 11.0 0.0 0.1 0.0 6.0 0.0
Rice Seed 0.0 0.0 9.0 53.7 12.9 29.0 61.9 26.0 33.2 99.5 72.5
Maize Seed 24.8 43.0 29.8 35.3 16.5 11.2 5.1 7.9 4.9 3.7 1.5
Grain Sorghum 0.0 0.0 14.4 13.9 14.5 19.4 24.0 18.2 47.6 37.9 37.4Seed
Barley Seed 0.0 0.0 5.2 71.8 31.4 17.9 28.5 31.6 80.0 1.9 0.4
Buckwheat Seed 0.0 0.0 0.2 0.3 0.0 0.1 0.3 0.0 0.0 0.0 0.6
India�s share in 100 100 86 94 95 95 86 94 91 97 73SAARC totalexport (9 seeds)
Source: ITC Trade Map, 2012-13
An OverviewAnalysis of data for the 10-year period demonstrates that the overall
export of seeds from India to other SAARC countries (Bangladesh,Pakistan, Nepal, Sri Lanka and Maldives) has increased by a whoppingover 17 times from US$3mn to over US$52mn (Table 8).
Growth in exports at country levels is, however, not uniform. Whileseed export to Nepal has increased by over 57 times; export of seeds to

Potential for Trade in Seeds between India and Other SAARC Countries 17
Pakistan multiplied by 19 times. The exceptional increase in export ofseed from India to Nepal is seemingly because of a combination of factorssuch as inadequate local infrastructure and similarities in agro-climaticcondition.
Another important factor could be a good political relationship betweenthe two countries. Bangladesh also recorded a less than 10 times increasein seed import from India. The lowest increase was recorded in case ofSri Lanka. In between years, a clear fluctuation is also observed.
Table 8: Trend in Export of Seeds from India toOther SAARC Countries
Region Export of seeds from India to other SAARC countries (US$ Thousand)
2001 2002 2003 2004 2005 2006 2007 2008 2009 2010 2011
World 165,408 126,491 205,434 284,217 223,990 237,229 433,127 630,422 363,603 562,112 713,917
SAARC 3,087 4,900 11,731 23,532 13,254 16,706 27,790 39,393 31,294 41,702 52,443
Bangladesh 594 249 5,370 1,806 3,362 3,011 2,467 3,101 3,620 2,774 4,936(19.24) (5.08) (45.78) (7.67) (25.37) (18.02) (8.88) (7.87) (11.57) (6.65) (9.41)
Pakistan 973 1513 1,484 2,190 3,160 5,898 8,983 8,811 11,876 21,074 19,048(31.52) (30.88) (12.65) (9.31) (23.84) (35.30) (32.32) (22.37) (37.95) (50.53) (36.32)
Nepal 360 1,968 3,353 7,368 3,820 5,412 11,636 24,074 12,357 9,498 22,542(11.66) (40.16) (28.58) (31.31) (28.82) (32.40) (41.87) (61.11) (39.49) (22.78) (42.98)
Sri Lanka 390 602 426 10,062 2,756 950 2,073 1,084 1,311 944 1,460(12.63) (12.29) (3.63) (42.76) (20.79) (5.69) (7.46) (2.75) (4.19) (2.26) (2.78)
Source: ITC Trade map, 2012-13
Note: figure in bracket shows the percentage value.
A similar pattern is revealed in case of export of seeds from otherSAARC countries to India in 2001-11). As indicated above, data reflectthat the import of seeds by India from other South Asian countries issignificantly low compared to import from the world (Table 9). The shareworks out to a little over one percent in 2001, and further lower at 0.47percent in 2011.
During the 10-year period, it is also observed that while seed importfrom the world increased by over six times, increase in import from theSAARC countries was only about 2.5 times, much lower compared to
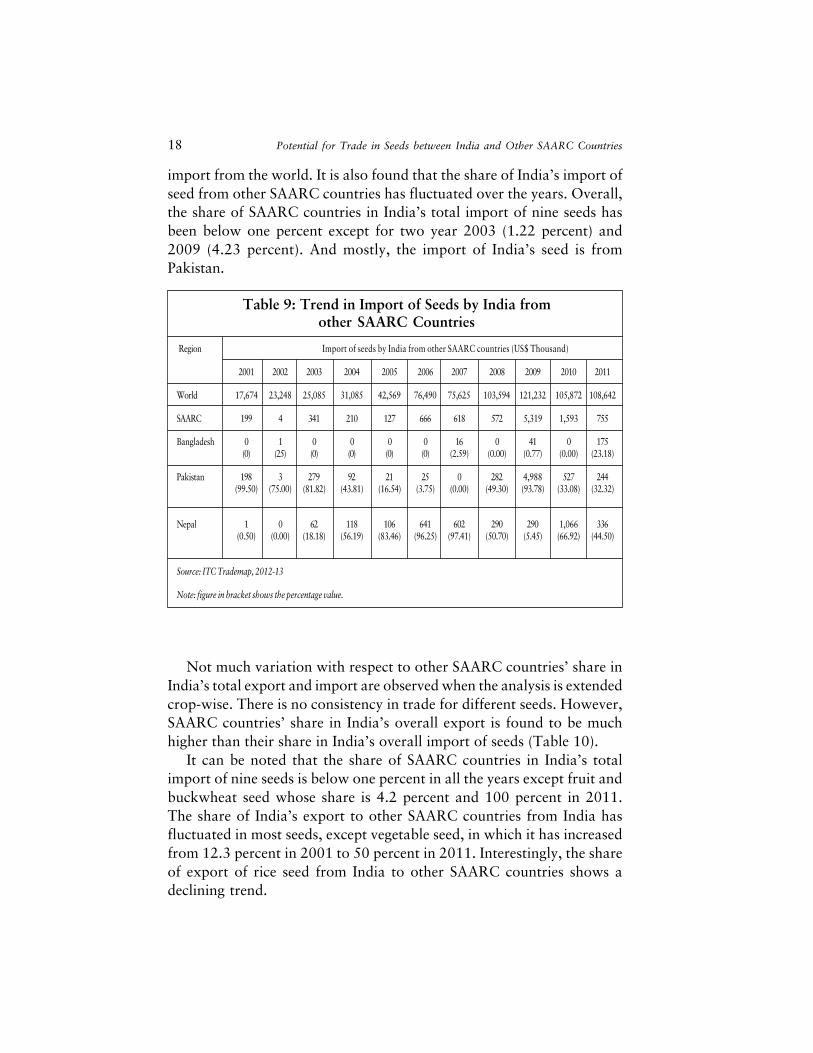
18 Potential for Trade in Seeds between India and Other SAARC Countries
import from the world. It is also found that the share of India�s import ofseed from other SAARC countries has fluctuated over the years. Overall,the share of SAARC countries in India�s total import of nine seeds hasbeen below one percent except for two year 2003 (1.22 percent) and2009 (4.23 percent). And mostly, the import of India�s seed is fromPakistan.
Table 9: Trend in Import of Seeds by India fromother SAARC Countries
Region Import of seeds by India from other SAARC countries (US$ Thousand)
2001 2002 2003 2004 2005 2006 2007 2008 2009 2010 2011
World 17,674 23,248 25,085 31,085 42,569 76,490 75,625 103,594 121,232 105,872 108,642
SAARC 199 4 341 210 127 666 618 572 5,319 1,593 755
Bangladesh 0 1 0 0 0 0 16 0 41 0 175(0) (25) (0) (0) (0) (0) (2.59) (0.00) (0.77) (0.00) (23.18)
Pakistan 198 3 279 92 21 25 0 282 4,988 527 244(99.50) (75.00) (81.82) (43.81) (16.54) (3.75) (0.00) (49.30) (93.78) (33.08) (32.32)
Nepal 1 0 62 118 106 641 602 290 290 1,066 336(0.50) (0.00) (18.18) (56.19) (83.46) (96.25) (97.41) (50.70) (5.45) (66.92) (44.50)
Source: ITC Trademap, 2012-13
Note: figure in bracket shows the percentage value.
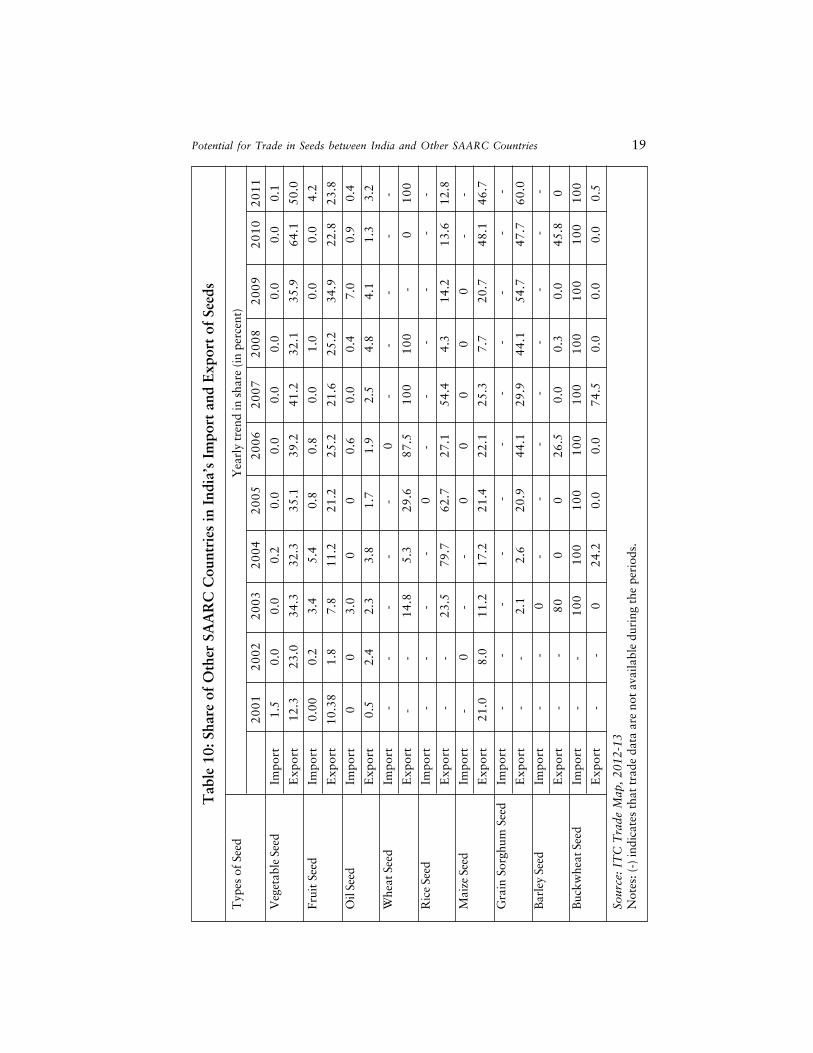
Not much variation with respect to other SAARC countries� share inIndia�s total export and import are observed when the analysis is extendedcrop-wise. There is no consistency in trade for different seeds. However,SAARC countries� share in India�s overall export is found to be muchhigher than their share in India�s overall import of seeds (Table 10).
It can be noted that the share of SAARC countries in India�s totalimport of nine seeds is below one percent in all the years except fruit andbuckwheat seed whose share is 4.2 percent and 100 percent in 2011.The share of India�s export to other SAARC countries from India hasfluctuated in most seeds, except vegetable seed, in which it has increasedfrom 12.3 percent in 2001 to 50 percent in 2011. Interestingly, the shareof export of rice seed from India to other SAARC countries shows adeclining trend.
Potential for Trade in Seeds between India and Other SAARC Countries 19
Tab
le 1
0: S
hare
of
Oth
er S
AA
RC
Cou
ntri
es in
Ind
ia�s
Im
port
and
Exp
ort
of S
eeds
Typ
es o
f Se
ed
Y
earl
y tr
end
in s
hare
(in
perc
ent)
20
01
20
02
20
03
20
04
20
05
20
06
20
07
20
08
20
09
20
10
20
11
Veg
etab
le S
eed
Impo
rt1.
50.
00.
00.
20.
00.
00.
00.
00.
00.
00.
1
Exp
ort
12.3
23.0
34.3
32.3
35.1
39.2
41.2
32.1
35.9
64.1
50.0
Frui
t Se
edIm
port
0.00
0.2
3.4
5.4
0.8
0.8
0.0
1.0
0.0
0.0
4.2
Exp
ort
10.3
81.
87.
811
.221
.225
.221
.625
.234
.922
.823
.8
Oil
Seed
Impo
rt0
03.
00
00.
60.
00.
47.
00.
90.
4
Exp
ort
0.5
2.4
2.3
3.8
1.7
1.9
2.5
4.8
4.1
1.3
3.2
Whe
at S
eed
Impo
rt -
- -
- -
0-
- -
- -
Exp
ort
- -
14.8
5.3
29.6
87.5
10
01
00
-0
10
0
Ric
e Se
edIm
port
--
- -
0-
- -
- -
-
Exp
ort
--
23.5
79.7
62.7
27.1
54.4
4.3
14.2
13.6
12.8
Mai
ze S
eed
Impo
rt-
0-
- 0
00
00
- -
Exp
ort
21.0
8.0
11.2
17.2
21.4
22.1
25.3
7.7
20.7
48.1
46.7
Gra
in S
orgh
um S
eed
Impo
rt -
- -
- -
- -
--
- -
Exp
ort
--
2.1
2.6
20.9
44.1
29.9
44.1
54.7
47.7
60.0
Bar
ley
Seed
Impo
rt -
-0
- -
- -
- -
- -
Exp
ort
- -
80
00
26.5
0.0
0.3
0.0
45.8
0
Buc
kwhe
at S
eed
Impo
rt -
- 1
00
10
01
00
10
01
00
10
01
00
10
01
00
Exp
ort
- -
024
.20.
00.
074
.50.
00.
00.
00.
5
Sour
ce:
ITC
Tra
de M
ap,
2012
-13
Not
es: (
-) in
dica
tes
that
tra
de d
ata
are
not
avai
labl
e du
ring
the
per
iods
.
20 Potential for Trade in Seeds between India and Other SAARC Countries
Seed-related Sensitive List under SAFTA and Applied MFNTariff
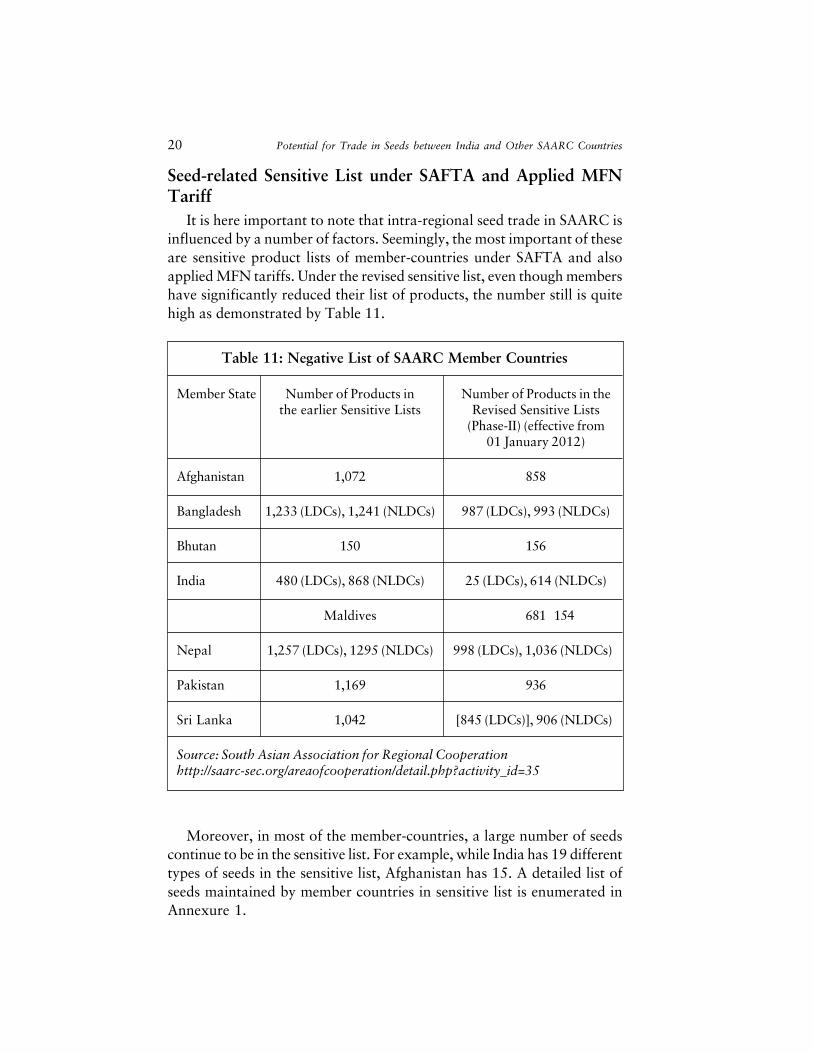
It is here important to note that intra-regional seed trade in SAARC isinfluenced by a number of factors. Seemingly, the most important of theseare sensitive product lists of member-countries under SAFTA and alsoapplied MFN tariffs. Under the revised sensitive list, even though membershave significantly reduced their list of products, the number still is quitehigh as demonstrated by Table 11.
Table 11: Negative List of SAARC Member Countries
Member State Number of Products in Number of Products in thethe earlier Sensitive Lists Revised Sensitive Lists
(Phase-II) (effective from01 January 2012)
Afghanistan 1,072 858
Bangladesh 1,233 (LDCs), 1,241 (NLDCs) 987 (LDCs), 993 (NLDCs)
Bhutan 150 156
India 480 (LDCs), 868 (NLDCs) 25 (LDCs), 614 (NLDCs)
Maldives 681 154
Nepal 1,257 (LDCs), 1295 (NLDCs) 998 (LDCs), 1,036 (NLDCs)
Pakistan 1,169 936
Sri Lanka 1,042 [845 (LDCs)], 906 (NLDCs)
Source: South Asian Association for Regional Cooperationhttp://saarc-sec.org/areaofcooperation/detail.php?activity_id=35
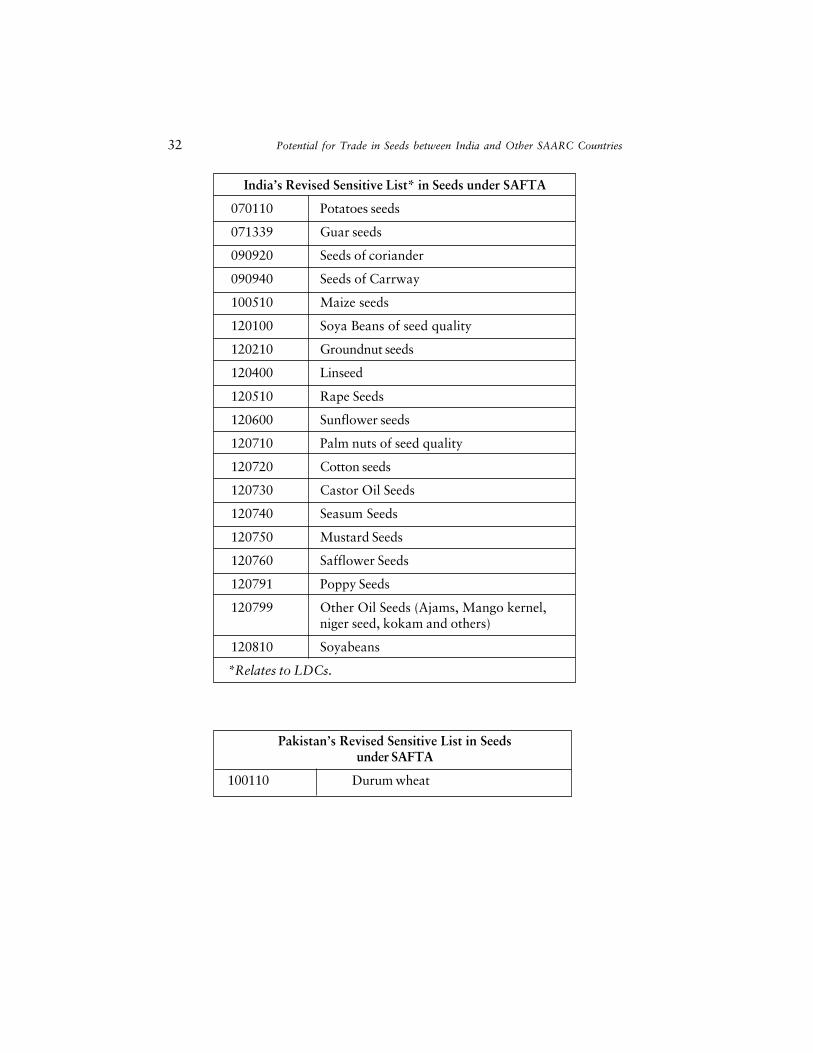
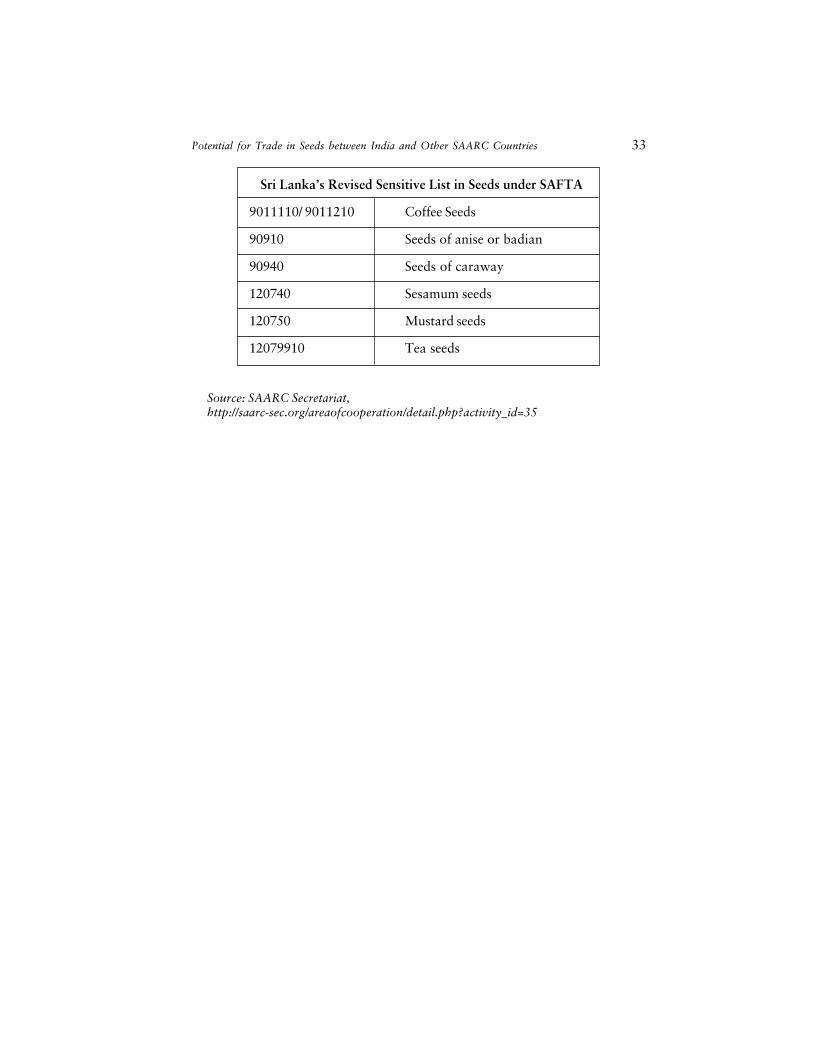
Moreover, in most of the member-countries, a large number of seedscontinue to be in the sensitive list. For example, while India has 19 differenttypes of seeds in the sensitive list, Afghanistan has 15. A detailed list ofseeds maintained by member countries in sensitive list is enumerated inAnnexure 1.
Potential for Trade in Seeds between India and Other SAARC Countries 21
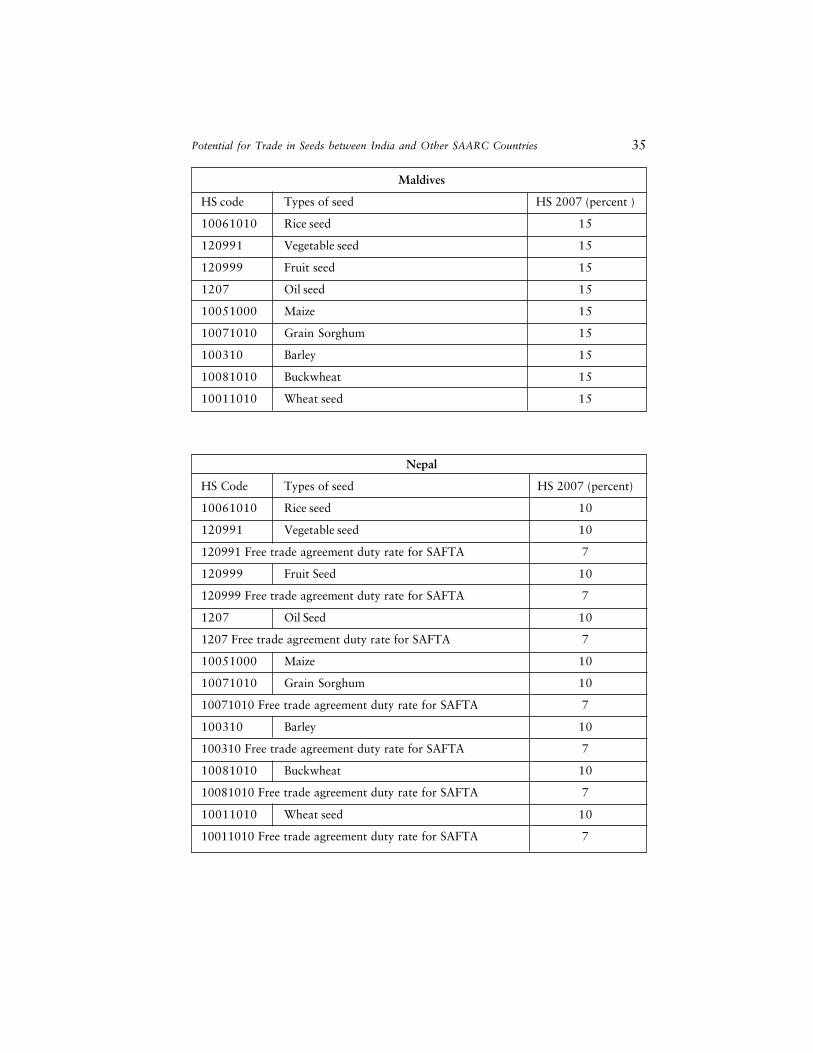
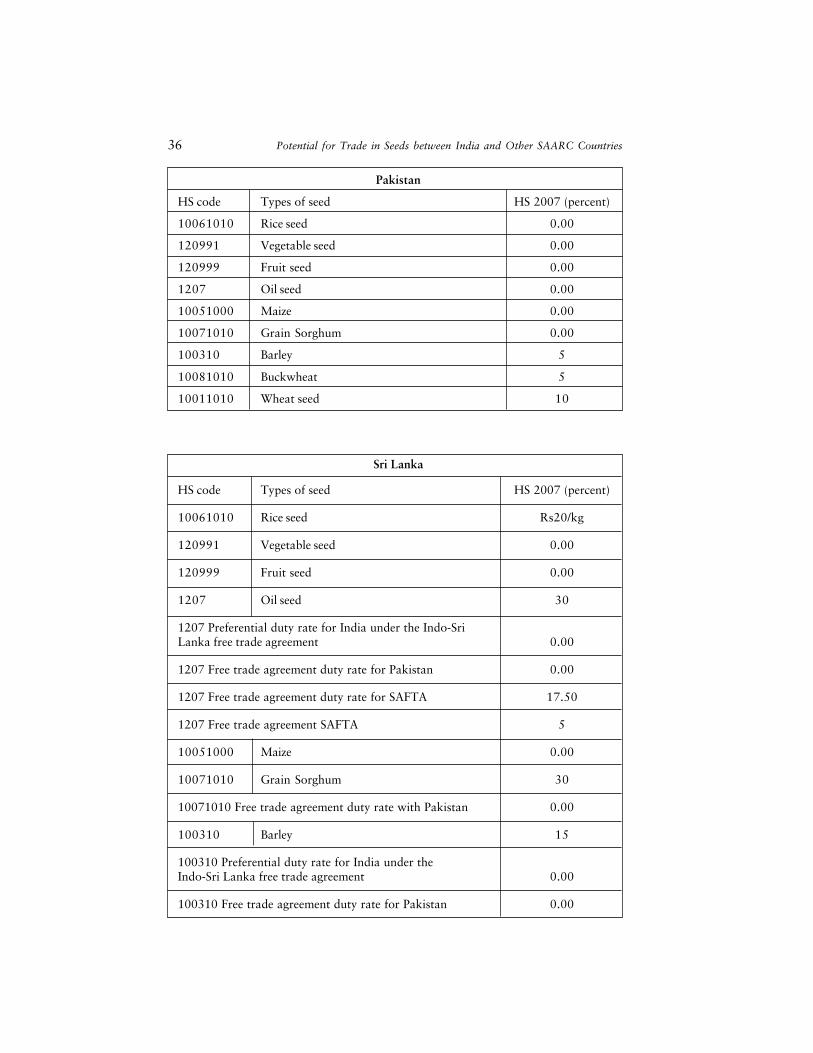
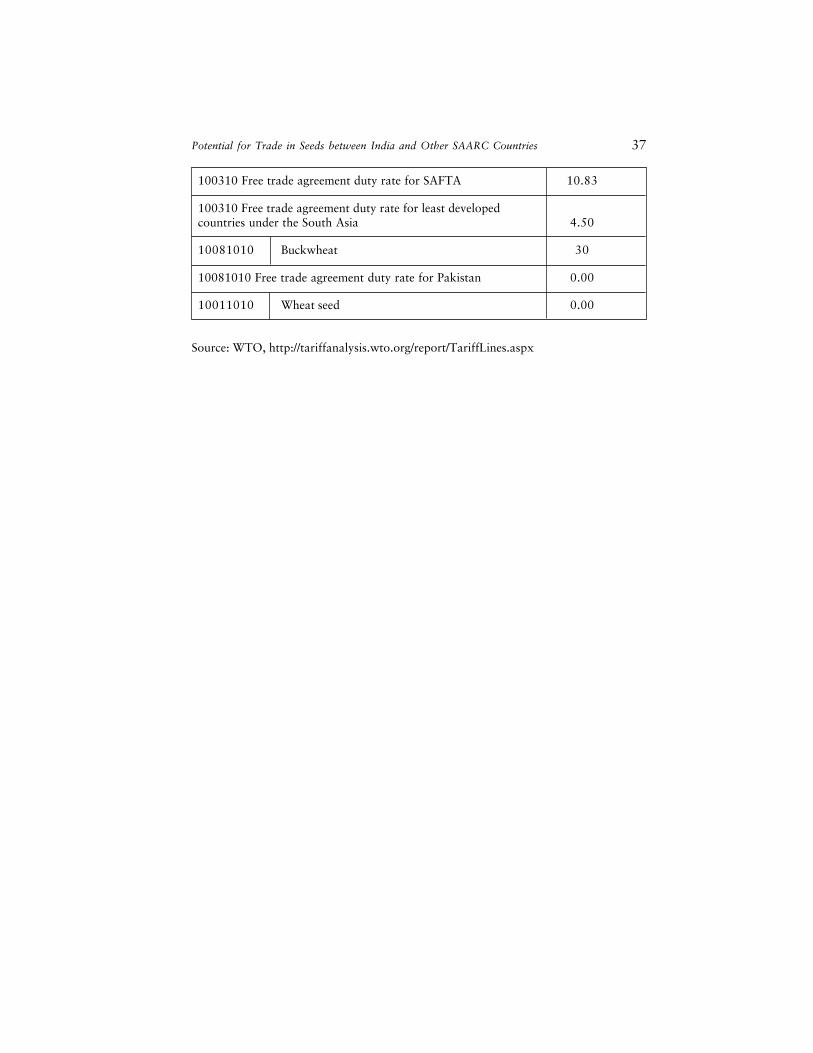
Besides, most of the member-countries apply MFN tariffs on importof certain seed products. This could be for the obvious reason of protectingone�s domestic seed industry from external competition. A detailed list ofMFN tariffs applied by member countries in SAARC is presented asAnnexure 2.

22 Potential for Trade in Seeds between India and Other SAARC Countries
To assess the potentiality of seed trade between the SAARC membercountries, and the positioning of different member countries,
techniques of RCA and bilateral trade intensity index have been applied.RCA for India and other SAARC countries has been computed. A revealedcomparative advantage is calculated to understand the relative advantageor disadvantage of a certain country in a certain class of goods or servicesas evidenced by trade flows.
Computation of revealed comparative advantage relies on bilateral tradeintensity index, that has been computed for India on the one hand andother SAARC countries on the other. It might be noted that bilateraltrade intensity index is used to explain the flow of trade between tworegions. In the present case, it is India and other SAARC countries. Theprocess is reversed to understand flow of seed from other SAARCcountries to India.
Table 12 summarises the results obtained from the RCA analysis. Thetable establishes the fact that India has revealed comparative advantagein eight out of nine seed categories traded between India and other SAARCcountries for the entire period 2001-11. The table reflects that there isbig scope and opportunity for both India and other SAARC countries inseed. Both India and other SAARC countries stand to potentially gainfrom trade in these nine seeds.
4Potential of Seed Trade andRevealed Comparative Advantage

24 Potential for Trade in Seeds between India and Other SAARC Countries
However, it is important to emphasise that there exists potential forbilateral and intra-regional trade between India and other SAARCcountries. This is because while India has comparative advantage in some,other SAARC countries have advantages in others. This is, however, adynamic situation and can change over time.
Seed-wise revealed comparative advantage in seed trade between Indiaand other SAARC countries is appended as annexures (see Annexure 3).Country-wise and seed-wise revealed comparative advantage of differentSAARC countries is shown in Annexure 4.
Table 12: Trade Potentials between India andOther SAARC Countries by RCA
Commodities India Other SAARC countries
Vegetable Seed Potential Exporter Potential Importer
Fruit Seed Potential Exporter Potential Importer
Oil Seed Potential Exporter Potential Importer
Wheat Seed Potential Exporter Potential Importer
Rice Seed Potential Exporter Potential Importer
Maize Seed Potential Exporter Potential Importer
Grain Sorghum Potential Exporter Potential Importer
Barley Seed Potential Exporter Potential Importer
Buckwheat Seed Potential Importer Potential Exporter
From the analysis and results obtained above, one can conclude thatIndia has fair potential to meet the import needs of the SAARC region.
The scope of benefiting from the bilateral trade with SAARC region looksquite good. Greater opening of seed trade might help other member-countries in SAARC to have better access to quality/certified seeds. Thesecountries might also benefit from the efficiency which trade will bring into their respective domestic markets.
Considering the mutual benefits which could be ushered in as a resultof seed trade, countries in South Asia need to join hands to avail existingpotential and opportunities within the region and further to addresschallenges to food security and poverty reduction.
The tasks at hand are challenging, considering the present low level ofcooperation reinforced by trust deficit. To have a real breakthrough, somefocused and time bound initiatives are required. Some of these includethe following:
Presently a clear understanding of seed market in the South Asiancountries is missing. It is difficult of the countries in the region to designsolutions, unless there is a proper assessment of what is available andwhat needs to be done. There is urgent need for understanding of marketdynamics, demand-supply and gap; capacity of each county to meet seedrequirement of domestic and regional market. These should also includeproper assessment of challenges faced at the country level keeping regionalperspective in view.
Considering that seeds are living basic inputs for a sustainableagricultural growth, South Asian countries should come forward withinitiatives such as identifying major varieties that could be adapted toother countries in the region.
5Conclusion and PolicyRecommendations
26 Potential for Trade in Seeds between India and Other SAARC Countries
Research institutions in one or more countries in the region shoulddesign a plan of action for engagements with similar institutions in othercountries. Such engagements could be premised on what is required tonot only ensure adequate seed production for the local market, but alsoto meet regional demand. The focus, obviously, should be on developmentand use of seeds.
The SAARC Seed Bank is a noble initiative. Its objective could beembedded with focused and time bound activities and initiative toeffectively address seed-related challenges faced by the region.
Bangladesh Seed Grower, Dealer and Merchants Association (2007),�Bangladesh Seed Industry at a Glance�, accessed on March 4, 2013,URL: www.apsaseed.org/docs/bc3147ea/Bangladesh_Seed_Industry_at_a_Glance.pdf.
Cho, Renee (2013), �Improving Seeds to Meet Future Challenges�,available at http://blogs.ei.columbia.edu/2013/02/08/improving-seeds-to-meet-future-challenges/
Cromwell, Elizabeth, Esbern Friis-hansen and Michael Turner (1992),�The Seed Sector in Developing Countries: A Framework forPerformance Analysis�, ODI Working paper No. 65.
Murugkar, Milind, Bharat Ramaswami, Mahesh Shelar (2007),�Competition and Monopoly in the Indian Cotton Seed Market�,Economic and Political Weekly, Vol - XLII No. 37, September 15,2007
Pray, Carl E. and Bharat Ramaswami (1991), �A Framework for SeedPolicy Analysis in Developing Countries�. IFPRI: Washington, D.C.
SAARC Agriculture Centre (2009), �Quality Seed in SAARC Countries(2009), Production, Processing, Legal and Quality Control andMarketing.�
Ravi, S. Bala, (December 2009), �The Conflict between Seed Bill andPPVFR Act of India.�
Sikdar, Chandrima (2012), �Prospects of Bilateral Trade between Indiaand Bangladesh.�
Spielman, David J., Deepthi Kolady, Anthony Cavalieri, N.Chandrasekhara Rao, (IFPRI Discussion Paper 01103, July 2011), �The
References
28 Potential for Trade in Seeds between India and Other SAARC Countries
Seed and Agricultural Biotechnology Industries in India: An Analysis ofIndustry Structure, Competition, and Policy Options�.
Tripp, Robert, Ruifa Hu and Suresh Pal (2010), �Rice Seed Provisionand Evolution of Seed Markets, in Sushil Pandey, Derek Byerlee, DavidDawe, Achim Dobermann, Samarendu Mohanty, Scott Rozelle, and BillHardy, Rice in the Global Economy: Strategic Research and PolicyIssues for Food Security, IRRI: Manila.

1. SAARC, established in 1985, consists of eight countries in South Asianamely Afghanistan, Bangladesh, Bhutan, India, Maldives, Nepal, Pakistanand Sri Lanka. Afghanistan is a relatively new entrant, having joined thegroup in April 2007
2. Afghanistan from over 45 percent in 2002 to less than 30 percent in 2010;Bangladesh from 24 percent in 2001 to a little over 18 percent in 2011;Bhutan from about 28 percent in 2001 to about 19 percent in 2009; Indiafrom 23 percent in 2001 to less than 18 percent in 2011; Maldives fromabout 10 percent in 2001 to about 3 percent in 2010; Pakistan from over 24percent in 2001 to less than 22 percent in 2011; and Sri Lanka from 20percent in 2001 to about 13 percent in 2011
3. IFPRI (2011), �The Seed and Agricultural Biotechnology Industries in India:An Analysis of Industry Structure, Competition, and Policy Options�, IFPRIDiscussion Paper 01103, July 2011, available at: www.ifpri.org/sites/default/files/publications/ifpridp01103.pdf
4. It might be noted that Breeder seed is used for the production of foundationseed and certified seeds
5. The estimate of total seed requirement in India is based on state-levelestimate of seed requirements presented at the Bi-annual (Kharif and Rabi)national-level conferences. Each of the states are invited and present theirseed requirement for Kharif and Rabi cropping seasons
6. For details, see CUTS (2013), Dynamics of Rice Seeds Trade: Need forCooperation between India and Bangladesh, available at: www.cuts-citee.org/RISTE/pdf/Dynamics_of_Rice_Seeds_Trade-Need_for_Cooperation_between_India_and_Bangladesh.pdf
7. Consumers and Economic Cooperation: Cost of Economic Non-cooperationto Consumers in South Asia, CUTS International, 2012, available at:www.cuts-citee.org/pdf/Consumers_and_Economic_Cooperation-Cost_of_Economic_Non-cooperation_to_Consumers_in_South_Asia.pdf
8. Vegetable seed includes cabbage, cauliflower, onion, pea, radish, tomato,among others
9. Oil seed includes palm nuts and kernel, cotton, mustard, coaster, sesamum,safflower, melon, poppy, sea nuts
Endnotes

30 Potential for Trade in Seeds between India and Other SAARC Countries
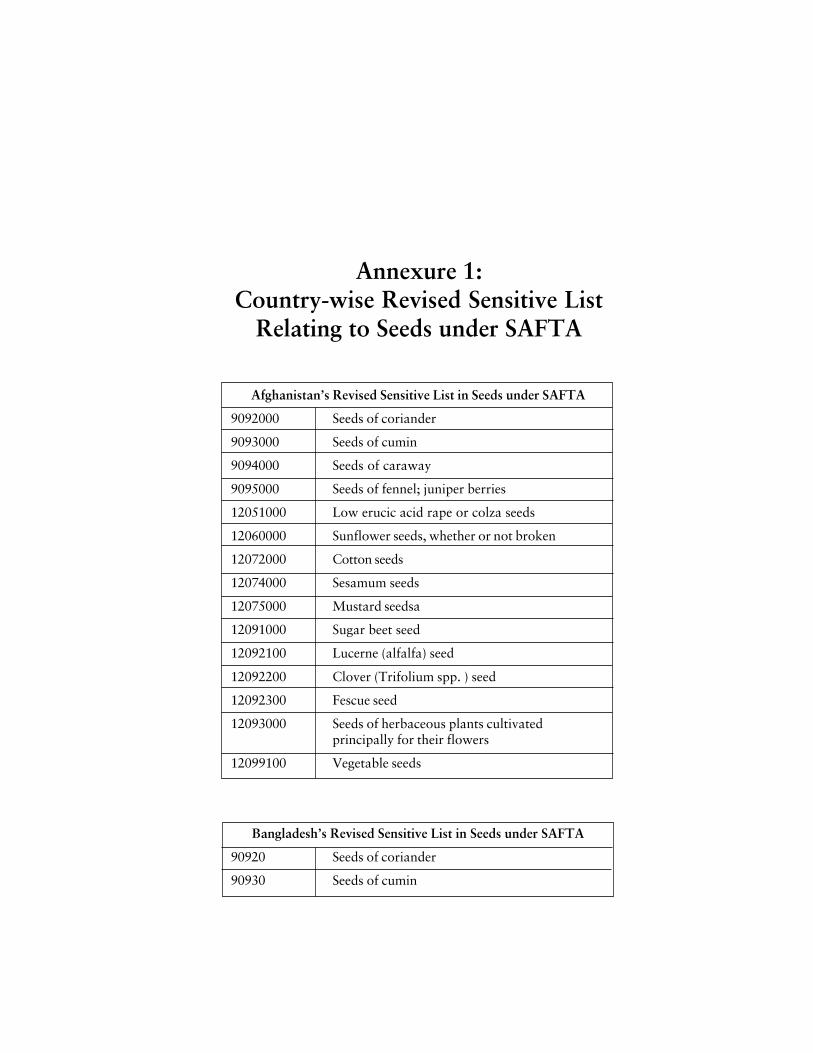
Afghanistan�s Revised Sensitive List in Seeds under SAFTA
9092000 Seeds of coriander
9093000 Seeds of cumin
9094000 Seeds of caraway
9095000 Seeds of fennel; juniper berries
12051000 Low erucic acid rape or colza seeds
12060000 Sunflower seeds, whether or not broken
12072000 Cotton seeds
12074000 Sesamum seeds
12075000 Mustard seedsa
12091000 Sugar beet seed
12092100 Lucerne (alfalfa) seed
12092200 Clover (Trifolium spp. ) seed
12092300 Fescue seed
12093000 Seeds of herbaceous plants cultivatedprincipally for their flowers
12099100 Vegetable seeds
Bangladesh�s Revised Sensitive List in Seeds under SAFTA
90920 Seeds of coriander
90930 Seeds of cumin
Annexure 1:Country-wise Revised Sensitive List
Relating to Seeds under SAFTA
32 Potential for Trade in Seeds between India and Other SAARC Countries
India�s Revised Sensitive List* in Seeds under SAFTA
070110 Potatoes seeds
071339 Guar seeds
090920 Seeds of coriander
090940 Seeds of Carrway
100510 Maize seeds
120100 Soya Beans of seed quality
120210 Groundnut seeds
120400 Linseed
120510 Rape Seeds
120600 Sunflower seeds
120710 Palm nuts of seed quality
120720 Cotton seeds
120730 Castor Oil Seeds
120740 Seasum Seeds
120750 Mustard Seeds
120760 Safflower Seeds
120791 Poppy Seeds
120799 Other Oil Seeds (Ajams, Mango kernel,niger seed, kokam and others)
120810 Soyabeans
*Relates to LDCs.
Pakistan�s Revised Sensitive List in Seedsunder SAFTA
100110 Durum wheat
Potential for Trade in Seeds between India and Other SAARC Countries 33
Sri Lanka�s Revised Sensitive List in Seeds under SAFTA
9011110/ 9011210 Coffee Seeds
90910 Seeds of anise or badian
90940 Seeds of caraway
120740 Sesamum seeds
120750 Mustard seeds
12079910 Tea seeds
Source: SAARC Secretariat,http://saarc-sec.org/areaofcooperation/detail.php?activity_id=35
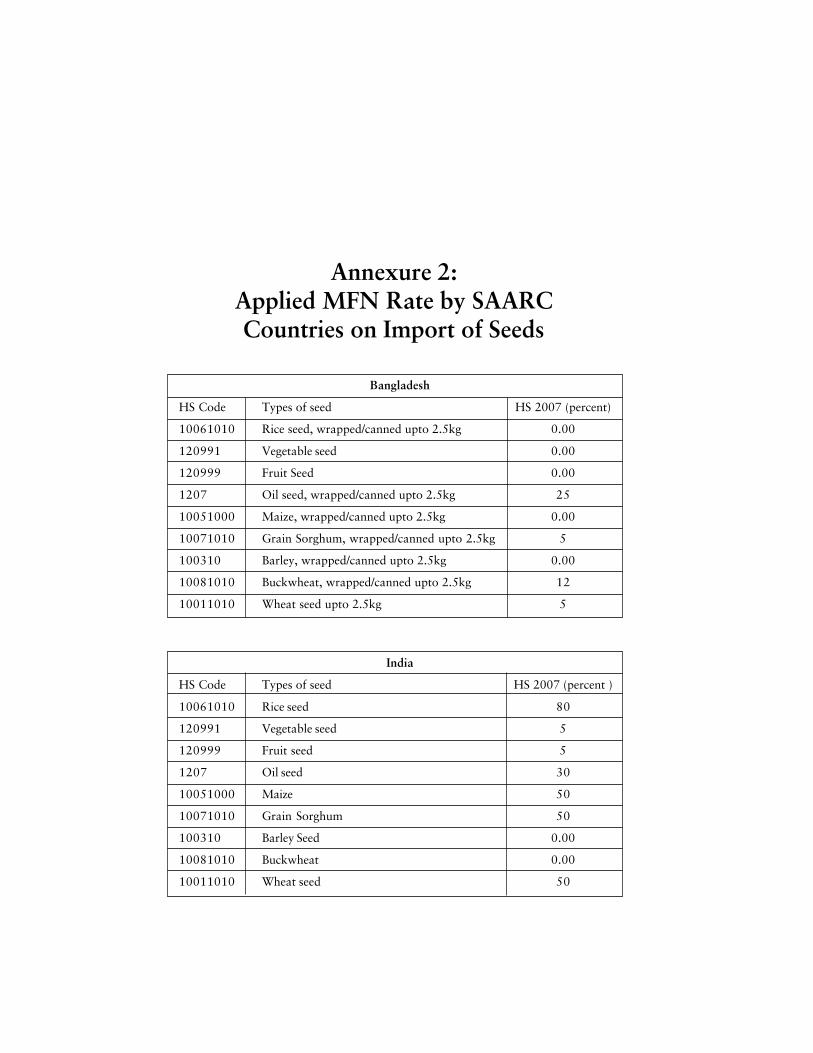
Annexure 2:Applied MFN Rate by SAARCCountries on Import of Seeds
Bangladesh
HS Code Types of seed HS 2007 (percent)
10061010 Rice seed, wrapped/canned upto 2.5kg 0.00
120991 Vegetable seed 0.00
120999 Fruit Seed 0.00
1207 Oil seed, wrapped/canned upto 2.5kg 25
10051000 Maize, wrapped/canned upto 2.5kg 0.00
10071010 Grain Sorghum, wrapped/canned upto 2.5kg 5
100310 Barley, wrapped/canned upto 2.5kg 0.00
10081010 Buckwheat, wrapped/canned upto 2.5kg 12
10011010 Wheat seed upto 2.5kg 5
India
HS Code Types of seed HS 2007 (percent )
10061010 Rice seed 80
120991 Vegetable seed 5
120999 Fruit seed 5
1207 Oil seed 30
10051000 Maize 50
10071010 Grain Sorghum 50
100310 Barley Seed 0.00
10081010 Buckwheat 0.00
10011010 Wheat seed 50
Potential for Trade in Seeds between India and Other SAARC Countries 35
Maldives
HS code Types of seed HS 2007 (percent )
10061010 Rice seed 15
120991 Vegetable seed 15
120999 Fruit seed 15
1207 Oil seed 15
10051000 Maize 15
10071010 Grain Sorghum 15
100310 Barley 15
10081010 Buckwheat 15
10011010 Wheat seed 15
Nepal
HS Code Types of seed HS 2007 (percent)
10061010 Rice seed 10
120991 Vegetable seed 10
120991 Free trade agreement duty rate for SAFTA 7
120999 Fruit Seed 10
120999 Free trade agreement duty rate for SAFTA 7
1207 Oil Seed 10
1207 Free trade agreement duty rate for SAFTA 7
10051000 Maize 10
10071010 Grain Sorghum 10
10071010 Free trade agreement duty rate for SAFTA 7
100310 Barley 10
100310 Free trade agreement duty rate for SAFTA 7
10081010 Buckwheat 10
10081010 Free trade agreement duty rate for SAFTA 7
10011010 Wheat seed 10
10011010 Free trade agreement duty rate for SAFTA 7
36 Potential for Trade in Seeds between India and Other SAARC Countries
Pakistan
HS code Types of seed HS 2007 (percent)
10061010 Rice seed 0.00
120991 Vegetable seed 0.00
120999 Fruit seed 0.00
1207 Oil seed 0.00
10051000 Maize 0.00
10071010 Grain Sorghum 0.00
100310 Barley 5
10081010 Buckwheat 5
10011010 Wheat seed 10
Sri Lanka
HS code Types of seed HS 2007 (percent)
10061010 Rice seed Rs20/kg
120991 Vegetable seed 0.00
120999 Fruit seed 0.00
1207 Oil seed 30
1207 Preferential duty rate for India under the Indo-SriLanka free trade agreement 0.00
1207 Free trade agreement duty rate for Pakistan 0.00
1207 Free trade agreement duty rate for SAFTA 17.50
1207 Free trade agreement SAFTA 5
10051000 Maize 0.00
10071010 Grain Sorghum 30
10071010 Free trade agreement duty rate with Pakistan 0.00
100310 Barley 15
100310 Preferential duty rate for India under theIndo-Sri Lanka free trade agreement 0.00
100310 Free trade agreement duty rate for Pakistan 0.00
Potential for Trade in Seeds between India and Other SAARC Countries 37
Source: WTO, http://tariffanalysis.wto.org/report/TariffLines.aspx
100310 Free trade agreement duty rate for SAFTA 10.83
100310 Free trade agreement duty rate for least developedcountries under the South Asia 4.50
10081010 Buckwheat 30
10081010 Free trade agreement duty rate for Pakistan 0.00
10011010 Wheat seed 0.00
The analysis below provides the trade intensity index of seed tradebetween India and SAARC, Bangladesh, Pakistan and Nepal. The tradeintensity index provides the flow of trade between India and SAARCcountries. This index has been used since 1960 to analyse the directionand magnitude of international trade. The intensity index allows thecountry to trade with each other more or less depending on its value. Theimportance of this index is that it can capture the small changes in tradebetween two countries. It can also highlight the small change in tradingcountries even if their earlier pattern of trade happens to be small.
Bilateral trade intensity index measures are an exporter�s penetrationof an importer�s market within the context of overall world trade. Aformula of this index is as follows:
ITij = (Xij/ Xiw) / (Mjw/ Mww)�������������. (i)
Share of I�s export going to jShare of world import going to j
Alternatively, if one abstracts from transportation margin, then thisindex can also be reshaped to focus on exporting country and its competingsuppliers in market j. In that case, the IT index becomes supply, a ratio ofdestination shares (ds) as is stated below:
ITij= dsij/dswj = (Xij/ Xiw) / (Xwj/ Xww)���������.(ii)
Share of I�s export going to jShare of world export going to j
Annexure 3:Seed Trade Intensity of India and
Other SAARC Countries
Potential for Trade in Seeds between India and Other SAARC Countries 39
Where Xij is export from country I to country j; Xiw is total exports tothe world by country I; Xwj is total export to country j; Xww is total worldexport; Mji is import of country j from country I; Mjw is total importsfrom the world by country j; Mww is total world imports; ds is destinationshare.
A unit value of ITij shows that country I has no gain in supplying ofcountry j or supplying the same in foreign markets. Following the resultsof second equation, if ITij> 1 implies that nation �j� is an important marketfor exporter I, than for any other country of the world. Likewise,, if0<ITij<1, then country j would be a less important market for I than anyother country exporting to j.
The bilateral trade intensity index has been computed by using thesecond equation for the nine seeds as mentioned above. It has beencomputed for the period 2001-11. The changes in the results of this indexwill show the experience of trade of increasing or decreasing over thetime.
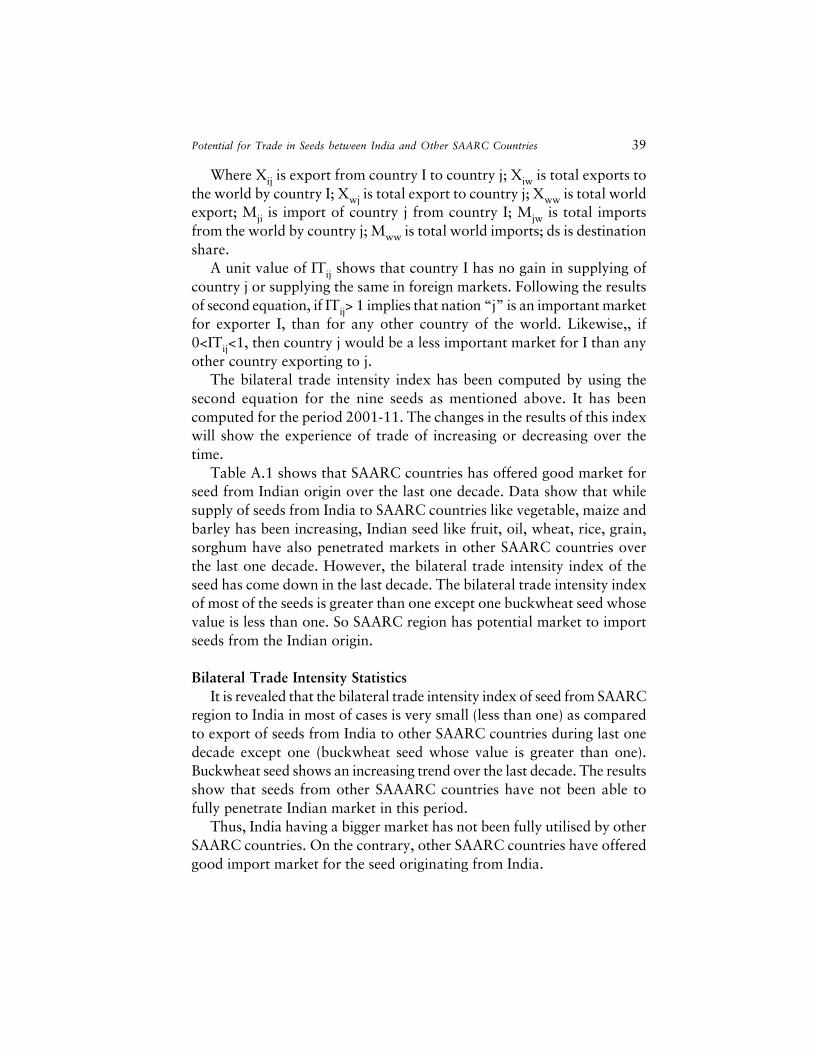
Table A.1 shows that SAARC countries has offered good market forseed from Indian origin over the last one decade. Data show that whilesupply of seeds from India to SAARC countries like vegetable, maize andbarley has been increasing, Indian seed like fruit, oil, wheat, rice, grain,sorghum have also penetrated markets in other SAARC countries overthe last one decade. However, the bilateral trade intensity index of theseed has come down in the last decade. The bilateral trade intensity indexof most of the seeds is greater than one except one buckwheat seed whosevalue is less than one. So SAARC region has potential market to importseeds from the Indian origin.
Bilateral Trade Intensity StatisticsIt is revealed that the bilateral trade intensity index of seed from SAARC
region to India in most of cases is very small (less than one) as comparedto export of seeds from India to other SAARC countries during last onedecade except one (buckwheat seed whose value is greater than one).Buckwheat seed shows an increasing trend over the last decade. The resultsshow that seeds from other SAAARC countries have not been able tofully penetrate Indian market in this period.
Thus, India having a bigger market has not been fully utilised by otherSAARC countries. On the contrary, other SAARC countries have offeredgood import market for the seed originating from India.
40 Potential for Trade in Seeds between India and Other SAARC Countries
Table A.1: Bilateral Trade Intensity Index of India and other SAARCRegion
Types of seed Bilateral Trade Intensity Index
2001 2002 2003 2004 2005 2006 2007 2008 2009 2010 2011
Vegetable 8.72 14.47 16.35 16.64 12.90 14.83 16.08 13.97 14.04 22.48 19.11Seed
Fruit Seed 9.89 1.33 9.29 18.14 12.41 9.95 5.23 7.12 9.76 7.93 7.64
Oil Seed 1.50 1.20 0.68 1.52 0.67 0.63 0.97 2.00 1.15 0.62 1.25
Wheat Seed - - 21.35 2.03 3.03 10.24 41.79 3.65 - 0.00 17.89
Rice Seed - - 41.20 52.15 37.80 0.77 22.55 2.40 7.46 6.04 2.10
Maize Seed 90.08 16.75 18.40 35.45 33.89 41.89 71.25 19.46 26.44 52.44 67.72
Grain - - 1,917.92 57.97 2,307.16 2,988.65 2,879.89 189.71 88.01 74.81 5,756.62Sorghum
Barley Seed - - 21,573.19 0.00 0.00 234.60 5.53 20.32 0.00 1,140.02 0.00
Buckwheat - - 0 121.48 0.00 0.00 229.82 0.00 0.00 0.00 0.26Seed
Source: Source: ITC Trade Map
Note: (-), indicate that country has not traded the seeds during the period
Table A.2: Bilateral Trade Intensity Index of other SAARC Regionand India, 2001-2011
Types of seed Bilateral Trade Intensity Index
2001 2002 2003 2004 2005 2006 2007 2008 2009 2010 2011
Vegetable Seed 1.64 0.01 0.03 0.26 0.00 0.00 0.00 0.00 0.02 0.00 0.07
Fruit Seed 0 0.02 0.86 2.03 0.20 0.10 0.00 0.06 0.00 0.00 0.25
Oil Seed 0 0 0.05 0.00 0.00 0.02 0.00 0.02 0.49 0.05 0.01
Wheat Seed 0 0 0 0 0 0 0 0
Rice Seed 0 0 0 0 0 0 0 0 0
Maize Seed 0 0 0 0 0 0 0 0 0 0 0
Grain Sorghum 0 0 0 0 0 0 0 0 0
Barley Seed 0 0 0 0 0 0 0 0 0
Buckwheat Seed 503.20 713.72 23,970.68 1,066.28 2,134.94 6,151.30 3,085.42 1,598.52 19.38
Source: ITC Trade Map, 2012-13
Notes: (-) indicates that trade has not occurred during that period.
This clearly indicates that SAARC as a whole except India did not reported any amount of exporting value to the world.

Potential for Trade in Seeds between India and Other SAARC Countries 41
Table A.3 indicates bilateral trade intensity index of India andBangladesh from 2001 to 2011. Bangladesh has offered good market forseed originating in India side. The index value of seed like vegetable seed,fruit seed, and maize seed have shown increasing trend over the last onedecade. Large fluctuation in index value of wheat seed has been recordedin this period. But index value of rest of the seed has been showingdecreasing trend and its index value is less than one in most of seeds.
Table A.3: Bilateral Trade Intensity Index for India with Bangladesh
Types of seed Bilateral Trade Intensity Index
2001 2002 2003 2004 2005 2006 2007 2008 2009 2010 2011
Vegetable - 9.87 60.70 39.92 27.03 21.40 10.93 22.94 19.92 26.39 35.89Seed
Fruit Seed - 1.47 26.99 110.01 73.20 33.19 34.53 33.42 40.28 20.18 21.76
Oil Seed - 0.00 0.00 0.03 0.00 0.03 0.00 1.18 0.50 0.14 0.00
Wheat Seed - - 26.33 18.46 62.35 408.99 0.00 159603.81 - 0.00 16.73
Rice Seed - - 14.24 1.63 0.11 0.02 0.98 0.48 0.09 3.33 0.47
Maize Seed - 20.63 28.75 21.87 4.74 49.24 107.06 58.15 14.47 55.15 63.99
Grain Sorghum - - - - - - - 1.45 0.63 0.40 572.29Seed
Barley Seed - - 52734.45 0.00 0.00 0.00 - - 0.00 -
Buckwheat - - - - - - - - - - -Seed
Source: ITC Trade Map, 2012-13
Notes: (-) indicates that trade has not occurred during that period
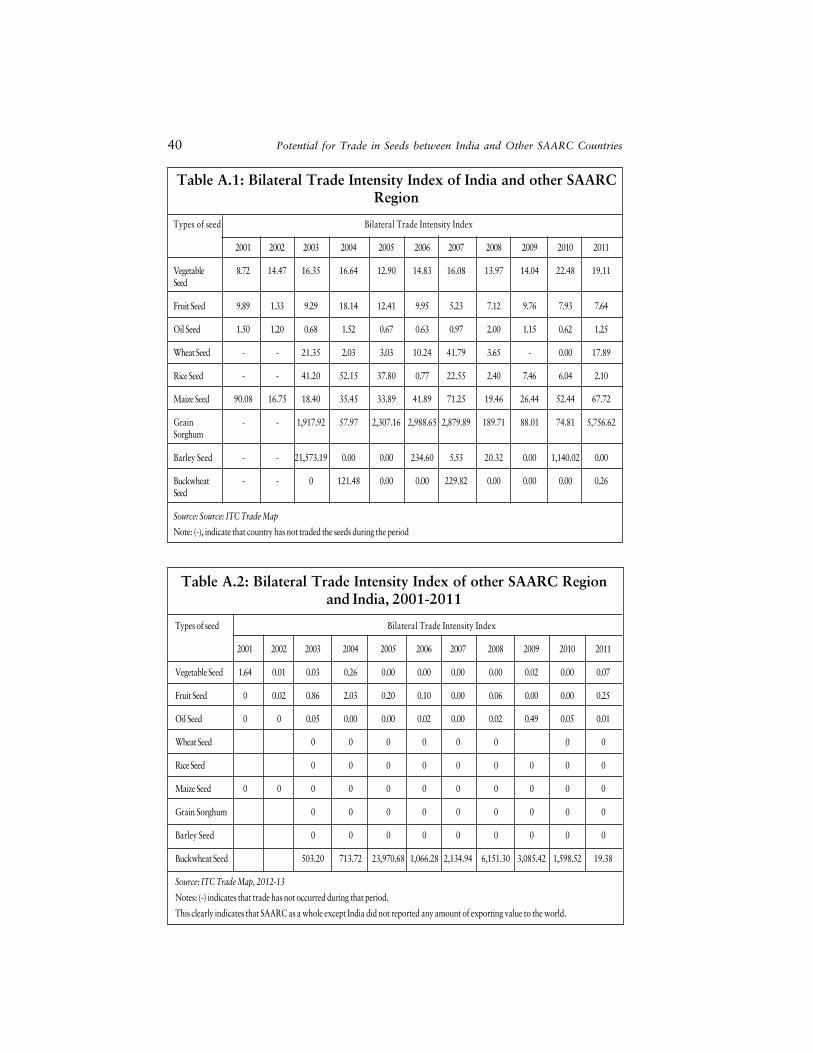
Analysis shows that seeds from India have been able to penetratemarkets in Pakistan. The intensity index of India with Pakistan has realisedan increasing trend in vegetable, fruit, oil, maize and grain sorghum seed.The index value of rest of the seed is either zero or have shown decreasingtrend in the last decade. Analysis and results also show that India haspotential and opportunity to export the seed in Pakistan market.
42 Potential for Trade in Seeds between India and Other SAARC Countries
Table A.4: Bilateral Trade Intensity Index for India with Pakistan
Types of seed Bilateral Trade Intensity Index
2001 2002 2003 2004 2005 2006 2007 2008 2009 2010 2011
Vegetable - - 31.20 38.12 27.03 31.77 52.86 55.86 67.66 68.85 55.32Seed
Fruit Seed - - 8.21 9.14 4.39 0.71 0.71 1.66 2.88 1.90 3.73
Oil Seed - - 0.99 1.36 0.04 1.88 0.00 0.24 1.53 6.95 3.46
Wheat Seed - - - 0.00 0.00 0.63 0.00 0.00 - 0.00 0.00
Rice Seed - - - - - 0.00 - - 0.02 4.18 0.00
Maize Seed - - 8.47 0.74 0.99 24.10 4.34 13.71 54.36 86.44 91.74
Grain - - - - - - 117,44.50 103,379.01 11,986.99 53,264.66 11,5661.03SorghumSeed
Barley Seed - - 0 0 0 3,958.567 0 0 0 0 0
Buckwheat Seed - - - - - - - - - - -
Source: ITC Trade Map, 2012-13
Notes: (-) indicates that trade has not occurred during that period
As reflected by Table A.5, seed trade data for India and Nepal is notavailable in many years. Available data indicate that Nepal is a goodexporting destination of seed originating in India. The index value of mostof the seed is greater than one.
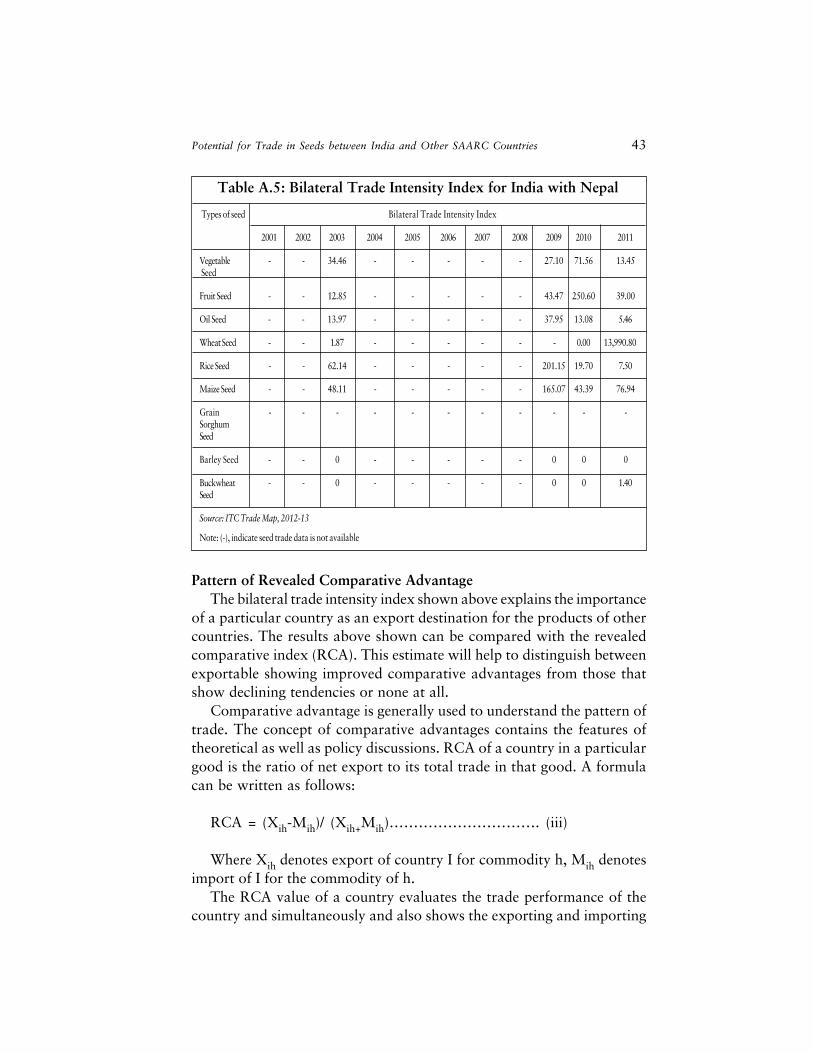
Potential for Trade in Seeds between India and Other SAARC Countries 43
Table A.5: Bilateral Trade Intensity Index for India with Nepal
Types of seed Bilateral Trade Intensity Index
2001 2002 2003 2004 2005 2006 2007 2008 2009 2010 2011
Vegetable - - 34.46 - - - - - 27.10 71.56 13.45 Seed
Fruit Seed - - 12.85 - - - - - 43.47 250.60 39.00
Oil Seed - - 13.97 - - - - - 37.95 13.08 5.46
Wheat Seed - - 1.87 - - - - - - 0.00 13,990.80
Rice Seed - - 62.14 - - - - - 201.15 19.70 7.50
Maize Seed - - 48.11 - - - - - 165.07 43.39 76.94
Grain - - - - - - - - - - -SorghumSeed
Barley Seed - - 0 - - - - - 0 0 0
Buckwheat - - 0 - - - - - 0 0 1.40Seed
Source: ITC Trade Map, 2012-13
Note: (-), indicate seed trade data is not available
Pattern of Revealed Comparative AdvantageThe bilateral trade intensity index shown above explains the importance
of a particular country as an export destination for the products of othercountries. The results above shown can be compared with the revealedcomparative index (RCA). This estimate will help to distinguish betweenexportable showing improved comparative advantages from those thatshow declining tendencies or none at all.
Comparative advantage is generally used to understand the pattern oftrade. The concept of comparative advantages contains the features oftheoretical as well as policy discussions. RCA of a country in a particulargood is the ratio of net export to its total trade in that good. A formulacan be written as follows:
RCA = (Xih-Mih)/ (Xih+Mih)����������. (iii)
Where Xih denotes export of country I for commodity h, Mih denotesimport of I for the commodity of h.
The RCA value of a country evaluates the trade performance of thecountry and simultaneously and also shows the exporting and importing
44 Potential for Trade in Seeds between India and Other SAARC Countries
of a particular commodity. The RCA value ranges from -1 to +1; where -1 indicates that there are no export from country (Xih = 0) which revealscomparative disadvantage and +1 indicates that there are no imports (Mih=0) which reveals that comparative advantage. RCA can be computed atthe various level but the results would be finer if it is disaggregated. Largerthe level of disaggregation, it will identify the product in which exportpotential exit.
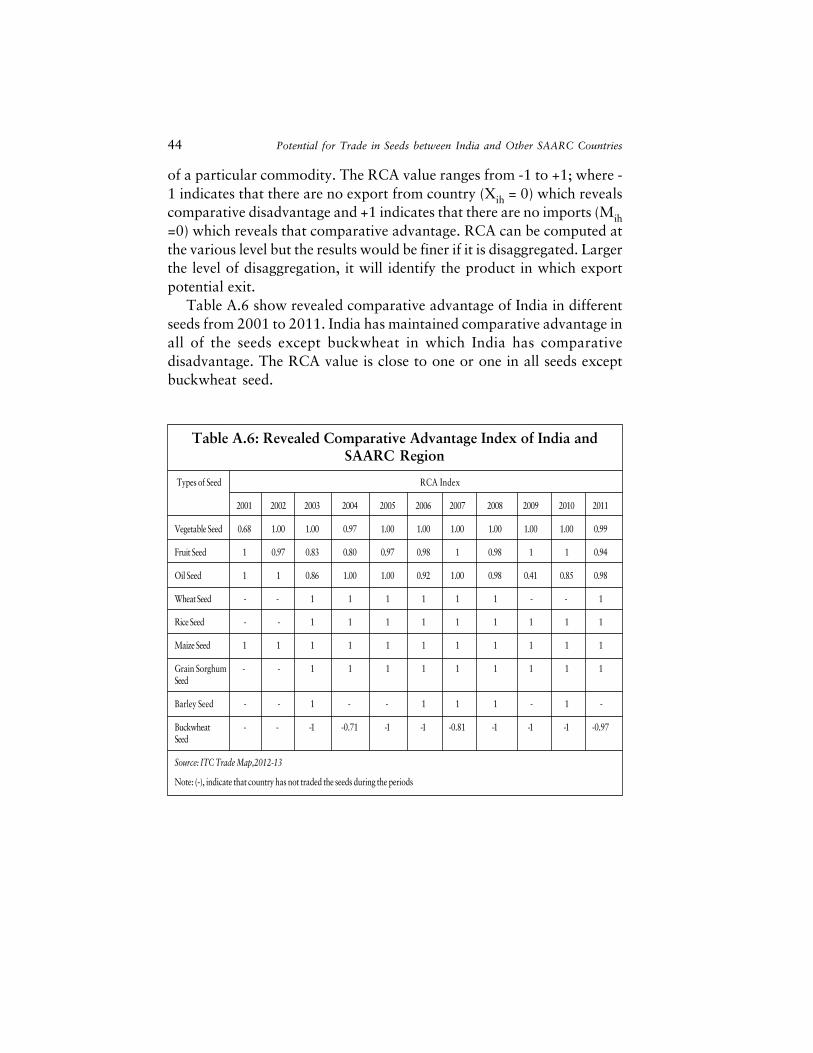
Table A.6 show revealed comparative advantage of India in differentseeds from 2001 to 2011. India has maintained comparative advantage inall of the seeds except buckwheat in which India has comparativedisadvantage. The RCA value is close to one or one in all seeds exceptbuckwheat seed.
Table A.6: Revealed Comparative Advantage Index of India andSAARC Region
Types of Seed RCA Index
2001 2002 2003 2004 2005 2006 2007 2008 2009 2010 2011
Vegetable Seed 0.68 1.00 1.00 0.97 1.00 1.00 1.00 1.00 1.00 1.00 0.99
Fruit Seed 1 0.97 0.83 0.80 0.97 0.98 1 0.98 1 1 0.94
Oil Seed 1 1 0.86 1.00 1.00 0.92 1.00 0.98 0.41 0.85 0.98
Wheat Seed - - 1 1 1 1 1 1 - - 1
Rice Seed - - 1 1 1 1 1 1 1 1 1
Maize Seed 1 1 1 1 1 1 1 1 1 1 1
Grain Sorghum - - 1 1 1 1 1 1 1 1 1Seed
Barley Seed - - 1 - - 1 1 1 - 1 -
Buckwheat - - -1 -0.71 -1 -1 -0.81 -1 -1 -1 -0.97Seed
Source: ITC Trade Map,2012-13
Note: (-), indicate that country has not traded the seeds during the periods
Potential for Trade in Seeds between India and Other SAARC Countries 45
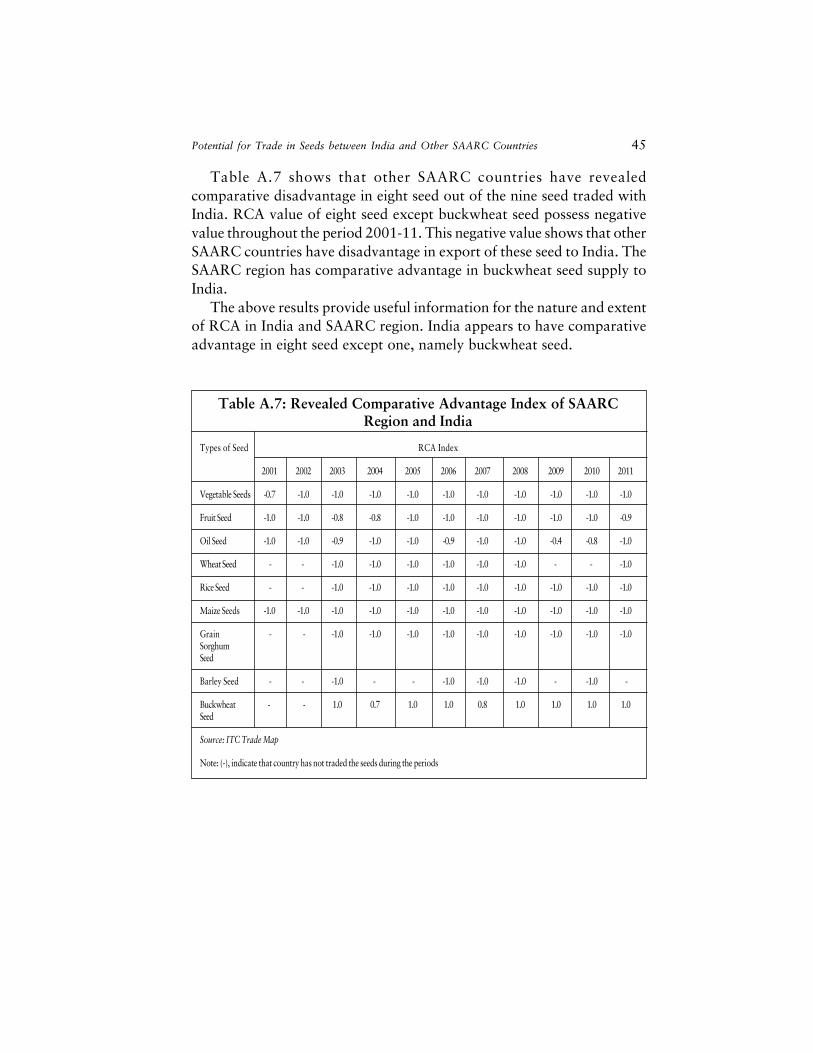
Table A.7 shows that other SAARC countries have revealedcomparative disadvantage in eight seed out of the nine seed traded withIndia. RCA value of eight seed except buckwheat seed possess negativevalue throughout the period 2001-11. This negative value shows that otherSAARC countries have disadvantage in export of these seed to India. TheSAARC region has comparative advantage in buckwheat seed supply toIndia.
The above results provide useful information for the nature and extentof RCA in India and SAARC region. India appears to have comparativeadvantage in eight seed except one, namely buckwheat seed.
Table A.7: Revealed Comparative Advantage Index of SAARCRegion and India
Types of Seed RCA Index
2001 2002 2003 2004 2005 2006 2007 2008 2009 2010 2011
Vegetable Seeds -0.7 -1.0 -1.0 -1.0 -1.0 -1.0 -1.0 -1.0 -1.0 -1.0 -1.0
Fruit Seed -1.0 -1.0 -0.8 -0.8 -1.0 -1.0 -1.0 -1.0 -1.0 -1.0 -0.9
Oil Seed -1.0 -1.0 -0.9 -1.0 -1.0 -0.9 -1.0 -1.0 -0.4 -0.8 -1.0
Wheat Seed - - -1.0 -1.0 -1.0 -1.0 -1.0 -1.0 - - -1.0
Rice Seed - - -1.0 -1.0 -1.0 -1.0 -1.0 -1.0 -1.0 -1.0 -1.0
Maize Seeds -1.0 -1.0 -1.0 -1.0 -1.0 -1.0 -1.0 -1.0 -1.0 -1.0 -1.0
Grain - - -1.0 -1.0 -1.0 -1.0 -1.0 -1.0 -1.0 -1.0 -1.0SorghumSeed
Barley Seed - - -1.0 - - -1.0 -1.0 -1.0 - -1.0 -
Buckwheat - - 1.0 0.7 1.0 1.0 0.8 1.0 1.0 1.0 1.0Seed
Source: ITC Trade Map
Note: (-), indicate that country has not traded the seeds during the periods

Vegetable Seed
Country 2001 2002 2003 2004 2005 2006 2007 2008 2009 2010 2011
Bangladesh 1 0.99 1 1 1 1 1 1 0.96 1 0.97
Pakistan 0.59 1.00 0.99 0.96 1.00 1.00 1.00 1.00 1.00 1.00 1.00
Nepal 1 - 0.94 1 1 1 1 1 1 1.00 0.89
Sri Lanka 1 1 1 1 1 1 1 1 1 1 1
Fruit Seeds
Country 2001 2002 2003 2004 2005 2006 2007 2008 2009 2010 2011
Bangladesh 1 1 1 1 1 1 1 1 1 1 0.91
Pakistan 1 0.94 0.45 0.10 0.75 0.37 1.00 0.89 1 1 1
Nepal 1 - 1 1 - 1 1 1 1 1 1
Sri Lanka 1 1 1 1 1 1 1 1 1 1 1
Oil Seed
Country 2001 2002 2003 2004 2005 2006 2007 2008 2009 2010 2011
Bangladesh 1 - 1 1 1 1 -0.52 1 0.93 1 -
Pakistan -0.12 0.02 0.30 0.48 -0.91 0.50 -1.00 -0.86 -0.70 -0.60 -0.06
Nepal 1 1 0.99 1 1 1 1 1 1 1 1
Sri Lanka 1 1 1 1 1 -0.20 1 1 1 1 1
Annexure 4:Revealed Comparative Advantage
Index of India withFour Countries in Different Seeds
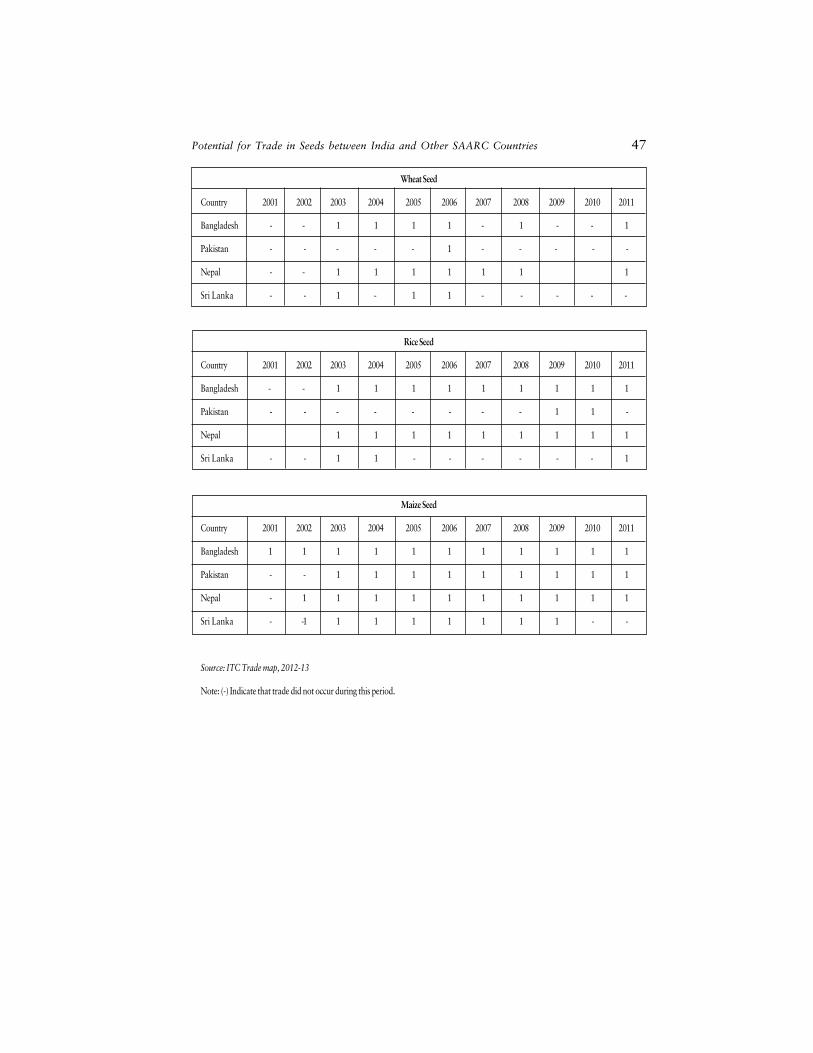
Potential for Trade in Seeds between India and Other SAARC Countries 47
Wheat Seed
Country 2001 2002 2003 2004 2005 2006 2007 2008 2009 2010 2011
Bangladesh - - 1 1 1 1 - 1 - - 1
Pakistan - - - - - 1 - - - - -
Nepal - - 1 1 1 1 1 1 1
Sri Lanka - - 1 - 1 1 - - - - -
Rice Seed
Country 2001 2002 2003 2004 2005 2006 2007 2008 2009 2010 2011
Bangladesh - - 1 1 1 1 1 1 1 1 1
Pakistan - - - - - - - - 1 1 -
Nepal 1 1 1 1 1 1 1 1 1
Sri Lanka - - 1 1 - - - - - - 1
Maize Seed
Country 2001 2002 2003 2004 2005 2006 2007 2008 2009 2010 2011
Bangladesh 1 1 1 1 1 1 1 1 1 1 1
Pakistan - - 1 1 1 1 1 1 1 1 1
Nepal - 1 1 1 1 1 1 1 1 1 1
Sri Lanka - -1 1 1 1 1 1 1 1 - -
Source: ITC Trade map, 2012-13
Note: (-) Indicate that trade did not occur during this period.
Related Documents