Population Increase

Welcome message from author
This document is posted to help you gain knowledge. Please leave a comment to let me know what you think about it! Share it to your friends and learn new things together.
Transcript
Population Increase
World Population Growth
Natural Increase Fertility Mortality
Crude Birth Rate (CBR) The number of live births per 1,000 population in a given year. Not to be confused with the growth rate.
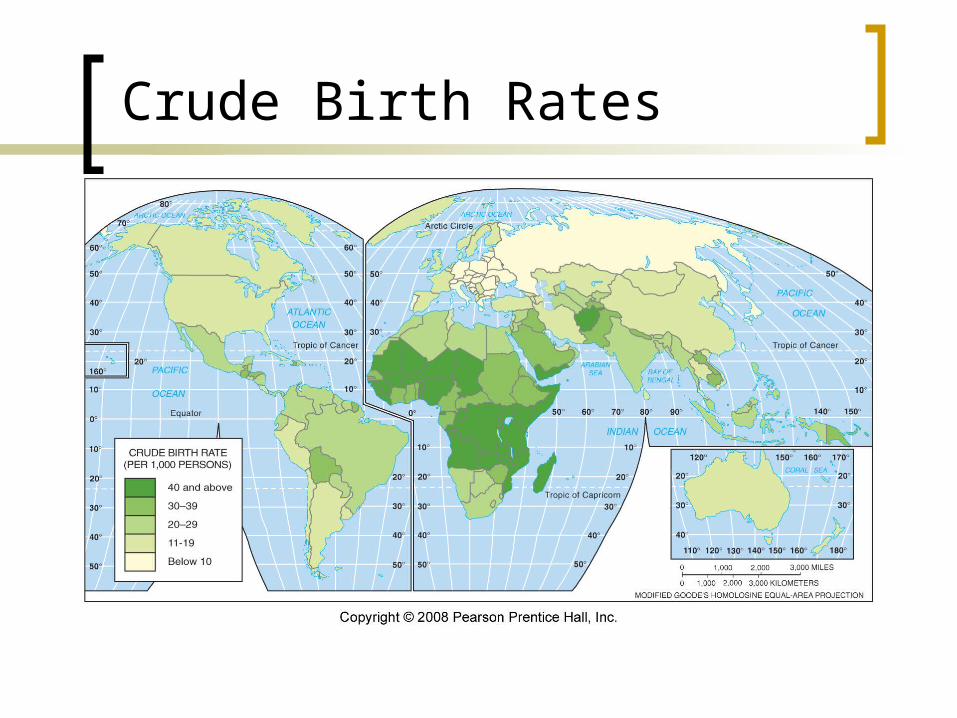
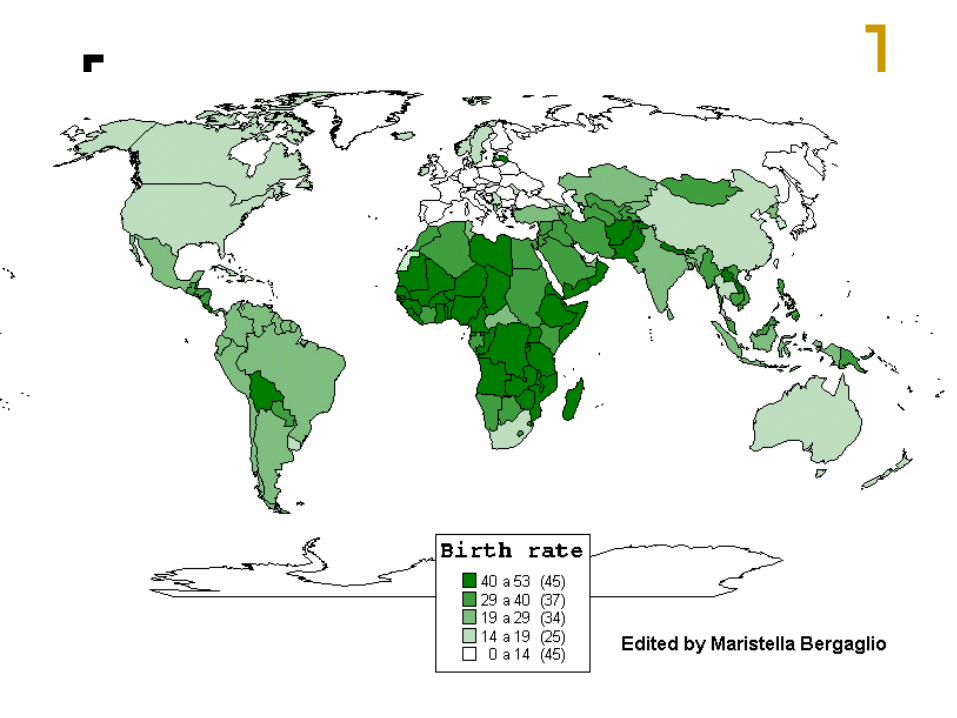
Crude Birth Rates
Fig. 2-8: The crude birth rate (CBR) is the total number of births in a country per 1000 population per year. The lowest rates are in Europe, and the highest rates are in Africa and several Asian countries.
General Fertility Rate The number of live births per 1,000 women ages 15-44 or 15-49 years in a given year.
Total Fertility Rate (TFR) The average number of children that would be born alive to a woman (or group of women) during her lifetime if she were to pass through her childbearing years conforming to the age-specific fertility rates of a given year.
This rate is sometimes stated as the number of children women are having today.
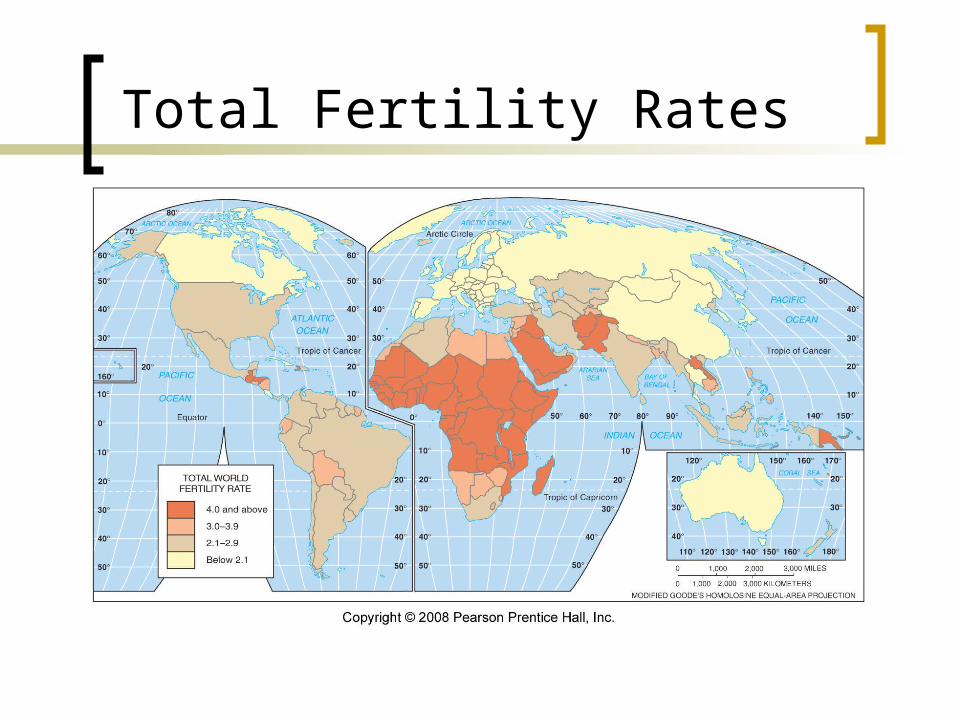
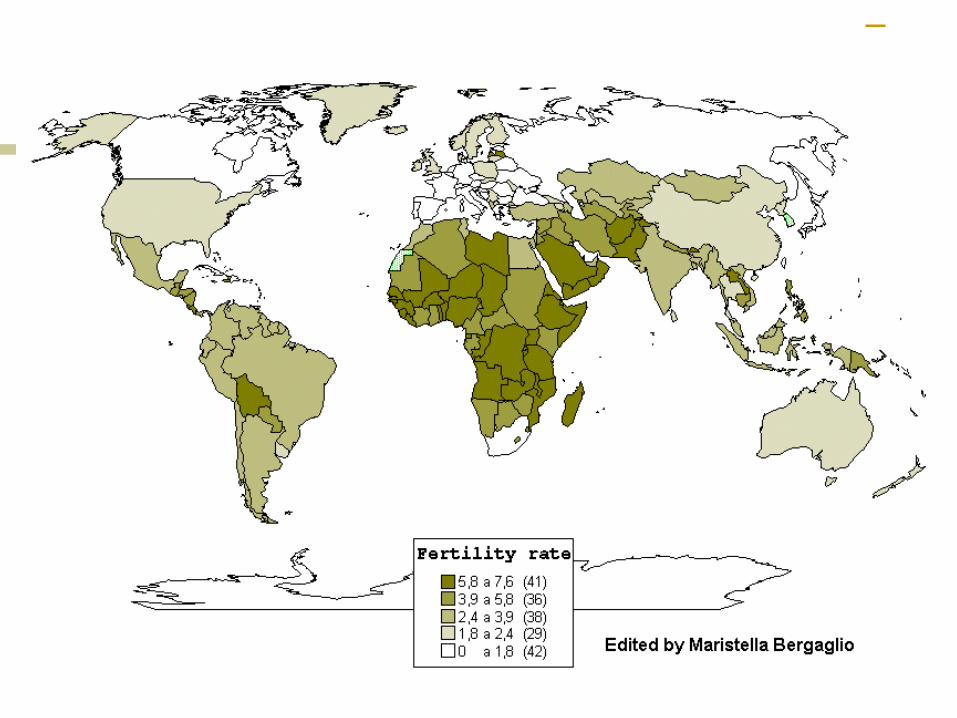
Total Fertility Rates
Fig. 2-9: The Total fertility rate (TFR) is the number of children an average woman in a society will have through her childbearing years. The lowest rates are in Europe, and the highest are in Africa and parts of the Middle East.
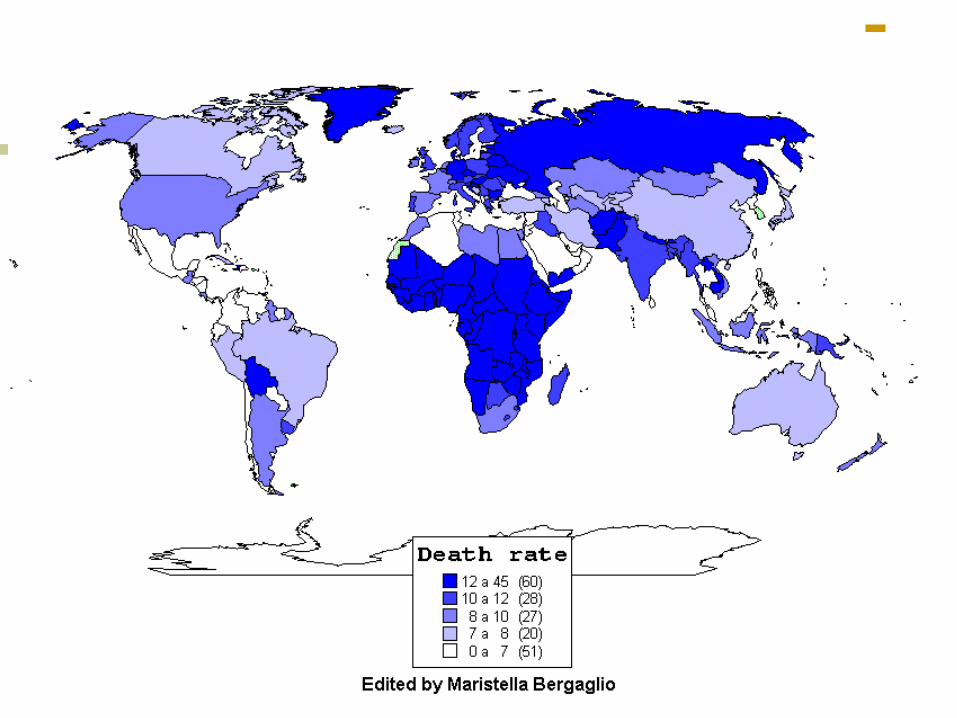
Crude Death Rate (CDR) The number of deaths per 1,000 population in a given year.
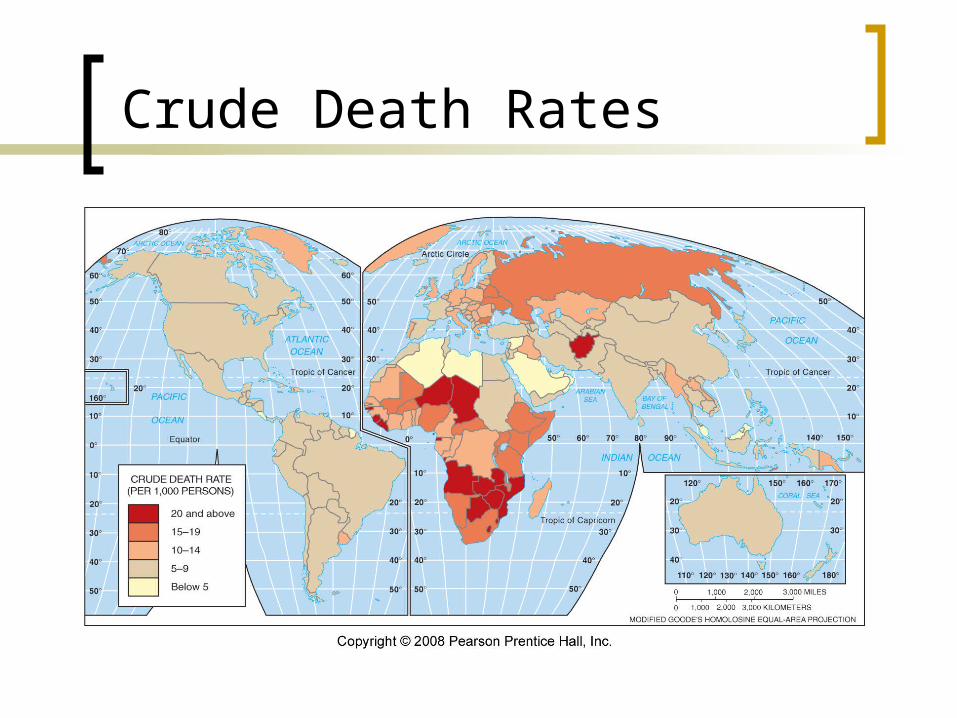
Crude Death Rates
Fig. 2-12: The crude death rate (CDR) is the total number of deaths in a country per 1000 population per year. Because wealthy countries are in a late stage of the Demographic Transition, they often have a higher CDR than poorer countries.
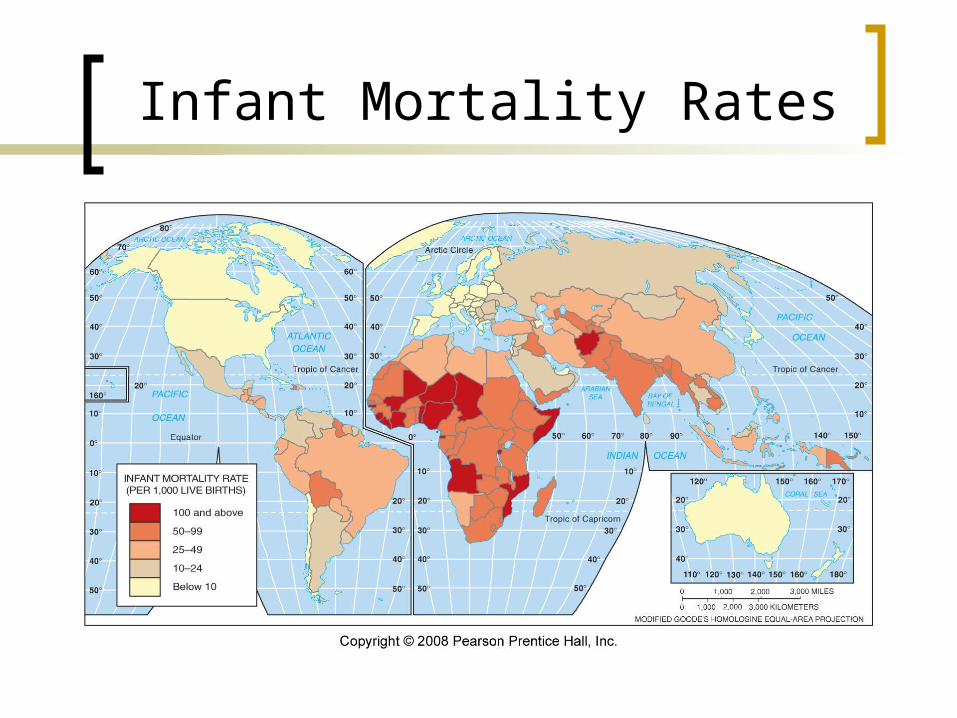
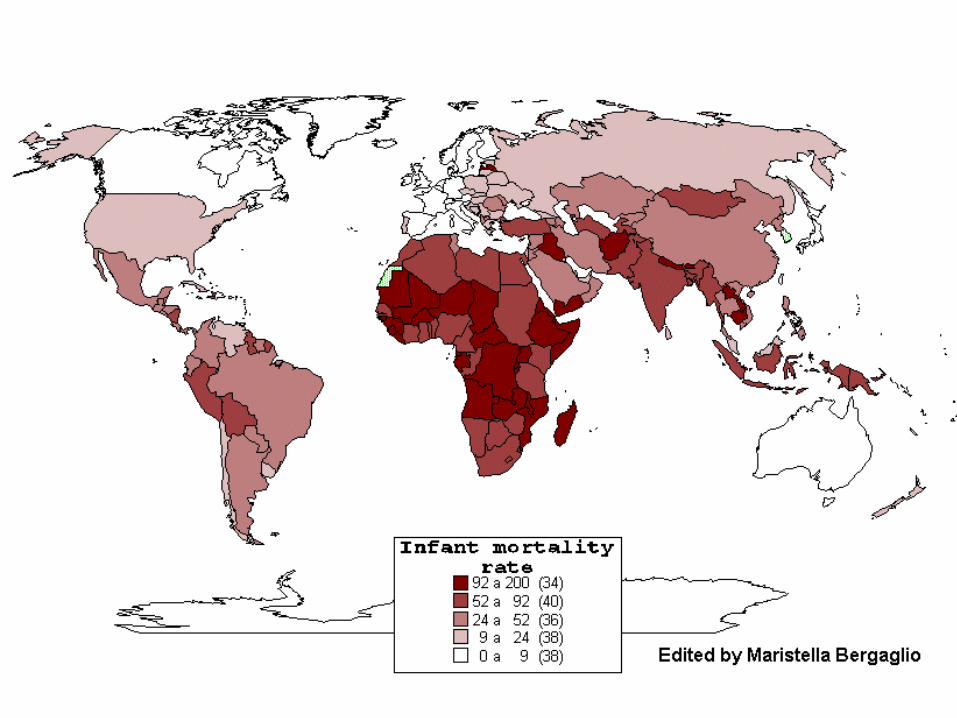
Infant Mortality Rates
Fig. 2-10: The infant mortality rate is the number of infant deaths per 1000 live births per year. The highest infant mortality rates are found in some of the poorest countries of Africa and Asia.
Infant Mortality Rate The number of deaths of infants under age 1 per 1,000 live births in a given year.
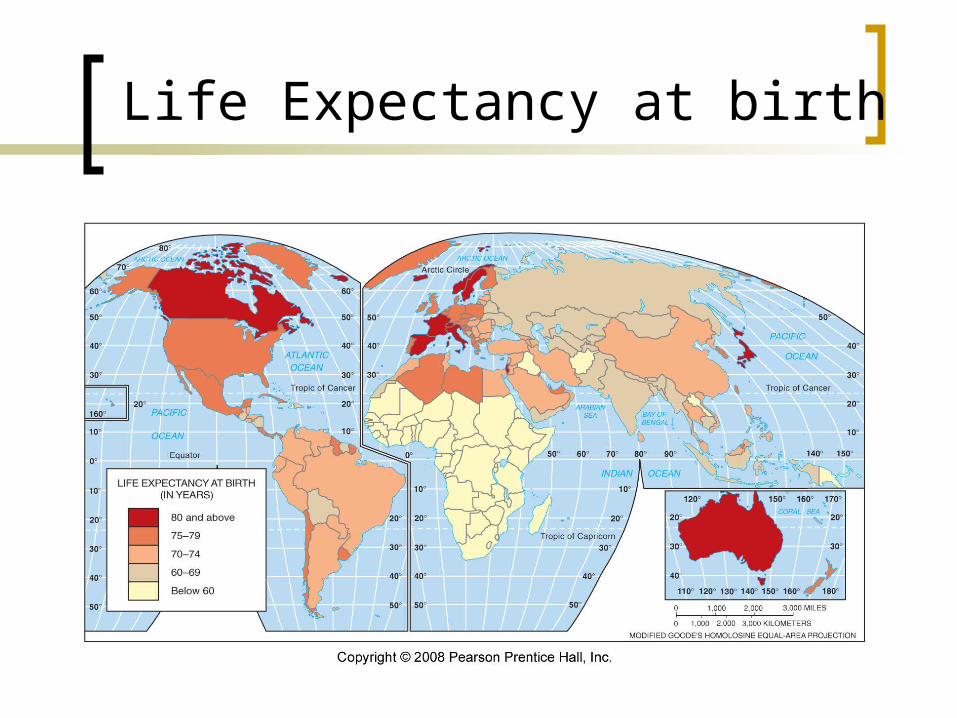
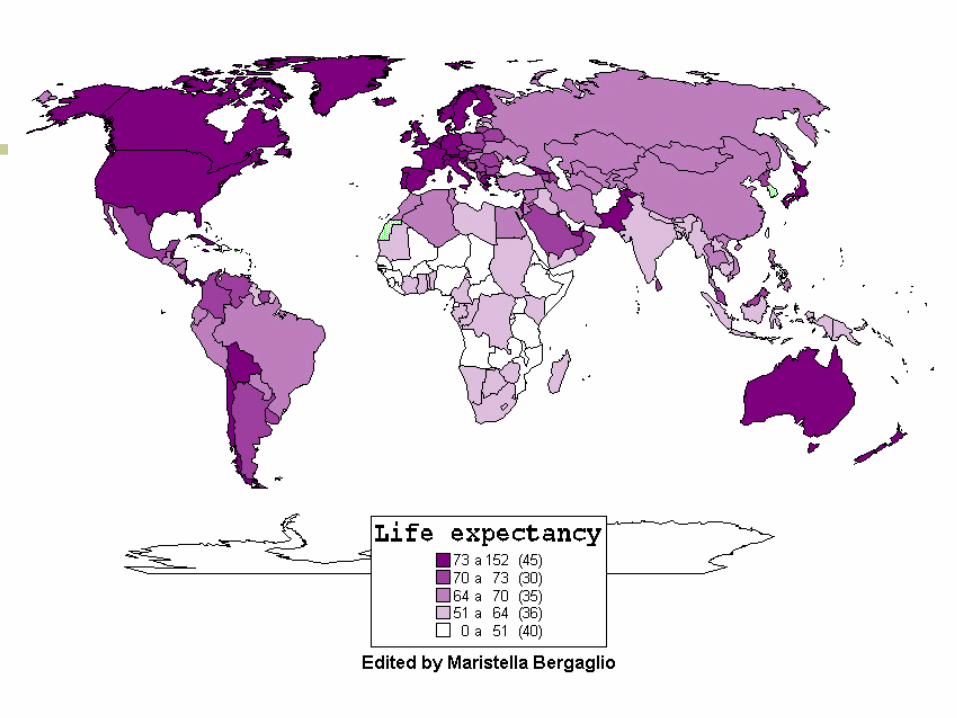
Life Expectancy at birth
Fig. 2-11: Life expectancy at birth is the average number of years a newborn infant can expect to live. The highest life expectancies are generally in the wealthiest countries, and the lowest in the poorest countries.
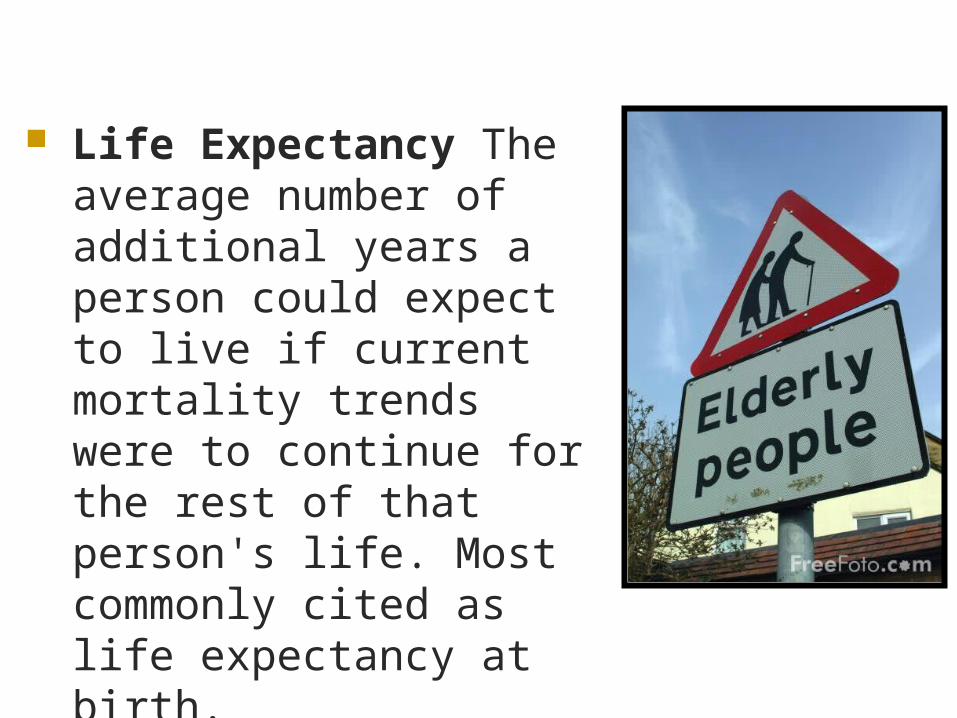
Life Expectancy The average number of additional years a person could expect to live if current mortality trends were to continue for the rest of that person's life. Most commonly cited as life expectancy at birth.
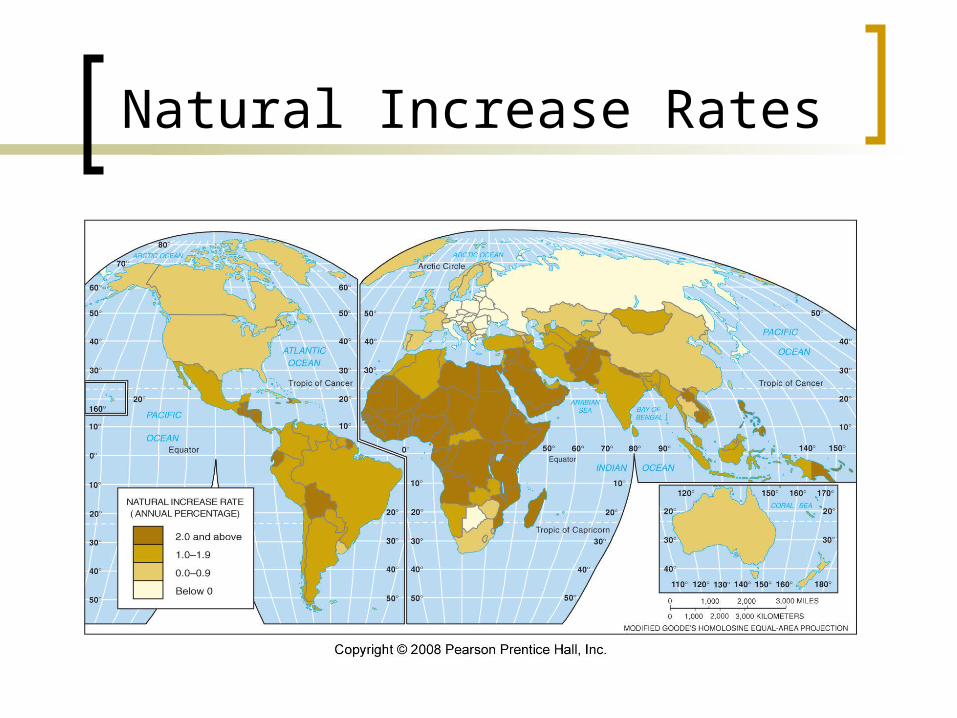
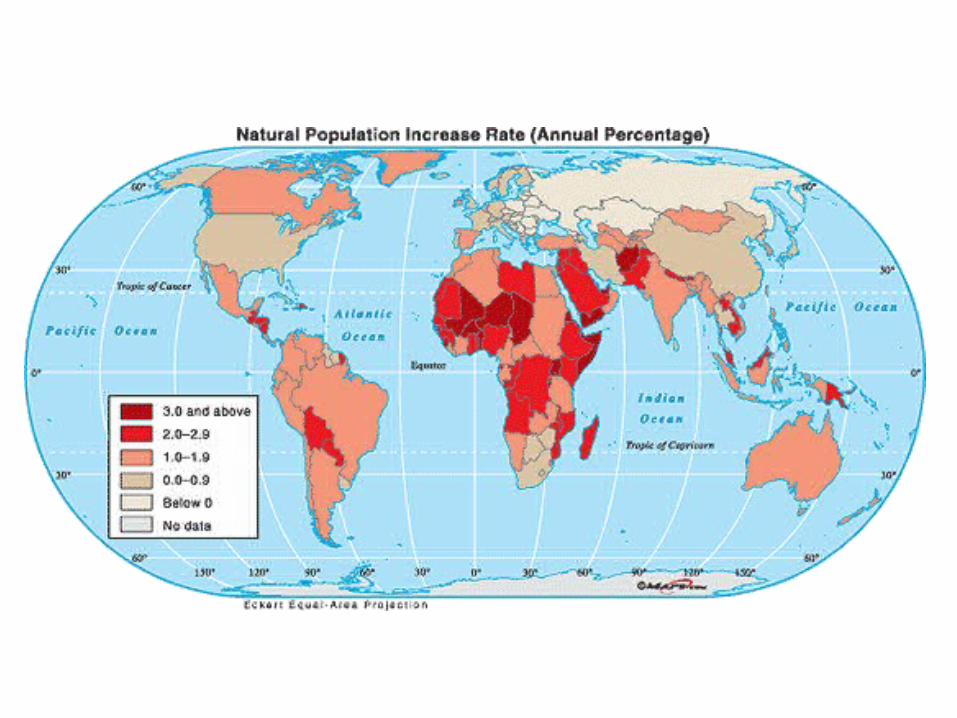
Natural Increase Rates
Fig. 2-7: The natural increase rate (NIR) is the percentage growth or decline in the population of a country per year (not including net migration). Countries in Africa and Southwest Asia have the highest current rates, while Russia and some European countries have negative rates.
Rate of Natural Increase (NIR) The rate at which a population is increasing (or decreasing) in a given year due to a surplus (or deficit) of births over deaths, expressed as a percentage of the base population.
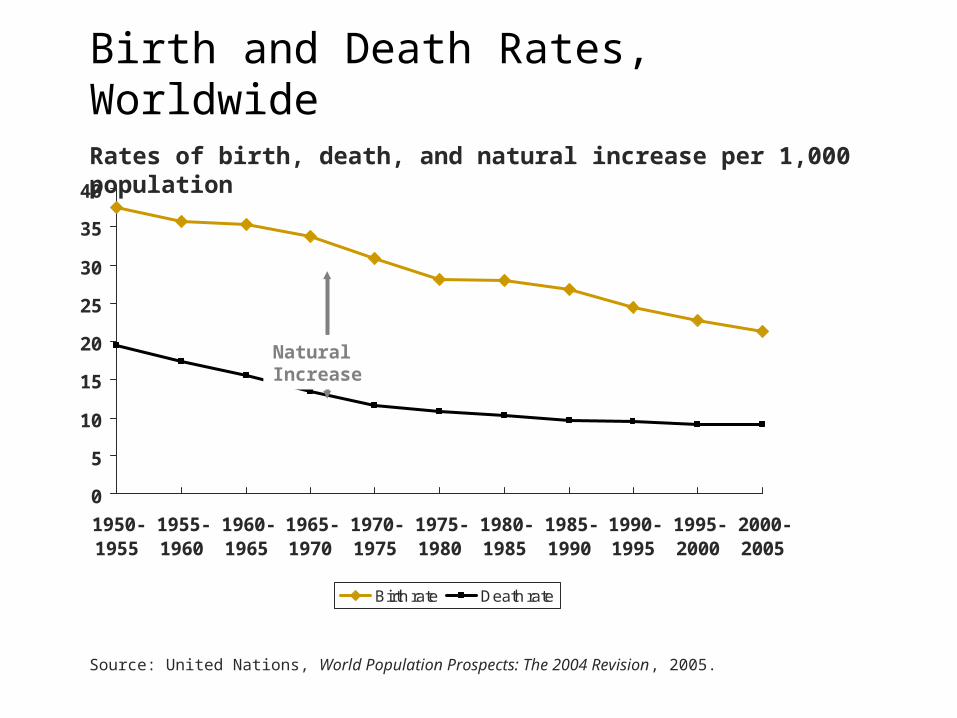
Rates of birth, death, and natural increase per 1,000 population
0
5
10
15
20
25
30
35
40
1950-1955
1955-1960
1960-1965
1965-1970
1970-1975
1975-1980
1980-1985
1985-1990
1990-1995
1995-2000
2000-2005
Birth rate Death rate
Natural Increase
Source: United Nations, World Population Prospects: The 2004 Revision, 2005.
Birth and Death Rates, Worldwide
Growth Rate The number of people added to (or subtracted from) a population in a year due to natural increase and net migration expressed as a percentage of the population at the beginning of the time period.
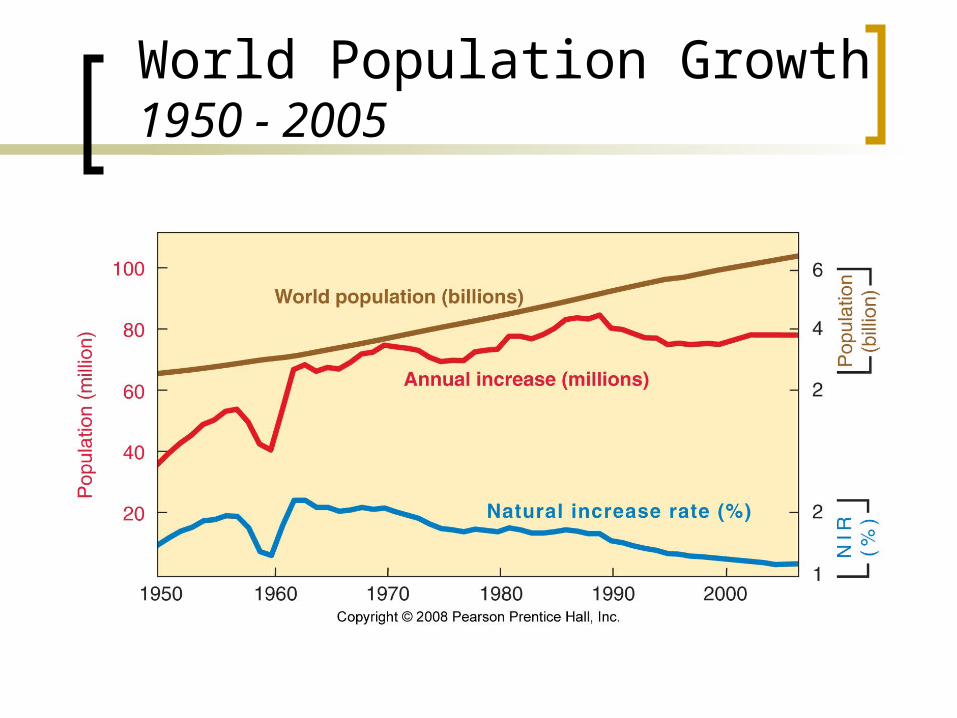
World Population Growth1950 - 2005
Fig. 2-6: Total world population increased from 2.5 to over 6 billion in slightly over 50 years. The natural increase rate peaked in the early 1960s and has declined since, but the number of people added each year did not peak until 1990.

The Lily Pond
Imagine having a pond with water lily pads floating on the surface.
The lily population doubles in size every day and if left unchecked will smother the pond in 30 days, killing all the other living things in the water.
Day after day the plant seems small and so you decide to leave it alone to grow until it half-covers the pond, before cutting it back.
On what day will the pond be half full? (From Meadows
et al. 1972)
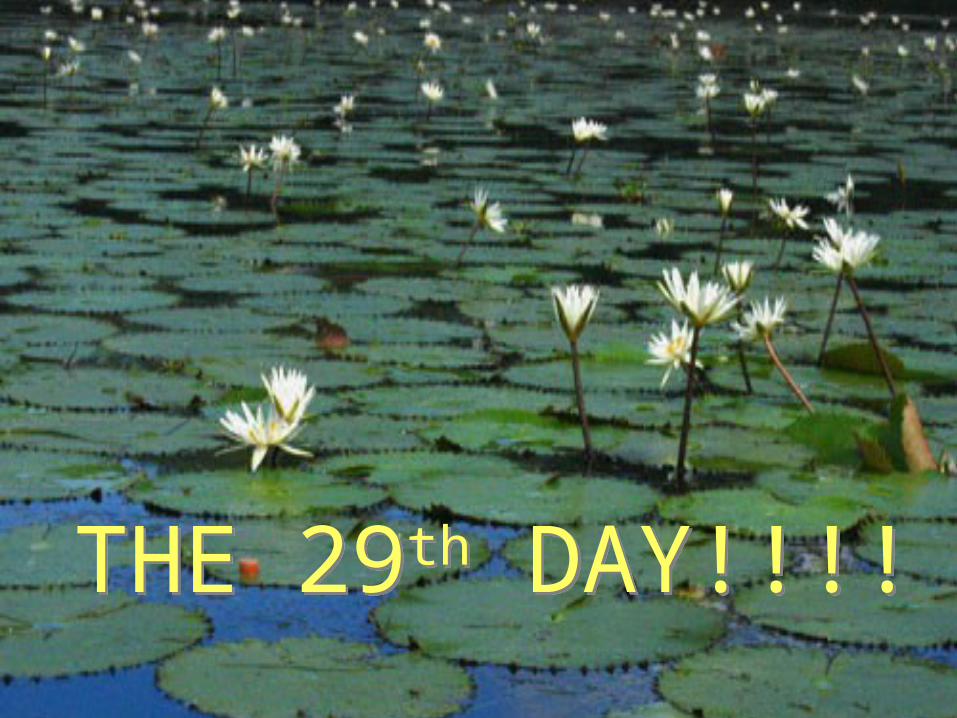
THE 29th DAY!!!!THE 29th DAY!!!!
Related Documents