Planning Global Compensation Budgets for 2018

Welcome message from author
This document is posted to help you gain knowledge. Please leave a comment to let me know what you think about it! Share it to your friends and learn new things together.
Transcript
Planning GlobalCompensation Budgets
for 2018
2 | ERI Economic Research Institute | Planning Global Compensation Budgets for 2018 | May 2017
Planning Global Compensation Budgets for 2018
As we approach 2018 global compensation and financial planning and budgeting, it is timely to provide ERI Economic Research Institute readers with insight into the world economy and its effect on 2018 salary increase budgeting. The International Monetary Fund (IMF) in their April 2017 World Economic Outlook (WEO) identifies important economic and labor trends that affect multi-national organizations:
With buoyant financial markets and a long-awaited cyclical recovery in manufacturing and trade under
way, world growth is projected to rise from 3.1 percent in 2016 to 3.5 percent in 2017 and 3.6 percent
in 2018 . . . Binding structural impediments continue to hold back a stronger recovery and the balance
of risks remains tilted to the downside, especially over the medium term. With persistent structural
problems—such as low productivity growth and high income inequality—pressures for inward-looking
policies are increasing in advanced economies. These threaten global economic integration and the
cooperative global economic order that has served the world economy, especially emerging market and
developing economies, well.1
Important projections from the report follow:• Growth in the United States is expected to increase due to the new Administration’s eased fiscal policy and an uptick
in confidence, also influencing a stronger dollar and higher U.S. Treasury interest rates, influencing yields elsewhere.
• Activity is projected to pick up in emerging markets and developing economies.
• An improved outlook is forecasted for Europe and Japan due to recovery in global manufacturing and trade.
• A decline in growth is expected in several large economies in Latin America and the Middle East, reflecting
ongoing adjustments to oil production, terms of trade, and other factors.
• Growth forecasts have been raised for China, reflecting stronger policy support.
• Increased growth is projected for Russia, where activity and higher oil prices support the recovery.
• Inflation is picking up in advanced economies and many emerging markets. Core inflation remains low in Japan
and parts of the Euro area.
Consider these downside risks associated with the forecasted trends:• An inward shift in policies, including protectionism
• A faster-than-expected pace of interest rates hikes in the United States
• An aggressive rollback of financial regulation
• Financial tightening in emerging market economies
• Weak demand, low inflation, weak balance sheets, and low productivity growth in advanced economies
• Geopolitical tensions, domestic political discord, risks from weak governance and corruption, extreme weather
events, and terrorism and security concerns2
The WEO’s findings indicate wages have not kept up with productivity in many countries over the last 30 years leading to a reduction in labor’s share of the national income. The findings suggest that the increase in technology has been the primary driver of the decline in the labor share in advanced economies, and trade integration has been the primary driver of the decline in emerging markets. The WEO highlights the need to make growth more inclusive.
1,2 International Monetary Fund. 2017. World Economic Outlook: Gaining Momentum? (pp. xv-xvii) Washington, April.
3 | ERI Economic Research Institute | Planning Global Compensation Budgets for 2018 | May 2017
Projected 2018 Salary Increases by Country and Historical Trends
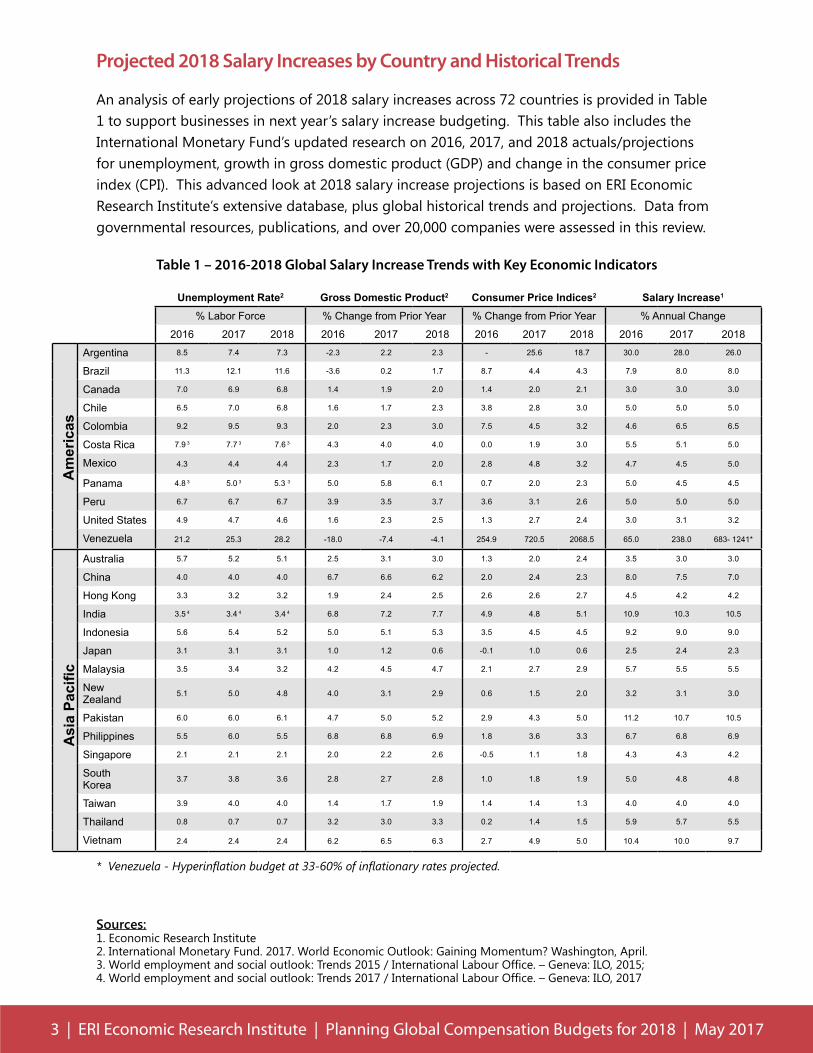
An analysis of early projections of 2018 salary increases across 72 countries is provided in Table 1 to support businesses in next year’s salary increase budgeting. This table also includes the International Monetary Fund’s updated research on 2016, 2017, and 2018 actuals/projections for unemployment, growth in gross domestic product (GDP) and change in the consumer price index (CPI). This advanced look at 2018 salary increase projections is based on ERI Economic Research Institute’s extensive database, plus global historical trends and projections. Data from governmental resources, publications, and over 20,000 companies were assessed in this review.
Table 1 – 2016-2018 Global Salary Increase Trends with Key Economic Indicators
Unemployment Rate2 Gross Domestic Product2 Consumer Price Indices2 Salary Increase1
% Labor Force % Change from Prior Year % Change from Prior Year % Annual Change
2016 2017 2018 2016 2017 2018 2016 2017 2018 2016 2017 2018
Argentina 8.5 7.4 7.3 -2.3 2.2 2.3 - 25.6 18.7 30.0 28.0 26.0
Brazil 11.3 12.1 11.6 -3.6 0.2 1.7 8.7 4.4 4.3 7.9 8.0 8.0
Canada 7.0 6.9 6.8 1.4 1.9 2.0 1.4 2.0 2.1 3.0 3.0 3.0
Chile 6.5 7.0 6.8 1.6 1.7 2.3 3.8 2.8 3.0 5.0 5.0 5.0
Colombia 9.2 9.5 9.3 2.0 2.3 3.0 7.5 4.5 3.2 4.6 6.5 6.5
Costa Rica 7.9 3 7.7 3 7.6 3 4.3 4.0 4.0 0.0 1.9 3.0 5.5 5.1 5.0
Mexico 4.3 4.4 4.4 2.3 1.7 2.0 2.8 4.8 3.2 4.7 4.5 5.0
Panama 4.8 3 5.0 3 5.3 3 5.0 5.8 6.1 0.7 2.0 2.3 5.0 4.5 4.5
Peru 6.7 6.7 6.7 3.9 3.5 3.7 3.6 3.1 2.6 5.0 5.0 5.0
United States 4.9 4.7 4.6 1.6 2.3 2.5 1.3 2.7 2.4 3.0 3.1 3.2
Venezuela 21.2 25.3 28.2 -18.0 -7.4 -4.1 254.9 720.5 2068.5 65.0 238.0 683- 1241*
Australia 5.7 5.2 5.1 2.5 3.1 3.0 1.3 2.0 2.4 3.5 3.0 3.0
China 4.0 4.0 4.0 6.7 6.6 6.2 2.0 2.4 2.3 8.0 7.5 7.0
Hong Kong 3.3 3.2 3.2 1.9 2.4 2.5 2.6 2.6 2.7 4.5 4.2 4.2
India 3.5 4 3.4 4 3.4 4 6.8 7.2 7.7 4.9 4.8 5.1 10.9 10.3 10.5
Indonesia 5.6 5.4 5.2 5.0 5.1 5.3 3.5 4.5 4.5 9.2 9.0 9.0
Japan 3.1 3.1 3.1 1.0 1.2 0.6 -0.1 1.0 0.6 2.5 2.4 2.3
Malaysia 3.5 3.4 3.2 4.2 4.5 4.7 2.1 2.7 2.9 5.7 5.5 5.5
NewZealand 5.1 5.0 4.8 4.0 3.1 2.9 0.6 1.5 2.0 3.2 3.1 3.0
Pakistan 6.0 6.0 6.1 4.7 5.0 5.2 2.9 4.3 5.0 11.2 10.7 10.5
Philippines 5.5 6.0 5.5 6.8 6.8 6.9 1.8 3.6 3.3 6.7 6.8 6.9
Singapore 2.1 2.1 2.1 2.0 2.2 2.6 -0.5 1.1 1.8 4.3 4.3 4.2
SouthKorea 3.7 3.8 3.6 2.8 2.7 2.8 1.0 1.8 1.9 5.0 4.8 4.8
Taiwan 3.9 4.0 4.0 1.4 1.7 1.9 1.4 1.4 1.3 4.0 4.0 4.0
Thailand 0.8 0.7 0.7 3.2 3.0 3.3 0.2 1.4 1.5 5.9 5.7 5.5
Vietnam 2.4 2.4 2.4 6.2 6.5 6.3 2.7 4.9 5.0 10.4 10.0 9.7
* Venezuela - Hyperinflation budget at 33-60% of inflationary rates projected.
Sources:1. Economic Research Institute2. International Monetary Fund. 2017. World Economic Outlook: Gaining Momentum? Washington, April.3. World employment and social outlook: Trends 2015 / International Labour Office. – Geneva: ILO, 2015; 4. World employment and social outlook: Trends 2017 / International Labour Office. – Geneva: ILO, 2017
Am
eric
asA
sia
Paci
fic
4 | ERI Economic Research Institute | Planning Global Compensation Budgets for 2018 | May 2017
Unemployment Rate2 Gross Domestic Product2 Consumer Price Indices2 Salary Increase1
% Labor Force % Change from Prior Year % Change from Prior Year % Annual Change
2016 2017 2018 2016 2017 2018 2016 2017 2018 2016 2017 2018
Algeria 10.5 11.7 13.2 4.2 1.4 0.6 6.4 4.8 4.3 6.5 6.3 6.0
Austria 6.1 5.9 5.9 1.5 1.4 1.3 1.0 2.1 1.8 2.9 2.9 2.7
Belgium 8.0 7.8 7.6 1.2 1.6 1.5 1.8 2.0 1.7 2.5 2.5 2.3
Bulgaria 7.7 7.1 6.9 3.4 2.9 2.7 -1.3 1.0 1.8 4.0 4.0 4.0
Cyprus 12.9 11.3 10.2 2.8 2.5 2.3 -1.2 1.5 1.4 1.7 1.8 2.0
CzechRepublic 4.0 3.8 4.2 2.4 2.8 2.2 0.7 2.3 1.8 2.5 2.6 2.7
Denmark 6.2 5.8 5.8 1.1 1.5 1.7 0.3 0.6 1.1 2.6 2.8 2.6
Egypt 12.7 12.6 11.8 4.3 3.5 4.5 10.2 22.0 16.9 10.0 11.0 11.0
Estonia 6.9 8.3 8.9 1.6 2.5 2.8 0.8 3.2 2.5 3.0 2.5 3.2
Finland 8.8 8.5 8.3 1.4 1.3 1.4 0.4 1.4 1.6 2.3 2.2 2.2
France 10.0 9.6 9.3 1.2 1.4 1.6 0.3 1.4 1.2 2.7 2.6 2.5
Germany 4.2 4.2 4.2 1.8 1.6 1.5 0.4 2.0 1.7 3.0 3.0 3.0
Greece 23.8 21.9 21.0 0.0 2.2 2.7 0.0 1.3 1.4 1.8 2.1 2.1
Hungary 4.9 4.4 4.3 2.0 2.9 3.0 0.4 2.5 3.3 3.5 3.2 3.4
Ireland 7.9 6.5 6.3 5.2 3.5 3.2 -0.2 0.9 1.5 2.1 2.4 2.5
Israel 4.8 4.8 4.8 4.0 2.9 3.0 -0.5 0.7 1.4 3.0 3.0 3.0
Italy 11.7 11.4 11.0 0.9 0.8 0.8 -0.1 1.3 1.3 2.6 2.7 2.7
Jordan 11.1 3 11.0 3 11.0 3 2.1 2.3 2.5 -0.8 2.3 2.5 5.7 5.7 5.6
Kazakhstan 5.0 5.0 5.0 1.1 2.5 3.4 14.6 8.0 7.2 8.5 8.1 8.4
Kenya 9.1 3 9.1 3 9.1 3 6.0 5.3 5.8 6.3 6.5 5.2 7.9 7.5 7.5
Kuwait 2.1 2.1 2.1 2.5 -0.2 3.5 3.2 4.2 3.6 4.4 4.8 5.0
Latvia 9.6 9.4 9.2 2.0 3.0 3.3 0.1 2.8 2.5 3.3 3.3 3.5
Lebanon 6.8 3 6.9 3 6.9 3 1.0 2.0 2.5 -0.8 2.6 2.0 - 5.5 5.5
Lithuania 7.9 7.4 7.2 2.3 2.8 3.1 0.7 2.8 2.0 3.5 3.6 3.6
Luxembourg 6.4 5.9 5.7 4.0 3.7 3.5 0.1 1.4 1.3 2.9 3.0 2.8
Morocco 9.4 9.3 9.5 1.5 4.4 3.9 1.6 1.2 1.5 4.5 4.1 4.1
Netherlands 5.9 5.4 5.3 2.1 2.1 1.8 0.1 0.9 1.4 2.8 2.9 2.8
Norway 4.8 4.5 4.2 1.0 1.2 1.9 3.6 2.6 2.5 3.0 3.0 3.0
Poland 6.1 5.5 5.3 2.8 3.4 3.2 -0.6 2.3 2.3 3.0 2.7 3.0
Portugal 11.1 10.6 10.1 1.4 1.7 1.5 0.6 1.2 1.4 2.0 2.2 2.2
Qatar 0.4 3 0.4 3 0.4 3 2.7 3.4 2.8 2.7 2.6 5.7 4.4 4.8 5.0
Romania 6.0 5.4 5.2 4.8 4.2 3.4 -1.6 1.3 3.1 4.5 4.7 4.6
Russia 5.5 5.5 5.5 -0.2 1.4 1.4 7.0 4.5 4.2 8.0 8.0 8.0
Saudi Arabia 5.7 5.3 4 5.3 4 1.4 0.4 1.3 3.5 3.8 5.1 4.7 4.9 5.0
Slovakia 9.7 7.9 7.4 3.3 3.3 3.7 -0.5 1.2 1.5 2.7 2.8 2.8
South Africa 26.7 27.4 27.7 0.3 0.8 1.6 6.3 6.2 5.5 6.8 6.7 6.8
Spain 19.6 17.7 16.6 3.2 2.6 2.1 -0.2 2.4 1.4 2.3 2.4 2.5
Sweden 7.0 6.7 6.7 3.3 2.7 2.4 1.1 1.4 1.6 2.8 2.9 2.9
Switzerland 3.3 3.0 2.9 1.3 1.4 1.6 -0.4 0.4 0.7 2.0 2.2 2.2
Tanzania 3.2 3 3.2 3 3.3 3 6.6 6.8 6.9 5.2 5.1 5.0 7.0 7.0 7.0
Tunisia 14.0 13.0 12.0 1.0 2.5 3.1 3.7 3.9 3.8 6.5 6.5 6.5
Turkey 10.8 11.5 11.0 2.9 2.5 3.3 7.8 10.1 9.1 8.0 8.0 9.2
Uganda 3.5 3 3.4 3 3.3 3 4.7 5.0 5.8 5.5 6.3 6.0 6.8 6.5 7.1
Ukraine 8.8 9.0 8.7 2.3 2.0 3.2 13.9 11.5 9.5 11.7 12.3 11.6
United Arab Emirates 3.4 3 3.3 3 3.3 3 2.7 1.5 4.4 1.8 2.8 3.7 4.5 4.8 4.8
UnitedKingdom 4.9 4.9 5.1 1.8 2.0 1.5 0.6 2.5 2.6 2.8 3.0 3.0
EMEA
(Eur
ope,
Mid
dle
East
, and
Afr
ica)
5 | ERI Economic Research Institute | Planning Global Compensation Budgets for 2018 | May 2017
Key Observations
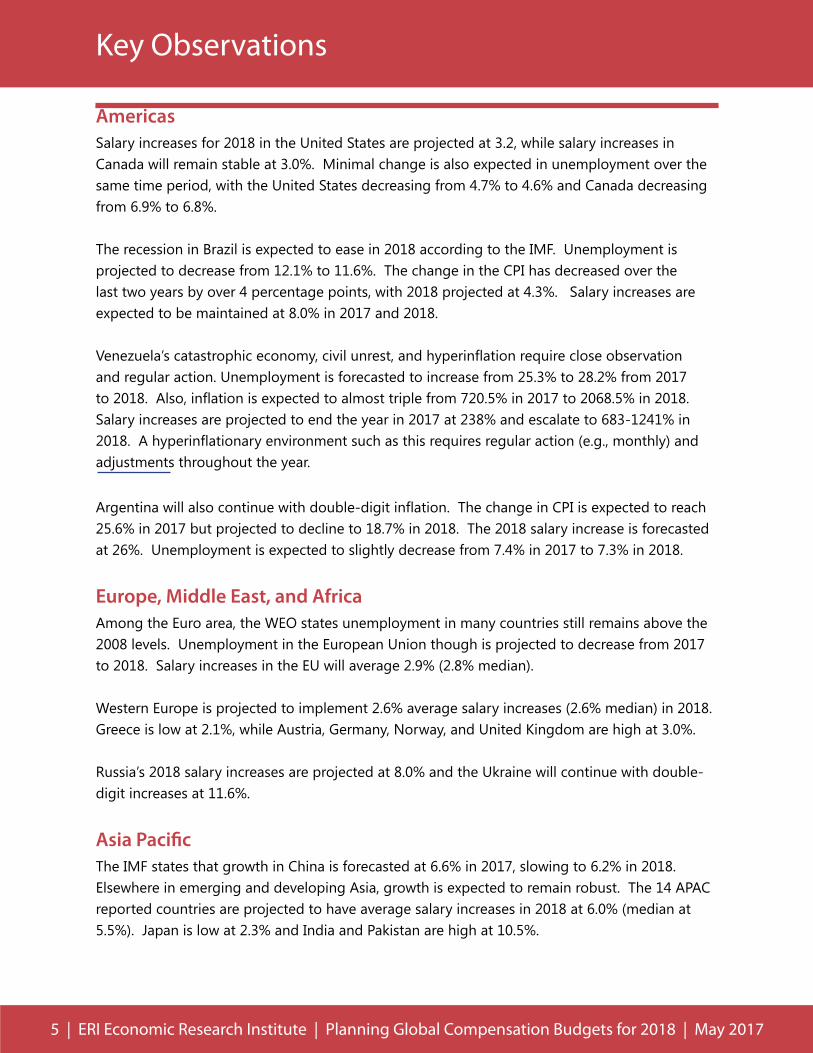
AmericasSalary increases for 2018 in the United States are projected at 3.2, while salary increases in Canada will remain stable at 3.0%. Minimal change is also expected in unemployment over the same time period, with the United States decreasing from 4.7% to 4.6% and Canada decreasing from 6.9% to 6.8%.
The recession in Brazil is expected to ease in 2018 according to the IMF. Unemployment is projected to decrease from 12.1% to 11.6%. The change in the CPI has decreased over the last two years by over 4 percentage points, with 2018 projected at 4.3%. Salary increases are expected to be maintained at 8.0% in 2017 and 2018.
Venezuela’s catastrophic economy, civil unrest, and hyperinflation require close observation and regular action. Unemployment is forecasted to increase from 25.3% to 28.2% from 2017 to 2018. Also, inflation is expected to almost triple from 720.5% in 2017 to 2068.5% in 2018. Salary increases are projected to end the year in 2017 at 238% and escalate to 683-1241% in 2018. A hyperinflationary environment such as this requires regular action (e.g., monthly) and adjustments throughout the year.
Argentina will also continue with double-digit inflation. The change in CPI is expected to reach 25.6% in 2017 but projected to decline to 18.7% in 2018. The 2018 salary increase is forecasted at 26%. Unemployment is expected to slightly decrease from 7.4% in 2017 to 7.3% in 2018.
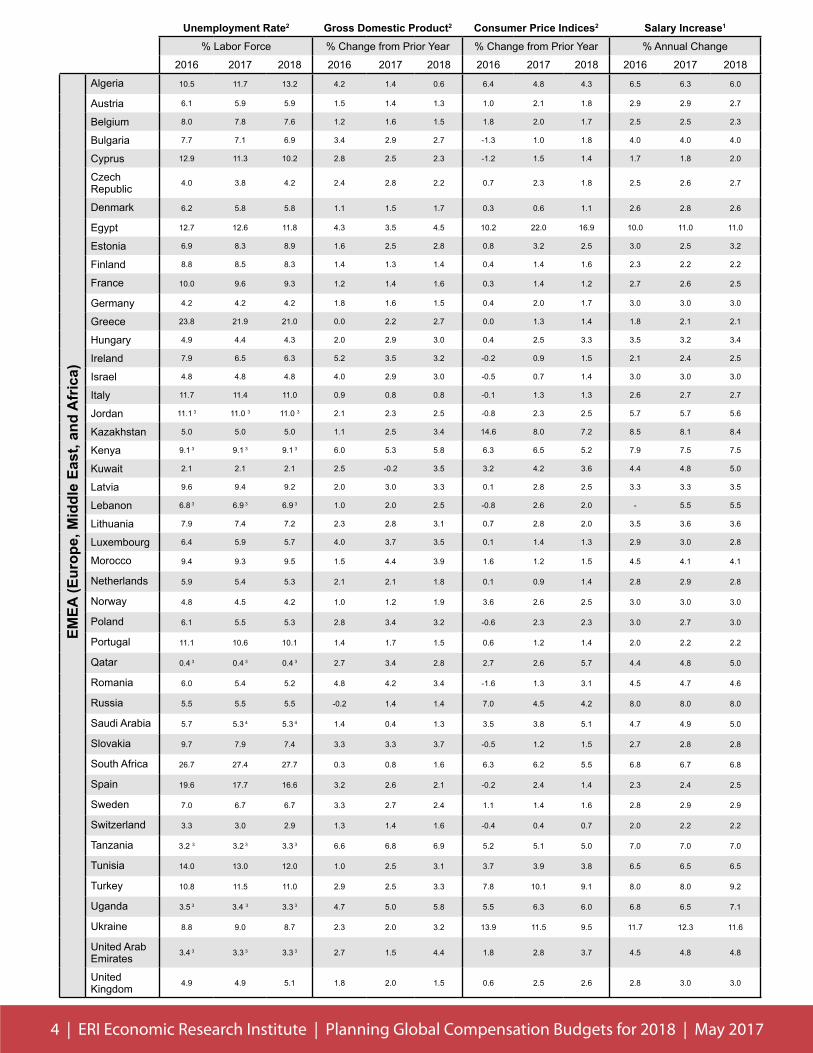
Europe, Middle East, and AfricaAmong the Euro area, the WEO states unemployment in many countries still remains above the 2008 levels. Unemployment in the European Union though is projected to decrease from 2017 to 2018. Salary increases in the EU will average 2.9% (2.8% median).
Western Europe is projected to implement 2.6% average salary increases (2.6% median) in 2018. Greece is low at 2.1%, while Austria, Germany, Norway, and United Kingdom are high at 3.0%.
Russia’s 2018 salary increases are projected at 8.0% and the Ukraine will continue with double-digit increases at 11.6%.
Asia PacificThe IMF states that growth in China is forecasted at 6.6% in 2017, slowing to 6.2% in 2018. Elsewhere in emerging and developing Asia, growth is expected to remain robust. The 14 APAC reported countries are projected to have average salary increases in 2018 at 6.0% (median at 5.5%). Japan is low at 2.3% and India and Pakistan are high at 10.5%.
This report was prepared by Linda L. Cox, CCP, with research assistance from Katie Sebastian.
Please email Linda Cox, CCP, at [email protected] with questions or comments.
Planning Global Compensation Budgets for 2018
ERI Economic Research Institute111 Academy Drive
Suite 270Irvine, CA 92617
800.627.3697
www.erieri.com
The 2018 projections indicate salary increase budgets throughout the majority of the world between 2% and 5%. High inflationary countries, such as Venezuela and Argentina require close observation and action, as needed, to ensure up-to-date compensation programs. The loss of real income for Venezuela employees is a catastrophic issue for businesses and their national economy alike.
The WEO states, “The global economy seems to be gaining momentum—we could be at a turning point. But even as things look up, the post-World War II system of international economic relations is under severe strain despite the aggregate benefits it has delivered—and precisely because growth and the resulting economic adjustments have too often entailed unequal rewards and costs within countries.”3
The guidance of the IMF in Chapter 3 of the WEO “Understanding the Downward Trend in Labor Income Shares” provides us with an opportunity to look at our Total Rewards strategies and practices to ensure fair and equitable distribution of rewards between all levels of employees. Are we appropriately distributing income based on performance for all employee groups throughout our businesses at base pay, total cash compensation, total direct compensation, and even taxable income? Are we adequately preparing our workforce for reeducation and relocation as globalization, technological advances, and artificial intelligence displace jobs? A break though in technology fundamentally changing the way people work also requires an investment in Human Capital to prepare employees for the future. Whose responsibility is this: the employee, the government, or the business? Perhaps we can all take responsibility.
In this important, transitional environment, Human Capital and Total Rewards management in the United States and globally have an opportunity to influence and guide our organizations today to ensure a better workplace for tomorrow.
Simplify salary planning with ERI’s compensation analytics software
Learn More →3 International Monetary Fund. 2017. World Economic Outlook: Gaining Momentum? (pp. xv-xvii) Washington, April.
6 | ERI Economic Research Institute | Planning Global Compensation Budgets for 2018 | May 2017
Summary
Related Documents