Performance Audit Pima Association of Governments- Regional Transportation Authority Plan April 2017 Submitted To: Debra Davenport, Auditor General Office of the Auditor General 2910 N. 44 th Street, Suite 410 Phoenix, AZ 85018 Submitted By: 455 Capitol Mall•Suite 700•Sacramento, California•95814•Tel 916.443.1300•www.secteam.com

Welcome message from author
This document is posted to help you gain knowledge. Please leave a comment to let me know what you think about it! Share it to your friends and learn new things together.
Transcript
Performance Audit
Pima Association of Governments- Regional Transportation Authority Plan
April 2017
Submitted To: Debra Davenport, Auditor General
Office of the Auditor General
2910 N. 44th Street, Suite 410
Phoenix, AZ 85018
Submitted By:
455 Capitol Mall•Suite 700•Sacramento, California•95814•Tel 916.443.1300•www.secteam.com

[THIS PAGE LEFT BLANK FOR REPRODUCTION PURPOSES]
2910 NORTH 44th STREET • SUITE 410 • PHOENIX, ARIZONA 85018 • (602) 553-0333 • FAX (602) 553-0051
April 20, 2017
Members of the Arizona Legislature
The Honorable Doug Ducey, Governor
Transmitted herewith is a report, A Performance Audit of the Pima Association of Governments—Regional Transportation Authority Plan. The independent firm Sjoberg Evashenk Consulting conducted this audit under contract with the Auditor General in response to the requirements of Arizona Revised Statutes §41-1279.03.
As outlined in their responses, the Pima Association of Governments (PAG), the Regional Transportation Authority (RTA), and the City of Tucson Department of Transportation agree with and plan to implement all the recommendations directed to them.
Sincerely,
Debbie Davenport Auditor General
cc: Farhad Moghimi, Executive Director, PAG/RTA Daryl Cole, Director, City of Tucson, Department of Transportation Pima Association of Governments Regional Council Members Regional Transportation Authority Board Members
Attachment
[THIS PAGE LEFT BLANK FOR REPRODUCTION PURPOSES]

SJOBERGEVASHENK i PAG RTA Plan Audit - 2017
Table of Contents
Table of Contents.......................................................................................................i
Executive Summary ................................................................................................... 1
Introduction & Background ........................................................................................ 5
Scope & Methodology .............................................................................................. 11
Chapter 1: Framework Is Sound and Will Help Accomplish RTA Plan as Promised ....... 13
Chapter 2: RTA Partners are Delivering Projects as Envisioned ................................... 21
Chapter 3: RTA Plan Partners Should Be Able to Complete Remaining Projects ........... 35
Chapter 4: Performance on Roadways Revealed Mixed Results .................................. 43
Chapter 5: Transit Services Generally Met Targets and Outperform Peers ................... 55
Chapter 6: Conclusions and Recommendations ......................................................... 77
Appendix A: Detailed Audit Methodology .................................................................. 79
Appendix B: Project Status and Remaining Budget as of June 30, 2016 ...................... 85
Appendix C: Project Budget-to-Actual Performance as of June 30, 2016 ..................... 89
Appendix D: Roadway Projects Schedule-to-Actual Start............................................ 93
Appendix E: Survey Summary Responses by Local Jurisdiction ................................... 95
Appendix F: Crosswalk Between Proposal Tasks and Audit Results ........................... 101
Responses to Audit Recommendations ................................................................... 103

SJOBERGEVASHENK ii PAG RTA Plan Audit - 2017
[THIS PAGE LEFT BLANK FOR REPRODUCTION PURPOSES]
SJOBERGEVASHENK 1 PAG RTA Plan Audit - 2017
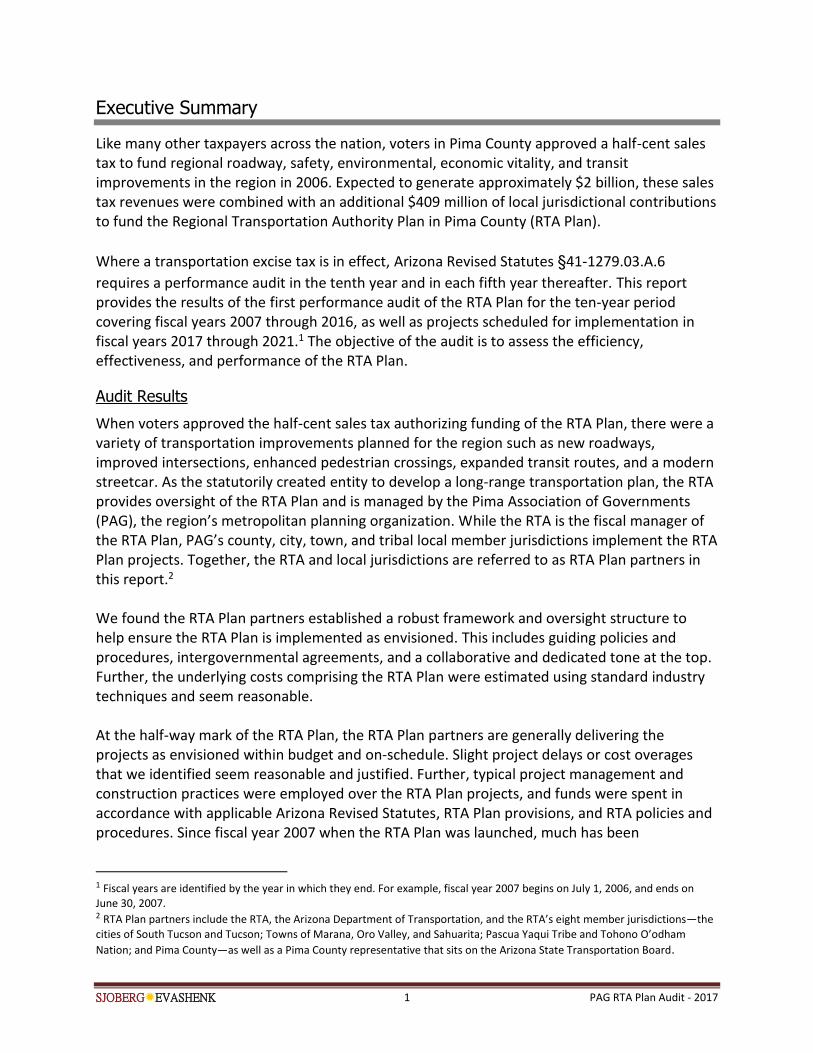
Executive Summary
Like many other taxpayers across the nation, voters in Pima County approved a half-cent sales tax to fund regional roadway, safety, environmental, economic vitality, and transit improvements in the region in 2006. Expected to generate approximately $2 billion, these sales tax revenues were combined with an additional $409 million of local jurisdictional contributions to fund the Regional Transportation Authority Plan in Pima County (RTA Plan).
Where a transportation excise tax is in effect, Arizona Revised Statutes §41-1279.03.A.6
requires a performance audit in the tenth year and in each fifth year thereafter. This report provides the results of the first performance audit of the RTA Plan for the ten-year period covering fiscal years 2007 through 2016, as well as projects scheduled for implementation in fiscal years 2017 through 2021.1 The objective of the audit is to assess the efficiency, effectiveness, and performance of the RTA Plan.
Audit Results
When voters approved the half-cent sales tax authorizing funding of the RTA Plan, there were a variety of transportation improvements planned for the region such as new roadways, improved intersections, enhanced pedestrian crossings, expanded transit routes, and a modern streetcar. As the statutorily created entity to develop a long-range transportation plan, the RTA provides oversight of the RTA Plan and is managed by the Pima Association of Governments (PAG), the region’s metropolitan planning organization. While the RTA is the fiscal manager of the RTA Plan, PAG’s county, city, town, and tribal local member jurisdictions implement the RTA Plan projects. Together, the RTA and local jurisdictions are referred to as RTA Plan partners in this report.2 We found the RTA Plan partners established a robust framework and oversight structure to help ensure the RTA Plan is implemented as envisioned. This includes guiding policies and procedures, intergovernmental agreements, and a collaborative and dedicated tone at the top. Further, the underlying costs comprising the RTA Plan were estimated using standard industry techniques and seem reasonable. At the half-way mark of the RTA Plan, the RTA Plan partners are generally delivering the projects as envisioned within budget and on-schedule. Slight project delays or cost overages that we identified seem reasonable and justified. Further, typical project management and construction practices were employed over the RTA Plan projects, and funds were spent in accordance with applicable Arizona Revised Statutes, RTA Plan provisions, and RTA policies and procedures. Since fiscal year 2007 when the RTA Plan was launched, much has been
1 Fiscal years are identified by the year in which they end. For example, fiscal year 2007 begins on July 1, 2006, and ends on June 30, 2007. 2 RTA Plan partners include the RTA, the Arizona Department of Transportation, and the RTA’s eight member jurisdictions—the
cities of South Tucson and Tucson; Towns of Marana, Oro Valley, and Sahuarita; Pascua Yaqui Tribe and Tohono O’odham
Nation; and Pima County—as well as a Pima County representative that sits on the Arizona State Transportation Board.

SJOBERGEVASHENK 2 PAG RTA Plan Audit - 2017
accomplished including the addition of approximately 80 new roadway lane miles, 270 miles of new bike lanes and paths, 159 miles of new sidewalks, 58 new and enhanced pedestrian crossings, and 109 new bus pullouts, among other improvements. If current practices continue in the future, it is likely that the RTA Plan partners will be able to deliver the remaining projects within the time envisioned by the voters. However, if anticipated revenues fall short of projections or costs significantly increase, then RTA Plan partners have plans in place to redirect other available funding. With revenue realization being a critical aspect of the RTA Plan’s ultimate success, we found that the revenue projection models used by the RTA contain standard elements and assumptions used in the transportation industry. Further, the RTA partners are actively monitoring revenues and cash flow. However, we could not measure performance related to congestion, mobility, and connectivity because the RTA Plan did not establish specific performance targets and did not have baseline data for targets. At the time the RTA Plan was established in 2006, there were no federal requirements mandating performance targets in transportation planning. Recent federal legislation has changed the performance measurement landscape and now requires realistic target-setting. In May 2016, PAG established targets as part of its long-term transportation plan that also incorporates the RTA Plan projects; thus, allowing for future assessments of performance against targets over the next ten-year period of the RTA Plan.3 Yet, our current audit revealed some available historic data with trends indicating mixed results of increased congestion, improved safety, fair pavement condition, and declining bridge health on roadways. Further, we found fixed route bus transit and paratransit services generally met internal performance targets and are performing in-line with peers—although performance and ridership have significantly declined in the last fiscal year similar to national trends.
Audit Recommendations
While the RTA Plan partners are delivering the RTA Plan as promised, we identified a few opportunities to enhance the strong practices in place and make several recommendations that the RTA Plan partners should consider to improve effectiveness and accountability to the taxpayers in Pima County as follows:
1. RTA should encourage lead agency/local jurisdictions responsible for the implementation of RTA Plan projects to consider using internal project delivery performance measures to better measure the efficiency and effectiveness of project management efforts toward meeting goals.
2. RTA should provide a range of expected revenues for the next cycle of RTA Plan revenue projections, instead of only providing one scenario as in the past.
3. PAG could improve practices related to the preparation and reporting of five-year performance assessment reports by releasing the information on a more frequent basis.
3 PAG’s most recent long-term transportation plan is called the 2045 Regional Mobility and Accessibility Plan.
SJOBERGEVASHENK 3 PAG RTA Plan Audit - 2017
4. PAG should capture roadway-related data and analyze performance against recently adopted Regional Mobility and Accessibility Plan targets.
5. PAG should continue to refine performance-based planning and measurement through an iterative approach adjusting measures and targets as needed to better achieve regional goals.
6. RTA and the City of Tucson could standardize reports and regional comprehensive performance reporting for Sun Tran, Sun Link, Sun Van, and Sun Shuttle transit services to make it easier for taxpayers to identify transit performance outcomes.
7. RTA should develop performance targets for the Sun Shuttle neighborhood and dial-a-ride paratransit service for areas such as ridership, service coverage and frequency, and total expenses and revenues in addition to system reliability and passenger safety currently included in operator contracts.

SJOBERGEVASHENK 4 PAG RTA Plan Audit - 2017
[THIS PAGE LEFT BLANK FOR REPRODUCTION PURPOSES]
SJOBERGEVASHENK 5 PAG RTA Plan Audit - 2017
Introduction & Background
In 2006, a county-wide transportation excise tax of a half-cent, levied on state taxable items, was proposed as the primary funding source for the Regional Transportation Authority (RTA) Plan in Pima County. The measure was expected to generate approximately $2 billion in revenue (in 2006 constant dollars) over the 20-year period between fiscal years 2007 and 2026 and combined with approximately $400 million of Pima County’s local jurisdictions’ funds to implement a variety of projects related to roadway, safety, environmental and economic, and transit improvements.
Pima County and the Urbanized Tucson Area
Pima County currently has a population of just over one million and is the second largest county by population in Arizona. Within the county boundary extending over 9,000 square miles, Tucson is the largest city with more than 500,000 residents.4 When compared to eleven peer urban areas using the Texas A&M Transportation Institute’s Urban Mobility Scorecard, the Tucson Urban Area had the highest annual hours of delay per commuter in 2014 and substantial congestion relative to peer urban areas across the nation.5
Relationship Between the RTA and the Pima Association of Governments
Two primary entities are involved with transportation planning in Pima County as it relates to the RTA Plan. Specifically, the Pima Association of Governments (PAG) was established in 1970 as a council of governments and became the region’s federally designated metropolitan planning organization in 1973 to address transportation planning at the regional level. In 1985, enacted legislation permitted the creation of the RTA in Pima County with responsibility to call a countywide special election to approve a transportation excise tax. Two unsuccessful elections took place prior to the expiration of the authority in 1992. In August 2004, the RTA was reestablished by the Arizona Legislature with the purpose of developing a regional transportation plan and acting as the fiscal manager of the transportation plan. In May 2006, Pima County voters approved the RTA Plan and accompanying funding to implement the RTA
Plan. Per Arizona Revised Statutes §48-5302(D), the Executive Director of PAG also serves as
the Executive Director of the RTA with the management of RTA provided by PAG through a memorandum of understanding between the two entities. The RTA is governed by a nine-member board (RTA Board) consisting of elected officials from its eight member jurisdictions—the cities of South Tucson and Tucson; Towns of Marana, Oro Valley, and Sahuarita; Pascua Yaqui Tribe and Tohono O’odham Nation; and Pima County—as well as a Pima County representative that sits on the Arizona State Transportation Board. In addition to the RTA Board, there are many committees and subcommittees dealing with policy and technical issues involved with the RTA Plan.
4 According to the American Community Survey from U.S. Census Bureau and Arizona Office of Economic Opportunity. 5 According to Texas A&M University’s Transportation Institute’s 2015 Urban Mobility Scorecard. Congestion hours of delay is one of multiple metrics used to measure congestion. The Tucson Urban Area was compared to five peer urban areas in Bakersfield, California; Fresno, California; McAllen, Texas; Colorado Springs, Colorado; and Albuquerque, New Mexico.
SJOBERGEVASHENK 6 PAG RTA Plan Audit - 2017
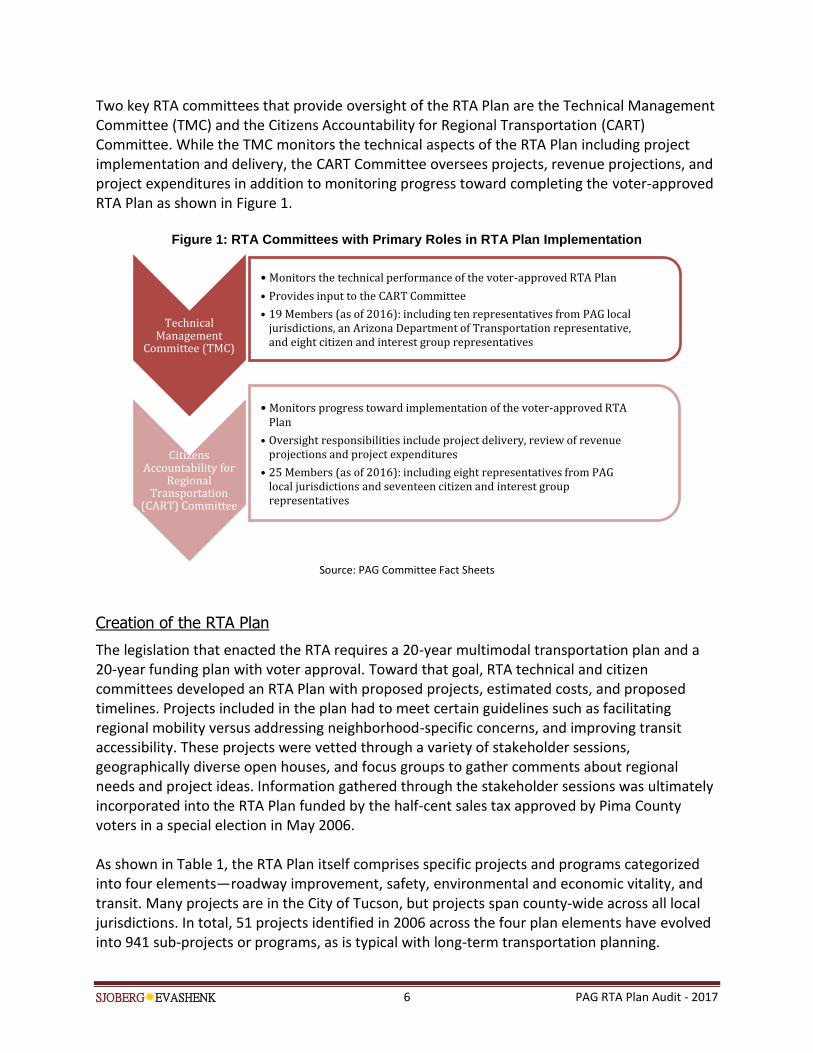
Two key RTA committees that provide oversight of the RTA Plan are the Technical Management Committee (TMC) and the Citizens Accountability for Regional Transportation (CART) Committee. While the TMC monitors the technical aspects of the RTA Plan including project implementation and delivery, the CART Committee oversees projects, revenue projections, and project expenditures in addition to monitoring progress toward completing the voter-approved RTA Plan as shown in Figure 1.
Figure 1: RTA Committees with Primary Roles in RTA Plan Implementation
Source: PAG Committee Fact Sheets
Creation of the RTA Plan
The legislation that enacted the RTA requires a 20-year multimodal transportation plan and a 20-year funding plan with voter approval. Toward that goal, RTA technical and citizen committees developed an RTA Plan with proposed projects, estimated costs, and proposed timelines. Projects included in the plan had to meet certain guidelines such as facilitating regional mobility versus addressing neighborhood-specific concerns, and improving transit accessibility. These projects were vetted through a variety of stakeholder sessions, geographically diverse open houses, and focus groups to gather comments about regional needs and project ideas. Information gathered through the stakeholder sessions was ultimately incorporated into the RTA Plan funded by the half-cent sales tax approved by Pima County voters in a special election in May 2006. As shown in Table 1, the RTA Plan itself comprises specific projects and programs categorized into four elements—roadway improvement, safety, environmental and economic vitality, and transit. Many projects are in the City of Tucson, but projects span county-wide across all local jurisdictions. In total, 51 projects identified in 2006 across the four plan elements have evolved into 941 sub-projects or programs, as is typical with long-term transportation planning.
Technical Management
Committee (TMC)
• Monitors the technical performance of the voter-approved RTA Plan
• Provides input to the CART Committee
• 19 Members (as of 2016): including ten representatives from PAG localjurisdictions, an Arizona Department of Transportation representative,and eight citizen and interest group representatives
Citizens Accountability for
Regional Transportation
(CART) Committee
• Monitors progress toward implementation of the voter-approved RTAPlan
• Oversight responsibilities include project delivery, review of revenueprojections and project expenditures
• 25 Members (as of 2016): including eight representatives from PAGlocal jurisdictions and seventeen citizen and interest grouprepresentatives

SJOBERGEVASHENK 7 PAG RTA Plan Audit - 2017
Table 1: RTA Plan Elements, Projects, and Programs
RTA Plan
Ballot ID
RTA Plan Projects RTA Commitment A
Element I: Roadway Improvement
1 through
35
A variety of street or segment specific projects for the construction of new roadways,
widening of existing roadways, overpasses, underpasses, and bridges, as well as
various associated development features such as intersection improvements,
sidewalks, bike lanes, bus pullouts, and safety upgrades.
$1,168,889,000
Element II: Safety
36 Intersection Safety and Capacity Improvements $100,000,000
37 Elderly and Pedestrian Safety Improvements (including Safe Routes to School) $20,000,000
38 Transit Corridor Bus Pullouts $30,000,000
39 At-grade Railroad Safety/Bridge Deficiencies $15,000,000
40 Signal Technology Upgrades to Improve Intersection Traffic Flow $15,000,000
Subtotal $180,000,000
Element III: Environmental & Economic Vitality
41 Greenways, Pathways, Bikeways, and Sidewalks $60,000,000
42 Transportation-related Critical Wildlife Linkages $45,000,000
43 Small Business Assistance $10,000,000
Subtotal $115,000,000
Element IV: Transit
44 Weekday Evening Bus Service Expansion $37,717,000
45 Weekend Bus Service Expansion $19,169,000
46 Bus Frequency and Area Expansion (including Maintenance Storage Facility) $178,232,000
47 Special Needs Transit for Elderly and Disabled Citizens $108,836,000
48 Neighborhood Circulator Bus Systems $24,859,000
49 Express Service Expansion $62,561,000
50 Downtown/University High-Capacity Transit (Streetcar) $87,727,000
51 Park & Ride Transit Centers $14,700,000
Subtotal $533,801,000
Grand Total $1,997,689,000
Source: 2006 RTA Plan; A = RTA Commitment is the maximum amount of funding through sales-tax revenues committed to each RTA Plan project.
SJOBERGEVASHENK 8 PAG RTA Plan Audit - 2017
The RTA Plan also details extensive policies and procedures over the administration and implementation of the four plan element projects, including requirements for intergovernmental agreements to guide activities and define responsibilities between the RTA Board and the local agency leading an RTA Plan project.
RTA Plan Funding
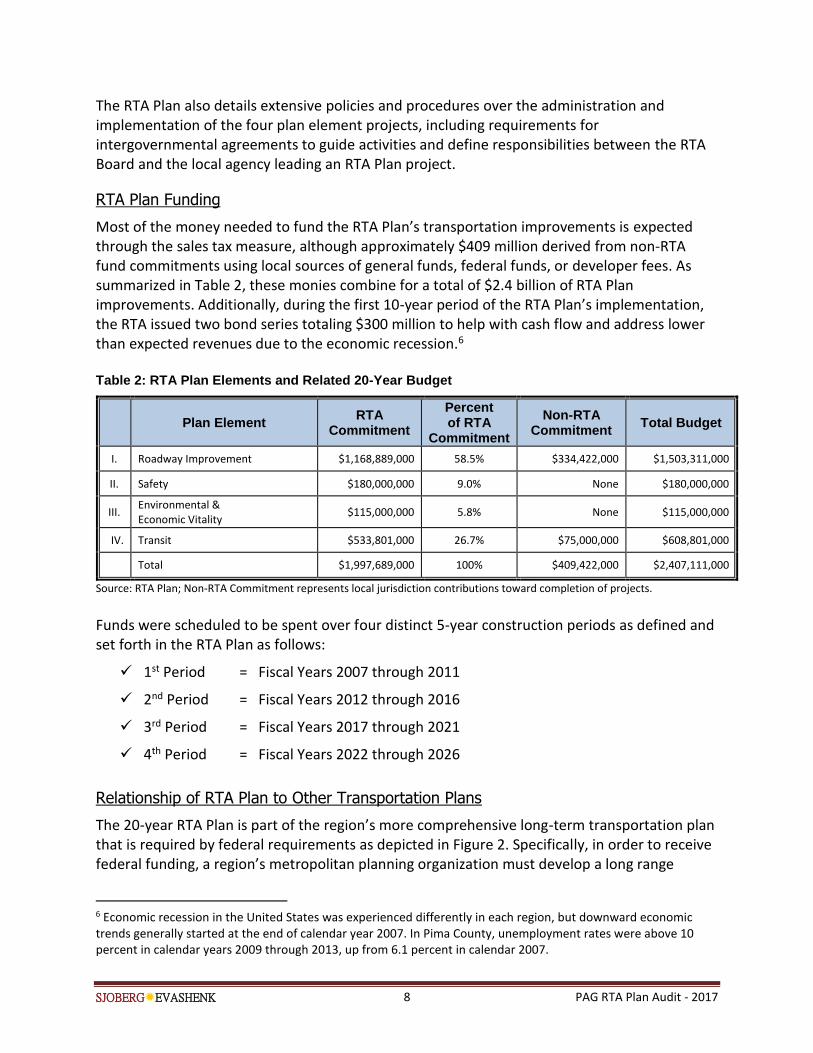
Most of the money needed to fund the RTA Plan’s transportation improvements is expected through the sales tax measure, although approximately $409 million derived from non-RTA fund commitments using local sources of general funds, federal funds, or developer fees. As summarized in Table 2, these monies combine for a total of $2.4 billion of RTA Plan improvements. Additionally, during the first 10-year period of the RTA Plan’s implementation, the RTA issued two bond series totaling $300 million to help with cash flow and address lower than expected revenues due to the economic recession.6 Table 2: RTA Plan Elements and Related 20-Year Budget
Plan Element RTA
Commitment
Percent of RTA
Commitment
Non-RTA Commitment
Total Budget
I. Roadway Improvement $1,168,889,000 58.5% $334,422,000 $1,503,311,000
II. Safety $180,000,000 9.0% None $180,000,000
III. Environmental & Economic Vitality
$115,000,000 5.8% None $115,000,000
IV. Transit $533,801,000 26.7% $75,000,000 $608,801,000
Total $1,997,689,000 100% $409,422,000 $2,407,111,000
Source: RTA Plan; Non-RTA Commitment represents local jurisdiction contributions toward completion of projects.
Funds were scheduled to be spent over four distinct 5-year construction periods as defined and set forth in the RTA Plan as follows:
1st Period = Fiscal Years 2007 through 2011
2nd Period = Fiscal Years 2012 through 2016
3rd Period = Fiscal Years 2017 through 2021
4th Period = Fiscal Years 2022 through 2026
Relationship of RTA Plan to Other Transportation Plans
The 20-year RTA Plan is part of the region’s more comprehensive long-term transportation plan that is required by federal requirements as depicted in Figure 2. Specifically, in order to receive federal funding, a region’s metropolitan planning organization must develop a long range
6 Economic recession in the United States was experienced differently in each region, but downward economic trends generally started at the end of calendar year 2007. In Pima County, unemployment rates were above 10 percent in calendar years 2009 through 2013, up from 6.1 percent in calendar 2007.
SJOBERGEVASHENK 9 PAG RTA Plan Audit - 2017
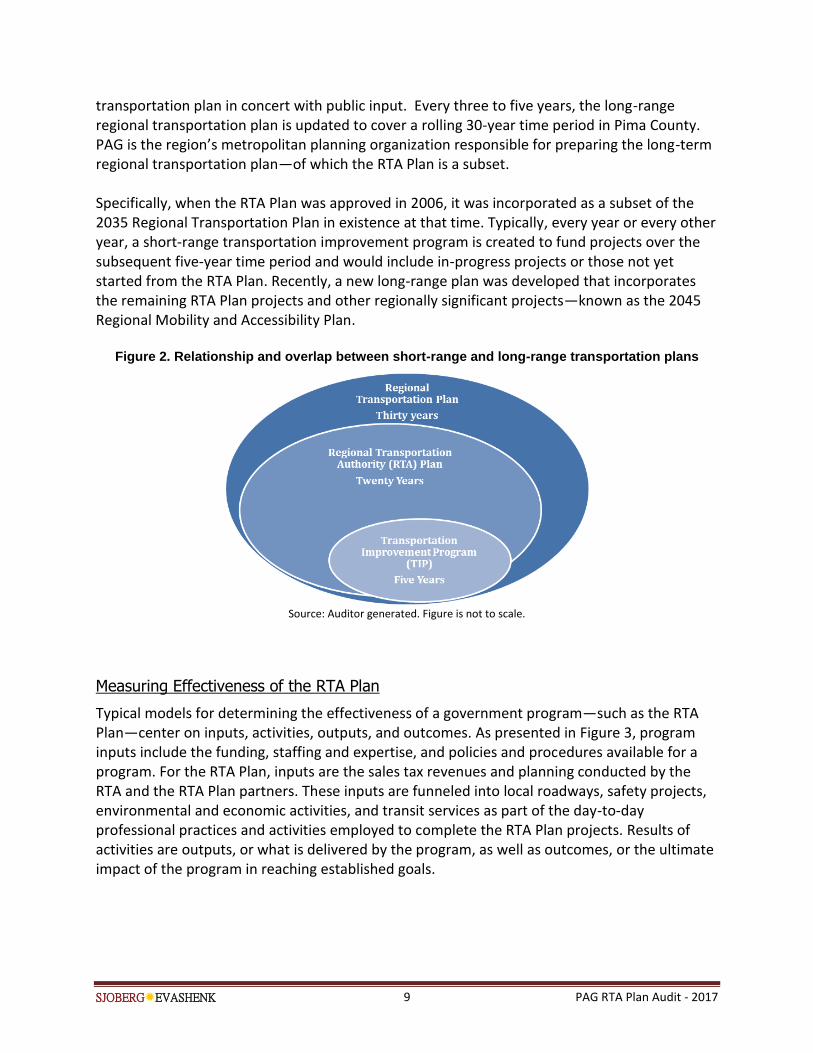
transportation plan in concert with public input. Every three to five years, the long-range regional transportation plan is updated to cover a rolling 30-year time period in Pima County. PAG is the region’s metropolitan planning organization responsible for preparing the long-term regional transportation plan—of which the RTA Plan is a subset. Specifically, when the RTA Plan was approved in 2006, it was incorporated as a subset of the 2035 Regional Transportation Plan in existence at that time. Typically, every year or every other year, a short-range transportation improvement program is created to fund projects over the subsequent five-year time period and would include in-progress projects or those not yet started from the RTA Plan. Recently, a new long-range plan was developed that incorporates the remaining RTA Plan projects and other regionally significant projects—known as the 2045 Regional Mobility and Accessibility Plan.
Figure 2. Relationship and overlap between short-range and long-range transportation plans
Source: Auditor generated. Figure is not to scale.
Measuring Effectiveness of the RTA Plan
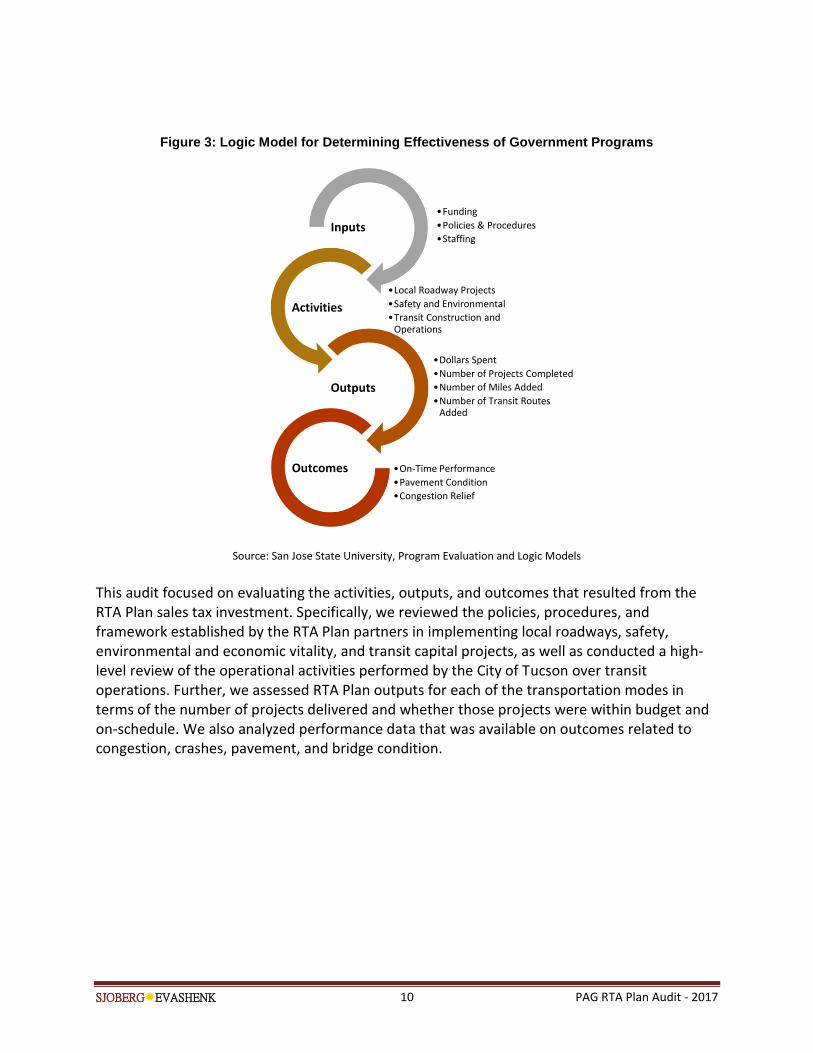
Typical models for determining the effectiveness of a government program—such as the RTA Plan—center on inputs, activities, outputs, and outcomes. As presented in Figure 3, program inputs include the funding, staffing and expertise, and policies and procedures available for a program. For the RTA Plan, inputs are the sales tax revenues and planning conducted by the RTA and the RTA Plan partners. These inputs are funneled into local roadways, safety projects, environmental and economic activities, and transit services as part of the day-to-day professional practices and activities employed to complete the RTA Plan projects. Results of activities are outputs, or what is delivered by the program, as well as outcomes, or the ultimate impact of the program in reaching established goals.
SJOBERGEVASHENK 10 PAG RTA Plan Audit - 2017
Figure 3: Logic Model for Determining Effectiveness of Government Programs
Source: San Jose State University, Program Evaluation and Logic Models
This audit focused on evaluating the activities, outputs, and outcomes that resulted from the RTA Plan sales tax investment. Specifically, we reviewed the policies, procedures, and framework established by the RTA Plan partners in implementing local roadways, safety, environmental and economic vitality, and transit capital projects, as well as conducted a high-level review of the operational activities performed by the City of Tucson over transit operations. Further, we assessed RTA Plan outputs for each of the transportation modes in terms of the number of projects delivered and whether those projects were within budget and on-schedule. We also analyzed performance data that was available on outcomes related to congestion, crashes, pavement, and bridge condition.
•Funding
•Policies & Procedures
•StaffingInputs
•Local Roadway Projects
•Safety and Environmental
•Transit Construction and Operations
Activities
•Dollars Spent
•Number of Projects Completed
•Number of Miles Added
•Number of Transit Routes Added
Outputs
•On-Time Performance
•Pavement Condition
•Congestion Relief
Outcomes
SJOBERGEVASHENK 11 PAG RTA Plan Audit - 2017
Scope & Methodology
In accordance with Arizona Revised Statutes §41-1279.03.A.6, the Arizona Office of the Auditor
General (Auditor General) has the responsibility for conducting a performance audit in the tenth year and in each fifth year thereafter where a transportation excise tax is in effect. In July 2016, the Auditor General hired Sjoberg Evashenk Consulting to conduct the first performance audit of the RTA Plan for the ten-year period covering fiscal years 2007 through 2016 as well as projects scheduled in fiscal years 2017 through 2021. The purpose of the audit is to assess the efficiency, effectiveness, and performance of the RTA Plan for Pima County and address the following primary objectives identified by the Auditor General:
1. Review system performance in relieving congestion and improving mobility in the region for completed and in-progress projects and expenditures for fiscal years 2007 through 2016.
2. Evaluate the extent to which projects completed have impacted the region’s transportation system’s integration and connectivity across and between modes.
3. Review and evaluate the potential impact of expenditures planned for fiscal years 2017 through 2021 in solving transportation problems in the region.
4. Compare budgeted project costs to actual costs for a sample of completed roadway and transit improvement projects, and determine reasons for any variances.
5. Compare projected start and completion dates to actual start and completion dates for a sample of completed roadway and transit improvement projects, and determine reasons for any variances.
6. Identify projects scheduled to be completed during the remaining years that the half-cent sales tax is in effect and compare original start dates to the current project schedule, noting any discrepancies and reasons for discrepancies.
7. Analyze whether RTA Plan expenditures complied with relevant statutes and were spent on RTA Plan projects.
8. Determine whether the RTA Plan as implemented is consistent with the plan voters approved in 2006 for completed, in-progress, and planned projects.
9. Evaluate the ability to complete all projects listed in the RTA Plan given expected revenues.
10. Compare and evaluate project management and cost efficiency used on RTA Plan projects against best practices in planning, design, construction, and completion stages.
We conducted this audit in accordance with generally accepted government auditing standards. Those standards require that we plan and perform the audit to obtain sufficient, appropriate evidence to provide a reasonable basis for our findings and conclusions based on our audit objectives. We believe that the evidence obtained provides a reasonable basis for our findings and conclusions based on our audit objectives. Refer to Appendix A for the detailed methodology employed on this audit.
SJOBERGEVASHENK 12 PAG RTA Plan Audit - 2017
[THIS PAGE LEFT BLANK FOR REPRODUCTION PURPOSES]
SJOBERGEVASHENK 13 PAG RTA Plan Audit - 2017
Chapter 1: Framework Is Sound and Will Help Accomplish RTA Plan as
Promised
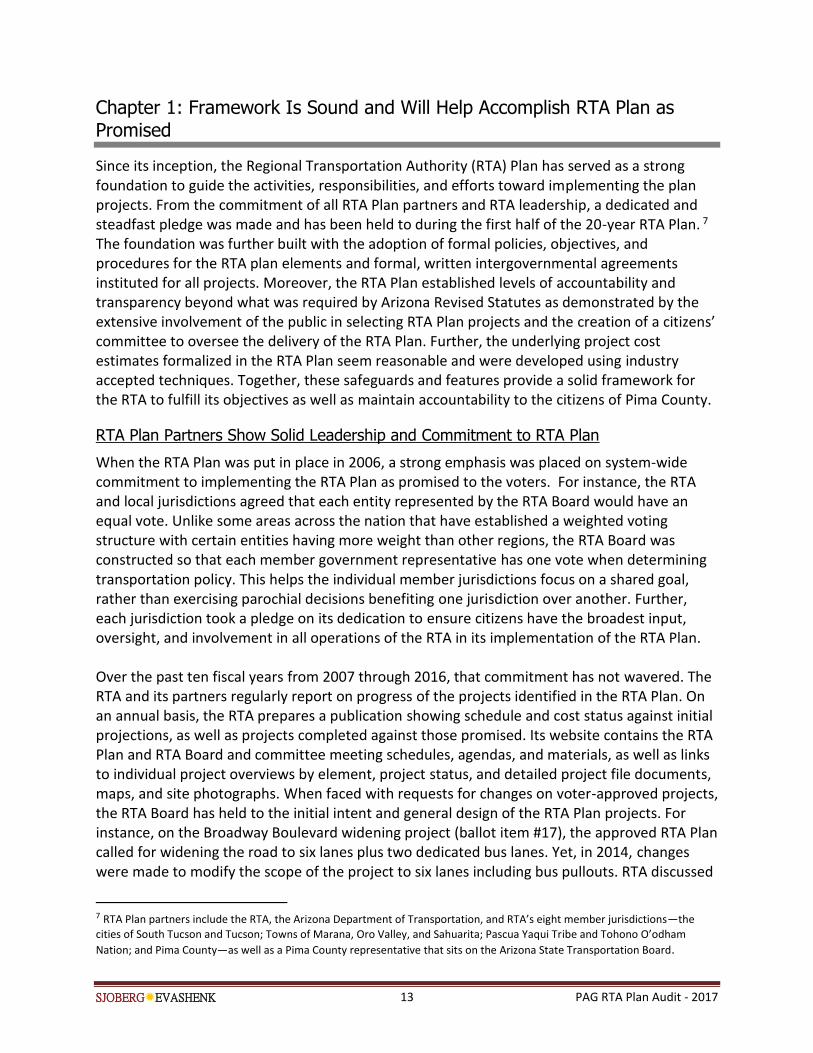
Since its inception, the Regional Transportation Authority (RTA) Plan has served as a strong foundation to guide the activities, responsibilities, and efforts toward implementing the plan projects. From the commitment of all RTA Plan partners and RTA leadership, a dedicated and steadfast pledge was made and has been held to during the first half of the 20-year RTA Plan. 7 The foundation was further built with the adoption of formal policies, objectives, and procedures for the RTA plan elements and formal, written intergovernmental agreements instituted for all projects. Moreover, the RTA Plan established levels of accountability and transparency beyond what was required by Arizona Revised Statutes as demonstrated by the extensive involvement of the public in selecting RTA Plan projects and the creation of a citizens’ committee to oversee the delivery of the RTA Plan. Further, the underlying project cost estimates formalized in the RTA Plan seem reasonable and were developed using industry accepted techniques. Together, these safeguards and features provide a solid framework for the RTA to fulfill its objectives as well as maintain accountability to the citizens of Pima County.
RTA Plan Partners Show Solid Leadership and Commitment to RTA Plan
When the RTA Plan was put in place in 2006, a strong emphasis was placed on system-wide commitment to implementing the RTA Plan as promised to the voters. For instance, the RTA and local jurisdictions agreed that each entity represented by the RTA Board would have an equal vote. Unlike some areas across the nation that have established a weighted voting structure with certain entities having more weight than other regions, the RTA Board was constructed so that each member government representative has one vote when determining transportation policy. This helps the individual member jurisdictions focus on a shared goal, rather than exercising parochial decisions benefiting one jurisdiction over another. Further, each jurisdiction took a pledge on its dedication to ensure citizens have the broadest input, oversight, and involvement in all operations of the RTA in its implementation of the RTA Plan. Over the past ten fiscal years from 2007 through 2016, that commitment has not wavered. The RTA and its partners regularly report on progress of the projects identified in the RTA Plan. On an annual basis, the RTA prepares a publication showing schedule and cost status against initial projections, as well as projects completed against those promised. Its website contains the RTA Plan and RTA Board and committee meeting schedules, agendas, and materials, as well as links to individual project overviews by element, project status, and detailed project file documents, maps, and site photographs. When faced with requests for changes on voter-approved projects, the RTA Board has held to the initial intent and general design of the RTA Plan projects. For instance, on the Broadway Boulevard widening project (ballot item #17), the approved RTA Plan called for widening the road to six lanes plus two dedicated bus lanes. Yet, in 2014, changes were made to modify the scope of the project to six lanes including bus pullouts. RTA discussed
7 RTA Plan partners include the RTA, the Arizona Department of Transportation, and RTA’s eight member jurisdictions—the
cities of South Tucson and Tucson; Towns of Marana, Oro Valley, and Sahuarita; Pascua Yaqui Tribe and Tohono O’odham
Nation; and Pima County—as well as a Pima County representative that sits on the Arizona State Transportation Board.
SJOBERGEVASHENK 14 PAG RTA Plan Audit - 2017
and vetted the proposal approved by the local jurisdiction and a citizen task force in addition to seeking legal guidance to ensure the proposed alignment would not constitute a substantial change from the RTA Plan nor diminish the project’s functionality. Moreover, the RTA appears to operate with a tone at the top that encourages dedication to the RTA Plan and a collaborative leadership style with its RTA Plan partners. According to the RTA, disagreements or conflicts are resolved through regular, yet informal breakfast meetings with the leaders of RTA and local jurisdictions. With transparency and accountability as key tenets and driving forces behind the RTA Plan, the RTA Plan partners appear to keep those concepts clearly in focus. Moreover, stakeholders we met with reinforced that RTA Plan partners are committed to those beliefs and have earned credibility by keeping promises to voters.
Policies and Procedures Seem Sufficient to Direct Project Activities
Developed in 2006, the RTA Plan has two sets of policies, objectives, and procedures—one set guiding roadway, safety, and environmental and economic vitality projects and another set guiding transit projects. The first set of policies, objectives, and procedures consists of 24 separate policies intended to facilitate development and oversight of plan projects and covers areas such as roles and responsibilities, project authorizations, allowable costs, invoicing and reimbursements, and reallocation of surplus funds. Further, there are policies requiring identification of a lead agency for each project and clarifying that costs exceeding the maximum amount approved in the RTA Plan are the responsibility of the lead agency. Similarly, the second set of policies, objectives, and procedures for transit projects provide guidance on roles and responsibilities, allowable expenditures, reporting requirements, and processes required to change transit projects outlined in the RTA Plan.
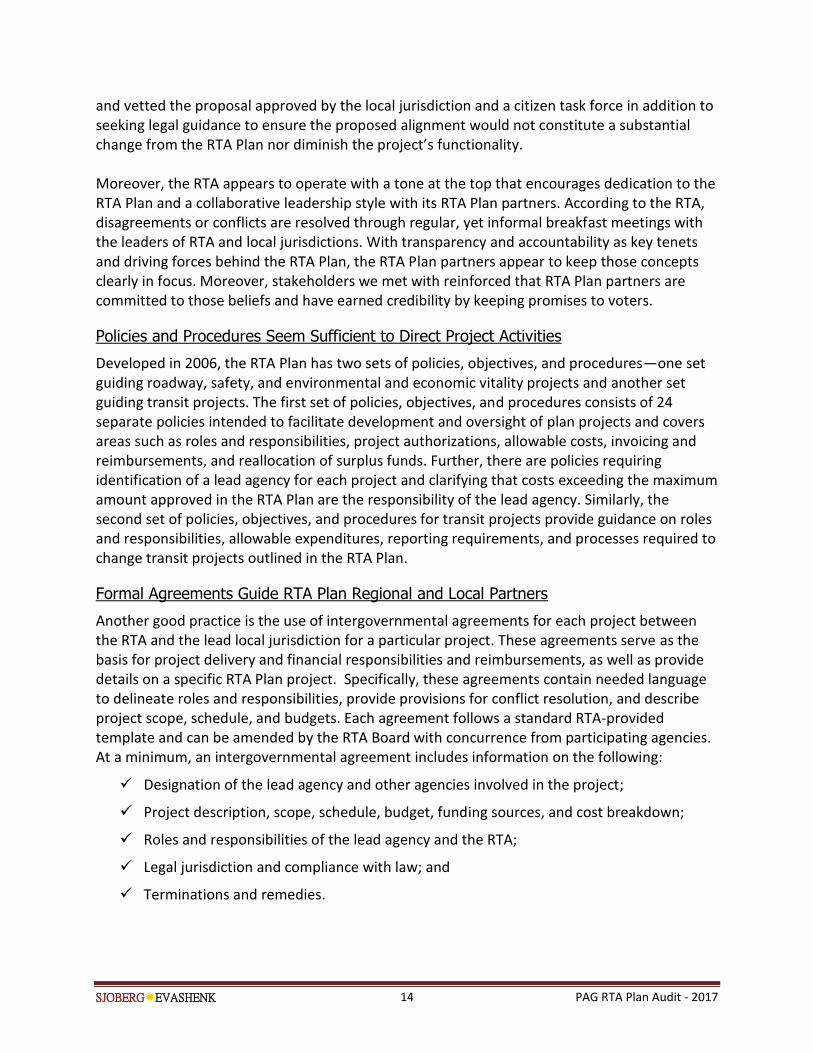
Formal Agreements Guide RTA Plan Regional and Local Partners
Another good practice is the use of intergovernmental agreements for each project between the RTA and the lead local jurisdiction for a particular project. These agreements serve as the basis for project delivery and financial responsibilities and reimbursements, as well as provide details on a specific RTA Plan project. Specifically, these agreements contain needed language to delineate roles and responsibilities, provide provisions for conflict resolution, and describe project scope, schedule, and budgets. Each agreement follows a standard RTA-provided template and can be amended by the RTA Board with concurrence from participating agencies. At a minimum, an intergovernmental agreement includes information on the following:
Designation of the lead agency and other agencies involved in the project;
Project description, scope, schedule, budget, funding sources, and cost breakdown;
Roles and responsibilities of the lead agency and the RTA;
Legal jurisdiction and compliance with law; and
Terminations and remedies.

SJOBERGEVASHENK 15 PAG RTA Plan Audit - 2017
Projects Selected Based on Extensive Public Outreach
An underlying strength of the RTA Plan is that projects were selected based on extensive public outreach, input from technical experts, estimated project costs, and projected sales tax revenues. In 2005 when the RTA Plan was being formed, a temporary Citizens Advisory Committee was established to assist with the development of the 20-year RTA Plan. Through this committee, there was an extensive public outreach campaign conducted in three distinct phases with questionnaires, public meetings, presentations, and e-mail comments that were used to modify aspects of projects and alignments originally set forth to the public. These public outreach efforts seemed to have resulted in a transportation plan that was well-championed by the voting public as evidenced by the approximate 60 percent passage rate of the half-cent sales tax measure in 2006.
Additional Safeguards and Committee Strengthen Accountability and Oversight
Expanding upon the Arizona Revised Statutes that instituted accountability and oversight such as annual financial audits and annual public budget reports, the RTA Board adopted additional safeguards designed to provide transparency and direct opportunities for the public to perform independent oversight and monitoring. For instance, in 2006 the RTA Board approved a “Pledge to the Public” to not substantially change amounts and projects dedicated within an RTA Plan element by 10 percent or more without voter approval and that the minimum allocations of RTA revenues for each project would be honored and not changed among other provisions. That pledge, along with other RTA Plan activities, are overseen by the Citizens Accountability for Regional Transportation (CART) Committee created in 2006 to provide independent citizen oversight and report directly to the RTA Board. In line with best industry practice, the CART Committee has a formal membership application process, follows written bylaws, and meets quarterly. Although we were not tasked with reviewing CART Committee structure or oversight, our high-level review found that the CART Committee functions appear similar to other well-run taxpayer oversight committees that monitor local sales-tax measures. Additional safeguards established by the RTA Board include a public corridor planning process, allowing participation by those who may be most affected or impacted by corridor improvement. The RTA and local jurisdictions have also adopted the use of consistent policies to help with coordination, planning, design, and project delivery processes.
Additional RTA Safeguards
Pledge of Minimum Allocations of RTA Revenues
Citizens Accountability for Regional Transportation Committee
Establishment of a Public Corridor Planning Process
RTA Policies for Plan Implementation Adopted by the RTA Board
Regional Consistency Policies Adopted by the Local Jurisdictions

SJOBERGEVASHENK 16 PAG RTA Plan Audit - 2017
Initial Cost Estimates Were Reliable in Forming RTA Plan and Align with Industry Models
As with most transportation and transit projects, performance and planning is highly dependent upon a solid financial foundation that encompasses estimation and projection of anticipated expenditures. While transportation financing is inherently complex and difficult to predict with great accuracy given external economic factors and project timelines spanning several years, the expenditure factors and process used in the estimation model for the RTA Plan are reasonable and consistent with best practices. As part of our review of high-level expenditure forecasts for the RTA Plan, we studied cost estimating methodologies, assumptions, and processes used for the initial RTA Plan in 2006. However, our review did not evaluate detailed project level costs at a design level. In Pima County, we found that cost estimating practices employed in the 2006 RTA Plan were in-line with industry practices and those elements considered by similar entities. From the initial cost estimate to the final cost estimate at the RTA Plan element level, it appears that key principles and elements were considered. The basis for cost estimates included in the RTA Plan was a revenue forecast prepared by the University of Arizona’s Eller College of Management in January 2005 that projected approximately $2 billion in sales tax revenues would be received between fiscal years 2007 and 2026 if Pima County voters approved a half-cent sales tax increase to fund transportation projects in the RTA Plan. Using this estimate, RTA Plan partners engaged in detailed discussions on how RTA funding should be allocated amongst a pool of transportation improvement projects grouped into four RTA Plan “elements” as described in the sections that follow.
Element I: Roadways
As the largest program in the RTA Plan, two cost estimates were created for the roadway elements—one initial and one final cost estimate, both prepared independently by private engineering consultants similar to other public agencies determining costs for large multi-million dollar construction programs. Key principles or elements considered in both estimates were consistent with industry standard practices as provided by the U.S. Department of Transportation’s Federal Highway Administration and American Association of State Highway Transportation Officials. 8 For instance, both sets of estimates provided details on individual construction line items such as pavement, traffic signals, utilities, and signage and marking that were consistent with federal guidance from the American Association of State Highway Transportation Officials. Additionally, the Federal Highway Administration recommends that cost estimates should be written to be easily understood by the public, include all costs and resources to complete the entire project as applicable, be expressed in year-of expenditure dollars, and validated by a “second set of
8 Refer to the Federal Highway Administration “Major Project Program Cost Estimate Guidance” January 2007 and the American
Association of State Highway and Transportation Officials “AASHTO Practical Guide to Estimating” December 2011.
SJOBERGEVASHENK 17 PAG RTA Plan Audit - 2017
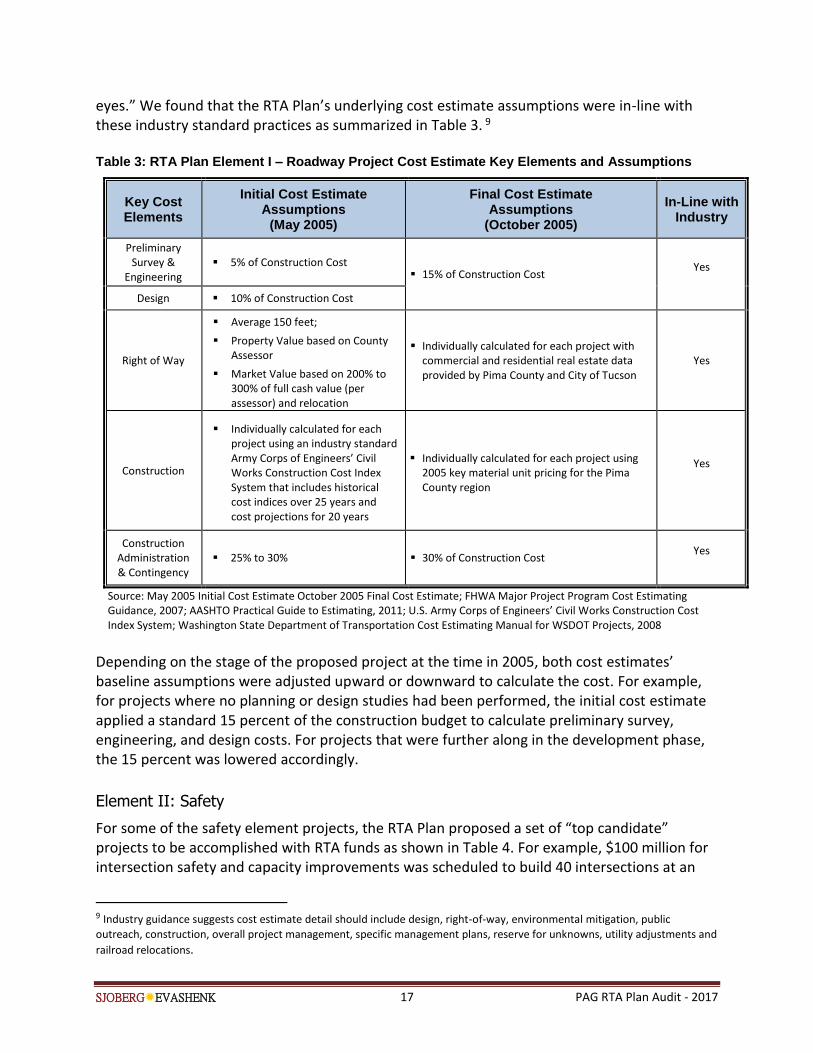
eyes.” We found that the RTA Plan’s underlying cost estimate assumptions were in-line with these industry standard practices as summarized in Table 3. 9 Table 3: RTA Plan Element I – Roadway Project Cost Estimate Key Elements and Assumptions
Key Cost Elements
Initial Cost Estimate Assumptions
(May 2005)
Final Cost Estimate Assumptions
(October 2005)
In-Line with Industry
Preliminary Survey &
Engineering 5% of Construction Cost
15% of Construction Cost Yes
Design 10% of Construction Cost
Right of Way
Average 150 feet;
Property Value based on County Assessor
Market Value based on 200% to 300% of full cash value (per assessor) and relocation
Individually calculated for each project with commercial and residential real estate data provided by Pima County and City of Tucson
Yes
Construction
Individually calculated for each project using an industry standard Army Corps of Engineers’ Civil Works Construction Cost Index System that includes historical cost indices over 25 years and cost projections for 20 years
Individually calculated for each project using 2005 key material unit pricing for the Pima County region
Yes
Construction Administration & Contingency
25% to 30% 30% of Construction Cost Yes
Source: May 2005 Initial Cost Estimate October 2005 Final Cost Estimate; FHWA Major Project Program Cost Estimating Guidance, 2007; AASHTO Practical Guide to Estimating, 2011; U.S. Army Corps of Engineers’ Civil Works Construction Cost Index System; Washington State Department of Transportation Cost Estimating Manual for WSDOT Projects, 2008
Depending on the stage of the proposed project at the time in 2005, both cost estimates’ baseline assumptions were adjusted upward or downward to calculate the cost. For example, for projects where no planning or design studies had been performed, the initial cost estimate applied a standard 15 percent of the construction budget to calculate preliminary survey, engineering, and design costs. For projects that were further along in the development phase, the 15 percent was lowered accordingly.
Element II: Safety
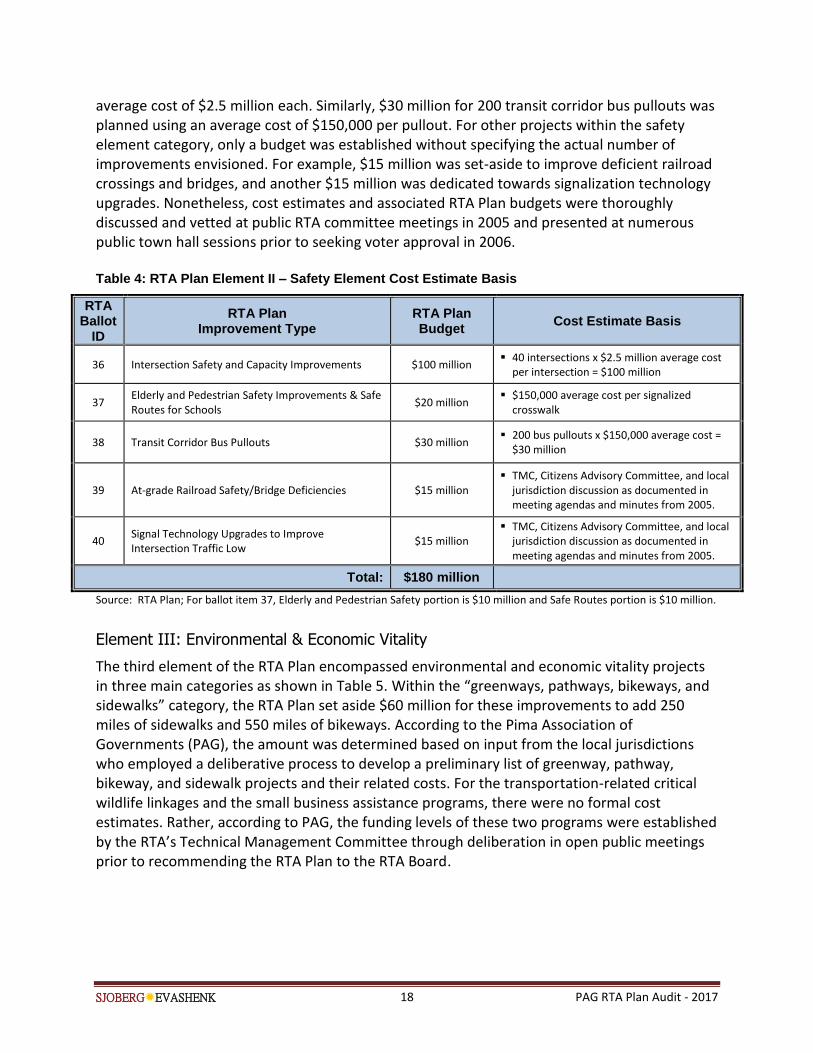
For some of the safety element projects, the RTA Plan proposed a set of “top candidate” projects to be accomplished with RTA funds as shown in Table 4. For example, $100 million for intersection safety and capacity improvements was scheduled to build 40 intersections at an
9 Industry guidance suggests cost estimate detail should include design, right-of-way, environmental mitigation, public
outreach, construction, overall project management, specific management plans, reserve for unknowns, utility adjustments and
railroad relocations.
SJOBERGEVASHENK 18 PAG RTA Plan Audit - 2017
average cost of $2.5 million each. Similarly, $30 million for 200 transit corridor bus pullouts was planned using an average cost of $150,000 per pullout. For other projects within the safety element category, only a budget was established without specifying the actual number of improvements envisioned. For example, $15 million was set-aside to improve deficient railroad crossings and bridges, and another $15 million was dedicated towards signalization technology upgrades. Nonetheless, cost estimates and associated RTA Plan budgets were thoroughly discussed and vetted at public RTA committee meetings in 2005 and presented at numerous public town hall sessions prior to seeking voter approval in 2006. Table 4: RTA Plan Element II – Safety Element Cost Estimate Basis
RTA Ballot
ID
RTA Plan Improvement Type
RTA Plan Budget
Cost Estimate Basis
36 Intersection Safety and Capacity Improvements $100 million 40 intersections x $2.5 million average cost
per intersection = $100 million
37 Elderly and Pedestrian Safety Improvements & Safe Routes for Schools
$20 million $150,000 average cost per signalized
crosswalk
38 Transit Corridor Bus Pullouts $30 million 200 bus pullouts x $150,000 average cost =
$30 million
39 At-grade Railroad Safety/Bridge Deficiencies $15 million TMC, Citizens Advisory Committee, and local
jurisdiction discussion as documented in meeting agendas and minutes from 2005.
40 Signal Technology Upgrades to Improve Intersection Traffic Low
$15 million TMC, Citizens Advisory Committee, and local
jurisdiction discussion as documented in meeting agendas and minutes from 2005.
Total: $180 million
Source: RTA Plan; For ballot item 37, Elderly and Pedestrian Safety portion is $10 million and Safe Routes portion is $10 million.
Element III: Environmental & Economic Vitality
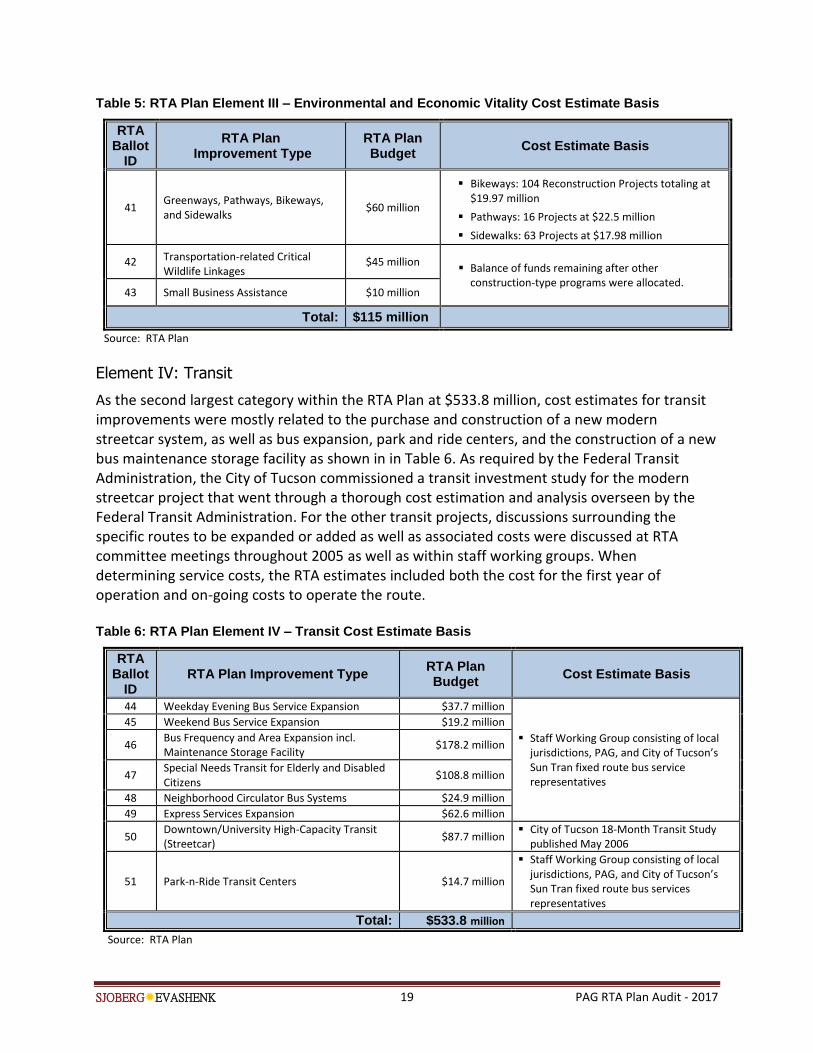
The third element of the RTA Plan encompassed environmental and economic vitality projects in three main categories as shown in Table 5. Within the “greenways, pathways, bikeways, and sidewalks” category, the RTA Plan set aside $60 million for these improvements to add 250 miles of sidewalks and 550 miles of bikeways. According to the Pima Association of Governments (PAG), the amount was determined based on input from the local jurisdictions who employed a deliberative process to develop a preliminary list of greenway, pathway, bikeway, and sidewalk projects and their related costs. For the transportation-related critical wildlife linkages and the small business assistance programs, there were no formal cost estimates. Rather, according to PAG, the funding levels of these two programs were established by the RTA’s Technical Management Committee through deliberation in open public meetings prior to recommending the RTA Plan to the RTA Board.
SJOBERGEVASHENK 19 PAG RTA Plan Audit - 2017
Table 5: RTA Plan Element III – Environmental and Economic Vitality Cost Estimate Basis
RTA Ballot
ID
RTA Plan Improvement Type
RTA Plan Budget
Cost Estimate Basis
41 Greenways, Pathways, Bikeways, and Sidewalks
$60 million
Bikeways: 104 Reconstruction Projects totaling at $19.97 million
Pathways: 16 Projects at $22.5 million
Sidewalks: 63 Projects at $17.98 million
42 Transportation-related Critical Wildlife Linkages
$45 million Balance of funds remaining after other
construction-type programs were allocated. 43 Small Business Assistance $10 million
Total: $115 million
Source: RTA Plan
Element IV: Transit
As the second largest category within the RTA Plan at $533.8 million, cost estimates for transit improvements were mostly related to the purchase and construction of a new modern streetcar system, as well as bus expansion, park and ride centers, and the construction of a new bus maintenance storage facility as shown in in Table 6. As required by the Federal Transit Administration, the City of Tucson commissioned a transit investment study for the modern streetcar project that went through a thorough cost estimation and analysis overseen by the Federal Transit Administration. For the other transit projects, discussions surrounding the specific routes to be expanded or added as well as associated costs were discussed at RTA committee meetings throughout 2005 as well as within staff working groups. When determining service costs, the RTA estimates included both the cost for the first year of operation and on-going costs to operate the route.
Table 6: RTA Plan Element IV – Transit Cost Estimate Basis
RTA Ballot
ID RTA Plan Improvement Type
RTA Plan Budget
Cost Estimate Basis
44 Weekday Evening Bus Service Expansion $37.7 million
Staff Working Group consisting of local jurisdictions, PAG, and City of Tucson’s Sun Tran fixed route bus service representatives
45 Weekend Bus Service Expansion $19.2 million
46 Bus Frequency and Area Expansion incl. Maintenance Storage Facility
$178.2 million
47 Special Needs Transit for Elderly and Disabled Citizens
$108.8 million
48 Neighborhood Circulator Bus Systems $24.9 million
49 Express Services Expansion $62.6 million
50 Downtown/University High-Capacity Transit (Streetcar)
$87.7 million City of Tucson 18-Month Transit Study
published May 2006
51 Park-n-Ride Transit Centers $14.7 million
Staff Working Group consisting of local jurisdictions, PAG, and City of Tucson’s Sun Tran fixed route bus services representatives
Total: $533.8 million
Source: RTA Plan
SJOBERGEVASHENK 20 PAG RTA Plan Audit - 2017
[THIS PAGE LEFT BLANK FOR REPRODUCTION PURPOSES]

SJOBERGEVASHENK 21 PAG RTA Plan Audit - 2017
Chapter 2: RTA Partners are Delivering Projects as Envisioned
Ten years into the 20-year RTA Plan, the Regional Transportation Authority (RTA) Plan partners are generally delivering the projects as described in the RTA Plan within budget and on-schedule. Slight project delays and cost overages seem reasonable and justified. Through these projects, many accomplishments have been realized including the addition of 80 new roadway lane miles to reduce congestion, 58 new and improved pedestrian crossings to enhance safety, 270 miles of bike lanes and paths to provide an alternative mode of transportation, and a new modern streetcar to assist with transit. Further, typical project management practices are being employed and funds were spent in accordance with applicable Arizona Revised Statues, the RTA Plan, and RTA policies, objectives, and procedures.
Many Projects have been Completed
Consistent with typical long-term transportation planning, higher level projects are split into sub-projects to better manage the project details. For instance, a specific road widening project may be tracked at sub-project levels to distinguish between intersection, sideway, bike lane, or bus pullout improvements. Similarly, the 51 ballot projects in the RTA Plan have evolved into approximately 941 sub-projects as of June 30, 2016. Using data from RTA files as confirmed with local jurisdictions, we categorized the 941 sub-projects into four categories—completed, in-progress, not started, and cancelled. 10 As of June 30, 2016, there have been 753 projects completed across the four roadway, safety, environmental and economic vitality, and transit elements—or nearly 80 percent of all sub-projects. As shown in Figure 4, another 158 sub-projects are in-progress, with only 26 sub-projects that have not yet started and 4 sub-projects that were cancelled.
Figure 4: Status of Sub-Projects as of June 30, 2016
Source: Auditor-generated based on RTA Plan, RTA project database, and local jurisdiction project data.
10 Only 4 projects approved for funding by the RTA Board have been subsequently cancelled by the requesting local jurisdiction.
941
4
26
158
753
Total
Cancelled
Not Started
In-Progress
Complete
Status of Sub-Projects
SJOBERGEVASHENK 22 PAG RTA Plan Audit - 2017
Because the RTA does not consider one of the 51 ballot-level projects “complete” until all sub-projects are completed, only 10 ballot-level projects—or 20 percent—were fully complete at June 30, 2016. All 10 completed ballot-level projects are in the roadway improvement element category, because other RTA Plan elements related to safety, environment and economic vitality, or transit projects have activities that will be on-going throughout the four periods of the RTA Plan timeframe. For instance, within the transit element, most ballot-level project categories are partially or fully allocated to on-going operational costs for bus or other service expansions, including evening and weekend bus service, special needs transit, neighborhood circulators, and express service. Thus, while construction of the Downtown/University High-Capacity Streetcar (ballot item #50) was completed in 2014, the project category includes funds for on-going operations and is not counted as complete. Although 41 ballot-level projects still need to be completed, the majority of sub-projects have been completed as of June 30, 2016. For a detailed listing of ballot-level project status, refer to Appendix B.
Projects Completed Generally Align with Stated Project Scopes
While we were not asked to compare project design documents against submittals showing final constructed projects, we conducted a cursory review of on-line project documents and studied aerial photographs showing before and after construction activity. For many projects, the RTA’s website provides links to detailed project file documentation with planning documents, budgets, reports, and schedule information. We used these documents to conduct a reasonableness check comparing the scope for a handful of projects outlined in the RTA Plan with the resulting aerial photos showing project completion. For the most part, it appears that projects have been completed as promised in the RTA Plan. Not only were we able to generally see where proposed designs or roadway alignments had been constructed through the photographs available, but also we could see reports or ribbon cutting events that were documented on-line. Further, we observed and rode the modern streetcar, and estimated the 3.9 mile length promised. However, we were informed of at least one project with a slightly modified scope with bus pullouts designed instead of distinct bus lanes. All changes were discussed, vetted, and approved by appropriate officials, citizens, and legal support.
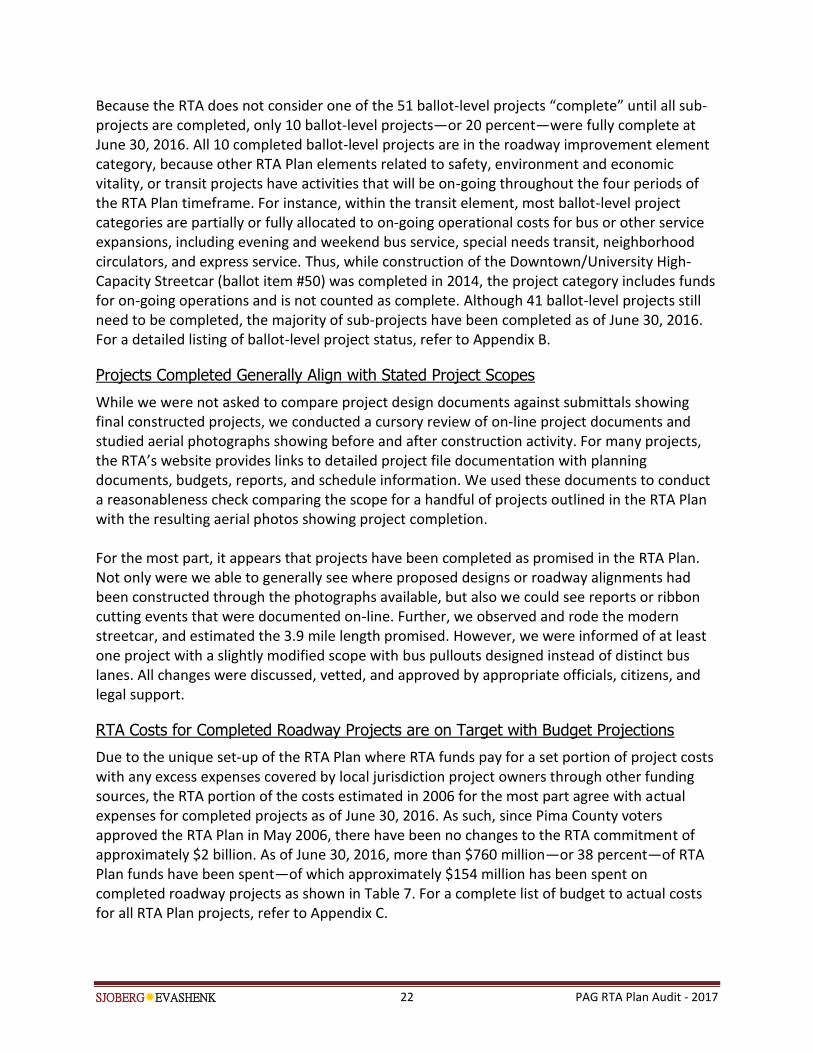
RTA Costs for Completed Roadway Projects are on Target with Budget Projections
Due to the unique set-up of the RTA Plan where RTA funds pay for a set portion of project costs with any excess expenses covered by local jurisdiction project owners through other funding sources, the RTA portion of the costs estimated in 2006 for the most part agree with actual expenses for completed projects as of June 30, 2016. As such, since Pima County voters approved the RTA Plan in May 2006, there have been no changes to the RTA commitment of approximately $2 billion. As of June 30, 2016, more than $760 million—or 38 percent—of RTA Plan funds have been spent—of which approximately $154 million has been spent on completed roadway projects as shown in Table 7. For a complete list of budget to actual costs for all RTA Plan projects, refer to Appendix C.

SJOBERGEVASHENK 23 PAG RTA Plan Audit - 2017
Table 7: Roadway Project Budget-to-Actual for Completed Projects as of June 30, 2016
Roadway Improvement: Element I (in thousands)
RTA Plan
ID
RTA Plan Project Name
Budget Actual Expenses as of 6/30/16
Status
RTA Budget
to Actual
RTA Budget Used
RTA Other Total RTA Other Total
2
Camino de
Manana:
Tangerine to
Linda Vista
$6,185 $9,500 $15,685 $6,186 $17,620 $23,806 Complete $1 100%
3
Twin Peaks
Road:
Silverbell to
I-10 and I-10
Interchange
$30,752 $45,670 $76,422 $14,479 $63,169 $77,648 Complete -$16,273 47%
7
Magee/Cortar
o Farms: La
Canada to
Thornydale
$29,570 $3,700 $33,270 $29,570 $18,033 $47,603 Complete $0 100%
10
La Cholla
Blvd:
Ruthrauff to
River
$14,760 $0 $14,760 $14,495 $3,476 $17,971 Complete -$265 98%
11
La Canada
Dr.: Calle
Concordia to
River
$27,665 $14,066 $41,731 $27,667 $29,148 $56,815 Complete $2 100%
12
Magee Rd: La
Canada to
Oracle
$5,850 $3,750 $9,600 $4,429 $10,932 $15,361 Complete -$1,421 76%
27
Tanque
Verde Rd:
Catalina
Highway to
Houghton
$12,833 $0 $12,833 $10,885 $3,149 $14,034 Complete -$1,948 85%
28
Speedway
Blvd: Camino
Seco to
Houghton
$14,127 $3,000 $17,127 $12,522 $3,716 $16,238 Complete -$1,605 89%
34
Sahuarita Rd
to Country
Club Rd
$30,785 $10,000 $40,785 $29,585 NP $29,585 Complete -$1,200 96%
35 Frontage Rd
(I-19) $3,920 $8,000 $11,920 $3,920 $19,695 $23,615 Complete $0 100%
Total: $176,447 $97,686 $274,133 $153,738 $168,938 $322,676 -$22,709 87%
Source: Auditor-generated based on RTA Plan, RTA General Ledger, and project status and costs provided by local jurisdictions. Budget amounts are estimated in 2006 constant dollars; NP =Other expense information not provided by local jurisdiction.
SJOBERGEVASHENK 24 PAG RTA Plan Audit - 2017
While most completed projects incurred costs greater than the total project budget, the portion the RTA paid remained set with local jurisdictions assuming any additional costs. For instance, on the Frontage Road project (ballot item #35) actual costs were more than double the total expected investment of $11.9 million—a variance paid for by Pima County.
Projects Were Generally Started on Schedule
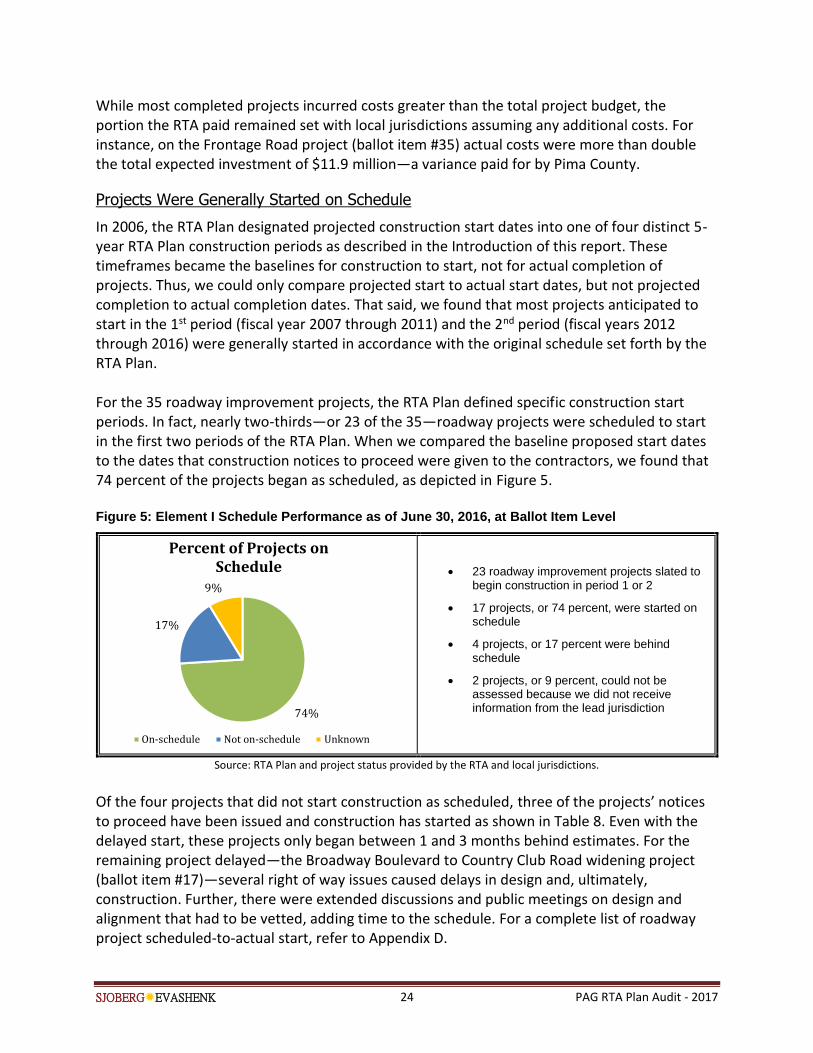
In 2006, the RTA Plan designated projected construction start dates into one of four distinct 5-year RTA Plan construction periods as described in the Introduction of this report. These timeframes became the baselines for construction to start, not for actual completion of projects. Thus, we could only compare projected start to actual start dates, but not projected completion to actual completion dates. That said, we found that most projects anticipated to start in the 1st period (fiscal year 2007 through 2011) and the 2nd period (fiscal years 2012 through 2016) were generally started in accordance with the original schedule set forth by the RTA Plan. For the 35 roadway improvement projects, the RTA Plan defined specific construction start periods. In fact, nearly two-thirds—or 23 of the 35—roadway projects were scheduled to start in the first two periods of the RTA Plan. When we compared the baseline proposed start dates to the dates that construction notices to proceed were given to the contractors, we found that 74 percent of the projects began as scheduled, as depicted in Figure 5. Figure 5: Element I Schedule Performance as of June 30, 2016, at Ballot Item Level
23 roadway improvement projects slated to begin construction in period 1 or 2
17 projects, or 74 percent, were started on schedule
4 projects, or 17 percent were behind schedule
2 projects, or 9 percent, could not be assessed because we did not receive information from the lead jurisdiction
Source: RTA Plan and project status provided by the RTA and local jurisdictions.
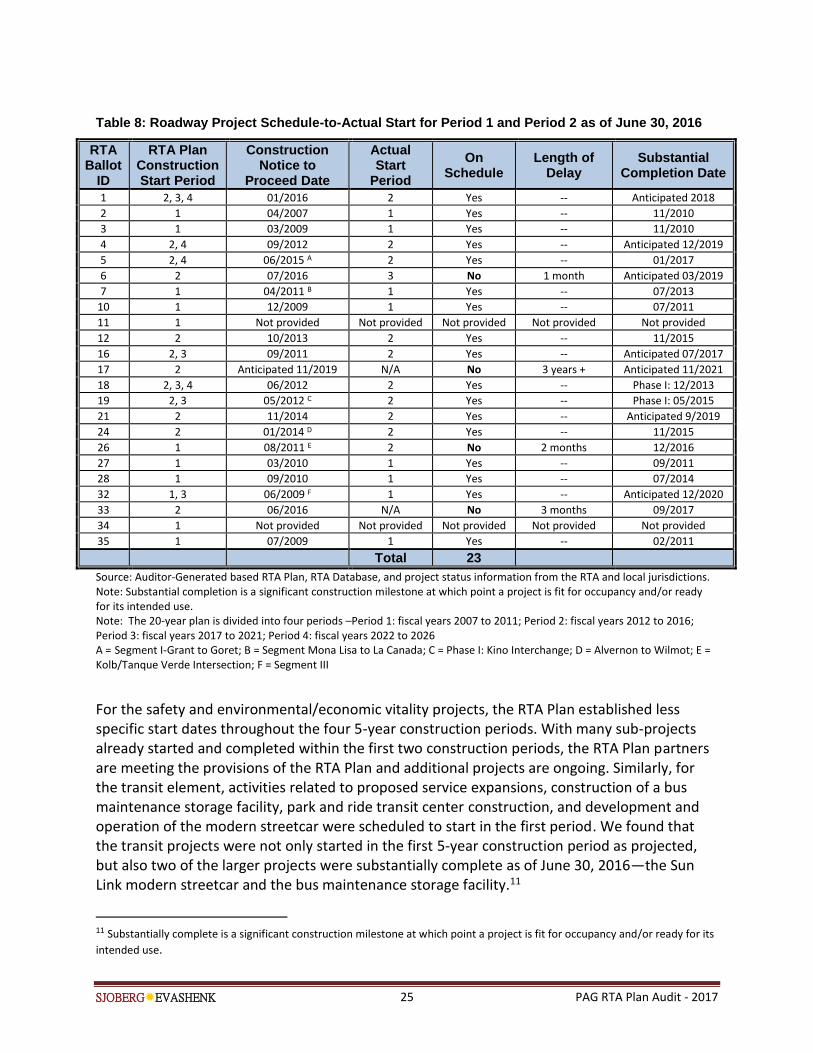
Of the four projects that did not start construction as scheduled, three of the projects’ notices to proceed have been issued and construction has started as shown in Table 8. Even with the delayed start, these projects only began between 1 and 3 months behind estimates. For the remaining project delayed—the Broadway Boulevard to Country Club Road widening project (ballot item #17)—several right of way issues caused delays in design and, ultimately, construction. Further, there were extended discussions and public meetings on design and alignment that had to be vetted, adding time to the schedule. For a complete list of roadway project scheduled-to-actual start, refer to Appendix D.
74%
17%
9%
Percent of Projects on Schedule
On-schedule Not on-schedule Unknown
SJOBERGEVASHENK 25 PAG RTA Plan Audit - 2017
Table 8: Roadway Project Schedule-to-Actual Start for Period 1 and Period 2 as of June 30, 2016
RTA Ballot
ID
RTA Plan Construction Start Period
Construction Notice to
Proceed Date
Actual Start
Period
On Schedule
Length of Delay
Substantial Completion Date
1 2, 3, 4 01/2016 2 Yes -- Anticipated 2018
2 1 04/2007 1 Yes -- 11/2010
3 1 03/2009 1 Yes -- 11/2010
4 2, 4 09/2012 2 Yes -- Anticipated 12/2019
5 2, 4 06/2015 A 2 Yes -- 01/2017
6 2 07/2016 3 No 1 month Anticipated 03/2019
7 1 04/2011 B 1 Yes -- 07/2013
10 1 12/2009 1 Yes -- 07/2011
11 1 Not provided Not provided Not provided Not provided Not provided
12 2 10/2013 2 Yes -- 11/2015
16 2, 3 09/2011 2 Yes -- Anticipated 07/2017
17 2 Anticipated 11/2019 N/A No 3 years + Anticipated 11/2021
18 2, 3, 4 06/2012 2 Yes -- Phase I: 12/2013
19 2, 3 05/2012 C 2 Yes -- Phase I: 05/2015
21 2 11/2014 2 Yes -- Anticipated 9/2019
24 2 01/2014 D 2 Yes -- 11/2015
26 1 08/2011 E 2 No 2 months 12/2016
27 1 03/2010 1 Yes -- 09/2011
28 1 09/2010 1 Yes -- 07/2014
32 1, 3 06/2009 F 1 Yes -- Anticipated 12/2020
33 2 06/2016 N/A No 3 months 09/2017
34 1 Not provided Not provided Not provided Not provided Not provided
35 1 07/2009 1 Yes -- 02/2011
Total 23
Source: Auditor-Generated based RTA Plan, RTA Database, and project status information from the RTA and local jurisdictions. Note: Substantial completion is a significant construction milestone at which point a project is fit for occupancy and/or ready for its intended use. Note: The 20-year plan is divided into four periods –Period 1: fiscal years 2007 to 2011; Period 2: fiscal years 2012 to 2016; Period 3: fiscal years 2017 to 2021; Period 4: fiscal years 2022 to 2026 A = Segment I-Grant to Goret; B = Segment Mona Lisa to La Canada; C = Phase I: Kino Interchange; D = Alvernon to Wilmot; E = Kolb/Tanque Verde Intersection; F = Segment III
For the safety and environmental/economic vitality projects, the RTA Plan established less specific start dates throughout the four 5-year construction periods. With many sub-projects already started and completed within the first two construction periods, the RTA Plan partners are meeting the provisions of the RTA Plan and additional projects are ongoing. Similarly, for the transit element, activities related to proposed service expansions, construction of a bus maintenance storage facility, park and ride transit center construction, and development and operation of the modern streetcar were scheduled to start in the first period. We found that the transit projects were not only started in the first 5-year construction period as projected, but also two of the larger projects were substantially complete as of June 30, 2016—the Sun Link modern streetcar and the bus maintenance storage facility.11
11 Substantially complete is a significant construction milestone at which point a project is fit for occupancy and/or ready for its
intended use.
SJOBERGEVASHENK 26 PAG RTA Plan Audit - 2017
RTA Plan Outputs and Accomplishments are on Track
In the RTA Plan, many specific output goals were planned and presented to the voters for widening roadways, improving safety, enhancing the environment and economic vitality, and expanding transit services. As of June 2016, roadway accomplishments included additional lanes, raised medians, and improved intersections. For categorical projects, spending seems to be in-line with progress. Specifically, $125 million of $295 million earmarked RTA Plan funds for the safety and environmental/economic vitality elements have been spent to date and significantly more than half of the output goals have been achieved. Similarly, transit projects have built a bus maintenance facility, modern streetcar, and park and ride transit centers as planned.
Many Planned Roadway Miles Have Been Added
More than 200 new lane miles to expand traffic capacity and reduce congestion were proposed in the roadway element of the RTA Plan. Features to be added also included items such as bus pullouts, bike lanes, drainage improvements, bus shelters, accessible sidewalks, and improved pedestrian safety crossings. Calculating the number of lane miles accomplished to date is challenging because local jurisdictions break larger projects into different subproject levels—often by contract—or certain outputs like bus pullouts or sidewalks may be combined within different subprojects. However, we estimated that nearly 80 new roadway miles have been added as of June 30, 2016—approximately 40 percent of the overall goal.
Safety Project Accomplishments Align with Those Promised
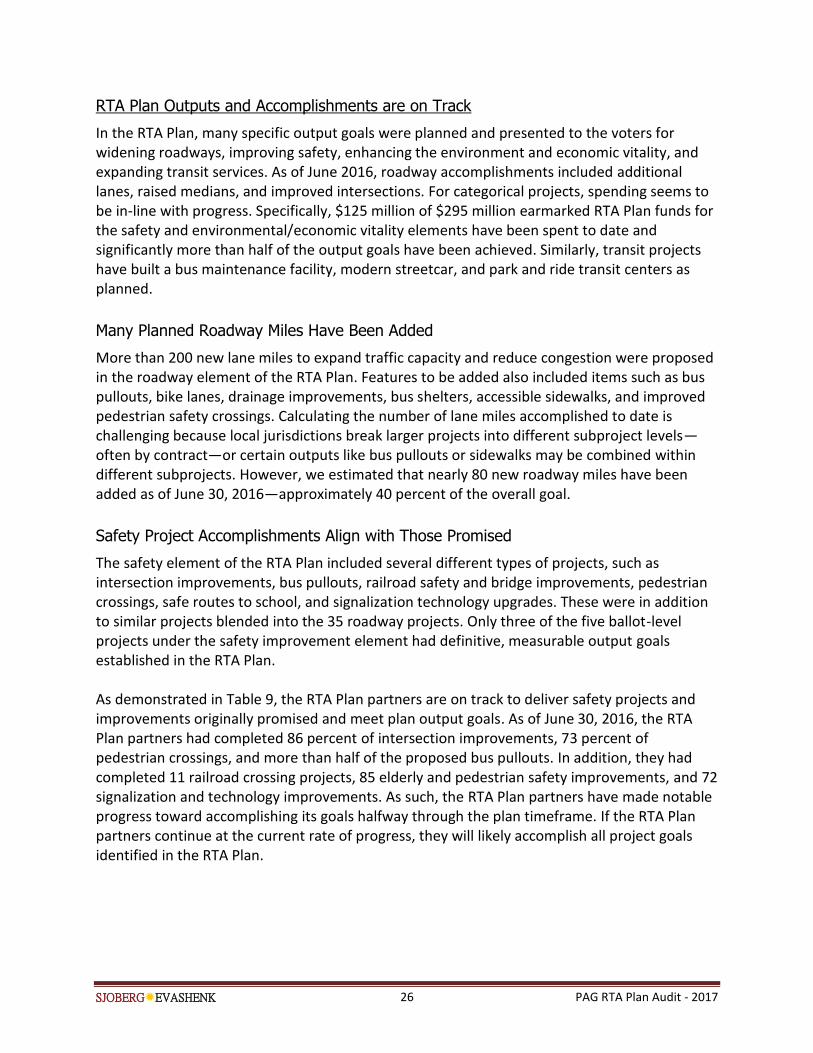
The safety element of the RTA Plan included several different types of projects, such as intersection improvements, bus pullouts, railroad safety and bridge improvements, pedestrian crossings, safe routes to school, and signalization technology upgrades. These were in addition to similar projects blended into the 35 roadway projects. Only three of the five ballot-level projects under the safety improvement element had definitive, measurable output goals established in the RTA Plan. As demonstrated in Table 9, the RTA Plan partners are on track to deliver safety projects and improvements originally promised and meet plan output goals. As of June 30, 2016, the RTA Plan partners had completed 86 percent of intersection improvements, 73 percent of pedestrian crossings, and more than half of the proposed bus pullouts. In addition, they had completed 11 railroad crossing projects, 85 elderly and pedestrian safety improvements, and 72 signalization and technology improvements. As such, the RTA Plan partners have made notable progress toward accomplishing its goals halfway through the plan timeframe. If the RTA Plan partners continue at the current rate of progress, they will likely accomplish all project goals identified in the RTA Plan.
SJOBERGEVASHENK 27 PAG RTA Plan Audit - 2017
Table 9: Comparison of Safety Project Output Goals with Accomplishments to Date
RTA Plan Ballot ID #
RTA Plan Goals Accomplishments
As of May 2016
Approximate Percent of
Goal Complete
36 200 Intersection Improvements 171 Intersection improvements 86%
37 80 new pedestrian crossings 58 pedestrian crossings 73%
38 200 new bus pullouts 109 bus pullouts 55%
Source: Auditor- Generated based on data from RTA Plan, Our Mobility (May 2016), and RTAMobility.com. Table does not include RTA Plan ballot item 39 or 40 since those projects did not have measurable output goals identified.
Environmental and Economic Vitality Projects Are Similarly Meeting Output Goals
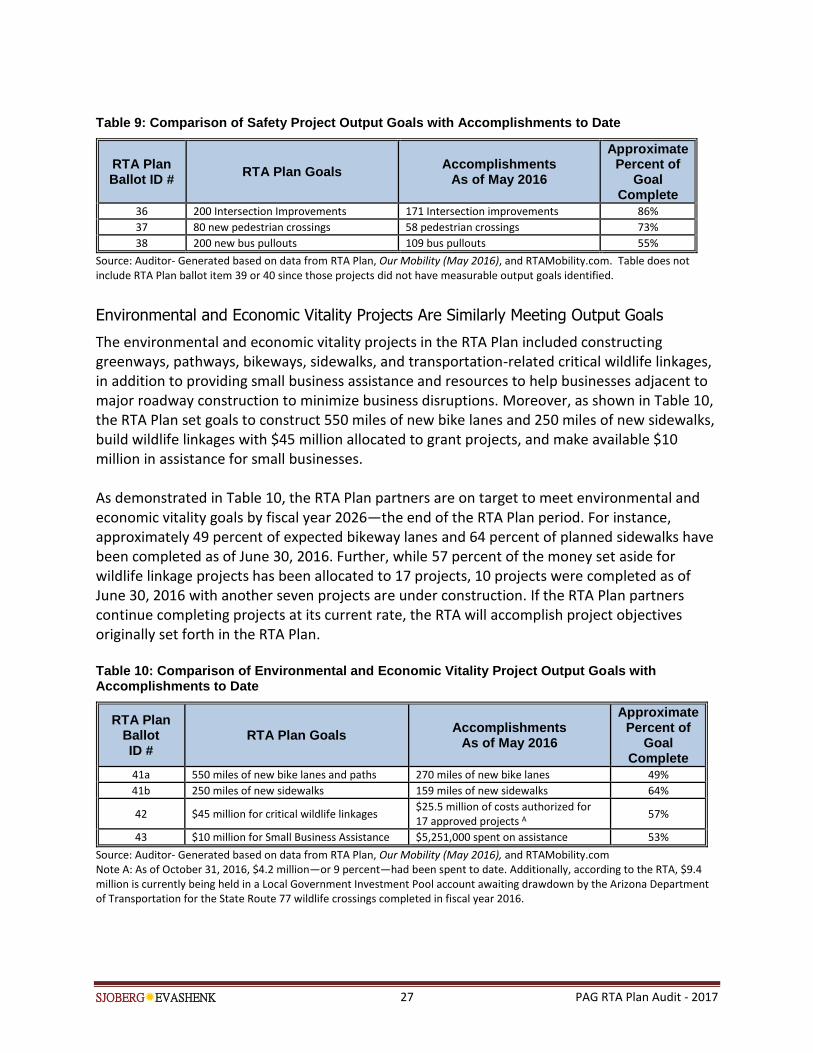
The environmental and economic vitality projects in the RTA Plan included constructing greenways, pathways, bikeways, sidewalks, and transportation-related critical wildlife linkages, in addition to providing small business assistance and resources to help businesses adjacent to major roadway construction to minimize business disruptions. Moreover, as shown in Table 10, the RTA Plan set goals to construct 550 miles of new bike lanes and 250 miles of new sidewalks, build wildlife linkages with $45 million allocated to grant projects, and make available $10 million in assistance for small businesses. As demonstrated in Table 10, the RTA Plan partners are on target to meet environmental and economic vitality goals by fiscal year 2026—the end of the RTA Plan period. For instance, approximately 49 percent of expected bikeway lanes and 64 percent of planned sidewalks have been completed as of June 30, 2016. Further, while 57 percent of the money set aside for wildlife linkage projects has been allocated to 17 projects, 10 projects were completed as of June 30, 2016 with another seven projects are under construction. If the RTA Plan partners continue completing projects at its current rate, the RTA will accomplish project objectives originally set forth in the RTA Plan. Table 10: Comparison of Environmental and Economic Vitality Project Output Goals with Accomplishments to Date
RTA Plan Ballot ID #
RTA Plan Goals Accomplishments
As of May 2016
Approximate Percent of
Goal Complete
41a 550 miles of new bike lanes and paths 270 miles of new bike lanes 49%
41b 250 miles of new sidewalks 159 miles of new sidewalks 64%
42 $45 million for critical wildlife linkages $25.5 million of costs authorized for 17 approved projects A
57%
43 $10 million for Small Business Assistance $5,251,000 spent on assistance 53%
Source: Auditor- Generated based on data from RTA Plan, Our Mobility (May 2016), and RTAMobility.com Note A: As of October 31, 2016, $4.2 million—or 9 percent—had been spent to date. Additionally, according to the RTA, $9.4 million is currently being held in a Local Government Investment Pool account awaiting drawdown by the Arizona Department of Transportation for the State Route 77 wildlife crossings completed in fiscal year 2016.
SJOBERGEVASHENK 28 PAG RTA Plan Audit - 2017
Transit Construction Projects Were Accomplished as Planned
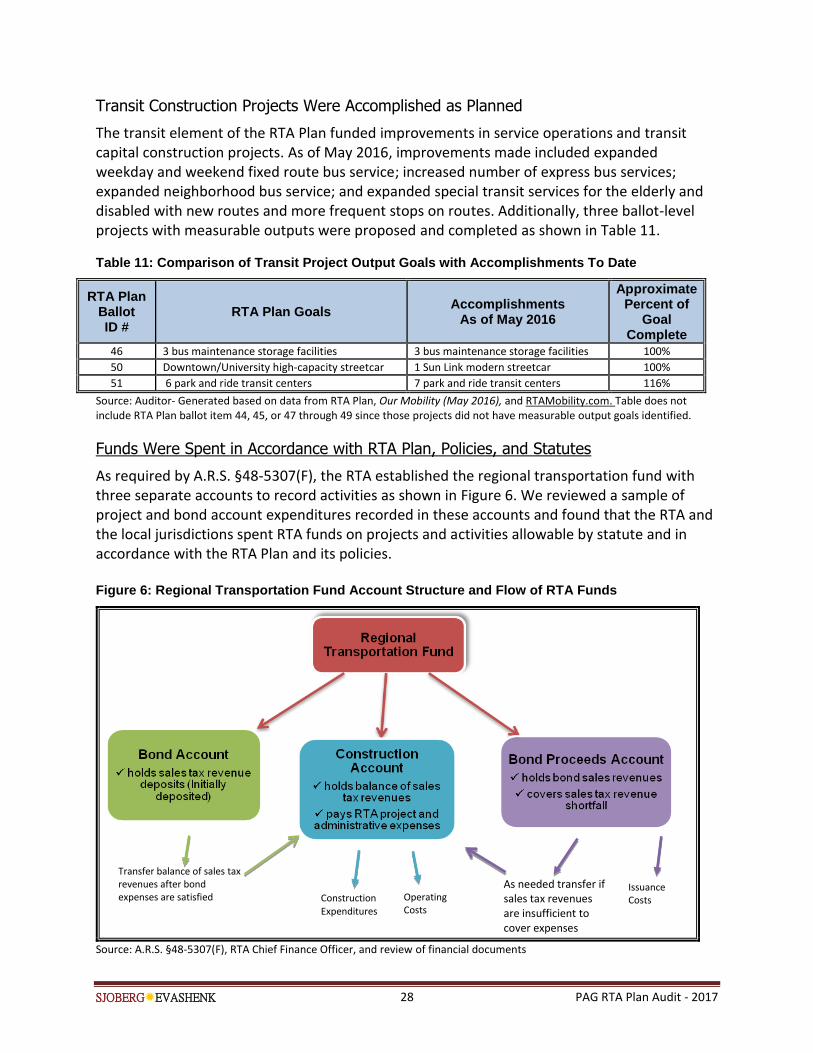
The transit element of the RTA Plan funded improvements in service operations and transit capital construction projects. As of May 2016, improvements made included expanded weekday and weekend fixed route bus service; increased number of express bus services; expanded neighborhood bus service; and expanded special transit services for the elderly and disabled with new routes and more frequent stops on routes. Additionally, three ballot-level projects with measurable outputs were proposed and completed as shown in Table 11. Table 11: Comparison of Transit Project Output Goals with Accomplishments To Date
RTA Plan Ballot ID #
RTA Plan Goals Accomplishments
As of May 2016
Approximate Percent of
Goal Complete
46 3 bus maintenance storage facilities 3 bus maintenance storage facilities 100%
50 Downtown/University high-capacity streetcar 1 Sun Link modern streetcar 100%
51 6 park and ride transit centers 7 park and ride transit centers 116%
Source: Auditor- Generated based on data from RTA Plan, Our Mobility (May 2016), and RTAMobility.com. Table does not include RTA Plan ballot item 44, 45, or 47 through 49 since those projects did not have measurable output goals identified.
Funds Were Spent in Accordance with RTA Plan, Policies, and Statutes
As required by A.R.S. §48-5307(F), the RTA established the regional transportation fund with three separate accounts to record activities as shown in Figure 6. We reviewed a sample of project and bond account expenditures recorded in these accounts and found that the RTA and the local jurisdictions spent RTA funds on projects and activities allowable by statute and in accordance with the RTA Plan and its policies. Figure 6: Regional Transportation Fund Account Structure and Flow of RTA Funds
Source: A.R.S. §48-5307(F), RTA Chief Finance Officer, and review of financial documents
As needed transfer if sales tax revenues are insufficient to cover expenses
Transfer balance of sales tax revenues after bond expenses are satisfied
Issuance Costs Construction
Expenditures
Operating Costs

SJOBERGEVASHENK 29 PAG RTA Plan Audit - 2017
Specifically, project expenditure invoices were supported by underlying documentation and allowable per statute, policies, and the RTA Plan. Our review of the transaction detail from the construction account for a sample of 22 projects revealed that all payments were made in compliance with regulations as shown in the bullets that follow. Specifically, our testing revealed:
Required RTA payment requests were complete and signed by a local representative;
Reimbursement requests were reviewed and accurate;
Project expenses were paid out of the designated construction account;
Costs were allowable and supported;
All reimbursement requests were based upon executed intergovernmental agreements as required by RTA Board policy.
Similarly, we found bond account monies were appropriately used to pay bond holders and project costs. Our review of the general ledger detail for both the bond principal and bond interest account did not reveal any payments other than those required to satisfy bond holders. Bond holders for both of the two bond issuances—Series 2011 and Series 2014 bonds—are paid twice a year in June and December.
Project Management Methods Used by Local Jurisdictions on Roadway Improvement Projects Follow Industry Practices
While we were not asked to do a full-scale examination of project management practices and extensive evaluation of individual project files, we conducted a high-level review and found that project management and delivery practices generally appear to align with common and best standards, although some local jurisdictions could enhance practices by using internal project delivery measures. To gain an understanding of practices employed, we surveyed the eight local jurisdictions in Pima County responsible for implementing the RTA Plan and compared results against standard industry protocols such as cradle-to-grave project management, value engineering, and well-documented change order practices.12 We received responses from seven of the eight jurisdictions and visited three of the local jurisdictions—City of Tucson, Pima County, and Town of Sahuarita—to meet with project management staff and gather examples of project file documentation. Survey responses revealed the majority of jurisdictions are employing many best practices in project management.13
12 The eight local jurisdictions include the cities of South Tucson and Tucson; towns of Marana, Oro Valley, and Sahuarita;
Pascua Yaqui Tribe and Tohono O’odham Nation; and Pima County. 13 A summary of all survey responses is provided in Appendix E, although no response was received from the Pascua Yaqui Tribe. Best practices are drawn from a variety of industry sources including the Construction Management Association’s Construction Management Standards of Practice, Federal Highway Administration guidance, American Institute of Architects guidance, American Public Works Association documents, and Project Management Institute’s Project Management Body of Knowledge Construction Extension, among other sources.
SJOBERGEVASHENK 30 PAG RTA Plan Audit - 2017
Specifically, we found:
Five responding jurisdictions employ a cradle-to-grave single project manager approach and one uses a combination of both single project manager and different project managers for each phase.
Six of the seven jurisdictions reported that they utilize automated project and construction management tools— with Microsoft Project being the most prevalent .14
Five of the seven jurisdictions retain final project files in a central repository, using a mix of scanned and hard copies.
Six of the seven responding jurisdictions indicated that they utilize value engineering practices on RTA Plan projects typically during design and construction stages—although Pima County stated that it employs continuous value engineering on its projects.15
When approving change orders, six of the seven local jurisdictions indicated that they consider multiple forms of supporting documentation that align with best industry practices such as requests for information, proposed change orders, and negotiations of the proposal elements into final change orders.16
Only four of the jurisdictions responded when asked about approving construction progress payments; yet, all four appropriately require and review supporting certified payroll, field inspection reports, and the schedule of values documentation.17
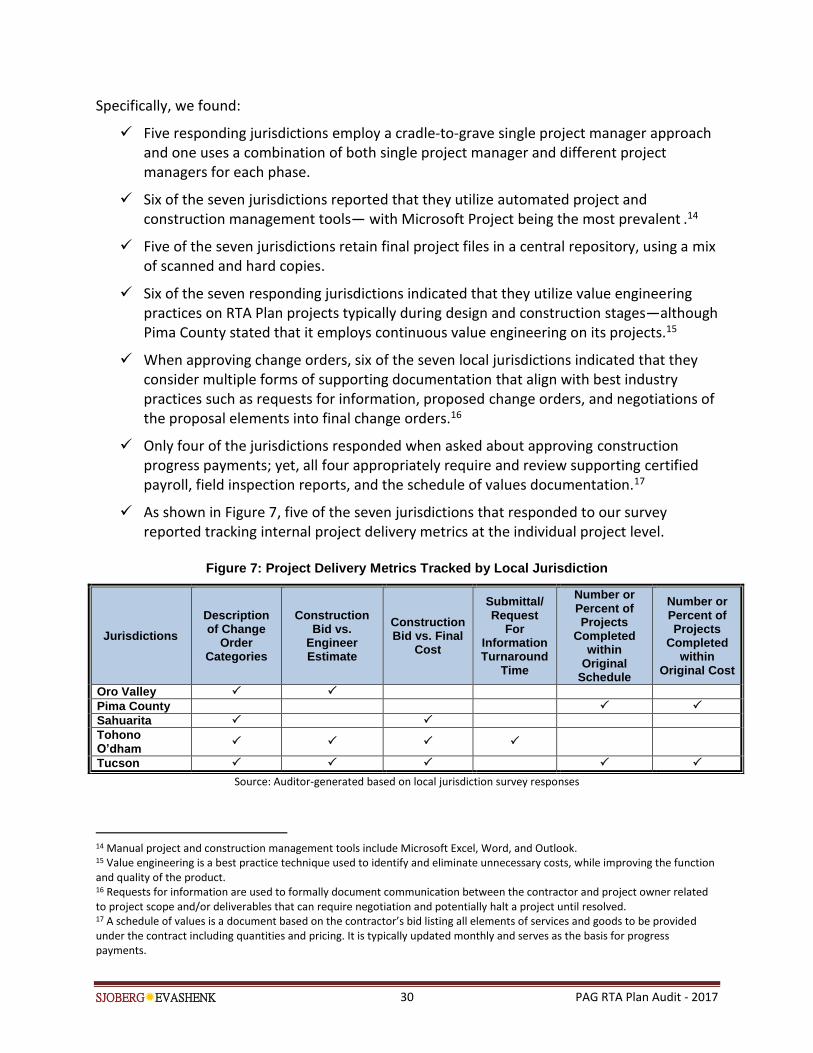
As shown in Figure 7, five of the seven jurisdictions that responded to our survey reported tracking internal project delivery metrics at the individual project level.
Figure 7: Project Delivery Metrics Tracked by Local Jurisdiction
Jurisdictions
Description of Change
Order Categories
Construction Bid vs.
Engineer Estimate
Construction Bid vs. Final
Cost
Submittal/ Request
For Information Turnaround
Time
Number or Percent of Projects
Completed within
Original Schedule
Number or Percent of Projects
Completed within
Original Cost
Oro Valley
Pima County
Sahuarita
Tohono O’dham
Tucson
Source: Auditor-generated based on local jurisdiction survey responses
14 Manual project and construction management tools include Microsoft Excel, Word, and Outlook. 15 Value engineering is a best practice technique used to identify and eliminate unnecessary costs, while improving the function and quality of the product. 16 Requests for information are used to formally document communication between the contractor and project owner related to project scope and/or deliverables that can require negotiation and potentially halt a project until resolved. 17 A schedule of values is a document based on the contractor’s bid listing all elements of services and goods to be provided under the contract including quantities and pricing. It is typically updated monthly and serves as the basis for progress payments.
SJOBERGEVASHENK 31 PAG RTA Plan Audit - 2017
Specifically, the most prevalent metrics tracked by the five reporting jurisdictions were comparing construction bid cost estimates to engineer’s cost estimates, construction bid estimates against final cost, and description of change order categories. The City of Tucson’s and the Tohono O’odham Nation’s tracking of project metrics were the most robust, and other local jurisdictions should consider implementing similar metrics to measure their internal project delivery efficiency and effectiveness.
Project Management on Transit Capital Projects also Followed Industry Best Practices
The City of Tucson and the RTA co-managed the $190 million Sun Link modern streetcar project (ballot item #50) with the City of Tucson Department of Transportation leading the construction component using the design-bid-build project delivery method.18 A combination of federal grant monies, RTA Plan sales-tax revenues, and local funds were used to fund the following components of the transit improvement projects:
Construction of a 3.9-mile modern streetcar line with 19 stations;
Purchase of 8 streetcar vehicles;
Relocation of utilities and installation of poles, electrical lines, and substations;
Installation or modification of traffic signals;
Construction of a maintenance facility;
Implementation of a communications and operations system; and
Construction of a bridge requested by the Federal Transit Administration. Our high-level review of the City of Tucson’s project management practices and project documentation for the Sun Link modern streetcar project found that the City of Tucson employed many best practices from project design through construction.19 For instance, the City of Tucson developed a project management plan that included the project scope of work, roles and responsibilities of key parties assigned to the project, protocols, and links to other project plans and documents. The project management plan was updated throughout the project and provided to oversight agencies, including the Federal Transit Administration.
18 Design-bid-build is the typical project delivery method where the design and construction is sequenced with the project owner hiring a contractor after design is complete. 19 Best industry project management practice standards are drawn from a variety of sources such as the Project Management Institute’s Project Management Body of Knowledge, Construction Management Association of America’s Construction Management Standards of Practice, Federal Highway Administration and Federal Transit Administration reports and guidance.
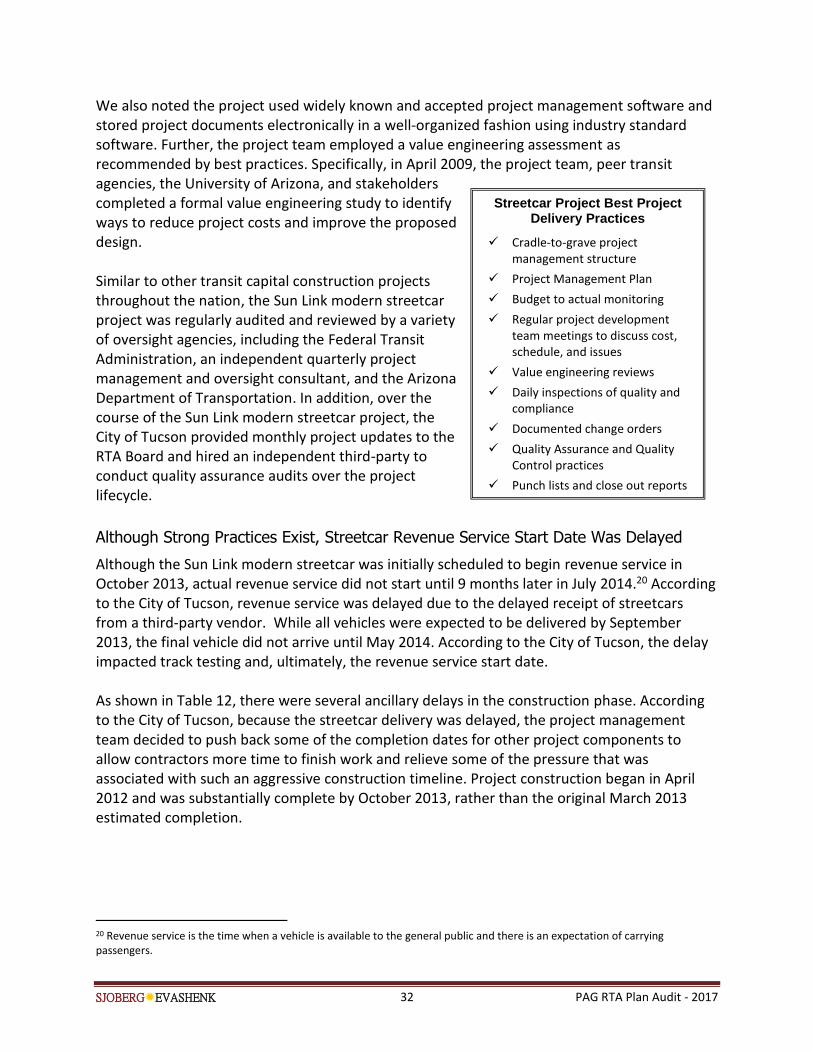
SJOBERGEVASHENK 32 PAG RTA Plan Audit - 2017
We also noted the project used widely known and accepted project management software and stored project documents electronically in a well-organized fashion using industry standard software. Further, the project team employed a value engineering assessment as recommended by best practices. Specifically, in April 2009, the project team, peer transit agencies, the University of Arizona, and stakeholders completed a formal value engineering study to identify ways to reduce project costs and improve the proposed design. Similar to other transit capital construction projects throughout the nation, the Sun Link modern streetcar project was regularly audited and reviewed by a variety of oversight agencies, including the Federal Transit Administration, an independent quarterly project management and oversight consultant, and the Arizona Department of Transportation. In addition, over the course of the Sun Link modern streetcar project, the City of Tucson provided monthly project updates to the RTA Board and hired an independent third-party to conduct quality assurance audits over the project lifecycle.
Although Strong Practices Exist, Streetcar Revenue Service Start Date Was Delayed
Although the Sun Link modern streetcar was initially scheduled to begin revenue service in October 2013, actual revenue service did not start until 9 months later in July 2014.20 According to the City of Tucson, revenue service was delayed due to the delayed receipt of streetcars from a third-party vendor. While all vehicles were expected to be delivered by September 2013, the final vehicle did not arrive until May 2014. According to the City of Tucson, the delay impacted track testing and, ultimately, the revenue service start date. As shown in Table 12, there were several ancillary delays in the construction phase. According to the City of Tucson, because the streetcar delivery was delayed, the project management team decided to push back some of the completion dates for other project components to allow contractors more time to finish work and relieve some of the pressure that was associated with such an aggressive construction timeline. Project construction began in April 2012 and was substantially complete by October 2013, rather than the original March 2013 estimated completion.
20 Revenue service is the time when a vehicle is available to the general public and there is an expectation of carrying passengers.
Streetcar Project Best Project Delivery Practices
Cradle-to-grave project management structure
Project Management Plan
Budget to actual monitoring
Regular project development team meetings to discuss cost, schedule, and issues
Value engineering reviews
Daily inspections of quality and compliance
Documented change orders
Quality Assurance and Quality Control practices
Punch lists and close out reports
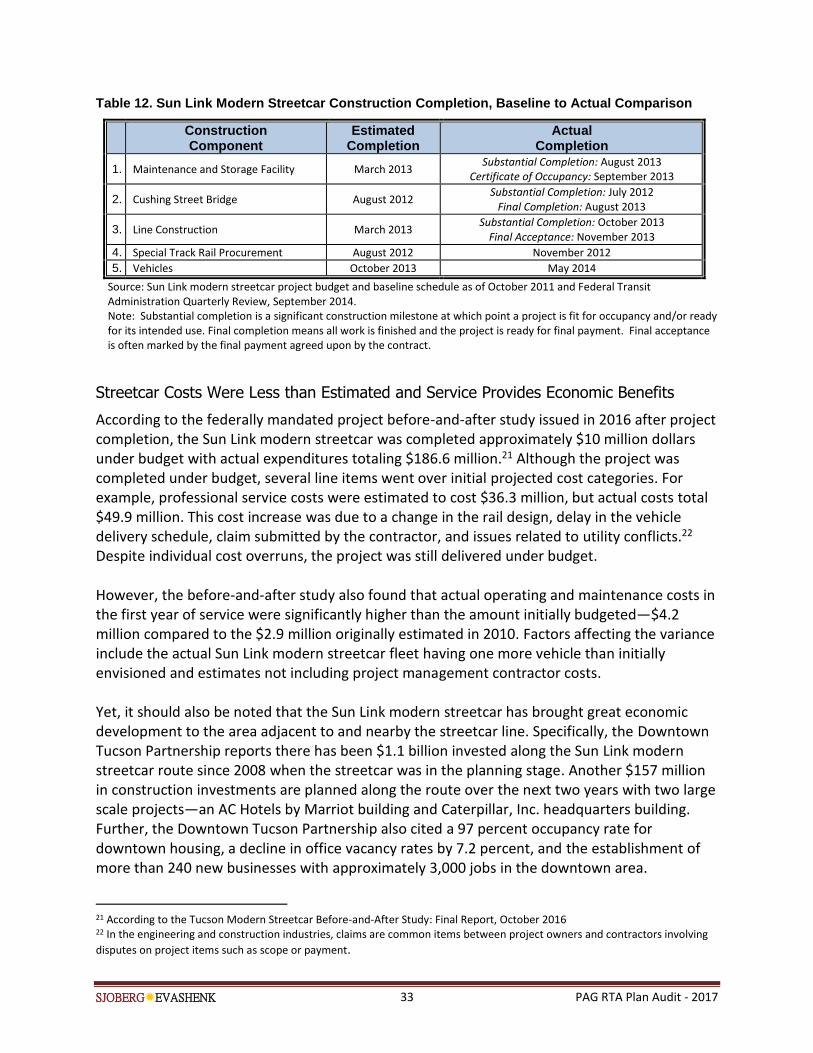
SJOBERGEVASHENK 33 PAG RTA Plan Audit - 2017
Table 12. Sun Link Modern Streetcar Construction Completion, Baseline to Actual Comparison
Construction Component
Estimated Completion
Actual Completion
1. Maintenance and Storage Facility March 2013 Substantial Completion: August 2013
Certificate of Occupancy: September 2013
2. Cushing Street Bridge August 2012 Substantial Completion: July 2012
Final Completion: August 2013
3. Line Construction March 2013 Substantial Completion: October 2013
Final Acceptance: November 2013
4. Special Track Rail Procurement August 2012 November 2012
5. Vehicles October 2013 May 2014
Source: Sun Link modern streetcar project budget and baseline schedule as of October 2011 and Federal Transit Administration Quarterly Review, September 2014. Note: Substantial completion is a significant construction milestone at which point a project is fit for occupancy and/or ready for its intended use. Final completion means all work is finished and the project is ready for final payment. Final acceptance is often marked by the final payment agreed upon by the contract.
Streetcar Costs Were Less than Estimated and Service Provides Economic Benefits
According to the federally mandated project before-and-after study issued in 2016 after project completion, the Sun Link modern streetcar was completed approximately $10 million dollars under budget with actual expenditures totaling $186.6 million.21 Although the project was completed under budget, several line items went over initial projected cost categories. For example, professional service costs were estimated to cost $36.3 million, but actual costs total $49.9 million. This cost increase was due to a change in the rail design, delay in the vehicle delivery schedule, claim submitted by the contractor, and issues related to utility conflicts.22 Despite individual cost overruns, the project was still delivered under budget. However, the before-and-after study also found that actual operating and maintenance costs in the first year of service were significantly higher than the amount initially budgeted—$4.2 million compared to the $2.9 million originally estimated in 2010. Factors affecting the variance include the actual Sun Link modern streetcar fleet having one more vehicle than initially envisioned and estimates not including project management contractor costs. Yet, it should also be noted that the Sun Link modern streetcar has brought great economic development to the area adjacent to and nearby the streetcar line. Specifically, the Downtown Tucson Partnership reports there has been $1.1 billion invested along the Sun Link modern streetcar route since 2008 when the streetcar was in the planning stage. Another $157 million in construction investments are planned along the route over the next two years with two large scale projects—an AC Hotels by Marriot building and Caterpillar, Inc. headquarters building. Further, the Downtown Tucson Partnership also cited a 97 percent occupancy rate for downtown housing, a decline in office vacancy rates by 7.2 percent, and the establishment of more than 240 new businesses with approximately 3,000 jobs in the downtown area.
21 According to the Tucson Modern Streetcar Before-and-After Study: Final Report, October 2016 22 In the engineering and construction industries, claims are common items between project owners and contractors involving
disputes on project items such as scope or payment.

SJOBERGEVASHENK 34 PAG RTA Plan Audit - 2017
[THIS PAGE LEFT BLANK FOR REPRODUCTION PURPOSES]
SJOBERGEVASHENK 35 PAG RTA Plan Audit - 2017
Chapter 3: RTA Plan Partners Should Be Able to Complete Remaining
Projects
As discussed in Chapters 1 and 2 of this report, the Regional Transportation Authority (RTA) Plan partners have laid a foundation that will help deliver the remaining plan projects as promised if these current practices continue in the future. For the second half of the RTA Plan, the realization of sales-tax revenue remains a critical factor in the successful completion of the RTA Plan. While the economic recession significantly lowered revenue collections and subsequent revenue projections, our review found that the RTA’s revenue projection models contain standard elements, and cost estimates models follow good practices. However, if the revenues fall short of projections or costs significantly increase, the RTA Plan partners have plans in place to help ensure projects are completed.
Most Remaining Projects Are In-Progress
By design, the RTA Plan partners planned to start and complete many of the roadway projects in the first half of the RTA Plan—resulting in approximately 63 percent of the 211 roadway sub-projects complete as of June 30, 2016. For safety, environmental and economic vitality, and transit projects, activities and costs are intentionally spread across the 20-year timeframe as well as on-going transit route operations. While much has been done through June 30, 2016, 41 of the 51 RTA ballot-level projects remain to be completed at an estimated cost of $1.2 billion over the remaining half of the RTA Plan. As shown in Appendix B, 33 of the remaining 41 projects, or 80 percent, are in-progress at the design or construction phase and are on track for spending for the on-going safety, environmental and economic vitality, and transit costs. Given the RTA Plan partners success in starting projects when planned as described in Chapter 2 of this report, it is likely that the remaining 8 ballot-level projects will be started and completed as promised.
Revenue Forecasting Models Are Reasonable and Align with Standard Practice
While revenues have not materialized as initially anticipated in 2005 when the RTA Plan was developed, the models used by the RTA seem reasonable, do not deviate from standard practice, and are similar to those used by other jurisdictions.23 Specifically, in 2005, the RTA, which serves as the fiscal manager of the RTA Plan, contracted with the University of Arizona’s Eller College of Management to produce the initial revenue forecast for the county-wide half-cent sales tax measure brought before Pima County voters in 2006. These revenue forecasts were subsequently updated by the University of Arizona’s Eller College of Management in 2010 and in 2013.
23 Other jurisdictions include the San Diego Association of Governments (SANDAG) in California and Maricopa Association of
Governments (MAG) in Arizona.
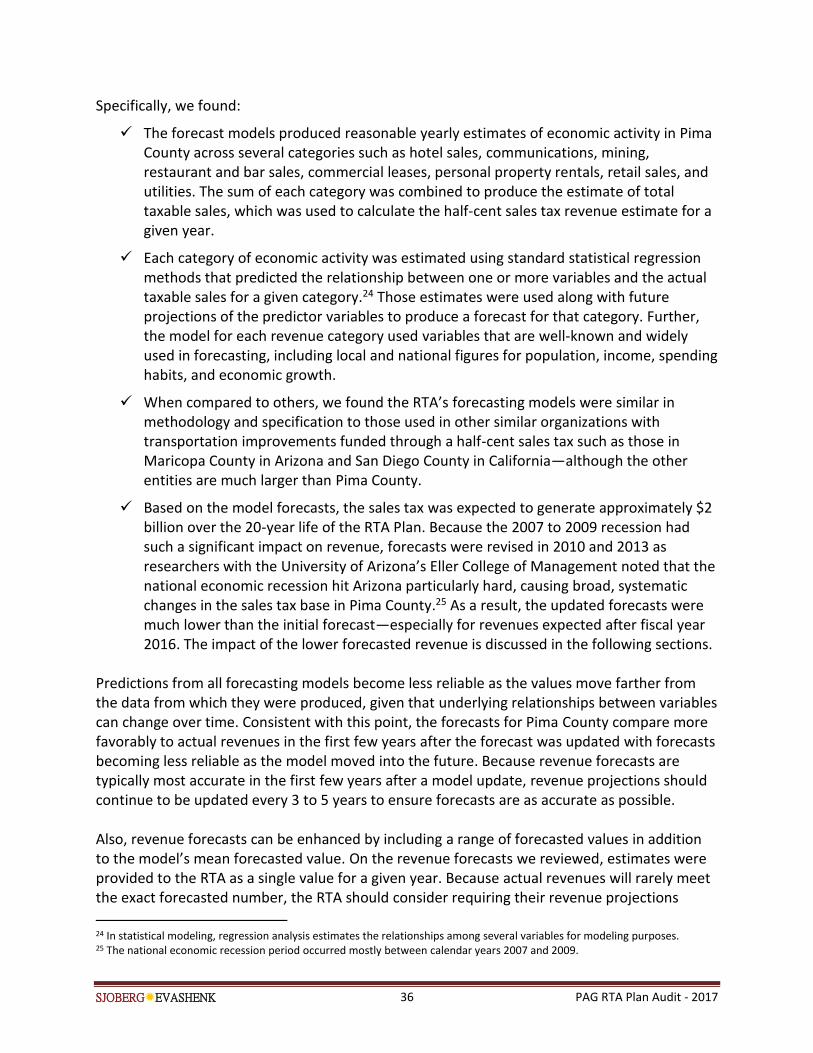
SJOBERGEVASHENK 36 PAG RTA Plan Audit - 2017
Specifically, we found:
The forecast models produced reasonable yearly estimates of economic activity in Pima County across several categories such as hotel sales, communications, mining, restaurant and bar sales, commercial leases, personal property rentals, retail sales, and utilities. The sum of each category was combined to produce the estimate of total taxable sales, which was used to calculate the half-cent sales tax revenue estimate for a given year.
Each category of economic activity was estimated using standard statistical regression methods that predicted the relationship between one or more variables and the actual taxable sales for a given category.24 Those estimates were used along with future projections of the predictor variables to produce a forecast for that category. Further, the model for each revenue category used variables that are well-known and widely used in forecasting, including local and national figures for population, income, spending habits, and economic growth.
When compared to others, we found the RTA’s forecasting models were similar in methodology and specification to those used in other similar organizations with transportation improvements funded through a half-cent sales tax such as those in Maricopa County in Arizona and San Diego County in California—although the other entities are much larger than Pima County.
Based on the model forecasts, the sales tax was expected to generate approximately $2 billion over the 20-year life of the RTA Plan. Because the 2007 to 2009 recession had such a significant impact on revenue, forecasts were revised in 2010 and 2013 as researchers with the University of Arizona’s Eller College of Management noted that the national economic recession hit Arizona particularly hard, causing broad, systematic changes in the sales tax base in Pima County.25 As a result, the updated forecasts were much lower than the initial forecast—especially for revenues expected after fiscal year 2016. The impact of the lower forecasted revenue is discussed in the following sections.
Predictions from all forecasting models become less reliable as the values move farther from the data from which they were produced, given that underlying relationships between variables can change over time. Consistent with this point, the forecasts for Pima County compare more favorably to actual revenues in the first few years after the forecast was updated with forecasts becoming less reliable as the model moved into the future. Because revenue forecasts are typically most accurate in the first few years after a model update, revenue projections should continue to be updated every 3 to 5 years to ensure forecasts are as accurate as possible. Also, revenue forecasts can be enhanced by including a range of forecasted values in addition to the model’s mean forecasted value. On the revenue forecasts we reviewed, estimates were provided to the RTA as a single value for a given year. Because actual revenues will rarely meet the exact forecasted number, the RTA should consider requiring their revenue projections
24 In statistical modeling, regression analysis estimates the relationships among several variables for modeling purposes. 25 The national economic recession period occurred mostly between calendar years 2007 and 2009.
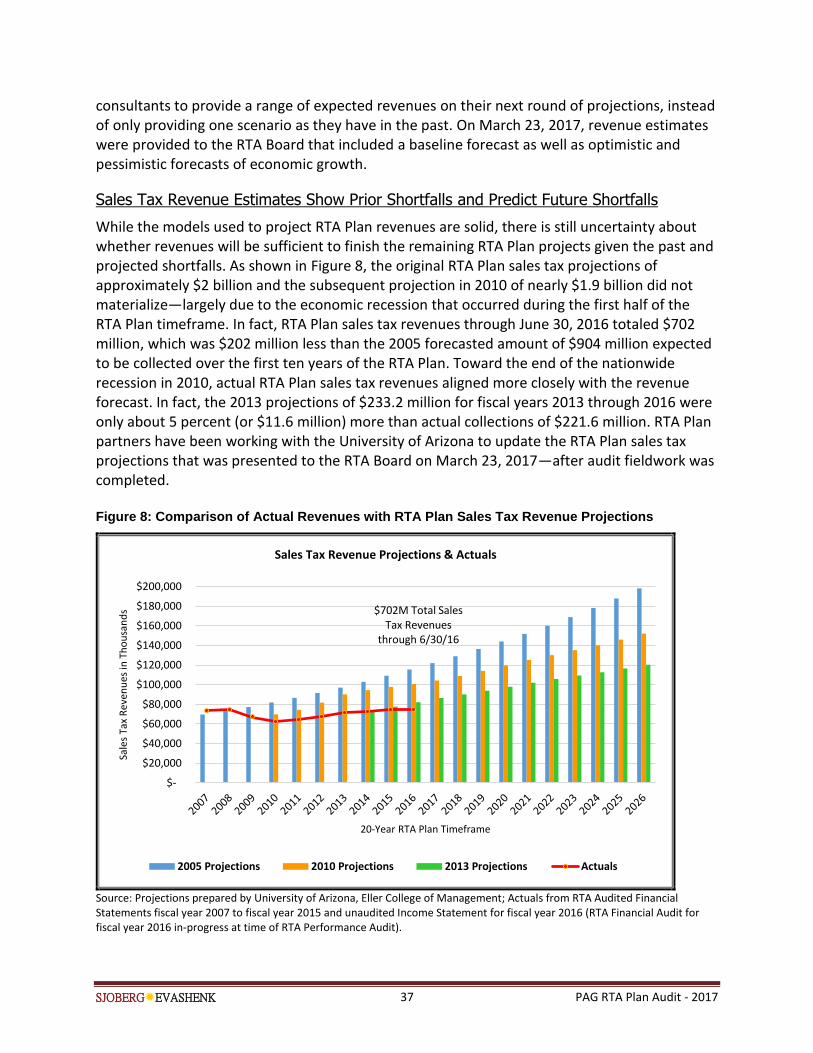
SJOBERGEVASHENK 37 PAG RTA Plan Audit - 2017
consultants to provide a range of expected revenues on their next round of projections, instead of only providing one scenario as they have in the past. On March 23, 2017, revenue estimates were provided to the RTA Board that included a baseline forecast as well as optimistic and pessimistic forecasts of economic growth.
Sales Tax Revenue Estimates Show Prior Shortfalls and Predict Future Shortfalls
While the models used to project RTA Plan revenues are solid, there is still uncertainty about whether revenues will be sufficient to finish the remaining RTA Plan projects given the past and projected shortfalls. As shown in Figure 8, the original RTA Plan sales tax projections of approximately $2 billion and the subsequent projection in 2010 of nearly $1.9 billion did not materialize—largely due to the economic recession that occurred during the first half of the RTA Plan timeframe. In fact, RTA Plan sales tax revenues through June 30, 2016 totaled $702 million, which was $202 million less than the 2005 forecasted amount of $904 million expected to be collected over the first ten years of the RTA Plan. Toward the end of the nationwide recession in 2010, actual RTA Plan sales tax revenues aligned more closely with the revenue forecast. In fact, the 2013 projections of $233.2 million for fiscal years 2013 through 2016 were only about 5 percent (or $11.6 million) more than actual collections of $221.6 million. RTA Plan partners have been working with the University of Arizona to update the RTA Plan sales tax projections that was presented to the RTA Board on March 23, 2017—after audit fieldwork was completed. Figure 8: Comparison of Actual Revenues with RTA Plan Sales Tax Revenue Projections
Source: Projections prepared by University of Arizona, Eller College of Management; Actuals from RTA Audited Financial Statements fiscal year 2007 to fiscal year 2015 and unaudited Income Statement for fiscal year 2016 (RTA Financial Audit for fiscal year 2016 in-progress at time of RTA Performance Audit).
$702M Total Sales Tax Revenues
through 6/30/16
$-
$20,000
$40,000
$60,000
$80,000
$100,000
$120,000
$140,000
$160,000
$180,000
$200,000
Sale
s Ta
x R
eve
nu
es in
Th
ou
san
ds
20-Year RTA Plan Timeframe
Sales Tax Revenue Projections & Actuals
2005 Projections 2010 Projections 2013 Projections Actuals

SJOBERGEVASHENK 38 PAG RTA Plan Audit - 2017
Cash Flow Is Regularly Monitored to Address Forecasted Revenue Shortfalls
As part of its administration of the RTA Plan, the RTA employs processes to track and monitor cash flow and debt administration that appear reasonable. In addition to assistance and guidance provided by external professional financial advisors, cash flow and debt management are overseen by various RTA committees and the RTA Board and are annually audited by an external auditor. As part of the RTA Plan, a cash flow plan was developed that considered the use and issuance of approximately $347 million in bonds over the plan’s 20-year timeframe. According to the cash flow plan, RTA Plan expenses were to exceed revenues by fiscal year 2011 and, as such, would require bond funding to cover the difference. For activities in subsequent years, the initial cash flow plan estimated seven bond issuances each with a 4-year repayment term with the last one planned for issuance in fiscal year 2023. Since 2006, the RTA has issued two revenue bonds totaling $300 million—$150 million in fiscal year 2010-2011 and $150 million in fiscal year 2014. For both bond issuances, the debt service coverage ratios calculated at the time of issuance were at least 2.0, which according to the Pima Association of Government’s Finance Director, is the minimum goal for RTA. Debt service ratios measure the cash flow available to pay current debt, with a ratio of 1 or more indicating there is sufficient income to pay debt. For instance, for the Series 2011 bonds, the debt service coverage ratio was 4.7 and for the Series 2014 bonds, the coverage was 2.24, meaning there are very sufficient levels to pay the associated debt. While the 2014 coverage ratio was lower than in 2011, it still afforded the RTA a very adequate debt position. Currently, the RTA’s debt service coverage ratio is 2.7 and comparable to other sales tax measures in the nation. For example, in San Diego, California, its sales tax measure reported a coverage of 2.62 as of September 2016. On an annual basis, RTA’s financial auditors review the RTA Plan’s debt administration and the RTA’s ability to repay the debt in the short term as well as long term. Also, RTA management regularly meets with its financial advisor to discuss the RTA Plan’s investment choices and financial position and updates the RTA Board, Technical Management Committee, and Citizens Accountability for Regional Transportation Committee at each meeting on the RTA Plan’s financial condition.
Other Roadway Funding Is Committed to Deliver Remaining RTA Plan Projects
Although sales tax revenues have aligned more closely with projections in recent years, total sales tax revenues over the life of the RTA Plan will likely be significantly less than the approximately $2 billion estimated in 2005 and committed to the RTA Plan—largely due to the recession. Specifically, with $702 million of RTA Plan sales tax revenues collected through June 30, 2016 and another $1 billion projected to be collected for the remainder of the RTA Plan, total sales tax revenues are forecasted to reach approximately $1.7 billion. Even if the RTA Plan project costs and scopes remain the same, the program is expected to experience a revenue
SJOBERGEVASHENK 39 PAG RTA Plan Audit - 2017
shortfall of roughly $300 million. To cover the funding gap and allow remaining projects to start and be completed, other state funds, federal monies, and planned bond issuances are expected to cover the shortfall. Specifically, the RTA partners have agreed to redirect all federal surface transportation program funding available and state highway user revenue funds currently available for other non-RTA projects to potentially cash-strapped RTA Plan projects as needed. In August 2014, PAG directed its member agencies to not plan on using state highway users revenue funds and federal surface transportation funding for non-RTA projects for fiscal years 2016 through 2020. According to the Pima Association of Governments (PAG), the anticipated sales tax revenue shortfall in future years is also mitigated by higher than initially anticipated state highway user fund revenues and federal surface transportation funding expected over the next 10 years. Over the next 10 years, state highway user revenue fund money is estimated at $173 million and federal surface transportation program funding is estimated at $102 million, for a combined total of $275 million, which would almost cover the entire $300 million sales tax shortfall. Moreover, RTA Plan partners are also discussing options to issue a third series of bonds—possibly in 2017—to address cash flow and pay for RTA Plan projects in the near term. Further, to help the RTA better monitor cash flow needs and ensure funding is available, local jurisdictions have agreed to inform the RTA of shovel-ready construction projects prior to advertising the bid.26 We also learned from several local jurisdictions that while the recession negatively impacted sales tax revenues, construction bids also came in lower than anticipated—thus, allowing for the acceleration of many projects and capitalization on the lower costs. Thus, at this point, the RTA Plan partners seem well-positioned to complete the remaining RTA Plan projects as promised to the voters in 2006.
Transit Project Ranking Process Is Reasonable to Address Shortfalls
In 2011, in response to lower than expected RTA Plan revenues, several transit groups—including, the RTA, Transit Working Group, and City of Tucson—worked together to develop a “ranking system to evaluate implementing RTA transit projects based on need and coordination with other projects.” In this way, the groups could use the lower revenues to their maximum potential to deliver the RTA Plan projects following a systematic method to meet community needs and stretch limited dollars. To assess “need,” the three entities looked at ridership, cost, and vehicle availability among other factors. This ranking process was completed for both frequency improvements and route extensions outlined in the RTA Plan. As employed, this ranking process identified two proposed transit routes and a proposed transit service frequency improvement in the RTA Plan as duplicative to already existing routes. For example, the proposed Green Valley/Sahuarita Express route was identified as duplicative to the existing Route 421 and, thus, ranked at the bottom of the prioritization list for funding and
26 The term shovel-ready is used to describe construction projects where planning and engineering are substantially complete that with sufficient funding construction could begin within a very short time.
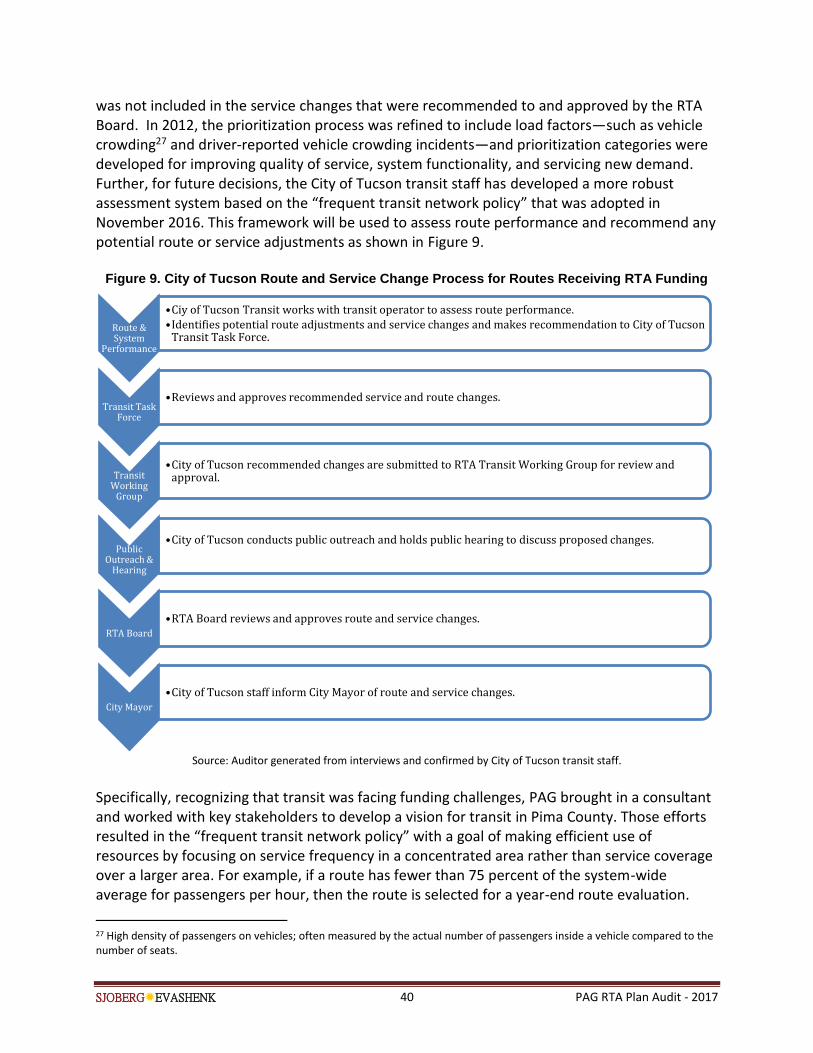
SJOBERGEVASHENK 40 PAG RTA Plan Audit - 2017
was not included in the service changes that were recommended to and approved by the RTA Board. In 2012, the prioritization process was refined to include load factors—such as vehicle crowding27 and driver-reported vehicle crowding incidents—and prioritization categories were developed for improving quality of service, system functionality, and servicing new demand. Further, for future decisions, the City of Tucson transit staff has developed a more robust assessment system based on the “frequent transit network policy” that was adopted in November 2016. This framework will be used to assess route performance and recommend any potential route or service adjustments as shown in Figure 9.
Figure 9. City of Tucson Route and Service Change Process for Routes Receiving RTA Funding
Source: Auditor generated from interviews and confirmed by City of Tucson transit staff.
Specifically, recognizing that transit was facing funding challenges, PAG brought in a consultant and worked with key stakeholders to develop a vision for transit in Pima County. Those efforts resulted in the “frequent transit network policy” with a goal of making efficient use of resources by focusing on service frequency in a concentrated area rather than service coverage over a larger area. For example, if a route has fewer than 75 percent of the system-wide average for passengers per hour, then the route is selected for a year-end route evaluation.
27 High density of passengers on vehicles; often measured by the actual number of passengers inside a vehicle compared to the number of seats.
Route & System
Performance
•Ciy of Tucson Transit works with transit operator to assess route performance.•Identifies potential route adjustments and service changes and makes recommendation to City of Tucson
Transit Task Force.
Transit Task Force
•Reviews and approves recommended service and route changes.
Transit Working
Group
•City of Tucson conducts public outreach and holds public hearing to discuss proposed changes. Public
Outreach & Hearing
•City of Tucson recommended changes are submitted to RTA Transit Working Group for review and approval.
RTA Board
•RTA Board reviews and approves route and service changes.
City Mayor
•City of Tucson staff inform City Mayor of route and service changes.

SJOBERGEVASHENK 41 PAG RTA Plan Audit - 2017
New Transit Funding Models Are Planned to Identify Reliable Funding for Future Services
In Pima County, the City of Tucson is the primary provider of transit services for bus, streetcar, vanpool, and paratransit services through external vendor contracts. In addition, the RTA has contracts with a private contractor and the Town of Oro Valley to provide rural and paratransit services outside the City of Tucson. As shown in Figure 10, the City of Tucson currently provides the majority of operating funding for transit services in the region, providing nearly $47.8 million, or 58.9 percent, of fiscal year 2016 funding. In addition, the RTA Plan provided approximately $6.9 million, or 8.5 percent, of funding for regional transit services in that same year, while the remaining funding came from local city and county funds and federal funding.
Figure 10: Fiscal Year 2016 Regional Transit Funding Contribution
Source: November 29, 2016 Alternative Transit Management Models: Agency and Service Delivery Options
With actual sales tax revenues falling short of estimates, the City of Tucson is working collaboratively with regional partners on establishing a regional transit authority that would help reduce reliance on the sales tax funding and allow the City of Tucson to keep existing or needed routes and maintain its fleet and structures, even if sales tax revenues do not materialize as initially planned. Specifically, the City of Tucson convened a Transit Stakeholder Advisory Group that explored several options and ultimately recommended the creation of a Metropolitan Public Transit Authority in November 2016, as allowed by A.R.S. Title 40, Chapter 6. The proposed Metropolitan Public Transit Authority would be an independent transit agency with a governing board elected by voters and a board of directors with decision-making authority using a proportional voting structure for member agencies based on funding contributions—rather than an equal one-vote-per-agency model. Depending on which agencies are interested in joining the Metropolitan Public Transit Authority as members, there are two board scenarios currently being proposed as shown in Figure 11.
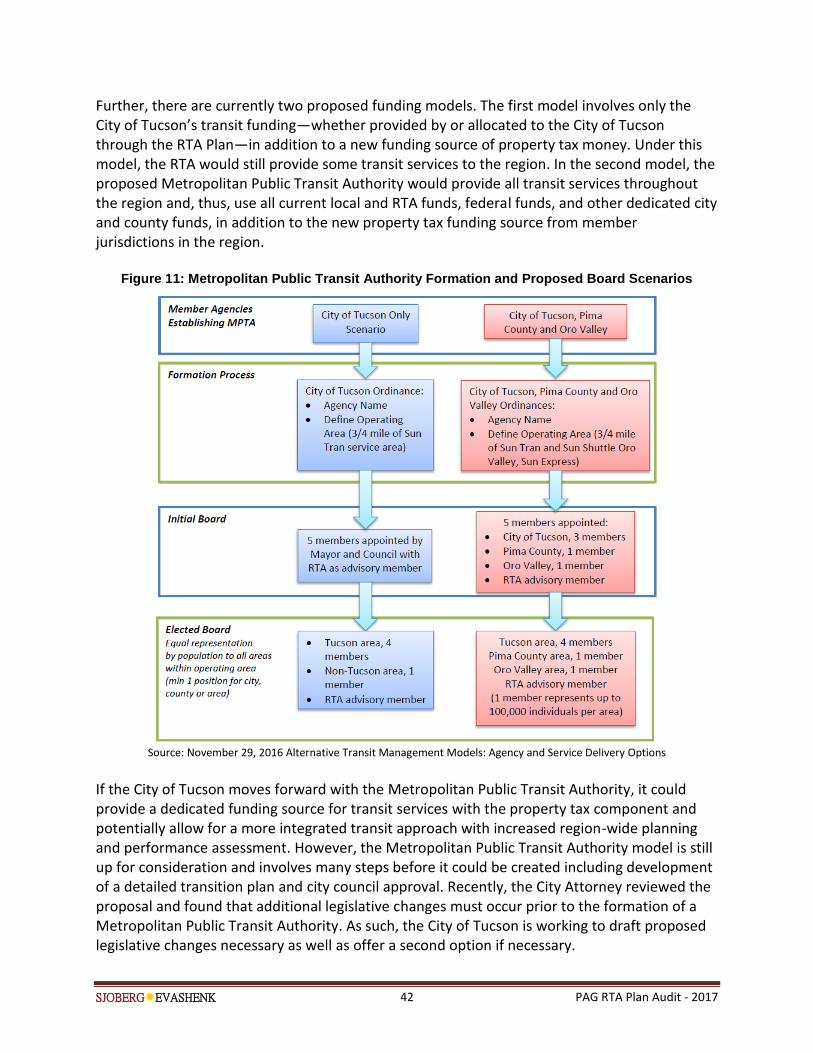
SJOBERGEVASHENK 42 PAG RTA Plan Audit - 2017
Further, there are currently two proposed funding models. The first model involves only the City of Tucson’s transit funding—whether provided by or allocated to the City of Tucson through the RTA Plan—in addition to a new funding source of property tax money. Under this model, the RTA would still provide some transit services to the region. In the second model, the proposed Metropolitan Public Transit Authority would provide all transit services throughout the region and, thus, use all current local and RTA funds, federal funds, and other dedicated city and county funds, in addition to the new property tax funding source from member jurisdictions in the region.
Figure 11: Metropolitan Public Transit Authority Formation and Proposed Board Scenarios
Source: November 29, 2016 Alternative Transit Management Models: Agency and Service Delivery Options
If the City of Tucson moves forward with the Metropolitan Public Transit Authority, it could provide a dedicated funding source for transit services with the property tax component and potentially allow for a more integrated transit approach with increased region-wide planning and performance assessment. However, the Metropolitan Public Transit Authority model is still up for consideration and involves many steps before it could be created including development of a detailed transition plan and city council approval. Recently, the City Attorney reviewed the proposal and found that additional legislative changes must occur prior to the formation of a Metropolitan Public Transit Authority. As such, the City of Tucson is working to draft proposed legislative changes necessary as well as offer a second option if necessary.
SJOBERGEVASHENK 43 PAG RTA Plan Audit - 2017
Chapter 4: Performance on Roadways Revealed Mixed Results
Because the Regional Transportation Authority (RTA) Plan was originally not designed with targets for performance outcomes, we cannot evaluate performance related to congestion, mobility, and connectivity over the first 10 years of the RTA Plan timeline. However, a future evaluation of performance outcomes should be possible because the Pima Association of Governments (PAG) established goals and targets in May 2016 as part of the 2045 Regional Mobility and Accessibility Plan28—the updated long-range transportation plan that includes the remaining RTA Plan projects. Over the past ten years, some performance data was captured and mainly used for modeling future conditions. The RTA’s modeling process typically only looks forward not backwards; thus, analyses were not used to compare projections to actuals. Historical data that was available related to traffic volume, safety, pavement condition, bridge condition, and employment rates showed a recovering economy with increased numbers of drivers and mixed performance outcome trends. Specifically, data indicated increased roadway congestion and declining bridge health, but also indicated improvements in safety and pavement conditions.29
RTA Has a Limited Performance Evaluation System in Place
While performance measures have been encouraged and discussed for several decades, the federal government is now mandating performance-based planning and development of certain performance indicators. These performance-based planning and measurement requirements are intended to increase accountability and transparency and improve project decision-making. Although the RTA regularly and specifically tracks and reports on performance outputs such as miles of roadways completed and sidewalks improved, it had a limited performance outcome evaluation system in place during the first half of the RTA Plan.
RTA Plan Has Performance Goals, but Specific Outcome Targets Were Not Defined
Although best practices have recommended using targets or standards for decades as part of any entity’s performance plan, it was only in 2012 with the passage of the Moving Ahead for Progress in the 21st Century Act (MAP-21), that federal law mandated that certain entities establish targets for performance related to transportation planning.30 Performance-based planning requirements were carried over with the subsequent passage of the Fixing America’s Surface Transportation (FAST) Act of 2015.
28 PAG’s 2045 Regional Mobility and Accessibility Plan, adopted May 26, 2016 29 This type of information was last published by PAG in its Regional Transportation System Performance Assessment 2005-2010, issued February 2013. Another report covering the next five years was in progress as of January 2017, as was a performance dashboard that will communicate performance results to the public on a more real-time basis. 30 Prior to MAP-21, the Government Performance and Results Act of 1993 set forth provisions to improve government performance management by setting goals and reporting progress. Subsequently, in April 1998, the U.S. Government Accountability Office Publication GAO/GGD-10.1.20 An Evaluator’s Guide to Assessing Agency Annual Performance Plans suggested reporting on what actions were needed to achieve or modify performance goals not met and directed entities to use targets as part of effective performance-measurement.
SJOBERGEVASHENK 44 PAG RTA Plan Audit - 2017
It was not until 2017, however, that the Federal Highway Administration finalized federal rules related to performance-based planning—five years after the passage of the initial law. State departments of transportation are now working with metropolitan planning organizations like the Pima Association of Governments (PAG) to set realistic targets for implementation of an effective performance measurement system. More recent guidance from the Transportation Research Board also cites realistic targets as one of the characteristics of an effective performance-measurement system allowing program staff to monitor progress towards goals and enhance public transparency and accountability.31 Yet, in 2006 when the RTA Plan was created, these outcome targets were not included—not unlike other transportation entities nationwide. When the RTA Plan was being developed, goals were established related to areas such as multimodal expansion, integrated transportation choices, safety, accessibility, and unobstructed mobility. Each specific ballot project selected had at least one type of project benefits such as “expanding travel capacity and safety,” but the goals and benefits were not quantitatively defined to allow for evaluation against the goal or target. For instance, the expected outcome for safety projects was “to improve safety for pedestrians via the construction of sidewalk pedestrian crossings and Americans with Disabilities Act accessibility.” As such, the benefits outlined in the RTA Plan were captured at a broad level with no specific targets or performance outcomes. For instance, for the Tangerine Road: I-10 to La Canada Drive project (ballot item #1), the outlined benefits were broad in nature, such as “add capacity” and “connect two other main routes” as well as “provide safety improvements,” rather than outcome specific such as “reduce delay by XX minutes.” The potential broad impact of these projects in improving mobility and safety was considered and run through sophisticated computer planning models at the time, but there were no specific performance outcome measures or targets established in the RTA Plan directly related to congestion, mobility, connectivity, or integration.
Instead, the RTA tracks and reports its performance toward the RTA Plan goals based on outputs and the delivery of the 51 promised projects. Accomplishments tracked and reported relate to outputs such as number of projects completed, expenditures to date, and miles added. Yet, without specific targets and benefits, the RTA has not been able to evaluate performance outcomes related to the RTA Plan projects. Ideally, RTA should have a performance monitoring system in place to compare project outcome data against the set targets. Results should be made public, and stakeholder participation, as well as communication and collaboration among agencies, should occur throughout the process. However, challenges exist for the RTA in capturing performance data to measure progress toward ultimate outcomes.
31 The Transportation Research Board is a division of the National Research Council well-known in the transportation industry for providing research to public officials and transportation practitioners.

SJOBERGEVASHENK 45 PAG RTA Plan Audit - 2017
Specifically:
Traffic volume data is available, but is mostly used for planning and modeling purposes.
Most accurate congestion data using global positioning system tools has to be purchased from third-party vendors.
Neither volume nor traffic counts are consistently performed on the same intersections, nor the same roadway segments, to create consistent and comprehensive data sets.
Studies are conducted prior to a project start, but there are limited “after” studies to show trend or impact of project improvements. This is not unlike other transportation entities, as finding the resources to conduct or pay for after studies is difficult.
Still, some performance outcome data was captured and reported by PAG. Specifically, in February 2013, PAG published an assessment report for calendar years 2005 through 2010 that provided results of its review of growth trends, travel conditions, and system improvements in Pima County.32 This assessment covered the period of time in which the region was struggling with a housing crisis and economic recession marked by lower than expected population growth. However, even with slowed growth, the assessment noted that the amount of congestion rose slightly. Between calendar years 2005 and 2010, there were roughly 145 miles of new roadway built adding 3.2 percent more roadway to the system; yet, vehicle miles of travel increased at a higher rate of 13.5 percent. By 2010, approximately 5.5 percent of travel in the region was in heavy to severe congestion conditions, up from 4.5 percent in 2005. PAG expects to issue another report for the subsequent five-year period between calendar years 2010 through 2015 in mid-2017. While these performance assessments provide valuable outcome data to the public, the RTA should work with PAG to improve its practices by releasing the information on a more frequent basis.
Performance Outcomes Will Be Measurable during Second-Half of the RTA Plan
While targets were not established when the RTA Plan was created, PAG has recently set formal targets as part of its long-range transportation plan incorporated known as the 2045 Regional Mobility and Accessibility Plan. When developing its required long-term transportation plan, PAG set performance targets in May 2016 that will allow it to track and evaluate system performance with the completion of the remaining RTA Plan projects against these targets. In accordance with recent federal guidance on developing performance-based transportation plans, the PAG’s 2045 Regional Mobility and Accessibility Plan considers traffic demand and congestion relief, travel volume forecasts, system continuity, accessibility, integration and connectivity, revenue availability, and project readiness for the future projects. As depicted in Figure 12, the framework of performance-based planning and programming is an iterative cycle that starts with overarching goals that are linked to performance monitoring of specific projects and investment strategies which lead back to refining the goals, measures, and targets.
32 PAG’s 2005-2010 Regional Transportation System Performance Assessment, February 2013.
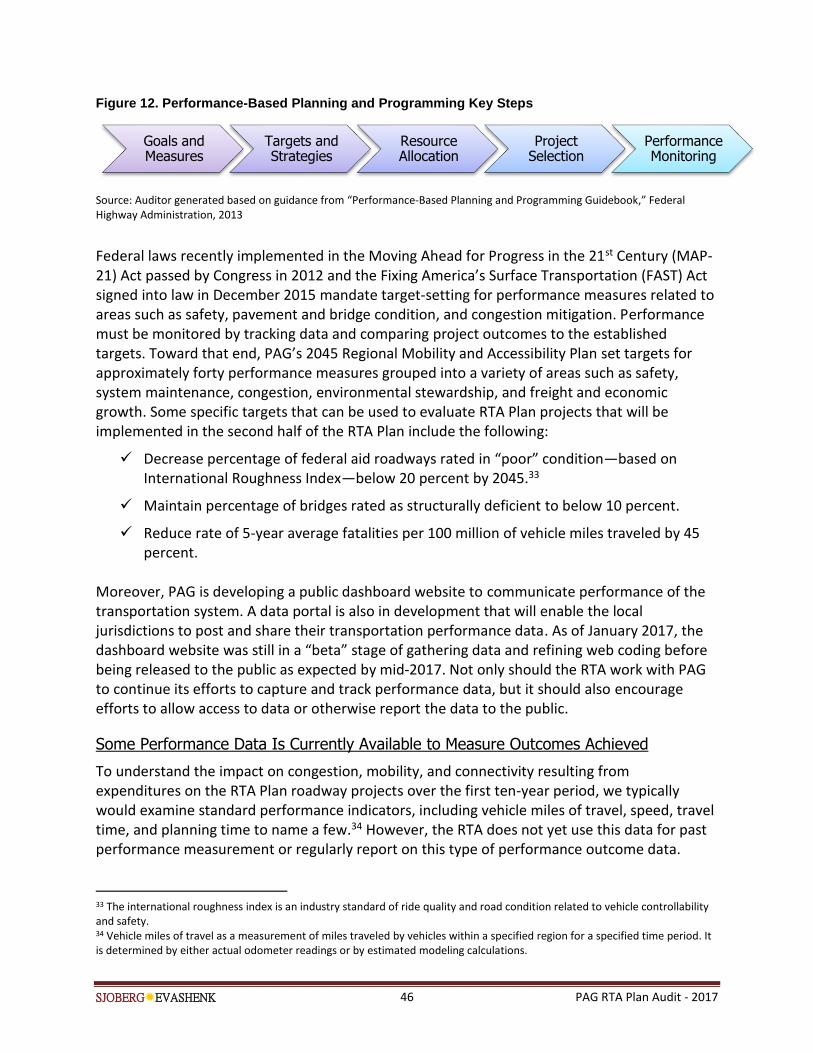
SJOBERGEVASHENK 46 PAG RTA Plan Audit - 2017
Figure 12. Performance-Based Planning and Programming Key Steps
Source: Auditor generated based on guidance from “Performance-Based Planning and Programming Guidebook,” Federal Highway Administration, 2013
Federal laws recently implemented in the Moving Ahead for Progress in the 21st Century (MAP-21) Act passed by Congress in 2012 and the Fixing America’s Surface Transportation (FAST) Act signed into law in December 2015 mandate target-setting for performance measures related to areas such as safety, pavement and bridge condition, and congestion mitigation. Performance must be monitored by tracking data and comparing project outcomes to the established targets. Toward that end, PAG’s 2045 Regional Mobility and Accessibility Plan set targets for approximately forty performance measures grouped into a variety of areas such as safety, system maintenance, congestion, environmental stewardship, and freight and economic growth. Some specific targets that can be used to evaluate RTA Plan projects that will be implemented in the second half of the RTA Plan include the following:
Decrease percentage of federal aid roadways rated in “poor” condition—based on International Roughness Index—below 20 percent by 2045.33
Maintain percentage of bridges rated as structurally deficient to below 10 percent.
Reduce rate of 5-year average fatalities per 100 million of vehicle miles traveled by 45 percent.
Moreover, PAG is developing a public dashboard website to communicate performance of the transportation system. A data portal is also in development that will enable the local jurisdictions to post and share their transportation performance data. As of January 2017, the dashboard website was still in a “beta” stage of gathering data and refining web coding before being released to the public as expected by mid-2017. Not only should the RTA work with PAG to continue its efforts to capture and track performance data, but it should also encourage efforts to allow access to data or otherwise report the data to the public.
Some Performance Data Is Currently Available to Measure Outcomes Achieved
To understand the impact on congestion, mobility, and connectivity resulting from expenditures on the RTA Plan roadway projects over the first ten-year period, we typically would examine standard performance indicators, including vehicle miles of travel, speed, travel time, and planning time to name a few.34 However, the RTA does not yet use this data for past performance measurement or regularly report on this type of performance outcome data.
33 The international roughness index is an industry standard of ride quality and road condition related to vehicle controllability and safety. 34 Vehicle miles of travel as a measurement of miles traveled by vehicles within a specified region for a specified time period. It is determined by either actual odometer readings or by estimated modeling calculations.
Goals and Measures
Targets and Strategies
Resource Allocation
Project Selection
Performance Monitoring
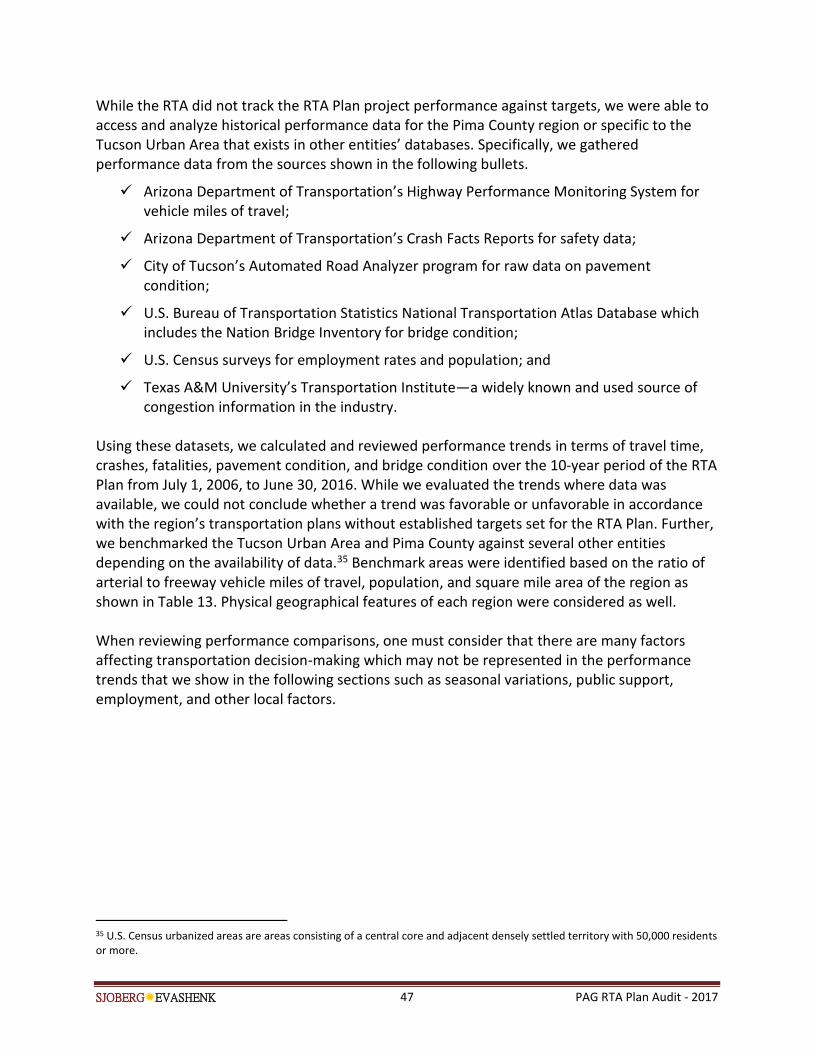
SJOBERGEVASHENK 47 PAG RTA Plan Audit - 2017
While the RTA did not track the RTA Plan project performance against targets, we were able to access and analyze historical performance data for the Pima County region or specific to the Tucson Urban Area that exists in other entities’ databases. Specifically, we gathered performance data from the sources shown in the following bullets.
Arizona Department of Transportation’s Highway Performance Monitoring System for vehicle miles of travel;
Arizona Department of Transportation’s Crash Facts Reports for safety data;
City of Tucson’s Automated Road Analyzer program for raw data on pavement condition;
U.S. Bureau of Transportation Statistics National Transportation Atlas Database which includes the Nation Bridge Inventory for bridge condition;
U.S. Census surveys for employment rates and population; and
Texas A&M University’s Transportation Institute—a widely known and used source of congestion information in the industry.
Using these datasets, we calculated and reviewed performance trends in terms of travel time, crashes, fatalities, pavement condition, and bridge condition over the 10-year period of the RTA Plan from July 1, 2006, to June 30, 2016. While we evaluated the trends where data was available, we could not conclude whether a trend was favorable or unfavorable in accordance with the region’s transportation plans without established targets set for the RTA Plan. Further, we benchmarked the Tucson Urban Area and Pima County against several other entities depending on the availability of data.35 Benchmark areas were identified based on the ratio of arterial to freeway vehicle miles of travel, population, and square mile area of the region as shown in Table 13. Physical geographical features of each region were considered as well. When reviewing performance comparisons, one must consider that there are many factors affecting transportation decision-making which may not be represented in the performance trends that we show in the following sections such as seasonal variations, public support, employment, and other local factors.
35 U.S. Census urbanized areas are areas consisting of a central core and adjacent densely settled territory with 50,000 residents or more.
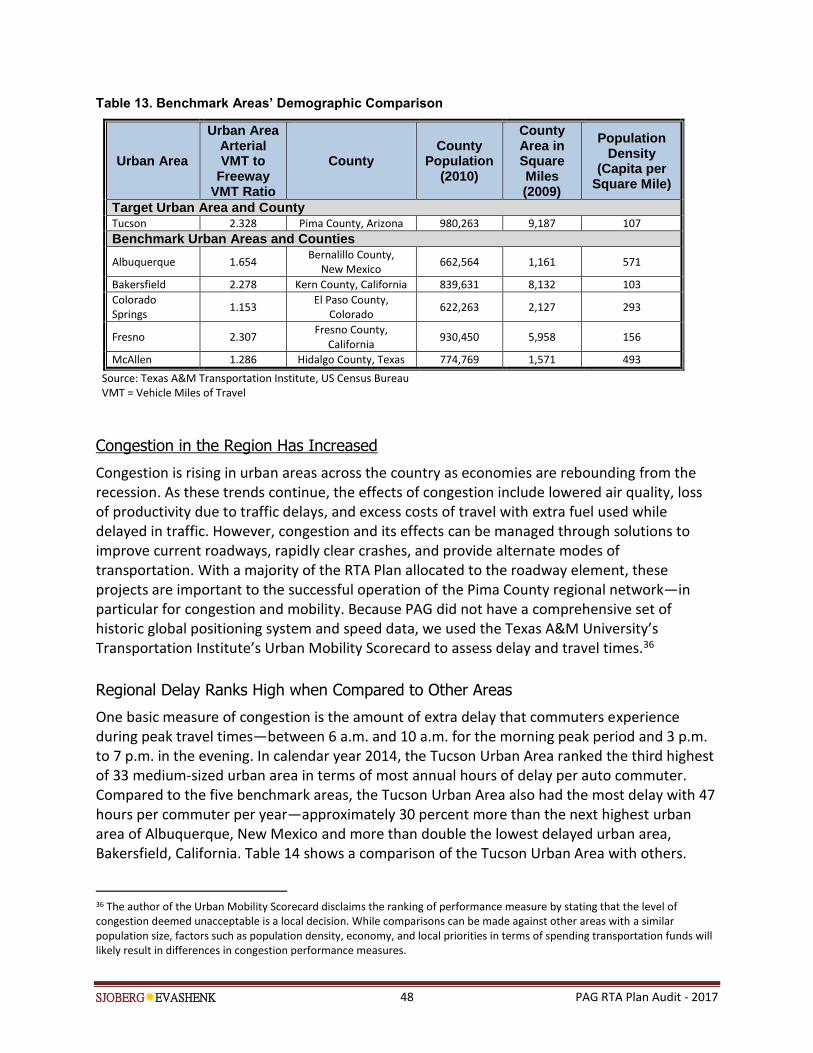
SJOBERGEVASHENK 48 PAG RTA Plan Audit - 2017
Table 13. Benchmark Areas’ Demographic Comparison
Urban Area
Urban Area Arterial VMT to
Freeway VMT Ratio
County County
Population (2010)
County Area in Square Miles (2009)
Population Density
(Capita per Square Mile)
Target Urban Area and County Tucson 2.328 Pima County, Arizona 980,263 9,187 107
Benchmark Urban Areas and Counties
Albuquerque 1.654 Bernalillo County,
New Mexico 662,564 1,161 571
Bakersfield 2.278 Kern County, California 839,631 8,132 103
Colorado Springs
1.153 El Paso County,
Colorado 622,263 2,127 293
Fresno 2.307 Fresno County,
California 930,450 5,958 156
McAllen 1.286 Hidalgo County, Texas 774,769 1,571 493
Source: Texas A&M Transportation Institute, US Census Bureau VMT = Vehicle Miles of Travel
Congestion in the Region Has Increased
Congestion is rising in urban areas across the country as economies are rebounding from the recession. As these trends continue, the effects of congestion include lowered air quality, loss of productivity due to traffic delays, and excess costs of travel with extra fuel used while delayed in traffic. However, congestion and its effects can be managed through solutions to improve current roadways, rapidly clear crashes, and provide alternate modes of transportation. With a majority of the RTA Plan allocated to the roadway element, these projects are important to the successful operation of the Pima County regional network—in particular for congestion and mobility. Because PAG did not have a comprehensive set of historic global positioning system and speed data, we used the Texas A&M University’s Transportation Institute’s Urban Mobility Scorecard to assess delay and travel times.36
Regional Delay Ranks High when Compared to Other Areas
One basic measure of congestion is the amount of extra delay that commuters experience during peak travel times—between 6 a.m. and 10 a.m. for the morning peak period and 3 p.m. to 7 p.m. in the evening. In calendar year 2014, the Tucson Urban Area ranked the third highest of 33 medium-sized urban area in terms of most annual hours of delay per auto commuter. Compared to the five benchmark areas, the Tucson Urban Area also had the most delay with 47 hours per commuter per year—approximately 30 percent more than the next highest urban area of Albuquerque, New Mexico and more than double the lowest delayed urban area, Bakersfield, California. Table 14 shows a comparison of the Tucson Urban Area with others.
36 The author of the Urban Mobility Scorecard disclaims the ranking of performance measure by stating that the level of congestion deemed unacceptable is a local decision. While comparisons can be made against other areas with a similar population size, factors such as population density, economy, and local priorities in terms of spending transportation funds will likely result in differences in congestion performance measures.
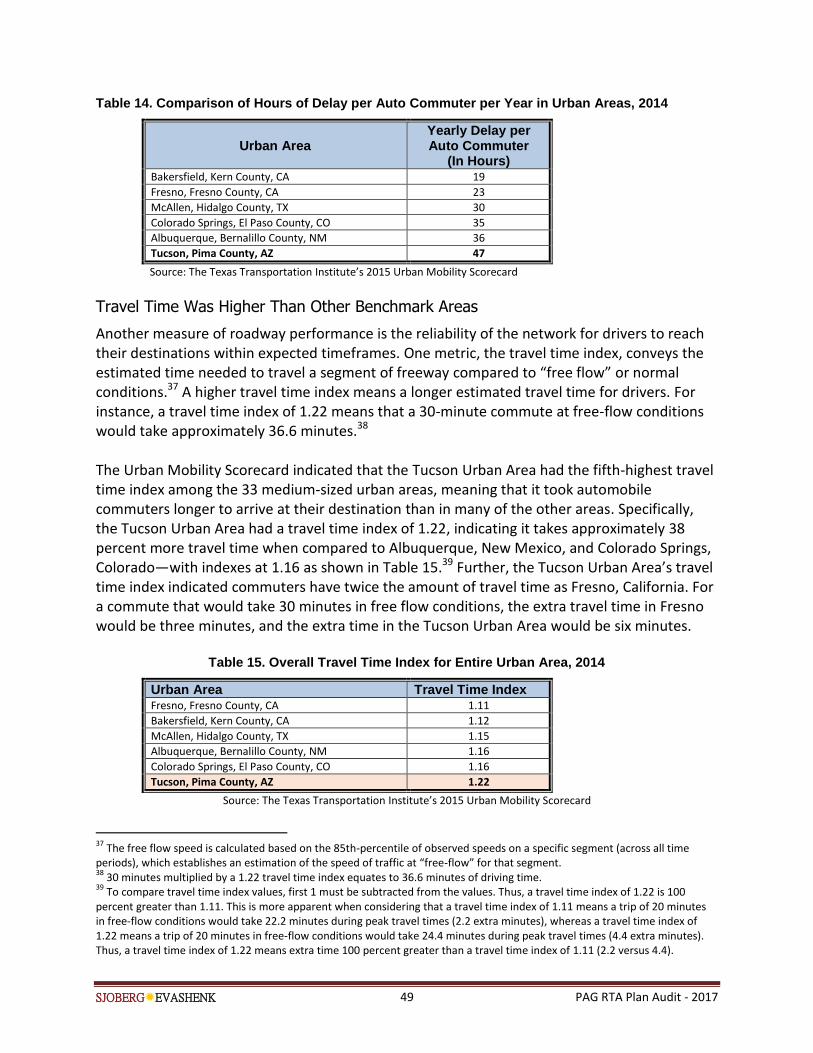
SJOBERGEVASHENK 49 PAG RTA Plan Audit - 2017
Table 14. Comparison of Hours of Delay per Auto Commuter per Year in Urban Areas, 2014
Urban Area Yearly Delay per Auto Commuter
(In Hours) Bakersfield, Kern County, CA 19
Fresno, Fresno County, CA 23
McAllen, Hidalgo County, TX 30
Colorado Springs, El Paso County, CO 35
Albuquerque, Bernalillo County, NM 36
Tucson, Pima County, AZ 47
Source: The Texas Transportation Institute’s 2015 Urban Mobility Scorecard
Travel Time Was Higher Than Other Benchmark Areas
Another measure of roadway performance is the reliability of the network for drivers to reach their destinations within expected timeframes. One metric, the travel time index, conveys the estimated time needed to travel a segment of freeway compared to “free flow” or normal conditions.37 A higher travel time index means a longer estimated travel time for drivers. For instance, a travel time index of 1.22 means that a 30-minute commute at free-flow conditions would take approximately 36.6 minutes.38 The Urban Mobility Scorecard indicated that the Tucson Urban Area had the fifth-highest travel time index among the 33 medium-sized urban areas, meaning that it took automobile commuters longer to arrive at their destination than in many of the other areas. Specifically, the Tucson Urban Area had a travel time index of 1.22, indicating it takes approximately 38 percent more travel time when compared to Albuquerque, New Mexico, and Colorado Springs, Colorado—with indexes at 1.16 as shown in Table 15.39 Further, the Tucson Urban Area’s travel time index indicated commuters have twice the amount of travel time as Fresno, California. For a commute that would take 30 minutes in free flow conditions, the extra travel time in Fresno would be three minutes, and the extra time in the Tucson Urban Area would be six minutes.
Table 15. Overall Travel Time Index for Entire Urban Area, 2014
Urban Area Travel Time Index Fresno, Fresno County, CA 1.11
Bakersfield, Kern County, CA 1.12
McAllen, Hidalgo County, TX 1.15
Albuquerque, Bernalillo County, NM 1.16
Colorado Springs, El Paso County, CO 1.16
Tucson, Pima County, AZ 1.22
Source: The Texas Transportation Institute’s 2015 Urban Mobility Scorecard
37
The free flow speed is calculated based on the 85th-percentile of observed speeds on a specific segment (across all time periods), which establishes an estimation of the speed of traffic at “free-flow” for that segment. 38
30 minutes multiplied by a 1.22 travel time index equates to 36.6 minutes of driving time. 39
To compare travel time index values, first 1 must be subtracted from the values. Thus, a travel time index of 1.22 is 100 percent greater than 1.11. This is more apparent when considering that a travel time index of 1.11 means a trip of 20 minutes in free-flow conditions would take 22.2 minutes during peak travel times (2.2 extra minutes), whereas a travel time index of 1.22 means a trip of 20 minutes in free-flow conditions would take 24.4 minutes during peak travel times (4.4 extra minutes). Thus, a travel time index of 1.22 means extra time 100 percent greater than a travel time index of 1.11 (2.2 versus 4.4).
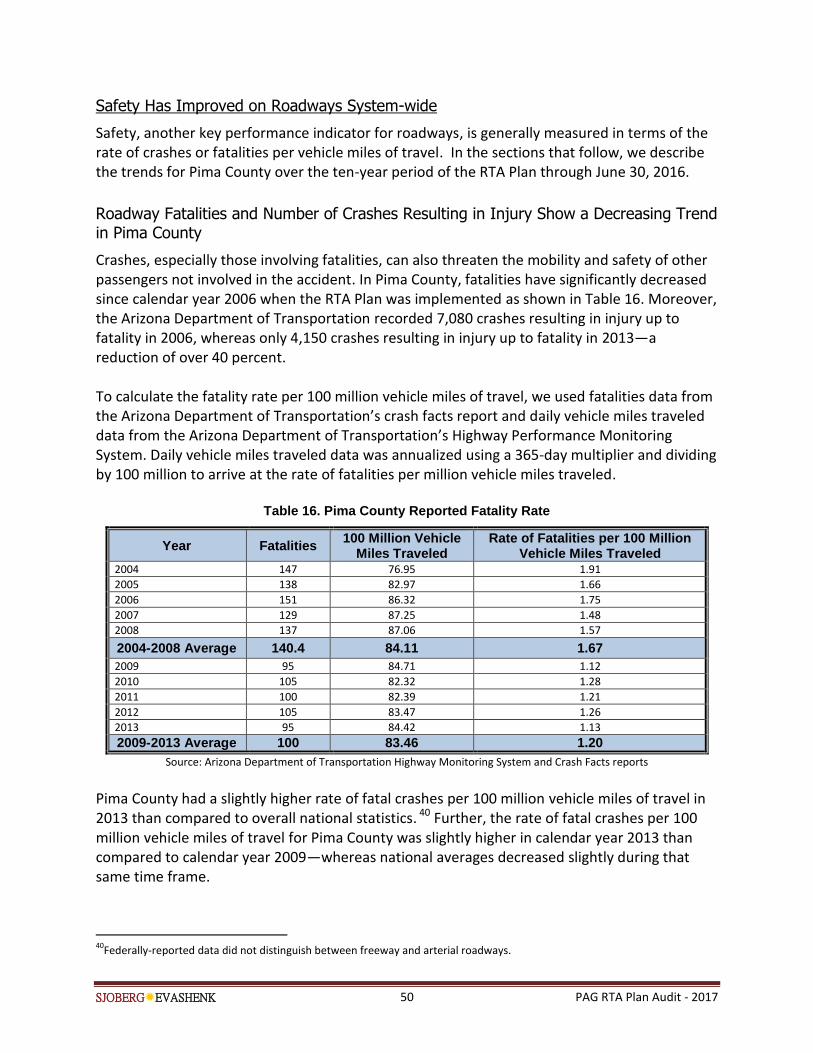
SJOBERGEVASHENK 50 PAG RTA Plan Audit - 2017
Safety Has Improved on Roadways System-wide
Safety, another key performance indicator for roadways, is generally measured in terms of the rate of crashes or fatalities per vehicle miles of travel. In the sections that follow, we describe the trends for Pima County over the ten-year period of the RTA Plan through June 30, 2016.
Roadway Fatalities and Number of Crashes Resulting in Injury Show a Decreasing Trend in Pima County
Crashes, especially those involving fatalities, can also threaten the mobility and safety of other passengers not involved in the accident. In Pima County, fatalities have significantly decreased since calendar year 2006 when the RTA Plan was implemented as shown in Table 16. Moreover, the Arizona Department of Transportation recorded 7,080 crashes resulting in injury up to fatality in 2006, whereas only 4,150 crashes resulting in injury up to fatality in 2013—a reduction of over 40 percent. To calculate the fatality rate per 100 million vehicle miles of travel, we used fatalities data from the Arizona Department of Transportation’s crash facts report and daily vehicle miles traveled data from the Arizona Department of Transportation’s Highway Performance Monitoring System. Daily vehicle miles traveled data was annualized using a 365-day multiplier and dividing by 100 million to arrive at the rate of fatalities per million vehicle miles traveled.
Table 16. Pima County Reported Fatality Rate
Year Fatalities 100 Million Vehicle
Miles Traveled Rate of Fatalities per 100 Million
Vehicle Miles Traveled 2004 147 76.95 1.91
2005 138 82.97 1.66
2006 151 86.32 1.75
2007 129 87.25 1.48
2008 137 87.06 1.57
2004-2008 Average 140.4 84.11 1.67
2009 95 84.71 1.12
2010 105 82.32 1.28
2011 100 82.39 1.21
2012 105 83.47 1.26
2013 95 84.42 1.13
2009-2013 Average 100 83.46 1.20
Source: Arizona Department of Transportation Highway Monitoring System and Crash Facts reports
Pima County had a slightly higher rate of fatal crashes per 100 million vehicle miles of travel in 2013 than compared to overall national statistics. 40 Further, the rate of fatal crashes per 100 million vehicle miles of travel for Pima County was slightly higher in calendar year 2013 than compared to calendar year 2009—whereas national averages decreased slightly during that same time frame.
40
Federally-reported data did not distinguish between freeway and arterial roadways.
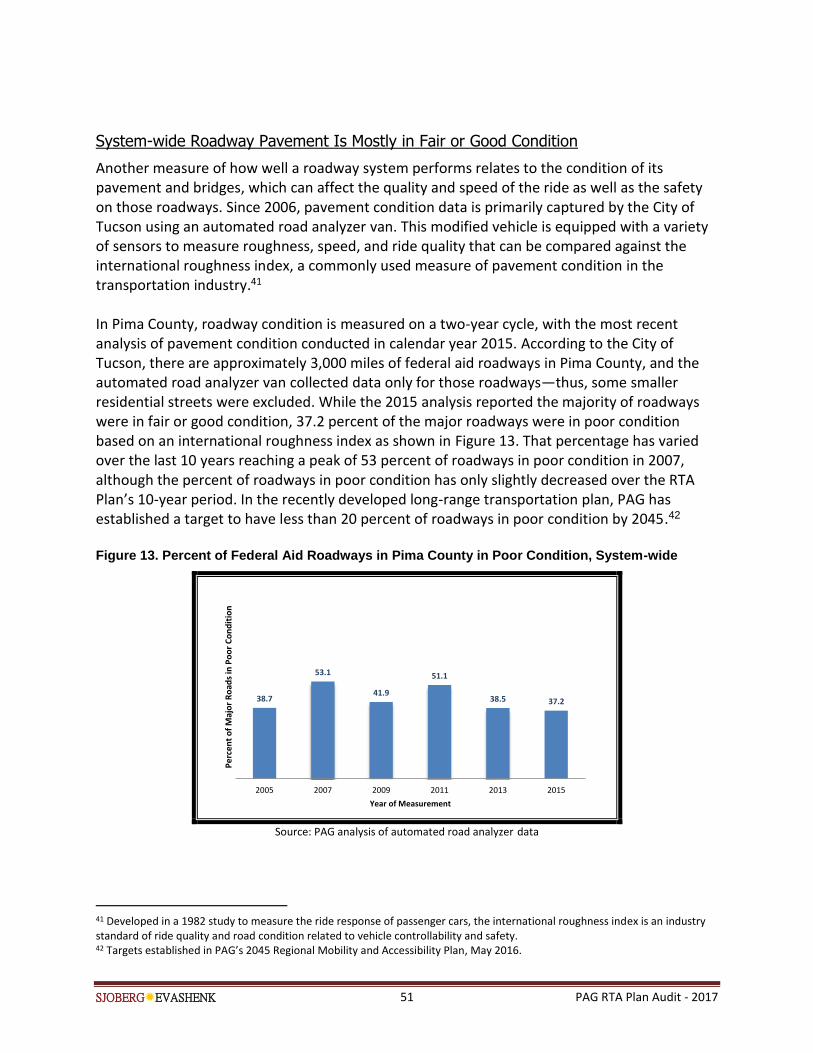
SJOBERGEVASHENK 51 PAG RTA Plan Audit - 2017
System-wide Roadway Pavement Is Mostly in Fair or Good Condition
Another measure of how well a roadway system performs relates to the condition of its pavement and bridges, which can affect the quality and speed of the ride as well as the safety on those roadways. Since 2006, pavement condition data is primarily captured by the City of Tucson using an automated road analyzer van. This modified vehicle is equipped with a variety of sensors to measure roughness, speed, and ride quality that can be compared against the international roughness index, a commonly used measure of pavement condition in the transportation industry.41 In Pima County, roadway condition is measured on a two-year cycle, with the most recent analysis of pavement condition conducted in calendar year 2015. According to the City of Tucson, there are approximately 3,000 miles of federal aid roadways in Pima County, and the automated road analyzer van collected data only for those roadways—thus, some smaller residential streets were excluded. While the 2015 analysis reported the majority of roadways were in fair or good condition, 37.2 percent of the major roadways were in poor condition based on an international roughness index as shown in Figure 13. That percentage has varied over the last 10 years reaching a peak of 53 percent of roadways in poor condition in 2007, although the percent of roadways in poor condition has only slightly decreased over the RTA Plan’s 10-year period. In the recently developed long-range transportation plan, PAG has established a target to have less than 20 percent of roadways in poor condition by 2045.42
Figure 13. Percent of Federal Aid Roadways in Pima County in Poor Condition, System-wide
Source: PAG analysis of automated road analyzer data
41 Developed in a 1982 study to measure the ride response of passenger cars, the international roughness index is an industry standard of ride quality and road condition related to vehicle controllability and safety. 42 Targets established in PAG’s 2045 Regional Mobility and Accessibility Plan, May 2016.
38.7
53.1
41.9
51.1
38.5 37.2
2005 2007 2009 2011 2013 2015
Pe
rce
nt
of
Maj
or
Ro
ads
in P
oo
r C
on
dit
ion
Year of Measurement
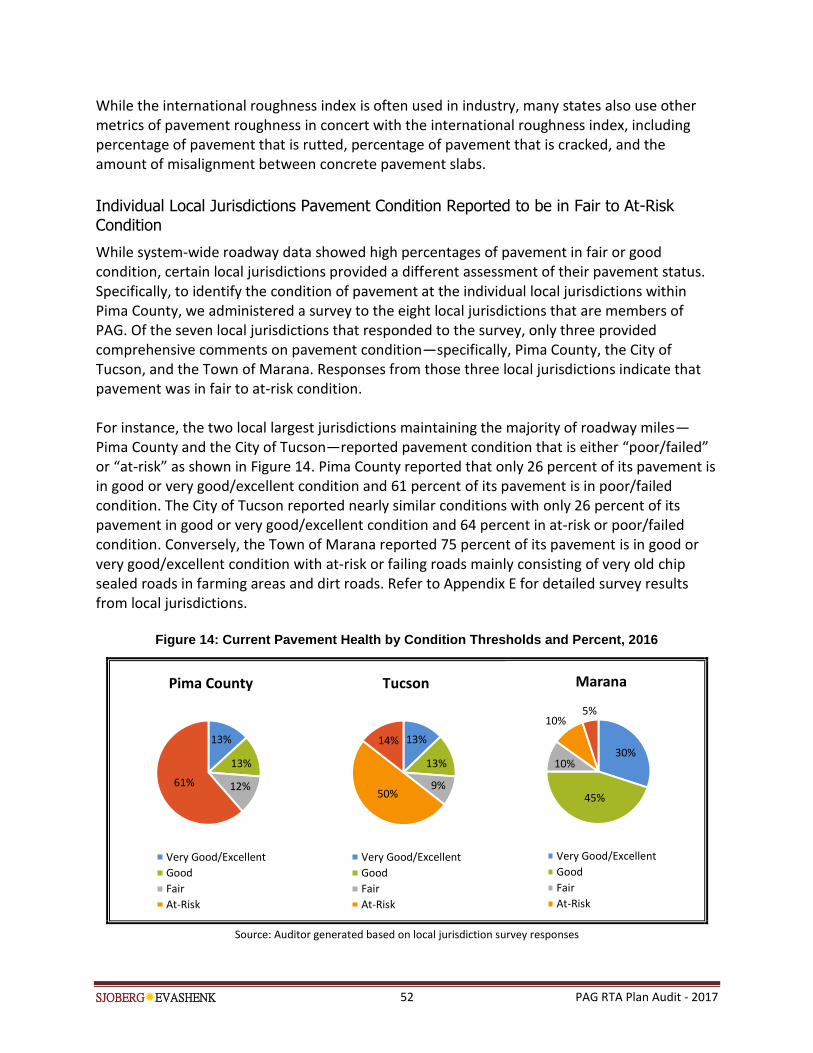
SJOBERGEVASHENK 52 PAG RTA Plan Audit - 2017
While the international roughness index is often used in industry, many states also use other metrics of pavement roughness in concert with the international roughness index, including percentage of pavement that is rutted, percentage of pavement that is cracked, and the amount of misalignment between concrete pavement slabs.
Individual Local Jurisdictions Pavement Condition Reported to be in Fair to At-Risk Condition
While system-wide roadway data showed high percentages of pavement in fair or good condition, certain local jurisdictions provided a different assessment of their pavement status. Specifically, to identify the condition of pavement at the individual local jurisdictions within Pima County, we administered a survey to the eight local jurisdictions that are members of PAG. Of the seven local jurisdictions that responded to the survey, only three provided comprehensive comments on pavement condition—specifically, Pima County, the City of Tucson, and the Town of Marana. Responses from those three local jurisdictions indicate that pavement was in fair to at-risk condition. For instance, the two local largest jurisdictions maintaining the majority of roadway miles—Pima County and the City of Tucson—reported pavement condition that is either “poor/failed” or “at-risk” as shown in Figure 14. Pima County reported that only 26 percent of its pavement is in good or very good/excellent condition and 61 percent of its pavement is in poor/failed condition. The City of Tucson reported nearly similar conditions with only 26 percent of its pavement in good or very good/excellent condition and 64 percent in at-risk or poor/failed condition. Conversely, the Town of Marana reported 75 percent of its pavement is in good or very good/excellent condition with at-risk or failing roads mainly consisting of very old chip sealed roads in farming areas and dirt roads. Refer to Appendix E for detailed survey results from local jurisdictions.
Figure 14: Current Pavement Health by Condition Thresholds and Percent, 2016
Source: Auditor generated based on local jurisdiction survey responses
13%
13%
12%61%
Pima County
Very Good/Excellent
Good
Fair
At-Risk
13%
13%
9%50%
14%
Tucson
Very Good/Excellent
Good
Fair
At-Risk
30%
45%
10%
10%5%
Marana
Very Good/Excellent
Good
Fair
At-Risk
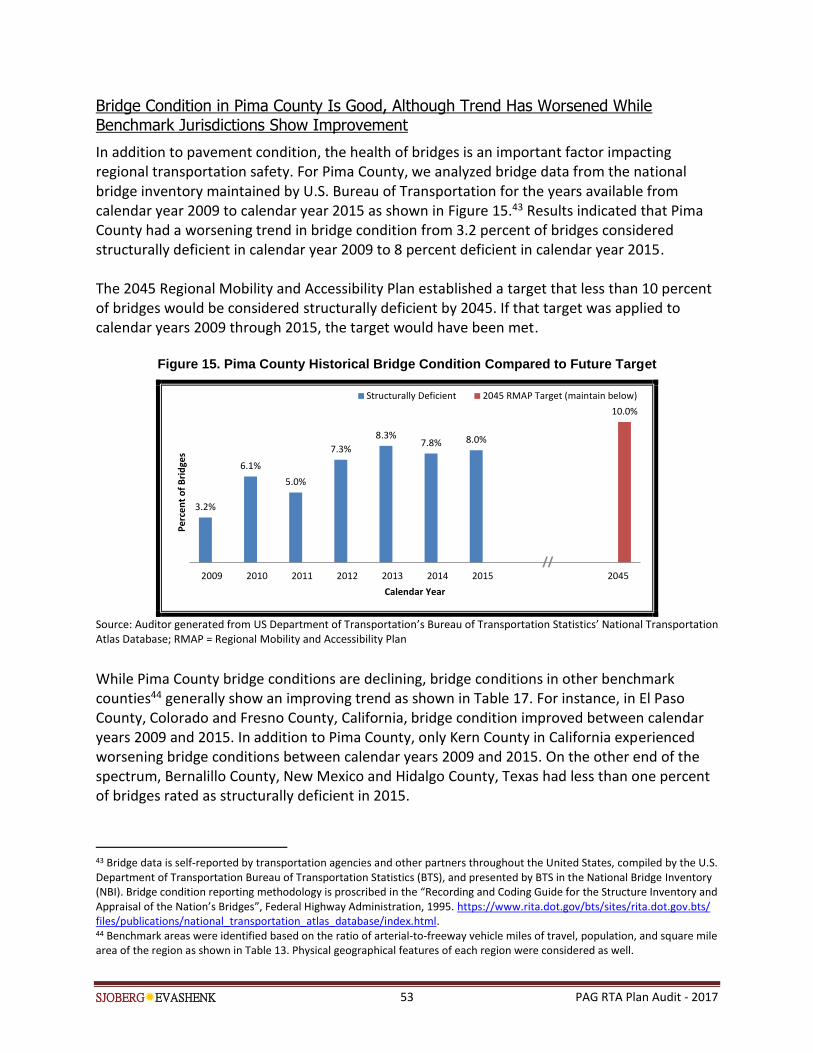
SJOBERGEVASHENK 53 PAG RTA Plan Audit - 2017
Bridge Condition in Pima County Is Good, Although Trend Has Worsened While Benchmark Jurisdictions Show Improvement
In addition to pavement condition, the health of bridges is an important factor impacting regional transportation safety. For Pima County, we analyzed bridge data from the national bridge inventory maintained by U.S. Bureau of Transportation for the years available from calendar year 2009 to calendar year 2015 as shown in Figure 15.43 Results indicated that Pima County had a worsening trend in bridge condition from 3.2 percent of bridges considered structurally deficient in calendar year 2009 to 8 percent deficient in calendar year 2015. The 2045 Regional Mobility and Accessibility Plan established a target that less than 10 percent of bridges would be considered structurally deficient by 2045. If that target was applied to calendar years 2009 through 2015, the target would have been met.
Figure 15. Pima County Historical Bridge Condition Compared to Future Target
Source: Auditor generated from US Department of Transportation’s Bureau of Transportation Statistics’ National Transportation Atlas Database; RMAP = Regional Mobility and Accessibility Plan
While Pima County bridge conditions are declining, bridge conditions in other benchmark counties44 generally show an improving trend as shown in Table 17. For instance, in El Paso County, Colorado and Fresno County, California, bridge condition improved between calendar years 2009 and 2015. In addition to Pima County, only Kern County in California experienced worsening bridge conditions between calendar years 2009 and 2015. On the other end of the spectrum, Bernalillo County, New Mexico and Hidalgo County, Texas had less than one percent of bridges rated as structurally deficient in 2015.
43 Bridge data is self-reported by transportation agencies and other partners throughout the United States, compiled by the U.S. Department of Transportation Bureau of Transportation Statistics (BTS), and presented by BTS in the National Bridge Inventory (NBI). Bridge condition reporting methodology is proscribed in the “Recording and Coding Guide for the Structure Inventory and Appraisal of the Nation’s Bridges”, Federal Highway Administration, 1995. https://www.rita.dot.gov/bts/sites/rita.dot.gov.bts/ files/publications/national_transportation_atlas_database/index.html. 44 Benchmark areas were identified based on the ratio of arterial-to-freeway vehicle miles of travel, population, and square mile area of the region as shown in Table 13. Physical geographical features of each region were considered as well.
3.2%
6.1%
5.0%
7.3%
8.3%7.8% 8.0%
10.0%
2009 2010 2011 2012 2013 2014 2015 2045
Pe
rce
nt
of
Bri
dge
s
Calendar Year
Structurally Deficient 2045 RMAP Target (maintain below)
//

SJOBERGEVASHENK 54 PAG RTA Plan Audit - 2017
Table 17. Comparison of Pima County Structurally Deficient Bridges to Peers, 2009 to 2015
Pima
County, Arizona
Kern County,
California
Hidalgo County, Texas
Fresno County,
California
El Paso County,
Colorado
Bernalillo County,
New Mexico
2009 3.2% 7.7% 0.2% 11.6% 5.9% 3.9%
2015 8.0% 10.2% 0.1% 10.5% 3.1% 0.8%
Percentage Point Change
4.8% 2.5% -0.1% -1.1% -2.8% -3.1%
Source: US Department of Transportation’s Bureau of Transportation Statistics’ National Transportation Atlas Database
Yet, Certain Individual Local Jurisdictions’ Bridges Were Reported in Good Condition
To identify the condition of bridges in the individual local jurisdictions within Pima County, we administered a survey to the eight local jurisdictions that are members of PAG. Of the seven local jurisdictions that responded to the survey, three provided comments indicating that most bridges are either in “good” or “fair” condition as shown in Figure 16. Not only did the Town of Marana indicate that its 25 bridges were in good condition, but also the City of Tucson responded that 70 percent of their 308 bridges were also in good condition.
Figure 16: Current Bridge Health by Condition Thresholds and Percent, 2016 Survey
Source: Auditor generated based on Local Jurisdiction Survey responses Note: “Good” means primary structural elements have no problems or minor deterioration. “Fair” means primary structural elements are sound, but may have minor loss, deterioration, cracking. “Poor” means bridges have advanced deficiencies such as deterioration or cracking, but bridge is still safe.
0%
20%
40%
60%
80%
100%
Marana Tucson Tohono O'odham
Bridge Deck Area Condition
Poor
Fair
Good
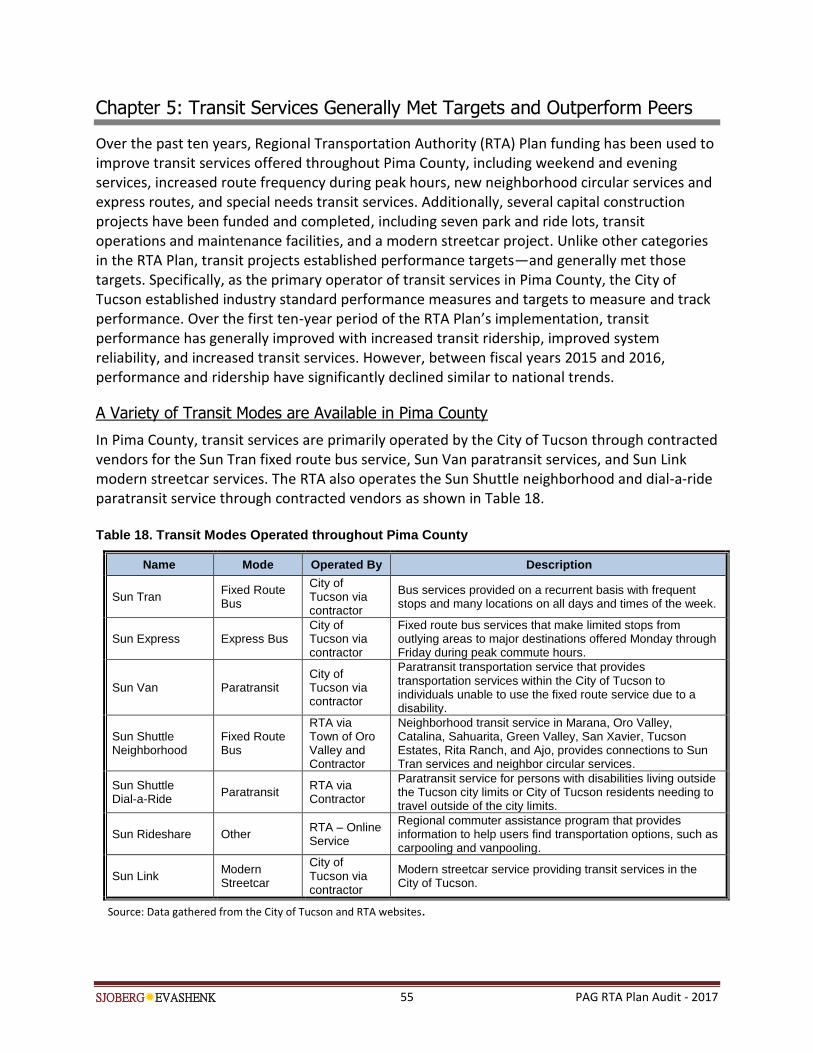
SJOBERGEVASHENK 55 PAG RTA Plan Audit - 2017
Chapter 5: Transit Services Generally Met Targets and Outperform Peers
Over the past ten years, Regional Transportation Authority (RTA) Plan funding has been used to improve transit services offered throughout Pima County, including weekend and evening services, increased route frequency during peak hours, new neighborhood circular services and express routes, and special needs transit services. Additionally, several capital construction projects have been funded and completed, including seven park and ride lots, transit operations and maintenance facilities, and a modern streetcar project. Unlike other categories in the RTA Plan, transit projects established performance targets—and generally met those targets. Specifically, as the primary operator of transit services in Pima County, the City of Tucson established industry standard performance measures and targets to measure and track performance. Over the first ten-year period of the RTA Plan’s implementation, transit performance has generally improved with increased transit ridership, improved system reliability, and increased transit services. However, between fiscal years 2015 and 2016, performance and ridership have significantly declined similar to national trends.
A Variety of Transit Modes are Available in Pima County
In Pima County, transit services are primarily operated by the City of Tucson through contracted vendors for the Sun Tran fixed route bus service, Sun Van paratransit services, and Sun Link modern streetcar services. The RTA also operates the Sun Shuttle neighborhood and dial-a-ride paratransit service through contracted vendors as shown in Table 18. Table 18. Transit Modes Operated throughout Pima County
Name Mode Operated By Description
Sun Tran Fixed Route Bus
City of Tucson via contractor
Bus services provided on a recurrent basis with frequent stops and many locations on all days and times of the week.
Sun Express Express Bus City of Tucson via contractor
Fixed route bus services that make limited stops from outlying areas to major destinations offered Monday through Friday during peak commute hours.
Sun Van Paratransit City of Tucson via contractor
Paratransit transportation service that provides transportation services within the City of Tucson to individuals unable to use the fixed route service due to a disability.
Sun Shuttle Neighborhood
Fixed Route Bus
RTA via Town of Oro Valley and Contractor
Neighborhood transit service in Marana, Oro Valley, Catalina, Sahuarita, Green Valley, San Xavier, Tucson Estates, Rita Ranch, and Ajo, provides connections to Sun Tran services and neighbor circular services.
Sun Shuttle Dial-a-Ride
Paratransit RTA via Contractor
Paratransit service for persons with disabilities living outside the Tucson city limits or City of Tucson residents needing to travel outside of the city limits.
Sun Rideshare Other RTA – Online Service
Regional commuter assistance program that provides information to help users find transportation options, such as carpooling and vanpooling.
Sun Link Modern Streetcar
City of Tucson via contractor
Modern streetcar service providing transit services in the City of Tucson.
Source: Data gathered from the City of Tucson and RTA websites.
SJOBERGEVASHENK 56 PAG RTA Plan Audit - 2017
In 2009, RTA funding was used to create a consistent regional “Sun” brand for Pima County transit services. This rebranding updated the look of vehicles across the county with the same color scheme and design, and renamed transit services to include the Sun brand.
Inconsistent Performance Reporting Exists Among Transit Service Providers
Measuring transit performance is somewhat different than measuring roadway performance. While roadways focus on congestion, speed, and mobility, transit operators typically evaluate performance outcomes such as cost efficiency of fare revenue subsidizing or covering operating costs, service effectiveness such as ridership and passengers per revenue hour and revenue mile, or system reliability in terms of trips completed and miles between failures. As discussed in the bullets that follow, a variety of data was collected and available to assess transit performance. However, within Pima County, there is no singular performance monitoring and reporting system or system-wide targets. Rather, the City of Tucson and the RTA collect and publicize performance data independently—although, that independent data is used to make system-wide and route-level changes. On-board surveys and studies provide additional information to the City of Tucson and RTA to help ensure both service providers are meeting the needs of Pima County residents.
Monthly Performance Reports: The City of Tucson-contracted transit operators are required to report the results of their Federal Transit Administration compliance in a monthly compliance report with data for on-time performance, number of preventable accidents, and miles between road calls as well as progress towards meeting its “Specific, Measureable, Achievable, Relevant, and Timebound” goals.45 Current goals include reducing customer complaints per 100,000 boardings by 1 percent and reducing preventable accidents per 100,000 miles by 2 percent.46 There are also monthly operations reports submitted with data on ridership, fare and revenues, expenses, and system safety and reliability. Importantly, each measure also includes a performance target developed collaboratively by the City of Tucson with its operators.
Transit Working Group Performance Reports: On a monthly basis, the RTA provides an update on the performance of RTA-contracted transit services comparing current system-wide ridership and passengers per hour to prior year data as well as ridership by route for the current month and year-to-date average.
On-Board Surveys: The City of Tucson conducts on-board surveys to better understand how customers use the transit system within the City of Tucson and throughout Pima County. The on-board survey captures customers’ origins and destinations, transit routes taken, time of trip, and transfers between routes to provide the City of Tucson data to guide future transit planning. Further, the City of Tucson conducted a before-and-after study of the Sun Link modern streetcar to evaluate the impact of the project in terms of service levels and ridership.
45 These types of goals are required by the Federal Transit Administration. 46 Boardings is the term used in industry to count a passenger of public transit systems.
SJOBERGEVASHENK 57 PAG RTA Plan Audit - 2017
While the City of Tucson has a robust performance monitoring and reporting system in place for its transit operations, a similar performance reporting system has not been established for RTA- contracted services. Specifically, the City of Tucson set performance targets for an array of metrics including ridership and service coverage, total expenses and fare revenues, and safety and system reliability. The contracted operators were required to collect and report performance data in monthly operations and compliance reports—both of which are available to the public on the City’s website. Although the RTA collected data related to service frequency, service cost, and fare revenue and had certain contractual performance targets related to on-time performance, preventative maintenance, collisions, and call center customer service, this data collected was not reported or available to the public. According to the RTA, it is in the process of establishing a performance monitoring system that will include goals and related targets. According to the Florida Department of Transportation, an effective performance monitoring system is based on goals and objectives. Goals and objectives, in turn, inform the performance targets and determine performance measurements to be collected, providing a standard against which performance can be evaluated. Without targets, the RTA is unable to connect goals and objectives to outcomes. Thus, the RTA should move forward with plans to develop transit targets and measure progress towards meeting transit goals. Further, current transit performance reporting was inconsistent and was not reported in one location easily located by taxpayers. To provide more consistent reporting for transit services provided throughout the region and better accountability to taxpayers, the RTA and the City of Tucson should work together to establish consistent transit performance reporting available in a central location.
Transit Ridership Increased over the 10-year RTA Plan, although Ridership Recently Declined
Between fiscal years 2007 and 2015, system-wide transit ridership increased from nearly 18.3 million to 21.5 million. However, as illustrated in Figure 17, between fiscal years 2015 and 2016 we noted declining ridership on Sun Tran, Sun Link, and Sun Shuttle. During this period, ridership declined from approximately 19.6 million to 15.7 million on the Sun Tran fixed route bus service, 992,000 to 953,000 on the Sun Link modern streetcar, and 226,000 to 191,000 on the Sun Shuttle neighborhood fixed route service.
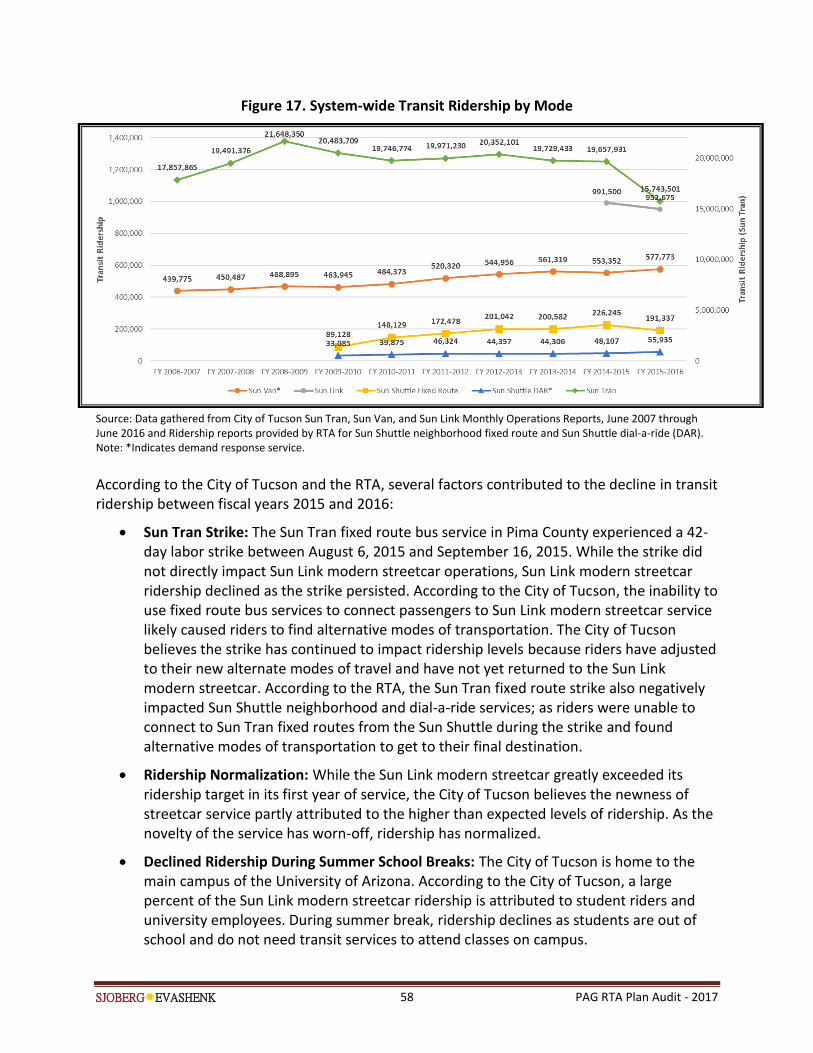
SJOBERGEVASHENK 58 PAG RTA Plan Audit - 2017
Figure 17. System-wide Transit Ridership by Mode
Source: Data gathered from City of Tucson Sun Tran, Sun Van, and Sun Link Monthly Operations Reports, June 2007 through June 2016 and Ridership reports provided by RTA for Sun Shuttle neighborhood fixed route and Sun Shuttle dial-a-ride (DAR). Note: *Indicates demand response service. According to the City of Tucson and the RTA, several factors contributed to the decline in transit ridership between fiscal years 2015 and 2016:
Sun Tran Strike: The Sun Tran fixed route bus service in Pima County experienced a 42-day labor strike between August 6, 2015 and September 16, 2015. While the strike did not directly impact Sun Link modern streetcar operations, Sun Link modern streetcar ridership declined as the strike persisted. According to the City of Tucson, the inability to use fixed route bus services to connect passengers to Sun Link modern streetcar service likely caused riders to find alternative modes of transportation. The City of Tucson believes the strike has continued to impact ridership levels because riders have adjusted to their new alternate modes of travel and have not yet returned to the Sun Link modern streetcar. According to the RTA, the Sun Tran fixed route strike also negatively impacted Sun Shuttle neighborhood and dial-a-ride services; as riders were unable to connect to Sun Tran fixed routes from the Sun Shuttle during the strike and found alternative modes of transportation to get to their final destination.
Ridership Normalization: While the Sun Link modern streetcar greatly exceeded its ridership target in its first year of service, the City of Tucson believes the newness of streetcar service partly attributed to the higher than expected levels of ridership. As the novelty of the service has worn-off, ridership has normalized.
Declined Ridership During Summer School Breaks: The City of Tucson is home to the main campus of the University of Arizona. According to the City of Tucson, a large percent of the Sun Link modern streetcar ridership is attributed to student riders and university employees. During summer break, ridership declines as students are out of school and do not need transit services to attend classes on campus.
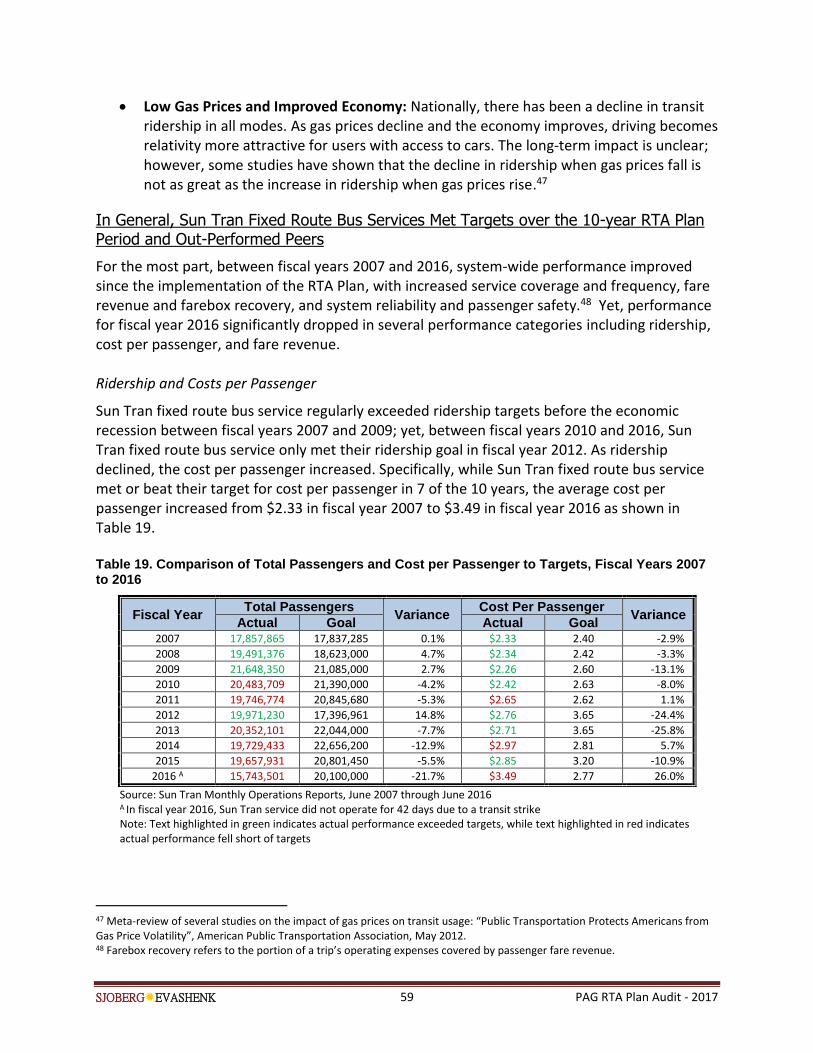
SJOBERGEVASHENK 59 PAG RTA Plan Audit - 2017
Low Gas Prices and Improved Economy: Nationally, there has been a decline in transit ridership in all modes. As gas prices decline and the economy improves, driving becomes relativity more attractive for users with access to cars. The long-term impact is unclear; however, some studies have shown that the decline in ridership when gas prices fall is not as great as the increase in ridership when gas prices rise.47
In General, Sun Tran Fixed Route Bus Services Met Targets over the 10-year RTA Plan Period and Out-Performed Peers
For the most part, between fiscal years 2007 and 2016, system-wide performance improved since the implementation of the RTA Plan, with increased service coverage and frequency, fare revenue and farebox recovery, and system reliability and passenger safety.48 Yet, performance for fiscal year 2016 significantly dropped in several performance categories including ridership, cost per passenger, and fare revenue. Ridership and Costs per Passenger
Sun Tran fixed route bus service regularly exceeded ridership targets before the economic recession between fiscal years 2007 and 2009; yet, between fiscal years 2010 and 2016, Sun Tran fixed route bus service only met their ridership goal in fiscal year 2012. As ridership declined, the cost per passenger increased. Specifically, while Sun Tran fixed route bus service met or beat their target for cost per passenger in 7 of the 10 years, the average cost per passenger increased from $2.33 in fiscal year 2007 to $3.49 in fiscal year 2016 as shown in Table 19. Table 19. Comparison of Total Passengers and Cost per Passenger to Targets, Fiscal Years 2007 to 2016
Source: Sun Tran Monthly Operations Reports, June 2007 through June 2016 A In fiscal year 2016, Sun Tran service did not operate for 42 days due to a transit strike Note: Text highlighted in green indicates actual performance exceeded targets, while text highlighted in red indicates actual performance fell short of targets
47 Meta-review of several studies on the impact of gas prices on transit usage: “Public Transportation Protects Americans from Gas Price Volatility”, American Public Transportation Association, May 2012. 48 Farebox recovery refers to the portion of a trip’s operating expenses covered by passenger fare revenue.
Fiscal Year Total Passengers
Variance Cost Per Passenger
Variance Actual Goal Actual Goal
2007 17,857,865 17,837,285 0.1% $2.33 2.40 -2.9%
2008 19,491,376 18,623,000 4.7% $2.34 2.42 -3.3%
2009 21,648,350 21,085,000 2.7% $2.26 2.60 -13.1%
2010 20,483,709 21,390,000 -4.2% $2.42 2.63 -8.0%
2011 19,746,774 20,845,680 -5.3% $2.65 2.62 1.1%
2012 19,971,230 17,396,961 14.8% $2.76 3.65 -24.4%
2013 20,352,101 22,044,000 -7.7% $2.71 3.65 -25.8%
2014 19,729,433 22,656,200 -12.9% $2.97 2.81 5.7%
2015 19,657,931 20,801,450 -5.5% $2.85 3.20 -10.9%
2016 A 15,743,501 20,100,000 -21.7% $3.49 2.77 26.0%
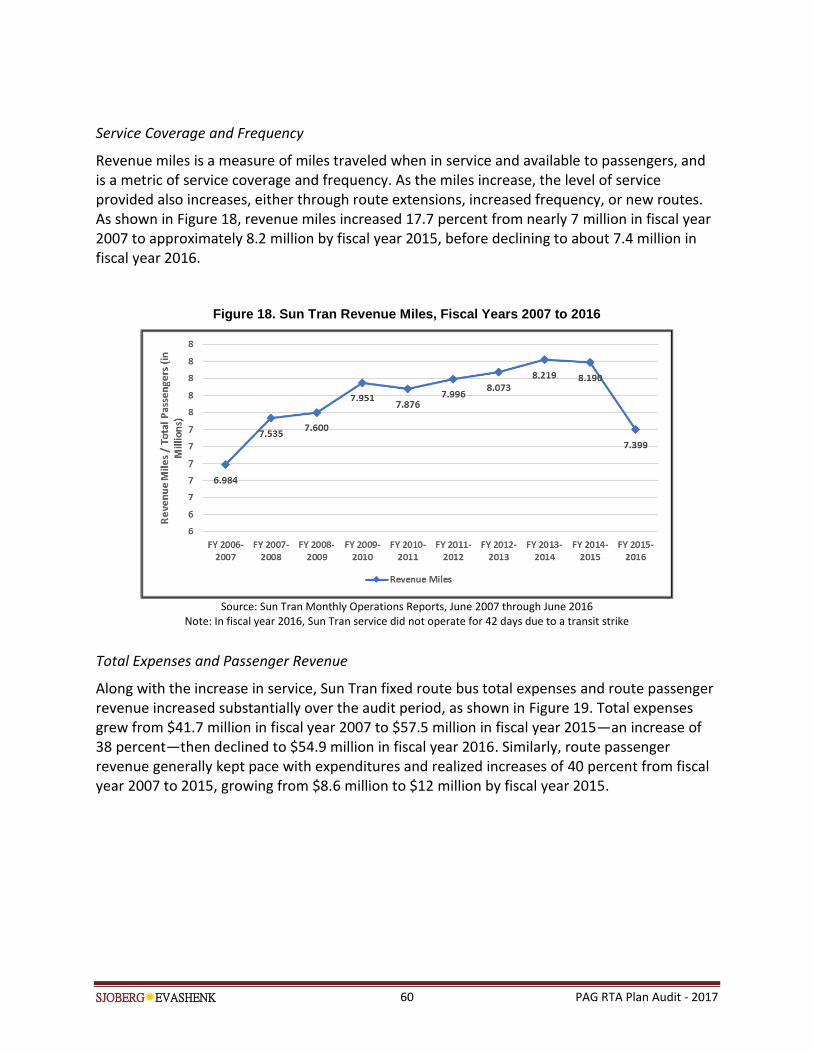
SJOBERGEVASHENK 60 PAG RTA Plan Audit - 2017
Service Coverage and Frequency
Revenue miles is a measure of miles traveled when in service and available to passengers, and is a metric of service coverage and frequency. As the miles increase, the level of service provided also increases, either through route extensions, increased frequency, or new routes. As shown in Figure 18, revenue miles increased 17.7 percent from nearly 7 million in fiscal year 2007 to approximately 8.2 million by fiscal year 2015, before declining to about 7.4 million in fiscal year 2016.
Figure 18. Sun Tran Revenue Miles, Fiscal Years 2007 to 2016
Source: Sun Tran Monthly Operations Reports, June 2007 through June 2016
Note: In fiscal year 2016, Sun Tran service did not operate for 42 days due to a transit strike
Total Expenses and Passenger Revenue
Along with the increase in service, Sun Tran fixed route bus total expenses and route passenger revenue increased substantially over the audit period, as shown in Figure 19. Total expenses grew from $41.7 million in fiscal year 2007 to $57.5 million in fiscal year 2015—an increase of 38 percent—then declined to $54.9 million in fiscal year 2016. Similarly, route passenger revenue generally kept pace with expenditures and realized increases of 40 percent from fiscal year 2007 to 2015, growing from $8.6 million to $12 million by fiscal year 2015.
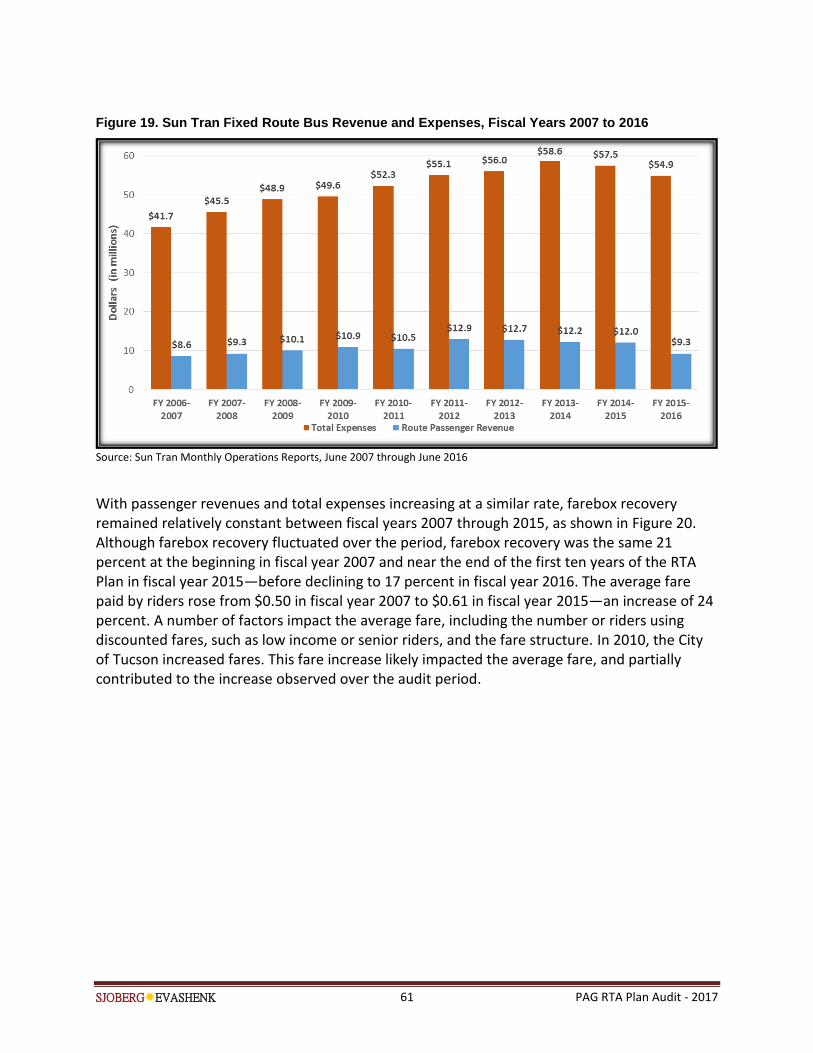
SJOBERGEVASHENK 61 PAG RTA Plan Audit - 2017
Figure 19. Sun Tran Fixed Route Bus Revenue and Expenses, Fiscal Years 2007 to 2016
Source: Sun Tran Monthly Operations Reports, June 2007 through June 2016
With passenger revenues and total expenses increasing at a similar rate, farebox recovery remained relatively constant between fiscal years 2007 through 2015, as shown in Figure 20. Although farebox recovery fluctuated over the period, farebox recovery was the same 21 percent at the beginning in fiscal year 2007 and near the end of the first ten years of the RTA Plan in fiscal year 2015—before declining to 17 percent in fiscal year 2016. The average fare paid by riders rose from $0.50 in fiscal year 2007 to $0.61 in fiscal year 2015—an increase of 24 percent. A number of factors impact the average fare, including the number or riders using discounted fares, such as low income or senior riders, and the fare structure. In 2010, the City of Tucson increased fares. This fare increase likely impacted the average fare, and partially contributed to the increase observed over the audit period.

SJOBERGEVASHENK 62 PAG RTA Plan Audit - 2017
Figure 20. Sun Tran Fixed Route Bus Farebox Recovery and Average Fare, Fiscal Years 2007 to 2016
Source: Sun Tran Monthly Operations Reports, June 2007 through June 2016
System Reliability and Passenger Safety
While an increase in service coverage and frequency is a positive outcome for users of the system, it also has the potential to strain the system and result in more vehicle and system failures—thus, lowering service quality. As shown in Table 20, however, our review found collision accidents and vehicle failures decreased over the 10-year period of the RTA Plan. Specifically, collision accidents per 100,000 passengers declined from 2.1 in fiscal year 2007 to 1.9 in fiscal year 2016. Additionally, miles between system failures increased significantly over the audit period improving from reported system failures occurring every 7,134 miles on average to every 12,041 miles on average between fiscal years 2007 and 2016—a nearly 69 percent improvement. Likewise, total vehicle failures decreased from 3,009 in fiscal year 2007 to 1,386 in fiscal year 2014—the last year for which data was available. This improvement is likely related to the purchase of new vehicles as the average age of Sun Tran fixed route bus fleet decreased from 7.89 years in 2006 to 5.2 years in fiscal year 2015. Moreover, on-time performance increased substantially from 80 percent to 91.2 percent between fiscal years 2007 and 2016. While collision accidents and system failures decreased over the audit period, passenger complaints per 100,000 passengers increased 58.8 percent between fiscal years 2007 and 2016.
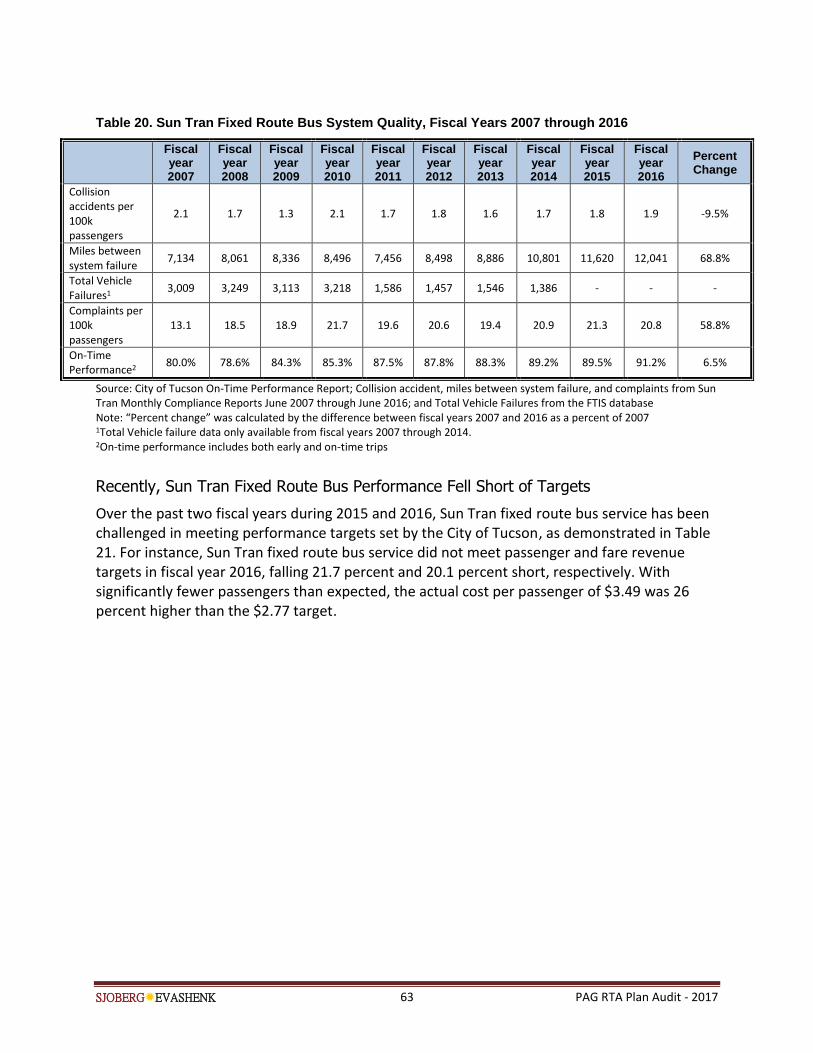
SJOBERGEVASHENK 63 PAG RTA Plan Audit - 2017
Table 20. Sun Tran Fixed Route Bus System Quality, Fiscal Years 2007 through 2016
Fiscal year 2007
Fiscal year 2008
Fiscal year 2009
Fiscal year 2010
Fiscal year 2011
Fiscal year 2012
Fiscal year 2013
Fiscal year 2014
Fiscal year 2015
Fiscal year 2016
Percent Change
Collision accidents per 100k passengers
2.1 1.7 1.3 2.1 1.7 1.8 1.6 1.7 1.8 1.9 -9.5%
Miles between system failure
7,134 8,061 8,336 8,496 7,456 8,498 8,886 10,801 11,620 12,041 68.8%
Total Vehicle Failures1
3,009 3,249 3,113 3,218 1,586 1,457 1,546 1,386 - - -
Complaints per 100k passengers
13.1 18.5 18.9 21.7 19.6 20.6 19.4 20.9 21.3 20.8 58.8%
On-Time Performance2 80.0% 78.6% 84.3% 85.3% 87.5% 87.8% 88.3% 89.2% 89.5% 91.2% 6.5%
Source: City of Tucson On-Time Performance Report; Collision accident, miles between system failure, and complaints from Sun Tran Monthly Compliance Reports June 2007 through June 2016; and Total Vehicle Failures from the FTIS database Note: “Percent change” was calculated by the difference between fiscal years 2007 and 2016 as a percent of 2007 1Total Vehicle failure data only available from fiscal years 2007 through 2014. 2On-time performance includes both early and on-time trips
Recently, Sun Tran Fixed Route Bus Performance Fell Short of Targets
Over the past two fiscal years during 2015 and 2016, Sun Tran fixed route bus service has been challenged in meeting performance targets set by the City of Tucson, as demonstrated in Table 21. For instance, Sun Tran fixed route bus service did not meet passenger and fare revenue targets in fiscal year 2016, falling 21.7 percent and 20.1 percent short, respectively. With significantly fewer passengers than expected, the actual cost per passenger of $3.49 was 26 percent higher than the $2.77 target.
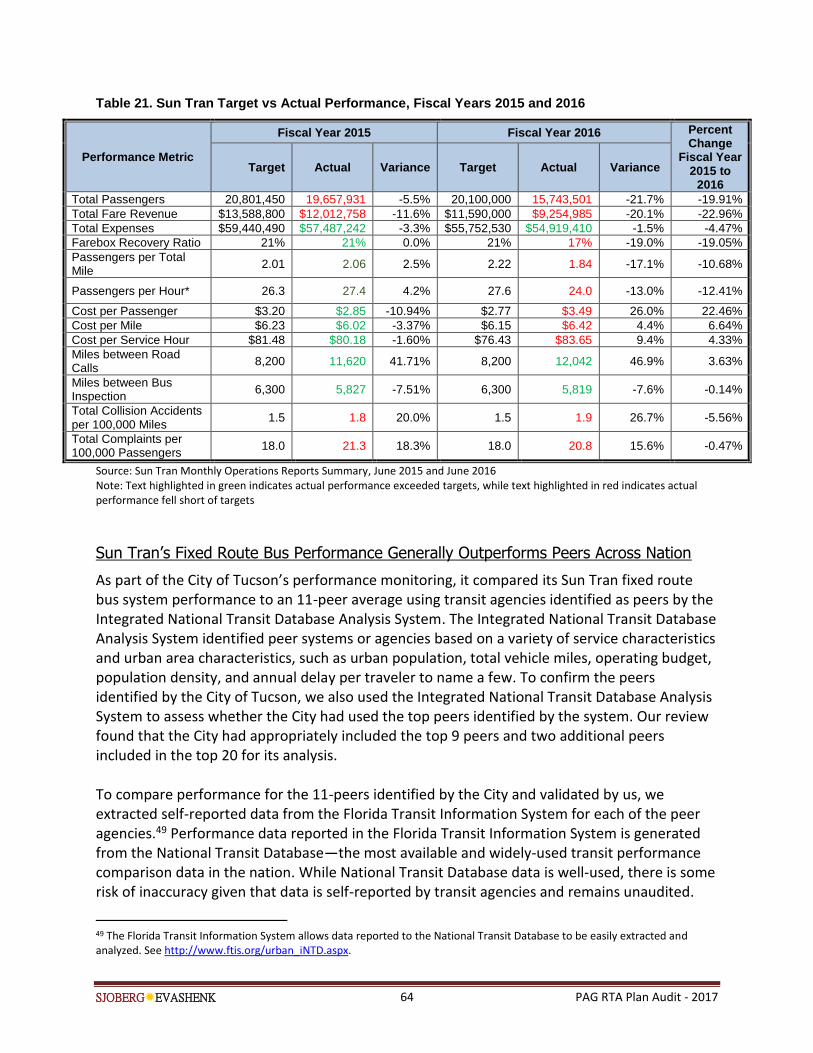
SJOBERGEVASHENK 64 PAG RTA Plan Audit - 2017
Table 21. Sun Tran Target vs Actual Performance, Fiscal Years 2015 and 2016
Performance Metric
Fiscal Year 2015 Fiscal Year 2016 Percent Change
Fiscal Year 2015 to
2016
Target Actual Variance Target Actual Variance
Total Passengers 20,801,450 19,657,931 -5.5% 20,100,000 15,743,501 -21.7% -19.91%
Total Fare Revenue $13,588,800 $12,012,758 -11.6% $11,590,000 $9,254,985 -20.1% -22.96%
Total Expenses $59,440,490 $57,487,242 -3.3% $55,752,530 $54,919,410 -1.5% -4.47%
Farebox Recovery Ratio 21% 21% 0.0% 21% 17% -19.0% -19.05%
Passengers per Total Mile
2.01 2.06 2.5% 2.22 1.84 -17.1% -10.68%
Passengers per Hour* 26.3 27.4 4.2% 27.6 24.0 -13.0% -12.41%
Cost per Passenger $3.20 $2.85 -10.94% $2.77 $3.49 26.0% 22.46%
Cost per Mile $6.23 $6.02 -3.37% $6.15 $6.42 4.4% 6.64%
Cost per Service Hour $81.48 $80.18 -1.60% $76.43 $83.65 9.4% 4.33%
Miles between Road Calls
8,200 11,620 41.71% 8,200 12,042 46.9% 3.63%
Miles between Bus Inspection
6,300 5,827 -7.51% 6,300 5,819 -7.6% -0.14%
Total Collision Accidents per 100,000 Miles
1.5 1.8 20.0% 1.5 1.9 26.7% -5.56%
Total Complaints per 100,000 Passengers
18.0 21.3 18.3% 18.0 20.8 15.6% -0.47%
Source: Sun Tran Monthly Operations Reports Summary, June 2015 and June 2016 Note: Text highlighted in green indicates actual performance exceeded targets, while text highlighted in red indicates actual performance fell short of targets
Sun Tran’s Fixed Route Bus Performance Generally Outperforms Peers Across Nation
As part of the City of Tucson’s performance monitoring, it compared its Sun Tran fixed route bus system performance to an 11-peer average using transit agencies identified as peers by the Integrated National Transit Database Analysis System. The Integrated National Transit Database Analysis System identified peer systems or agencies based on a variety of service characteristics and urban area characteristics, such as urban population, total vehicle miles, operating budget, population density, and annual delay per traveler to name a few. To confirm the peers identified by the City of Tucson, we also used the Integrated National Transit Database Analysis System to assess whether the City had used the top peers identified by the system. Our review found that the City had appropriately included the top 9 peers and two additional peers included in the top 20 for its analysis. To compare performance for the 11-peers identified by the City and validated by us, we extracted self-reported data from the Florida Transit Information System for each of the peer agencies.49 Performance data reported in the Florida Transit Information System is generated from the National Transit Database—the most available and widely-used transit performance comparison data in the nation. While National Transit Database data is well-used, there is some risk of inaccuracy given that data is self-reported by transit agencies and remains unaudited.
49 The Florida Transit Information System allows data reported to the National Transit Database to be easily extracted and analyzed. See http://www.ftis.org/urban_iNTD.aspx.
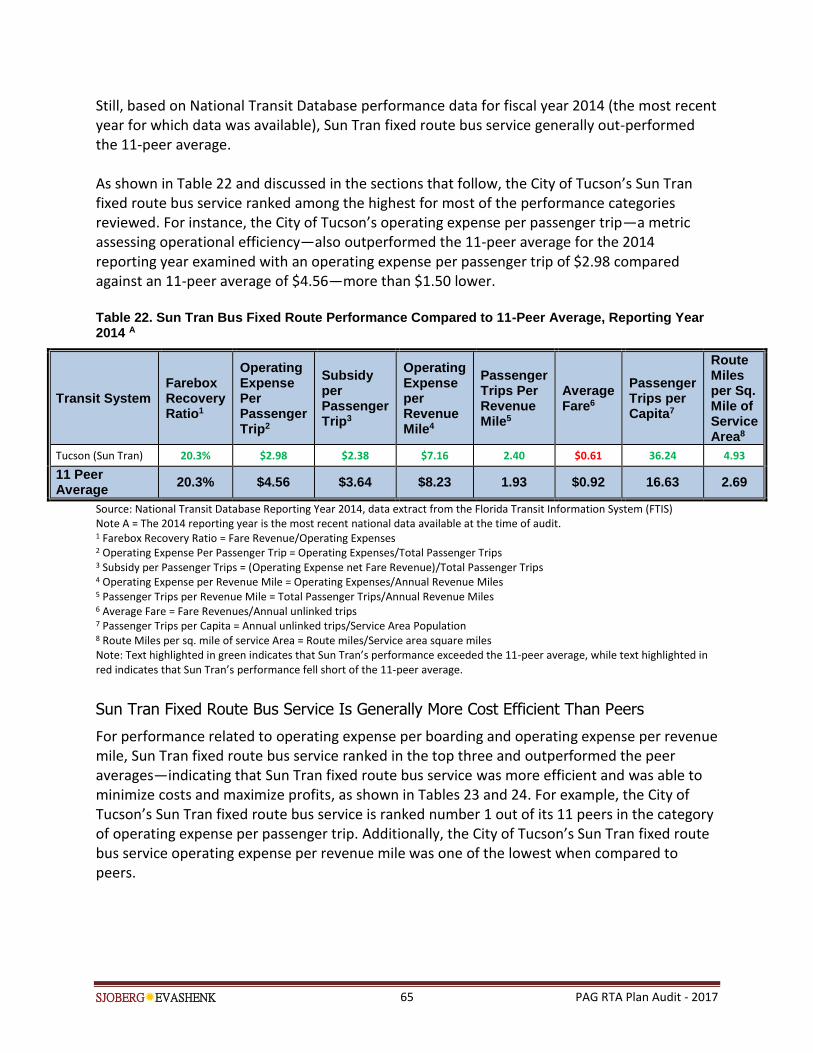
SJOBERGEVASHENK 65 PAG RTA Plan Audit - 2017
Still, based on National Transit Database performance data for fiscal year 2014 (the most recent year for which data was available), Sun Tran fixed route bus service generally out-performed the 11-peer average. As shown in Table 22 and discussed in the sections that follow, the City of Tucson’s Sun Tran fixed route bus service ranked among the highest for most of the performance categories reviewed. For instance, the City of Tucson’s operating expense per passenger trip—a metric assessing operational efficiency—also outperformed the 11-peer average for the 2014 reporting year examined with an operating expense per passenger trip of $2.98 compared against an 11-peer average of $4.56—more than $1.50 lower.
Table 22. Sun Tran Bus Fixed Route Performance Compared to 11-Peer Average, Reporting Year 2014 A
Transit System Farebox Recovery Ratio1
Operating Expense Per Passenger Trip2
Subsidy per Passenger Trip3
Operating Expense per Revenue Mile4
Passenger Trips Per Revenue Mile5
Average Fare6
Passenger Trips per Capita7
Route Miles per Sq. Mile of Service Area8
Tucson (Sun Tran) 20.3% $2.98 $2.38 $7.16 2.40 $0.61 36.24 4.93
11 Peer Average
20.3% $4.56 $3.64 $8.23 1.93 $0.92 16.63 2.69
Source: National Transit Database Reporting Year 2014, data extract from the Florida Transit Information System (FTIS) Note A = The 2014 reporting year is the most recent national data available at the time of audit. 1 Farebox Recovery Ratio = Fare Revenue/Operating Expenses 2 Operating Expense Per Passenger Trip = Operating Expenses/Total Passenger Trips 3 Subsidy per Passenger Trips = (Operating Expense net Fare Revenue)/Total Passenger Trips 4 Operating Expense per Revenue Mile = Operating Expenses/Annual Revenue Miles 5 Passenger Trips per Revenue Mile = Total Passenger Trips/Annual Revenue Miles 6 Average Fare = Fare Revenues/Annual unlinked trips 7 Passenger Trips per Capita = Annual unlinked trips/Service Area Population 8 Route Miles per sq. mile of service Area = Route miles/Service area square miles Note: Text highlighted in green indicates that Sun Tran’s performance exceeded the 11-peer average, while text highlighted in red indicates that Sun Tran’s performance fell short of the 11-peer average.
Sun Tran Fixed Route Bus Service Is Generally More Cost Efficient Than Peers
For performance related to operating expense per boarding and operating expense per revenue mile, Sun Tran fixed route bus service ranked in the top three and outperformed the peer averages—indicating that Sun Tran fixed route bus service was more efficient and was able to minimize costs and maximize profits, as shown in Tables 23 and 24. For example, the City of Tucson’s Sun Tran fixed route bus service is ranked number 1 out of its 11 peers in the category of operating expense per passenger trip. Additionally, the City of Tucson’s Sun Tran fixed route bus service operating expense per revenue mile was one of the lowest when compared to peers.
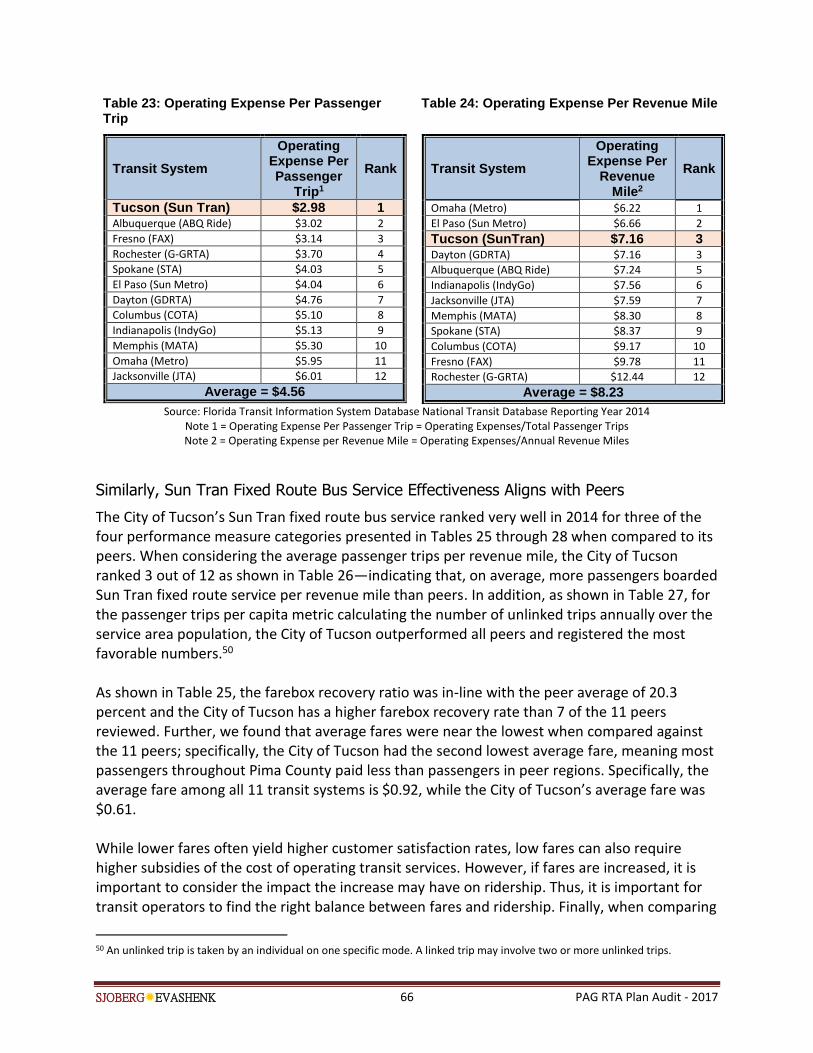
SJOBERGEVASHENK 66 PAG RTA Plan Audit - 2017
Table 23: Operating Expense Per Passenger Trip
Table 24: Operating Expense Per Revenue Mile
Transit System
Operating Expense Per Passenger
Trip1
Rank
Tucson (Sun Tran) $2.98 1 Albuquerque (ABQ Ride) $3.02 2
Fresno (FAX) $3.14 3
Rochester (G-GRTA) $3.70 4
Spokane (STA) $4.03 5
El Paso (Sun Metro) $4.04 6
Dayton (GDRTA) $4.76 7
Columbus (COTA) $5.10 8
Indianapolis (IndyGo) $5.13 9
Memphis (MATA) $5.30 10
Omaha (Metro) $5.95 11
Jacksonville (JTA) $6.01 12
Average = $4.56
Transit System
Operating Expense Per
Revenue Mile2
Rank
Omaha (Metro) $6.22 1
El Paso (Sun Metro) $6.66 2
Tucson (SunTran) $7.16 3 Dayton (GDRTA) $7.16 3
Albuquerque (ABQ Ride) $7.24 5
Indianapolis (IndyGo) $7.56 6
Jacksonville (JTA) $7.59 7
Memphis (MATA) $8.30 8
Spokane (STA) $8.37 9
Columbus (COTA) $9.17 10
Fresno (FAX) $9.78 11
Rochester (G-GRTA) $12.44 12
Average = $8.23
Source: Florida Transit Information System Database National Transit Database Reporting Year 2014 Note 1 = Operating Expense Per Passenger Trip = Operating Expenses/Total Passenger Trips Note 2 = Operating Expense per Revenue Mile = Operating Expenses/Annual Revenue Miles
Similarly, Sun Tran Fixed Route Bus Service Effectiveness Aligns with Peers
The City of Tucson’s Sun Tran fixed route bus service ranked very well in 2014 for three of the four performance measure categories presented in Tables 25 through 28 when compared to its peers. When considering the average passenger trips per revenue mile, the City of Tucson ranked 3 out of 12 as shown in Table 26—indicating that, on average, more passengers boarded Sun Tran fixed route service per revenue mile than peers. In addition, as shown in Table 27, for the passenger trips per capita metric calculating the number of unlinked trips annually over the service area population, the City of Tucson outperformed all peers and registered the most favorable numbers.50 As shown in Table 25, the farebox recovery ratio was in-line with the peer average of 20.3 percent and the City of Tucson has a higher farebox recovery rate than 7 of the 11 peers reviewed. Further, we found that average fares were near the lowest when compared against the 11 peers; specifically, the City of Tucson had the second lowest average fare, meaning most passengers throughout Pima County paid less than passengers in peer regions. Specifically, the average fare among all 11 transit systems is $0.92, while the City of Tucson’s average fare was $0.61. While lower fares often yield higher customer satisfaction rates, low fares can also require higher subsidies of the cost of operating transit services. However, if fares are increased, it is important to consider the impact the increase may have on ridership. Thus, it is important for transit operators to find the right balance between fares and ridership. Finally, when comparing
50 An unlinked trip is taken by an individual on one specific mode. A linked trip may involve two or more unlinked trips.
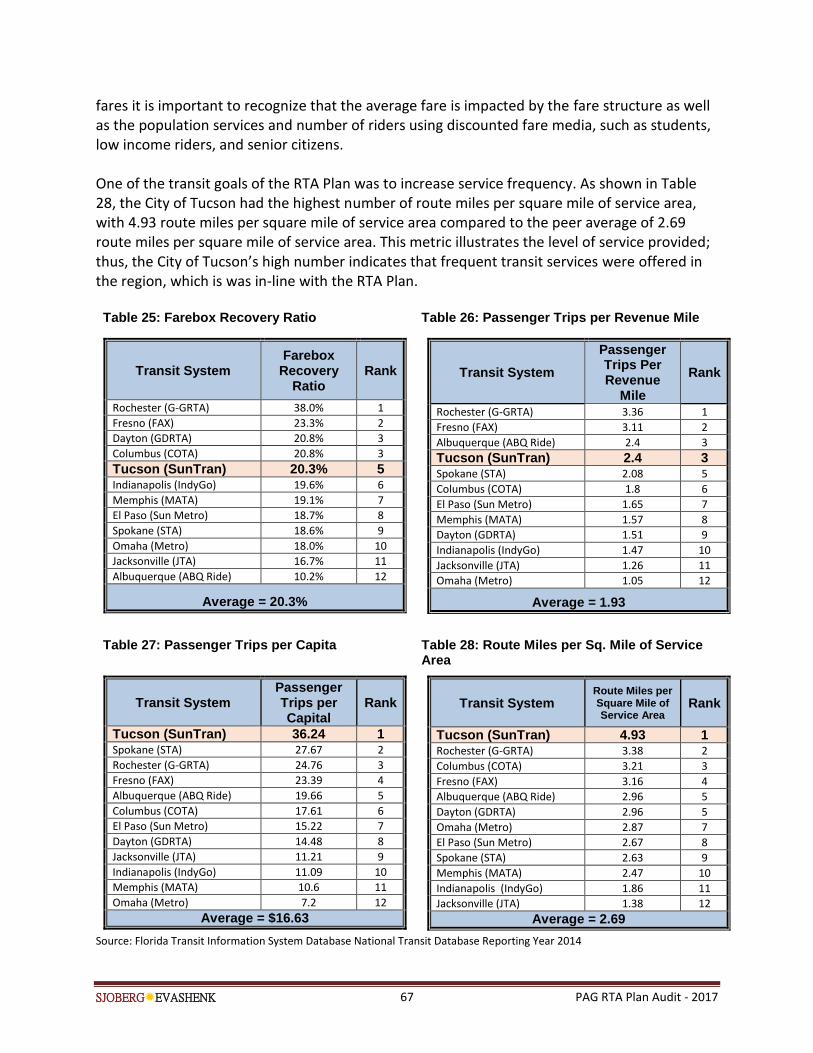
SJOBERGEVASHENK 67 PAG RTA Plan Audit - 2017
fares it is important to recognize that the average fare is impacted by the fare structure as well as the population services and number of riders using discounted fare media, such as students, low income riders, and senior citizens. One of the transit goals of the RTA Plan was to increase service frequency. As shown in Table 28, the City of Tucson had the highest number of route miles per square mile of service area, with 4.93 route miles per square mile of service area compared to the peer average of 2.69 route miles per square mile of service area. This metric illustrates the level of service provided; thus, the City of Tucson’s high number indicates that frequent transit services were offered in the region, which is was in-line with the RTA Plan. Table 25: Farebox Recovery Ratio Table 26: Passenger Trips per Revenue Mile
Transit System Farebox
Recovery Ratio
Rank
Rochester (G-GRTA) 38.0% 1
Fresno (FAX) 23.3% 2
Dayton (GDRTA) 20.8% 3
Columbus (COTA) 20.8% 3
Tucson (SunTran) 20.3% 5 Indianapolis (IndyGo) 19.6% 6
Memphis (MATA) 19.1% 7
El Paso (Sun Metro) 18.7% 8
Spokane (STA) 18.6% 9
Omaha (Metro) 18.0% 10
Jacksonville (JTA) 16.7% 11
Albuquerque (ABQ Ride) 10.2% 12
Average = 20.3%
Transit System
Passenger Trips Per Revenue
Mile
Rank
Rochester (G-GRTA) 3.36 1
Fresno (FAX) 3.11 2
Albuquerque (ABQ Ride) 2.4 3
Tucson (SunTran) 2.4 3 Spokane (STA) 2.08 5
Columbus (COTA) 1.8 6
El Paso (Sun Metro) 1.65 7
Memphis (MATA) 1.57 8
Dayton (GDRTA) 1.51 9
Indianapolis (IndyGo) 1.47 10
Jacksonville (JTA) 1.26 11
Omaha (Metro) 1.05 12
Average = 1.93
Table 27: Passenger Trips per Capita
Table 28: Route Miles per Sq. Mile of Service Area
Transit System Passenger Trips per Capital
Rank
Tucson (SunTran) 36.24 1 Spokane (STA) 27.67 2
Rochester (G-GRTA) 24.76 3
Fresno (FAX) 23.39 4
Albuquerque (ABQ Ride) 19.66 5
Columbus (COTA) 17.61 6
El Paso (Sun Metro) 15.22 7
Dayton (GDRTA) 14.48 8
Jacksonville (JTA) 11.21 9
Indianapolis (IndyGo) 11.09 10
Memphis (MATA) 10.6 11
Omaha (Metro) 7.2 12
Average = $16.63
Transit System Route Miles per Square Mile of Service Area
Rank
Tucson (SunTran) 4.93 1 Rochester (G-GRTA) 3.38 2
Columbus (COTA) 3.21 3
Fresno (FAX) 3.16 4
Albuquerque (ABQ Ride) 2.96 5
Dayton (GDRTA) 2.96 5
Omaha (Metro) 2.87 7
El Paso (Sun Metro) 2.67 8
Spokane (STA) 2.63 9
Memphis (MATA) 2.47 10
Indianapolis (IndyGo) 1.86 11
Jacksonville (JTA) 1.38 12
Average = 2.69
Source: Florida Transit Information System Database National Transit Database Reporting Year 2014
SJOBERGEVASHENK 68 PAG RTA Plan Audit - 2017
Sun Link Modern Streetcar Performance Also Met or Exceeded Performance Goals
In July 2014, the 3.9-mile Sun Link modern streetcar opened and connected the main University of Arizona campus, 4th Avenue Business District, downtown Tucson, and the Mercado district. Since the start of service, more than 2 million total passengers have used the Sun Link modern streetcar service. More importantly, since the start of Sun Link modern streetcar operations, it has generally met or exceeded most performance targets set by the City of Tucson as shown in Table 29. For instance, for metrics of service efficiency and effectiveness as measured by passengers per revenue hour and passengers per revenue mile, the Sun Link modern streetcar generally met established targets—although actual passengers per revenue hour was slightly less than the 43-passenger goal at 41 passengers per revenue hour in fiscal year 2016. Between fiscal years 2015 and 2016, passengers per revenue mile fell 16.7 percent, while passengers per revenue hour fell 14.6 percent. Similarly, for a measure of cost efficiency, results showed that the Sun Link modern streetcar cost per revenue mile was $19.90 in fiscal year 2016 beating its target cost per revenue mile of $20.98 by more than 5 percent. In both fiscal years 2015 and 2016, total Sun Link modern streetcar expenses were well below budgeted forecasts. For fiscal year 2015, actual expenses were just over $3.5 million—16.6 percent lower than the budgeted amount of $4.2 million. In fiscal year 2016, actual expenses were slightly under $3.6 million—14.5 percent lower than the budgeted amount of $4.2 million. Yet during this same time, total fare revenue decreased between fiscal year 2015 and 2016 by roughly 7.7 percent from nearly $947,000 to approximately $874,000 as shown in Table 29. Despite the decline in fare revenue, the farebox recovery ratio still remained above 20 percent with farebox recovery ratios registering 27 percent and 24.3 percent in fiscal year 2015 and fiscal year 2016, respectively. Industry-wide, a farebox recovery ratio of 20 percent or higher is considered a good recovery rate. Additionally, the Sun Link modern streetcar system generally met targets related to passenger safety and system reliability where streetcar inspections occurred more frequently. In fiscal year 2015, inspections occurred every 950 miles, on average, earlier than the set goal of every 1,000 miles. This trend continued into fiscal year 2016 where streetcars were inspected every 936 miles. Moreover, performance in fiscal year 2016 also revealed there were no preventable accidents and actual complaints per 100,000 passengers were significantly lower than targeted amounts—indicating a higher level of customer satisfaction with services provided. Although the Sun Link modern streetcar had nearly 1.1 million passengers in its first year of operation in fiscal year 2015, exceeding the target of approximately 992,000 riders by 8.7 percent, total ridership declined 11.6 percent between fiscal years 2015 and 2016. Specifically, ridership declined from nearly 1.1 million passengers to approximately 953,000 passengers between the two years, falling slightly short of the approximate 992,000 target. As discussed earlier in this report, this decline was similar to system-wide ridership declines.

SJOBERGEVASHENK 69 PAG RTA Plan Audit - 2017
Table 29: Sun Link System-wide Performance, Fiscal Years 2015 and 2016
Performance Metric
Fiscal Year 2015 Fiscal Year 2016 Percent Change
from Fiscal Year
2015 to 2016
Target/ Budget
Actual Variance Target/ Budget
Actual Variance
Total Passengers 991,500 1,078,136 8.7% 992,400 952,675 -4.0% -11.6%
Total Fare Revenue No Target $946,828 Not
Applicable No Target $874,111
Not Applicable
-7.7%
Total Expenses $4,201,560 $3,503,452 -16.6% $4,201,560 $3,593,263 -14.5% 2.6%
Farebox Recovery Ratio
No Target 27.0% Not
Applicable No Target 24.3%
Not Applicable
-10.0%
Passengers per Revenue Mile
5 6 20.0% 5 5 0.0% -16.7%
Passengers per Revenue Hour
41 48 17.1% 43 41 -4.7% -14.6%
Cost per Passenger $3.86 $3.77 -2.3% $3.86 $4.42 14.5% 17.2%
Cost per Revenue Mile $20.21 $20.61 2.0% $20.98 $19.90 -5.2% -3.4%
Cost per Revenue Hour
$161.05 $163.64 1.6% $161.05 $155.19 -3.6% -5.2%
Miles between Road Calls
35,000 No Data No Data 35,000 No Data No Data No Data
Miles between Streetcar Inspection
1,000 950 -5.0% 1,000 936 -6.4% -1.5%
Preventable Accidents per 100,000 Miles
0 1.7 Not
Applicable 0 0 0 Not Applicable
Complaints per 100,000 Passengers
50 37 -26.0% 50 20 -60.0% -46.0%
Source: Auditor-generated from Sun Link Monthly Operations Report, June 2015 and June 2016 Note: Text highlighted in green indicates actual performance exceeded targets, while text highlighted in red indicates actual performance fell short of targets
Sun Link Modern Streetcar Cannot Yet be Compared to Peers
Unlike other modes of transit travel such as fixed bus route, it is more challenging to compare the City of Tucson’s modern streetcar to peers across the country because of the limited number of similar streetcars in service and limited data available. Specifically, streetcars are either classified as historic or modern. Most streetcars in operation are characterized as historic and are not comparable to modern streetcars. Regardless, the most recent Nation Transit Database reporting year is for 2014, before the Tucson streetcar was in service.
SJOBERGEVASHENK 70 PAG RTA Plan Audit - 2017
Performance of the City of Tucson’s Sun Van Paratransit Services Has Improved and Performs Close to its Targets
In addition to increased funding for fixed route service and the Sun Link modern streetcar service, the RTA Plan also allocated $109 million for the expansion of Sun Van paratransit services in Pima County. With 18.4 percent of persons in Pima County older than 65 years of age, this percentage is greater than the national average of 14.9 percent and has grown 3 percent since 2010—faster than the national increase of 1.9 percent. As a result, paratransit service serves a critical need in the Pima County transit system. Over the last ten years, Sun Van paratransit has increased service in accordance with the RTA Plan approved by voters in Pima County. Ridership has grown 37.6 percent and both revenue miles and service hours increased 29.3 and 15.3 percent, respectively. While Sun Van paratransit fell short of targets in some years, performance was typically within 5 percent of goals. Thus, Sun Van paratransit appears to have substantially improved system-wide performance. Ridership Trends and Finances
Sun Van paratransit ridership has increased substantially over the first ten fiscal years of the RTA Plan. As shown in Figure 21, actual ridership grew from approximately 440,000 to nearly 578,000 between fiscal years 2007 and 2016—an increase of 31.4 percent. Since Sun Van paratransit is an on-demand service, it has to contend with cancelations and no-show passengers. In fact, cancellations have increased 34.1 percent from a low of approximately 115,000 in fiscal year 2007 to more than 154,000 by fiscal year 2016. Meanwhile, no-show passengers also significantly increased by 36.5 percent. No-shows and cancellations grew at a faster rate, although they remained flat when measured as a percentage of total demand.51 Over the ten-year period of the RTA Plan elapsed as of June 30, 2016, cancellations and no-shows accounted for between 24.5 and 26.2 percent of total demand for Sun Van paratransit service.52 However, in recent years, both actual cancellations and no-shows were lower than then the respective targets.
51 Total demand = actual passengers + cancellations + no-shows 52 Cancellations and no-shows are part of providing paratransit services. The City of Tucson accounts for cancellations and no-
shows when establishing the Sun Van budget.
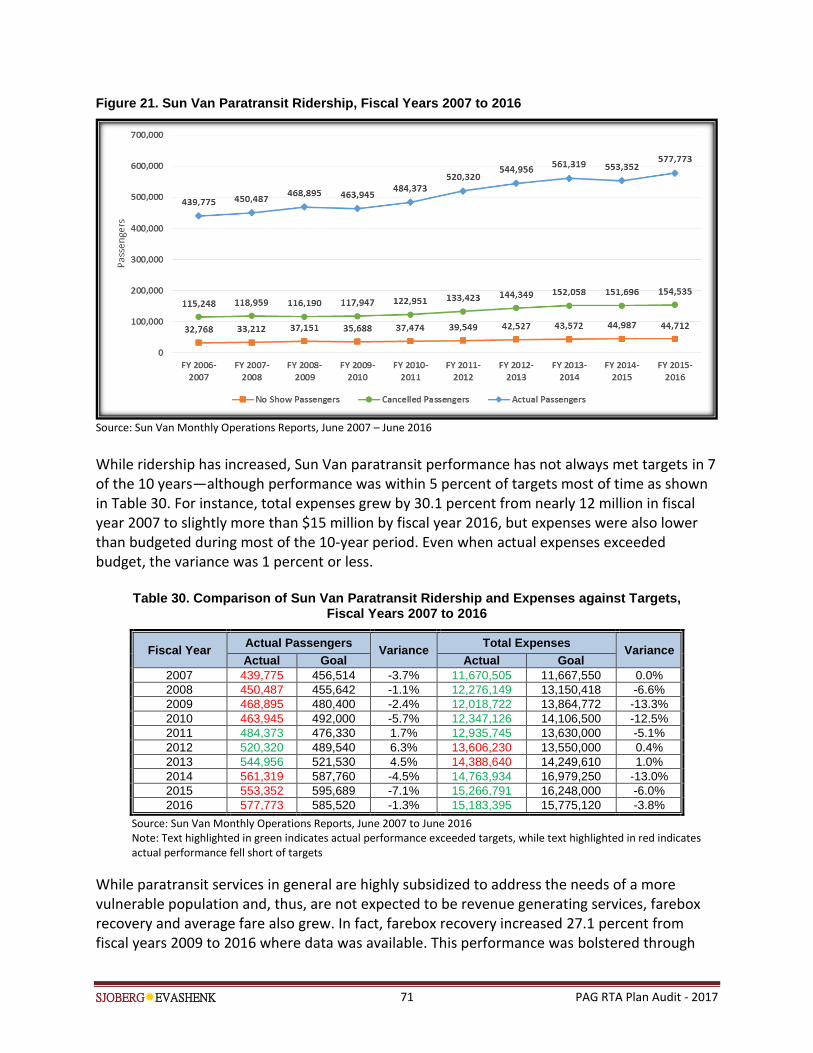
SJOBERGEVASHENK 71 PAG RTA Plan Audit - 2017
Figure 21. Sun Van Paratransit Ridership, Fiscal Years 2007 to 2016
Source: Sun Van Monthly Operations Reports, June 2007 – June 2016
While ridership has increased, Sun Van paratransit performance has not always met targets in 7 of the 10 years—although performance was within 5 percent of targets most of time as shown in Table 30. For instance, total expenses grew by 30.1 percent from nearly 12 million in fiscal year 2007 to slightly more than $15 million by fiscal year 2016, but expenses were also lower than budgeted during most of the 10-year period. Even when actual expenses exceeded budget, the variance was 1 percent or less.
Table 30. Comparison of Sun Van Paratransit Ridership and Expenses against Targets, Fiscal Years 2007 to 2016
Fiscal Year Actual Passengers
Variance Total Expenses
Variance Actual Goal Actual Goal
2007 439,775 456,514 -3.7% 11,670,505 11,667,550 0.0%
2008 450,487 455,642 -1.1% 12,276,149 13,150,418 -6.6%
2009 468,895 480,400 -2.4% 12,018,722 13,864,772 -13.3%
2010 463,945 492,000 -5.7% 12,347,126 14,106,500 -12.5%
2011 484,373 476,330 1.7% 12,935,745 13,630,000 -5.1%
2012 520,320 489,540 6.3% 13,606,230 13,550,000 0.4%
2013 544,956 521,530 4.5% 14,388,640 14,249,610 1.0%
2014 561,319 587,760 -4.5% 14,763,934 16,979,250 -13.0%
2015 553,352 595,689 -7.1% 15,266,791 16,248,000 -6.0%
2016 577,773 585,520 -1.3% 15,183,395 15,775,120 -3.8%
Source: Sun Van Monthly Operations Reports, June 2007 to June 2016 Note: Text highlighted in green indicates actual performance exceeded targets, while text highlighted in red indicates actual performance fell short of targets
While paratransit services in general are highly subsidized to address the needs of a more vulnerable population and, thus, are not expected to be revenue generating services, farebox recovery and average fare also grew. In fact, farebox recovery increased 27.1 percent from fiscal years 2009 to 2016 where data was available. This performance was bolstered through
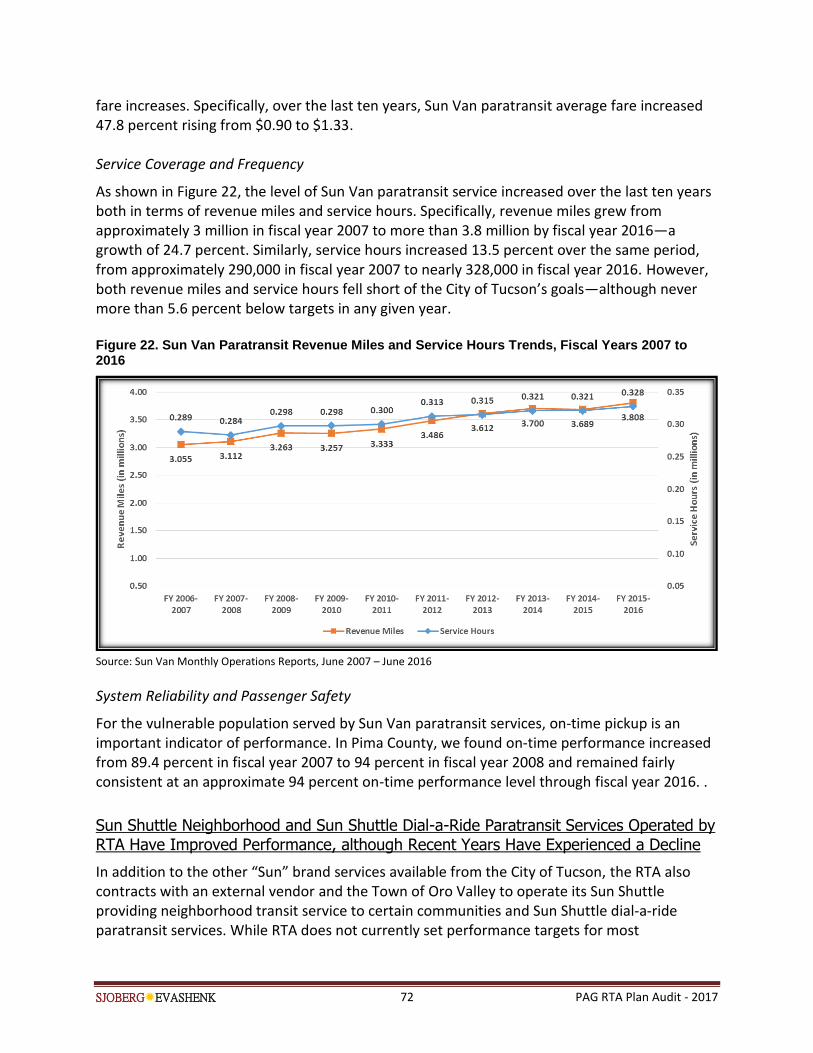
SJOBERGEVASHENK 72 PAG RTA Plan Audit - 2017
fare increases. Specifically, over the last ten years, Sun Van paratransit average fare increased 47.8 percent rising from $0.90 to $1.33. Service Coverage and Frequency
As shown in Figure 22, the level of Sun Van paratransit service increased over the last ten years both in terms of revenue miles and service hours. Specifically, revenue miles grew from approximately 3 million in fiscal year 2007 to more than 3.8 million by fiscal year 2016—a growth of 24.7 percent. Similarly, service hours increased 13.5 percent over the same period, from approximately 290,000 in fiscal year 2007 to nearly 328,000 in fiscal year 2016. However, both revenue miles and service hours fell short of the City of Tucson’s goals—although never more than 5.6 percent below targets in any given year. Figure 22. Sun Van Paratransit Revenue Miles and Service Hours Trends, Fiscal Years 2007 to 2016
Source: Sun Van Monthly Operations Reports, June 2007 – June 2016
System Reliability and Passenger Safety
For the vulnerable population served by Sun Van paratransit services, on-time pickup is an important indicator of performance. In Pima County, we found on-time performance increased from 89.4 percent in fiscal year 2007 to 94 percent in fiscal year 2008 and remained fairly consistent at an approximate 94 percent on-time performance level through fiscal year 2016. .
Sun Shuttle Neighborhood and Sun Shuttle Dial-a-Ride Paratransit Services Operated by RTA Have Improved Performance, although Recent Years Have Experienced a Decline
In addition to the other “Sun” brand services available from the City of Tucson, the RTA also contracts with an external vendor and the Town of Oro Valley to operate its Sun Shuttle providing neighborhood transit service to certain communities and Sun Shuttle dial-a-ride paratransit services. While RTA does not currently set performance targets for most
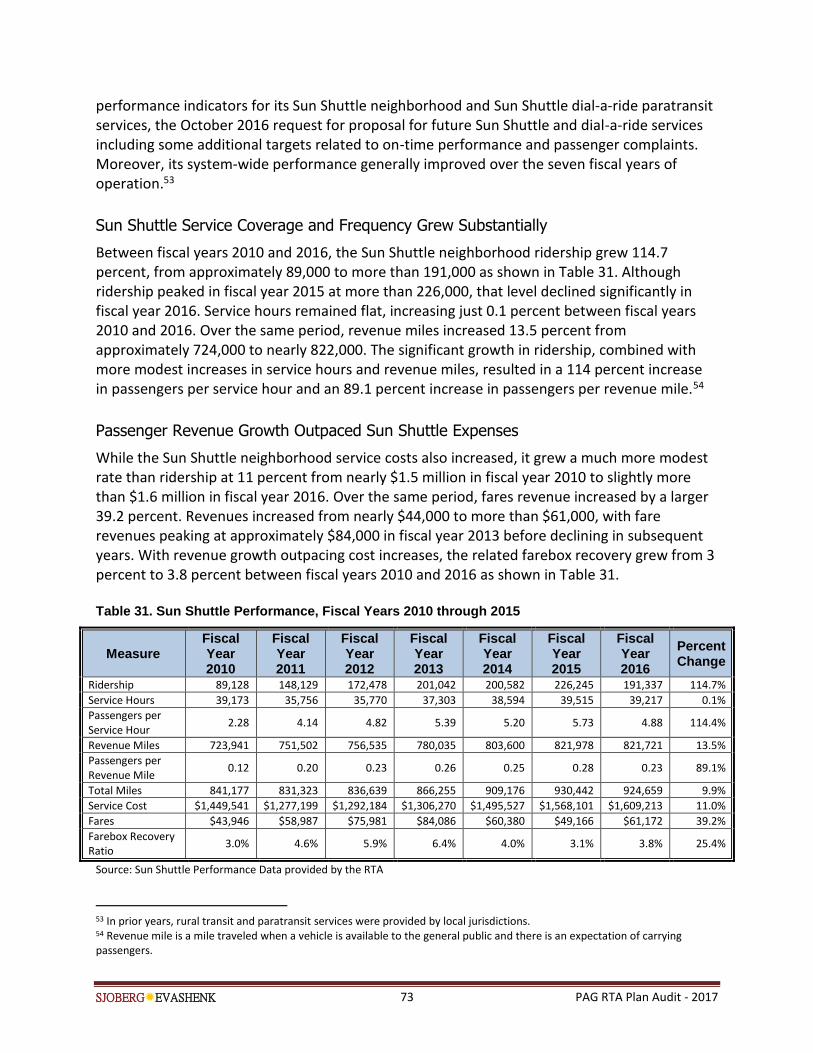
SJOBERGEVASHENK 73 PAG RTA Plan Audit - 2017
performance indicators for its Sun Shuttle neighborhood and Sun Shuttle dial-a-ride paratransit services, the October 2016 request for proposal for future Sun Shuttle and dial-a-ride services including some additional targets related to on-time performance and passenger complaints. Moreover, its system-wide performance generally improved over the seven fiscal years of operation.53
Sun Shuttle Service Coverage and Frequency Grew Substantially
Between fiscal years 2010 and 2016, the Sun Shuttle neighborhood ridership grew 114.7 percent, from approximately 89,000 to more than 191,000 as shown in Table 31. Although ridership peaked in fiscal year 2015 at more than 226,000, that level declined significantly in fiscal year 2016. Service hours remained flat, increasing just 0.1 percent between fiscal years 2010 and 2016. Over the same period, revenue miles increased 13.5 percent from approximately 724,000 to nearly 822,000. The significant growth in ridership, combined with more modest increases in service hours and revenue miles, resulted in a 114 percent increase in passengers per service hour and an 89.1 percent increase in passengers per revenue mile.54
Passenger Revenue Growth Outpaced Sun Shuttle Expenses
While the Sun Shuttle neighborhood service costs also increased, it grew a much more modest rate than ridership at 11 percent from nearly $1.5 million in fiscal year 2010 to slightly more than $1.6 million in fiscal year 2016. Over the same period, fares revenue increased by a larger 39.2 percent. Revenues increased from nearly $44,000 to more than $61,000, with fare revenues peaking at approximately $84,000 in fiscal year 2013 before declining in subsequent years. With revenue growth outpacing cost increases, the related farebox recovery grew from 3 percent to 3.8 percent between fiscal years 2010 and 2016 as shown in Table 31. Table 31. Sun Shuttle Performance, Fiscal Years 2010 through 2015
Measure Fiscal Year 2010
Fiscal Year 2011
Fiscal Year 2012
Fiscal Year 2013
Fiscal Year 2014
Fiscal Year 2015
Fiscal Year 2016
Percent Change
Ridership 89,128 148,129 172,478 201,042 200,582 226,245 191,337 114.7%
Service Hours 39,173 35,756 35,770 37,303 38,594 39,515 39,217 0.1%
Passengers per Service Hour
2.28 4.14 4.82 5.39 5.20 5.73 4.88 114.4%
Revenue Miles 723,941 751,502 756,535 780,035 803,600 821,978 821,721 13.5%
Passengers per Revenue Mile
0.12 0.20 0.23 0.26 0.25 0.28 0.23 89.1%
Total Miles 841,177 831,323 836,639 866,255 909,176 930,442 924,659 9.9%
Service Cost $1,449,541 $1,277,199 $1,292,184 $1,306,270 $1,495,527 $1,568,101 $1,609,213 11.0%
Fares $43,946 $58,987 $75,981 $84,086 $60,380 $49,166 $61,172 39.2%
Farebox Recovery Ratio
3.0% 4.6% 5.9% 6.4% 4.0% 3.1% 3.8% 25.4%
Source: Sun Shuttle Performance Data provided by the RTA
53 In prior years, rural transit and paratransit services were provided by local jurisdictions. 54 Revenue mile is a mile traveled when a vehicle is available to the general public and there is an expectation of carrying passengers.
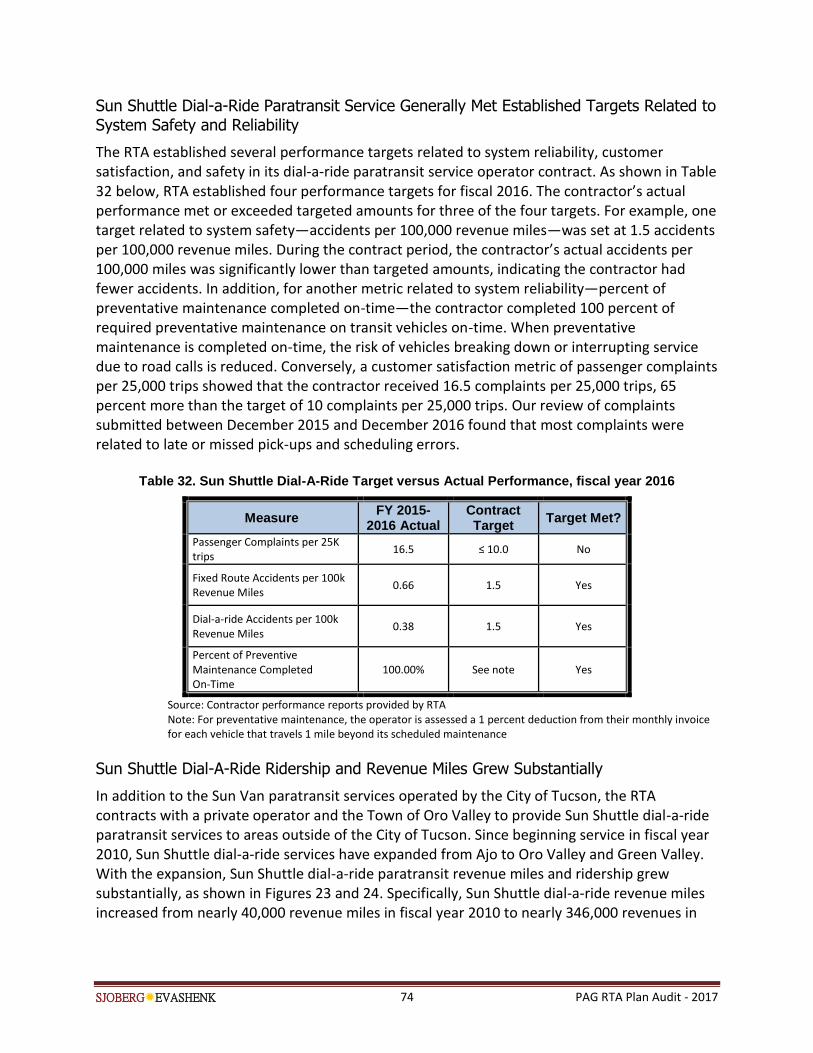
SJOBERGEVASHENK 74 PAG RTA Plan Audit - 2017
Sun Shuttle Dial-a-Ride Paratransit Service Generally Met Established Targets Related to System Safety and Reliability
The RTA established several performance targets related to system reliability, customer satisfaction, and safety in its dial-a-ride paratransit service operator contract. As shown in Table 32 below, RTA established four performance targets for fiscal 2016. The contractor’s actual performance met or exceeded targeted amounts for three of the four targets. For example, one target related to system safety—accidents per 100,000 revenue miles—was set at 1.5 accidents per 100,000 revenue miles. During the contract period, the contractor’s actual accidents per 100,000 miles was significantly lower than targeted amounts, indicating the contractor had fewer accidents. In addition, for another metric related to system reliability—percent of preventative maintenance completed on-time—the contractor completed 100 percent of required preventative maintenance on transit vehicles on-time. When preventative maintenance is completed on-time, the risk of vehicles breaking down or interrupting service due to road calls is reduced. Conversely, a customer satisfaction metric of passenger complaints per 25,000 trips showed that the contractor received 16.5 complaints per 25,000 trips, 65 percent more than the target of 10 complaints per 25,000 trips. Our review of complaints submitted between December 2015 and December 2016 found that most complaints were related to late or missed pick-ups and scheduling errors.
Table 32. Sun Shuttle Dial-A-Ride Target versus Actual Performance, fiscal year 2016
Measure FY 2015-
2016 Actual Contract Target
Target Met?
Passenger Complaints per 25K trips
16.5 ≤ 10.0 No
Fixed Route Accidents per 100k Revenue Miles
0.66 1.5 Yes
Dial-a-ride Accidents per 100k Revenue Miles
0.38 1.5 Yes
Percent of Preventive Maintenance Completed On-Time
100.00% See note Yes
Source: Contractor performance reports provided by RTA Note: For preventative maintenance, the operator is assessed a 1 percent deduction from their monthly invoice for each vehicle that travels 1 mile beyond its scheduled maintenance
Sun Shuttle Dial-A-Ride Ridership and Revenue Miles Grew Substantially
In addition to the Sun Van paratransit services operated by the City of Tucson, the RTA contracts with a private operator and the Town of Oro Valley to provide Sun Shuttle dial-a-ride paratransit services to areas outside of the City of Tucson. Since beginning service in fiscal year 2010, Sun Shuttle dial-a-ride services have expanded from Ajo to Oro Valley and Green Valley. With the expansion, Sun Shuttle dial-a-ride paratransit revenue miles and ridership grew substantially, as shown in Figures 23 and 24. Specifically, Sun Shuttle dial-a-ride revenue miles increased from nearly 40,000 revenue miles in fiscal year 2010 to nearly 346,000 revenues in
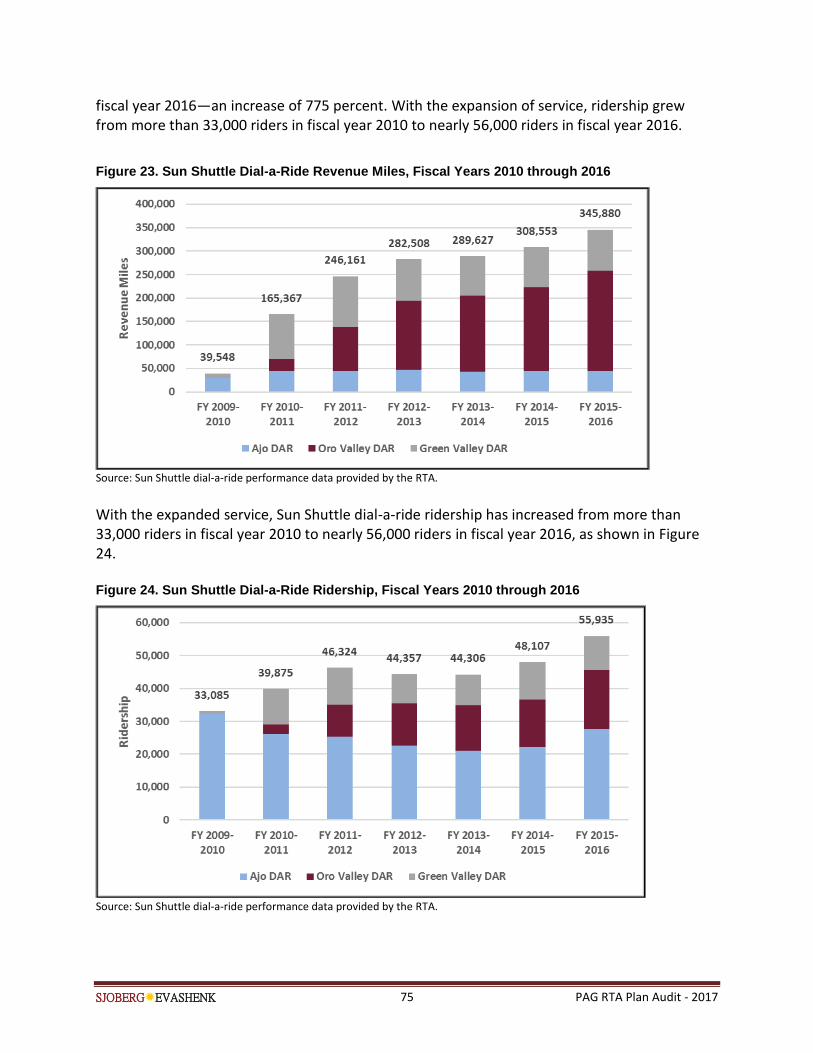
SJOBERGEVASHENK 75 PAG RTA Plan Audit - 2017
fiscal year 2016—an increase of 775 percent. With the expansion of service, ridership grew from more than 33,000 riders in fiscal year 2010 to nearly 56,000 riders in fiscal year 2016.
Figure 23. Sun Shuttle Dial-a-Ride Revenue Miles, Fiscal Years 2010 through 2016
Source: Sun Shuttle dial-a-ride performance data provided by the RTA.
With the expanded service, Sun Shuttle dial-a-ride ridership has increased from more than 33,000 riders in fiscal year 2010 to nearly 56,000 riders in fiscal year 2016, as shown in Figure 24. Figure 24. Sun Shuttle Dial-a-Ride Ridership, Fiscal Years 2010 through 2016
Source: Sun Shuttle dial-a-ride performance data provided by the RTA.

SJOBERGEVASHENK 76 PAG RTA Plan Audit - 2017
[THIS PAGE LEFT BLANK FOR REPRODUCTION PURPOSES]
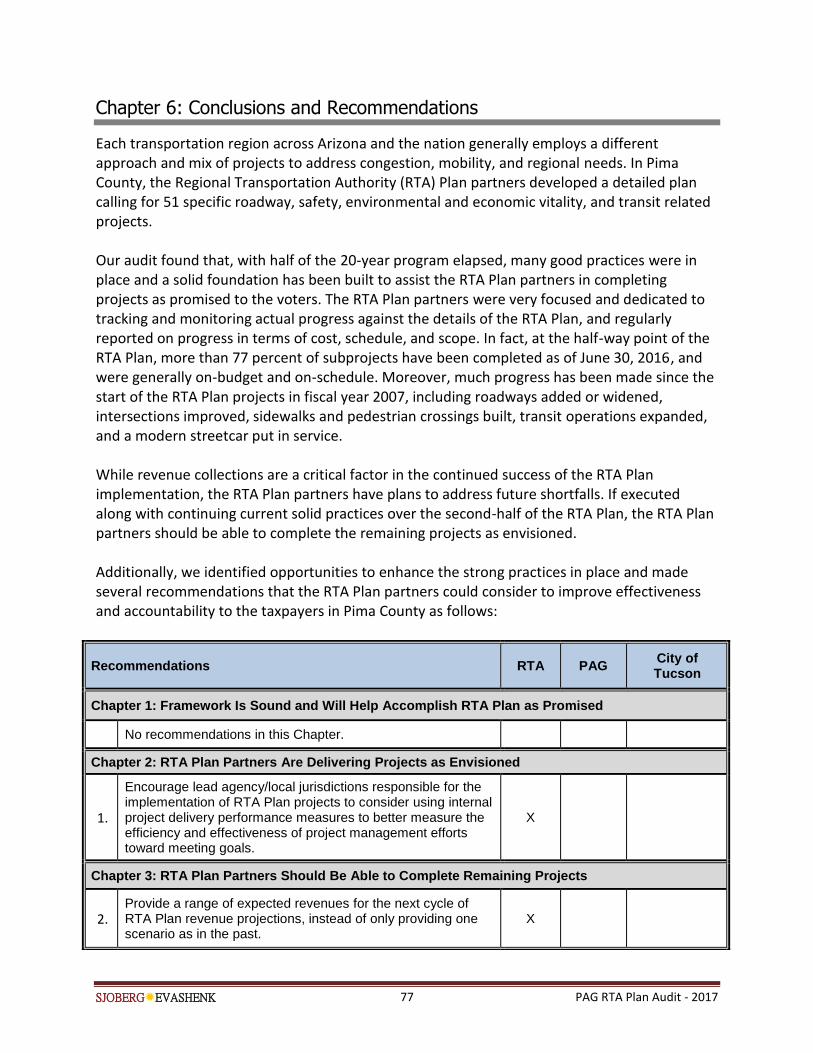
SJOBERGEVASHENK 77 PAG RTA Plan Audit - 2017
Chapter 6: Conclusions and Recommendations
Each transportation region across Arizona and the nation generally employs a different approach and mix of projects to address congestion, mobility, and regional needs. In Pima County, the Regional Transportation Authority (RTA) Plan partners developed a detailed plan calling for 51 specific roadway, safety, environmental and economic vitality, and transit related projects. Our audit found that, with half of the 20-year program elapsed, many good practices were in place and a solid foundation has been built to assist the RTA Plan partners in completing projects as promised to the voters. The RTA Plan partners were very focused and dedicated to tracking and monitoring actual progress against the details of the RTA Plan, and regularly reported on progress in terms of cost, schedule, and scope. In fact, at the half-way point of the RTA Plan, more than 77 percent of subprojects have been completed as of June 30, 2016, and were generally on-budget and on-schedule. Moreover, much progress has been made since the start of the RTA Plan projects in fiscal year 2007, including roadways added or widened, intersections improved, sidewalks and pedestrian crossings built, transit operations expanded, and a modern streetcar put in service. While revenue collections are a critical factor in the continued success of the RTA Plan implementation, the RTA Plan partners have plans to address future shortfalls. If executed along with continuing current solid practices over the second-half of the RTA Plan, the RTA Plan partners should be able to complete the remaining projects as envisioned. Additionally, we identified opportunities to enhance the strong practices in place and made several recommendations that the RTA Plan partners could consider to improve effectiveness and accountability to the taxpayers in Pima County as follows:
Recommendations RTA PAG City of Tucson
Chapter 1: Framework Is Sound and Will Help Accomplish RTA Plan as Promised
No recommendations in this Chapter.
Chapter 2: RTA Plan Partners Are Delivering Projects as Envisioned
1.
Encourage lead agency/local jurisdictions responsible for the implementation of RTA Plan projects to consider using internal project delivery performance measures to better measure the efficiency and effectiveness of project management efforts toward meeting goals.
X
Chapter 3: RTA Plan Partners Should Be Able to Complete Remaining Projects
2.
Provide a range of expected revenues for the next cycle of RTA Plan revenue projections, instead of only providing one scenario as in the past.
X
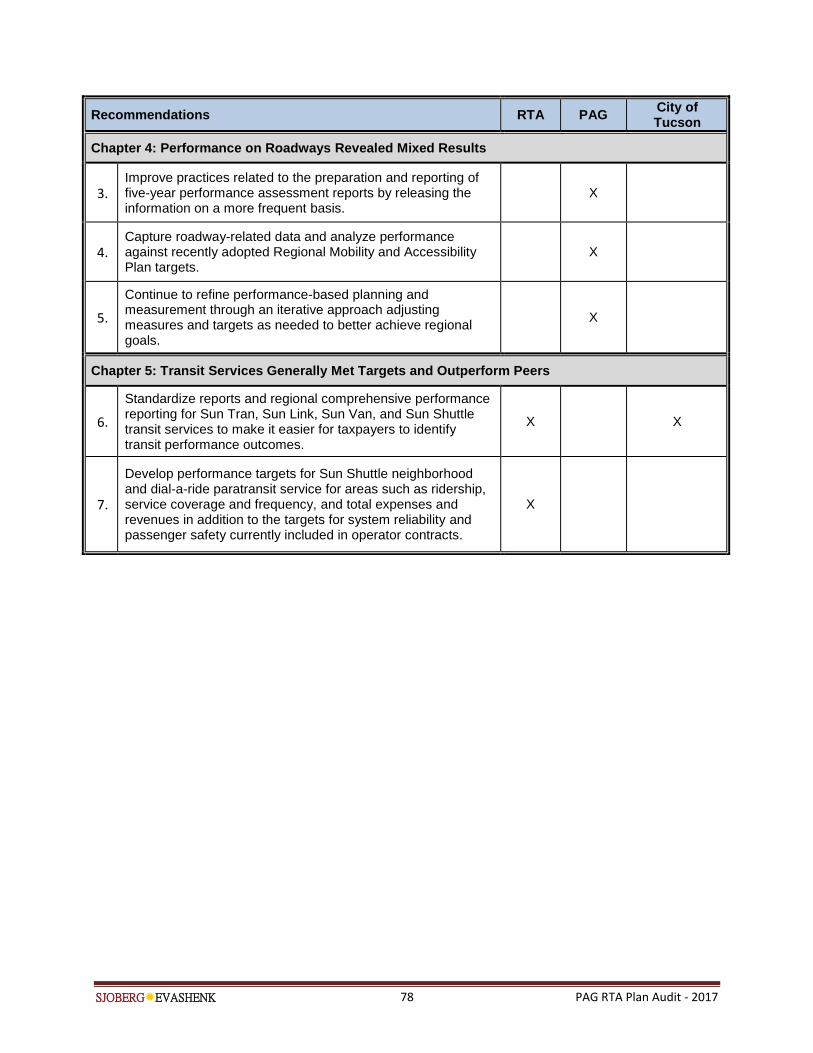
SJOBERGEVASHENK 78 PAG RTA Plan Audit - 2017
Recommendations RTA PAG City of Tucson
Chapter 4: Performance on Roadways Revealed Mixed Results
3.
Improve practices related to the preparation and reporting of five-year performance assessment reports by releasing the information on a more frequent basis.
X
4.
Capture roadway-related data and analyze performance against recently adopted Regional Mobility and Accessibility Plan targets.
X
5.
Continue to refine performance-based planning and measurement through an iterative approach adjusting measures and targets as needed to better achieve regional goals.
X
Chapter 5: Transit Services Generally Met Targets and Outperform Peers
6.
Standardize reports and regional comprehensive performance reporting for Sun Tran, Sun Link, Sun Van, and Sun Shuttle transit services to make it easier for taxpayers to identify transit performance outcomes.
X X
7.
Develop performance targets for Sun Shuttle neighborhood and dial-a-ride paratransit service for areas such as ridership, service coverage and frequency, and total expenses and revenues in addition to the targets for system reliability and passenger safety currently included in operator contracts.
X
SJOBERGEVASHENK 79 PAG RTA Plan Audit - 2017
Appendix A: Detailed Audit Methodology
In accordance with Arizona Revised Statutes §41-1279.03.A.6, the Arizona Office of the Auditor
General (Auditor General) has the responsibility for conducting a performance audit in the tenth year and in each fifth year thereafter where a transportation excise tax is in effect. In July 2016, the Auditor General hired Sjoberg Evashenk Consulting, to conduct the first performance audit of the RTA Plan for the ten-year period covering fiscal years 2007 through 2016, as well as projects scheduled in fiscal years 2017 through 2021. The purpose of the audit is to assess the efficiency, effectiveness, and performance of the RTA Plan for Pima County and address the following primary objectives identified by the Auditor General:
1. Review system performance in relieving congestion and improving mobility in the region for completed and in-progress projects and expenditures for fiscal years 2007 through 2015-2016.
2. Evaluate the extent to which projects completed have impacted the region’s transportation system’s integration and connectivity across and between modes.
3. Review and evaluate the potential impact of expenditures planned for fiscal years 2017 through 2021 in solving transportation problems in the region.
4. Compare budgeted project costs to actual costs for a sample of completed roadway and transit improvement projects, and determine reasons for any variances.
5. Compare projected start and completion dates to actual start and completion dates for a sample of completed roadway and transit improvement projects, and determine reasons for any variances.
6. Identify projects scheduled to be completed during the remaining years that the half-cent sales tax is in effect and compare original start dates to the current project schedule, noting any discrepancies and reasons for discrepancies.
7. Analyze whether RTA Plan expenditures complied with relevant statutes and were spent on RTA Plan projects.
8. Determine whether the RTA Plan as implemented is consistent with the plan voters approved in 2006 for completed, in-progress, and planned projects.
9. Evaluate the ability to complete all projects listed in the RTA Plan given expected revenues.
10. Compare and evaluate project management and cost efficiency used on RTA Plan projects against best practices for planning, design, construction, and completion stages.
To gain an understanding of the environment, we reviewed state laws and regulations related to sales tax revenues, RTA policies and procedures, RTA Board and committee structure and meeting minutes, RTA Plan, RTA Plan project information, interagency agreements, and available performance reports. We assessed regional transportation plans and updates such as the 2045 Regional Mobility and Accessibility Plan, transportation improvement plans, short-

SJOBERGEVASHENK 80 PAG RTA Plan Audit - 2017
range transit plans, annual reports, customer satisfaction surveys, and various publications, brochures, and fact sheets. Additionally, we interviewed RTA committee members and stakeholders, as well as officials, management, and staff from the RTA, Pima Association of Governments (PAG), and all eight-member local jurisdictions, including the cities of Tucson and South Tucson; towns of Marana, Oro Valley, and Sahuarita; Pasqua Yaqui Tribe and Tohono O’odham Nation; and Pima County. Further, we analyzed provisions of the federal Moving Ahead for Progress in the 21st Century (MAP-21) Act and the Fixing America’s Surface Transportation (FAST) Act related to transportation performance. Additionally, we considered and assessed internal controls relevant to the key objective areas over project implementation, project management, cost and expenditure data, and performance data. For instance, we identified control policies and procedures over call for projects for the safety and environmental/economic vitality projects and tested adherence through a review of applications. Additionally, we verified project schedule and status data contained in RTA databases with local jurisdictions as well as project file documents available. Also, we conducted a high-level file review on site at three local jurisdictions to determine whether intended project management control practices were appropriately documented. For cost and expenditure data, we tested a variety of invoices to determine adherence with control procedures and accuracy in recording them in the RTA general ledger. We reviewed external financial audit reports on the RTA entity and activities to ensure that general expenditure and recording controls were subject to audit and that the related reports on internal control did not identify any deficiencies. Finally, for performance data, we determined the reliability of data provided by independently recalculating performance measures with data from third-party sources. Using an RTA project database and supporting documents, reports, and available project file data, we obtained a universe of projects and sub-projects proposed in the RTA Plan and sorted them by completed, in-progress, not started, and cancelled by element within the RTA Plan—roadways, safety, environmental and economic vitality, and transit. Projects and their status were confirmed with the local lead agency jurisdictions as well as studied available project documentation for a handful of projects for reasonableness. To review projects and expenditures incurred during the 10-year period between fiscal years 2007 and 2016 and their impact on system performance in relieving congestion, improving mobility, integrating the system, benefits of the projects, and connectivity integration, we assessed the 2006 RTA Plan, 2035 Regional Transportation Plan, and 2045 Regional Mobility and Accessibility Plan to identify performance goals, targets, and measures in place. Specifically, we did the following:
Investigated sources of regional performance data and interviewed PAG program staff for walkthroughs of key processes for capturing, analyzing, and reporting the data.
Reviewed federal rules and guidelines, regional studies, local plans, and policies and procedures.
SJOBERGEVASHENK 81 PAG RTA Plan Audit - 2017
Made observations of in-progress data portal and performance website.
For roadways, we reviewed industry reports, state reported statistics, and national databases to measure congestion, safety, pavement condition, and bridge condition as well as calculated performance measures from raw data to independently verify figures reported by PAG.
Compared performance measures for Pima County and the Tucson Urban Area to other similar counties and urban areas in the United States using information from the U.S. Census, national bridge inventories, Arizona Department of Transportation crash reports, and Texas A&M University reports.
For transit projects, we compared transit activity in Pima County with eleven peer transit systems. Specifically, we compared performance measures and practices employed with those used by other similar transportation and transit entities in the nation using data from the Florida Transit Information System Database of data from the National Transit Database, Urban Mobility Report, and Urban Congestion Report among other documents. These reported results could not be verified as they were either self-reported by agencies not subject to this audit, or were analyzed and correlated by the specific industry entity reports results. In these instances, we attribute the data to the sources as appropriate. However, this is the best available and most widely-used comparable performance data in the transit industry.
Specifically, we evaluated transit system performance, including fixed route and demand response/paratransit services, examining service levels, capital costs, operation and maintenance costs, transit ridership, and fare box revenues as well as standard indicators related to operating cost per vehicle service hour or revenue mile, operating cost per boarding, passenger trips per revenue mile, and passenger trips per vehicle service hour.
Additionally, we created and distributed a survey to the eight local jurisdictions in Pima County to ascertain information about performance practices, actual performance indicators, pavement maintenance, bridge condition, and project management and delivery practices on roadways, safety, environmental, and transit projects. Results were analyzed and summarized accordingly.
For all RTA Plan projects as of June 30, 2016, we compared budget project costs to actual costs using the RTA Plan, RTA’s general ledger, RTA audited financial statements, and confirmations from local lead agency jurisdictions implementing the projects. Where possible, we attempted to gather cost information at the sub-project level from the local jurisdictions. Because of differences in how sub-projects are classified by the RTA and the local jurisdictions, it was difficult to identify with certainty individual sub-project costs. However, we are confident in the material accuracy of the RTA Plan ballot-level projects as that information is based on paid local jurisdictional reimbursements as recorded in the RTA’s general ledger. As needed, we identified reasons for significant variances through available documentation and interviews as well as assessed reasonableness. However, we did not evaluate the appropriateness of individual
SJOBERGEVASHENK 82 PAG RTA Plan Audit - 2017
project design concepts or second guess the precision of related project cost estimates prepared by expert transportation engineering consulting firms, nor did we assess whether the right decisions were made based on the information since projects were discussed and vetted through the RTA committee process. Also, for a sample of completed projects as of June 30, 2016, we compared projected start and actual start dates using the RTA Plan, RTA project database, and notice to proceed information provided by local jurisdictions. Because the RTA Plan did not identify projected completion dates, we were unable to compare projected completion dates to actual completion dates. Further, spending in several RTA Plan categories was intended for on-going operational costs; thus, monies will be spent over the 20-year timeframe of the RTA Plan and will not be “complete” until fiscal year 2026. To analyze whether RTA Plan expenditures complied with applicable Arizona Revised Statutes
§28-6392, §41-5307, §41-5308, §41-5348, and §48-5308, we selected a sample of expenditures
from a universe of all expenditures recorded in the RTA general ledgers over the last ten fiscal years from 2007 through 2016 choosing costs from a variety of year of expenditure, RTA Plan element category, project type (road widening, environmental project, etc.), project category (design, right of way, construction), expenditure type (salaries, contracts, etc.) dollar amount, and jurisdiction. Specifically, we tested expenditures from the bond account, bond proceed
account, and construction account for compliance with the Arizona Revised Statutes §28-6392
and §48-5308(c) as well as the RTA policies, objectives, and procedures.
As part of determining whether the RTA Plan implementation is consistent with the RTA Plan approved by the voters, we compared projects completed, in-progress, and planned with the RTA Plan projects identified. Using information from the RTA project database, on-line project files and documentation, aerial photographs of construction projects, and interviews with project managers, we performed a high-level assessment to determine consistency with the RTA Plan and to identify and explain significant discrepancies. To understand the potential impact in solving transportation problems through the projects and expenditures planned between fiscal years 2017 and 2021, we interviewed PAG program staff for walkthroughs of the planning process and assessed the sources of and validation of data input into the transportation model used for PAG’s 2045 Regional Mobility and Accessibility Plan. Additionally, we performed a high-level review for reasonableness of the modeling and estimation techniques used, and how calibration, validation, and midpoint corrections were incorporated into the model to better ensure reliability and the impacts on in-progress or planned projects. Because neither PAG nor RTA had established performance outcome targets for the period under audit, we could not evaluate how the RTA Plan projects impact or affect transportation problems related to mobility, congestions, integration, and connectivity among other areas.
SJOBERGEVASHENK 83 PAG RTA Plan Audit - 2017
Also, to evaluate the RTA’s ability to complete the remaining projects in the RTA Plan, we reviewed the sales tax revenue forecasting models used by RTA. Specifically, we obtained and analyzed revenue forecasting models created and used by RTA’s experts from the University of Arizona’s Eller School of Management to compare the model’s assumptions, methodology, and the resulting output with industry standard models and to evaluate the appropriateness on the models. Further, we compared revenue estimates against actual revenue collections for several years in order to determine the frequency in which the models should be updated. We studied plans for bonding, calculated debt service ratios, and assessed cash flow management as well. To assess project management practices employed on the individual projects, we created and distributed a survey through on-line SurveyMonkey technology to the eight local jurisdictions in Pima County to ascertain information about project management and performance practices, actual performance indicators, and pavement maintenance. This survey was developed using a variety of industry best practices as described in the following paragraph. We received survey responses from 7 of the 8 local jurisdictions for an 88 percent response rate. Using these results, we compared the project management techniques used and followed during all stages and phases of the lifecycle—including project scoping, design, construction, operation, and maintenance—in comparison with best practices drawn from a variety of industry sources, including the Construction Management Association’s Construction Management Standards of Practice, Federal Highway Administration guidance, American Institute of Architects guidance, American Public Works Association documents, and Project Management Body of Knowledge, among other sources. Further, for transit project management practices, we performed a high-level review of the City of Tucson’s project management files for the Sun Link modern streetcar.

SJOBERGEVASHENK 84 PAG RTA Plan Audit - 2017
[THIS PAGE LEFT BLANK FOR REPRODUCTION PURPOSES]
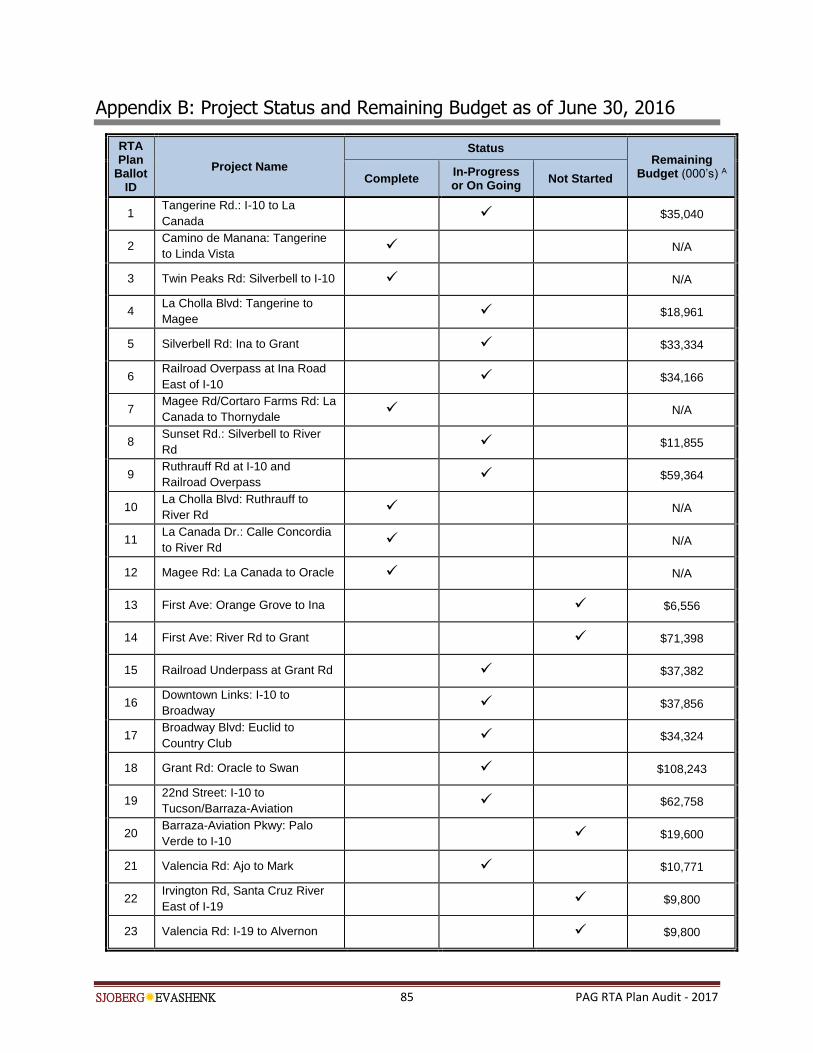
SJOBERGEVASHENK 85 PAG RTA Plan Audit - 2017
Appendix B: Project Status and Remaining Budget as of June 30, 2016
RTA Plan
Ballot ID
Project Name
Status Remaining
Budget (000’s) A Complete In-Progress or On Going
Not Started
1 Tangerine Rd.: I-10 to La
Canada $35,040
2 Camino de Manana: Tangerine
to Linda Vista N/A
3 Twin Peaks Rd: Silverbell to I-10 N/A
4 La Cholla Blvd: Tangerine to
Magee $18,961
5 Silverbell Rd: Ina to Grant $33,334
6 Railroad Overpass at Ina Road
East of I-10 $34,166
7 Magee Rd/Cortaro Farms Rd: La
Canada to Thornydale N/A
8 Sunset Rd.: Silverbell to River
Rd $11,855
9 Ruthrauff Rd at I-10 and
Railroad Overpass $59,364
10 La Cholla Blvd: Ruthrauff to
River Rd N/A
11 La Canada Dr.: Calle Concordia
to River Rd N/A
12 Magee Rd: La Canada to Oracle N/A
13 First Ave: Orange Grove to Ina $6,556
14 First Ave: River Rd to Grant $71,398
15 Railroad Underpass at Grant Rd $37,382
16 Downtown Links: I-10 to
Broadway $37,856
17 Broadway Blvd: Euclid to
Country Club $34,324
18 Grant Rd: Oracle to Swan $108,243
19 22nd Street: I-10 to
Tucson/Barraza-Aviation $62,758
20 Barraza-Aviation Pkwy: Palo
Verde to I-10 $19,600
21 Valencia Rd: Ajo to Mark $10,771
22 Irvington Rd, Santa Cruz River
East of I-19 $9,800
23 Valencia Rd: I-19 to Alvernon $9,800
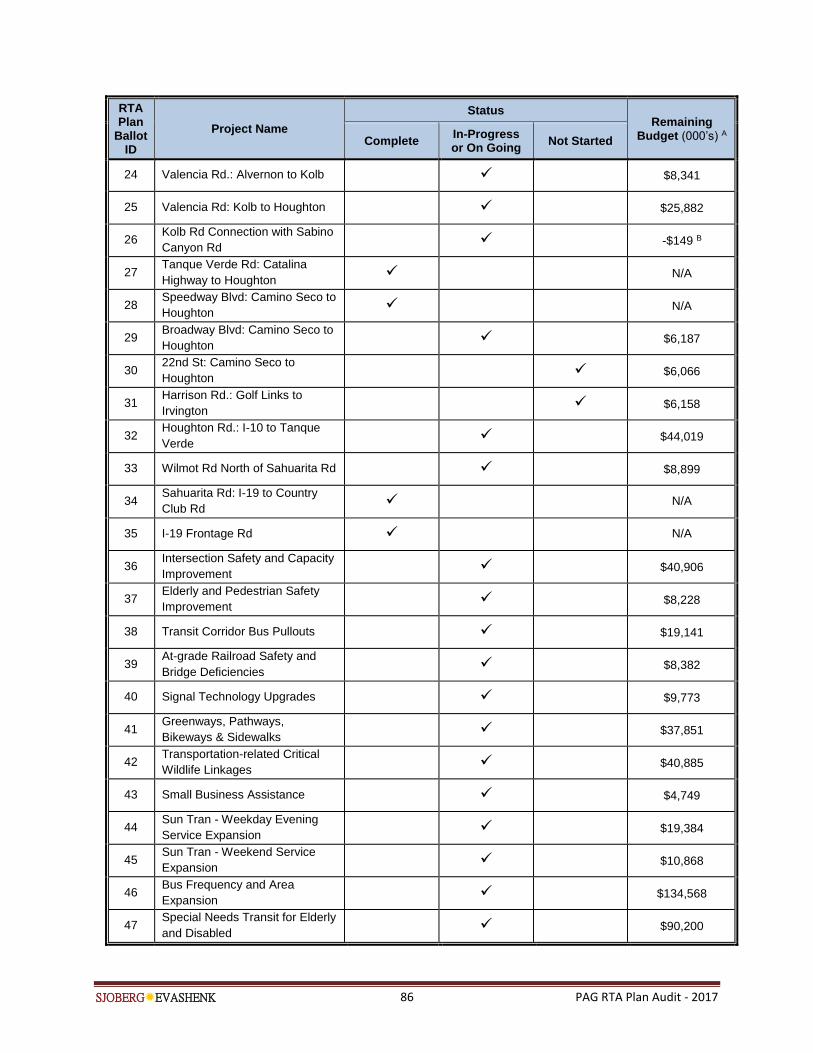
SJOBERGEVASHENK 86 PAG RTA Plan Audit - 2017
RTA Plan
Ballot ID
Project Name
Status Remaining
Budget (000’s) A Complete In-Progress or On Going
Not Started
24 Valencia Rd.: Alvernon to Kolb $8,341
25 Valencia Rd: Kolb to Houghton $25,882
26 Kolb Rd Connection with Sabino
Canyon Rd -$149 B
27 Tanque Verde Rd: Catalina
Highway to Houghton N/A
28 Speedway Blvd: Camino Seco to
Houghton N/A
29 Broadway Blvd: Camino Seco to
Houghton $6,187
30 22nd St: Camino Seco to
Houghton $6,066
31 Harrison Rd.: Golf Links to
Irvington $6,158
32 Houghton Rd.: I-10 to Tanque
Verde $44,019
33 Wilmot Rd North of Sahuarita Rd $8,899
34 Sahuarita Rd: I-19 to Country
Club Rd N/A
35 I-19 Frontage Rd N/A
36 Intersection Safety and Capacity
Improvement $40,906
37 Elderly and Pedestrian Safety
Improvement $8,228
38 Transit Corridor Bus Pullouts $19,141
39 At-grade Railroad Safety and
Bridge Deficiencies $8,382
40 Signal Technology Upgrades $9,773
41 Greenways, Pathways,
Bikeways & Sidewalks $37,851
42 Transportation-related Critical
Wildlife Linkages $40,885
43 Small Business Assistance $4,749
44 Sun Tran - Weekday Evening
Service Expansion $19,384
45 Sun Tran - Weekend Service
Expansion $10,868
46 Bus Frequency and Area
Expansion $134,568
47 Special Needs Transit for Elderly
and Disabled $90,200
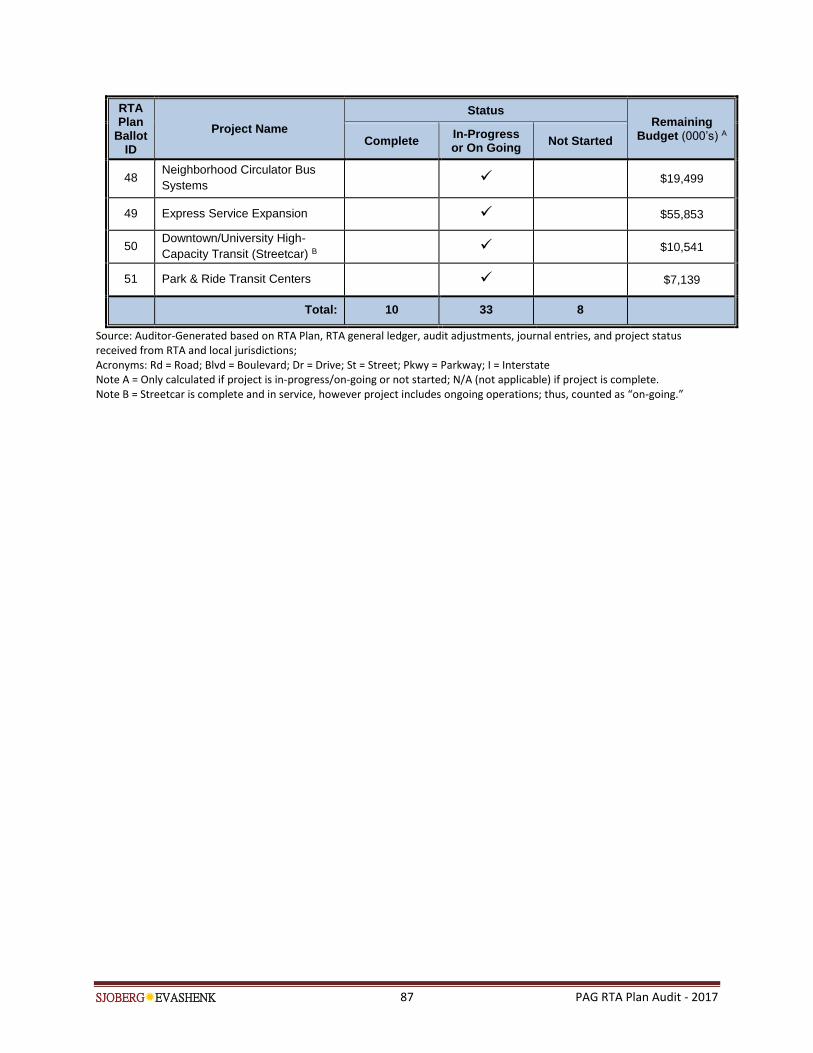
SJOBERGEVASHENK 87 PAG RTA Plan Audit - 2017
RTA Plan
Ballot ID
Project Name
Status Remaining
Budget (000’s) A Complete In-Progress or On Going
Not Started
48 Neighborhood Circulator Bus
Systems $19,499
49 Express Service Expansion $55,853
50 Downtown/University High-
Capacity Transit (Streetcar) B $10,541
51 Park & Ride Transit Centers $7,139
Total: 10 33 8
Source: Auditor-Generated based on RTA Plan, RTA general ledger, audit adjustments, journal entries, and project status received from RTA and local jurisdictions; Acronyms: Rd = Road; Blvd = Boulevard; Dr = Drive; St = Street; Pkwy = Parkway; I = Interstate Note A = Only calculated if project is in-progress/on-going or not started; N/A (not applicable) if project is complete. Note B = Streetcar is complete and in service, however project includes ongoing operations; thus, counted as “on-going.”

SJOBERGEVASHENK 88 PAG RTA Plan Audit - 2017
[THIS PAGE LEFT BLANK FOR REPRODUCTION PURPOSES]

SJOBERGEVASHENK 89 PAG RTA Plan Audit - 2017
Appendix C: Project Budget-to-Actual Performance as of June 30, 2016
RTA Plan
Ballot ID
RTA Plan Project Name
RTA Plan Budget (in 000s) Actual Expenses (in 000s) Difference In RTA
Budget to Actual
Percent RTA
Budget Used
RTA Other Total RTA Other Total
Element I: Roadway Improvement
1 Tangerine Rd.: I-10
to La Canada $45,325 $28,890 $74,215 $10,285 $85 $10,370 -$35,040 23%
2
Camino de Manana:
Tangerine to Linda
Vista
$6,185 $9,500 $15,685 $6,186 $17,620 $23,806 $1 100%
3 Twin Peaks Rd:
Silverbell to I-10 $30,752 $45,670 $76,422 $14,479 $63,169 $77,648 -$16,273 47%
4 La Cholla Blvd:
Tangerine to Magee $42,233 $6,100 $48,333 $23,272 $2,202 $25,474 -$18,961 55%
5 Silverbell Rd: Ina to
Grant $42,653 $14,400 $57,053 $9,319 $2,585 $11,904 -$33,334 22%
6
Railroad Overpass
at Ina Road East of
I-10
$34,218 $20,165 $54,383 $52 $17,517 $17,569 -$34,166 0%
7
Magee Rd/Cortaro
Farms Rd: La
Canada to
Thornydale
$29,570 $3,700 $33,270 $29,570 $18,033 $47,603 $0 100%
8 Sunset Rd.:
Silverbell to River Rd $12,764 $10,000 $22,764 $909 $5,073 $5,982 -$11,855 7%
9
Ruthrauff Rd at I-10
and Railroad
Overpass
$59,364 $0 $59,364 $0 $3,163 $3,163 -$59,364 0%
10
La Cholla Blvd:
Ruthrauff to River
Rd
$14,760 $0 $14,760 $14,495 $3,476 $17,971 -$265 98%
11
La Canada Dr.:
Calle Concordia to
River Rd
$27,665 $14,066 $41,731 $27,667 $29,148 $56,815 $2 100%
12 Magee Rd: La
Canada to Oracle $5,850 $3,750 $9,600 $4,429 $10,932 $15,361 -$1,421 76%
13 First Ave: Orange
Grove to Ina $6,556 $700 $7,256 $0 $0 $0 -$6,556 0%
14 First Ave: River Rd
to Grant $71,398 $3,000 $74,398 $0 $0 $0 -$71,398 0%
15 Railroad Underpass
at Grant Rd $37,382 $319 $37,701 $0 $0 $0 -$37,382 0%
16 Downtown Links: I-
10 to Broadway $76,134 $8,540 $84,674 $38,278 $648 $38,926 -$37,856 50%
17
Broadway Blvd:
Euclid to Country
Club
$42,125 $29,222 $71,347 $7,801 $65 $7,866 -$34,324 19%
18 Grant Rd: Oracle to
Swan $160,850 $6,000 $166,850 $52,607 $2,997 $55,604 -$108,243 33%
19
22nd Street: I-10 to
Tucson/Barraza-
Aviation
$104,952 $3,000 $107,952 $42,194 $416 $42,610 -$62,758 40%
20
Barraza-Aviation
Pkwy: Palo Verde to
I-10
$19,600 $0 $19,600 $0 $0 $0 -$19,600 0%
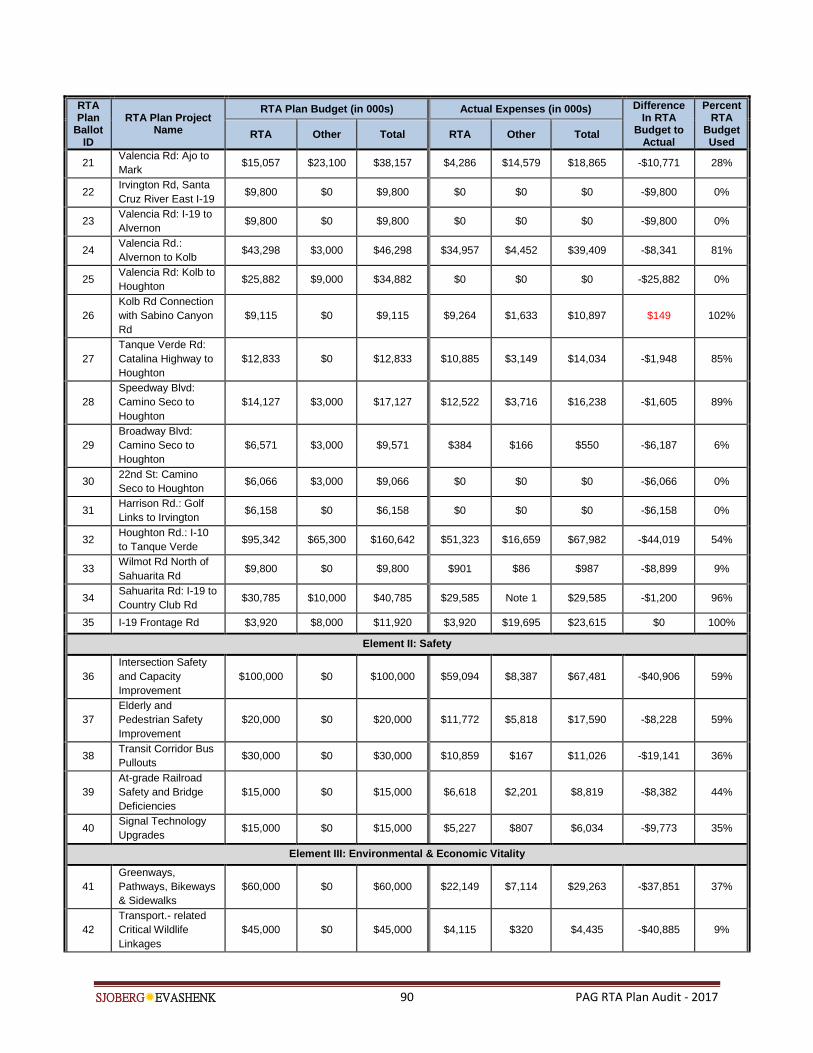
SJOBERGEVASHENK 90 PAG RTA Plan Audit - 2017
RTA Plan
Ballot ID
RTA Plan Project Name
RTA Plan Budget (in 000s) Actual Expenses (in 000s) Difference In RTA
Budget to Actual
Percent RTA
Budget Used
RTA Other Total RTA Other Total
21 Valencia Rd: Ajo to
Mark $15,057 $23,100 $38,157 $4,286 $14,579 $18,865 -$10,771 28%
22 Irvington Rd, Santa
Cruz River East I-19 $9,800 $0 $9,800 $0 $0 $0 -$9,800 0%
23 Valencia Rd: I-19 to
Alvernon $9,800 $0 $9,800 $0 $0 $0 -$9,800 0%
24 Valencia Rd.:
Alvernon to Kolb $43,298 $3,000 $46,298 $34,957 $4,452 $39,409 -$8,341 81%
25 Valencia Rd: Kolb to
Houghton $25,882 $9,000 $34,882 $0 $0 $0 -$25,882 0%
26
Kolb Rd Connection
with Sabino Canyon
Rd
$9,115 $0 $9,115 $9,264 $1,633 $10,897 $149 102%
27
Tanque Verde Rd:
Catalina Highway to
Houghton
$12,833 $0 $12,833 $10,885 $3,149 $14,034 -$1,948 85%
28
Speedway Blvd:
Camino Seco to
Houghton
$14,127 $3,000 $17,127 $12,522 $3,716 $16,238 -$1,605 89%
29
Broadway Blvd:
Camino Seco to
Houghton
$6,571 $3,000 $9,571 $384 $166 $550 -$6,187 6%
30 22nd St: Camino
Seco to Houghton $6,066 $3,000 $9,066 $0 $0 $0 -$6,066 0%
31 Harrison Rd.: Golf
Links to Irvington $6,158 $0 $6,158 $0 $0 $0 -$6,158 0%
32 Houghton Rd.: I-10
to Tanque Verde $95,342 $65,300 $160,642 $51,323 $16,659 $67,982 -$44,019 54%
33 Wilmot Rd North of
Sahuarita Rd $9,800 $0 $9,800 $901 $86 $987 -$8,899 9%
34 Sahuarita Rd: I-19 to
Country Club Rd $30,785 $10,000 $40,785 $29,585 Note 1 $29,585 -$1,200 96%
35 I-19 Frontage Rd $3,920 $8,000 $11,920 $3,920 $19,695 $23,615 $0 100%
Element II: Safety
36
Intersection Safety
and Capacity
Improvement
$100,000 $0 $100,000 $59,094 $8,387 $67,481 -$40,906 59%
37
Elderly and
Pedestrian Safety
Improvement
$20,000 $0 $20,000 $11,772 $5,818 $17,590 -$8,228 59%
38 Transit Corridor Bus
Pullouts $30,000 $0 $30,000 $10,859 $167 $11,026 -$19,141 36%
39
At-grade Railroad
Safety and Bridge
Deficiencies
$15,000 $0 $15,000 $6,618 $2,201 $8,819 -$8,382 44%
40 Signal Technology
Upgrades $15,000 $0 $15,000 $5,227 $807 $6,034 -$9,773 35%
Element III: Environmental & Economic Vitality
41
Greenways,
Pathways, Bikeways
& Sidewalks
$60,000 $0 $60,000 $22,149 $7,114 $29,263 -$37,851 37%
42
Transport.- related
Critical Wildlife
Linkages
$45,000 $0 $45,000 $4,115 $320 $4,435 -$40,885 9%
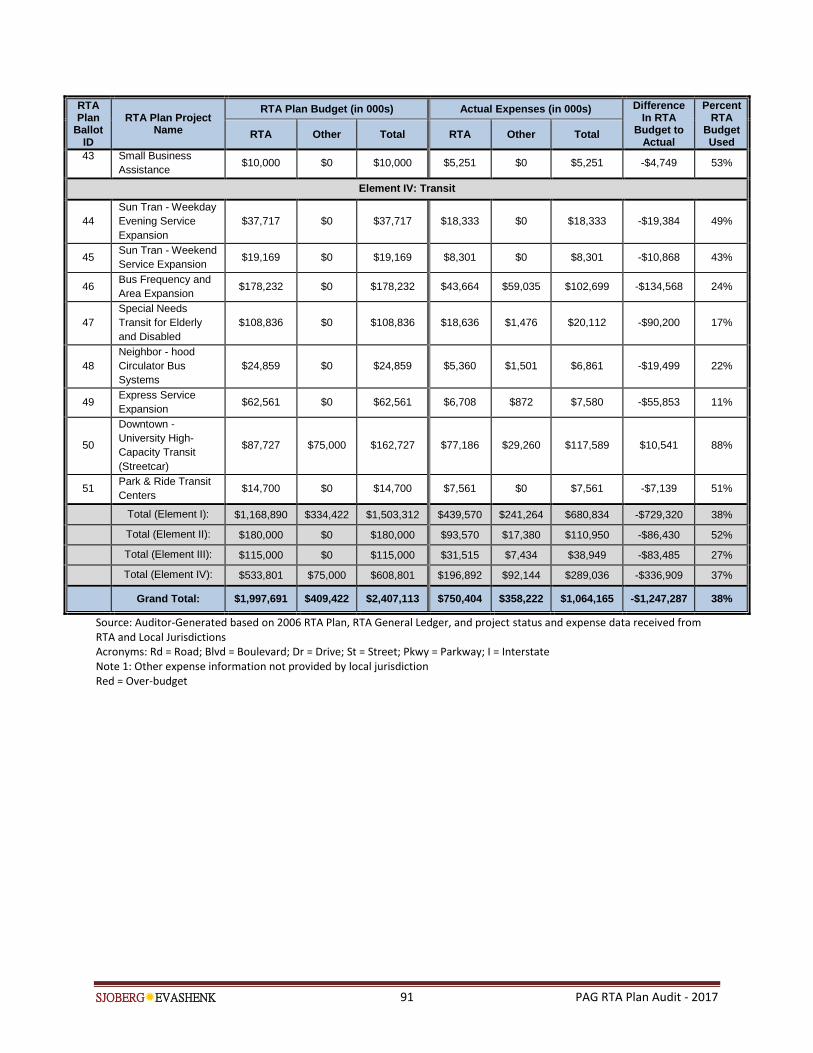
SJOBERGEVASHENK 91 PAG RTA Plan Audit - 2017
RTA Plan
Ballot ID
RTA Plan Project Name
RTA Plan Budget (in 000s) Actual Expenses (in 000s) Difference In RTA
Budget to Actual
Percent RTA
Budget Used
RTA Other Total RTA Other Total
43
Small Business
Assistance $10,000 $0 $10,000 $5,251 $0 $5,251 -$4,749 53%
Element IV: Transit
44
Sun Tran - Weekday
Evening Service
Expansion
$37,717 $0 $37,717 $18,333 $0 $18,333 -$19,384 49%
45 Sun Tran - Weekend
Service Expansion $19,169 $0 $19,169 $8,301 $0 $8,301 -$10,868 43%
46 Bus Frequency and
Area Expansion $178,232 $0 $178,232 $43,664 $59,035 $102,699 -$134,568 24%
47
Special Needs
Transit for Elderly
and Disabled
$108,836 $0 $108,836 $18,636 $1,476 $20,112 -$90,200 17%
48
Neighbor - hood
Circulator Bus
Systems
$24,859 $0 $24,859 $5,360 $1,501 $6,861 -$19,499 22%
49 Express Service
Expansion $62,561 $0 $62,561 $6,708 $872 $7,580 -$55,853 11%
50
Downtown -
University High-
Capacity Transit
(Streetcar)
$87,727 $75,000 $162,727 $77,186 $29,260 $117,589 $10,541 88%
51 Park & Ride Transit
Centers $14,700 $0 $14,700 $7,561 $0 $7,561 -$7,139 51%
Total (Element I): $1,168,890 $334,422 $1,503,312 $439,570 $241,264 $680,834 -$729,320 38%
Total (Element II): $180,000 $0 $180,000 $93,570 $17,380 $110,950 -$86,430 52%
Total (Element III): $115,000 $0 $115,000 $31,515 $7,434 $38,949 -$83,485 27%
Total (Element IV): $533,801 $75,000 $608,801 $196,892 $92,144 $289,036 -$336,909 37%
Grand Total: $1,997,691 $409,422 $2,407,113 $750,404 $358,222 $1,064,165 -$1,247,287 38%
Source: Auditor-Generated based on 2006 RTA Plan, RTA General Ledger, and project status and expense data received from RTA and Local Jurisdictions Acronyms: Rd = Road; Blvd = Boulevard; Dr = Drive; St = Street; Pkwy = Parkway; I = Interstate Note 1: Other expense information not provided by local jurisdiction Red = Over-budget

SJOBERGEVASHENK 92 PAG RTA Plan Audit - 2017
[THIS PAGE LEFT BLANK FOR REPRODUCTION PURPOSES]
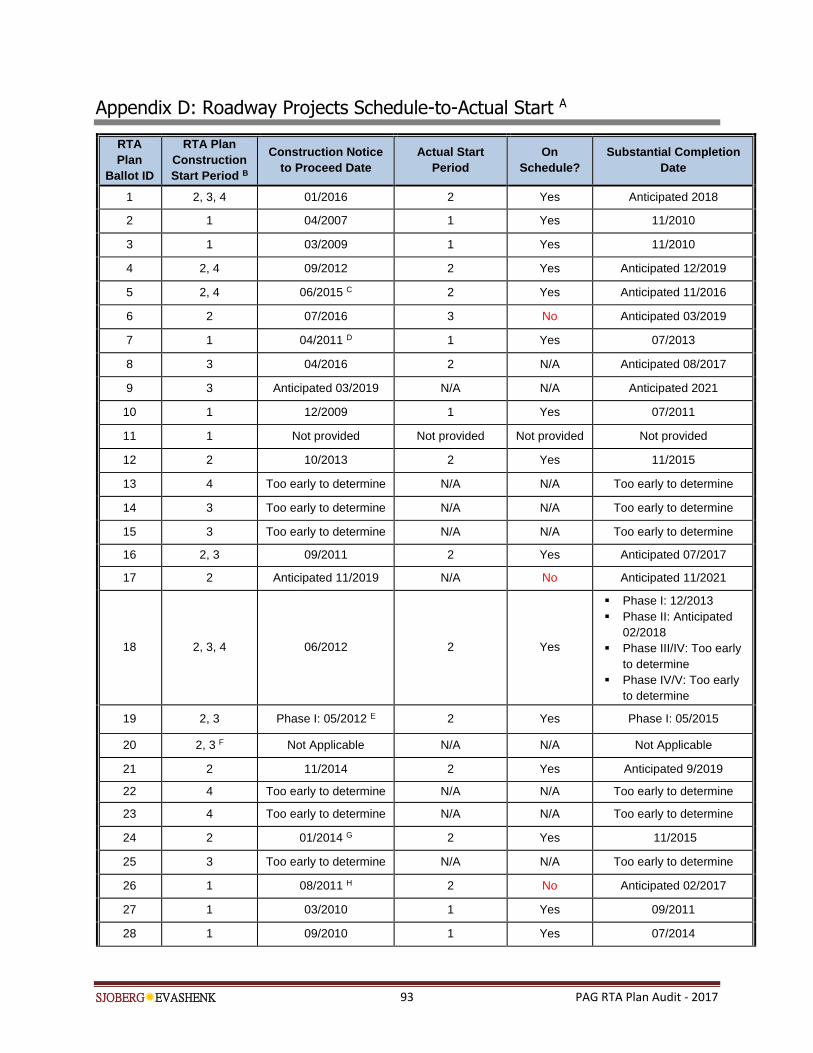
SJOBERGEVASHENK 93 PAG RTA Plan Audit - 2017
Appendix D: Roadway Projects Schedule-to-Actual Start A
RTA
Plan
Ballot ID
RTA Plan
Construction
Start Period B
Construction Notice
to Proceed Date
Actual Start
Period
On
Schedule?
Substantial Completion
Date
1 2, 3, 4 01/2016 2 Yes Anticipated 2018
2 1 04/2007 1 Yes 11/2010
3 1 03/2009 1 Yes 11/2010
4 2, 4 09/2012 2 Yes Anticipated 12/2019
5 2, 4 06/2015 C 2 Yes Anticipated 11/2016
6 2 07/2016 3 No Anticipated 03/2019
7 1 04/2011 D 1 Yes 07/2013
8 3 04/2016 2 N/A Anticipated 08/2017
9 3 Anticipated 03/2019 N/A N/A Anticipated 2021
10 1 12/2009 1 Yes 07/2011
11 1 Not provided Not provided Not provided Not provided
12 2 10/2013 2 Yes 11/2015
13 4 Too early to determine N/A N/A Too early to determine
14 3 Too early to determine N/A N/A Too early to determine
15 3 Too early to determine N/A N/A Too early to determine
16 2, 3 09/2011 2 Yes Anticipated 07/2017
17 2 Anticipated 11/2019 N/A No Anticipated 11/2021
18 2, 3, 4 06/2012 2 Yes
Phase I: 12/2013
Phase II: Anticipated
02/2018
Phase III/IV: Too early
to determine
Phase IV/V: Too early
to determine
19 2, 3 Phase I: 05/2012 E 2 Yes Phase I: 05/2015
20 2, 3 F Not Applicable N/A N/A Not Applicable
21 2 11/2014 2 Yes Anticipated 9/2019
22 4 Too early to determine N/A N/A Too early to determine
23 4 Too early to determine N/A N/A Too early to determine
24 2 01/2014 G 2 Yes 11/2015
25 3 Too early to determine N/A N/A Too early to determine
26 1 08/2011 H 2 No Anticipated 02/2017
27 1 03/2010 1 Yes 09/2011
28 1 09/2010 1 Yes 07/2014
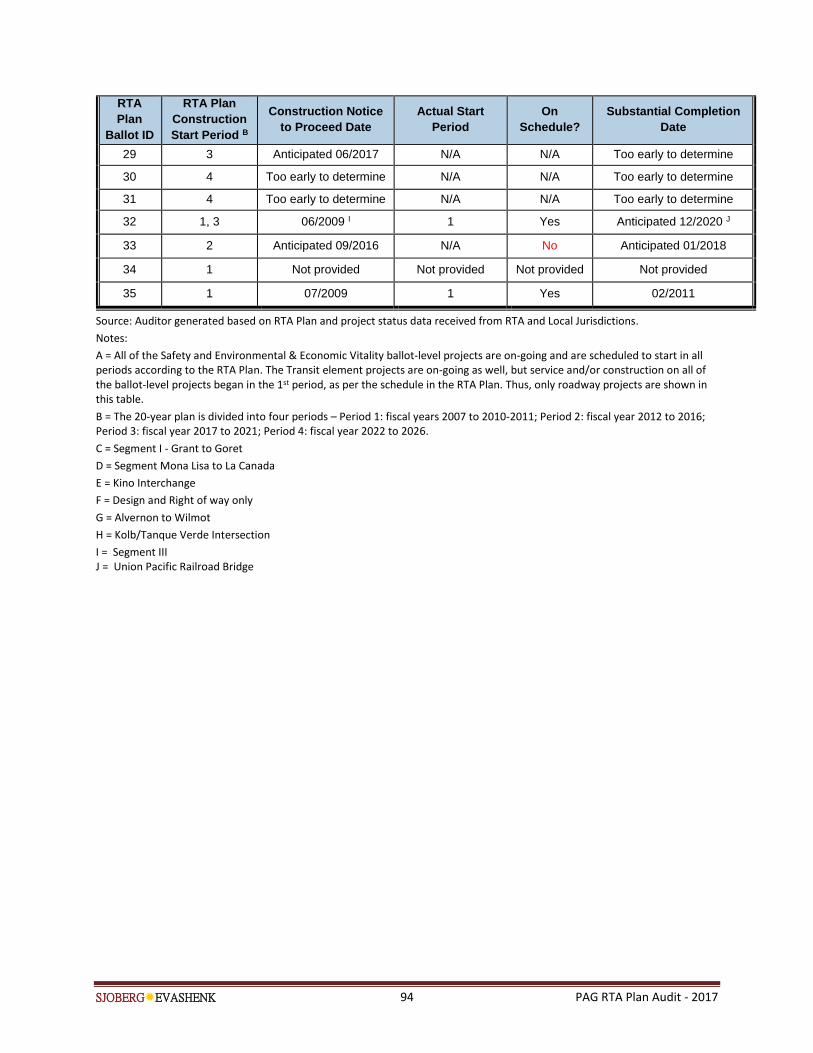
SJOBERGEVASHENK 94 PAG RTA Plan Audit - 2017
RTA
Plan
Ballot ID
RTA Plan
Construction
Start Period B
Construction Notice
to Proceed Date
Actual Start
Period
On
Schedule?
Substantial Completion
Date
29 3 Anticipated 06/2017 N/A N/A Too early to determine
30 4 Too early to determine N/A N/A Too early to determine
31 4 Too early to determine N/A N/A Too early to determine
32 1, 3 06/2009 I 1 Yes Anticipated 12/2020 J
33 2 Anticipated 09/2016 N/A No Anticipated 01/2018
34 1 Not provided Not provided Not provided Not provided
35 1 07/2009 1 Yes 02/2011
Source: Auditor generated based on RTA Plan and project status data received from RTA and Local Jurisdictions.
Notes:
A = All of the Safety and Environmental & Economic Vitality ballot-level projects are on-going and are scheduled to start in all periods according to the RTA Plan. The Transit element projects are on-going as well, but service and/or construction on all of the ballot-level projects began in the 1st period, as per the schedule in the RTA Plan. Thus, only roadway projects are shown in this table.
B = The 20-year plan is divided into four periods – Period 1: fiscal years 2007 to 2010-2011; Period 2: fiscal year 2012 to 2016; Period 3: fiscal year 2017 to 2021; Period 4: fiscal year 2022 to 2026.
C = Segment I - Grant to Goret
D = Segment Mona Lisa to La Canada
E = Kino Interchange
F = Design and Right of way only
G = Alvernon to Wilmot
H = Kolb/Tanque Verde Intersection
I = Segment III J = Union Pacific Railroad Bridge
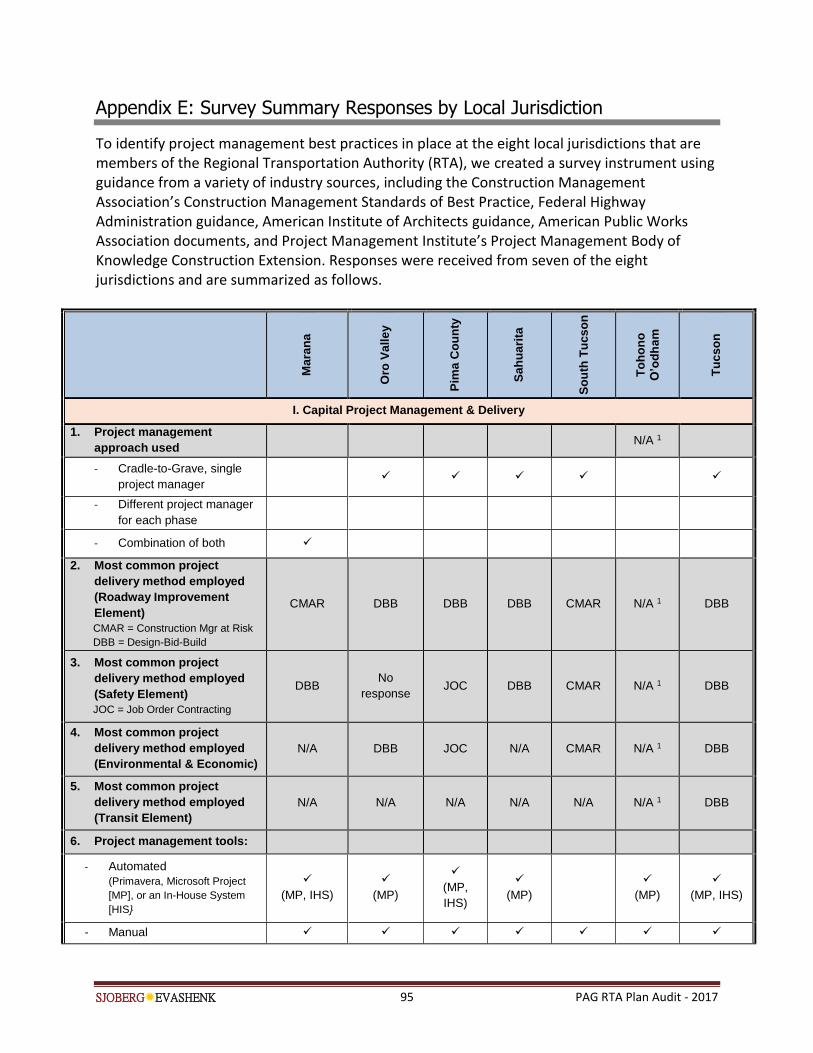
SJOBERGEVASHENK 95 PAG RTA Plan Audit - 2017
Appendix E: Survey Summary Responses by Local Jurisdiction
To identify project management best practices in place at the eight local jurisdictions that are members of the Regional Transportation Authority (RTA), we created a survey instrument using guidance from a variety of industry sources, including the Construction Management Association’s Construction Management Standards of Best Practice, Federal Highway Administration guidance, American Institute of Architects guidance, American Public Works Association documents, and Project Management Institute’s Project Management Body of Knowledge Construction Extension. Responses were received from seven of the eight jurisdictions and are summarized as follows.
Ma
ran
a
Oro
Va
lle
y
Pim
a C
ou
nty
Sa
hu
ari
ta
So
uth
Tu
cs
on
To
ho
no
O’o
dh
am
Tu
cs
on
I. Capital Project Management & Delivery
1. Project management
approach used N/A 1
- Cradle-to-Grave, single
project manager
- Different project manager
for each phase
- Combination of both
2. Most common project
delivery method employed
(Roadway Improvement
Element)
CMAR = Construction Mgr at Risk
DBB = Design-Bid-Build
CMAR DBB DBB DBB CMAR N/A 1 DBB
3. Most common project
delivery method employed
(Safety Element)
JOC = Job Order Contracting
DBB No
response JOC DBB CMAR N/A 1 DBB
4. Most common project
delivery method employed
(Environmental & Economic)
N/A DBB JOC N/A CMAR N/A 1 DBB
5. Most common project
delivery method employed
(Transit Element)
N/A N/A N/A N/A N/A N/A 1 DBB
6. Project management tools:
- Automated
(Primavera, Microsoft Project
[MP], or an In-House System
[HIS}
(MP, IHS)
(MP)
(MP,
IHS)
(MP)
(MP)
(MP, IHS)
- Manual
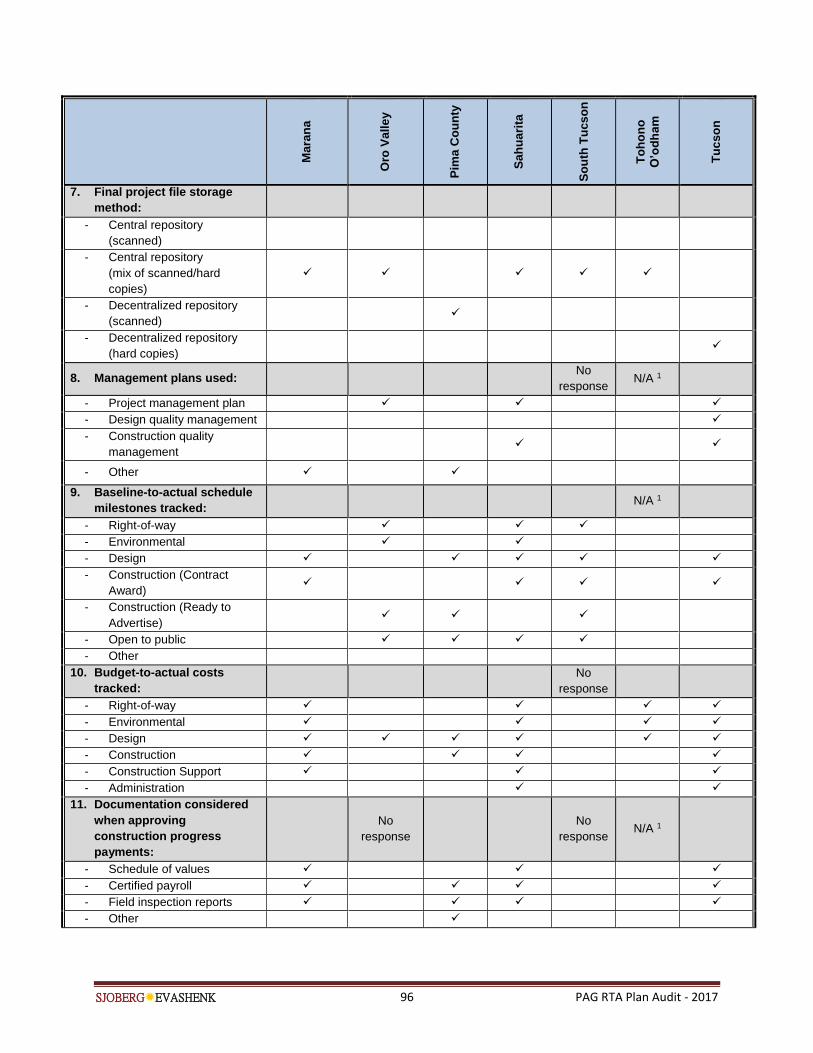
SJOBERGEVASHENK 96 PAG RTA Plan Audit - 2017
Ma
ran
a
Oro
Va
lle
y
Pim
a C
ou
nty
Sa
hu
ari
ta
So
uth
Tu
cs
on
To
ho
no
O’o
dh
am
Tu
cs
on
7. Final project file storage
method:
- Central repository
(scanned)
- Central repository
(mix of scanned/hard
copies)
- Decentralized repository
(scanned)
- Decentralized repository
(hard copies)
8. Management plans used: No
response N/A 1
- Project management plan
- Design quality management
- Construction quality
management
- Other
9. Baseline-to-actual schedule
milestones tracked: N/A 1
- Right-of-way
- Environmental
- Design
- Construction (Contract
Award)
- Construction (Ready to
Advertise)
- Open to public
- Other
10. Budget-to-actual costs
tracked:
No
response
- Right-of-way
- Environmental
- Design
- Construction
- Construction Support
- Administration
11. Documentation considered
when approving
construction progress
payments:
No
response
No
response N/A 1
- Schedule of values
- Certified payroll
- Field inspection reports
- Other
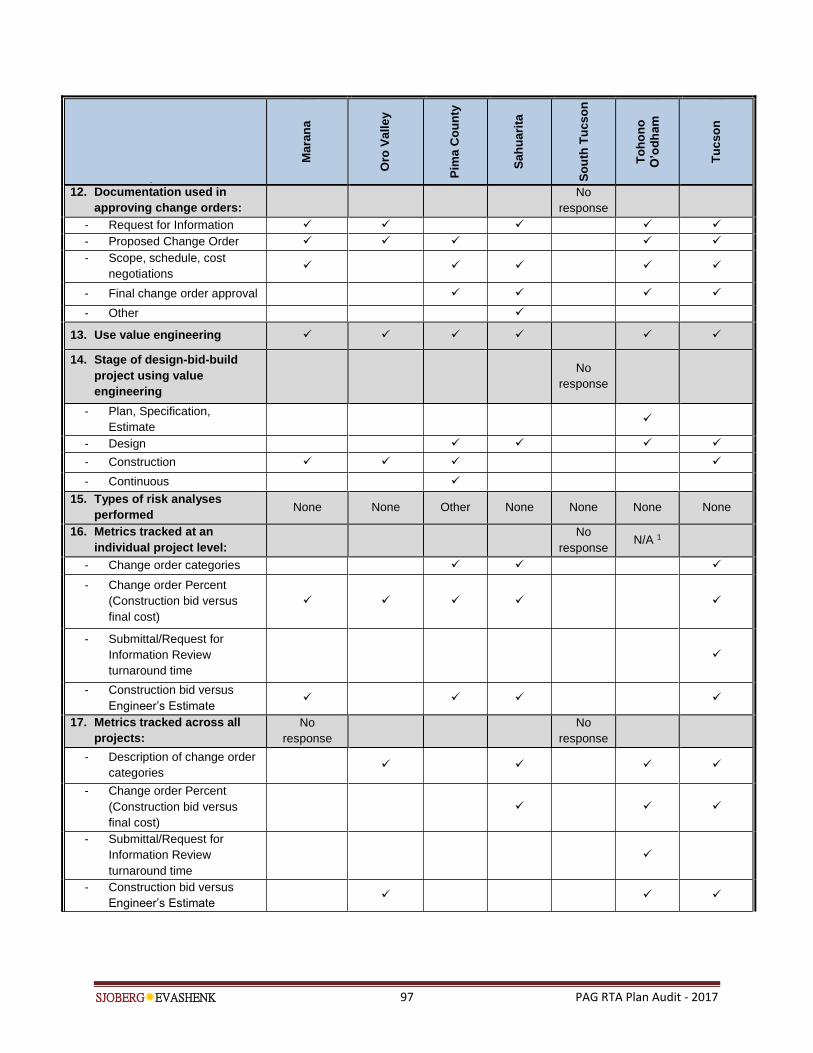
SJOBERGEVASHENK 97 PAG RTA Plan Audit - 2017
Ma
ran
a
Oro
Va
lle
y
Pim
a C
ou
nty
Sa
hu
ari
ta
So
uth
Tu
cs
on
To
ho
no
O’o
dh
am
Tu
cs
on
12. Documentation used in
approving change orders:
No
response
- Request for Information
- Proposed Change Order
- Scope, schedule, cost
negotiations
- Final change order approval
- Other
13. Use value engineering
14. Stage of design-bid-build
project using value
engineering
No
response
- Plan, Specification,
Estimate
- Design
- Construction
- Continuous
15. Types of risk analyses
performed None None Other None None None None
16. Metrics tracked at an
individual project level:
No
response N/A 1
- Change order categories
- Change order Percent
(Construction bid versus
final cost)
- Submittal/Request for
Information Review
turnaround time
- Construction bid versus
Engineer’s Estimate
17. Metrics tracked across all
projects:
No
response
No
response
- Description of change order
categories
- Change order Percent
(Construction bid versus
final cost)
- Submittal/Request for
Information Review
turnaround time
- Construction bid versus
Engineer’s Estimate
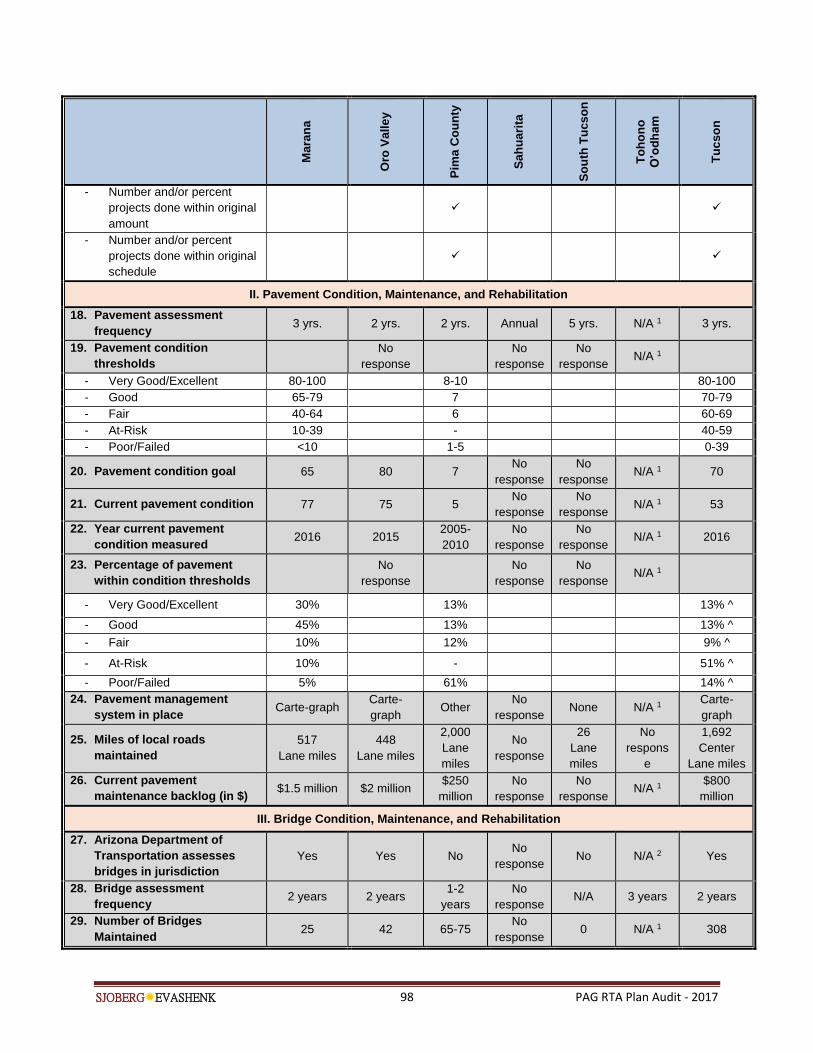
SJOBERGEVASHENK 98 PAG RTA Plan Audit - 2017
Ma
ran
a
Oro
Va
lle
y
Pim
a C
ou
nty
Sa
hu
ari
ta
So
uth
Tu
cs
on
To
ho
no
O’o
dh
am
Tu
cs
on
- Number and/or percent
projects done within original
amount
- Number and/or percent
projects done within original
schedule
II. Pavement Condition, Maintenance, and Rehabilitation
18. Pavement assessment
frequency 3 yrs. 2 yrs. 2 yrs. Annual 5 yrs. N/A 1 3 yrs.
19. Pavement condition
thresholds
No
response
No
response
No
response N/A 1
- Very Good/Excellent 80-100 8-10 80-100
- Good 65-79 7 70-79
- Fair 40-64 6 60-69
- At-Risk 10-39 - 40-59
- Poor/Failed <10 1-5 0-39
20. Pavement condition goal 65 80 7 No
response
No
response N/A 1 70
21. Current pavement condition 77 75 5 No
response
No
response N/A 1 53
22. Year current pavement
condition measured 2016 2015
2005-
2010
No
response
No
response N/A 1 2016
23. Percentage of pavement
within condition thresholds
No
response
No
response
No
response N/A 1
- Very Good/Excellent 30% 13% 13% ^
- Good 45% 13% 13% ^
- Fair 10% 12% 9% ^
- At-Risk 10% - 51% ^
- Poor/Failed 5% 61% 14% ^
24. Pavement management
system in place Carte-graph
Carte-
graph Other
No
response None N/A 1
Carte-
graph
25. Miles of local roads
maintained
517
Lane miles
448
Lane miles
2,000
Lane
miles
No
response
26
Lane
miles
No
respons
e
1,692
Center
Lane miles
26. Current pavement
maintenance backlog (in $) $1.5 million $2 million
$250
million
No
response
No
response N/A 1
$800
million
III. Bridge Condition, Maintenance, and Rehabilitation
27. Arizona Department of
Transportation assesses
bridges in jurisdiction
Yes Yes No No
response No N/A 2 Yes
28. Bridge assessment
frequency 2 years 2 years
1-2
years
No
response N/A 3 years 2 years
29. Number of Bridges
Maintained 25 42 65-75
No
response 0 N/A 1 308
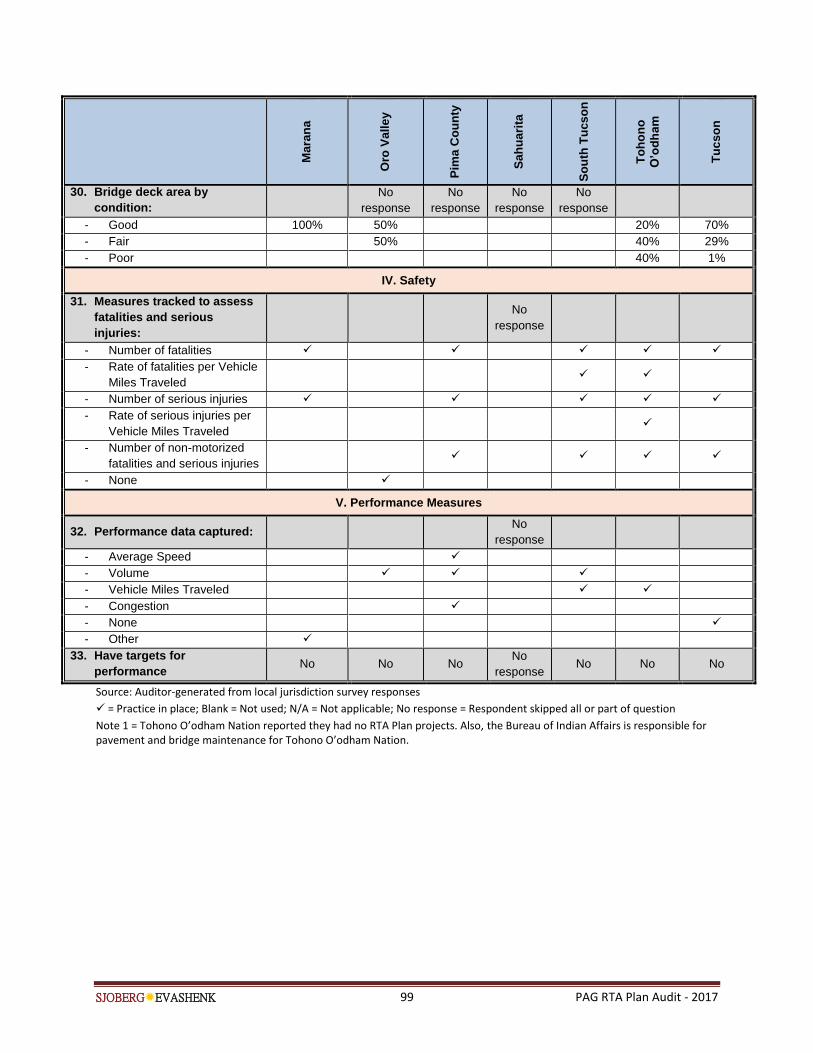
SJOBERGEVASHENK 99 PAG RTA Plan Audit - 2017
Ma
ran
a
Oro
Va
lle
y
Pim
a C
ou
nty
Sa
hu
ari
ta
So
uth
Tu
cs
on
To
ho
no
O’o
dh
am
Tu
cs
on
30. Bridge deck area by
condition:
No
response
No
response
No
response
No
response
- Good 100% 50% 20% 70%
- Fair 50% 40% 29%
- Poor 40% 1%
IV. Safety
31. Measures tracked to assess
fatalities and serious
injuries:
No
response
- Number of fatalities
- Rate of fatalities per Vehicle
Miles Traveled
- Number of serious injuries
- Rate of serious injuries per
Vehicle Miles Traveled
- Number of non-motorized
fatalities and serious injuries
- None
V. Performance Measures
32. Performance data captured: No
response
- Average Speed
- Volume
- Vehicle Miles Traveled
- Congestion
- None
- Other
33. Have targets for
performance No No No
No
response No No No
Source: Auditor-generated from local jurisdiction survey responses
= Practice in place; Blank = Not used; N/A = Not applicable; No response = Respondent skipped all or part of question
Note 1 = Tohono O’odham Nation reported they had no RTA Plan projects. Also, the Bureau of Indian Affairs is responsible for pavement and bridge maintenance for Tohono O’odham Nation.
SJOBERGEVASHENK 100 PAG RTA Plan Audit - 2017
[THIS PAGE LEFT BLANK FOR REPRODUCTION PURPOSES]
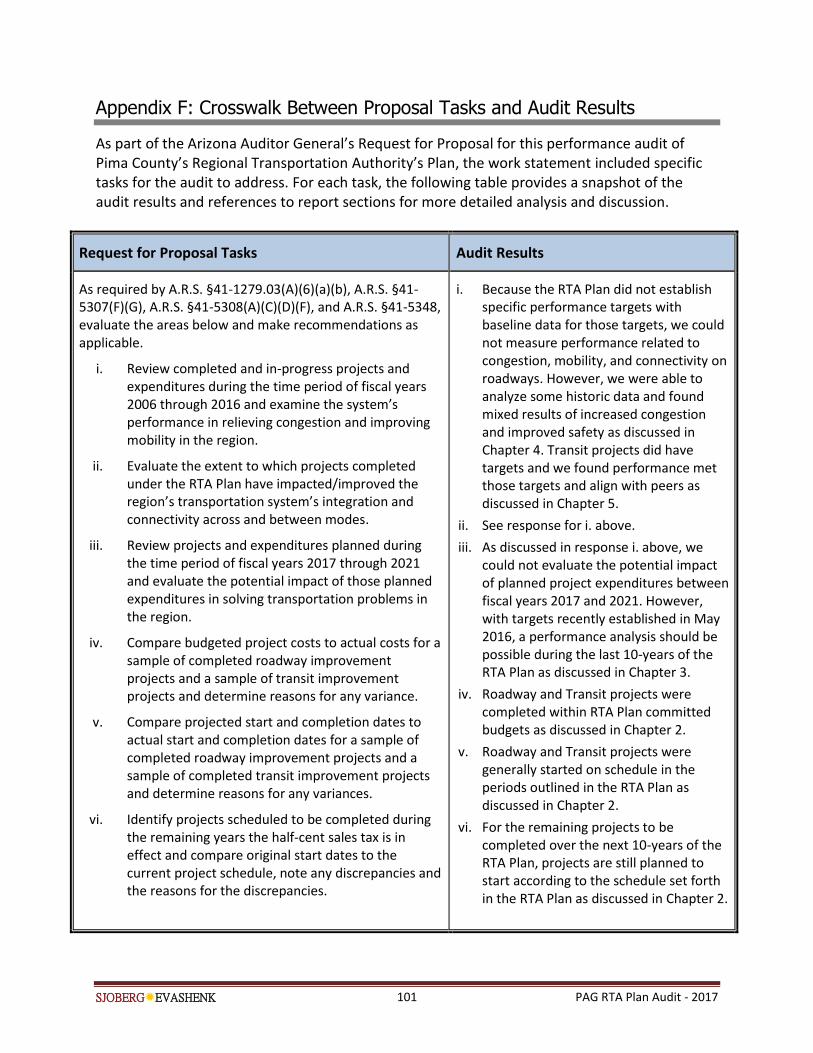
SJOBERGEVASHENK 101 PAG RTA Plan Audit - 2017
Appendix F: Crosswalk Between Proposal Tasks and Audit Results
As part of the Arizona Auditor General’s Request for Proposal for this performance audit of Pima County’s Regional Transportation Authority’s Plan, the work statement included specific tasks for the audit to address. For each task, the following table provides a snapshot of the audit results and references to report sections for more detailed analysis and discussion.
Request for Proposal Tasks Audit Results
As required by A.R.S. §41-1279.03(A)(6)(a)(b), A.R.S. §41-5307(F)(G), A.R.S. §41-5308(A)(C)(D)(F), and A.R.S. §41-5348, evaluate the areas below and make recommendations as applicable.
i. Review completed and in-progress projects and expenditures during the time period of fiscal years 2006 through 2016 and examine the system’s performance in relieving congestion and improving mobility in the region.
ii. Evaluate the extent to which projects completed under the RTA Plan have impacted/improved the region’s transportation system’s integration and connectivity across and between modes.
iii. Review projects and expenditures planned during the time period of fiscal years 2017 through 2021 and evaluate the potential impact of those planned expenditures in solving transportation problems in the region.
iv. Compare budgeted project costs to actual costs for a sample of completed roadway improvement projects and a sample of transit improvement projects and determine reasons for any variance.
v. Compare projected start and completion dates to actual start and completion dates for a sample of completed roadway improvement projects and a sample of completed transit improvement projects and determine reasons for any variances.
vi. Identify projects scheduled to be completed during the remaining years the half-cent sales tax is in effect and compare original start dates to the current project schedule, note any discrepancies and the reasons for the discrepancies.
i. Because the RTA Plan did not establish specific performance targets with baseline data for those targets, we could not measure performance related to congestion, mobility, and connectivity on roadways. However, we were able to analyze some historic data and found mixed results of increased congestion and improved safety as discussed in Chapter 4. Transit projects did have targets and we found performance met those targets and align with peers as discussed in Chapter 5.
ii. See response for i. above.
iii. As discussed in response i. above, we could not evaluate the potential impact of planned project expenditures between fiscal years 2017 and 2021. However, with targets recently established in May 2016, a performance analysis should be possible during the last 10-years of the RTA Plan as discussed in Chapter 3.
iv. Roadway and Transit projects were completed within RTA Plan committed budgets as discussed in Chapter 2.
v. Roadway and Transit projects were generally started on schedule in the periods outlined in the RTA Plan as discussed in Chapter 2.
vi. For the remaining projects to be completed over the next 10-years of the RTA Plan, projects are still planned to start according to the schedule set forth in the RTA Plan as discussed in Chapter 2.
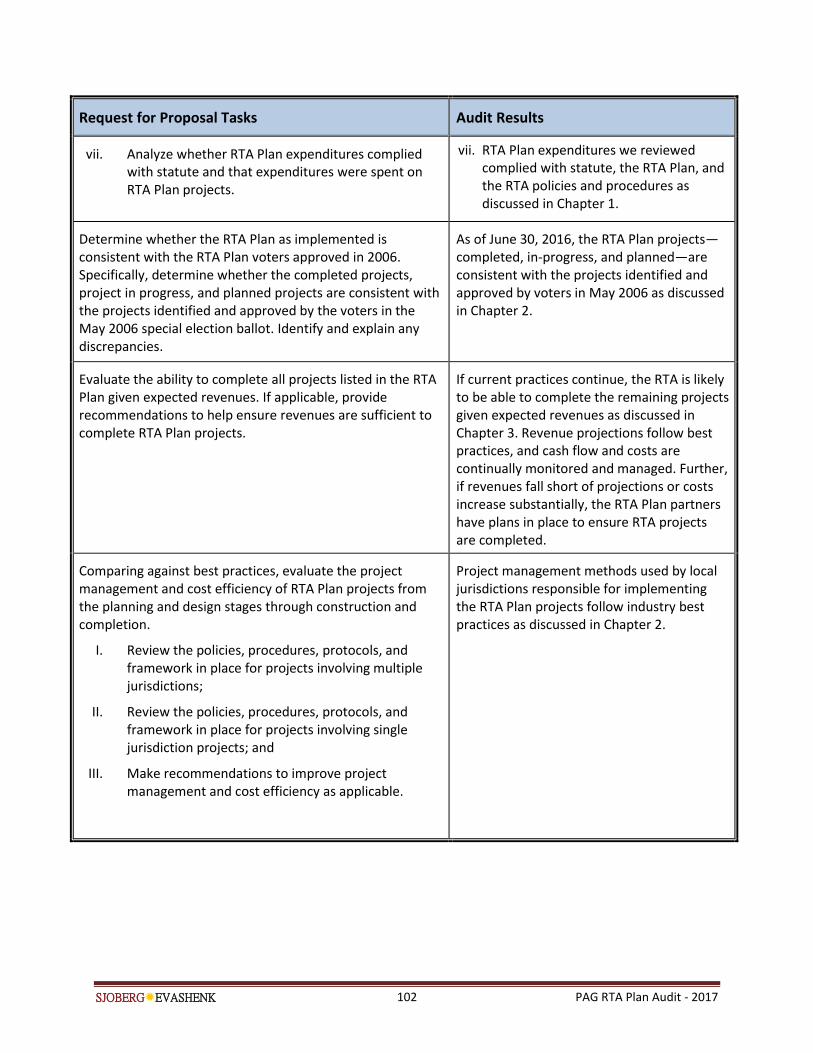
SJOBERGEVASHENK 102 PAG RTA Plan Audit - 2017
Request for Proposal Tasks Audit Results
vii. Analyze whether RTA Plan expenditures complied with statute and that expenditures were spent on RTA Plan projects.
vii. RTA Plan expenditures we reviewed complied with statute, the RTA Plan, and the RTA policies and procedures as discussed in Chapter 1.
Determine whether the RTA Plan as implemented is consistent with the RTA Plan voters approved in 2006. Specifically, determine whether the completed projects, project in progress, and planned projects are consistent with the projects identified and approved by the voters in the May 2006 special election ballot. Identify and explain any discrepancies.
As of June 30, 2016, the RTA Plan projects—completed, in-progress, and planned—are consistent with the projects identified and approved by voters in May 2006 as discussed in Chapter 2.
Evaluate the ability to complete all projects listed in the RTA Plan given expected revenues. If applicable, provide recommendations to help ensure revenues are sufficient to complete RTA Plan projects.
If current practices continue, the RTA is likely to be able to complete the remaining projects given expected revenues as discussed in Chapter 3. Revenue projections follow best practices, and cash flow and costs are continually monitored and managed. Further, if revenues fall short of projections or costs increase substantially, the RTA Plan partners have plans in place to ensure RTA projects are completed.
Comparing against best practices, evaluate the project management and cost efficiency of RTA Plan projects from the planning and design stages through construction and completion.
I. Review the policies, procedures, protocols, and framework in place for projects involving multiple jurisdictions;
II. Review the policies, procedures, protocols, and framework in place for projects involving single jurisdiction projects; and
III. Make recommendations to improve project management and cost efficiency as applicable.
Project management methods used by local jurisdictions responsible for implementing the RTA Plan projects follow industry best practices as discussed in Chapter 2.
103
104
105
SJOBERGEVASHENK 106 PAG RTA Plan Audit - 2017
[THIS PAGE LEFT BLANK FOR REPRODUCTION PURPOSES]

107
Related Documents