PIIOSPIIORUS EXCRETION BY ZOOPLANKTON Barry T. Haqyme’ and Glen H. Geed Dcpartmcnt of Biology, Dalhousie University, Halifax, Nova Scotia ABSTRACT The cxcrction of dissolved inorganic and organic phosphorus by scvcrnl species of marinc crustaceans and a planktonic rotifer was measured under laboratory conditions. The rate of excretion decrcascd as bacterial activity and duration of cxperimcnts increasctl and was directly related to tempcraturc and salinity. Excretion rates were higher in early evening than at other times of day. The claily phosphorus r&miremcnts of the phytoplankton, calculated from 14C mcasurcd rates of production and an assunrcd C : P ratio of 40 : 1, were compared with phosphorus released by zooplankton. The rates of excretion and the abundance of zooplankton were used to calculate an average daily adclition of inorganic phosphorus to the photic zone. Jn Bras d’Or Lake, zooplankton released twice the average daily phytoplankton phosphorus requirement; in Morrison’s Pond, only one-fifth was supplied by animal excretion. Micro- zooplankton excretion (not considered in this study) may explain the discrepancy between phytoplankton rcquiremcnts and rcgencrntion rate in Morrison’s Pond. Phosphorus sup- plied from the hypolimnion by eddy diEfusion in Bras d’Or Lake was one-tenth that rc- generated by the-zooplankton- - In Bras d’Or Lake and Morrison’s Pond, Nova Scotia, enrichment cxpcriments using various inorganic salts showed that phos- phatc led to the most pronounced increase in algal growth and may have been present in limiting concentrations (Hargravc 1965). Phosphorus concentrations were low and relatively constant throughout summer, so a rapid mechanism of regeneration must be operating. This study evaluates the cxcrc- tion of inorganic phosphorus by zooplank- ton as a rcgcnerative mechanism. In recent years scvcral workers have demonstrated the cxcrction of inorganic phosphorus (Pomeroy, Mathews, and Min 1963; Johannes 1964c) and nitrogen (Harris 1959) by zooplankton. Barlow and Bishop (1965) mcasurcd the excretion of phos- phorus by zooplankton in Cayuga Lake and concluded that the amount would meet phytoplankton requirements. WC have mca- surcd excretion in controlled laboratory cx- pcriments and have cvaluatcd the cffccts of various cxperimen tal and cnvironmcntal paramctcrs on excretion rate. -- L F’rescnt address: Department of Zoology, Uni- vcrsity of British Columbia, Vancouver 8, B.C. 2 E’rcsent address : Department of Biological Sciences, Simon Fraser University, Burnaby 2, B.C. This study was conducted in Bras d’Or Lake and adjacent Morrison’s Pond on Cape Brcton Island, Nova Scotia; carlicr work provided information on the rate of algal photosynthesis, nutrient concentrations, and zooplankton abundance (Geen 1965; Gecn and Hargravc 1966; Hargrave 1965). This work was conducted at Dalhousie University, IIalifax, Nova Scotia, and sup- ported by a National Rcscarch Council studentship held by BII. and by a National Research Council grant-in-aid of research held by Drs. K. E. von Maltzahn and G. A. Riley. Grateful acknowledgments arc cx- tended to M. Muhammad, D. J. MacDonald, and E. Christiansen for assistance in the field. Drs. D. II. Chitty and P. A. Larkin rcviewcd the manuscript. MATERIALS AND METHODS To determine the rate of excretion of dissolved organic (DOP) and inorganic (DIP) phosphorus, WC used planktonic copepods from Bras d’Or Lake and adjacent brackish Morrison’s Pond. Bras d’Or Lake, an cncloscd arm of the Atlantic Ocean, is connected to the ocean by three channels and has surface salinities ranging Erom 20- 25%. Morrison’s Pond is separated Erom Bras d’Or Lake by a narrow gravel beach. 332

Welcome message from author
This document is posted to help you gain knowledge. Please leave a comment to let me know what you think about it! Share it to your friends and learn new things together.
Transcript
PIIOSPIIORUS EXCRETION BY ZOOPLANKTON
Barry T. Haqyme’ and Glen H. Geed Dcpartmcnt of Biology, Dalhousie University, Halifax, Nova Scotia
ABSTRACT
The cxcrction of dissolved inorganic and organic phosphorus by scvcrnl species of marinc crustaceans and a planktonic rotifer was measured under laboratory conditions. The rate of excretion decrcascd as bacterial activity and duration of cxperimcnts increasctl and was directly related to tempcraturc and salinity. Excretion rates were higher in early evening than at other times of day.
The claily phosphorus r&miremcnts of the phytoplankton, calculated from 14C mcasurcd rates of production and an assunrcd C : P ratio of 40 : 1, were compared with phosphorus released by zooplankton. The rates of excretion and the abundance of zooplankton were used to calculate an average daily adclition of inorganic phosphorus to the photic zone. Jn Bras d’Or Lake, zooplankton released twice the average daily phytoplankton phosphorus requirement; in Morrison’s Pond, only one-fifth was supplied by animal excretion. Micro- zooplankton excretion (not considered in this study) may explain the discrepancy between phytoplankton rcquiremcnts and rcgencrntion rate in Morrison’s Pond. Phosphorus sup- plied from the hypolimnion by eddy diEfusion in Bras d’Or Lake was one-tenth that rc- generated by the-zooplankton- -
In Bras d’Or Lake and Morrison’s Pond, Nova Scotia, enrichment cxpcriments using various inorganic salts showed that phos- phatc led to the most pronounced increase in algal growth and may have been present in limiting concentrations (Hargravc 1965). Phosphorus concentrations were low and relatively constant throughout summer, so a rapid mechanism of regeneration must be operating. This study evaluates the cxcrc- tion of inorganic phosphorus by zooplank- ton as a rcgcnerative mechanism.
In recent years scvcral workers have demonstrated the cxcrction of inorganic phosphorus (Pomeroy, Mathews, and Min 1963; Johannes 1964c) and nitrogen (Harris 1959) by zooplankton. Barlow and Bishop (1965) mcasurcd the excretion of phos- phorus by zooplankton in Cayuga Lake and concluded that the amount would meet phytoplankton requirements. WC have mca- surcd excretion in controlled laboratory cx- pcriments and have cvaluatcd the cffccts of various cxperimen tal and cnvironmcntal paramctcrs on excretion rate. --
L F’rescnt address: Department of Zoology, Uni- vcrsity of British Columbia, Vancouver 8, B.C.
2 E’rcsent address : Department of Biological Sciences, Simon Fraser University, Burnaby 2, B.C.
This study was conducted in Bras d’Or Lake and adjacent Morrison’s Pond on Cape Brcton Island, Nova Scotia; carlicr work provided information on the rate of algal photosynthesis, nutrient concentrations, and zooplankton abundance (Geen 1965; Gecn and Hargravc 1966; Hargrave 1965).
This work was conducted at Dalhousie University, IIalifax, Nova Scotia, and sup- ported by a National Rcscarch Council studentship held by BII. and by a National Research Council grant-in-aid of research held by Drs. K. E. von Maltzahn and G. A. Riley. Grateful acknowledgments arc cx- tended to M. Muhammad, D. J. MacDonald, and E. Christiansen for assistance in the field. Drs. D. II. Chitty and P. A. Larkin rcviewcd the manuscript.
MATERIALS AND METHODS
To determine the rate of excretion of dissolved organic (DOP) and inorganic (DIP) phosphorus, WC used planktonic copepods from Bras d’Or Lake and adjacent brackish Morrison’s Pond. Bras d’Or Lake, an cncloscd arm of the Atlantic Ocean, is connected to the ocean by three channels and has surface salinities ranging Erom 20- 25%. Morrison’s Pond is separated Erom Bras d’Or Lake by a narrow gravel beach.
332
ZOOPLANKTON PIIOSl?IIORUS EXCRETION 333
Salinities ranged from 5% at the surface to 23% at the bottom (4.5 m ) during summer 1965. Further details of the study area arc :rcportcd by Geen ( 1965).
The copepods Pseudocalanus minutus :Kr@ycr, Temora longicorn.is Miiller, and Qithona similis Claus were obtained from Bras d’Or Lake with a 0.3-m-diam NO. 10 nylon net towed slowly for brief periods at cl Id to 10 XL Acartia towa Dana was col- l&ted with a No. 2, 6, or 10 net in Morri- son’s Pond at 2 m. Asplanch,na sp., a com- mon rotifer in Morrison’s Pond, was taken I+om surface waters with a No. 10 net. ,$ftcr collection the zooplankton were trans- I&red to a 2-liter dark-glass bottle; water from the sampling depth was added to pre- 1Jcnt overcrowding. Samples were main- taincd at in situ tcmpcraturcs until the cxpcrimcnts. Benthic crustaceans ,$Vysis c~mericanus, Crangon septumspinosus, and Gammal-us oceanicus) were collected from the littoral areas of a shallow bay.
Samples were usually collected bctwccn 0800 and 1000 hours, and cxperimcnts com- menced within an hour. Water obtained from the depth at which the animals were collected was strained through a 35p-pore- diam net into tight 275-ml black-taped bottles. This proccdurc removed most of the zooplankton but did not affect the phytoplankton population (primarily flag- cIlatcs < 15 p in max dimension). Active snimals were added to four or more bottles --the remaining containers acting as con- trols. In experiments with benthic sp&es, single animals were placed in cxpcrimental 1)ottlcs. Antibiotics at a concentration of 50 mg/liter of p cnicillin G and 100 mg/ liter of streptomycin sulfate were added to some of the expcrimcntal and control hot- ties to rcducc bacterial uptake of the cx- creted phosphorus. The effectivcncss of this procedure, which inhibited bacterial activity for up to 12 hr, was evaluated by plating 1 ml of sample on ZoBell’s 2216 nutrient medium and counting colonies after 18-24-hr incubation at 18C. We measured zooplankton respiration and up- take of 14C by the flagellated phytoplank- ton in four cxperimcnts; these rates were
not significantly changed by the addition of antibiotics.
During experiments with plankton, bot- tics wcrc rotated at 0.25, rpm in a constant tcmperaturc water bath; this rate main- tained plankton homogeneity. After count- ing the animals in each bottle at the end of the experiment, we dctcrmined excretion by comparing phosphorus concentrations in the sample and control bottles.
A second method used to detcrminc phosphorus excretion was to follow changes in body phosphorus during extended pc- riods of starvation. A 5-liter sample of membrane-filtered water containing 500 copepods was maintained at in situ tem- pcrature for up to four days. Antibiotics were added at the beginning of the expcri- mcnt and at 12-hr intervals thcrcafter .to limit bacterial growth. Periodically lo-20 animals were rcmovcd, rinsed with distilled water and transfcrrcd to a beaker for total phosphorus determinations. At the same time, a 3OO-ml sample of the water that had contained the starved animals was mcmbranc filtcrcd and analyzed for dis- solved inorganic and total phosphorus.
We have assumed that the increase in DIP and DOP we measured was due to the excretory activity of the planktonic animals. It is possible that epizoic bacteria break down organic compounds, and also that DIP or DOP is leached out of fecal pcllcts, relcascd from partially digested food, or produced by the action of enzymes present in water. No attempt has been made to distinguish true excretion from these methods of phosphorus rclcase.
Total phosphorus and dissolved inor- ganic phosphorus wcrc determined as dc- scribed by Strickland and Parsons ( 1965). Our terms DIP and DOP are equivalent to their terms SRP and SUP, Since DIP was higher in unfiltered than filtcrcd water, probably owing to charring of particulate matter, all samples were passed through prerinscd 47-mm-diam HA Millipore filters before DIP analysis. Dissolved organic phosphorus was considered to bc the dif- ference bctwecn total phosphorus and DTP, since all particulate matter had been rc-
334 BARRY T. HARGRAVE AND GLEN H. GEEN
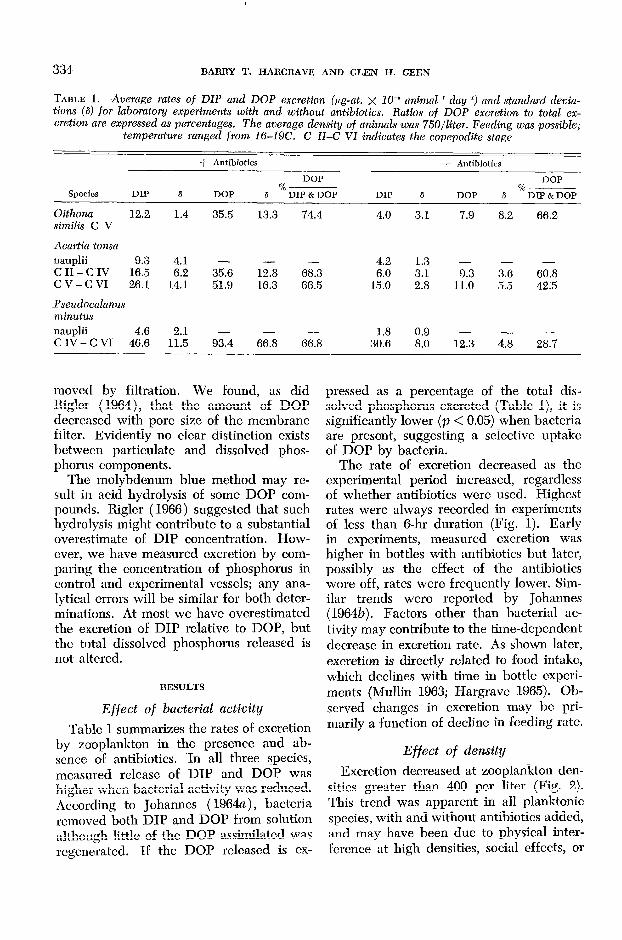
TABLE 1. Average rates of DIP and DOP excretion (,ug-at. x 10d6 animal-’ day-l) and standard devia- tions (6) for Zahomtory experiments with and without antibiotics. Ratios of DOP excretion to total ex- cretion are expressed as percentages. The average density of animals was 750/liter. Feeding was possible;
temperature ranged from lci-19C. C ZZ-C VZ indicates the copepodite stage
Species DIP
+ Antibiotics - Antibiotics
DOP DOP %--
6 DOP %--
8 DIP & DOP DIP 6 DOP 8 DIP & DOP
Oithona 12.2 1.4 35.5 13.3 74.4 4.0 3.1 7.9 8.2 66.2 similis C V
Acartia tonsa
nauplii 9.3 4.1 - iii - 4.2 1.3 - c II - C IV 16.5 6.2 35.6 68.3 6.0 3.1 G 3; 60.8 cv-CVI 26.1 14.1 51.9 16.3 66.5 15.0 2.8 11.0 5.5 42.5
Pseudocalanus minutus
nauplii 4.6 1::; - - - 1.8 0.9 - - - CIV-CVI 46.6 93.4 66.8 66.8 30.6 8.0 12.3 4.8 28.7
moved by filtration, We found, as did Rigler ( 1964), that the amount of DOP decreased with pore size of the membrane filter. Evidently no clear distinction exists between particulate and dissolved phos- phorus components.
The molybdenum blue method may rc- suit in acid hydrolysis of some DOP com- pounds. Rigler (1966) suggested that such hydrolysis might contribute to a substantial overestimate of DIP concentration. How- ever, we have measured excretion by com- paring the concentration of phosphorus in control and experimental vessels; any ana- lytical errors will be similar for both dcter- minations. At most we have overestimated the excretion of DIP relative to DOP, but the total dissolved phosphorus released is not altered.
RESULTS
Effect of bacterial activity
Table 1 summarizes the rates of excretion by zooplankton in the presence and ab- sence of antibiotics. In all three species, measured release of DIP and DOP was higher when bacterial activity was reduced. According to Johannes ( 1964a), bacteria removed both DIP and DOP from solution although little of the DOP assimilated was regenerated. If the DOP released is CX-
pressed as a percentage of the total dis- solved phosphorus excreted (Table l), it is significantly lower (p < 0.05) when bacteria are present, suggesting a selective uptake of DOP by bacteria.
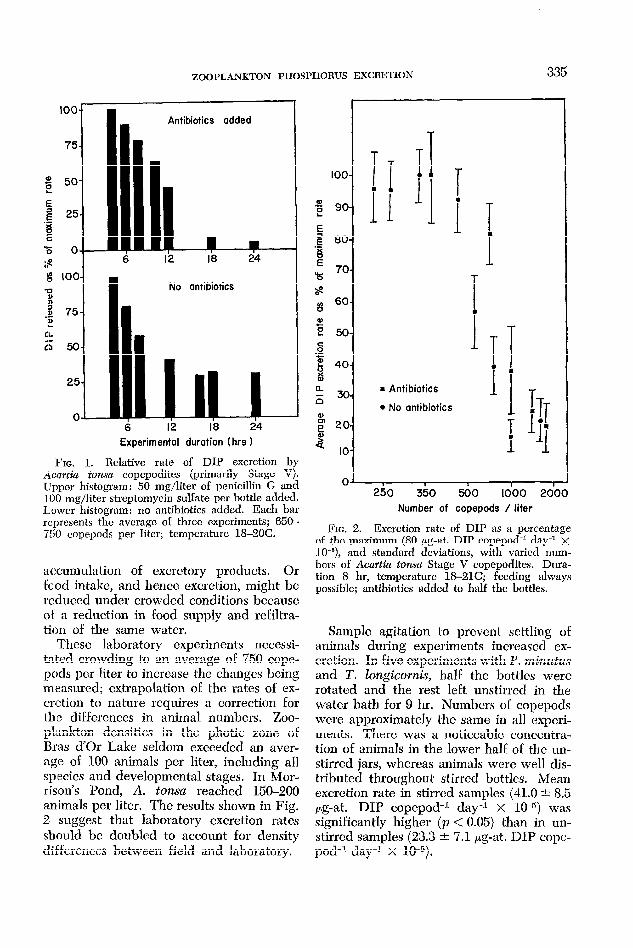
The rate of excretion decreased as the experimental period increased, regardless of whether antibiotics were used. Highest rates were always recorded in experiments of less than 6-hr duration (Fig. 1). Early in experiments, measured excretion was higher in bottles with antibiotics but later, possibly as the effect of the antibiotics wore off, rates were frequently lower. Sim- ilar trends were reported by Johannes (1964b). Factors other than bacterial ac- tivity may contribute to the time-dependent decrease in excretion rate. As shown later, excretion is directly related to food intake, which declines with time in bottle experi- ments (Mullin 1963; Hargrave 1965). Ob- served changes in excretion may be pri- marily a function of decline in feeding rate.
Effect of density
Excretion decreased at zooplankton den- sities greater than 400 per liter (Fig. 2). This trend was apparent in all planktonic species, with and without antibiotics added, an d may have been due to physical inter- fcrcnce at high densities, social effects, or
ZOOPLANKTON PIIOSPIIORUS EXCRETION 335
Antibiotics added
I I 6 12 18 24
No antibiotics
I2 18 24
Experimental duration (hrs 1
FIG. 1. Relative rate of DIP excretion by Acmtin tona copcpoditcs (primarily Stage V). Upper histogram : 50 mg/liter of penicillin G and I00 mg/liter streptomycin sulfate per bottle added. Lower histogram: no antibiotics added. Each bar represents the average of three experiments; 650- 750 copepods per liter; temperature 1%20C. FIG. 2. Excretion rate of DIP as a percentage
of the maximum (80 yg-at. DIP copepod-l day” x 10e6), and standard deviations, with varied num- bcrs of Acmth tonsa Stage V copepodites. Dura- tion 8 hr, temperature lS-21C; feeding always possible; antibiotics added to half the bottles.
= Antibiotics
l No antibiotics
T 8 1 T 8 T T[ 8 8 1 4 1
250 350 500 1000 Number of copepods / liter
2000
accumulation of excretory products. Or fcod intake, and hence excretion, might bc rcduccd under crowded conditions because of a reduction in food supply and rcfiltra- tion of the same water.
These laboratory experiments nccessi- tated crowding to an average of 750 cope- pods per liter to increase the changes being measured; extrapolation of the rates of ex- cretion to nature requires a correction for the differences in animal numbers. Zoo- plankton densities in the photic zone of Bras d’Or Lake seldom exceeded an aver- age of 100 animals per liter, including all species and developmental stages. In Mor- rison’s Pond, A. tonsa reached 150-200 animals per liter. The results shown in Fig. 2 suggest that laboratory excretion rates should bc doubled to account for density differcnccs between field and laboratory.
Sample agitation to prevent settling 0E animals during experiments increased cx- cretion. In five experiments with P. minutus and 2’. hgicods, half the bottles were rotated and the rest left unstirred in the water bath for 9 hr. Numbers of copepods were approximately the same in all experi- ments. There was a noticcablc conccntra- tion of animals in the lower half of the un- stirred jars, whereas animals were well dis- tributed throughout stirred bottles. Mean excretion rate in stirred samples (41.0 -F 8.5 pg-at. DIP copepod-l day-l X lo-‘)) was significantly higher (p < 0.05) than in un- stirred samples (23.3 +- 7.1 pg-at. DIP cope- pod-’ day-l x W5).
336 BARRY T. IIARCRAVE AND GLEN II. GEEN
6am noon 6pm midnight 6am
Mean of experimental period (hr)
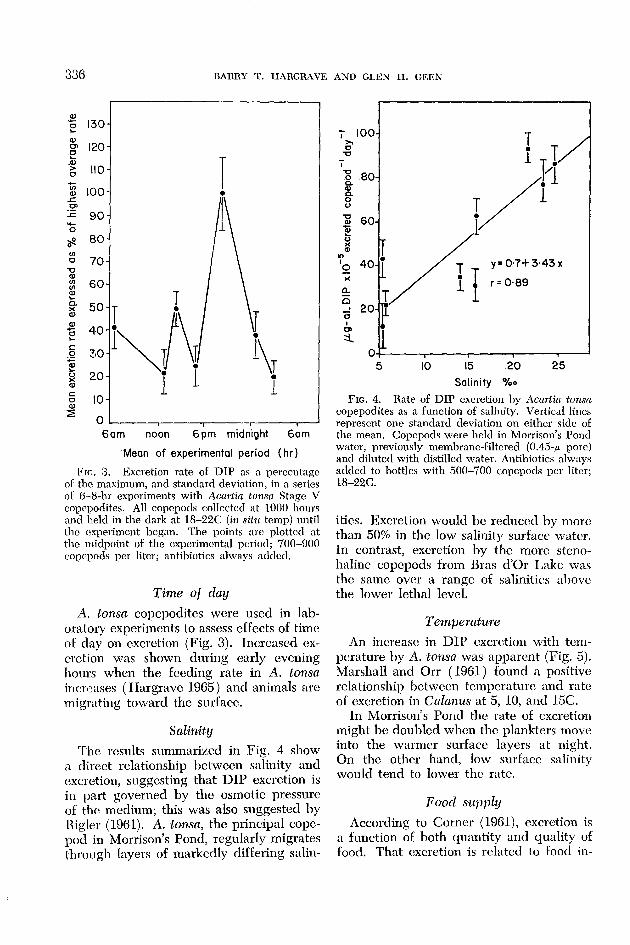
Frc. 3. Excretion rate of DIP as n percentage of the maximum, and standard deviation, in a series of 6-8-hr experiments with Aca&n tonsa Stage V copepodites. All copepods collected at 1000 hours and held in the dark at 18-22C (in situ temp) until the cxperimcnt began. The points are plotted at the midpoint of the experimental period; 700-000 copepods per liter; antibiotics always added.
Time of clay
A. tonsa copepodites were used in lah- oratory experiments to assess effects of time oF day on excretion (Fig. 3). Increased ex- cretion was shown during early evening hours when the feeding rate in A. tonsa increases ( IIargravc 1965) and animals arc migrating toward the surface.
Salinity
The results summarized in Fig. 4 show a direct relationship between salinity and cxcrction, suggesting that DIP excretion is in part governed by the osmotic pressure of the medium; this was also suggested by Kgler (1961). A. tonsa, the principal copc- pod. in Morrison’s Pond, regularly migrates through lavers of markedly differing salin-
1
5 IO 15 20 25
Salinity %o
FIG. 4. Rate of DIP excretion by Acnriin tonsa copepodites as a function of salinity. Vertical lines represent one standard deviation on either side of the mean. Copepods were held in Morrison’s Pond water, previously membrane-filtered (0.45-p pore) and diluted with distilled water. Antibiotics always added to bottles with 500-700 copepods per liter; ls-22c.
ities. Excretion would be reduced by more than 50% in the low salinity surface water. In contrast, excretion by the more steno- haline copepods from Bras d’Or Lake was the same over a range of salinities above the lower lethal level.
Temperature
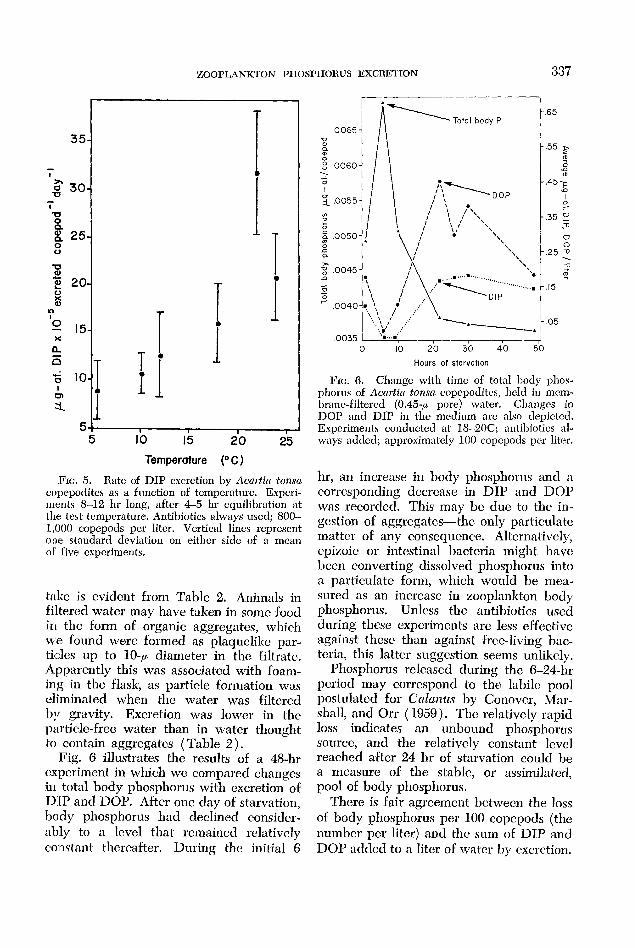
An increase in DIP excretion with tem- pcrature by A. tonsa was apparent (Fig. 5). Marshall and Orr ( 1961) found a positive relationship hctwccn temperature and rate of excretion in CaTanus at 5, 10, and 15C.
In Morrison’s Pond the rate of excretion might be doubled when the plankters move into the warmer surface layers at night. On the other hand, low surface salinity would tend to lower the rate.
Food supply
According to Corner (1961), excretion is a function of both quantity and quality of food, That excretion is related to food in-
ZOOPLANKTON l’l3OSPIIORUS EXCRETION
I I 8 I
IO 15 20 25
Temperature (“C )
FIG. rj. Rate of DIP excretion by Acmtin tonsa copepodites as a function of tempcrnture. Expcri- ments 8-12 hr long, after 4-5 hr equilibration at the test tcmpcrature. Antibiotics always used; 800- 1,000 copepods per liter. Vertical lines rcprescnt one standard deviation on either side of a mean o F five cxpcrimen ts.
trtkc is evident from Table 2. Animals in filtered water may have taken in some food in the form of organic aggregates, which we found were formed as plaquclikc par- ti’cles up to 10-p diameter in the filtrate, Apparently this was associated with foam- ing in the flask, as particle formation was eliminated when the water was filtered by gravity. Excretion was lower in the particle-free water than in water thought to contain aggregates (Table 2).
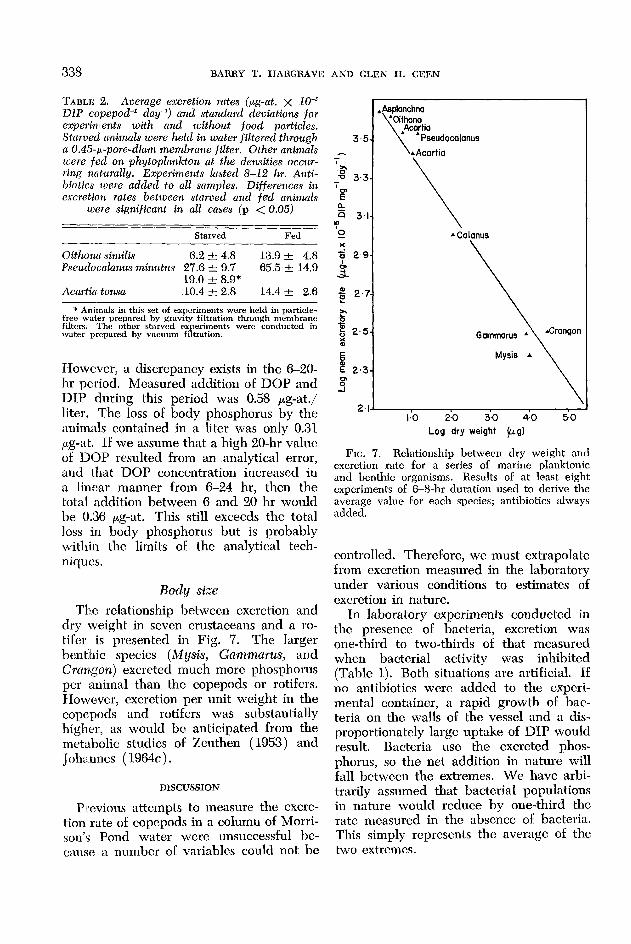
Fig. 6 illustrates the results of a 4%hr cxpcriment in which we compared changes in total body phosphorus with excretion of DIP and DOP. After one day of starvation, body phosphorus had declined considcr- ably to a level that remained relatively co:ns tant thereafter. During the initial 6
.0035 I I r-- I-I 0 IO 20 30 40 5 0
Hours of starvation
FIG,. 6. Change with time of total body phos-
.65
.55 p (D ij. 0
.45; * I s
.35 E "7
: .25 Q
-. ;a' -I
.I5
.05
phorus of Acn~+tin tonsa copcpoditcs, held in mcm- branc-filtered (0.45-p pore) water. Changes in D0P and DIP in the medium arc also clepictcd. Experiments conductecl at 18-2OC; antibiotics al- ways added; approximately 100 copepods per liter.
hr, an increase in body phosphorus and a corresponding dccrcase in DIP and DOP was recorded. This may bc due to the in- gestion of aggregates-the only particulate matter of any consequence. Alternatively, cpizoic or intestinal bacteria might have been converting dissolved phosphorus into a particulate form, which would be mea- sured as an increase in zooplankton body phosphorus. Unless the antibiotics used during these cxpcrimcnts arc less effcctivc against thcsc than against free-living bac- tcria, this latter suggestion seems unlikely,
Phosphorus released during the 6-24-hr period may correspond to the labile pool postulated for Calanus by Conovcr, Mar- shall, and Orr (1959). The relatively rapid loss indicates an unbound phosphorus source, and the relatively constant level reached after 24 hr of starvation could be a measure of the stable, or assimilated, pool of body phosphorus.
There is fair agreement bctwecn the loss of body phosphorus per 100 copepods (the number per liter) and the sum of DIP and DOP added to a liter of water by cxcrction.
337
338 BARRY T. IIARGRAVE AND GLEN II. GEEN
TABLE 2. Average excretion rates (rug-at. x .ZO-” DIP copepod-l day-*) and standard deviations for experiments with and without food particles. Starved animals were held in water filtered, through a 0.45~p-pore-diam membrane filter. Other animals zoere fed on phytoplankton at the densities occur- ring naturally. Experiments lasted 8-12 hr. Anti- biotics were added to all samples. Differences in excretion rates between starved and fed animals
were significant in all cases (p < 0.05)
Starved Fed
Oithona similis 6.2 -t- 4.8 13.9 +- 4.8 Pseudocalanus minutus 27.6 IL 9.7 65.5 2 14.9
19.0 & 8.9”
A Calanus x 5 2,9-
3
Aixrtia. tonsa 10.4 2 2.8 14.4 2 2.6
* Animals in this set of experiments were held in particlc- free water prepared by gravity filtration through membrnnc filters. The other starved experiments were conauctcd in water prepared by vacuum filtration.
IIowcver, a discrepancy exists in the 6-20- hr period. Measured addition of DOP and DIP during this period was 0.58 pg-at./ liter. The loss of body phosphorus by the animals contained in a liter was only 0.31 pg-at. If we assume that a high 20-hr value of DOP resulted from an analytical error, and that DOP concentration increased in a linear manner from 6-24 hr, then the total addition between 6 and 20 hr would be 0.36 pug-at. This still exceeds the total loss in body phosphorus but is probably within the limits of the analytical tech- niques.
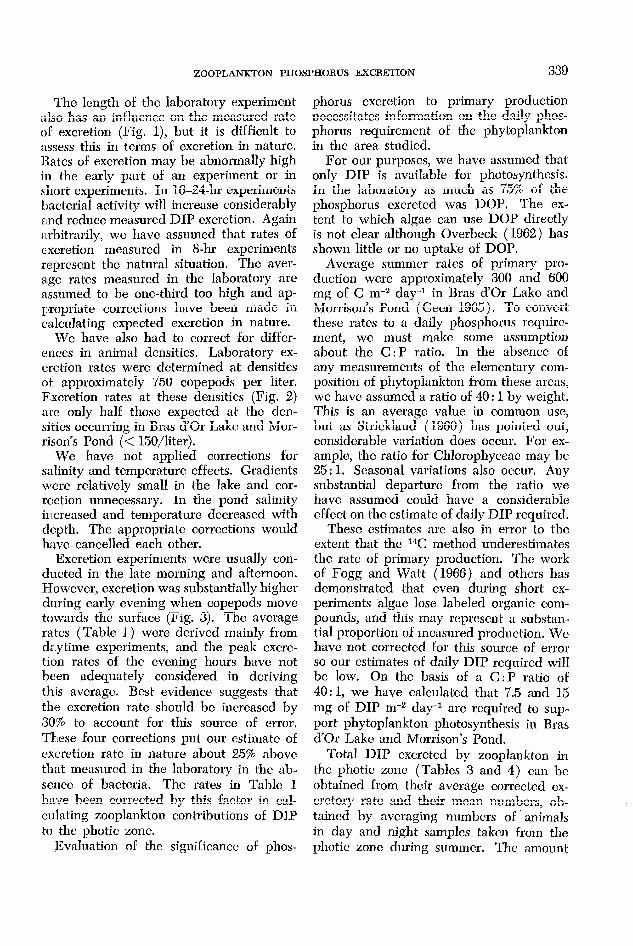
FIG. 7. Relationship between dry weight and excretion rate for a series of marine planktonic and benthic organisms. Results of at least eight experiments of 6-8-hr duration used to derive the average v&e for each species; antibiotics always added.
Body size
controlled. Therefore, we must extrapolate from cxcrction measured in the laboratory under various conditions to estimates of cxcrction in nature.
The relationship between excretion and dry weight in seven crustaceans and a ro- t&r is presented in Fig. 7. The larger benthic species (Mysis, Gammarus, and Crangon) excreted much more phosphorus per animal than the copepods or rotifers. However, excretion per unit weight in the copepods and rotifers was substantially higher, as would be anticipated from the metabolic studies of Zeuthen (1953) and Johannes ( 1964c).
DISCUSSION
In laboratory experiments conducted in the presence of bacteria, excretion was one-third to two-thirds of that measured when bacterial activity was inhibited (Table 1). Both situations are artificial. If no antibiotics wcrc added to the experi- mental container, a rapid growth of bac- teria on the walls of the vessel and a dis- proportionately large uptake of DIP would result. Bacteria use the excreted phos- phorus, so the net addition in nature will fall between the extremes. We have arbi- trarily assumed that bacterial populations in nature would reduce by one-third the rate measured in the absence of bacteria. This simply represents the average oE the two cxtrcmcs.
Previous attempts to measure the excre- tion rate of copepods in a column of Morri- son’s Pond water were unsuccessful he- cause a number of variables could not be _
2.1 I.0 2.0 30 4.0 5-o
Log dry weight @gLe,
ZOOPLANKTON PIIOSPHORUS EXCRETION 339
The length of the laboratory experiment also has an influence on the measured rate of excretion (Fig, l), but it is difficult to assess this in terms of excretion in nature. Bates of excretion may be abnormally high in the early part of an experiment or in short experiments. In 16-24-hr experiments bacterial activity will increase considerably and reduce measured DIP excretion. Again arbitrarily, we have assumed that rates of c,xcretion measured in 8-hr experiments represent the natural situation. The aver- age rates measured in the laboratory are assumed to be one-third too high and ap- propriate corrections have been made in calculating expected excretion in nature.
WC have also had to correct for diffcr- cnces in animal densities. Laboratory ex- cretion rates were determined at densities of approximately 750 copepods per liter. E:xcretion rates at these densities (Fig. 2) are only half those expected at the den- sities occurring in Bras d’Or Lake and Mor- rison’s Pond (< 150/liter).
We have not applied corrections for salinity and temperature effects. Gradients were relatively small in the lake and cor- rection unnecessary. In the pond salinity in creased and temperature decreased with depth. The appropriate corrections would have cancelled each other.
Excretion experiments were usually con- ducted in the late morning and afternoon. However, excretion was substantially higher during early evening when copepods move towards the surface (Fig. 3). The average rates (Table 1) were derived mainly from daytime experiments, and the peak excre- tion rates of the evening hours have not been adequately considered in deriving th:is average. Best evidence suggests that the excretion rate should be increased by 30% to account for this source of error. These four corrections put our estimate of excretion rate in nature about 25% above that measured in the laboratory in the ab- sencc of bacteria. The rates in Table 1 have been corrected by this factor in cal- culating zooplankton contributions of DJP to the photic zone.
Evaluation of the significance of phos-
phorus excretion to primary production necessitates information on the daily phos- phorus requirement of the phytoplankton in the area studied.
For our purposes, we have assmned that only DIP is available for photosynthesis. In the laboratory as much as 75% of the phosphorus excreted was DOP. The ex- tent to which algae can use DOP directly is not clear although Overbeck ( 1962) has shown little or no uptake of DOP.
Average summer rates of primary pro- duction were approximately 300 and 600 mg of C m-2 day-1 in Bras d’Or Lake and Morrison’s Pond ( Gecn 1965). To convert these rates to a daily phosphorus requirc- ment, we must make some assumption about the C: P ratio. In the absence of any measurements of the elementary com- position of phytoplankton from these areas, we have assumed a ratio of 40: 1 by weight. This is an average value in common use,
but as Strickland (1960) has pointed out, considerable variation does occur. For ex- ample, the ratio for Chlorophyceae may bc 25 : 1. Seasonal variations also occur. Any substantial departure from the ratio we have assumed could have a considerable effect on the estimate of daily DIP required.
These estimates are also in error to the extent that the 14C method underestimates the rate of primary production. The work of Fog-g and Watt ( 1966) and others has demonstrated that even during short ex- perimcnts algae lose labeled organic com- pounds, and this may represent a substan- tial proportion of measured production, WC have not corrected for this source of error so our estimates of daily DIP required will be low. On the basis of a C: P ratio of 40: 1, we have calculated that 7.5 and 15 mg of DIP m-2 day-l are required to sup- port phytoplankton photosynthesis in Bras d’Or Lake and Morrison’s Pond,
Total DIP excreted by zooplankton in the photic zone (Tables 3 and 4) can bc obtained from their average corrected CX- cretory rate and their mean numbers, ob- taincd by averaging numbers of animals in day and night samples taken from the photic zone during summer. The amount
340 BARRY T. HARGRAVE AND GLEN I-1. GEEN
TABLE 3. Average daily excretion of DIP by planktonic copepods in Bras d’Or Lake, calculated. from corrected excretion rates determined in the labora.tory and abundance of the various developmental
stages in the Zake. Species: Pseudocalanus minutus, Temora longicornis, and Oithona similis
Stage hl”l”t:r”- i Avg dry Biomass ‘., wt l/-u) ( mg m-” )
C;$m;t;d - .
mg-l day-1 excreted
yg-at. P m-3 day-l released
Exdo~l 8
day-1
Avg mg I? excrctcd
nl+ day-l in 20-m
photic zone
Nauplii 20 3.0 60 0.049 2.94 0.09 1.8 Copepoclitcs 60 9.0 540 0.030 16.20 0.50 10.0 Adulta; 8 14.0 112 0.041 4.59, 0.14 2.8
14.6
excreted apparently exceeds the daily algal requirement in the lake and is less than that theoretically required in the pond. Since DIP does not accumulate, we can only assume that a balance between addi- tion and utilization exists. Several explana- tions may be offered for an excretion of DIP in apparent excess of daily photo- synthetic requirement. Either the C:P ratio is lower than the 40: 1 assumed in our calculations, or alternatively, photo- synthesis may be substantially greater than that estimated by the 14C method. If, for example, the C : P ratio was 25 : 1 and 30% of the labeled photosynthetic product was cxcrcted by the algae-both reasonable possibilities-the daily algal requirement for DIP in Bras d’Or Lake would exceed that contributed by zooplankton. If this line of reasoning is applied to data from Morrison’s Pond, zooplankton contributions would be even lower than shown in Table 4.
The zooplankton biomass values (Tables 3 and 4) arc averages for Eivc summer
months. If the monthly changes in abun- dance of various developmental stages are considered, daily contributions of DIP are markedly altered. For example, in August the zooplanktcrs in Bras d’Or Lake were predominately Pseuclocdanus and Oitho~, adults and late copepodites. Calculated excretion was 9.6 mg of DIP m-2 day-‘, only slightly greater than the theoretical daily phytoplankton rcquiremcnt for the month of August.
Altemative nutrient sources Excretion of phosphorus by zooplankton
represents recycling of existing nutrients within the water column and not a mccha- nism of supply, Since DIP concentrations in adjacent coastal waters are comparable to those in Bras d’Or Lake and Morrison’s Pond, no appreciable increase in phosphorus can bc expected as a result of tidal inflow, and little increase can be expected from drain- age. At best, some enrichment could only be expected in the vicinity of river mouths.
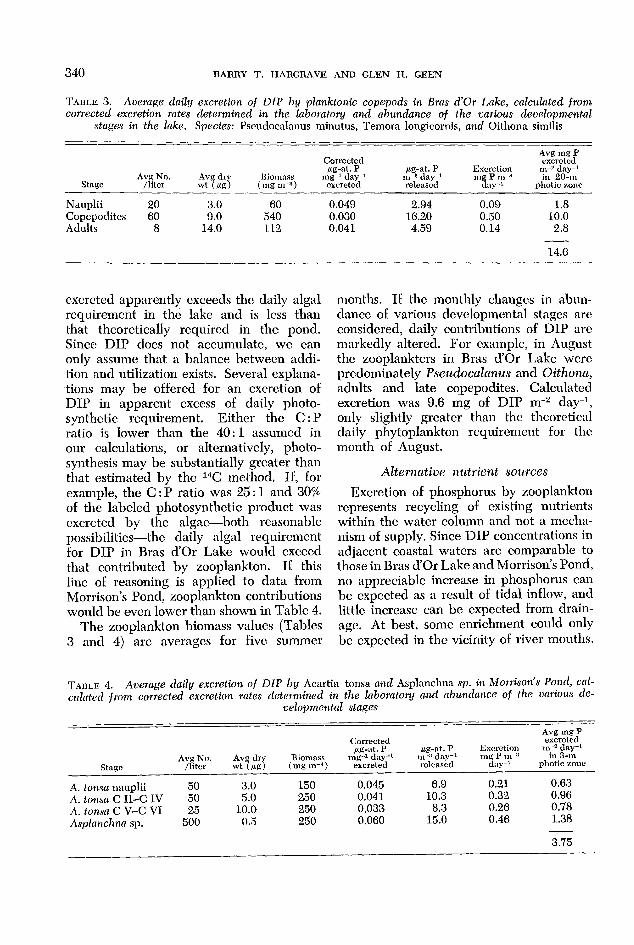
TAHLE 4. Average daily excretion of DIP by Acartia tonsa and Asplanchna sp. in Morrison’s Pond, cal- culated from corrected excretion rates determined in the laboratory a.nd abundance of the various de-
velopmental stages
Avg mg P Corrected excretecl
fig-at. P /Lg-at . P zzrpee;2 m-2 day-l
stage Jytfro* -4% dry Biomass mg-1 day-1 m-:1 day-l :1 in 3-m
1 wt (l-c) ( mg in-” ) excreted released &by-’ photic ~onc
A. tonsa nauplii 50 3.0 150 0.045 6.9 0.21 0.63 A. tonsa C II-C IV 50 50 250 0.041 10.3 0.32 0.96, A. tonsa C V-C VI 25 10.0 250 0.033 8.3 0.26 0.78 Asplanchna sp. 500 0.5 250 0.060 15.0 0.46 1.38
3.75
ZOOPLANKTON PIIOSPIIORUS EXCRETION 341
#Some increase in DIP does occur at the ,surfacc of Morrison’s Pond after a heavy :rainfall and the subsequent increase in run- off. IIowever, this is an intermittent in- crease in the low salinity surface layer, which has a relatively low level of primary production.
Apparently the bulk of the nutrient rc- generation takes place within the bodies of water. We have presented evidence in- dicating an important role for planktonic animals in the regeneration of DIP. Some DIP will also be excreted by fish and benthic organisms. The DIP contribution of the benthic organisms is unknown but would only bc immediately available to the phytoplankton in the shallow, well- mixed regions near shore. In deeper arcas, DIP excreted by the benthic fauna will be returned to the photic zone at times of overturn or by turbulent mixing processes. The contribution of the fish is also un- known but is probably low if, as might be expected, the biomass at this terminal point in the food web is relatively small.
Turbulent mixing will also contribute to the return of DIP or other nutrients to the photic zone from the hypolimnctic region. Eddy diffusion coefficients have been cal- culated from several summers’ temperature data from Bras d’Or Lake. These cocffi- cicnts were used to calculate the flux of DIP into the photic zone from the hypo- limnion as described by Riley ( 1956). The average contribution to the photic zone from June through August 1962, and I964 was 1.30 and 1.67 mg of P m-2 day-l respectively. This amounts to about 20% of the estimated daily phytoplankton re- quirement and 10% of the DIP cxcretcd by the zooplankton, Evidently zooplank- ton excretion is the major mechanism of nutrient rcgcncration in Bras d’Or Lake during summer months. Work on Cayuga Lake by Barlow and Bishop (1965) has led to a similar conclusion,
In Morrison’s Pond, zooplankton excre- tion supplies only 20% of the daily phyto- plankton requirement. Return of DIP to the photic zone in this area was not Cal- culatcd bccausc of an unmcasurcd effect
of water diffusing through the gravel beach that separates the pond from the lake. At any rate, turbulent mixing was probably relatively limited.
The discrepancy bctwecn daily rcquirc- ments and regeneration may indicate the importance of the smaller zooplankton We did not determine the numbers of ciliates and Littorintc veliger larvae, although each of these was occasionally abundant. Our data on the rotifer Aspkmchna indicate the importance of these smaller forms (Table 4). The other microzooplankton may re- generate much of the DIP required by the phytoplankton. Some workers have sug- gcstcd that bacteria are important agents in the regeneration of inorganic phosphorus. In our experiments, bacteria accumulated rather than released phosphorus; this agrees with results of Johannes (1964n). But Overbcck (1962) and others have shown that bacteria do rcgencrate DIP. The rela- tive importance of bacterial and zooplank- ton regeneration of DIP is not clear. Our studies have indicated that regeneration of inorganic phosphorus by zooplankton is oE considerable, if not of prime, importance in our study areas.
IlEFEllENCES
BAI-ILOW, J. P., AND J. w. BISITOP. 19%. p’hos- phate regeneration by zooplankton in Cayuga Lake. Limnol. Occanog., 10 (Suppl.): RX- R24.
CONOVER, R. J., S. M. MARSIIALL, AND A. P. ORR. 1959. Feeding and excretion of Calanus fin- marchicus with reference to the possible role of the zooplankton in the mincralizntion of organic matter. Woods IIole Oceanog. Inst., Ref. 59-32. ( Unpublished manuscript. )
CORNER, E. D. S. 1961. On the nutrition and metabolism of zooplankton. I. Preliminary ob- servations on the feeding of the marine copc- pod, Calanus helgolanclicus (Claus). J. Marine Biol. Assoc. U.K., 41: 5-16.
~GC., G. E., AND W. D. \VATT. 1966. The ki- netics cf release of extra-cellular products of photosynthesis by phytoplankton, p. 167-174. In C. R. Goldman [Ed.], Primary productivity in aquatic environments. Mem. 1st. Ital. Idro- biol., 18 (Suppl.), Univ. Calif. Press, Berke- ley.
CEEN, G. II. 1965. Primary production in Bras d’Or Lake and other inland waters of Gape Breton Island, Nova Scotia. Ph.D. thesis, Dalhousie University, Halifax, Nova Scotia. 187 p.
342 BARRY T. HARGRAVE AND GLEN I-I. GEEN
-, AND B. T. HARGRAVE. 1966. Primary and secondary production in Bras d’Or Lake, Nova Scotia, Canada. Vcrhandl. Intern. Verein. Limnol., 16: 333-340.
HARGHAVE, B. T. 196,5. Feeding rates of zoo- plankton in a natural community. BSc. thesis, Dalhousic University, Halifax, Nova Scotia. 58 p.
IIARIW:, E. 1959. The nitrogen cycle in Long Island Sound. Bull. Bingham Oceanog. Col- lection, 17: 31-65.
JOIIANIVES, R. E. 1964a. Uptake and release of dissolved organic phosphorus by representa- tivcs of a coastal marinc ecosystem. Limnol. Occanog., 9 : 224-234.
---. 1964h. Uptake and release of phos- phorus by a benthic marine amphipod. Lim- nol. Oceanog., 9: 235-242.
--. 1964c. Phosphorus excretion and body size in marine animals: Microzooplankton and nutrient regeneration. Science, 146: 923- 924.
MAIISIIALL, S. M., AND A. P. Onn. 1961. On the biology of Calanus finmarchict~s. XII. The phosphorus cycle : excretion, egg production, autolysis. J. M arine Biol. Assoc. U.K., 41: 463-483.
MULLIN, M. M. 1963. Some factors affecting the feeding of marine copepods of the genus C:alu,nus. Limnol. Oceanog., 8 : 239-250.
OVERBECK, J. 1962. Untersuchungen zum Phos- phathaushalt von Griinalgen. II. Die Verver- tung von Pyrophosphate und organisch ge-
bundenen Phosphaten und ihr Beziehung zu den phosphatasen von Scenedesmus q~~cZri- cuuz-lu (Turp. ) Breb. Arch. Hydrobiol., 58 : 281-308.
POMEHOY, L. R., H. M. MATFIEWS, AND HONG SHIK MIN. 1963. Excretion of phosphate and soluble organic phosphorus compounds by zooplankton. Limnol. Oceanog., 8: 50- 55.
RIGLER, F. H. 1961. The uptake and release of inorganic phosphorus by Daphnia magna Straus. Limnol. Oceanog., 6: 165-174.
-. 1964. The phosphorus fractions and the turnover time of inorganic phosphorus in different types of lakes. Limnol. Oceanog., 9: 511-518.
-a 1966. Radiobiological analysis of in- organic phosphorus in lakewater. Verhandl. Intern. Verein. Limnol., 16: 465-470.
RILEY, G. A. 1956. Oceanography of Long Is- land Sound, 1952-1954. IX. Production and utilization of organic matter. Bull. Bingham Occanog. Collection, 15 : 324-344.
SWICKLAND, J. D. H. 1960. Measuring the pro- duction of marine phytoplankton. Bull. Fish- eries Res. Board Can. No. 122. 172 p.
-, AND T. R. PARSONS. 1965. A manual of sea water analysis, 2nd Ed. Bull. Fisheries Rcs. Board Can. No. 125. 203 p.
ZEUTIIEN, E. 1953. Oxygen uptake as related to body size in organisms. Quart. Rev. Biol., 28: 1-12.
Related Documents


![Quantification of the phosphorus released by zooplankton ...wpd.ugr.es/~ireche/wp-content/uploads/Carrilloetal_JPlanktonRes... · solved phosphate (TDP)] to algae and bacteria would](https://static.cupdf.com/doc/110x72/5cafdc2f88c9930e2e8b67be/quantification-of-the-phosphorus-released-by-zooplankton-wpdugresirechewp-contentuploadscarrilloetaljplanktonres.jpg)