Phonetics of Tongan stress Marc Garellek Department of Linguistics, University of California, San Diego [email protected] James White Department of Linguistics, University College London [email protected] In this study, we determine the acoustic correlates of primary and secondary stress in Tongan. Vowels with primary stress show differences in f0, intensity, duration, F1, and spectral measures compared to unstressed vowels, but a linear discriminant analysis suggests f0 and duration are the best cues for discriminating vowels with primary stress from unstressed vowels. Vowels with secondary stress are mainly marked by differences in f0 relative to unstressed vowels. With regard to the effects of stress on the vowel space, we find that all five Tongan vowels are higher in the vowel space (have lower F1) when unstressed. Moreover, there is no reduction in the overall size of the vowel space. We interpret this pattern as evidence that unstressed vowels in Tongan are not prone to centralization, vowel reduction, or undershoot. The results, however, are consistent with a sonority expansion account (Beckman, Edwards & Fletcher 1992), whereby stressed vowels are lowered to enhance sonority. 1 Introduction In this paper, we aim to determine which acoustic measures correlate with primary and secondary stress in Tongan (Malayo-Polynesian, Austronesian; Blust 2009), and to determine which of the measures best predict stress in the language. Studies of the acoustic correlates of stress date from pioneering work on English (Fry 1955). However, the work in this area has focused on only a few languages, coming from a limited set of language families. There have been few acoustic studies of stress in Polynesian languages, and even fewer of Tongan in particular (but see Anderson & Otsuka 2003, 2006). Analyzing data from a wide array of cross-linguistic studies is vital for understanding how stress is realized in language in general, because it can offer an insight into which aspects of stress are universal and which are language-specific. For example, Gordon & Applebaum (2010: 35–36) note the existence of languages in which typologically common acoustic measures of stress do not distinguish stressed from unstressed vowels, presumably because those measures serve as the primary cue to other contrasts, e.g. f0 in languages with lexical tone. Similarly, it is possible that duration may not be used to distinguish stressed and unstressed vowels in Tongan because it is a language with contrastive vowel length. By expanding acoustic studies of stress to Journal of the International Phonetic Association (2015) 45/1 C International Phonetic Association doi:10.1017/S0025100314000206

Welcome message from author
This document is posted to help you gain knowledge. Please leave a comment to let me know what you think about it! Share it to your friends and learn new things together.
Transcript
Phonetics of Tongan stressMarc Garellek
Department of Linguistics, University of California, San [email protected]
James WhiteDepartment of Linguistics, University College London
In this study, we determine the acoustic correlates of primary and secondary stress inTongan. Vowels with primary stress show differences in f0, intensity, duration, F1, andspectral measures compared to unstressed vowels, but a linear discriminant analysis suggestsf0 and duration are the best cues for discriminating vowels with primary stress fromunstressed vowels. Vowels with secondary stress are mainly marked by differences in f0relative to unstressed vowels. With regard to the effects of stress on the vowel space, we findthat all five Tongan vowels are higher in the vowel space (have lower F1) when unstressed.Moreover, there is no reduction in the overall size of the vowel space. We interpret thispattern as evidence that unstressed vowels in Tongan are not prone to centralization, vowelreduction, or undershoot. The results, however, are consistent with a sonority expansionaccount (Beckman, Edwards & Fletcher 1992), whereby stressed vowels are lowered toenhance sonority.
1 IntroductionIn this paper, we aim to determine which acoustic measures correlate with primary andsecondary stress in Tongan (Malayo-Polynesian, Austronesian; Blust 2009), and to determinewhich of the measures best predict stress in the language. Studies of the acoustic correlatesof stress date from pioneering work on English (Fry 1955). However, the work in this areahas focused on only a few languages, coming from a limited set of language families. Therehave been few acoustic studies of stress in Polynesian languages, and even fewer of Tonganin particular (but see Anderson & Otsuka 2003, 2006). Analyzing data from a wide arrayof cross-linguistic studies is vital for understanding how stress is realized in language ingeneral, because it can offer an insight into which aspects of stress are universal and whichare language-specific. For example, Gordon & Applebaum (2010: 35–36) note the existenceof languages in which typologically common acoustic measures of stress do not distinguishstressed from unstressed vowels, presumably because those measures serve as the primarycue to other contrasts, e.g. f0 in languages with lexical tone. Similarly, it is possible thatduration may not be used to distinguish stressed and unstressed vowels in Tongan becauseit is a language with contrastive vowel length. By expanding acoustic studies of stress to
Journal of the International Phonetic Association (2015) 45/1 C© International Phonetic Associationdoi:10.1017/S0025100314000206
14 Marc Garellek & James White
a larger, more varied sample of languages, we will be better able to make cross-linguisticgeneralizations.
Previous studies have shown that multiple acoustic measures may correlate with stressin vowels. Stressed vowels are often found to have a higher fundamental frequency or pitch(Lieberman 1960, Adisasmito-Smith & Cohn 1996, Gordon & Applebaum 2010), greaterintensity (Lieberman 1960, Everett 1998, Kochanski et al. 2005, Gordon & Applebaum2010, Gordon & Nafi 2012), and longer duration (Lieberman 1960, Everett 1998, Gordon &Applebaum 2010). Differences in F1 and F2, associated with differences in vowel quality,have also been found, including higher F1 (Cho & Keating 2009, Gordon & Applebaum2010). Researchers have also found differences in measures associated with voice quality orphonation (Sluijter & van Heuven 1996). Not all of these acoustic measures necessarilycorrelate with stress for any given language; moreover, secondary stress may be cueddifferently than primary stress (Adisasmito-Smith & Cohn 1996, Gordon & Applebaum2010, Plag, Kunter & Schramm 2011). In this study, we are interested in which of thesemeasures correlate with stress in Tongan.
An area of particular interest is how stress will affect the Tongan vowel space. Stressedvowels are often more peripheral in the vowel space when compared to unstressed vowels.A common explanation for this pattern is that speakers systematically undershoot theirarticulatory targets in unstressed vowels, an account with a clear connection to the moregeneral notions of phonetic undershoot and hyperarticulation (Lindblom 1990). Undershootat the synchronic level could represent the phonetic precursors leading to phonological,stress-based vowel reduction found in many languages.
This type of phonetic centralization (presumably due to undershoot) has been found inlanguages with five-vowel systems similar to the one found in Tongan, e.g. Castilian Spanish(Ortega-Llebaria & Prieto 2011). Thus, we might expect unstressed vowels in Tongan toundergo centralization, yielding lower high vowels and higher low vowels. On the other hand,such a reduction strategy might be counterproductive in a language with few distinctivephonemes and relatively simple syllable structure such as Tongan; the potential loss of vowelcontrasts would result in vast lexical neutralization. Therefore, it is possible that unstressedvowels in Tongan will not be subject to a reduction in the size of the vowel space.
There are also language-internal reasons to look at stress in Tongan. For one, stressplays an important role in the so-called ‘definitive accent’, whereby noun phrases undergoreduplication of the final vowel to mark that they are definite (Anderson & Otsuka 2006).Because stress is always penultimate, this reduplication in turn triggers a stress shift. Insome cases, this results in a long vowel become trimoraic: compare non-definite [tamaˈsiʔikaaˈkaa] ‘cunning boy’ vs. definite [tamaˈsiʔi kaakaˈaa].1 Stress likely plays a primary rolein cuing this contrast.
Stress may also be relevant for a controversial phonological process in Tongan called‘syllable fusion’. It has been claimed that certain sequences of two vowels may be ‘fused’into a single syllable (Churchward 1953, Feldman 1978, Poser 1985, Schutz 2001), but thereis disagreement as to which sequences of vowels may undergo the process (and under whichconditions), with some claiming that the process never occurs at all (Taumoefolau 2002).Measuring stress correlates could offer insights on the syllabic structure of these vowelsequences. Knowing how Tongan stress is realized acoustically is crucial for subsequentphonetic work looking at these phonological phenomena (for discussion, see Garellek &White 2010).
The paper is organized in the following manner: We first give a brief overview of thephonemes and stress system of Tongan. We then discuss our methodology, followed by theresults of our study for each acoustic measure. Finally, we end with a discussion of ourfindings, their implications, and the conclusions of the paper.
1 Long vowels have often been analyzed as sequences of two short vowels in separate syllables(Taumoefolau 2002, Anderson & Otsuka 2006). This distinction will not be crucial in this paper.
Phonetics of Tongan stress 15
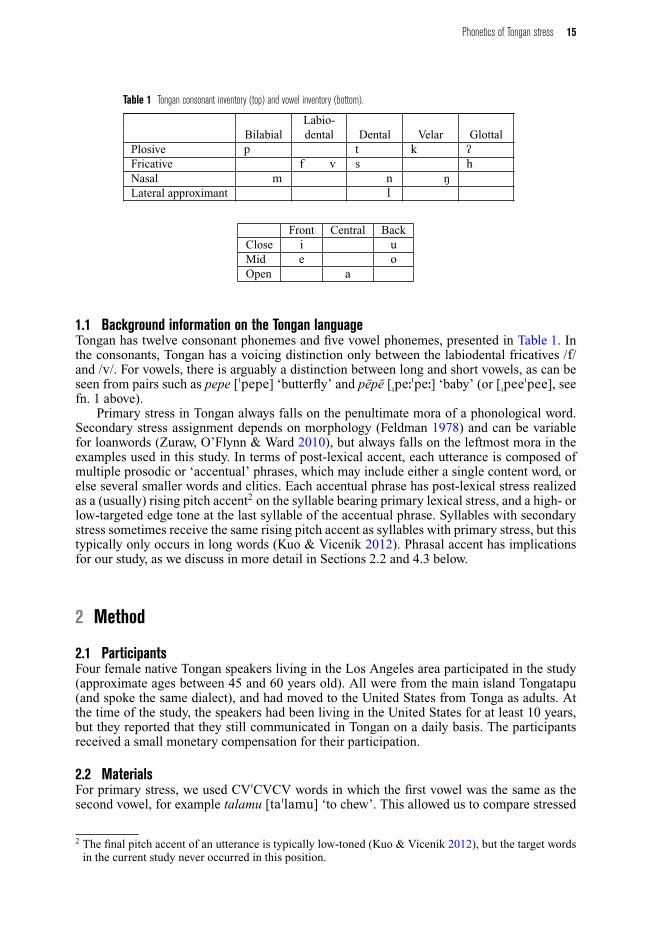
Table 1 Tongan consonant inventory (top) and vowel inventory (bottom).
Labio-Bilabial dental Dental Velar Glottal
Plosive p t k ʔFricative f v s hNasal m n ŋLateral approximant l
Front Central BackClose i uMid e oOpen a
1.1 Background information on the Tongan languageTongan has twelve consonant phonemes and five vowel phonemes, presented in Table 1. Inthe consonants, Tongan has a voicing distinction only between the labiodental fricatives /f/and /v/. For vowels, there is arguably a distinction between long and short vowels, as can beseen from pairs such as pepe [ˈpepe] ‘butterfly’ and pepe [ˌpeːˈpeː] ‘baby’ (or [ˌpeeˈpee], seefn. 1 above).
Primary stress in Tongan always falls on the penultimate mora of a phonological word.Secondary stress assignment depends on morphology (Feldman 1978) and can be variablefor loanwords (Zuraw, O’Flynn & Ward 2010), but always falls on the leftmost mora in theexamples used in this study. In terms of post-lexical accent, each utterance is composed ofmultiple prosodic or ‘accentual’ phrases, which may include either a single content word, orelse several smaller words and clitics. Each accentual phrase has post-lexical stress realizedas a (usually) rising pitch accent2 on the syllable bearing primary lexical stress, and a high- orlow-targeted edge tone at the last syllable of the accentual phrase. Syllables with secondarystress sometimes receive the same rising pitch accent as syllables with primary stress, but thistypically only occurs in long words (Kuo & Vicenik 2012). Phrasal accent has implicationsfor our study, as we discuss in more detail in Sections 2.2 and 4.3 below.
2 Method
2.1 ParticipantsFour female native Tongan speakers living in the Los Angeles area participated in the study(approximate ages between 45 and 60 years old). All were from the main island Tongatapu(and spoke the same dialect), and had moved to the United States from Tonga as adults. Atthe time of the study, the speakers had been living in the United States for at least 10 years,but they reported that they still communicated in Tongan on a daily basis. The participantsreceived a small monetary compensation for their participation.
2.2 MaterialsFor primary stress, we used CVˈCVCV words in which the first vowel was the same as thesecond vowel, for example talamu [taˈlamu] ‘to chew’. This allowed us to compare stressed
2 The final pitch accent of an utterance is typically low-toned (Kuo & Vicenik 2012), but the target wordsin the current study never occurred in this position.
16 Marc Garellek & James White
and unstressed (short) vowels of the same type within the same word so that extraneous factorsthat may vary across repetitions (e.g. speaking rate) could be well controlled. Ten words ofthis type were selected for each of the five Tongan vowels. For secondary stress, the same setof words was used, but a CV suffix, usually the highly productive demonstrative suffix -ni, wasadded to each word. The resulting ˌCVCVˈCV–CV words allowed us to once again comparethe first and second vowels, which now had secondary stress and no stress, respectively. Notethat vowels with secondary stress were also word-initial, in contrast to vowels with primarystress. We discuss the implications of this in Section 3.1.2. A wide variety of consonantswas used in each consonant position in order to control for consonantal effects on the targetstressed/unstressed vowels.
Note that, in our study, all vowels with primary lexical stress also had post-lexical phrasalaccent. The target words, as content words, each formed their own accentual phrase. Accentualphrases in Tongan always have a pitch accent that falls on the syllable with primary lexicalstress. It would be very difficult (if not impossible) to disentangle the effects of lexical stressfrom post-lexical accent in Tongan. This issue is not unique to Tongan; in principle, it couldapply in any language in which post-lexical phrases may be composed of single words (e.g.Farsi; Jun 2005, Scarborough 2007). In contrast, languages like English, where only somevowels with lexical stress also have post-lexical accent, allow more easily for the effects ofstress and accent to be distinguished (e.g. Campbell & Beckman 1997, Cho & Keating 2009).Nonetheless, we succeed in disentangling stress from accent with respect to secondary stress,because vowels with secondary stress were not pitch-accented in this study (owing to therelatively short length of the words elicited). We also ensured that accentual phrase-final edgetones did not influence the target sounds in this study because we only analyzed vowels up tothe tonic syllable.
A full list of stimuli is provided in Appendix.
2.3 ProcedureThe words were collected into a wordlist written in Tongan orthography, which was read by thespeakers. Each word was repeated in the carrier phrase Angimui ‘a e fo‘ilea ko e ___ kiateau([ˌaŋiˈmui ˈʔae ˌfoʔiˈlea ˈkoe ___ ˌkiateˈau]) ‘Repeat the word ___ for me’. Three repetitionswere collected for each word, yielding a total of 30 tokens per speaker for each vowel forprimary stress vs. unstressed and 30 tokens per speaker for each vowel for secondary stress vs.unstressed. The recordings were made in a UCLA Phonetics Lab sound booth using a ShureSM10A head-mounted microphone, whose signal ran through an XAudioBox pre-amplifierand A-D device. The recording was done using PCquirerX at a sampling rate of 22,050 Hz.
The first and second vowels of each word were labeled in PRAAT textgrids (Boersma &Weenink 2009). The boundaries for vowels were segmented according to the beginning andend of a clear second formant. The labeled sound files were then run through VoiceSauce (Shueet al. 2011) to obtain the acoustic measures, which were calculated for every millisecond.VoiceSauce calculates f0 using the STRAIGHT algorithm (Kawahara, Masuda-Katsuse &de Cheveign ⁄e 1999). VoiceSauce also outputs the duration of the labeled segment as well asvalues for F1, F2, and Root Mean Square (RMS) energy. The formants were measured usingthe Snack SoundToolkit (Sjolander 2004).
We also include here two acoustic correlates of voice quality: H1∗-H2∗ and cepstral peakprominence (CPP). H1∗-H2∗ is a measure of the difference in amplitude between the firstand second harmonics (Bickley 1982). Its values have been corrected for formants (hencethe use of asterisks) following the correction by Hanson (1997) and Iseli, Shue & Alwan(2007), in order to enable cross-vowel comparison. H1∗-H2∗ is perhaps the most commonlyused harmonic measure of voice quality. Values of H1∗-H2∗ are typically higher for breathyvoice when compared to modal voice, and lower for creaky or laryngealized voice whencompared to modal voice (Klatt & Klatt 1990, Gordon & Ladefoged 2001). CPP, calculatedusing the algorithm from Hillenbrand, Cleveland & Erickson (1994), is a measure of noise
Phonetics of Tongan stress 17
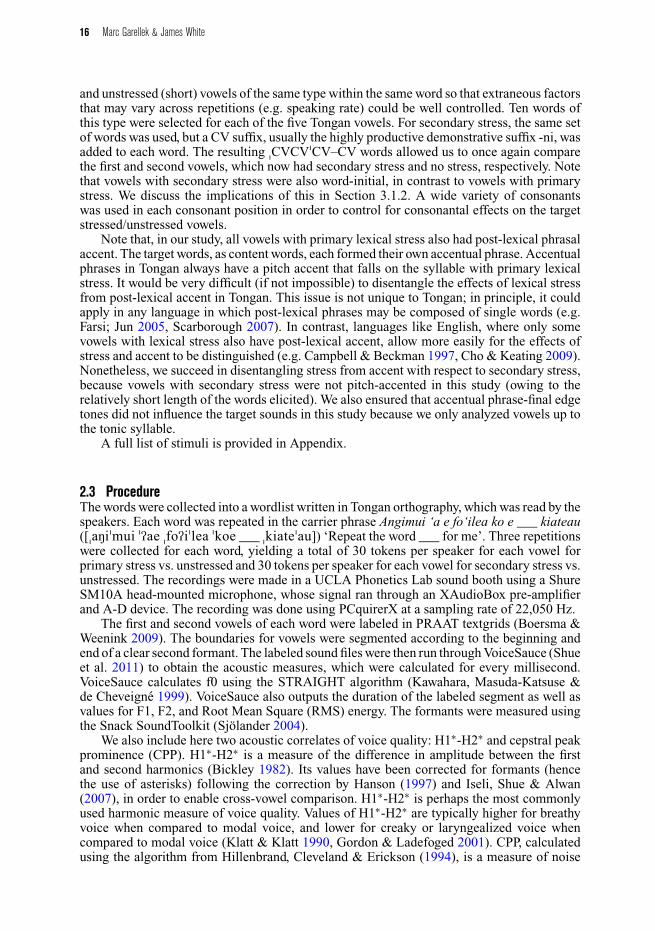
Table 2 Summary of acoustic measures.
Measure Description
Fundamental frequency (f0) Frequency of lowest harmonic, correlated with perceived pitch. Measured in Hertz (Hz).Duration Duration of the vowel, measured in milliseconds.RMS energy Root mean squared energy, corresponding to intensity/loudness.First formant (F1) First formant, measured in Hz. Correlated with vowel height.Second formant (F2) Second formant, in Hz. Correlated with vowel frontness.H1∗-H2∗ Corrected difference in amplitude between the first and second harmonics, in decibels (dB). Correlated with
voice quality (higher = breathier). The correction is used in order to compare values across different vowelqualities.
Cepstral peak prominence (CPP) Measure of regularity and magnitude of harmonics above the noise floor (lower CPP = noisier signal, e.g. dueto aspiration or irregularity).
and aperiodicity. Either aspiration noise during breathy voice or aperiodic voicing duringcreaky voice may result in lower values of CPP (Garellek & Keating 2011). Table 2 providesa summary of the acoustic measures recorded with a brief description of each measure.
The average values for each measure across the full duration of the vowels were calculatedautomatically by VoiceSauce, and the results were then saved to a text file for subsequentanalysis.
3 Results
3.1 Linear mixed-effects analysisIn this section, we determine which acoustic measures differ significantly between stressed andunstressed vowels in Tongan. The values of each measure were analyzed using linear mixedeffects models. These were implemented in R (R Development Core Team 2008) using thelmer() function of the lme4 package (Bates, Maechler & Dai 2008), following Baayen (2008a:Chapter 7). Separate models were fitted for primary and secondary stress. All of the modelscontained a fixed effect for vowel (/i e a o u/) and three random intercepts: speaker, word,and repetition. These random effects significantly improved model fit according to likelihoodratio tests comparing models with and without the effect (using the anova() function in R, seeBaayen 2008a), suggesting that there was indeed variation across individual speakers, words,and repetitions (the latter was likely due to the fact that speakers had a tendency to speakmore quickly in later repetitions). However, by including these factors as random effects, weeffectively controlled for any effect that they may have had on the results. Random slopes didnot improve model fit, so none were included.
First, to determine the overall main effect of stress regardless of individual vowel, we ran amodel with an added fixed effect for presence of stress (stress or no stress). For the main effectof stress, we report t-values provided in the model output, as well as p-values obtained usingthe pvals.fnc() function of the languageR package (Baayen 2008b), which estimates p-valuesby conducting Markov Chain Monte Carlo (MCMC) sampling with 10,000 simulations.3
3 As an additional test for main effects, we conducted likelihood ratio tests comparing a model with fixedeffects for both vowel and stress to a model with only a fixed effect for vowel (both models had the samerandom-effects structure). This comparison evaluated the improvement to model fit resulting from addinga fixed effect for stress to the model. In all cases, the result of this test matched the pattern of significance
18 Marc Garellek & James White
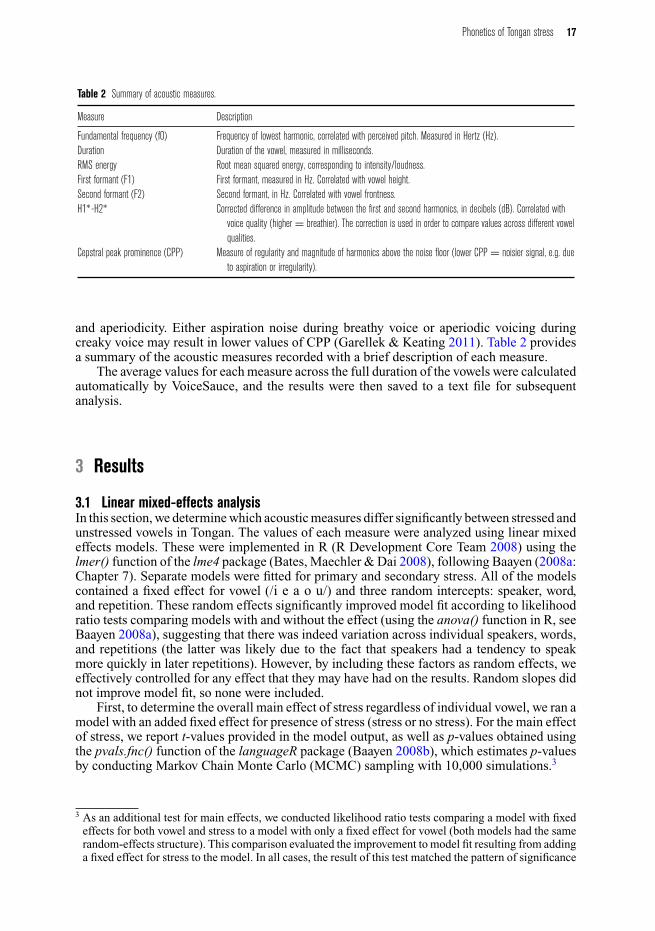
Figure 1 Mean f0 (in Hz) by vowel, for primary stress (left panel) and secondary stress (right panel). Error bars represent standarderror of the mean.
Second, to determine whether individual vowels differed from the overall pattern, we rana model containing an interaction effect between vowel (/i e a o u/) and stress (stress or nostress). We compared this model to the model containing fixed effects for vowel and stress (butno interaction) using a likelihood ratio test, which evaluated whether the interaction effectsignificantly improved model fit. (Both models had the same random-effects structure.) If theinteraction effect proved significant, we ran additional linear mixed-effects models on subsetsof the data corresponding to each of the five vowels. These within-vowel models included afixed effect for stress and the same random effects structures as the overall models. However,we used a Bonferroni-adjusted alpha level of .01 to account for the multiple comparisons(one for each of the five vowels). For within-vowel comparisons, we report the t-value fromthe model output as well as the p-value estimated by MCMC sampling (see above).4
3.1.1 Fundamental frequency (f0)Figure 1 shows the mean values of f0 for primary and secondary stressed vowels and theirunstressed counterparts. Vowels with primary stress have significantly higher f0 values overall(by about 50 Hz) than those without stress. A likelihood ratio test indicates that a vowel bystress interaction effect significantly improves model fit (χ2(4) = 54.35, p < .001), suggestingthat the magnitude of the primary stress effect varies across vowels. However, within-vowelcomparisons show that the effect of primary stress remains significant for each of the vowelsindividually (Table 3). Vowels with secondary stress also have significantly higher f0 valuesthan those without stress overall (t = 11.05, p < .001), but this difference of about 9 Hz ismuch smaller than the difference found for primary stress. A likelihood ratio test indicatesthat a vowel by stress interaction effect does not significantly improve model fit (χ2(4) =
found based on the t-values reported in the output of the linear-mixed effects models. Therefore, we donot report the likelihood ratio tests to avoid redundancy.
4 To compare stressed vowels with unstressed vowels, we focused on the first two syllables of each word.Because just over half of the words were possible reduplicative forms (i.e. the first and second syllablewere identical as in [nenenu]), it is possible that our effects were due to differences between base andreduplicant rather than stress. To address this concern, we also ran models containing an added fixedeffect of possible reduplication (yes or no). We found that any significant main effects of stress andsignificant interactions between stress and vowel quality remained when reduplication was added to themodel, indicating that the effects reported below cannot be attributed to reduplication.
Phonetics of Tongan stress 19
Table 3 Mean f0 (in Hz; standard deviations in parentheses) for vowels with primary stress and nostress, both overall and by individual vowel. t-values are taken from the linear mixed-effectsmodels and p-values are estimated using MCMC sampling.
Primary stress No stress t-value p-value
Overall 192.31 (34.85) 141.93 (16.98) 46.26 <.001/i/ 203.30 (35.45) 145.36 (16.91) 25.06 <.001/e/ 184.86 (29.36) 137.60 (15.37) 23.24 <.001/a/ 174.86 (26.95) 136.24 (14.26) 17.93 <.001/o/ 191.43 (32.54) 143.07 (16.92) 19.24 <.001/u/ 207.51 (38.41) 147.48 (18.55) 21.82 <.001
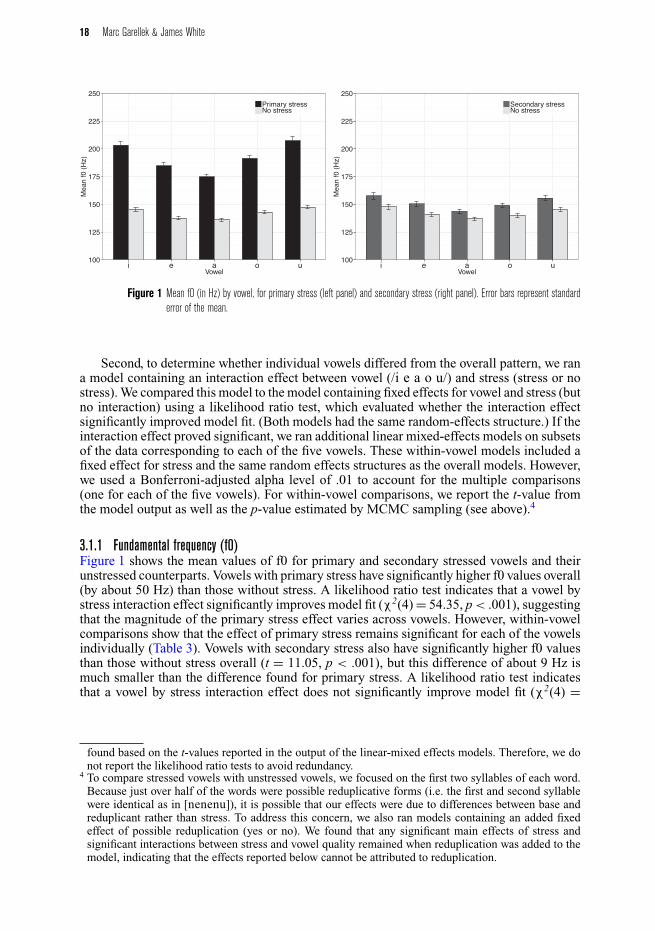
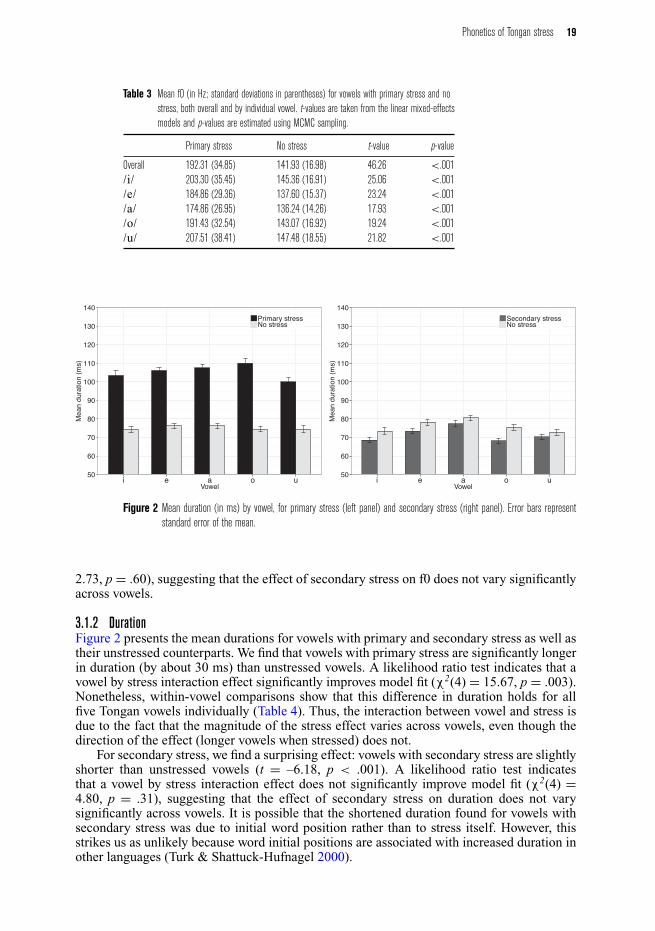
Figure 2 Mean duration (in ms) by vowel, for primary stress (left panel) and secondary stress (right panel). Error bars representstandard error of the mean.
2.73, p = .60), suggesting that the effect of secondary stress on f0 does not vary significantlyacross vowels.
3.1.2 DurationFigure 2 presents the mean durations for vowels with primary and secondary stress as well astheir unstressed counterparts. We find that vowels with primary stress are significantly longerin duration (by about 30 ms) than unstressed vowels. A likelihood ratio test indicates that avowel by stress interaction effect significantly improves model fit (χ2(4) = 15.67, p = .003).Nonetheless, within-vowel comparisons show that this difference in duration holds for allfive Tongan vowels individually (Table 4). Thus, the interaction between vowel and stress isdue to the fact that the magnitude of the stress effect varies across vowels, even though thedirection of the effect (longer vowels when stressed) does not.
For secondary stress, we find a surprising effect: vowels with secondary stress are slightlyshorter than unstressed vowels (t = –6.18, p < .001). A likelihood ratio test indicatesthat a vowel by stress interaction effect does not significantly improve model fit (χ2(4) =4.80, p = .31), suggesting that the effect of secondary stress on duration does not varysignificantly across vowels. It is possible that the shortened duration found for vowels withsecondary stress was due to initial word position rather than to stress itself. However, thisstrikes us as unlikely because word initial positions are associated with increased duration inother languages (Turk & Shattuck-Hufnagel 2000).
20 Marc Garellek & James White
Table 4 Mean duration (in ms; standard deviations in parentheses) for vowels with primary stressand no stress, both overall and by individual vowel. t-values are taken from the linearmixed-effects models and p-values are estimated using MCMC sampling.
Primary stress No stress t-value p-value
Overall 105.36 (23.82) 75.16 (16.90) 36.41 <.001/i/ 103.44 (28.73) 74.32 (19.12) 13.44 <.001/e/ 106.10 (18.09) 76.23 (17.14) 18.66 <.001/a/ 107.56 (20.97) 76.26 (13.82) 19.47 <.001/o/ 110.01 (25.66) 74.41 (14.61) 18.68 <.001/u/ 100.02 (23.54) 74.51 (19.15) 15.60 <.001
Figure 3 Mean RMS energy by vowel, for primary stress (left panel) and secondary stress (right panel). Error bars represent standarderror of the mean.
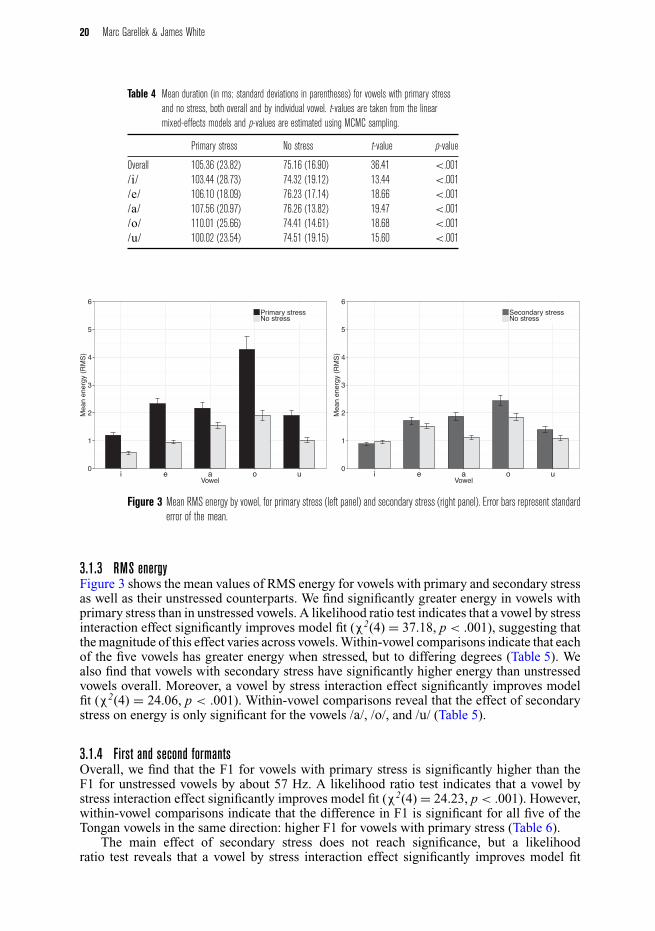
3.1.3 RMS energyFigure 3 shows the mean values of RMS energy for vowels with primary and secondary stressas well as their unstressed counterparts. We find significantly greater energy in vowels withprimary stress than in unstressed vowels. A likelihood ratio test indicates that a vowel by stressinteraction effect significantly improves model fit (χ2(4) = 37.18, p < .001), suggesting thatthe magnitude of this effect varies across vowels. Within-vowel comparisons indicate that eachof the five vowels has greater energy when stressed, but to differing degrees (Table 5). Wealso find that vowels with secondary stress have significantly higher energy than unstressedvowels overall. Moreover, a vowel by stress interaction effect significantly improves modelfit (χ2(4) = 24.06, p < .001). Within-vowel comparisons reveal that the effect of secondarystress on energy is only significant for the vowels /a/, /o/, and /u/ (Table 5).
3.1.4 First and second formantsOverall, we find that the F1 for vowels with primary stress is significantly higher than theF1 for unstressed vowels by about 57 Hz. A likelihood ratio test indicates that a vowel bystress interaction effect significantly improves model fit (χ2(4) = 24.23, p < .001). However,within-vowel comparisons indicate that the difference in F1 is significant for all five of theTongan vowels in the same direction: higher F1 for vowels with primary stress (Table 6).
The main effect of secondary stress does not reach significance, but a likelihoodratio test reveals that a vowel by stress interaction effect significantly improves model fit
Phonetics of Tongan stress 21
Table 5 Mean RMS energy (standard deviations in parentheses) overall and by vowel, for primary stress vs. no stress (left panel) and secondary stressvs. no stress (right panel). t-values are taken from the linear mixed-effects models and p-values are estimated using MCMC sampling.
Primary Secondarystress No stress t-value p-value stress No stress t-value p-value
Overall 2.35 (3.04) 1.19 (1.28) 10.66 <.001 Overall 1.66 (1.56) 1.30 (1.07) 5.81 <.001/i/ 1.20 (1.07) .56 (.49) 7.03 <.001 /i/ .88 (.76) .96 (.64) �1.08 .286/e/ 2.33 (2.24) .95 (.71) 8.26 <.001 /e/ 1.72 (1.41) 1.52 (.99) 1.52 .136/a/ 2.17 (2.50) 1.54 (1.37) 3.08 .003 /a/ 1.87 (1.54) 1.11 (.87) 5.53 <.001/o/ 4.28 (5.11) 1.90 (1.83) 5.84 <.001 /o/ 2.43 (2.04) 1.84 (1.44) 3.41 .002/u/ 1.91 (2.11) 1.02 (1.15) 5.05 <.001 /u/ 1.39 (1.31) 1.09 (1.00) 2.64 .008
Table 6 Mean F1 (in Hz; standard deviations in parentheses) overall and by vowel for primary stress vs. no stress (left panel) and secondary stress vs.no stress (right panel). t-values are taken from the linear mixed-effects models and p-values are estimated using MCMC sampling.
Primary stress No stress t-value p-value Secondary stress No stress t-value p-value
Overall 515.75 (178.63) 458.98 (186.32) 14.45 <.001 Overall 460.62 (168.56) 456.50 (161.82) 1.10 .277/i/ 336.22 (33.84) 296.39 (55.08) 7.18 <.001 /i/ 304.62 (32.48) 306.65 (31.11) �0.66 .514/e/ 474.66 (45.81) 390.54 (53.22) 17.79 <.001 /e/ 403.92 (43.38) 411.83 (44.69) �2.66 .009/a/ 811.20 (81.68) 774.97 (78.79) 4.64 <.001 /a/ 750.06 (84.32) 717.01 (85.60) 5.53 <.001/o/ 541.78 (65.05) 501.38 (100.99) 3.53 .008 /o/ 498.74 (85.51) 503.43 (91.71) �0.27 .787/u/ 400.27 (62.13) 340.94 (55.15) 8.25 <.001 /u/ 354.99 (54.59) 351.08 (76.20) 0.52 .609
Table 7 Mean F2 (in Hz; standard deviations on parentheses) for vowels with primary stress and nostress, both overall and by individual vowel. t-values are taken from the linear mixed-effectsmodels and p-values are estimated using MCMC sampling.
Primary stress No stress t-value p-value
Overall 1738.31 (591.71) 1746.29 (602.50) �0.14 .869/i/ 2418.72 (171.55) 2439.66 (196.83) �1.81 .082/e/ 2176.37 (121.90) 2229.71 (161.28) �5.56 <.001/a/ 1650.13 (128.48) 1540.13 (132.32) 10.31 <.001/o/ 1258.87 (548.90) 1283.87 (482.78) �0.29 .779/u/ 1144.49 (424.34) 1177.46 (453.42) �0.67 .499
(χ2(4) = 16.76, p = .002). Within-vowel comparisons reveal that the vowel /a/ has a greaterF1 under secondary stress compared to no stress. The vowel /e/ has a lower F1 under secondarystress, but this difference is very small. There is no significant difference in F1 due to secondarystress for vowels /i/, /o/, and /u/ (Table 6).
Looking at the F2 values, we find no significant main effect of primary stress on F2overall, but a likelihood ratio test indicates that a vowel by stress interaction effect significantlyimproves model fit (χ2(4) = 10.72, p = .03). Within-vowel comparisons (Table 7) reveal thatthe vowel /a/ has a significantly higher F2 when it has primary stress compared to no stress,and the vowel /e/ has a significantly lower F2 under primary stress. There is no significantdifference based on primary stress for the vowels /i/, /o/, and /u/.
For secondary stress, the main effect on F2 was not found to be significant (t =.47, p = .65). In addition, adding a vowel by stress interaction effect did not significantlyimprove model fit (χ2(4) = 7.13, p = .13).
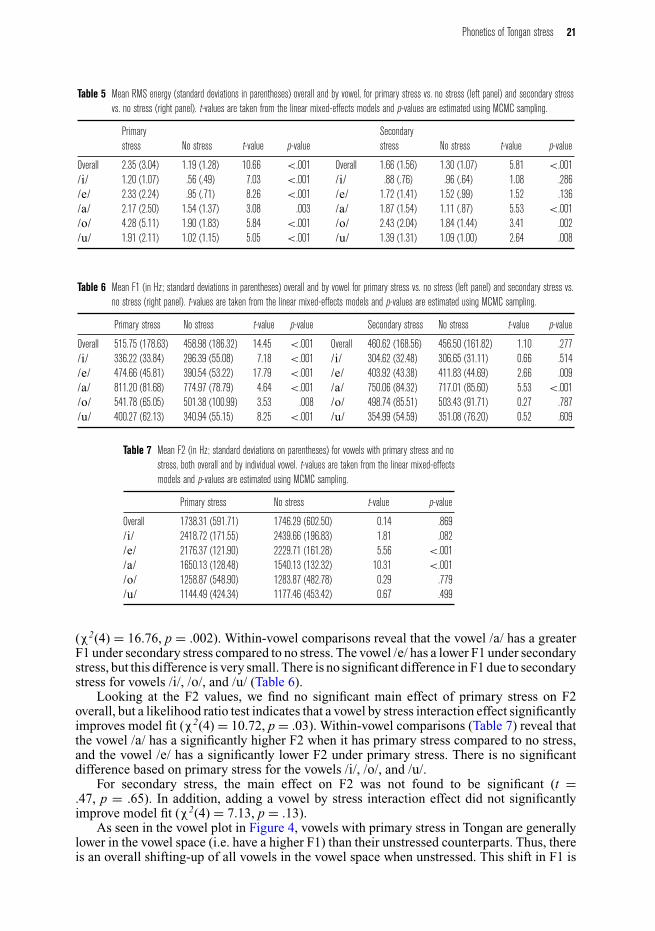
As seen in the vowel plot in Figure 4, vowels with primary stress in Tongan are generallylower in the vowel space (i.e. have a higher F1) than their unstressed counterparts. Thus, thereis an overall shifting-up of all vowels in the vowel space when unstressed. This shift in F1 is
22 Marc Garellek & James White
Figure 4 Vowel plot for primary stress vs. unstressed vowels. F1 × F2 clouds show one standard deviation from mean value.
generally not accompanied by a significant change in F2, except for /a/ (which has a higherF2 when stressed) and /e/ (which has a slightly lower F2 when stressed).
It should also be noted that the vowel space in Figure 4 shows little to no overlap betweenthe five vowels – even when they are unstressed. For each vowel, there is some overlap betweenthe two stress conditions (e.g. between stressed /u/ and unstressed /u/), but the data show thatin Tongan both stressed and unstressed vowels are well dispersed. Note that if the unstressedvowels were subject to phonetic undershoot, we would expect an overall smaller vowel space(and potentially some overlap between the five vowel categories) for unstressed vowels. Theimplications of this pattern in the vowel space will be discussed in greater detail Section 4.1.
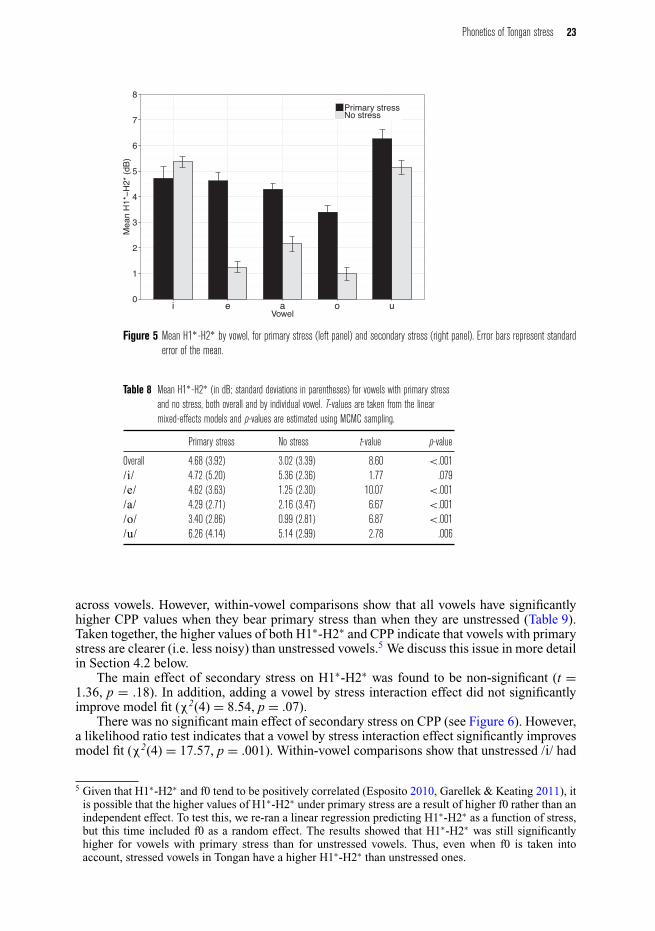
3.1.5 Voice quality measures (H1∗-H2∗ and CPP)The results for H1∗-H2∗ (see Figure 5) show a significant main effect for primary stress. Alikelihood ratio test indicates that a vowel by stress interaction effect significantly improvesmodel fit (χ2(4) = 50.85, p < .001). Within-vowel comparisons show that all vowels but/i/ have significantly higher H1∗-H2∗ values when they bear primary stress than when theyare unstressed. For /i/, there was no significant change in H1∗-H2∗ as a function of stress(Table 8). H1∗-H2∗ is a measure of RELATIVE voice quality, and it can be difficult to interpretspecific values in absolute terms. Vowels with primary stress may have higher values of H1∗-H2∗ because they are breathier relative to unstressed vowels, or because unstressed vowels arecreakier. To distinguish between these two possibilities, we report below the results for CPP(Hillenbrand et al. 1994), which decreases under noise from both breathiness and aperiodicitydue to creaky voice (Garellek & Keating 2011). Thus, if the higher H1∗-H2∗ values underprimary stress are accompanied by low values for CPP, we can conclude that vowels arebreathier when they bear primary stress. On the other hand, if vowels with primary stress havehigh CPP values, we can conclude that stressed vowels are less creaky (i.e. have less noisedue to aperiodicity) than unstressed vowels.
The results for CPP also show a significant main effect for primary stress. A likelihoodratio test indicates that a vowel by stress interaction effect significantly improves model fit(χ2(4) = 34.71, p < .001), suggesting that the magnitude of the primary stress effect varies
Phonetics of Tongan stress 23
Figure 5 Mean H1∗-H2∗ by vowel, for primary stress (left panel) and secondary stress (right panel). Error bars represent standarderror of the mean.
Table 8 Mean H1∗-H2∗ (in dB; standard deviations in parentheses) for vowels with primary stressand no stress, both overall and by individual vowel. T-values are taken from the linearmixed-effects models and p-values are estimated using MCMC sampling.
Primary stress No stress t-value p-value
Overall 4.68 (3.92) 3.02 (3.39) 8.60 <.001/i/ 4.72 (5.20) 5.36 (2.36) �1.77 .079/e/ 4.62 (3.63) 1.25 (2.30) 10.07 <.001/a/ 4.29 (2.71) 2.16 (3.47) 6.67 <.001/o/ 3.40 (2.86) 0.99 (2.81) 6.87 <.001/u/ 6.26 (4.14) 5.14 (2.99) 2.78 .006
across vowels. However, within-vowel comparisons show that all vowels have significantlyhigher CPP values when they bear primary stress than when they are unstressed (Table 9).Taken together, the higher values of both H1∗-H2∗ and CPP indicate that vowels with primarystress are clearer (i.e. less noisy) than unstressed vowels.5 We discuss this issue in more detailin Section 4.2 below.
The main effect of secondary stress on H1∗-H2∗ was found to be non-significant (t =1.36, p = .18). In addition, adding a vowel by stress interaction effect did not significantlyimprove model fit (χ2(4) = 8.54, p = .07).
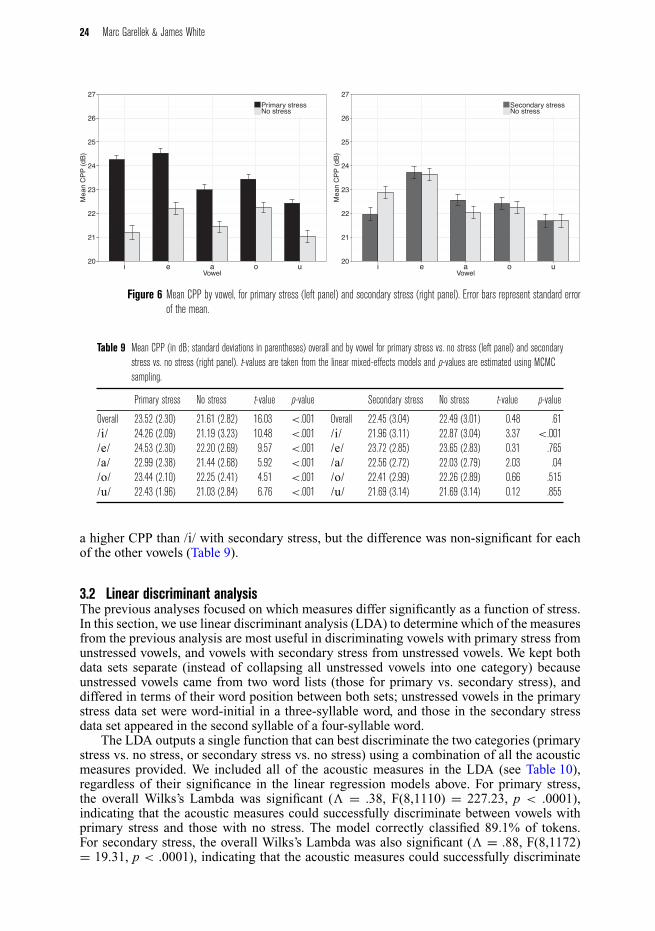
There was no significant main effect of secondary stress on CPP (see Figure 6). However,a likelihood ratio test indicates that a vowel by stress interaction effect significantly improvesmodel fit (χ2(4) = 17.57, p = .001). Within-vowel comparisons show that unstressed /i/ had
5 Given that H1∗-H2∗ and f0 tend to be positively correlated (Esposito 2010, Garellek & Keating 2011), itis possible that the higher values of H1∗-H2∗ under primary stress are a result of higher f0 rather than anindependent effect. To test this, we re-ran a linear regression predicting H1∗-H2∗ as a function of stress,but this time included f0 as a random effect. The results showed that H1∗-H2∗ was still significantlyhigher for vowels with primary stress than for unstressed vowels. Thus, even when f0 is taken intoaccount, stressed vowels in Tongan have a higher H1∗-H2∗ than unstressed ones.
24 Marc Garellek & James White
Figure 6 Mean CPP by vowel, for primary stress (left panel) and secondary stress (right panel). Error bars represent standard errorof the mean.
Table 9 Mean CPP (in dB; standard deviations in parentheses) overall and by vowel for primary stress vs. no stress (left panel) and secondarystress vs. no stress (right panel). t-values are taken from the linear mixed-effects models and p-values are estimated using MCMCsampling.
Primary stress No stress t-value p-value Secondary stress No stress t-value p-value
Overall 23.52 (2.30) 21.61 (2.82) 16.03 <.001 Overall 22.45 (3.04) 22.49 (3.01) �0.48 .61/i/ 24.26 (2.09) 21.19 (3.23) 10.48 <.001 /i/ 21.96 (3.11) 22.87 (3.04) �3.37 <.001/e/ 24.53 (2.30) 22.20 (2.69) 9.57 <.001 /e/ 23.72 (2.85) 23.65 (2.83) 0.31 .765/a/ 22.99 (2.38) 21.44 (2.68) 5.92 <.001 /a/ 22.56 (2.72) 22.03 (2.79) 2.03 .04/o/ 23.44 (2.10) 22.25 (2.41) 4.51 <.001 /o/ 22.41 (2.99) 22.26 (2.89) 0.66 .515/u/ 22.43 (1.96) 21.03 (2.84) 6.76 <.001 /u/ 21.69 (3.14) 21.69 (3.14) �0.12 .855
a higher CPP than /i/ with secondary stress, but the difference was non-significant for eachof the other vowels (Table 9).
3.2 Linear discriminant analysisThe previous analyses focused on which measures differ significantly as a function of stress.In this section, we use linear discriminant analysis (LDA) to determine which of the measuresfrom the previous analysis are most useful in discriminating vowels with primary stress fromunstressed vowels, and vowels with secondary stress from unstressed vowels. We kept bothdata sets separate (instead of collapsing all unstressed vowels into one category) becauseunstressed vowels came from two word lists (those for primary vs. secondary stress), anddiffered in terms of their word position between both sets; unstressed vowels in the primarystress data set were word-initial in a three-syllable word, and those in the secondary stressdata set appeared in the second syllable of a four-syllable word.
The LDA outputs a single function that can best discriminate the two categories (primarystress vs. no stress, or secondary stress vs. no stress) using a combination of all the acousticmeasures provided. We included all of the acoustic measures in the LDA (see Table 10),regardless of their significance in the linear regression models above. For primary stress,the overall Wilks’s Lambda was significant (� = .38, F(8,1110) = 227.23, p < .0001),indicating that the acoustic measures could successfully discriminate between vowels withprimary stress and those with no stress. The model correctly classified 89.1% of tokens.For secondary stress, the overall Wilks’s Lambda was also significant (� = .88, F(8,1172)= 19.31, p < .0001), indicating that the acoustic measures could successfully discriminate
Phonetics of Tongan stress 25
Table 10 Results of linear discriminant analysis.
Correlation of measure withdiscriminant functions
Acoustic measure Primary stress Secondary stress
f0 �0.85 �0.56Duration �0.75 0.43Energy �0.33 �0.41F1 �0.20 �0.04F2 0.009 �0.02H1∗-H2∗ �0.27 �0.09CPP �0.43 0.01
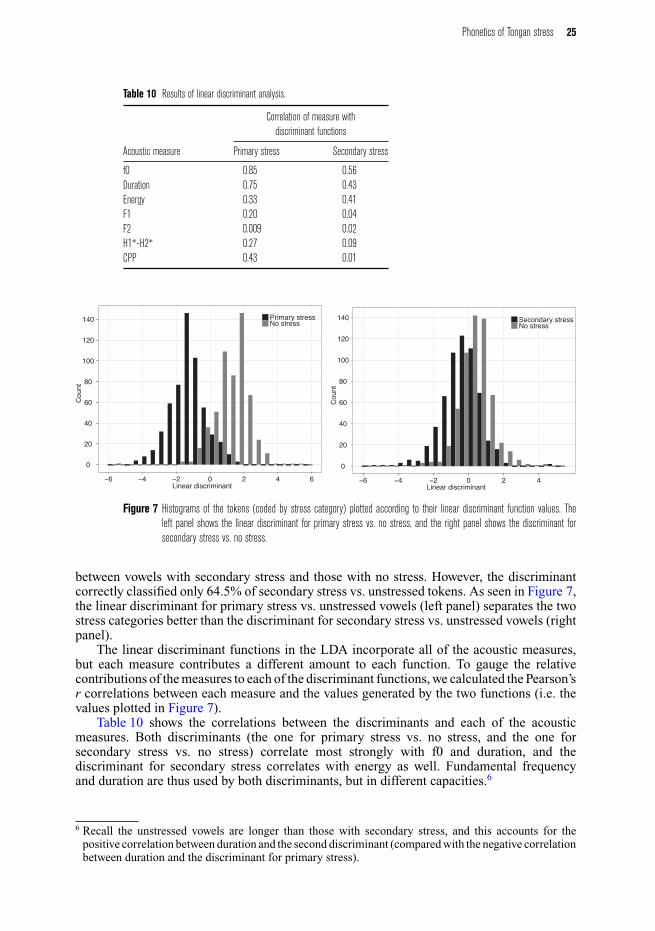
Figure 7 Histograms of the tokens (coded by stress category) plotted according to their linear discriminant function values. Theleft panel shows the linear discriminant for primary stress vs. no stress, and the right panel shows the discriminant forsecondary stress vs. no stress.
between vowels with secondary stress and those with no stress. However, the discriminantcorrectly classified only 64.5% of secondary stress vs. unstressed tokens. As seen in Figure 7,the linear discriminant for primary stress vs. unstressed vowels (left panel) separates the twostress categories better than the discriminant for secondary stress vs. unstressed vowels (rightpanel).
The linear discriminant functions in the LDA incorporate all of the acoustic measures,but each measure contributes a different amount to each function. To gauge the relativecontributions of the measures to each of the discriminant functions, we calculated the Pearson’sr correlations between each measure and the values generated by the two functions (i.e. thevalues plotted in Figure 7).
Table 10 shows the correlations between the discriminants and each of the acousticmeasures. Both discriminants (the one for primary stress vs. no stress, and the one forsecondary stress vs. no stress) correlate most strongly with f0 and duration, and thediscriminant for secondary stress correlates with energy as well. Fundamental frequencyand duration are thus used by both discriminants, but in different capacities.6
6 Recall the unstressed vowels are longer than those with secondary stress, and this accounts for thepositive correlation between duration and the second discriminant (compared with the negative correlationbetween duration and the discriminant for primary stress).
26 Marc Garellek & James White
Thus, even though multiple measures can differentiate stressed from unstressed vowelswhen considered individually (particularly for primary stress), f0 and duration are found tobe most important for discriminating vowels with primary or secondary stress from vowelswith no stress. This analysis suggests that these measures may serve as the most reliable stresscues to listeners as well.
4 DiscussionIn this study we found that multiple measures distinguish stressed and unstressed vowels. Inparticular, vowels with primary stress are marked by higher f0, higher F1, longer duration,higher energy, higher H1∗-H2∗, and higher CPP relative to vowels without stress. Thoughmultiple measures correlate with stress in Tongan, the linear discriminant analysis showed thatf0 and duration were the most useful cues for discriminating between stressed and unstressedvowels. With the exception of F1 and F2 (discussed below), these results are generallyconsistent with findings that have been reported for stress correlates in other languages (seeSection 1 above).
We also find that primary stress is correlated with a different set of measures thansecondary stress in Tongan, which is similar to Adisasmito-Smith & Cohn’s (1996) findingsfor Indonesian. In particular, duration, f0, and energy are found to be consistently different invowels with secondary stress and unstressed vowels, a subset of those found to be significantcues for primary stress.
In the remainder of this section, we discuss several aspects of our results in more detail.In Section 4.1, we focus on the effect of primary stress on the Tongan vowel space, arguingthat the results are more consistent with a sonority expansion strategy (Beckman, Edwards &Fletcher 1992, de Jong, Beckman & Edwards 1993) than with an account based on phoneticundershoot. In Section 4.2, we discuss the implications with regard to stress and voice quality.Finally, in Section 4.3, we consider the possible effect that the confounding of word stressand phrasal accent had in our study.
4.1 Phonetic targets and the effects of stress on the vowel spaceRecall that the Tongan vowel space was neither expanded nor reduced in unstressed vowelsrelative to vowels with primary stress (Figure 4). Instead, all five vowels were higher in thevowel space (i.e. had lower F1) when unstressed, with no change in the overall size of thevowel space. This pattern of results is informative for our understanding of phonetic targetsand how they are realized within the context of a stress system. As we describe below, theTongan results are not consistent with some common accounts of how vowel quality is affectedby stress (or lack of stress).
Crosswhite (2001) discusses two common phonological vowel reduction systems:centralization of the unstressed vowels (e.g. as in English) and merging vowel contrasts (e.g. asin Catalan and Italian). Yet even in languages without phonological vowel reduction, we expecta tendency for a phonetically reduced acoustic vowel space in unstressed vowels (Flemming2005). Indeed, this is often discussed in terms of phonetic ‘undershoot’. In Lindblom’s (1990)‘Hyper- and Hypoarticulation’ theory, the input to the speech system at the time of productionrepresents an ideal goal that the speaker intends to produce. In certain speech conditions inwhich the duration of speech sounds is reduced (e.g. casual speech and unstressed vowels),articulatory targets may not be fully reached, resulting in what is commonly called undershoot.Similarly, in the Articulatory Phonology framework (Browman & Goldstein 1986, 1990), eachspeech sound is associated with a set of articulatory gestures. In running speech, gestures inclose proximity overlap. Under conditions where speech sounds have shorter durations, thesegestures have greater overlap due to the temporal compression. As a result, the gestural targets
Phonetics of Tongan stress 27
may not be fully realized. Johnson, Flemming & Wright (1993) likewise discuss what theycall the ‘hyperspace’ effect, in which careful speech is characterized by a larger overall vowelspace than reduced speech. Over time, the tendency to reduce the vowel space for unstressedvowels due to articulatory undershoot (a phonetic effect) may lead to phonological patternsof vowel reduction that we see in many of the world’s languages (e.g. see Flemming 2005,Barnes 2012).
In Tongan, we found that unstressed vowels indeed had shorter durations than vowelswith primary stress (see Table 4 above). Therefore, it is reasonable to expect that unstressedvowels in Tongan should be subject to undershoot and a reduced vowel space (Flemming2005). However, the particular pattern found in Tongan does not follow from any of thetheories discussed above. As the vowel space plot in Figure 4 above shows, the overallsize of the Tongan vowel space is not reduced for unstressed vowels as predicted by thehyperarticulation account; rather, the size of the vowel space is comparable for stressed andunstressed vowels. Moreover, the vowel space for unstressed vowels resembles neither of thetwo phonological systems of vowel reduction discussed by Crosswhite (2001): the unstressedvowels are not moving towards the center of the vowel space (as in centralization) and they arenot moving closer to each other (as in contrast merging). Rather, all of the vowels, includingthe high vowels, are higher in the vowel space when unstressed.
We propose that the relationship between Tongan stressed and unstressed vowels is notone characterized by undershoot or the hyperspace effect, but rather by a shifted vowelspace that retains both its overall size and the relative distance between the vowels withinthat space. This kind of pattern has been referred to as ‘sonority expansion’ (e.g. Beckmanet al. 1992, de Jong et al. 1993), whereby all vowels exhibit jaw lowering under stress toenhance sonority. Beckman et al. (1992) argued that sonority expansion might account forthe increased jaw displacement for accented (phrasally-stressed) [ɑ] in English. However, ina subsequent experiment, de Jong et al. (1993) found that the results were more consistentwith hyperarticulation, because accented [ʊ] differed from unaccented [ʊ] mostly in terms oftongue retraction rather than lowering. They therefore argue for hyperarticulation as a moresuitable explanation for the English data in both experiments. However, the acoustic datafrom Tongan presented here are only consistent with sonority expansion, because F1 raisesunder stress even for non-low vowels. Further research could verify whether the increase inF1 under stress is due to jaw lowering or some other articulatory mechanism.
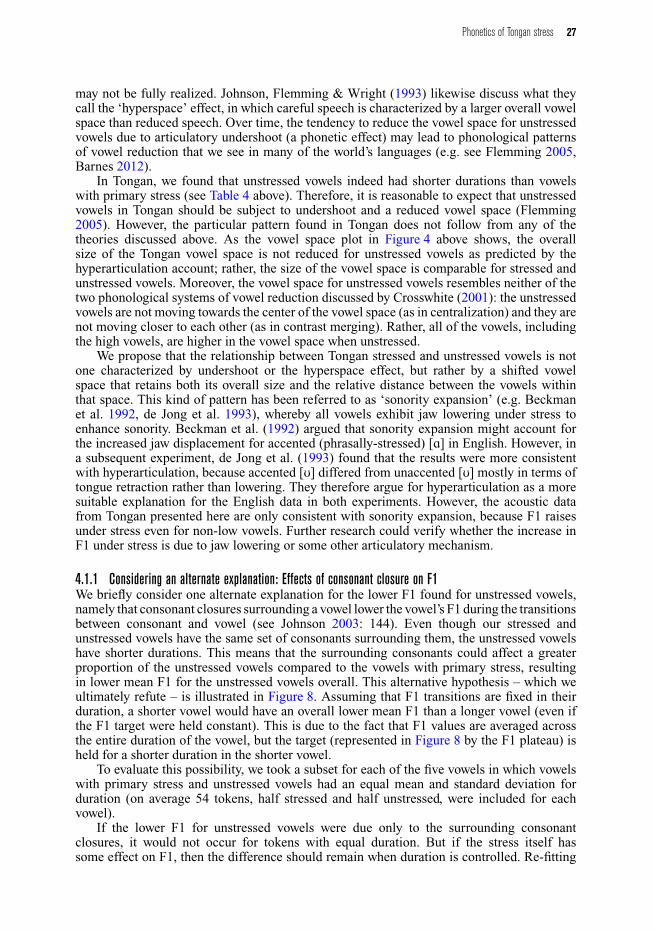
4.1.1 Considering an alternate explanation: Effects of consonant closure on F1We briefly consider one alternate explanation for the lower F1 found for unstressed vowels,namely that consonant closures surrounding a vowel lower the vowel’s F1 during the transitionsbetween consonant and vowel (see Johnson 2003: 144). Even though our stressed andunstressed vowels have the same set of consonants surrounding them, the unstressed vowelshave shorter durations. This means that the surrounding consonants could affect a greaterproportion of the unstressed vowels compared to the vowels with primary stress, resultingin lower mean F1 for the unstressed vowels overall. This alternative hypothesis – which weultimately refute – is illustrated in Figure 8. Assuming that F1 transitions are fixed in theirduration, a shorter vowel would have an overall lower mean F1 than a longer vowel (even ifthe F1 target were held constant). This is due to the fact that F1 values are averaged acrossthe entire duration of the vowel, but the target (represented in Figure 8 by the F1 plateau) isheld for a shorter duration in the shorter vowel.
To evaluate this possibility, we took a subset for each of the five vowels in which vowelswith primary stress and unstressed vowels had an equal mean and standard deviation forduration (on average 54 tokens, half stressed and half unstressed, were included for eachvowel).
If the lower F1 for unstressed vowels were due only to the surrounding consonantclosures, it would not occur for tokens with equal duration. But if the stress itself hassome effect on F1, then the difference should remain when duration is controlled. Re-fitting
28 Marc Garellek & James White
Figure 8 Schematic of possible F1 effect as a function of adjacent consonant [k] and vowel duration [e]. The F1 contours duringvowels of differing lengths are schematized in terms of frequency (on y-axis) and duration of vowel (on x-axis). Thishypothetical effect is not found in the current study; duration does not influence F1 independently of stress.
the models to just the subsets with an equal mean duration, the difference in F1 remainssignificant for all vowels except /a/. Thus we conclude that for all vowels except /a/, primarystress results in a higher F1, independent of any effect of duration or the surroundingconsonants. Thus, a scenario like the kind represented in Figure 8 does not account forthe lower F1 of unstressed vowels in Tongan. These results also provide further support forthe conclusion that phonetic undershoot, which depends on the difference in duration betweenstressed and unstressed vowels, cannot solely explain the lowered F1 for unstressed vowels inTongan.7
4.1.2 Motivation for the shifted vowel space in TonganOne possible motivation for the shifted vowel space is perceptual clarity: enhancing thecontrast between stressed and unstressed vowels without sacrificing the vowel quality contrast.Vowel reduction of the type found in English is effective at making stressed vowels verydistinct from unstressed vowels, but the distinction between many vowel qualities is lost inunstressed vowels. This reduction strategy, however, would be counterproductive in a languagewith few distinctive phonemes and relatively simple syllable structure such as Tongan. Insuch languages, distinctions between different vowel qualities are highly informative evenfor unstressed vowels because losing those contrasts would result in many merged words.At the same time, stress plays an important role in morphological processes in Tongan,such as the definitive accent (see Anderson & Otsuka 2006). Thus, enhancing the contrastbetween stressed and unstressed vowels via slightly modified F1 values, without threateningthe contrast between vowel qualities, could be perceptually beneficial. It is important to recallthat F1 is not the sole acoustic measure correlated with stress in Tongan; it is therefore unclearwhether listeners focus on any single measure as a cue to stress, rather than relying on theintegration of several acoustic cues.
Given that the shift in the vowel space under stress cannot be accounted for by phoneticundershoot, our interpretation also implies that the shift in the vowel space has beenphonologized. In other words, the sonority expansion strategy is part of the phonologicalsystem that Tongan speakers use to cue differences in stress. As a result, we predict thatTongan speakers should be able to use F1 as a cue to stress in a perceptual task with othermeasures held constant. We leave this prediction for future work. We conclude by noting thatTongan is unlikely to be unique in exhibiting the shifted system of unstressed vowels. As such,these findings underscore the need to examine a wider selection of languages to increase ourunderstanding of how stress may affect the vowel space.
7 Note that phonetic undershoot may be responsible for the F1 differences for the low vowel /a/ becausethe F1 difference for /a/ did not remain significant when duration was controlled.
Phonetics of Tongan stress 29
4.2 Voice quality and stressThe voice quality results show that H1∗-H2∗ and CPP are generally higher for vowels withprimary stress than for unstressed vowels. Higher H1∗-H2∗ values are associated with lesscreakiness and/or breathier voice quality, whereas higher CPP values indicate a more modal,more periodic vowel. Thus, when taken together, the two measures indicate that primarystressed vowels in Tongan are more modal than unstressed vowels. Because unstressed vowelshave lower H1∗-H2∗ and CPP values, they are assumed to be creakier or less periodic thanvowels with primary stress. The aperiodicity in creaky phonation is likely to lower both H1∗-H2∗ and CPP, as seen in other languages like Mazatec, Zapotec, and Yi (Garellek & Keating2011, Keating et al. 2011). Thus, the inclusion of CPP in this study is important, in that ithelps clarify the H1∗-H2∗ results.
Our results also indicate that voice quality and stress in Tongan interact similarly to whathas been shown in other languages. Campbell & Beckman (1997) found similar spectralchanges in English vowels. They calculated H1-H2 (in their study, H2-H1, uncorrectedfor vowel formants), and three of the four speakers showed lower values of H2-H1 (thus,higher H1-H2) for accented vowels compared to stressed or unstressed ones. The results inCampbell & Beckman (1997) are consistent with ours, because vowels with primary stress(which also bore accent in our study) showed higher values of H1∗-H2∗. Therefore, our studyprovides further evidence that stress affects voice quality. The results also show that bothharmonic and inharmonic (noise) measures should be used to analyze voice quality (Simpson2012), and that closer examination of these effects on various components of the spectrum iswarranted.
We hypothesize that the higher values of H1∗-H2∗ under stress could serve as a cue tolisteners: Higher H1∗-H2∗ values mean that the first harmonic is louder under primary stressrelative to the second harmonic. A louder H1 accompanied by greater periodicity wouldresult in a louder and clearer f0 (the frequency of H1) during stress. If stress in Tongan isprimarily cued by f0, and if stress plays an important role in the language (as we claim),then it is reasonable to assume that the relative loudness of the fundamental frequencywould be perceptually useful for Tongan listeners. Studies of other languages have illustratedthat listeners may be highly sensitive to voice quality measures like H1-H2 (or H1∗-H2∗) –especially when voice quality is contrastive (as in Hmong; Garellek et al. 2013), but even whenvoice quality accompanies other linguistic features like lexical tone (Kreiman & Gerratt 2010,Kreiman, Gerratt & Khan 2010). It is thus possible that Tongan listeners would be sensitiveto changes in voice quality as a function of lexical stress.
4.3 Pitch accent vs. word stressIt is possible that the findings of this study are associated with pitch-accented vowels (i.e.phrasal prominence) rather than stress (lexical prominence). As mentioned earlier, we believethat for primary stress, it is effectively impossible to disambiguate between these two levelsof prominence in our case. In Tongan, each content word typically forms its own accentualphrase, thereby necessarily bearing a pitch accent (Kuo & Vicenik 2012). Moreover, sincefocus in Tongan is expressed primarily through syntactic means with no overt prosodicchanges (Kuo & Vicenik 2012), we were unable to elicit unaccented content words throughpost-focal de-accenting. Although this is a limitation in the current study, we expect that thesame problem would arise in phonetic studies of stress in other languages that have bothlexical stress and obligatory accentual phrase pitch accents, e.g. Farsi (Jun 2005, Scarborough2007). It should also be noted that even though vowels with primary stress in this study alwaysbore a pitch accent, vowels with secondary stress did not. Thus, we can conclude that thehigher f0 that is characteristic of vowels with secondary stress is due to lexical stress ratherthan the presence of a pitch accent. Because secondary stress clearly has an effect on f0, it islikely that part of the difference in f0 (and possibly other measures) seen for primary stress isalso due to lexical stress itself and not only to phrasal accent. Future research on the intonation
30 Marc Garellek & James White
of Tongan may help determine how lexical stress and phrasal accent may be disentangled inthe language.
5 ConclusionsThe primary goal of this paper was to determine which acoustic measures correlate withboth primary and secondary stress in Tongan. The results indicate that vowels with primarystress are marked by higher f0, higher F1, longer duration, higher energy, and more regularvoice quality relative to vowels without stress. Vowels with secondary stress are marked byhigher f0 and energy, as well as shorter duration. We found a lowering of F1 for all unstressedvowels, including high vowels. This shift in the vowel space with no corresponding changein its overall size is inconsistent with an explanation based on phonetic undershoot alone, butis consistent with the interpretation that stressed vowels are lowered to enhance sonority (i.e.sonority expansion).
In addition to its implications for our understanding of how stress is realized cross-linguistically, this work provides a foundation for future work on phonological phenomenain Tongan that involve stress. Specifically, the measures that statistically correlate with stresscould be used in studies investigating how speakers of Tongan use and perceive the ‘definitiveaccent’ (Anderson & Otsuka 2006). They could also serve as a tool in studies aimed at settlingthe ongoing dispute over the phonological structure of vowel–vowel sequences in Tongan (seeChurchward 1953, Feldman 1978, Poser 1985, Schutz 2001, Taumoefolau 2002, Garellek &White 2010).
Appendix. Words elicited in the experiment written in IPA
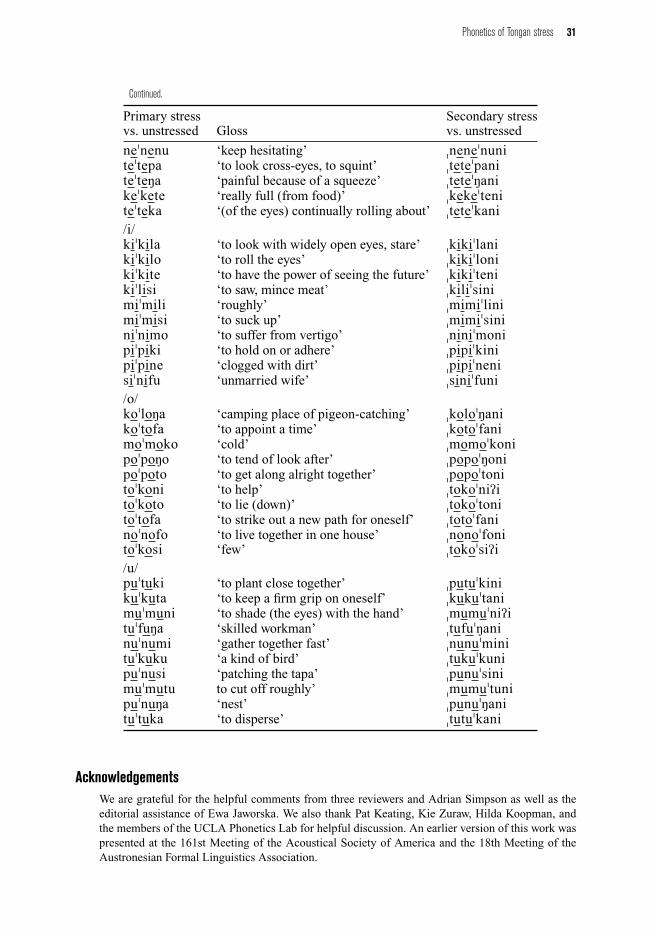
The stressed and unstressed vowels that were compared in the experiment are underlined.
Primary stress Secondary stressvs. unstressed Gloss vs. unstressed
/a/maˈfana ‘warm (of food, water) ˌmafaˈnanitaˈlamu ‘chew’ ˌtalaˈmunipaˈnaki ‘to be near, close’ ˌpanaˈkinipaˈpaka ‘to be nervous’ ˌpapaˈkanimaˈnafu ‘piece of open ground’ ˌmanaˈfunimaˈnatu ‘to think of’ ˌmanaˈtunipaˈpani ‘to besmear’ ˌpapaˈniʔipaˈkaka ‘dry and rough or stiff’ ˌpakaˈkanitaˈkafi ‘outer cover for something’ ˌtakaˈfinimaˈkaka ‘rough (speech, behavior)’ ˌmakaˈkani/e/meˈlemo ‘to be drowned’ ˌmeleˈmoniteˈkena ‘to be pushed up or out’ ˌtekeˈnanikeˈkena ‘going yellow (of leaves)’ ˌkekeˈnanineˈnefu ‘blurred, indistinct’ ˌneneˈfunipeˈpenu ‘flexible, but difficult to break’ ˌpepeˈnuni
Phonetics of Tongan stress 31
Continued.
Primary stress Secondary stressvs. unstressed Gloss vs. unstressed
neˈnenu ‘keep hesitating’ ˌneneˈnuniteˈtepa ‘to look cross-eyes, to squint’ ˌteteˈpaniteˈteŋa ‘painful because of a squeeze’ ˌteteˈŋanikeˈkete ‘really full (from food)’ ˌkekeˈteniteˈteka ‘(of the eyes) continually rolling about’ ˌteteˈkani/i/kiˈkila ‘to look with widely open eyes, stare’ ˌkikiˈlanikiˈkilo ‘to roll the eyes’ ˌkikiˈlonikiˈkite ‘to have the power of seeing the future’ ˌkikiˈtenikiˈlisi ‘to saw, mince meat’ ˌkiliˈsinimiˈmili ‘roughly’ ˌmimiˈlinimiˈmisi ‘to suck up’ ˌmimiˈsininiˈnimo ‘to suffer from vertigo’ ˌniniˈmonipiˈpiki ‘to hold on or adhere’ ˌpipiˈkinipiˈpine ‘clogged with dirt’ ˌpipiˈnenisiˈnifu ‘unmarried wife’ ˌsiniˈfuni/o/koˈloŋa ‘camping place of pigeon-catching’ ˌkoloˈŋanikoˈtofa ‘to appoint a time’ ˌkotoˈfanimoˈmoko ‘cold’ ˌmomoˈkonipoˈpoŋo ‘to tend of look after’ ˌpopoˈŋonipoˈpoto ‘to get along alright together’ ˌpopoˈtonitoˈkoni ‘to help’ ˌtokoˈniʔitoˈkoto ‘to lie (down)’ ˌtokoˈtonitoˈtofa ‘to strike out a new path for oneself’ ˌtotoˈfaninoˈnofo ‘to live together in one house’ ˌnonoˈfonitoˈkosi ‘few’ ˌtokoˈsiʔi/u/puˈtuki ‘to plant close together’ ˌputuˈkinikuˈkuta ‘to keep a firm grip on oneself’ ˌkukuˈtanimuˈmuni ‘to shade (the eyes) with the hand’ ˌmumuˈniʔituˈfuŋa ‘skilled workman’ ˌtufuˈŋaninuˈnumi ‘gather together fast’ ˌnunuˈminituˈkuku ‘a kind of bird’ ˌtukuˈkunipuˈnusi ‘patching the tapa’ ˌpunuˈsinimuˈmutu to cut off roughly’ ˌmumuˈtunipuˈnuŋa ‘nest’ ˌpunuˈŋanituˈtuka ‘to disperse’ ˌtutuˈkani
AcknowledgementsWe are grateful for the helpful comments from three reviewers and Adrian Simpson as well as theeditorial assistance of Ewa Jaworska. We also thank Pat Keating, Kie Zuraw, Hilda Koopman, andthe members of the UCLA Phonetics Lab for helpful discussion. An earlier version of this work waspresented at the 161st Meeting of the Acoustical Society of America and the 18th Meeting of theAustronesian Formal Linguistics Association.
32 Marc Garellek & James White
ReferencesAdisasmito-Smith, Niken & Abigail C. Cohn. 1996. Phonetic correlates of primary and secondary stress
in Indonesian: A preliminary study. Working Papers of the Cornell Phonetic Laboratory 11, 1–16.Anderson, Victoria & Yuko Otsuka. 2003. Phonetic correlates of length, stress, and definitive accent in
Tongan. 15th International Congress of Phonetic Sciences (ICPhS XV), Universitat Aut Ÿonoma deBarcelona, 2047–2050.
Anderson, Victoria & Yuko Otsuka. 2006. The phonetics and phonology of ‘Definitive Accent’ in Tongan.Oceanic Linguistics 45, 25–42.
Baayen, R. Harald. 2008a. Analyzing linguistic data: A practical introduction to statistics using R.Cambridge: Cambridge University Press.
Baayen, R. Harald. 2008b. languageR: Data sets and functions with ‘Analyzing linguistic data: A practicalintroduction to statistics’. R package version 0.953.
Barnes, Jonathan. 2012. Phonetics and phonology in Russian unstressed vowel reduction: A study inhyperarticulation. Ms., Boston University.
Bates, Douglas, Martin Maechler & Bin Dai. 2008. lme4: Linear mixed-effects models using S4 classes.R package version 0.999375–28. http://lme4.r-forge.r-project.org/.
Beckman, Mary [E.], Jan Edwards & Janet Fletcher. 1992. Prosodic structure and tempo in a sonoritymodel of articulatory dynamics. In Gerard Docherty & D. Robert Ladd (eds.), Papers in LaboratoryPhonology II: Gesture, segment and prosody, 68–86. Cambridge: Cambridge University Press.
Bickley, Corine. 1982. Acoustic analysis and perception of breathy vowels. MIT Speech CommunicationWorking Papers 1, 73–83.
Blust, Robert. 2009. The Austronesian languages. Canberra: Pacific Linguistics.Boersma, Paul & David Weenink. 2009. PRAAT: Doing phonetics by computer (version 5.1.14).
http://www.praat.org/ (30 August 2009).Browman, Cathe P. & Louis Goldstein. 1986. Towards an articulatory phonology. Phonology 3, 219–252.Browman, Cathe P. & Louis Goldstein. 1990. Gestural specification using dynamically-defined articulatory
structures. Journal of Phonetics 18, 299–320.Campbell, Nick & Mary [E.] Beckman. 1997. Stress, prominence, and spectral tilt. In Antonis Botnis,
Georgios Kouroupetroglou & George Carayannis (eds.), Intonation: Theory, models and applications(ESCA Workshop on Intonation), 67–70.
Cho, Taehong & Patricia A. Keating. 2009. Effects of initial position versus prominence in English. Journalof Phonetics 37, 466–485.
Churchward, Clerk M. 1953. Tongan grammar. Oxford: Oxford University Press.Crosswhite, Katherine. 2001. Vowel reduction in Optimality Theory. New York: Routledge.de Jong, Kenneth, Mary E. Beckman & Jan Edwards. 1993. The interplay between prosodic structure and
coarticulation. Language and Speech 36, 197–212.Esposito, Christina M. 2010. The effects of linguistic experience on the perception of phonation. Journal
of Phonetics 38, 303–316.Everett, Keren L. 1998. The acoustic correlates of stress in Piraha. The Journal of Amazonian Languages
1, 104–162.Feldman, Harry. 1978. Some notes on Tongan phonology. Oceanic Linguistics 17, 133–139.Flemming, Edward. 2005. A phonetically-based model of vowel reduction. Ms., MIT.Fry, D. B. 1955. Duration and intensity as physical correlates of linguistic stress. Journal of the Acoustical
Society of America 27, 765–768.Garellek, Marc & Patricia Keating. 2011. The acoustic consequences of phonation and tone interactions
in Mazatec. Journal of the International Phonetic Association 41, 185–205.Garellek, Marc, Patricia Keating, Christina M. Esposito & Jody Kreiman. 2013. Voice quality and tone
identification in White Hmong. Journal of the Acoustical Society of America 133, 1078–1089.Garellek, Marc & James White. 2010. Acoustic correlates of stress and their use in diagnosing syllable
fusion in Tongan. UCLA Working Papers in Phonetics 108, 35–65.Gordon, Matthew & Ayla Applebaum. 2010. Acoustic correlates of stress in Turkish Kabardian. Journal
of the International Phonetic Association 40, 35–58.
Phonetics of Tongan stress 33
Gordon, Matthew & Peter Ladefoged. 2001. Phonation types: A cross-linguistic overview. Journal ofPhonetics 29, 383–406.
Gordon, Matthew & Latifa Nafi. 2012. Acoustic correlates of stress and pitch accent in Tashlhiyt Berber.Journal of Phonetics 40, 706–724.
Hanson, Helen M. 1997. Glottal characteristics of female speakers: Acoustic correlates. Journal of theAcoustical Society of America 101, 466–481.
Hillenbrand, James, Ronald A. Cleveland & Robert L. Erickson. 1994. Acoustic correlates of breathyvocal quality. Journal of Speech and Hearing Research 37, 769–778.
Iseli, Markus, Yen-Liang Shue & Abeer Alwan. 2007. Age, sex, and vowel dependencies of acousticalmeasures related to the voice source. Journal of the Acoustical Society of America 121, 2283–2295.
Johnson, Keith. 2003. Acoustic and auditory phonetics, 2nd edn. Oxford: Blackwell.Johnson, Keith, Edward Flemming & Richard Wright. 1993. The hyperspace effect: Phonetic targets are
hyperarticulated. Language 69, 505–528.Jun, Sun-Ah. 2005. Prosodic typology. In Sun-Ah, Jun (ed.), Prosodic typology: The phonology of
intonation and phrasing, 430–458. Oxford: Oxford University Press.Kawahara, Hideki, Ikuyo Masuda-Katsuse & Alain de Cheveign ⁄e. 1999. Restructuring speech
representations using a pitch adaptive time-frequency smoothing and an instantaneous-frequency-basedf0 extraction: Possible role of a repetitive structure in sounds. Speech Communication 27, 187–207.
Keating, Patricia, Christina Esposito, Marc Garellek, Sameer ud Dowla Khan & Jianjing Kuang. 2011.Phonation contrasts across languages. 17th International Congress of Phonetic Sciences (ICPhS XVII),Hong Kong, 1046–1049.
Klatt, Dennis & Laura Klatt. 1990. Analysis, synthesis, and perception of voice quality variations amongfemale and male talkers. Journal of the Acoustical Society of America 87, 820–857.
Kochanski, Greg, Esther Grabe, John Coleman & Burton Rosner. 2005. Loudness predicts prominence:Fundamental frequency lends little. Journal of the Acoustical Society of America 118, 1038–1054.
Kreiman, Jody & Bruce R. Gerratt. 2010. Perceptual sensitivity to first harmonic amplitude in the voicesource. Journal of the Acoustical Society of America 128, 2085–2089.
Kreiman, Jody, Bruce R. Gerratt & Sameer ud Dowla Khan. 2010. Effects of native language on perceptionof voice quality. Journal of Phonetics 38, 588–593.
Kuo, Grace & Chad Vicenik. 2012. The intonation of Tongan. UCLA Working Papers in Phonetics 111,63–91.
Lieberman, Philip. 1960. Some acoustic correlates of word stress in American English. Journal of theAcoustical Society of America 32, 451–454.
Lindblom, Bjorn. 1990. Explaining phonetic variation: A sketch of the H&H theory. InWilliam J. Hardcastle & Alain Marchal (eds.), Speech production and speech modeling, 403–439.Dordrecht: Kluwer.
Ortega-Llebaria, Marta & Pilar Prieto. 2011. Acoustic correlates of stress in Central Catalan and CastilianSpanish. Language and Speech 54, 73–97.
Plag, Ingo, Gero Kunter & Mareile Schramm. 2011. Acoustic correlates of primary and secondary stressin North American English. Journal of Phonetics 39, 362–374.
Poser, William J. 1985. Cliticization to NP and Lexical Phonology. In Jeffrey Goldberg, Susannah MacKaye& Michael Wescoat (eds.), West Coast Conference in Formal Linguistics 4 (WCCFL 4), 262–272.Stanford, CA: Stanford Linguistics Association & CSLI.
R Development Core Team. 2008. R: A language and environment for statistical computing. Vienna: RFoundation for Statistical Computing. http://www.R-project.org (14 January 2009).
Scarborough, Rebecca. 2007. The intonation of focus in Farsi. UCLA Working Papers in Phonetics 105,19–34.
Schutz, Albert J. 2001. Tongan accent. Oceanic Linguistics 40, 307–323.Shue, Yen-Liang, Patricia Keating, Chad Vicenik & Kristine Yu. 2011. VoiceSauce: A program for voice
analysis. 17th International Congress of Phonetic Sciences (ICPhS XVII), Hong Kong, 1846–1849.Simpson, Adrian P. 2012. The first and second harmonics should not be used to measure breathiness in
male and female voices. Journal of Phonetics 40, 477–490.
34 Marc Garellek & James White
Sjolander, Kare. 2004. The Snack Sound Toolkit [computer program], http://www.speech.kth.se/snack/(retrieved 25 May 2010).
Sluijter, Agaath M. C. & Vincent J. van Heuven. 1996. Spectral balance as an acoustic correlate of linguisticstress. Journal of the Acoustical Society of America 100, 2471–2485.
Taumoefolau, Melenaite. 2002. Stress in Tongan (MIT Working Papers in Linguistics 44). Cambridge,MA: MIT.
Turk, Alice E. & Stefanie Shattuck-Hufnagel. 2000. Word-boundary–related duration patterns in English.Journal of Phonetics 28, 397–440.
Zuraw, Kie, Kathleen O’Flynn & Kaeli Ward. 2010. Marginal prosodic contrasts in Tongan loans. Presentedat UCLA Phonology Seminar, 2 June 2010.
Related Documents