T OOLS OF PERSONALIZED MEDICINE 10.2217/17410541.2.3.239 © 2005 Future Medicine Ltd ISSN 1741-0541 Personalized Medicine (2005) 2(3), 239–249 239 Personalizing public health Theodore R Holford 1 , Andreas Windemuth 2 & Gualberto Ruaño 2† † Author for correspondence 1 Yale University School of Medicine, Division of Biostatistics, Department of Epidemiology and Public Health, New Haven, Connecticut, 06520, USA 2 Genomas, Inc., 67 Jefferson Street, Hartford, Connecticut, 06106, USA Tel.: +1 860 545 4574; E-mail: g.ruano @genomas.net Keywords: generalized linear models, linear logistic model, personalized health, physiogenomics, regression, statistical genetics Public health and medicine share a common objective of prolonging life. However, the means by which this can be attained have long repre- sented very different perspectives and strategies. Medicine has traditionally focused on treating patients who, by definition, are ill and in need of restoration to health, while public health seeks to reduce the number of individuals acquiring illness in the first place. Hence, medicine generally focuses on the needs of individuals in order to deliver the best treatment available to that person, taking into account their personal and clinical characteristics. On the other hand, public health focuses on the needs of the population as a whole, developing a health program that will serve the common good by reducing overall disease risk; with the understanding that a small minority may not realize the intended benefit. The two perspectives can be illustrated by the approaches for dealing with dental caries. A com- munity that adopts a public health approach to the problem might add fluoride to the water sup- ply, thus increasing the resistance of individuals to caries by making tooth enamel more resistant. Alternatively, the community may instead choose to provide its citizens with dental insurance, in which caries are treated once they develop. The former is certainly more cost effective from the perspective of the population, but the latter would avoid inducing any rare side effects that may result from the addition of something to the public water supply. Some individuals may have a gene or a lifestyle that makes them more resistant to the development of caries, so that they would person- ally receive little benefit from the addition of fluo- ride to the water, yet they may suffer some risk of harm from it. If it were possible to identify those individuals who would benefit most from a partic- ular form of treatment or disease prevention, then it may be possible to optimize the program as a whole, by avoiding side effects and increasing effi- ciency. In effect, this effort would bring together aspects of the medical and the public health per- spectives by personalizing the public health strate- gies, thus providing a method by which individuals can optimize their own health, and in the process benefit the population at large. In this report, the manner in which data from a variety of sources can be used to arrive at statistical models that may be used in prediction is consid- ered. First, the study designs that are employed, in addition to the behavior of the variables, are desci- bed. In addition, the basic structure of a general- ized linear model, indicating how this can be adapted in order to cover a wide variety of different types of data, is set out. These require specific ways for dealing with measurement types when the fac- tor is a response and when it is a predictor. Some of the issues involved in selecting prediction models and assessing their adequacy are also discussed. Cause versus prediction in genomics The issue of causal inference involves some of the deepest concepts in the philosophy of science, and it is arguable whether a strict adherence to causal reasoning can ever be fully realized in health sci- ence. Knowledge that a particular genetic poly- morphism will produce a given effect on the outcome may be very difficult, especially in light of the fact that most biochemical reactions have mul- tiple steps involving different proteins, each one of which can have their own effect on the phenotypic result for the individual. A somewhat lower stand- ard would be to determine whether a particular polymorphism was associated with the outcome, a relationship that may or may not be causal. The ultimate goal of science is to understand causal mechanisms that underlie physiological processes, thus providing an approach for pre- dicting outcome. However, this may be difficult when the development of knowledge is at an early stage, so that a more pragmatic approach would be to learn about associations that exist between individual characteristics and the out- come of interest. This would allow us to improve our prediction of the response by incorporating information that is related to the outcome. How- ever, when we cannot be certain that the associa- tions are causal, we must maintain a level of caution in using the predictions. These limita- tions that exist in a prediction model could be summarized to users by carefully specifying the level of error present in the estimates provided by the prediction model.

Welcome message from author
This document is posted to help you gain knowledge. Please leave a comment to let me know what you think about it! Share it to your friends and learn new things together.
Transcript
TOOLS OF PERSONALIZED MEDICINE
Personalizing public health
Theodore R Holford1, Andreas Windemuth2 & Gualberto Ruaño2††Author for correspondence1Yale University School of Medicine,Division of Biostatistics, Department of Epidemiology and Public Health,New Haven, Connecticut, 06520, USA2Genomas, Inc., 67 Jefferson Street, Hartford, Connecticut, 06106, USATel.: +1 860 545 4574;E-mail: [email protected]
Keywords: generalized linear models, linear logistic model, personalized health, physiogenomics, regression, statistical genetics
10.2217/17410541.2.3.239 ©
Public health and medicine share a commonobjective of prolonging life. However, the meansby which this can be attained have long repre-sented very different perspectives and strategies.Medicine has traditionally focused on treatingpatients who, by definition, are ill and in need ofrestoration to health, while public health seeks toreduce the number of individuals acquiring illnessin the first place. Hence, medicine generallyfocuses on the needs of individuals in order todeliver the best treatment available to that person,taking into account their personal and clinicalcharacteristics. On the other hand, public healthfocuses on the needs of the population as a whole,developing a health program that will serve thecommon good by reducing overall disease risk;with the understanding that a small minority maynot realize the intended benefit.
The two perspectives can be illustrated by theapproaches for dealing with dental caries. A com-munity that adopts a public health approach tothe problem might add fluoride to the water sup-ply, thus increasing the resistance of individuals tocaries by making tooth enamel more resistant.Alternatively, the community may instead chooseto provide its citizens with dental insurance, inwhich caries are treated once they develop. Theformer is certainly more cost effective from theperspective of the population, but the latter wouldavoid inducing any rare side effects that may resultfrom the addition of something to the publicwater supply. Some individuals may have a geneor a lifestyle that makes them more resistant to thedevelopment of caries, so that they would person-ally receive little benefit from the addition of fluo-ride to the water, yet they may suffer some risk ofharm from it. If it were possible to identify thoseindividuals who would benefit most from a partic-ular form of treatment or disease prevention, thenit may be possible to optimize the program as awhole, by avoiding side effects and increasing effi-ciency. In effect, this effort would bring togetheraspects of the medical and the public health per-spectives by personalizing the public health strate-gies, thus providing a method by whichindividuals can optimize their own health, and inthe process benefit the population at large.
In this report, the manner in which data from avariety of sources can be used to arrive at statisticalmodels that may be used in prediction is consid-ered. First, the study designs that are employed, inaddition to the behavior of the variables, are desci-bed. In addition, the basic structure of a general-ized linear model, indicating how this can beadapted in order to cover a wide variety of differenttypes of data, is set out. These require specific waysfor dealing with measurement types when the fac-tor is a response and when it is a predictor. Some ofthe issues involved in selecting prediction modelsand assessing their adequacy are also discussed.
Cause versus prediction in genomicsThe issue of causal inference involves some of thedeepest concepts in the philosophy of science, andit is arguable whether a strict adherence to causalreasoning can ever be fully realized in health sci-ence. Knowledge that a particular genetic poly-morphism will produce a given effect on theoutcome may be very difficult, especially in light ofthe fact that most biochemical reactions have mul-tiple steps involving different proteins, each one ofwhich can have their own effect on the phenotypicresult for the individual. A somewhat lower stand-ard would be to determine whether a particularpolymorphism was associated with the outcome, arelationship that may or may not be causal.
The ultimate goal of science is to understandcausal mechanisms that underlie physiologicalprocesses, thus providing an approach for pre-dicting outcome. However, this may be difficultwhen the development of knowledge is at anearly stage, so that a more pragmatic approachwould be to learn about associations that existbetween individual characteristics and the out-come of interest. This would allow us to improveour prediction of the response by incorporatinginformation that is related to the outcome. How-ever, when we cannot be certain that the associa-tions are causal, we must maintain a level ofcaution in using the predictions. These limita-tions that exist in a prediction model could besummarized to users by carefully specifying thelevel of error present in the estimates provided bythe prediction model.
2005 Future Medicine Ltd ISSN 1741-0541 Personalized Medicine (2005) 2(3), 239–249 239
TOOLS OF PERSONALIZED MEDICINE – Holford, Windemuth & Ruaño
240
Causal inference in genomicsCausal inference requires that we have knowl-edge regarding the underlying biology of aphysiological process that is affecting an out-come, so that we can specify quantitatively themanner in which an individual’s physiologymight behave under a specified set of circum-stances. Understanding the process may notinclude information about the magnitude ofvarious rates of reaction, or the manner inwhich the effect takes place, so that statisticalinference amounts to the development of esti-mates of unknown quantities and assessing themode of action by determining the agreementbetween observed values and levels predicted bya model. In the case of genomic information,the factor level would require the identificationof a particular gene that may be recognized bydetecting the number of copies of a known sin-gle nucleotide polymorphism (SNP). The iden-tification of causal SNPs, and the mechanismsby which they act, are ideal for predicting anoutcome, and these should be used wheneveravailable. When specific polymorphisms thatcause disease are known, the magnitude of theirassociation with the response is huge and highlypredictive for an individual who harbors it (forexample, the effect of BRCA1 and BRCA2 onbreast cancer risk [1,2]). By the same token, theprocess required to find these polymorphismscan take considerable time. However, this proc-ess continues to improve, as in the case of theelegant work used to discover the gene causingmacular degeneration [3].
Prediction of health outcomesStatistical models that can be used to predicthealth outcomes would make use of demo-graphic, clinical and genomic information, inorder to arrive at a model that predicts the out-come. The goal is not necessarily to discoverclinical variables and alleles that cause an effect,but to make use of the associations that exist. Inthis sense, the aims are somewhat differentfrom those in a strictly scientific endeavor thatseeks to understand modes of action, butinstead adopts a more pragmatic approach ofdeveloping methodology that provides predic-tions that have sufficient accuracy to be of prac-tical use to clinicians and healthcare providers.The outcomes may be qualitative, as in the caseof binary indicators of disease status, or contin-uous indicators such as body mass index (BMI),blood sugar or cholesterol. While there areaspects of the process that will need to be
modified in order to arrive at assumptions thatagree with the data, the approaches are similar,in that they can be dealt with by using the con-cepts underlying generalized linear models forthe analysis of health data.
Data sourcesStudy designsControlled experimentsA controlled experiment is a carefully con-structed study in which the groups being com-pared only differ from each other by the factorunder study. In that sense, the intent is to mimica laboratory experiment, in which the carefulscientist can exercise considerable control overthe experimental units so that they are all han-dled in the same way, except for the factor ortreatment of interest. In population studies, therandomized control trial is the most commonlyused design for this type of study, in which thegroups to be compared are made comparablethrough random assignment of subjects to thegroups in question. In this case, the rules ofchance make it possible to achieve comparabil-ity, although there is always the prospect thatthe luck of the draw may turn out to be unfavo-rable in terms of balance. Hence, the underlyingapproach may be augmented by adopting alter-native strategies that force balance among thegroups to be compared, especially for factorsthat are known to be strongly related to the out-come. A considerable effort is required tolaunch a controlled experiment, including therecruitment of subjects and physicians who arewilling to meet the requirements of randomassignment. If the outcome is the occurrence ofa relatively rare event, such as the developmentof a disease or syndrome, then the sample sizerequired for valid inferences could be large andthe follow-up time lengthy, thus further increas-ing the cost of the study. In general, these stud-ies, although extremely valuable because of theirvalidity if carefully conducted, can be extremelycostly. Thus, they are often not the firstapproach used to look at a particular associa-tion, but are instead used as a final justificationfor a particular treatment strategy.
Observational studiesAn observational study involves the assessmentof associations discovered in subjects who havebeen recruited for a particular project. In someinstances, the subjects are selected as represent-atives of the population at large. This is some-times referred to as a cross-sectional study. In
Personalized Medicine (2005) 2(3)
www.futuremedicine.com
Personalizing public health – TOOLS OF PERSONALIZED MEDICINE
other instances the subjects are recruited as rep-resentatives of particular groups, and then fol-lowed to determine their clinical course – acohort study. Alternatively, subjects with a par-ticular disease and an appropriate control groupmay be recruited and their past clinical historyor exposure gleaned through the use of inter-views or chart reviews, which are known ascase–control studies. The disadvantage inobservational studies is that the carefully struc-tured study design provided by a controlledexperiment no longer applies. Nevertheless, theimportance of avoiding the bias that can arisewhen groups are not comparable remains asimportant as ever. Therefore, there is considera-ble effort to control for imbalances by employ-ing statistical models that make use of variablesthat may be confounding an estimated associa-tion. Typically, these are variables that have animbalanced distribution in the groups beingcompared, and they are associated with theresponse of interest.
Types of predicted outcomesThe goal of prediction modeling is to develop amathematical expression that may be used topredict or estimate the unobserved outcome inan individual based on an observed set of predic-tor variables. The outcome or response (some-times called the dependent variable) may be:
Continuous measure
• Body mass• High-density lipoprotein cholesterol• Low-density lipoprotein cholesterol• Blood pressure
Binary
• Obese (yes/no)• Neuralgia (yes/no)• Hypertension (yes/no)
Ordered polychotomous
• Obesity (normal/overweight/obese/morbidlyobese)
• Muscular pain (none/mild/moderate/severe)
Nominal (not ordered) polychotomous
• Organ system affected (respiratory, digestive,circulatory, neurological)
Regressor variables (sometimes called inde-pendent variables) are used in the prediction
equation, and these may be similarly classified ascontinuous, binary or polychotomous. For a pre-diction model, the regressor variables comprisethe information that is to be used to predict theresponse, and in a physiogenomic model, thesewould include a mixture of demographic, physi-ologic and clinical data, along with informationon the genotype for the individual.
Generalized linear models provide anextremely powerful framework for developingstatistical models that may be used for any ofthese types of outcomes. The mathematicalexpression, or model, that relates the outcome,Y, to a set of regressor variables,
is given by:
where µ(X) is the systematic part of the equationwhich describes the manner in which the regres-sor variables affect the average level of the out-come, , and is the unexplainedor random part of the model. Properties of agood model are:
Accurate representation of the systematic component of the model, µ(X)
• Correct form for the equation• Include all relevant regressor variables• Preferably do not include unimportant varia-
bles, i.e., parsimony
Appropriate characterization of random error, ε• Zero on average, indicating model and data
are not biased• Probability distribution is appropriately char-
acterized- Continuous – normal or Gaussian, γ- Binary – binomial- Counts – Poisson or negative binomial
• Variance is small – precision is great
In a linear model [4], the systematic componentis comprised of the sum of each regressor variablemultiplied by a regression parameter that is usu-ally not known, but estimated from the data, i.e.,
Models of this form are the standard regressionmodel. The error term, ε, is assumed to be nor-mal with a mean of zero and unspecified vari-ance, which is a constant that does not dependon the mean. However, a generalization in whicha model has this form after taking a specifiedtransformation of the mean greatly enhances
X X( 1 X2 … Xp ), , ,=
Y µ X( ) ε+=
µ X( ) E Y X[ ]= ε
µ X( ) β0 X1β1 X2β2 … Xpβp+ + + +=
241
TOOLS OF PERSONALIZED MEDICINE – Holford, Windemuth & Ruaño
242
ones ability to consider different types of data, i.e.,a model of the form:
The term is called the linear predictor, andthe function, h(.), which transforms the meaninto the linear part of the model, is called thelink function [5].
As an example, consider a binary response,Y = 0 or 1, for which the linear logistic model iscommonly used [6]. On average, the response takesthe value of the probability of observing a one,and for the commonly used linear logistic model,this is expressed as:
Notice that the model contains a part that has thefamiliar mathematic form used in standard regres-sion, i.e., the sum of products of regressor varia-bles and regression coefficients. To obtain anexpression that only has that form, one would usea logit link function to transform the mean intothe linear predictor [5,7]:
Clinical predictorsDemographic and personal characteristicsThe most commonly-used demographic charac-teristics are age, gender and ethnicity. Agingclearly affects the clinical course of most diseases,as gender also does, perhaps due to the hormonaland physiological differences between men andwomen. Ethnic differences in disease risk may, inpart, reflect genetic variation, but they could alsobe the result of diet and other practices that influ-ence the prognosis of individuals in these groups.Other social and economic characteristics of indi-viduals can influence personal health, eitherthrough knowledge or resources that empowerthem to take control of factors that affect diseaserisk. In developing a model that can be used topredict or to characterize a likely course of symp-tomatology, the effect of each of these factorsneeds to be explored.
Clinical measurementsIn the interest of planning for the health needs ofindividual patients, it is important to includeinformation on the status of clinical symptoms atbaseline, or even before if the information is avail-able. In some instances, the baseline data mayconsist of information on levels prior to the treat-ment regimen. For example, BMI at baseline islikely to be strongly related to BMI 6 months
later, so it would clearly be relevant to include thisinformation in a prediction model. In addition,blood sugar, insulin level or other measures atbaseline that might be related to an individual’smetabolic rate could add information to the pre-diction. Perhaps not as obvious would be theproblem of making sense of the effect of baselineBMI on temporal changes. An individual with ahigh BMI may find it easier or harder to loseweight, but an analysis that suggests that higherbaseline levels are associated with greater weightloss may not be an indication of a greater ability tolose weight as BMI increases. It could actually bedue, in part, to regression to the mean, whichresults in patients with extreme levels of any varia-ble tending to have subsequent values that arecloser to the average. Nevertheless, for the purposeof obtaining a predicted value for a future level ofBMI, this distinction may not be important,because the objective is to obtain a good predic-tion model, which is not necessarily the same asidentifying causal relationships.
Coding categorical predictorsFor a binary variable there is no difference analyti-cally between a comparison of two nominal levels(presence vs absence of a factor) and two ordinallevels (high vs low). In each case, a single parame-ter provides a measure of comparison, for exam-ple, the difference in the outcome when the factoris present and absent, or the difference between ahigh and low level of the factor. One convenientway to specify such a comparison in a regressionmodel is to introduce a dummy variable that takesthe value of 1 when the factor is present or highand 0 otherwise. In this case, the mean levels ofthe response for the two groups are:
for X = 0, the reference level and
for X = 1, the comparison level. Notice that theparameter represents the difference in the linearpredictors for the two levels of the factor,
.For a categorical variable with more than two
levels, one must first consider whether one is deal-ing with nominal categories, in which there is noparticular form for the relationship, or ordered cat-egories, which would enable one to capitalize onthe relationship among the levels. Extending theapproach used for two categorical levels, one canintroduce additional dummy variables which takethe value 1 for the comparison level of interest, and
η X( ) h µ X( )[ ] β0 X1β1 X2β2 … Xpβp+ + + += =
η X( )
Pr Y X{ } µ X( ) eβ0 X1β1 … Xpβp+ + +
1 eβ0 X1β1 … XpBp+ + +
+-----------------------------------------------------= =
logit[µ X( ) ] log µ X( )1 µ X( )–--------------------- β0 X1β1 … Xpβp+ + += =
η 0( ) β0 0 β1⋅+ β0= =
η 1( ) β0 1 β1⋅+ β0 β1+= =
∆η η 1( ) n 0( )–=
Personalized Medicine (2005) 2(3)
www.futuremedicine.com
Personalizing public health – TOOLS OF PERSONALIZED MEDICINE
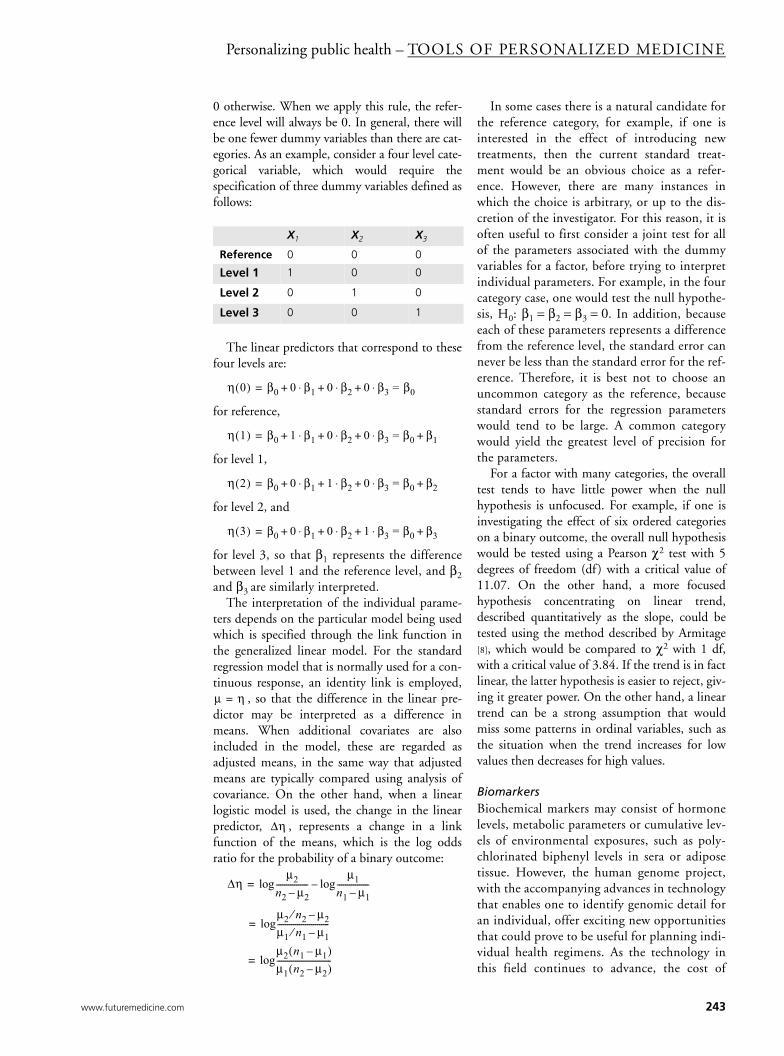
0 otherwise. When we apply this rule, the refer-ence level will always be 0. In general, there willbe one fewer dummy variables than there are cat-egories. As an example, consider a four level cate-gorical variable, which would require thespecification of three dummy variables defined asfollows:
The linear predictors that correspond to thesefour levels are:
for reference,
for level 1,
for level 2, and
for level 3, so that β1 represents the differencebetween level 1 and the reference level, and β2and β3 are similarly interpreted.
The interpretation of the individual parame-ters depends on the particular model being usedwhich is specified through the link function inthe generalized linear model. For the standardregression model that is normally used for a con-tinuous response, an identity link is employed,
, so that the difference in the linear pre-dictor may be interpreted as a difference inmeans. When additional covariates are alsoincluded in the model, these are regarded asadjusted means, in the same way that adjustedmeans are typically compared using analysis ofcovariance. On the other hand, when a linearlogistic model is used, the change in the linearpredictor, , represents a change in a linkfunction of the means, which is the log oddsratio for the probability of a binary outcome:
In some cases there is a natural candidate forthe reference category, for example, if one isinterested in the effect of introducing newtreatments, then the current standard treat-ment would be an obvious choice as a refer-ence. However, there are many instances inwhich the choice is arbitrary, or up to the dis-cretion of the investigator. For this reason, it isoften useful to first consider a joint test for allof the parameters associated with the dummyvariables for a factor, before trying to interpretindividual parameters. For example, in the fourcategory case, one would test the null hypothe-sis, H0: β1 = β2 = β3 = 0. In addition, becauseeach of these parameters represents a differencefrom the reference level, the standard error cannever be less than the standard error for the ref-erence. Therefore, it is best not to choose anuncommon category as the reference, becausestandard errors for the regression parameterswould tend to be large. A common categorywould yield the greatest level of precision forthe parameters.
For a factor with many categories, the overalltest tends to have little power when the nullhypothesis is unfocused. For example, if one isinvestigating the effect of six ordered categorieson a binary outcome, the overall null hypothesiswould be tested using a Pearson χ2 test with 5degrees of freedom (df ) with a critical value of11.07. On the other hand, a more focusedhypothesis concentrating on linear trend,described quantitatively as the slope, could betested using the method described by Armitage[8], which would be compared to χ2 with 1 df,with a critical value of 3.84. If the trend is in factlinear, the latter hypothesis is easier to reject, giv-ing it greater power. On the other hand, a lineartrend can be a strong assumption that wouldmiss some patterns in ordinal variables, such asthe situation when the trend increases for lowvalues then decreases for high values.
BiomarkersBiochemical markers may consist of hormonelevels, metabolic parameters or cumulative lev-els of environmental exposures, such as poly-chlorinated biphenyl levels in sera or adiposetissue. However, the human genome project,with the accompanying advances in technologythat enables one to identify genomic detail foran individual, offer exciting new opportunitiesthat could prove to be useful for planning indi-vidual health regimens. As the technology inthis field continues to advance, the cost of
X1 X2 X3
Reference 0 0 0
Level 1 1 0 0
Level 2 0 1 0
Level 3 0 0 1
η 0( ) β0 0 β1 0 β2 0 β3 = β0⋅+⋅+⋅+=
η 1( ) β0 1 β1 0 β2 0 β3 = β0 β1+⋅+⋅+⋅+=
η 2( ) β0 0 β1 1 β2 0 β3 = β0 β2+⋅+⋅+⋅+=
η 3( ) β0 0 β1 0 β2 1 β3 = β0 β3+⋅+⋅+⋅+=
µ η=
∆η
∆ηµ2
n2 µ2–----------------
µ1n1 µ1–----------------log–log=
µ2 n2 µ2–⁄µ1 n1 µ1–⁄--------------------------log=
µ2 n1 µ1–( )µ1 n2 µ2–( )---------------------------log=
243
TOOLS OF PERSONALIZED MEDICINE – Holford, Windemuth & Ruaño
244
identifying large numbers of genetic markersbecome more feasible. An important questionis how best to use this information for the goodof an individual’s health.
Genomic dataThe contribution of genes to disorders, such asHuntington’s disease or Down’s syndrome, haslong been recognized. However, with theincreased power provided by new genomictechnologies, one is able to identify specificgene polymorphisms that are associated withdiseases such as breast cancer [1] and maculardegeneration [3]. Cellular decoding of DNAresults in the construction of proteins, so thatvariations in genetic expression can ultimatelylead to defective proteins that may, in turn,affect disease risk. Not all variants in thegenetic code may affect disease risk, so it is notalways clear which variants in genetic expres-sion are important identifiers for disease risk.In some instances, a measure of the extent ofthe match for a particular portion of a gene isused as the measure of interest. Alternatively,libraries of specific SNPs are being con-structed for use as specific genetic markers.Ideally, the SNPs will identify critical changesthat result in clinically important changes inprotein structure, and knowledge continues togrow as more information is gleaned about theimportant variants in the genetic sequence andthe effects these may have.
Tissue samples can provide information onthe number of copies of particular allelesthrough the identification of SNPs. Currenttechnological advances in highly parallel geno-typing can provide such information on hun-dreds of alleles at relatively low cost. Theimportance of this capability in personalizedpublic health is the valuable new informationprovided to an individual and his/her healthcareprovider. With respect to a prediction model,SNPs provide the number of copies of a particu-lar allele that is an ordinal categorical variable.This could be parameterized as any other cate-gorical predictor, but the mode of action sug-gests particular approaches that would be
motivated by the underlying biology, which arediscussed below.
Proteomic dataWhile DNA provides the necessary code neededto order the amino acids in a protein, some vari-ants in this order will have little effect on func-tionality in a biochemical reaction. Thus, theanalysis of protein structure or proteomics offersa more direct measurement of an enzyme thatmay actually be involved in a relevant biochemi-cal reaction for a particular health outcome. Atthis stage, this technology is still being rapidlydeveloped. However, from the perspective of thestatistical analysis, the issues are very similar tothose that arise in the analysis of genomic data,which are discussed in further detail below.
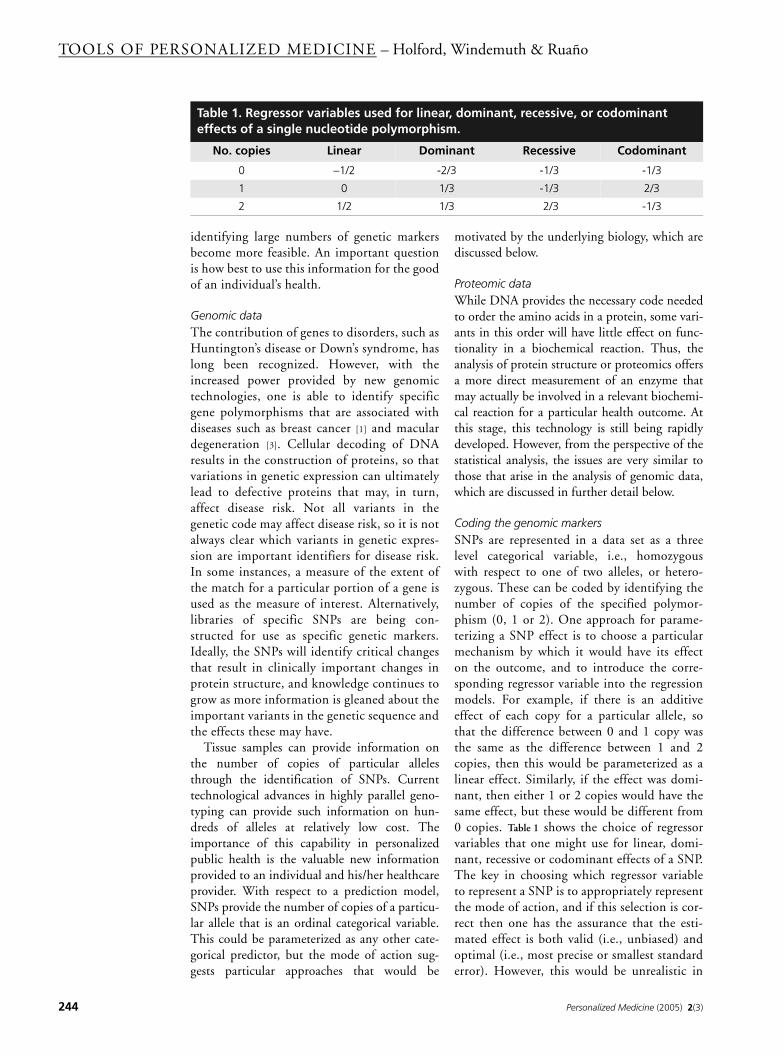
Coding the genomic markersSNPs are represented in a data set as a threelevel categorical variable, i.e., homozygouswith respect to one of two alleles, or hetero-zygous. These can be coded by identifying thenumber of copies of the specified polymor-phism (0, 1 or 2). One approach for parame-terizing a SNP effect is to choose a particularmechanism by which it would have its effecton the outcome, and to introduce the corre-sponding regressor variable into the regressionmodels. For example, if there is an additiveeffect of each copy for a particular allele, sothat the difference between 0 and 1 copy wasthe same as the difference between 1 and 2copies, then this would be parameterized as alinear effect. Similarly, if the effect was domi-nant, then either 1 or 2 copies would have thesame effect, but these would be different from0 copies. Table 1 shows the choice of regressorvariables that one might use for linear, domi-nant, recessive or codominant effects of a SNP.The key in choosing which regressor variableto represent a SNP is to appropriately representthe mode of action, and if this selection is cor-rect then one has the assurance that the esti-mated effect is both valid (i.e., unbiased) andoptimal (i.e., most precise or smallest standarderror). However, this would be unrealistic in
Table 1. Regressor variables used for linear, dominant, recessive, or codominant effects of a single nucleotide polymorphism.
No. copies Linear Dominant Recessive Codominant
0 −1/2 -2/3 -1/3 -1/3
1 0 1/3 -1/3 2/3
2 1/2 1/3 2/3 -1/3
Personalized Medicine (2005) 2(3)
www.futuremedicine.com
Personalizing public health – TOOLS OF PERSONALIZED MEDICINE
Table 2. Linear andparameters for line
No. X
0 -1
1 0
2 -1
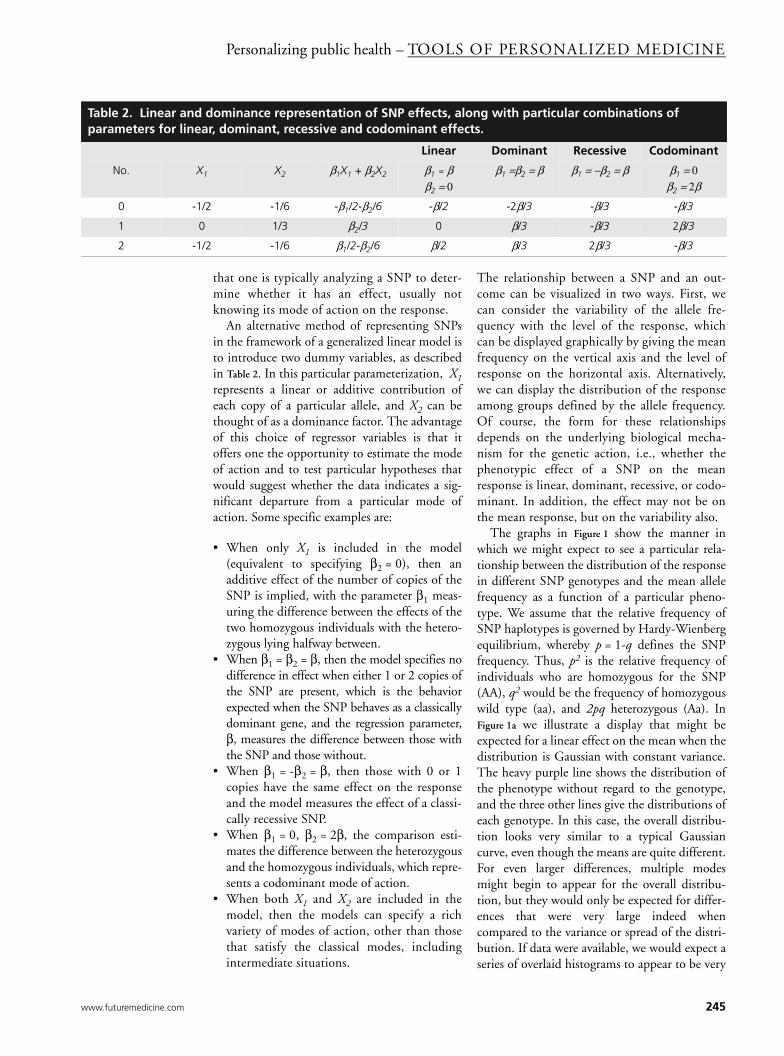
that one is typically analyzing a SNP to deter-mine whether it has an effect, usually notknowing its mode of action on the response.
An alternative method of representing SNPsin the framework of a generalized linear model isto introduce two dummy variables, as describedin Table 2. In this particular parameterization, X1represents a linear or additive contribution ofeach copy of a particular allele, and X2 can bethought of as a dominance factor. The advantageof this choice of regressor variables is that itoffers one the opportunity to estimate the modeof action and to test particular hypotheses thatwould suggest whether the data indicates a sig-nificant departure from a particular mode ofaction. Some specific examples are:
• When only X1 is included in the model(equivalent to specifying β2 = 0), then anadditive effect of the number of copies of theSNP is implied, with the parameter β1 meas-uring the difference between the effects of thetwo homozygous individuals with the hetero-zygous lying halfway between.
• When β1 = β2 = β, then the model specifies nodifference in effect when either 1 or 2 copies ofthe SNP are present, which is the behaviorexpected when the SNP behaves as a classicallydominant gene, and the regression parameter,β, measures the difference between those withthe SNP and those without.
• When β1 = -β2 = β, then those with 0 or 1copies have the same effect on the responseand the model measures the effect of a classi-cally recessive SNP.
• When β1 = 0, β2 = 2β, the comparison esti-mates the difference between the heterozygousand the homozygous individuals, which repre-sents a codominant mode of action.
• When both X1 and X2 are included in themodel, then the models can specify a richvariety of modes of action, other than thosethat satisfy the classical modes, includingintermediate situations.
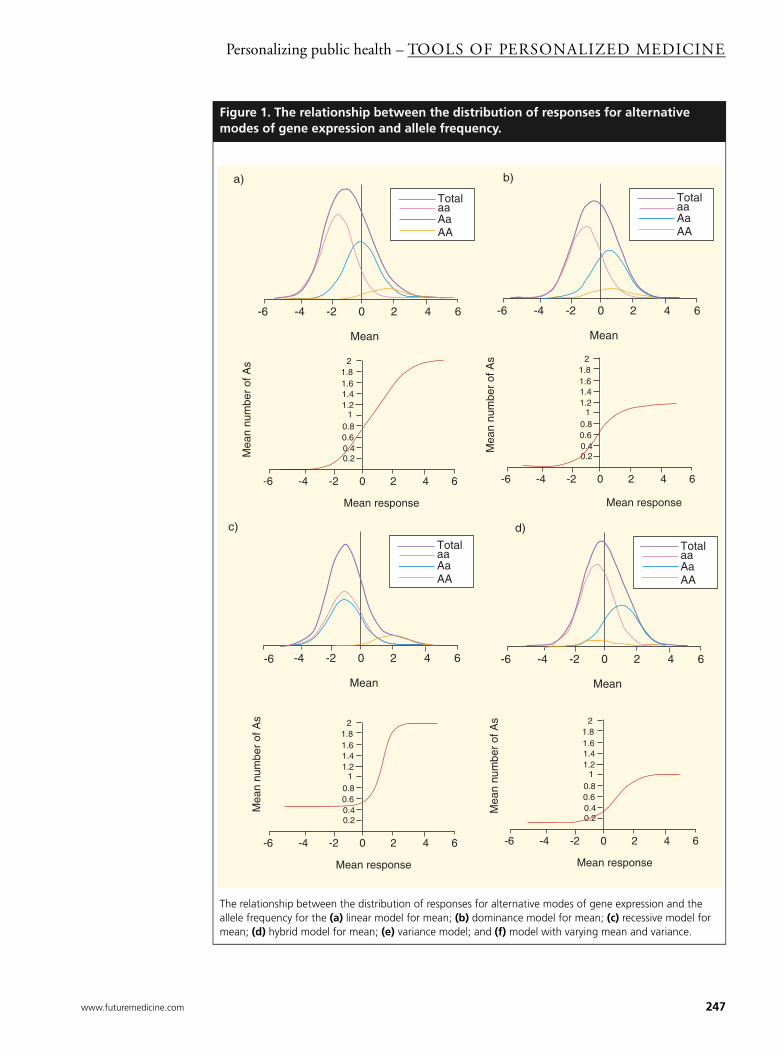
The relationship between a SNP and an out-come can be visualized in two ways. First, wecan consider the variability of the allele fre-quency with the level of the response, whichcan be displayed graphically by giving the meanfrequency on the vertical axis and the level ofresponse on the horizontal axis. Alternatively,we can display the distribution of the responseamong groups defined by the allele frequency.Of course, the form for these relationshipsdepends on the underlying biological mecha-nism for the genetic action, i.e., whether thephenotypic effect of a SNP on the meanresponse is linear, dominant, recessive, or codo-minant. In addition, the effect may not be onthe mean response, but on the variability also.
The graphs in Figure 1 show the manner inwhich we might expect to see a particular rela-tionship between the distribution of the responsein different SNP genotypes and the mean allelefrequency as a function of a particular pheno-type. We assume that the relative frequency ofSNP haplotypes is governed by Hardy-Wienbergequilibrium, whereby p = 1-q defines the SNPfrequency. Thus, p2 is the relative frequency ofindividuals who are homozygous for the SNP(AA), q2 would be the frequency of homozygouswild type (aa), and 2pq heterozygous (Aa). InFigure 1a we illustrate a display that might beexpected for a linear effect on the mean when thedistribution is Gaussian with constant variance.The heavy purple line shows the distribution ofthe phenotype without regard to the genotype,and the three other lines give the distributions ofeach genotype. In this case, the overall distribu-tion looks very similar to a typical Gaussiancurve, even though the means are quite different.For even larger differences, multiple modesmight begin to appear for the overall distribu-tion, but they would only be expected for differ-ences that were very large indeed whencompared to the variance or spread of the distri-bution. If data were available, we would expect aseries of overlaid histograms to appear to be very
dominance representation of SNP effects, along with particular combinations of ar, dominant, recessive and codominant effects.
Linear Dominant Recessive Codominant
1 X2 β1X1 + β2X2 β1 = ββ2 = 0
β1 =β2 = β β1 = −β2 = β β1 = 0β2 = 2β
/2 -1/6 -β1/2-β2/6 -β/2 -2β/3 -β/3 -β/3
1/3 β2/3 0 β/3 -β/3 2β/3
/2 -1/6 β1/2-β2/6 β/2 β/3 2β/3 -β/3
245
TOOLS OF PERSONALIZED MEDICINE – Holford, Windemuth & Ruaño
246
similar to the distributions shown in the graph.Notice that in this hypothetical example, themean responses progress in equal increments, sothat the difference in the mean for 1 and 0 copiesof an allele is equal to the difference between 2and 1. If we were to interchange the axes, dis-playing the mean number of alleles as a functionof the phenotypic response, we would expect therelationship to be that shown in the correspond-ing sigmoid curve. Notice that for low values ofthe response, the mean frequency is close to 0,indicating that these individuals are primarilyhomozygous aa. Gradually this begins toincrease, and for intermediate values the rela-tionship is almost linear in this instance. Finally,the curve approaches an asymptote of 2, whichcorresponds to homozygous AA.
Figure 1b shows a similar pair of graphs for ahypothetical gene with a dominant expressionon the genotype. In this case, the meanresponse for Aa and AA would be the same,with a higher mean response than aa in thishypothetical example. The relationshipbetween the mean number of alleles as a func-tion of the phenotypic response is once again asigmoid curve, starting near zero, indicatingthat these individuals are primarily aa. How-ever, the curve then gradually increases and,ultimately, approaches an asymptote, which
lies between 1 and 2, the actual value being aweighted average depending on the relativefrequency of Aa and AA.
A recessive SNP would be expected to behaveas shown in Figure 1c, which would be identical tothe case where a SNP is dominant. The graphshowing the sigmoid relationship between themean number of alleles and the phenotype nowstarts between 0 and 1, a weighted averagedepending on the relative frequency of aa andAa, and approaches the asymptote of 2.
In the rare event of a codominant effect on thephenotype, the mean for the homozygous indi-viduals would be the same, in this case lowerthan the heterozygous, Aa. The relationshipbetween the genotype and the mean allele fre-quency is once again a sigmoid curve starting atthe weighted average of 0 and 2, depending onthe relative frequency of aa and Aa, andapproaching an asymptote of 1. In this examplethe sigmoid curve is increasing because allele A isless common than a. If the converse were truethe curve would be decreasing.
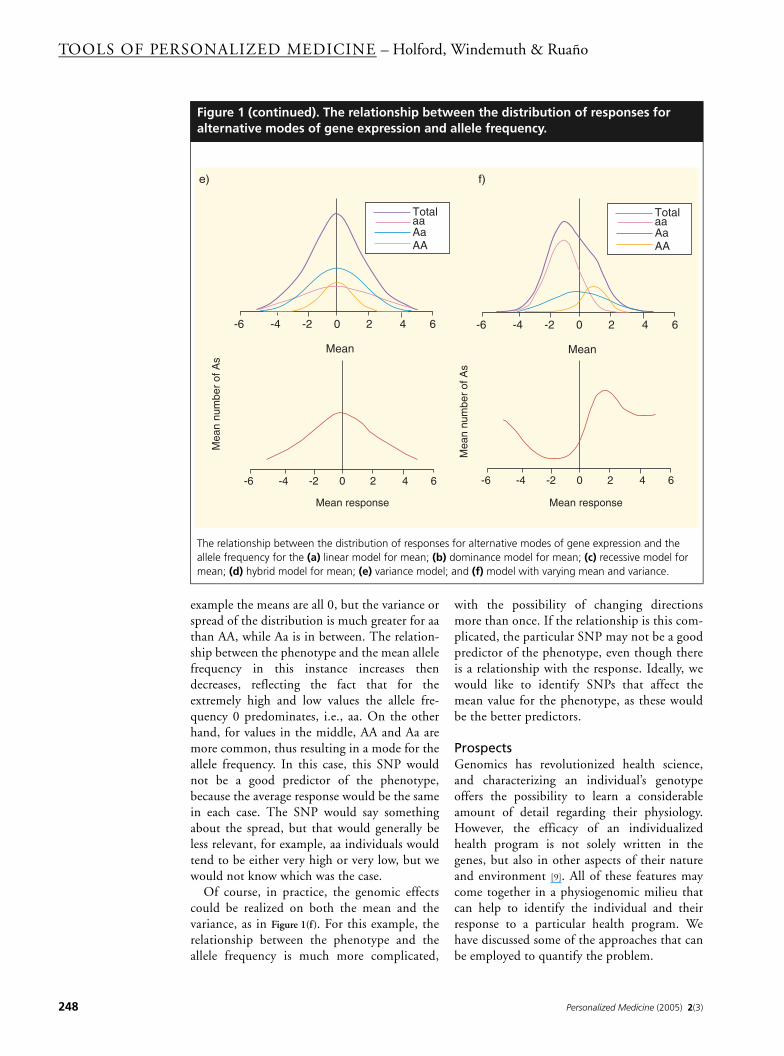
For each of the examples considered thus far,we have assumed that the effect of the SNP ison the mean. However, in principle it couldaffect any property of the distribution. Supposethat the variance were affected, and not themean, a case illustrated in Figure 1e. For this
Highlights
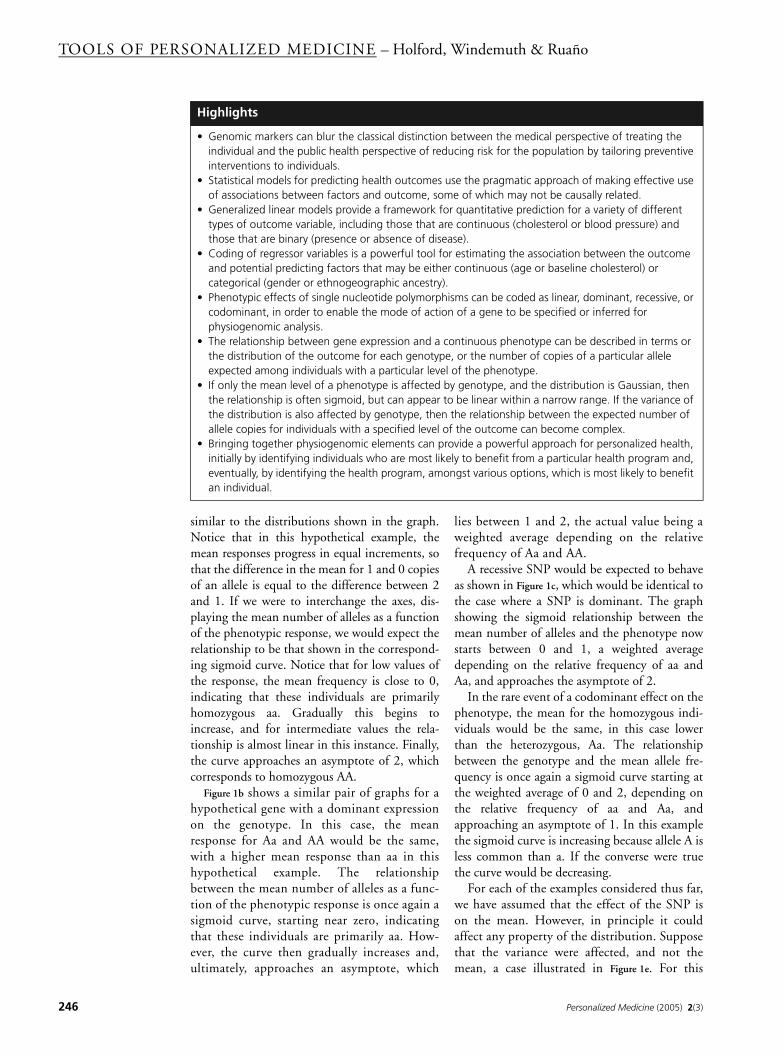
• Genomic markers can blur the classical distinction between the medical perspective of treating the individual and the public health perspective of reducing risk for the population by tailoring preventive interventions to individuals.
• Statistical models for predicting health outcomes use the pragmatic approach of making effective use of associations between factors and outcome, some of which may not be causally related.
• Generalized linear models provide a framework for quantitative prediction for a variety of different types of outcome variable, including those that are continuous (cholesterol or blood pressure) and those that are binary (presence or absence of disease).
• Coding of regressor variables is a powerful tool for estimating the association between the outcome and potential predicting factors that may be either continuous (age or baseline cholesterol) or categorical (gender or ethnogeographic ancestry).
• Phenotypic effects of single nucleotide polymorphisms can be coded as linear, dominant, recessive, or codominant, in order to enable the mode of action of a gene to be specified or inferred for physiogenomic analysis.
• The relationship between gene expression and a continuous phenotype can be described in terms or the distribution of the outcome for each genotype, or the number of copies of a particular allele expected among individuals with a particular level of the phenotype.
• If only the mean level of a phenotype is affected by genotype, and the distribution is Gaussian, then the relationship is often sigmoid, but can appear to be linear within a narrow range. If the variance of the distribution is also affected by genotype, then the relationship between the expected number of allele copies for individuals with a specified level of the outcome can become complex.
• Bringing together physiogenomic elements can provide a powerful approach for personalized health, initially by identifying individuals who are most likely to benefit from a particular health program and, eventually, by identifying the health program, amongst various options, which is most likely to benefit an individual.
Personalized Medicine (2005) 2(3)
www.futuremedicine.com
Personalizing public health – TOOLS OF PERSONALIZED MEDICINE
Figure 1. The relationship between the distribution of responses for alternative modes of gene expression and allele frequency.
The relationship between the distribution of responses for alternative modes of gene expression and the allele frequency for the (a) linear model for mean; (b) dominance model for mean; (c) recessive model for mean; (d) hybrid model for mean; (e) variance model; and (f) model with varying mean and variance.
-6 -4 -2 0 2 4 6
Mean
TotalaaAaAA
-6 -4 -2 0 2 4 6
Mean
TotalaaAaAA
-6 -4 -2 0 2 4 6
0.20.40.60.8
11.21.41.61.8
2
Mean responseM
ean
num
ber
of A
s
-6 -4 -2 0 2 4 6
Mean
TotalaaAaAA
-6 -4 -2 0 2 4 6
Mean
TotalaaAaAA
a) b)
-6 -4 -2 0 2 4 6
0.20.40.60.8
11.21.41.61.8
2
Mean response
Mea
n nu
mbe
r of
As
c) d)
-6 -4 -2 0 2 4 6
0.20.40.60.8
11.21.41.61.8
2
Mean response
Mea
n nu
mbe
r of
As
-6 -4 -2 0 2 4 6
0.20.40.60.8
11.21.41.61.8
2
Mean response
Mea
n nu
mbe
r of
As
247
TOOLS OF PERSONALIZED MEDICINE – Holford, Windemuth & Ruaño
248
example the means are all 0, but the variance orspread of the distribution is much greater for aathan AA, while Aa is in between. The relation-ship between the phenotype and the mean allelefrequency in this instance increases thendecreases, reflecting the fact that for theextremely high and low values the allele fre-quency 0 predominates, i.e., aa. On the otherhand, for values in the middle, AA and Aa aremore common, thus resulting in a mode for theallele frequency. In this case, this SNP wouldnot be a good predictor of the phenotype,because the average response would be the samein each case. The SNP would say somethingabout the spread, but that would generally beless relevant, for example, aa individuals wouldtend to be either very high or very low, but wewould not know which was the case.
Of course, in practice, the genomic effectscould be realized on both the mean and thevariance, as in Figure 1(f). For this example, therelationship between the phenotype and theallele frequency is much more complicated,
with the possibility of changing directionsmore than once. If the relationship is this com-plicated, the particular SNP may not be a goodpredictor of the phenotype, even though thereis a relationship with the response. Ideally, wewould like to identify SNPs that affect themean value for the phenotype, as these wouldbe the better predictors.
ProspectsGenomics has revolutionized health science,and characterizing an individual’s genotypeoffers the possibility to learn a considerableamount of detail regarding their physiology.However, the efficacy of an individualizedhealth program is not solely written in thegenes, but also in other aspects of their natureand environment [9]. All of these features maycome together in a physiogenomic milieu thatcan help to identify the individual and theirresponse to a particular health program. Wehave discussed some of the approaches that canbe employed to quantify the problem.
Figure 1 (continued). The relationship between the distribution of responses for alternative modes of gene expression and allele frequency.
The relationship between the distribution of responses for alternative modes of gene expression and the allele frequency for the (a) linear model for mean; (b) dominance model for mean; (c) recessive model for mean; (d) hybrid model for mean; (e) variance model; and (f) model with varying mean and variance.
-6 -4 -2 0 2 4 6
Mean
TotalaaAaAA
-6 -4 -2 0 2 4 6
Mean
TotalaaAaAA
-6 -4 -2 0 2 4 6
Mean response
Mea
n nu
mbe
r of
As
-6 -4 -2 0 2 4 6
Mean response
Mea
n nu
mbe
r of
As
e) f)
Personalized Medicine (2005) 2(3)

Personalizing public health – TOOLS OF PERSONALIZED MEDICINE
Bibliography1. Miki Y, Swensen J, Shattuck-Eidens D et al.:
A strong candidate for the breast and ovarian cancer susceptibility gene BRCA1. Science 266, 66–71 (1994).
2. Wooster R, Neuhausen SL, Mangion J et al.: Localization of a breast cancer susceptibility gene, BRCA2, to chromosome 13q12-13. Science 265, 2088–2090 (1994).
3. Klein RJ, Zeiss C, Chew EY et al.: Complement factor H polymorphism in
age-related macular degeneration. Science 308, 385–389 (2005).
4. Neter J, Kutner MH, Nachtsheim CJ, Wasserman W: Applied Linear Statistical Models. WCB McGraw-Hill, MA, USA (1996).
5. McCullagh P, Nelder JA: Generalized Linear Models. Chapman and Hall, London, UK (1989).
6. Hosmer DW, Lemeshow S: Applied logistic regression. John Wiley & Sons, New York, USA (1989).
7. Holford TR: Multivariate Methods in Epidemiology. Oxford University Press, New York, USA (2002).
8. Armitage P: Test for linear trend in proportions and frequencies. Biometrics 11, 375–386 (1955).
9. Ruano G: Quo vadis personalized medicine? Personalized Med. 1, 1–7 (2004).
www.futuremedicine.com 249
Related Documents