169 Personality traits in HILDA 1 Ibolya Losoncz Research and Analysis Branch, Department of Families, Housing, Community Services and Indigenous Affairs 1 Introduction Personality traits are relatively stable, cross-situational tendencies that refer to the abstract underlying characteristics of individuals. The current most popular approach for studying and organising personality traits is the five-factor or the Big-Five model, which suggests that most individual differences in human personality can be classified into the following five broad domains: Emotional stability (often referred to by its inverse, Neuroticism), Extraversion, Openness to experience, Agreeableness and Conscientiousness. In Wave 5 of the Household, Income and Labour Dynamics in Australia (HILDA) survey respondents were questioned on their personality character traits using a 36-item inventory. This paper will item analyse responses to evaluate how well they capture the five-factor personality trait constructs and to assess the reliabilities of each of the scales compared with existing longer inventories measuring the same constructs. In addition, this paper will examine how the HILDA personality scales correlate with other measures known to be associated with personality. conceptual map of the Big five Personality has been conceptualised from a range of theoretical perspectives. Initial investigation was guided by the lexical approach—the analysis of the natural-language terms people use to describe themselves (Cattell, Eber & Tatsuoka, cited in John & Srivastava 1999; Goldberg 1992; Norman, cited in John & Srivastava 1999). While researchers following the lexical tradition were accumulating evidence for the five-factor structure, analysis of personality questionnaire scales had shown only two dimensions to appear consistently. This changed in the early 1990s with the work of Costa and McCrae recovering the same five factor structure in various personality questionnaires (McCrae & Costa 1990). This strong convergence of factor-analytic results from the lexical tradition with those from the questionnaire tradition led to a consensus on what became known as the Big Five (Goldberg 1981) personality dimensions. The Big-Five taxonomy is often criticised for not providing a comprehensive theory of personality; however, this was not its intended function. It was developed to account for the structural relations between personality traits to provide an account of personality that is primarily descriptive. In fact, the title ‘Big Five’ was chosen not to reflect the intrinsic greatness of the five factors but rather to emphasise that each factor is extremely broad and encompasses a large number of distinct and

Welcome message from author
This document is posted to help you gain knowledge. Please leave a comment to let me know what you think about it! Share it to your friends and learn new things together.
Transcript
169
Personality traits in HILDA1 Ibolya Losoncz
Research and Analysis Branch, Department of Families, Housing, Community Services and Indigenous Affairs
1 IntroductionPersonality traits are relatively stable, cross-situational tendencies that refer to the abstract underlying characteristics of individuals. The current most popular approach for studying and organising personality traits is the five-factor or the Big-Five model, which suggests that most individual differences in human personality can be classified into the following five broad domains: Emotional stability (often referred to by its inverse, Neuroticism), Extraversion, Openness to experience, Agreeableness and Conscientiousness.
In Wave 5 of the Household, Income and Labour Dynamics in Australia (HILDA) survey respondents were questioned on their personality character traits using a 36-item inventory. This paper will item analyse responses to evaluate how well they capture the five-factor personality trait constructs and to assess the reliabilities of each of the scales compared with existing longer inventories measuring the same constructs. In addition, this paper will examine how the HILDA personality scales correlate with other measures known to be associated with personality.
conceptual map of the Big five
Personality has been conceptualised from a range of theoretical perspectives. Initial investigation was guided by the lexical approach—the analysis of the natural-language terms people use to describe themselves (Cattell, Eber & Tatsuoka, cited in John & Srivastava 1999; Goldberg 1992; Norman, cited in John & Srivastava 1999). While researchers following the lexical tradition were accumulating evidence for the five-factor structure, analysis of personality questionnaire scales had shown only two dimensions to appear consistently. This changed in the early 1990s with the work of Costa and McCrae recovering the same five factor structure in various personality questionnaires (McCrae & Costa 1990). This strong convergence of factor-analytic results from the lexical tradition with those from the questionnaire tradition led to a consensus on what became known as the Big Five (Goldberg 1981) personality dimensions.
The Big-Five taxonomy is often criticised for not providing a comprehensive theory of personality; however, this was not its intended function. It was developed to account for the structural relations between personality traits to provide an account of personality that is primarily descriptive. In fact, the title ‘Big Five’ was chosen not to reflect the intrinsic greatness of the five factors but rather to emphasise that each factor is extremely broad and encompasses a large number of distinct and
170
AuStrAlIAN SocIAl PolIcy No. 8
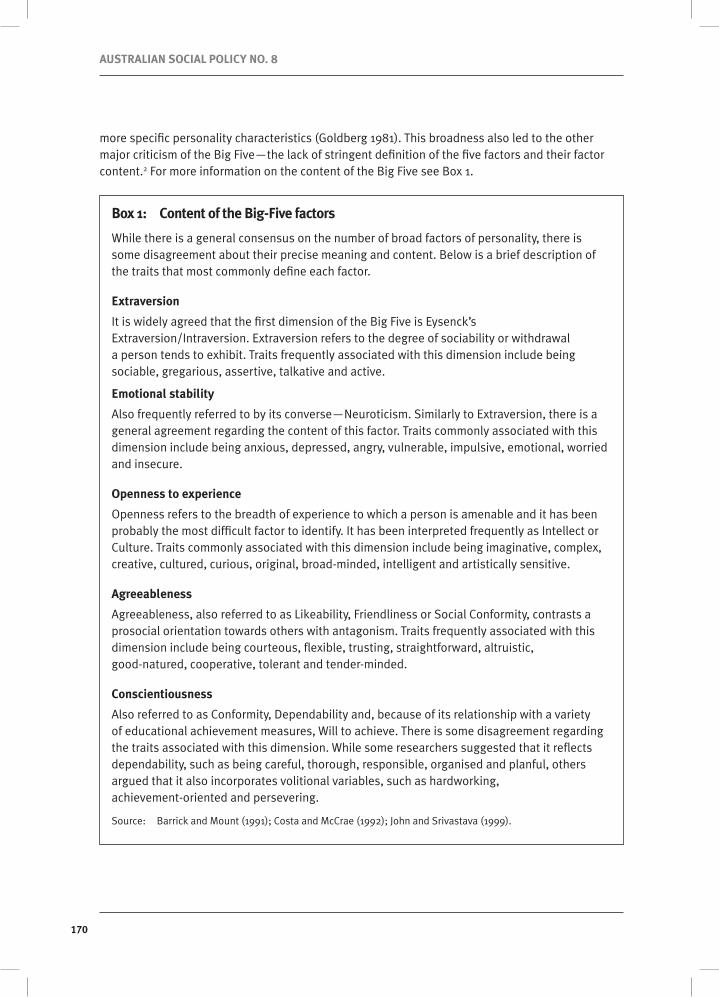
more specific personality characteristics (Goldberg 1981). This broadness also led to the other major criticism of the Big Five—the lack of stringent definition of the five factors and their factor content.2 For more information on the content of the Big Five see Box 1.
Box 1: content of the Big-five factors
While there is a general consensus on the number of broad factors of personality, there is some disagreement about their precise meaning and content. Below is a brief description of the traits that most commonly define each factor.
extraversion
It is widely agreed that the first dimension of the Big Five is Eysenck’s Extraversion/Intraversion. Extraversion refers to the degree of sociability or withdrawal a person tends to exhibit. Traits frequently associated with this dimension include being sociable, gregarious, assertive, talkative and active.
emotional stability
Also frequently referred to by its converse—Neuroticism. Similarly to Extraversion, there is a general agreement regarding the content of this factor. Traits commonly associated with this dimension include being anxious, depressed, angry, vulnerable, impulsive, emotional, worried and insecure.
openness to experience
Openness refers to the breadth of experience to which a person is amenable and it has been probably the most difficult factor to identify. It has been interpreted frequently as Intellect or Culture. Traits commonly associated with this dimension include being imaginative, complex, creative, cultured, curious, original, broad-minded, intelligent and artistically sensitive.
Agreeableness
Agreeableness, also referred to as Likeability, Friendliness or Social Conformity, contrasts a prosocial orientation towards others with antagonism. Traits frequently associated with this dimension include being courteous, flexible, trusting, straightforward, altruistic, good-natured, cooperative, tolerant and tender-minded.
conscientiousness
Also referred to as Conformity, Dependability and, because of its relationship with a variety of educational achievement measures, Will to achieve. There is some disagreement regarding the traits associated with this dimension. While some researchers suggested that it reflects dependability, such as being careful, thorough, responsible, organised and planful, others argued that it also incorporates volitional variables, such as hardworking, achievement-oriented and persevering.
Source: Barrick and Mount (1991); Costa and McCrae (1992); John and Srivastava (1999).
171
PerSoNAlIty trAItS IN hIldA
Predictive utility
While the Big-Five factors are interpreted as dimensions of trait descriptions, rather than a particular theoretical perspective, subsequent research found consistent support for the predictive utility of the Big Five. Among the adult population, personality traits were found to relate to important outcomes in:
w training and education
w employment and the workplace
w mental and physical health
w other life outcome variables such as marriage, leadership, donating to charity and social capital.
Personality traits also showed a systematic variation with sex and age.
Sex
Studies exploring gender differences found that women report a higher score on all five measures, except on Emotional stability. These differences between men and women tend to reduce on all five scales with the increase of age. The decline of difference with the increase of age is particularly notable on the Emotional stability scale (Srivastava et al. 2003). This corresponds with earlier studies, which found higher levels of Neuroticism among girls than boys in adolescent populations (Margalit & Eysenck 1990). However, studies focusing on the middle-aged women found an increased emotional coping skill with age (Helson & Kwan 2000).
development of personality in adulthood
Since the 1980s, a number of longitudinal and cross-sectional personality studies have provided evidence for the current consensus—that while personality traits show high levels of continuity over the life course of individuals, at the same time they show important and systematic changes connected to particular life experiences and ageing.
A consistent finding among studies is a decreasing pattern of Extraversion with an increase of age during young adulthood. However, patterns after the age of 30 are not clear or consistent. The partitioning of Extraversion into two components—social dominance3 and social vitality4—has led to a clearer pattern of development and found an increase in social dominance through midlife and a decline in social vitality into old age (Costa et al. 2000; Roberts et al. 2003).
Emotional stability tends to increase moderately or remain stable across the life course. For example, McCrae et al. (1999) reported a negative, although very small, correlation between Neuroticism and age across six cultures, while Goldberg et al. (1998) found a small positive relationship between age and emotional stability. Findings from longitudinal studies have been generally consistent with these cross-sectional studies. They found either a decreasing (Costa et al. 2000; Robins et al. 2001) or relatively stable (Costa & McCrae 1988; Roberts & Chapman 2000) level of Neuroticism during adulthood.
Studies examining changes in Openness to experience show an increase in young adulthood, followed by either no relationship or a decrease during middle to old age. For example, Robins et al. (2001) found an increase of Openness to experience in a four year longitudinal study of US
172
AuStrAlIAN SocIAl PolIcy No. 8
college students. However, beyond college years findings are inconsistent (Costa & McCrae 1986; McCrae et al. 1999; Stevens & Truss 1985).
While several studies have found little or no change in Agreeableness across the life course (Costa et al. 2000; Stevens & Truss 1985), there are also examples of studies reporting an increased level of Agreeableness across adulthood. For example, a study by Costa and McCrae (1986) reported a higher level of Agreeableness among adults 35 to 85 years than among US college students.
The increase in Conscientiousness, especially in young adulthood, is probably the most robust pattern in personality development. In a cross-sectional study, McCrae et al. (1999) found an increase of all facets of Conscientiousness with an increase in age. A longitudinal study from adolescence to adulthood by Stein, Newcomb and Bentler (1986) found corresponding results.
In summary, it appears that people are more socially dominant during young adulthood, and more Conscientious and Agreeable during their middle years and into old age. Emotional stability appears to increase across the life course, while Openness to experience tends to remain stable after a small increase during young adulthood.
employment and income
In the workplace, Conscientiousness was found to be a general predictor of work performance, while Agreeableness and Emotional stability were linked to improved job performance in a team environment. Openness to experience and Extraversion also predicted training proficiency across a variety of occupations. In addition, Extraversion, Conscientiousness, and Emotional stability have shown a positive correlation with income (Barrick & Mount 1991). These findings were also supported by the German Panel pre-test personality study in 2004 (Wooden 2004).
lifestyle risk activities and health
Studies to date suggest that adults with high Conscientiousness have better health outcomes and longevity, whereas adults low on Agreeableness and Emotional stability have poorer health outcomes and are more likely to engage in lifestyle risk activities, such as smoking and alcohol intake (Adams et al. 1998; Friedman, Hawley & Tucker 1994).
A recent study by van Loon et al. (2001) found that after controlling for other predictors, female (but not male) smokers had significantly higher scores for Extraversion. Respondents who never smoked reported the lowest score on Neuroticism, followed by ex-smokers, while current smokers reported the highest score for Neuroticism. Also, increased levels of self-reported hostility (comparable to the reverse of Agreeableness) were found to be a significant predictor for being a smoker or ex-smoker. While the study found no statistically significant differences in personality scores between moderate and heavy drinkers, it found that male non-drinkers reported a significantly lower score for Extraversion than moderate and heavy drinkers. This finding by van Loon and her colleagues was largely comparable with earlier findings by Cook et al. (1998).
In terms of physical and mental health, forward selection regression analysis by Holden et al. (2006) predicting health measures found a positive correlation of Energetic coping (computed of items measuring Emotional stability and Extraversion) with Mental health, Vitality, Social function, Role emotional, and General health.

173
PerSoNAlIty trAItS IN hIldA
life satisfaction and relationships
The positive relationship of Extraversion and Emotional stability with subjective wellbeing is well established by research (for example, Costa & McCrae 1980). Emotional stability has also shown a positive correlation with the propensity to marry and a negative correlation with propensity to divorce (Cramer 1993).
Extraversion and Emotional stability were both found to strongly and positively correlate with life satisfaction and positive life events, including subjective and objective life events. In a relatively large sample Australian longitudinal study, Headey and Wearing (1989) found Extraversion to be strongly related to measures of life satisfaction and positive affect but less related to negative affect. Neuroticism, on the other hand, was more strongly related to measures of life satisfaction and negative affect than measures of positive affect. Also, Openness to experience has shown a moderate, but statistically significant, correlation with subjective wellbeing.
Mini-markers
To reduce testing time, several shortened versions of the Big-Five scale called mini markers were developed (see Box 2). Mini-markers are a compromise between reliability and testing time. Also, as mini markers include items relatively close to the prototypical cores of the five factors, they tend to leave out variables with low factor purity. A benefit of this is a more homogenous scale. The cost, however, is the sacrifice of the breadth of the factor. Tighter scales may lead to lower overall reliability as they produce ‘too much’ homogeneity, leading to attenuation paradox—a possible decrease in validity as item intercorrelations increase, but not all facets of each domain are represented.
In addition to the scales listed in Box 2 there are other measures which set out to assess the Big-Five factors. While most of these were developed for a specific research application, the plethora of instruments available to measure the Big Five indicates the lack of a definitive instrument(s).
174
AuStrAlIAN SocIAl PolIcy No. 8
Box 2: Mini-markers
Some of the well established, but shorter, instruments developed for various research applications are:
the Big-five Inventory (BfI) by Benet-Martınez and John (1998)
Consisting of 44 short phrases based on trait adjectives found to be prototypical markers of the Big-Five. Estimated to take around five minutes to complete. Although the BFI includes only eight to 10 items per scale, it has high content coverage and psychometric properties. It has also shown a high convergent validity with other self-report Big-Five scales and with peer ratings (John & Srivastava 1999).
Neo five-factor Inventory (Neo-ffI) by Costa and McCrae (1992)
Consisting of 60 self-report items, it is a shortened version of the NEO Personality Inventory (NEO-PI), containing the best items of that longer inventory as indicated by factor analysis. Estimated to take around 15 minutes to complete. Research using the NEO-FFI has demonstrated strong psychometric properties (John & Srivastava 1999).
trait descriptive Adjectives–100 (tdA-100) by Goldberg (1992)
Consisting of 100 adjectives, it requires about 15 minutes of respondents’ time. Based on Norman’s semantic categories list, Goldberg (1990) constructed an inventory of trait adjectives for respondents to rate their own personality. He then factor analysed the collected data. Goldberg distilled his findings into several published lists of adjective lists. The list most commonly used is the set of 100 unipolar trait descriptive adjectives.
trait descriptive Adjectives–40 (tdA-40) by Saucier (1994)
Using Goldberg’s 100-item set and guided by psychometric criteria, Saucier (1994) selected those items that showed high factor purity. In addition, Saucier was aiming to:
w increase user-friendliness by reducing the number of terms beginning with a prefix un-
w decrease the number of root-negation pairs (for example, kind–unkind)
w increase the already high correlation of the scales with scales from the full set of 100 markers.
ten-Item Personality Inventory (tIPI) by Gosling, Rentfrow and Swann (2003)
The TIPI contains two items for each Big-Five factor and it takes only a couple of minutes to complete. The scale was constructed to emphasise content validity considerations, and internal consistency estimates are therefore inappropriate. The scales in TIPI show high convergent validity with other widely used Big Five scales as well as a very good test–retest reliability.
175
PerSoNAlIty trAItS IN hIldA
2 Development of the HILDA personality trait scales
results from Wave 5 dress rehearsal
The HILDA Wave 5 dress rehearsal included two alternative instruments, the Ten-Item Personality Inventory (TIPI) and the Trait Descriptive Adjectives-40 (TDA-40).5 Principal component analysis extracted only two components from the TIPI, instead of the expected five. Results from the TDA-40 extracted eight components, and explained 56 per cent of variations in the 40 items. Components one to five, containing 33 items, meshed quite well with the five-factor concept. However, the remaining seven items formed an additional three components. There were also a number of items that appeared to load better on a different component than the one they set out to measure (University of Melbourne 2005).
On the whole, results were in favour of TDA-40, although the exclusion of poorly performing items was recommended and a new 30-item instrument was proposed. This recommendation was later reviewed, resulting in a 36-item instrument.
3 Data, measures and methods
data
The data used in this research came from Wave 5 of HILDA, a longitudinal household survey focusing on the interactions between the labour market, families and social welfare. For more information see Watson and Wooden (2002). The survey is a large, nationally representative sample of households, with interviews and self-complete questionnaires sought from all household members over the age of 15 years.
Wave 5 interviews were conducted between August 2005 and March 2006. Of the 17,469 persons eligible for interview, 12,759 were successfully interviewed. Not all of the successfully interviewed respondents completed and returned the self-complete questionnaires where the personality trait items were listed. Consequently, only 10,512 respondents (or 82.4 per cent of those successfully interviewed) provided valid answers to all personality traits measures. However, the response rate for the personality traits items was relatively stable across sex, age, marital status, country of birth, level of education and occupation. Thus, the sample of respondents who provided valid answers to the personality items bears a close resemblance to the wider sample of respondents.
Measures
The measures of personality traits were listed under the Lifestyle and Living Situation module of the questionnaire. Thirty of the adjectives were lifted from the TDA-40 (Saucier 1994), while the remaining six were from other sources (see Table 1). Respondents were asked to rate on a
176
AuStrAlIAN SocIAl PolIcy No. 8
seven-point scale how well each of the adjectives describes them, from 1, ‘does not describe me at all’, to 7, ‘describes me very well’.
Other measures included in this paper were:
w age
w marital status
w country of birth
w educational attainment
w labour force status
w occupation
w remoteness
w income
w life satisfaction
w satisfaction with family relationships
w smoking
w alcohol intake
w physical and mental health.
Life satisfaction was measured on a scale of 0 ‘totally dissatisfied’ to 10 ‘totally satisfied’ scale. Satisfaction with family relationships was calculated for each respondent as the average score across all relationship types which applied to the respondent.6 Correspondingly, a person would receive a high score for this measure regardless of how many relationship types they have, as long as they felt satisfied with those relationships.
Smoking was captured with three self-reported categories: never smoked, ex-smoker, and current smoker. To measure alcohol intake, four categories were developed to capture both frequency and quantity of alcohol intake reported by the respondent (that is, Never drunk, No longer drink, Current drinker—low frequency and quantity,7 and Current drinker—high frequency or quantity).8
The seven occupational categories used in the paper were developed using the International Standard Classification of Occupations (Elias & Birch 1994). Self-reported physical and mental health was measured using the SF-36 instrument. For more information on SF-36, see Ware (2000).
Methodsconstruct validity and scale construction
The lack of agreed theoretical definitions of the five-factor personality construct (Eysenck 1997; John & Srivastava 1999; McAdams 1992) restricted the range of methods available to critically evaluate the construct validity of the HILDA personality traits scales. To identify the number of underlying dimensions of personality as assessed by the HILDA inventory, Exploratory Factor Analysis (EFA) was used. EFA is a widely-used technique to develop scales. It assumes that latent concepts/factors (such as Extraversion) underlie observed variables (such as Talkative). Unlike
177
PerSoNAlIty trAItS IN hIldA
Principal Component Analysis, another commonly used technique to identify composite variables, EFA, attempts to explain the common variance among the observed variables by excluding unique variance, which is partly influenced by measurement error (Floyd & Widaman 1995; Gorsush 1997).
A maximum likelihood method with oblimin rotation was selected. A maximum likelihood method obtains a set of factors (through successive factoring), each of which in turn explains as much variance as possible in the population correlation matrix, as estimated from the sample correlation matrix (Kline 1993). Oblimin rotation is an oblique axis-rotation technique with no orthogonal assumptions made to the correlation(s) between factors (Gorsuch 1997). This rotation was selected to account for the known overlap between the five factors.
Internal consistency
Internal consistency was assessed using Cronbach’s alpha, Item-total correlation, Squared Multiple R and Alpha if deleted.
Scale computation
Summated scales, as opposed to factor scores based on item loadings, were used to compute scales, as factor scores are more likely to underestimate the contribution of highly specific variables measuring some unique facets of a scale.9
external and predictive validity
An important objective of this paper is to examine the scales as predictors of socially significant behaviours and quality of life. Usually analysis assessing patterns of external correlates is applied to evaluate the construct validity of an instrument in terms of a nomological network. However, in this paper the analysis will be used only to evaluate whether the pattern of external correlates of the personality trait scales in HILDA matched the patterns of external correlates demonstrated by other established personality scales. From these results it can be judged with some confidence if the measures in HILDA assess the same constructs as those assessed by more established measures.
4 Results
Normality and discriminating properties of all items
The assumptions of univariate normality were evaluated through histograms and summary descriptive statistics. Of the 36 observed personality trait measures, 15 were moderately skewed.10 An additional four items (Sloppy, Jealous, Cold and Careless) had highly skewed distribution.11
Having some highly skewed items in personality inventories is expected. Also, all four items performed well in subsequent factor analysis and scale construction procedures, and therefore no transformations to normalise the distribution were necessary. A Kaiser measure of sampling adequacy of 0.891 indicated that the group of items was appropriate for EFA.
178
AuStrAlIAN SocIAl PolIcy No. 8
construct validity and scale construction
Initial exploratory factor analysis on the 36 personality trait items, with no restriction on the number of factors and with eigenvalue set to 1, produced seven factors. Five of the seven factors supported the Big-Five personality traits and accounted for 84.5 per cent of the total variance indicating that further investigation of a five-factor structure was appropriate (detailed results for the extraction of factors and factor matrix available from the author on request).
Items selected from the TDA-40 inventory were more likely to load sufficiently on the intended trait factors than items selected from other sources (see Table 1). Items from the TDA-40 that did not load the highest on their intended factor include Creative, Imaginative and Harsh. Items from the TDA-40 which loaded onto more than one factor were Withdrawn, Cold and Systematic. Of the six items selected from other sources only one item, Orderly, loaded sufficiently on its intended factor.

179
PerSoNAlIty trAItS IN hIldA
tabl
e 1:
Su
mm
ary
of it
ems
in h
Ild
A W
ave
5
Pe
rson
alit
y tr
ait i
tem
s in
hIl
dA
and
in th
e td
A-4
0
em
otio
nal
ope
nnes
s to
st
abil
ity
—
extr
aver
sion
co
nsci
enti
ousn
ess
Agr
eeab
lene
ss
expe
rien
ce
—
TDA
-40
item
s Re
laxe
d
Bol
d O
rgan
ised
U
nsym
path
etic
U
ncre
ativ
e ex
clud
ed fr
om H
ILD
A
Une
nvio
us
En
erge
tic
Prac
tica
l Ru
de
Uni
ntel
lect
ual
Item
s in
HIL
DA
En
viou
s
Bas
hful
Ca
rele
ss
Cold
Co
mpl
ex
fr
om T
DA
-40
Fret
ful
Ex
trov
erte
d D
isor
gani
sed
Coop
erat
ive
Crea
tive
Je
alou
s
Qui
et
Effic
ient
H
arsh
D
eep
Moo
dy
Sh
y In
effic
ient
Ki
nd
Imag
inat
ive
Tem
pera
men
tal
Ta
lkat
ive
Slop
py
Sym
path
etic
In
telle
ctua
l
To
uchy
Wit
hdra
wn
Syst
emat
ic
War
m
Philo
soph
ical
Item
s in
HIL
DA
Ca
lm
En
thus
iast
ic
Ord
erly
Se
lfish
fr
om o
ther
sou
rces
Li
vely
Tr
adit
iona
l
r
esul
ts fr
om fa
ctor
ana
lysi
s
Item
s lo
adin
g fa
ctor
1
fact
or 2
fa
ctor
3
fact
or 4
fa
ctor
5
fact
or 6
fa
ctor
7
on to
the
fact
ors
Envi
ous
Crea
tive
B
ashf
ul
Care
less
Co
oper
ativ
e Co
mpl
ex
Calm
Fr
etfu
l Im
agin
ativ
e Ex
trov
erte
d D
isor
gani
sed
Kind
D
eep
Trad
itio
nal
H
arsh
En
thus
iast
ic
Qui
et
Effic
ient
Sy
mpa
thet
ic
Inte
llect
ual
Je
alou
s
Shy
Inef
ficie
nt
War
m
Philo
soph
ical
Moo
dy
Ta
lkat
ive
Ord
erly
Selfi
sh
Slop
py
Te
mpe
ram
enta
l
To
uchy
Cros
s-lo
adin
g it
ems
Cold
Cold
Wit
hdra
wn
W
ithd
raw
n
Sy
stem
atic
Syst
emat
ic
Live
ly
Live
ly
Li
vely
Sour
ce:
HIL
DA
Wav
e 5;
TD
A-4
0 by
Sau
cier
(199
4).
180
AuStrAlIAN SocIAl PolIcy No. 8
five component factor analysis
To investigate how well the items would support the five-factor structure, a maximum likelihood factor analysis, with five components rotated to an oblimin criterion, was undertaken. Items that did not reach the cut-off factor loading of 0.45, or did not load on the expected factor more than 1.25 times higher than any other factor, were omitted from the scales.12
The rotated five-component solution (see Table 2) sufficiently supported the Big-Five structure. Twenty-eight of the 36 items loaded on their corresponding components and satisfied the specified criteria. Again, items selected from the TDA-40 inventory were more likely to load sufficiently on the intended five trait factors than items selected from other sources. TDA-40 items that did not load the highest on their intended factor and were omitted from the scales included: Complex, Withdrawn, Harsh, Cold and Careless.
Items from other sources that did not load the highest onto their intended factor and were omitted from the scales included Selfish and Enthusiastic. Calm and Traditional were also omitted from the scales as they did not load high enough on any factors.
According to the criteria, Complex was also deemed to be omitted. It had a loading of 0.44 to its target factor, Openness to experience, as well as a loading of 0.47 to Emotional stability. However, this trait is frequently listed in the literature as a primary dimension of Openness to experience (Barrick & Mount 1991; Costa & McCrae 1992; John & Srivastava 1999) and therefore it was retained for that scale.
In the end, the items identified for inclusion for the five scales corresponded exactly with the items selected by the University of Melbourne to construct the five personality scales included in HILDA Wave 5.
The above results are also indicative of associations between the scales. In fact, subsequent bivariate correlation analysis between the five scales found a low to moderate correlation between Conscientiousness and Emotional stability (r=0.30), Conscientiousness and Agreeableness (r=0.30), and Agreeableness and Openness to experience (r=0.27). This intercorrelation between the five personality trait scales is consistent with earlier results, which found that the five factors are not independent from each other (DeYoung, Peterson & Higgins 2002; Digman 1997; Goldberg 1993).

181
PerSoNAlIty trAItS IN hIldA
table 2: factor matrix from five-factor analysis (oblimin rotation) of hIldA personality traits items
Items emotional openness
extraversion conscien-
Agreeableness stability to experience tiousness
Emotional stabilityMoody 0.697 Temperamental 0.683 Jealous 0.614 Fretful 0.575 Envious 0.573 Touchy 0.598
Openness to experience Imaginative 0.715 Creative 0.613 Intellectual 0.561 Philosophical 0.511 Deep 0.311 0.455 Complex 0.465 0.441
Extraversion Quiet (reversed) 0.742 Shy (reversed) 0.316 0.679 Talkative 0.646 Extroverted 0.461 Bashful (reversed) 0.382 0.337 0.477 Lively 0.344 0.473 0.368
Conscientiousness Orderly 0.723 Disorganised 0.353 0.696 (reversed)Efficient 0.684 0.380Sloppy 0.416 0.597 (reversed)Inefficient 0.386 0.576 (reversed)Systematic 0.515
Agreeableness Warm 0.314 0.748Kind 0.729Sympathetic 0.665Cooperative 0.313 0.608
Not included Selfish 0.567 –0.348Harsh 0.583 –0.360Cold 0.512 –0.398Enthusiastic 0.515 –0.335 0.474Withdrawn 0.531 0.494 Careless 0.440 –0.442 Calm –0.273 0.322Traditional 0.231 0.249
Note: Only loadings >0.3 or above 0.8 per cent of the loading on the highest factor reported. Kaiser-Meyer-Olkin measure of Sampling Adequacy=0.891
Source: HILDA Wave 5.
182
AuStrAlIAN SocIAl PolIcy No. 8
Internal consistency and normality
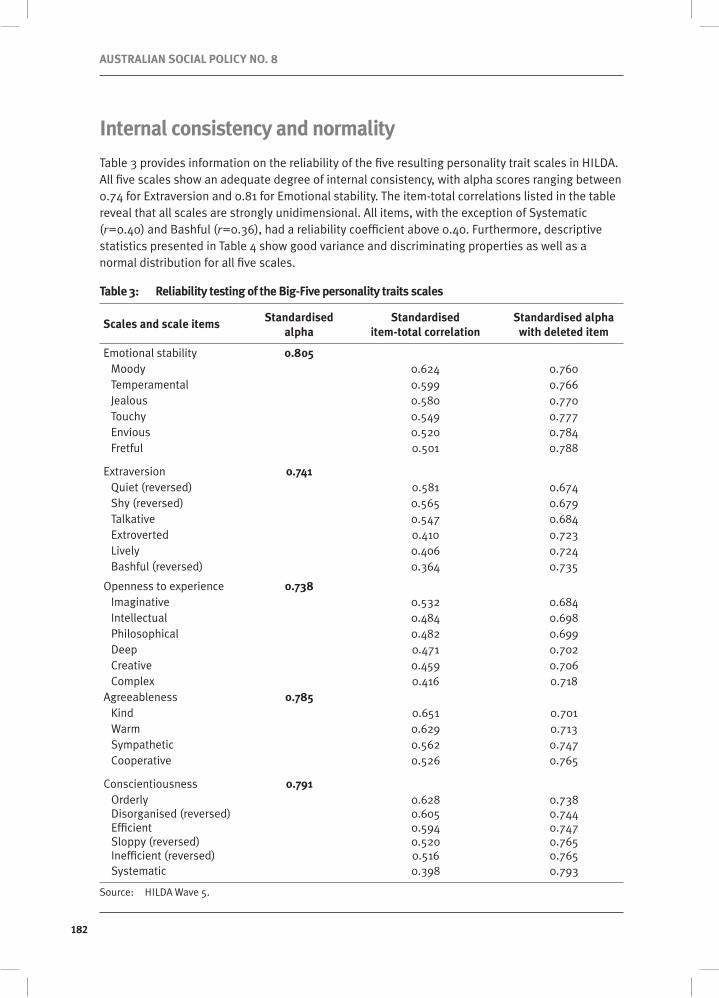
Table 3 provides information on the reliability of the five resulting personality trait scales in HILDA. All five scales show an adequate degree of internal consistency, with alpha scores ranging between 0.74 for Extraversion and 0.81 for Emotional stability. The item-total correlations listed in the table reveal that all scales are strongly unidimensional. All items, with the exception of Systematic (r=0.40) and Bashful (r=0.36), had a reliability coefficient above 0.40. Furthermore, descriptive statistics presented in Table 4 show good variance and discriminating properties as well as a normal distribution for all five scales.
table 3: reliability testing of the Big-five personality traits scales
Scales and scale items Standardised Standardised Standardised alpha alpha item-total correlation with deleted item
Emotional stability 0.805 Moody 0.624 0.760Temperamental 0.599 0.766Jealous 0.580 0.770Touchy 0.549 0.777Envious 0.520 0.784Fretful 0.501 0.788
Extraversion 0.741 Quiet (reversed) 0.581 0.674Shy (reversed) 0.565 0.679Talkative 0.547 0.684Extroverted 0.410 0.723Lively 0.406 0.724Bashful (reversed) 0.364 0.735
Openness to experience 0.738 Imaginative 0.532 0.684Intellectual 0.484 0.698Philosophical 0.482 0.699Deep 0.471 0.702Creative 0.459 0.706Complex 0.416 0.718
Agreeableness 0.785 Kind 0.651 0.701Warm 0.629 0.713Sympathetic 0.562 0.747Cooperative 0.526 0.765
Conscientiousness 0.791 Orderly 0.628 0.738Disorganised (reversed) 0.605 0.744Efficient 0.594 0.747Sloppy (reversed) 0.520 0.765Inefficient (reversed) 0.516 0.765Systematic 0.398 0.793
Source: HILDA Wave 5.
183
PerSoNAlIty trAItS IN hIldA
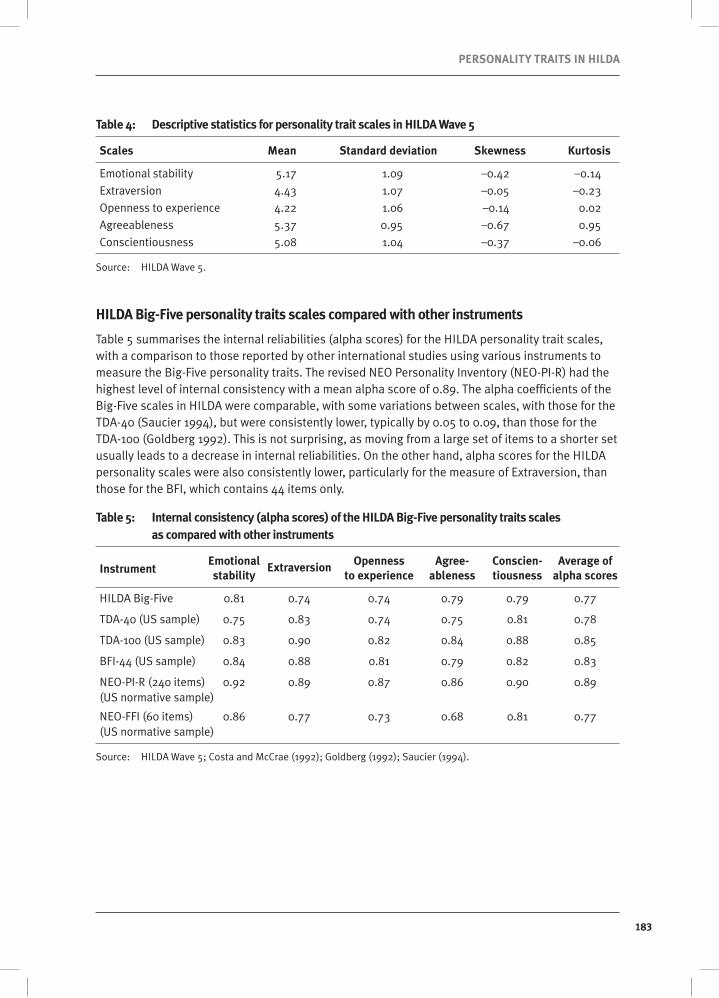
table 4: descriptive statistics for personality trait scales in hIldA Wave 5
Scales Mean Standard deviation Skewness kurtosis
Emotional stability 5.17 1.09 –0.42 –0.14
Extraversion 4.43 1.07 –0.05 –0.23
Openness to experience 4.22 1.06 –0.14 0.02
Agreeableness 5.37 0.95 –0.67 0.95
Conscientiousness 5.08 1.04 –0.37 –0.06
Source: HILDA Wave 5.
hIldA Big-five personality traits scales compared with other instruments
Table 5 summarises the internal reliabilities (alpha scores) for the HILDA personality trait scales, with a comparison to those reported by other international studies using various instruments to measure the Big-Five personality traits. The revised NEO Personality Inventory (NEO-PI-R) had the highest level of internal consistency with a mean alpha score of 0.89. The alpha coefficients of the Big-Five scales in HILDA were comparable, with some variations between scales, with those for the TDA-40 (Saucier 1994), but were consistently lower, typically by 0.05 to 0.09, than those for the TDA-100 (Goldberg 1992). This is not surprising, as moving from a large set of items to a shorter set usually leads to a decrease in internal reliabilities. On the other hand, alpha scores for the HILDA personality scales were also consistently lower, particularly for the measure of Extraversion, than those for the BFI, which contains 44 items only.
table 5: Internal consistency (alpha scores) of the hIldA Big-five personality traits scales as compared with other instruments
Instrument emotional openness Agree- conscien- Average of
stability extraversion
to experience ableness tiousness alpha scores
HILDA Big-Five 0.81 0.74 0.74 0.79 0.79 0.77
TDA-40 (US sample) 0.75 0.83 0.74 0.75 0.81 0.78
TDA-100 (US sample) 0.83 0.90 0.82 0.84 0.88 0.85
BFI-44 (US sample) 0.84 0.88 0.81 0.79 0.82 0.83
NEO-PI-R (240 items) 0.92 0.89 0.87 0.86 0.90 0.89 (US normative sample)
NEO-FFI (60 items) 0.86 0.77 0.73 0.68 0.81 0.77 (US normative sample)
Source: HILDA Wave 5; Costa and McCrae (1992); Goldberg (1992); Saucier (1994).
184
AuStrAlIAN SocIAl PolIcy No. 8
external validity and predictive utility
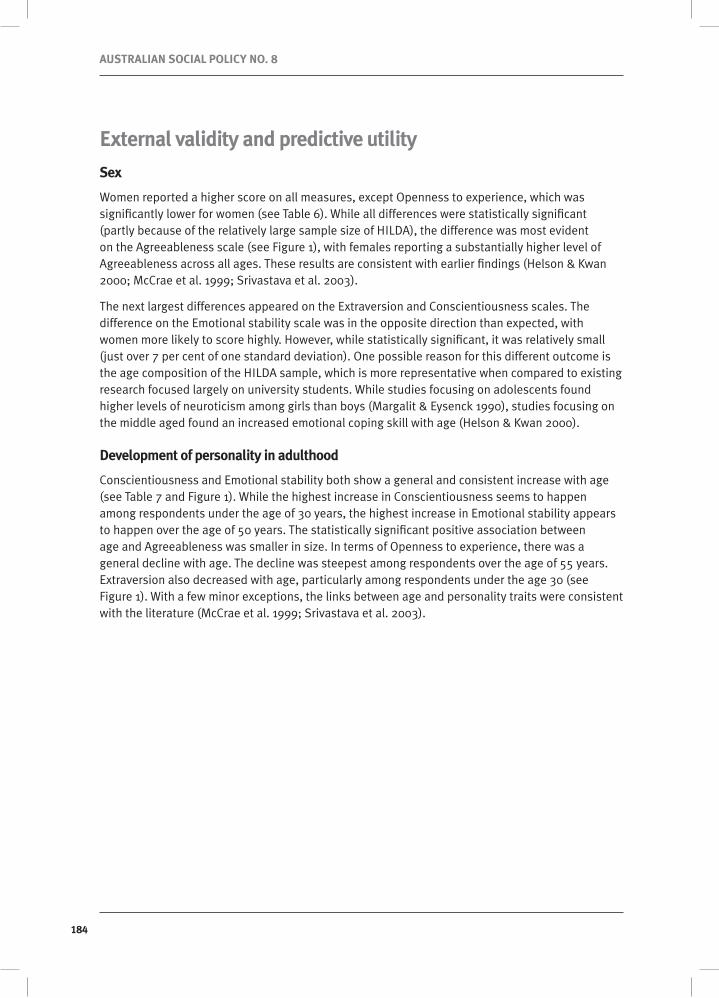
Sex
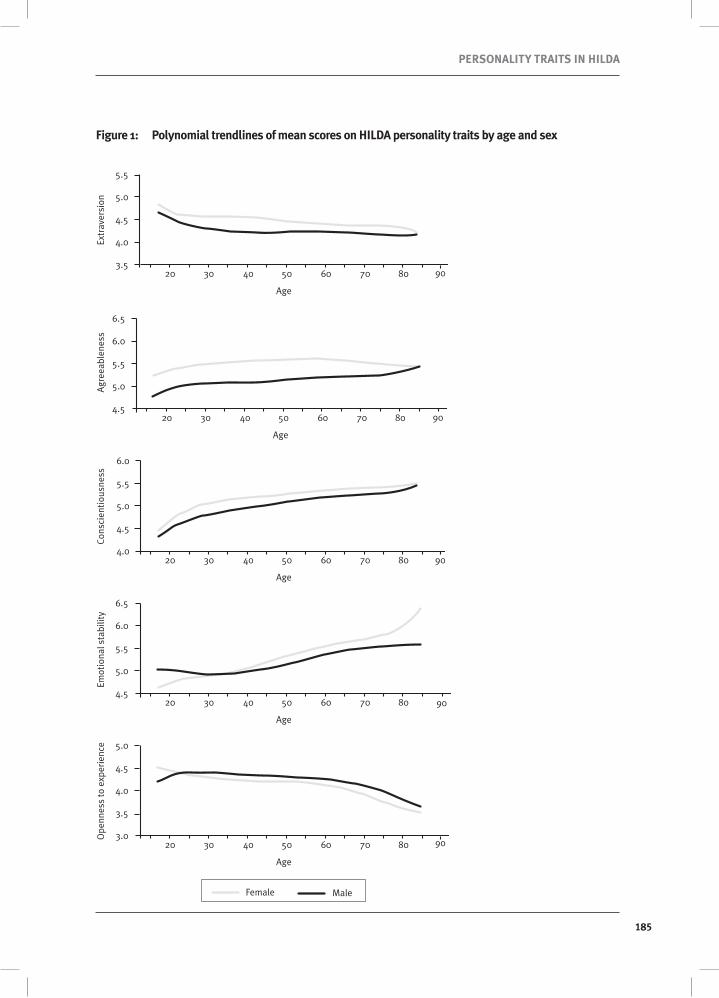
Women reported a higher score on all measures, except Openness to experience, which was significantly lower for women (see Table 6). While all differences were statistically significant (partly because of the relatively large sample size of HILDA), the difference was most evident on the Agreeableness scale (see Figure 1), with females reporting a substantially higher level of Agreeableness across all ages. These results are consistent with earlier findings (Helson & Kwan 2000; McCrae et al. 1999; Srivastava et al. 2003).
The next largest differences appeared on the Extraversion and Conscientiousness scales. The difference on the Emotional stability scale was in the opposite direction than expected, with women more likely to score highly. However, while statistically significant, it was relatively small (just over 7 per cent of one standard deviation). One possible reason for this different outcome is the age composition of the HILDA sample, which is more representative when compared to existing research focused largely on university students. While studies focusing on adolescents found higher levels of neuroticism among girls than boys (Margalit & Eysenck 1990), studies focusing on the middle aged found an increased emotional coping skill with age (Helson & Kwan 2000).
development of personality in adulthood
Conscientiousness and Emotional stability both show a general and consistent increase with age (see Table 7 and Figure 1). While the highest increase in Conscientiousness seems to happen among respondents under the age of 30 years, the highest increase in Emotional stability appears to happen over the age of 50 years. The statistically significant positive association between age and Agreeableness was smaller in size. In terms of Openness to experience, there was a general decline with age. The decline was steepest among respondents over the age of 55 years. Extraversion also decreased with age, particularly among respondents under the age 30 (see Figure 1). With a few minor exceptions, the links between age and personality traits were consistent with the literature (McCrae et al. 1999; Srivastava et al. 2003).
185
PerSoNAlIty trAItS IN hIldA
figure 1: Polynomial trendlines of mean scores on hIldA personality traits by age and sex
3.5
4.0
4.5
5.0
5.5
40 50 70 806020 30
Age
Extr
aver
sion
Female Male
90
4.5
5.0
5.5
6.0
6.5
40 50 70 806020 30
Age
Agr
eeab
lene
ss
Female Male
90
4.0
4.5
5.0
5.5
6.0
40 50 70 80 906020 30
Age
Cons
cien
tiou
snes
s
Female Male
4.5
5.0
5.5
6.0
6.5
40 50 70 806020 30
Age
Emot
iona
l sta
bilit
y
Female Male
90
3.0
3.5
4.0
4.5
5.0
40 50 70 806020 30
Age
Ope
nnes
s to
exp
erie
nce
Female Male
903.0
3.5
4.0
4.5
5.0
40 50 70 806020 30
Age
Ope
nnes
s to
exp
erie
nce
Female Male
90
186
AuStrAlIAN SocIAl PolIcy No. 8
Marital status
Emotional stability was found to be lowest among single respondents and highest among widowed respondents (Table 6), although to some extent this relationship may be related to age of respondents. Analysis (not shown here) found that female, but not male, married respondents reported higher scores on Emotional stability than separated respondents.
Extraversion was found to be the lowest among widowed women. No significant difference was observed in the male group.13 Openness to experience was lowest among widowed and married respondents. Among widows, this relationship may partly be age related. Agreeableness was lowest among single respondents, while Conscientiousness was lowest among single and de facto respondents. These results are consistent with earlier findings (Cramer 1993).
country of birth
Openness to experience was highest among respondents born in non–English speaking countries, and lowest among Australian-born respondents (see Table 6). Conscientiousness was lowest among Australian-born respondents and highest among respondents born in other English-speaking countries. Respondents born in other English-speaking countries also reported the highest level of Emotional stability, followed by respondents born in Australia. Agreeableness only reached a statistically significant difference between respondents born in Australia and those born in other English-speaking countries, who reported the highest level. No significant group differences were found for Extraversion.
educational attainment
Respondents with a diploma or higher educational attainment reported significantly higher levels of Openness to experience, Emotional stability, Conscientiousness and Agreeableness than respondents with Year 12 or below. No significant group differences were found for Extraversion (see Table 6). These results are consistent with existing findings on the relationship between Conscientiousness and educational grades and achievements (for example, Hogan & Ones 1997) and Openness to experience and tertiary education (for example, Jang, Livesley & Vemon 1996).
labour force status
Respondents not in the labour force reported the lowest level of Openness to experience (this may be age related) followed by part-time and full-time workers. The highest level on this scale was reported by unemployed respondents. Unemployed respondents also reported the lowest level of Emotional stability followed by full-time and part-time workers (see Table 6). These findings are consistent with existing research, which found Emotional stability to be negatively related with unemployment (Headey & Wearing 1989; Magnus et al. 1993).
Unemployed respondents reported a lower level of Conscientiousness than respondents from other groups. Part-time workers and those not in the labour force reported a significantly higher level of Agreeableness than full time workers. Respondents not in the labour force reported a significantly lower level of Extraversion compared to other respondents (see Table 6). Analysis not shown here has also found that self-employed workers reported a significantly higher level of Emotional stability than employees.

187
PerSoNAlIty trAItS IN hIldA
table 6: Mean values of the Big-five personality traits in hIldA by selected sample characteristics
emotional openness Agree- conscien- stability extraversion to experience ableness tiousness
SexMales 5.11 4.30 4.25 5.13 4.97Females 5.19 4.52 4.16 5.57 5.16
Significant p<0.0001 p<0.0001 p<0.0001 p<0.0001 p<0.0001 differences
Marital status1. Married 5.24 4.40 4.11 5.39 5.202. De facto 4.97 4.45 4.36 5.35 5.013. Separated 5.12 4.40 4.37 5.55 5.204. Divorced 5.35 4.40 4.42 5.51 5.155. Widowed 5.83 4.30 3.74 5.49 5.266. Single 4.85 4.44 4.37 5.21 4.72
Significant 6< 1,3,4,5 5<1,2,6 5<1,2,3,4,6 6<1,2,3,4,5 6<1,2,3,4,5 differences(a) 2<1,4,5 1<6 1<2,3,4 4>1,2 2<1,3,4,5 3<1,4,5 1<5 4<5
country of birth1. Australia 5.16 4.41 4.17 5.35 5.032. Overseas—Main 5.34 4.41 4.23 5.41 5.24 English-speaking countries 3. Overseas—Other 4.93 4.42 4.36 5.36 5.11
Significant 3<1,2 ns 1,2<3 1<2 1<2,3 differences(a) 1<2
education attainment1. Degree or higher 5.21 4.44 4.64 5.44 5.232. Diploma 5.24 4.42 4.38 5.45 5.203. Certificate 5.12 4.38 4.14 5.27 5.074. Year 12 5.03 4.41 4.35 5.37 4.985. Year 11 or below 5.16 4.41 3.92 5.33 4.98
Significant 4<1,2,5 ns 5<1,2,3,4 3,5<1 5<1,2,3 differences(a) 3<1,2 3<1,2,4 3,5<2 4<1,2 5<2 2,4<1 3<1,2
labour force status 1. Employed full-time 5.07 4.40 4.28 5.29 5.072. Employed part-time 5.08 4.56 4.23 5.43 5.033. Unemployed 4.89 4.44 4.43 5.31 4.754. Not in the labour force 5.31 4.33 4.07 5.39 5.11
Significant 3<1,2,4 4<1,2 4<1,2,3 1<2,4 3<1,2,4 differences(a) 1,2<4 1<2 1,2<3
188
AuStrAlIAN SocIAl PolIcy No. 8
table 6: Mean values of the Big-five personality traits in hIldA by selected sample characteristics (continued)
emotional openness Agree- conscien- stability extraversion to experience ableness tiousness
occupation(b) 1. Senior officials 5.22 4.57 4.40 5.28 5.26 and managers2. Professionals 5.23 4.45 4.59 5.44 5.193. Technicians and 5.12 4.51 4.31 5.43 5.20 associate professionals4. Clerks 5.01 4.45 4.15 5.53 5.125. Service and 4.93 4.55 4.24 5.42 4.92 sales workers6. Trade workers 5.06 4.37 4.10 5.08 4.897. Elementary occupations 4.98 4.31 4.02 5.13 4.84
Significant 5<1,2,3 6<1,2,3,4 2>1,3,4,5,6,7 6<2,3,4,5 6<1,2,3,4 differences(a) 7<1,2,3 7<1,3,5 1>4,6,7 7<2,3,4,5 7<1,2,3,4 4<1,2 3>4,6,7 1<2,3,4,5 5<1,2,3,4 6<2 5>4,6,7
Smoking 1. Never smoked 5.23 4.39 4.20 5.39 5.112. Ex-smoker 5.16 4.39 4.19 5.33 5.153. Current smoker 4.94 4.48 4.24 5.30 4.86
Significant 3<1,2 1,2<3 1<3 1>2,3 1,2>3 differences(a) 2<1
Alcohol intake 1. Never drunk 5.17 4.32 4.06 5.31 4.982. No longer drink 5.14 4.35 4.22 5.31 5.063. Current drinker 5.19 4.40 4.25 5.43 5.10 —low frequency and quantity(c)
4. Current drinker 5.01 4.51 4.19 5.20 4.94 —high frequency or quantity(d)
Significant 4<1,2,3 1,2,3<4 1<2,3,4 4<1,2,3 4,1<3 differences(a) 1<3 4<3 1,2<3
(a) Significant differences are tested with Tukey’s method (p<0.05, Agresti & Finlay 1997).
(b) Employed sub-sample only.
(c) See endnote 6.
(d) See endnote 7.
Note: ns=not significant.
Source: HILDA Wave 5.
189
PerSoNAlIty trAItS IN hIldA
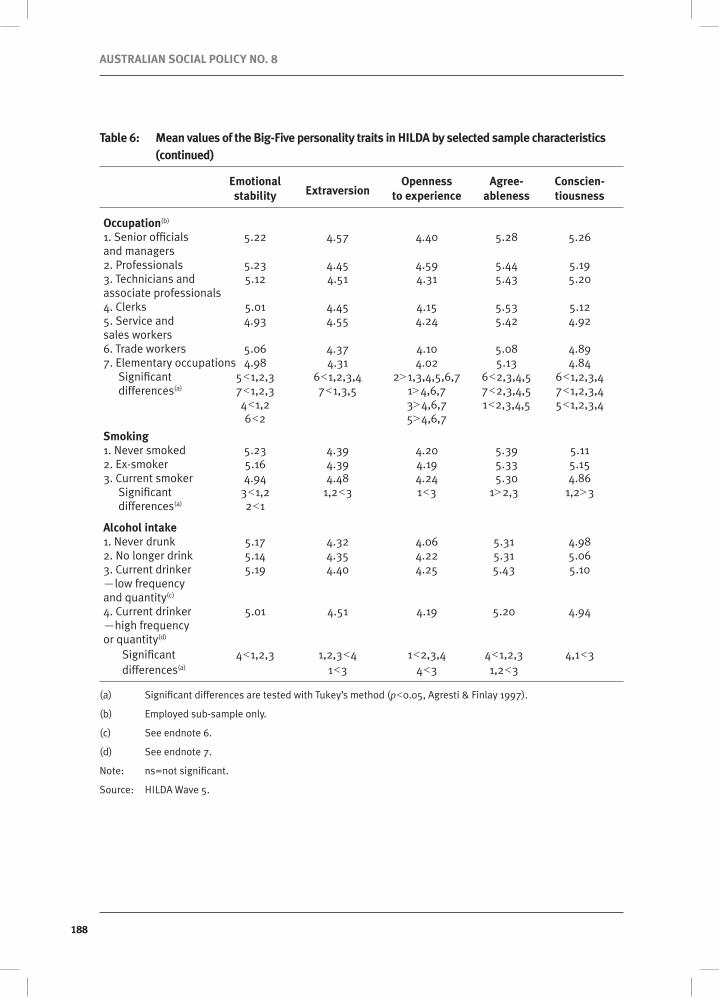
occupation (employed sub-sample only)
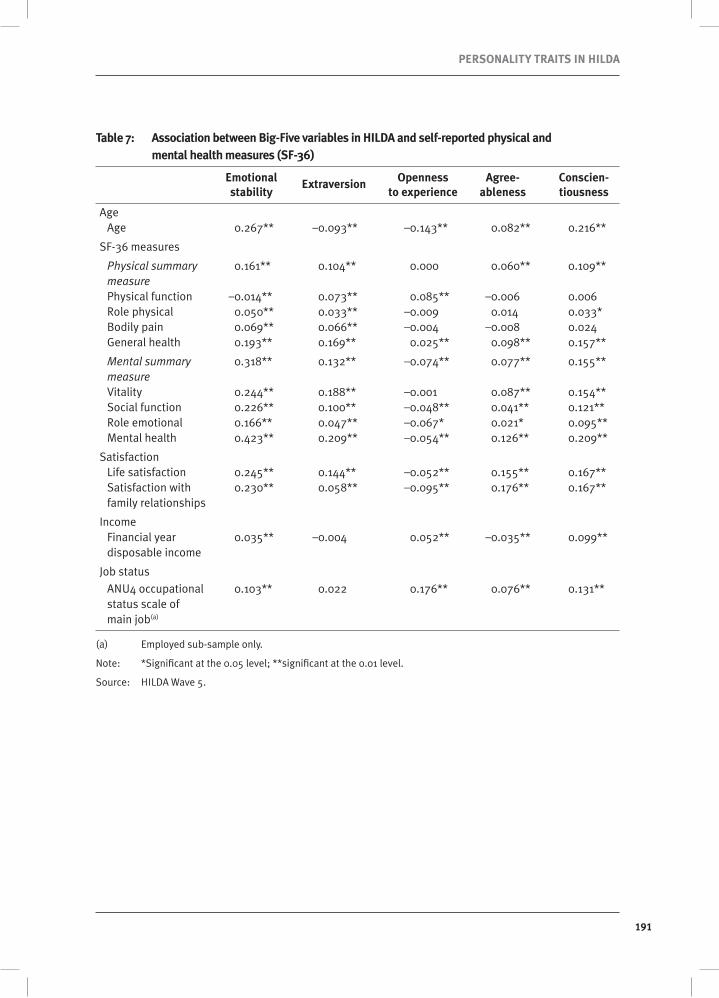
Openness to experience was highest among professionals compared to respondents from other occupational groups. After professionals, senior officials and managers as well as technicians and associated professionals reported a significantly higher level of Openness to experience than those in the other groups. Service and sales workers reported a higher level of Openness to experience than clerks, trade workers and those with elementary occupations (see Table 6). Of the five personality traits, Openness to experience has shown the highest correlation (r=0.18) with job status (see Table 7).
Self-reported Emotional stability was significantly higher among professionals, senior officials and managers and technicians and associated professionals than among other groups. Similarly, Conscientiousness was significantly higher among higher level occupational groups (see Table 6). Both Conscientiousness and Emotional stability have shown a low degree, but statistically significant correlation (r=0.13, and r=0.10 respectively) with job status (see Table 7).
Occupational groups with a significantly lower level of Agreeableness included elementary occupations and trades as well as senior officials and managers. Trade workers and those with elementary occupations also reported the lowest level of Extraversion (see Table 6).
Income
A bivariate correlation analysis between personality trait measures and individual income estimates from HILDA has found a very low, but statistically significant, positive correlation between Conscientiousness and income (r=0.10). This positive relationship is consistent with earlier findings. The correlation between income and other personality traits was negligible.
life satisfaction and satisfaction with family relationships
In addition to the life satisfaction measure, the current study also included a measure of satisfaction with family relationships. Of the five personality traits, Emotional stability had the strongest correlation with both life satisfaction (r=0.25) and satisfaction with family relationships (r=0.23). Conscientiousness and Agreeableness also showed a low, but statistically significant, positive correlation with life satisfaction (r=0.17 and r=0.16 respectively) and satisfaction with family relationships (r=0.17 and r=0.18, respectively) (see Table 7). These results are consistent with earlier findings by Headey and Wearing (1989). The association between Extraversion and life satisfaction was relatively small (r=0.14), and the correlation between Extraversion and satisfaction with family relationships was negligible.
Smoking and alcohol intake
Current smokers scored lower on Conscientiousness, Agreeableness and Emotional stability, and higher on Extraversion and Openness to experience than ex-smokers and respondents who never smoked (see Table 6). While the differences were statistically significant on all five traits, the magnitude of the difference was largest for Emotional stability, followed by Conscientiousness. Respondents who never smoked reported the highest score on Emotional stability, followed by ex-smokers, while current smokers reported the lowest score.
In terms of alcohol intake, non-drinkers scored lower on Extraversion than moderate drinkers. Respondents with high frequency or high quantity alcohol consumption scored the highest on
190
AuStrAlIAN SocIAl PolIcy No. 8
Extraversion (see Table 6). Not surprisingly, respondents who have never drunk alcohol scored the lowest on Openness to experience. High frequency or high quantity drinkers also scored lower on this scale than moderate drinkers. Agreeableness, Conscientiousness and Emotional stability were highest among moderate drinkers and lowest among respondents reporting high frequency or high quantity alcohol intake.
Results from the current study are in line with earlier findings which suggest that adults with low scores on the traits Conscientiousness, Agreeableness and Emotional stability are more likely to engage in lifestyle risk activities, such as smoking and alcohol intake (Adams et al. 1998; Friedman, Hawley & Tucker 1994).
Physical and mental health
Associations between personality traits and measures of self-reported physical and mental health are presented in Table 7. Of the five personality traits, Emotional stability showed the strongest correlation with mental as well as physical health measures. The highest correlation was observed between Emotional stability and Mental health (r=0.42), followed by the correlation between Emotional stability and the Mental summary measure (r=0.32). Emotional stability has also shown a low degree, but statistically significant, correlation with Vitality (r=0.24), Social function (r=0.23), and General health (r=0.19). These relationships were in line with results from previous studies.
Conscientiousness has shown a low, but statistically significant, correlation with Mental health (r=0.21), General health (r=0.16) and Vitality (r=0.15). The direction of these relationships was in line with previous research, although the magnitude of the estimated correlations was smaller than those found by Holden and colleagues (2006).
Extraversion also showed low, but statistically significant, positive correlations with Mental health (r=0.21), and Vitality (r=0.19). The correlation of Openness to experience and Agreeableness with various physical and mental measures were negligible. These results, while not directly comparable, are consistent with results presented by Holden and his colleagues (2006).
191
PerSoNAlIty trAItS IN hIldA
table 7: Association between Big-five variables in hIldA and self-reported physical and mental health measures (Sf-36)
emotional openness Agree- conscien- stability
extraversion to experience ableness tiousness
AgeAge 0.267** –0.093** –0.143** 0.082** 0.216**
SF-36 measures
Physical summary 0.161** 0.104** 0.000 0.060** 0.109** measurePhysical function –0.014** 0.073** 0.085** –0.006 0.006Role physical 0.050** 0.033** –0.009 0.014 0.033*Bodily pain 0.069** 0.066** –0.004 –0.008 0.024General health 0.193** 0.169** 0.025** 0.098** 0.157**
Mental summary 0.318** 0.132** –0.074** 0.077** 0.155** measureVitality 0.244** 0.188** –0.001 0.087** 0.154**Social function 0.226** 0.100** –0.048** 0.041** 0.121**Role emotional 0.166** 0.047** –0.067* 0.021* 0.095**Mental health 0.423** 0.209** –0.054** 0.126** 0.209**
SatisfactionLife satisfaction 0.245** 0.144** –0.052** 0.155** 0.167**Satisfaction with 0.230** 0.058** –0.095** 0.176** 0.167** family relationships
IncomeFinancial year 0.035** –0.004 0.052** –0.035** 0.099** disposable income
Job status
ANU4 occupational 0.103** 0.022 0.176** 0.076** 0.131** status scale of main job(a)
(a) Employed sub-sample only.
Note: *Significant at the 0.05 level; **significant at the 0.01 level.
Source: HILDA Wave 5.
192
AuStrAlIAN SocIAl PolIcy No. 8
5 Discussion
the Big-five taxonomy
The Big-Five concept is a broad level abstraction of personality. In recent years attempts have been made to present the Big-Five concept as an acceptable descriptive paradigm but, as argued by Eysenck, ‘a purely descriptive paradigm is a scientific impossibility’ (Eysenck 1997). The fundamental weakness of the Big-Five model as a scientific model of personality is the absence of causal relations and nomological networks to support the factors emerging from factor analysis. It is therefore not surprising that while there is an emerging consensus on the Big-Five factor structure, it is by no means a universal agreement and the content of the factors are still subject to some debate. In summary, the Big-Five concept provides an integrative descriptive concept for personality research, and while some researchers claim that it may hold more meaning and use, these claims are yet to be explicated theoretically.
Psychometric properties of the hIldA personality trait scales
Results from this research offer adequate but not perfect support for the HILDA personality traits inventory and subsequent scales. Maximum likelihood factor analysis with five components suggested that the majority of items performed appropriately; however, the six items selected from elsewhere did not perform as well as items lifted directly from the TDA-40. The items selected for the Big-Five scales in this research have corresponded exactly with the items selected by the University of Melbourne to construct the five personality scales included in HILDA Wave 5.
All five personality scales included in HILDA Wave 5 have reached adequate levels for those criteria evaluated in this paper; normality, construct validity, internal consistency, and external correlates. In terms of internal consistency, the personality trait scales within HILDA are somewhat inferior to larger Big-Five instruments. The low item-total correlation values for some of the Extraversion items are indicative of relatively low levels of internal consistency of the Extraversion scale.
Descriptive statistics showed good variance and discriminating properties, as well as a normal distribution, in all five scales. In terms of overall reliability, Emotional stability and Agreeableness performed the best across the criteria and Extraversion performed the least well.
The relationships of personality trait scales with other measures known to be associated with personality were found, with a few exceptions, to be consistent with the literature. In terms of sex, age, marital status, educational attainment, occupation and income, results from this study using the HILDA personality scales were consistent with previous findings using other established personality scales.
The strong positive correlation of Emotional stability with mental health, and to some extent with measures of physical health, was consistent with earlier findings. The relationship of Conscientiousness with general health and mental health, and Extraversion with mental health and vitality, also ran in the predicted direction. Furthermore, the relatively weak relationships of Agreeableness and Openness to experience with mental and physical health measures are consistent with earlier findings.
193
PerSoNAlIty trAItS IN hIldA
Also resembling previous research, the current study found that adults with low scores on Conscientiousness, Agreeableness and Emotional stability were more likely to engage in lifestyle risk activities, such as smoking and alcohol intake. With the exception of Extraversion, the relationship between personality traits and life satisfaction was found to be consistent with earlier findings. However, in this study the link between Extraversion and life satisfaction and satisfaction with family relationships was negligible. This may be due, to some extent, to the relatively low performance of the Extraversion scale.
Based on these results, users of this scale can be relatively confident that the personality trait items used in HILDA have adequately captured the separate constructs of the Big-Five model. They can also be confident that the resulting scales measuring the Big-Five personality traits, with the exception of Extraversion, have good reliability properties. Furthermore, results from this assessment of patterns of external correlates tend to indicate that the Big-Five scales in HILDA assess the same constructs as those assessed by other established measures.
To date, most studies on the predictive utility of personality traits are limited to reports of correlations, as opposed to underlying processes. Nevertheless, the predictive function of personality traits can be well utilised in social longitudinal studies of health and wellbeing, social relationships, welfare and labour market outcomes. Results from this study provide a useful resource to social policy researchers in search of a comprehensive evaluation of the HILDA personality traits.
future research
The conceptual status of the Big Five has limited the extent to which this paper could evaluate the psychometric properties of the personality scales in HILDA Wave 5. Most importantly, content validity analysis was not performed, while construct validity was limited to searching for underlying themes using factor analysis. In terms of external or predictive validity, the analysis in this paper was limited to bivariate correlations as opposed to testing for causal processes.
Future research strengthening the evaluation of the psychometric properties of the personality trait scales in HILDA could include community sample studies comparing results with other five factor personality trait instruments. In addition, studies exploring the relationship and the underlying causal processes between personality traits and health outcomes and/or lifestyle risk activities could broaden the application and utilisation of personality inventories.
194
AuStrAlIAN SocIAl PolIcy No. 8
Endnotes1 This paper uses unit record data from the Household, Income and Labour Dynamics in Australia
(HILDA) survey (release 5.1). The HILDA project was initiated and is funded by the Australian Government Department of Families, Housing, Community Services and Indigenous Affairs (FaHCSIA) and is managed by the Melbourne Institute of Applied Economic and Social Research (MIAESR).
2 For example, the NEO inventories include items related to warmth in Extraversion whereas the Big-Five Inventory (BFI) and Trait Descriptive Adjectives (TDA) include them in Agreeableness.
3 Social dominance reflects independence and self-confidence, especially in social context.
4 Social vitality reflects sociability, positive affect, gregariousness, and energy level.
5 Note that the TDA–40 items tested in the HILDA dress rehearsal were not actually taken directly from Saucier (1994). Due to a mistake in the set tested, the adjectives Distant, Orderly, Mellow, Enthusiastic, Average and Ordinary took the place of Unsympathetic, Organised, Unenvious, Energetic, Uncreative and Unintellectual.
6 The construction equally weighted each type of relationship to which the individual responded. In practice, some relationship types are likely to be more important than others. However, the relative importance of particular relationship types will differ across individuals and life stages, and in the absence of alternative weights, the equal weighting approach was considered reasonable.
7 Drinks alcohol less than five days a week and less than five standard drinks on a day.
8 Drinks alcohol more than four days a week, or more than four standard drinks on a day.
9 Items measuring unique facets of a scale tend to be overlooked when items are selected for their common variance.
10 Had a skewness coefficient value between 0.5 and 1.0 or –0.5 and –1.0.
11 Had a skewness coefficient greater than 1 or less than –1.
12 This benchmark may seem too relaxed; however, the unique nature of personality traits is the lack of simple hierarchical structure. Consequently, items measuring important aspects of personality are sometimes excluded because of their multiple loadings. To moderate the potential of similar misjudgements in this research the usual benchmark was adjusted.
13 Results from analysis of personality traits by sex are available from the author on request.
195
PerSoNAlIty trAItS IN hIldA
ReferencesAdams, SH, Cartwright, LK, Ostrove, JM & Stewart, AJ 1998, ‘Psychological predictors of good health in three longitudinal samples of educated midlife women’, Health Psychology, vol. 17, pp. 412–20.
Agresti, A & Finlay, B 1997, Statistical methods for the social sciences (third edition), Prentice–Hall, New Jersey.
Barrick, MR & Mount, MK 1991, ‘The Big-Five personality dimensions and job performance: a meta-analysis’, Personnel Psychology, vol. 44, pp. 1–26.
Benet-Martınez, V & John, OP 1998, ‘Los Cinco Grandes across cultures and ethnic groups: multitrait multimethod analyses of the Big-Five in Spanish and English’, Journal of Personality and Social Psychology, vol. 75, no. 3, pp. 729–50.
Cattell, RB, Eber, HW & Tatsuoka, MM 1970, Handbook for the sixteen personality factor questionnaire (16PF), Institute for Personality and Ability Testing, Champaign, Illinois.
Cook, M, Young, A, Taylor, D & Bedford, AP 1998, ‘Personality correlates of alcohol consumption’, Personality and Individual Differences, vol. 24, pp. 641–47.
Costa, PT, Herbst, JH, McCrae, RR & Siegler, IC 2000, ‘Personality at midlife: stability, intrinsic maturation and response to life events’, Assessment, vol. 7, pp. 365–78.
Costa, PT & McCrae, RR 1980, ‘Influence of extraversion and neuroticism on subjective wellbeing’, Journal of Personality and Social Psychology, vol. 38, pp. 668–78.
——1986, ‘Cross-sectional studies of personality in a national sample: I. Development and validation of survey measures’, Psychology and Aging, vol. 1, pp. 140–43.
——1988, ‘Personality in adulthood: a six-year longitudinal study of self-reports and spouse ratings on the NEO personality Inventory’, Journal of Personality and Social Psychology, vol. 54, pp. 853–63.
——1992, Revised NEO Personality Inventory (NEO-PI-R) and NEO Five-Factor Inventory (NEO-FFI) professional manual, Psychological Assessment Resources, Odessa, Florida.
Cramer, D 1993, ‘Personality and marital dissolution’, Personality and Individual Differences, vol. 14, pp. 605–07.
DeYoung, CG, Peterson, JB & Higgins, DM 2002, ‘Higher-order factors of the Big-Five predict conformity: are there neuroses of health?’, Personality and Individual Differences, vol. 33, pp. 533–52.
Digman, JM 1997, ‘Higher-order factors of the Big Five’, Journal of Personality and Social Psychology, vol. 73, pp. 1246–56.
Elias, P & Birch, M 1994, Establishment of community-wide occupational statistics, ISCO 88 (COM) A guide for users, Institute for Employment Research, University of Warwick.
196
AuStrAlIAN SocIAl PolIcy No. 8
Eysenck, HJ 1997, ‘Personality and experimental psychology: the unification of psychology and the possibility of a paradigm’, Journal of Personality and Social Psychology, vol. 73, pp. 1224–37.
Floyd, FJ & Widaman, KF 1995, ‘Factor analysis in the development and refinement of clinical assessment instruments’, Psychological Assessment, vol. 7, pp. 286–99.
Friedman, HS, Hawley, PH & Tucker, JS 1994, ‘Personality, health, and longevity’, Current Directions in Psychological Science, vol. 3, pp. 37–41.
Goldberg, LR 1981, ‘Language and individual differences: the search for universals in personality lexicons’, in L Wheeler (ed.), Review of personality and social psychology, vol. 2, Sage, Beverly Hills, California, pp. 141–65.
——1990, ‘An alternative “description of personality”: the Big-Five factor structure’, Journal of Personality and Social Psychology, vol. 59, pp. 1216–29.
——1992, ‘The development of markers for the Big-Five factor structure’, Psychological Assessment, vol. 4, pp. 26–42.
——1993, ‘The structure of phenotypic personality traits’, American Psychologist, vol. 48, pp. 26–34.
Goldberg, LR, Sweeney, D, Merenda, PF & Hughes, JE 1998, ‘Demographic variables and personality: the effects of gender, age, education, and ethnic/racial status of personality attributes’, Personality and Individual Differences, vol. 24, pp. 393–403.
Gorsuch, RL 1997, ‘Exploratory factor analysis: its role in item analysis’, Journal of Personality Assessment, vol. 68, pp. 532–60.
Gosling, SD, Rentfrow, PJ & Swann, WB 2003, ‘A very brief measure of the Big-Five personality domains’, Journal of Research in Personality, vol. 37, pp. 504–28.
Headey, B & Wearing, A 1989, ‘Personality, life events, and subjective wellbeing: toward a dynamic equilibrium model’, Journal of Personality and Social Psychology, vol. 57, pp. 731–39.
Helson, R & Kwan, VSY 2000, ‘Personality development in adulthood: the broad picture and processes in one longitudinal sample’, in S Hampson (ed.), Advances in personality psychology, vol. 1, Routledge, London, pp. 77–106.
Hogan, R & Ones, DS 1997, ‘Conscientiousness and integrity at work’, in R Hogan, JA Johnson & SR Briggs (eds), Handbook of personality psychology, Academic Press, San Diego, CA, pp. 849–70.
Holden, RR, Wasylkiw, L, Starzyk, KB, Book, AS & Edwards, MJ 2006, ‘Inferential structure of the NEO five-factor inventory: construct validity of the big-four personality clusters’, Canadian Journal of Behavioural Science, vol. 38, pp. 24–40.
Jang, KL, Livesley, WJ & Vemon, PA 1996, ‘Heritability of the Big-Five personality dimensions and their facets: a twin study’, Journal of Personality, vol. 64, pp. 577–92.
John, OP & Srivastava, S 1999, ‘The Big-Five trait taxonomy: history, measurement, and theoretical perspectives’, in LA Pervin & OP John (eds), Handbook of personality: theory and research, Guilford Press, New York, pp.102–38.
Kline, P 1993, Personality: the psychometric view, Routledge, London.
197
PerSoNAlIty trAItS IN hIldA
Magnus, K, Diener, E, Fujita, F & Pavot, W 1993, ‘Extraversion and neuroticism as predictors of objective life events; a longitudinal study’, Journal of Personality and Social Psychology, vol. 65, pp. 1046–53.
Margalit, M & Eysenck, S 1990, ‘Prediction of coherence in adolescence: gender differences in social skills, personality, and family climate’, Journal of Research in Personality, vol. 24, pp. 510–21.
McAdams, DP 1992, ‘The five-factor model in personality: a critical appraisal’, Journal of Personality, vol. 60, pp. 329–61.
McCrae, RR & Costa, PT 1990, Personality in adulthood, Guilford Press, New York.
McCrae, RR & Costa, PT, Pedroso de Lima, M, Simões, A, Ostendorf, F, Angleitner, A, Marusic, I, Bratko, D, Caprara, GV, Barbaranelli, C, Chae, JH & Piedmont, RL 1999, ‘Age differences in personality across the adult life span: parallels in five cultures’, Developmental Psychology, vol. 35, pp. 466–77.
Norman, WT 1967, 2,800 personality trait descriptors: normative operating characteristics for a university population, Department of Psychology, University of Michigan.
Roberts, BW & Chapman, C 2000, ‘Change in dispositional wellbeing and its relation to role quality: a 30-year longitudinal study’, Journal of Research in Personality, vol. 34, pp. 26–41.
Roberts, BW, Robins, RW, Trzesniewski, KH & Caspi, A 2003, ‘Personality trait development in adulthood’, in JT Mortimer & MJ Shanahan (eds), Handbook of the life course, Kluwer Academic/Plenum Publishers, New York, pp. 579–95.
Robins, RW, Fraley, RC, Roberts, BW & Trzesniewski, KH 2001, ‘A longitudinal study of personality change in adulthood’, Journal of Personality, vol. 69, pp. 617–40.
Saucier, G 1994, ‘Mini-markers: a brief version of Goldberg’s unipolar Big-Five markers’, Journal of Personality Assessment, vol. 63, no. 3, pp. 506–16.
Srivastava, S, John, OP, Gosling, SD & Potter, J 2003, ‘Development of personality in early and middle adulthood: set like plaster or persistent change?’, Journal of Personality and Social Change, vol. 84, pp. 1041–53.
Stein, JA, Newcomb, MD & Bentler, PM 1986, ‘Stability and change in personality: a longitudinal study from early adolescence to young adulthood’, Journal of Research in Personality, vol. 20, pp. 276–91.
Stevens, DP & Truss, CV 1985, ‘Stability and change in adult personality over 12 and 20 years’, Developmental Psychology, vol. 21, pp. 568–84.
University of Melbourne 2005, HILDA project report 05/03 development of Wave 5 survey instruments and methodology: progress report (following completion of dress rehearsal), report prepared for the Australian Government Department of Families, Community Services and Indigenous Affairs, Canberra.
van Loon, AJM, Tijhuis, M, Surtess, PG & Ormel, J 2001, ‘Personality and coping: their relationship with lifestyle risk factors for cancer’, Personality and Individual Differences, vol. 31, pp. 541–53.

198
AuStrAlIAN SocIAl PolIcy No. 8
Ware, JE Jr 2000, ‘SF-36 health survey update’, Spine, vol. 25, no. 24, pp. 3130–39.
Watson, N & Wooden, M 2002, The Household Income and Labour Dynamics in Australia (HILDA) survey: Wave 1 survey methodology, HILDA project technical paper series, University of Melbourne (No. 1/02).
Wooden, M 2004, HILDA survey strategy paper, 1/04, HILDA survey content—Waves 5 to 8, paper prepared for the HILDA ERG Meeting 04.2.

Copyright of Full Text rests with the original copyright owner and, except as permitted under the Copyright Act 1968, copying this copyright material is prohibited without the permission of the owner or its exclusive licensee or agent or by way of a license from Copyright Agency Limited. For information about such licences contact Copyright Agency Limited on (02) 93947600 (ph) or (02) 93947601 (fax)
Related Documents