www.angelbroking.com Market Outlook November 07, 2017 www.angelbroking.com Market Cues Indian markets are likely to open positive tracking global indices and SGX Nifty. The US markets moved mostly higher during trading on Monday, although trading activity was somewhat subdued. With the upward move on the day, the major averages reached new record closing highs. The Dow inched up 9 points to 23,548, while the Nasdaq rose 0.3 percent to 6,786 and the S&P 500 crept up 0.1 percent to 2,591. London’s benchmark index closed at 7,562 points, a 0.03 per cent gain from Friday’s close. The index hit another record closing high as commodity continue to firm up. Oil companies and miners were among the leading performers as commodity prices rose. The BSE Sensex hit a fresh record on Monday as it settled at 33,731, driven by better-than- expected earnings by blue-chip companies. NSE Nifty however pulled back from record on profit- booking and ended in the negative terrain. The Sensex after scaling an all-time high of 33,848.42 intraday settled at the new high of 33,731, up 0.1%. The NSE Nifty smashed all records to touch a fresh life-time high of 10,490 during the day, before ending down 0.1%, at 10,452. News Analysis Reliance Nippon Life Asset management – Book profit MAS Financials Services – Book profit Detailed analysis on Pg2 Investor’s Ready Reckoner Key Domestic & Global Indicators Stock Watch: Latest investment recommendations on 150+ stocks Refer Pg5 onwards Top Picks Company Sector Rating CMP (`) Target (`) Upside (%) Blue Star Capital Goods Buy 675 867 28.4 Dewan Housing Finance Financials Accumulate 642 712 10.9 Asian Granito Other Buy 493 570 15.7 Navkar Corporation Other Buy 192 265 37.9 KEI Industries Capital Goods Accumulate 334 380 13.8 More Top Picks on Pg4 Key Upcoming Events Date Region Event Description Previous Reading Consensus Expectations Nov08 China Exports YoY% 8.10 7.20 Nov09 China Consumer Price Index (YoY) 1.60 1.70 Nov09 US Initial Jobless claims 229.00 231.50 Nov10 UK Industrial Production (YoY) 1.60 1.90 Nov10 India Exports YoY% 25.67 More Events on Pg7 Domestic Indices Chg (%) (Pts) (Close) BSE Sensex 0.1 46 33,731 Nifty (0.0) (1) 10,452 Mid Cap 0.5 77 16,790 Small Cap 0.3 55 17,911 Bankex (0.3) (95) 28,997 Global Indices Chg (%) (Pts) (Close) Dow Jones 0.0 9 23,548 Nasdaq 0.3 22 6,786 FTSE 0.0 2 7,562 Nikkei 0.0 9 22,548 Hang Seng (0.0) (7) 28,597 Shanghai Com 0.5 16 3,388 Advances / Declines BSE NSE Advances 1,432 854 Declines 1,419 886 Unchanged 160 75 Volumes (` Cr) BSE 5,127 NSE 35,436 Net Inflows (` Cr) Net Mtd Ytd FII 1,537 2,580 41,032 MFs (138) (138) 95,272 Top Gainers Price (`) Chg (%) Hindcopper 104 19.5 Titan 785 19.0 Mmtc 87 18.9 Infibeam 189 12.8 Hathway 42 10.3 Top Losers Price (`) Chg (%) Recltd 166 (7.6) Rcom 16 (6.2) Relcapital 558 (5.2) Idea 101 (5.1) Sci 104 (4.7) As on November, 06 2017

Welcome message from author
This document is posted to help you gain knowledge. Please leave a comment to let me know what you think about it! Share it to your friends and learn new things together.
Transcript

www.angelbroking.com
Market Outlook November 07, 2017
www.angelbroking.com
Market Cues
Indian markets are likely to open positive tracking global indices and SGX Nifty.
The US markets moved mostly higher during trading on Monday, although trading activity was somewhat subdued. With the upward move on the day, the major averages reached new record closing highs. The Dow inched up 9 points to 23,548, while the Nasdaq rose 0.3 percent to 6,786 and the S&P 500 crept up 0.1 percent to 2,591.
London’s benchmark index closed at 7,562 points, a 0.03 per cent gain from Friday’s close. The index hit another record closing high as commodity continue to firm up. Oil companies and miners were among the leading performers as commodity prices rose.
The BSE Sensex hit a fresh record on Monday as it settled at 33,731, driven by better-than- expected earnings by blue-chip companies. NSE Nifty however pulled back from record on profit- booking and ended in the negative terrain. The Sensex after scaling an all-time high of 33,848.42 intraday settled at the new high of 33,731, up 0.1%. The NSE Nifty smashed all records to touch a fresh life-time high of 10,490 during the day, before ending down 0.1%, at 10,452.
News Analysis
Reliance Nippon Life Asset management – Book profit
MAS Financials Services – Book profit
Detailed analysis on Pg2
Investor’s Ready Reckoner
Key Domestic & Global Indicators
Stock Watch: Latest investment recommendations on 150+ stocks
Refer Pg5 onwards
Top Picks Company Sector Rating
CMP (`)
Target (`)
Upside (%)
Blue Star Capital Goods Buy 675 867 28.4
Dewan Housing Finance Financials Accumulate 642 712 10.9
Asian Granito Other Buy 493 570 15.7
Navkar Corporation Other Buy 192 265 37.9
KEI Industries Capital Goods Accumulate 334 380 13.8 More Top Picks on Pg4
Key Upcoming Events Date Region Event Description
Previous Reading
Consensus Expectations
Nov08 China Exports YoY% 8.10 7.20
Nov09 China Consumer Price Index (YoY) 1.60 1.70
Nov09 US Initial Jobless claims 229.00 231.50
Nov10 UK Industrial Production (YoY) 1.60 1.90
Nov10 India Exports YoY% 25.67More Events on Pg7
Domestic Indices Chg (%) (Pts) (Close)
BSE Sensex 0.1 46 33,731
Nifty (0.0) (1) 10,452
Mid Cap 0.5 77 16,790
Small Cap 0.3 55 17,911
Bankex (0.3) (95) 28,997
Global Indices Chg (%) (Pts) (Close)
Dow Jones 0.0 9 23,548
Nasdaq 0.3 22 6,786
FTSE 0.0 2 7,562
Nikkei 0.0 9 22,548
Hang Seng (0.0) (7) 28,597
Shanghai Com 0.5 16 3,388
Advances / Declines BSE NSE
Advances 1,432 854
Declines 1,419 886
Unchanged 160 75
Volumes (` Cr)
BSE 5,127
NSE 35,436
Net Inflows (` Cr) Net Mtd Ytd
FII 1,537 2,580 41,032
MFs (138) (138) 95,272
Top Gainers Price (`) Chg (%)
Hindcopper 104 19.5
Titan 785 19.0
Mmtc 87 18.9
Infibeam 189 12.8
Hathway 42 10.3
Top Losers Price (`) Chg (%)
Recltd 166 (7.6)
Rcom 16 (6.2)
Relcapital 558 (5.2)
Idea 101 (5.1)
Sci 104 (4.7) As on November, 06 2017

www.angelbroking.com
Market Outlook November 07, 2017
www.angelbroking.com
News Analysis
Reliance Nippon Life Asset management – Book profit
We had recommended SUBSCRIBE for Reliance Nippon Life Asset Management Ltd (RNAM) IPO which successfully raised `1,542cr at `252. At higher end IPO band, it was demanding market cap of `15,422cr (which is 6.8% of the MF AUM `2,28,329cr for the month of August 2017). At yesterday’s closing price, it is trading at 12.7% premium ton IPO price. We recommend to book profit in Reliance Nippon Life Asset management Ltd.
MAS Financials Services – Book profit
We had also recommended SUBSCRIBE for MAS Financials Services Ltd. Company raised `460cr at the issue price of `459 (6.85x FY17 book value pre-IPO). Although valuations were on the higher side, the strong and sustainable growth and ROE prospects of the company, gave us comfort to assign Subscribe rating to the issue. At yesterday’s closing price of `633, it is trading at 38% premium to IPO price and 5.6x post-IPO book value. We recommend to book profit in MAS Financials Services Ltd.
Economic and Political News Govt may review monthly GST return filing process
Govt to give 60% stake in ONGC, OIL fields to private companies
Oil hits $63 a bbl, highest since 2015 on output tightening by Saudi Arabia
Corporate News
Wheels India standalone PAT rises 112.81% in the September quarter
Greenlam Industries standalone PAT rises 35.97% in the September quarter
NBFCs grabbing market share of banks, says BCG report
Indian Bank soars 9% post Q2 results
RCom shares tumble over 6% on news that Brookfield called off `11,000cr merger deal

www.angelbroking.com
Market Outlook November 07, 2017
www.angelbroking.com
Quarterly Bloomberg Brokers Consensus Estimate
Cipla Ltd - Nov 07, 2017 Particulars ( ` cr) 2QFY18E 2QFY17 y-o-y (%) 1QFY18 q-o-q (%)
Sales 4,014 3,751 7.1 3,525 13.9
EBIDTA 755 680 11.1 646 16.9
% 18.9 18.1 18.4
PAT 422 354 19.3 408 3.4
BHEL Ltd - Nov 07, 2017 Particulars ( ` cr) 2QFY18E 2QFY17 y-o-y (%) 1QFY18 q-o-q (%)
Sales 6,793 6,646 2.2 5,505 23.9
EBIDTA 254 155 63.8 (88) -
% 3.8 2.3 (1.6)
PAT 158 109 44.9 80 97.5
UBL Ltd - Nov 08, 2017 Particulars ( ` cr) 2QFY18E 2QFY17 y-o-y (%) 1QFY18 q-o-q (%)
Sales 1,119 1,038 7.9 1,674 (33.2)
EBIDTA 125 121 3.4 318 (60.9)
% 11.2 11.7 19.1
PAT 31 27 14.8 162 (80.8)
Ashok Leyland Ltd - Nov 08, 2017 Particulars ( ` cr) 2QFY18E 2QFY17 y-o-y (%) 1QFY18 q-o-q (%)
Sales 6,177 4,622 33.7 4,237 45.8
EBIDTA 680 536 26.9 290 134
% 11.1 11.6 6.9
PAT 383 294 30.3 111 245
www.angelbroking.com
Market Outlook November 07, 2017
www.angelbroking.com
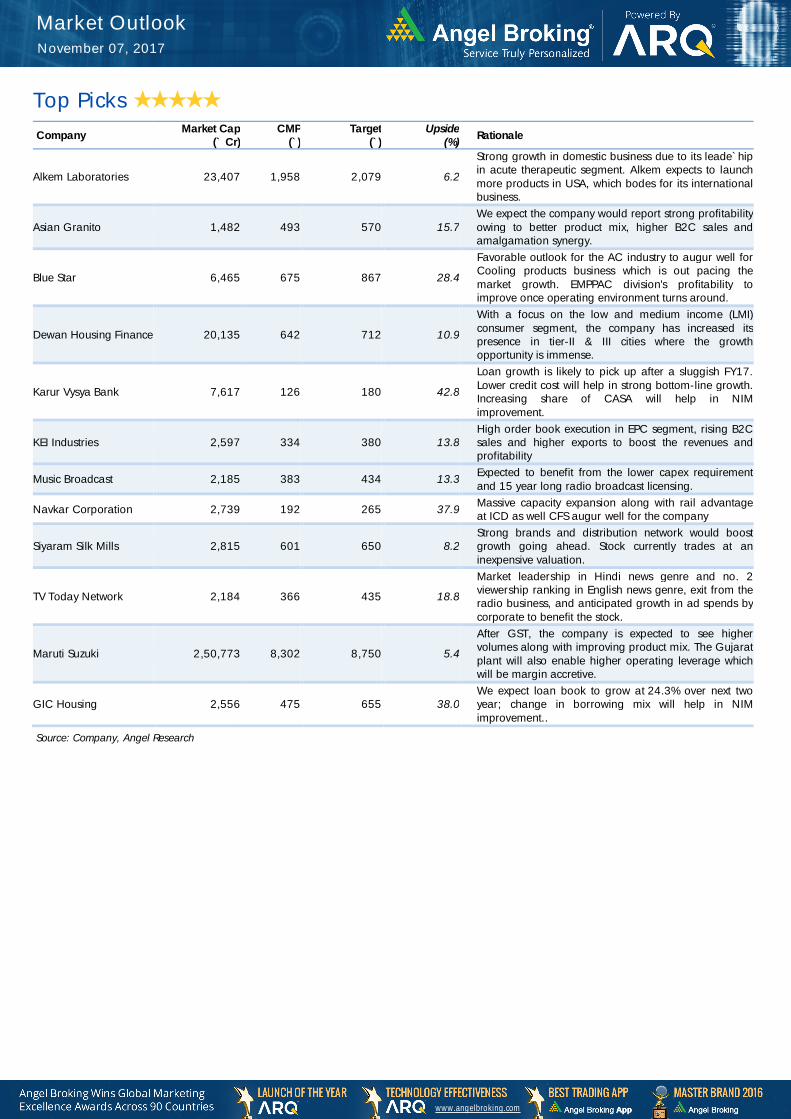
Top Picks HHHHH Company
Market Cap(` Cr)
CMP (`)
Target (`)
Upside (%)
Rationale
Alkem Laboratories 23,407 1,958 2,079 6.2
Strong growth in domestic business due to its leade`hip in acute therapeutic segment. Alkem expects to launch more products in USA, which bodes for its international business.
Asian Granito 1,482 493 570 15.7 We expect the company would report strong profitability owing to better product mix, higher B2C sales and amalgamation synergy.
Blue Star 6,465 675 867 28.4
Favorable outlook for the AC industry to augur well for Cooling products business which is out pacing the market growth. EMPPAC division's profitability to improve once operating environment turns around.
Dewan Housing Finance 20,135 642 712 10.9
With a focus on the low and medium income (LMI) consumer segment, the company has increased its presence in tier-II & III cities where the growth opportunity is immense.
Karur Vysya Bank 7,617 126 180 42.8
Loan growth is likely to pick up after a sluggish FY17. Lower credit cost will help in strong bottom-line growth. Increasing share of CASA will help in NIM improvement.
KEI Industries 2,597 334 380 13.8 High order book execution in EPC segment, rising B2C sales and higher exports to boost the revenues and profitability
Music Broadcast 2,185 383 434 13.3 Expected to benefit from the lower capex requirement and 15 year long radio broadcast licensing.
Navkar Corporation 2,739 192 265 37.9 Massive capacity expansion along with rail advantage at ICD as well CFS augur well for the company
Siyaram Silk Mills 2,815 601 650 8.2 Strong brands and distribution network would boost growth going ahead. Stock currently trades at an inexpensive valuation.
TV Today Network 2,184 366 435 18.8
Market leadership in Hindi news genre and no. 2 viewership ranking in English news genre, exit from the radio business, and anticipated growth in ad spends by corporate to benefit the stock.
Maruti Suzuki 2,50,773 8,302 8,750 5.4
After GST, the company is expected to see higher volumes along with improving product mix. The Gujarat plant will also enable higher operating leverage which will be margin accretive.
GIC Housing
2,556 475 655 38.0 We expect loan book to grow at 24.3% over next two year; change in borrowing mix will help in NIM improvement..
Source: Company, Angel Research

www.angelbroking.com
Market Outlook November 07, 2017
www.angelbroking.com
Key Upcoming Events
Result Calendar
Date Company
November 07, 2017 BHEL, IOB, GlaxoSmith Con, Finolex Cables, Jyothy Laboratories, Cipla, Alembic Pharma, Indoco Remedies
November 08, 2017 Bharat Forge, Ashok Leyland, Thermax, J K Lakshmi Cements, Oriental Bank, Electrosteel Castings, Petronet LNG, ITD
Source: Bloomberg, Angel Research
Global economic events release calendar
Date Time Country Event Description Unit Period Bloomberg Data
Last Reported Estimated
Nov 08, 2017 China Exports YoY% % Change Oct 8.10 7.20
Nov 09, 2017 7:00 AMChina Consumer Price Index (YoY) % Change Oct 1.60 1.70
7:00 PMUS Initial Jobless claims Thousands Nov 4 229.00 231.50
Nov 10, 2017 3:00 PMUK Industrial Production (YoY) % Change Sep 1.60 1.90
India Exports YoY% % Change Oct 25.67
Nov 13, 2017 5:30 PMIndia Industrial Production YoY % Change Sep 4.30 3.60
India Imports YoY% % Change Oct 18.09
Nov 14, 2017 3:30 PMEuro Zone Euro-Zone GDP s.a. (QoQ) % Change 3Q P 0.60
7:30 AMChina Industrial Production (YoY) % Change Oct 6.60 6.30
3:00 PMUK CPI (YoY) % Change Oct 3.00
12:00 PMIndia Monthly Wholesale Prices YoY% % Change Oct 2.60
US Producer Price Index (mom) % Change Oct 0.80
12:30 PMGermany GDP nsa (YoY) % Change 3Q P 0.80
Nov 15, 2017 3:00 PMUK Jobless claims change % Change Oct 1.70
7:00 PMUS Consumer price index (mom) % Change Oct 0.50 0.10
Source: Bloomberg, Angel Research
www.angelbroking.com
Market Outlook November 07, 2017
www.angelbroking.com
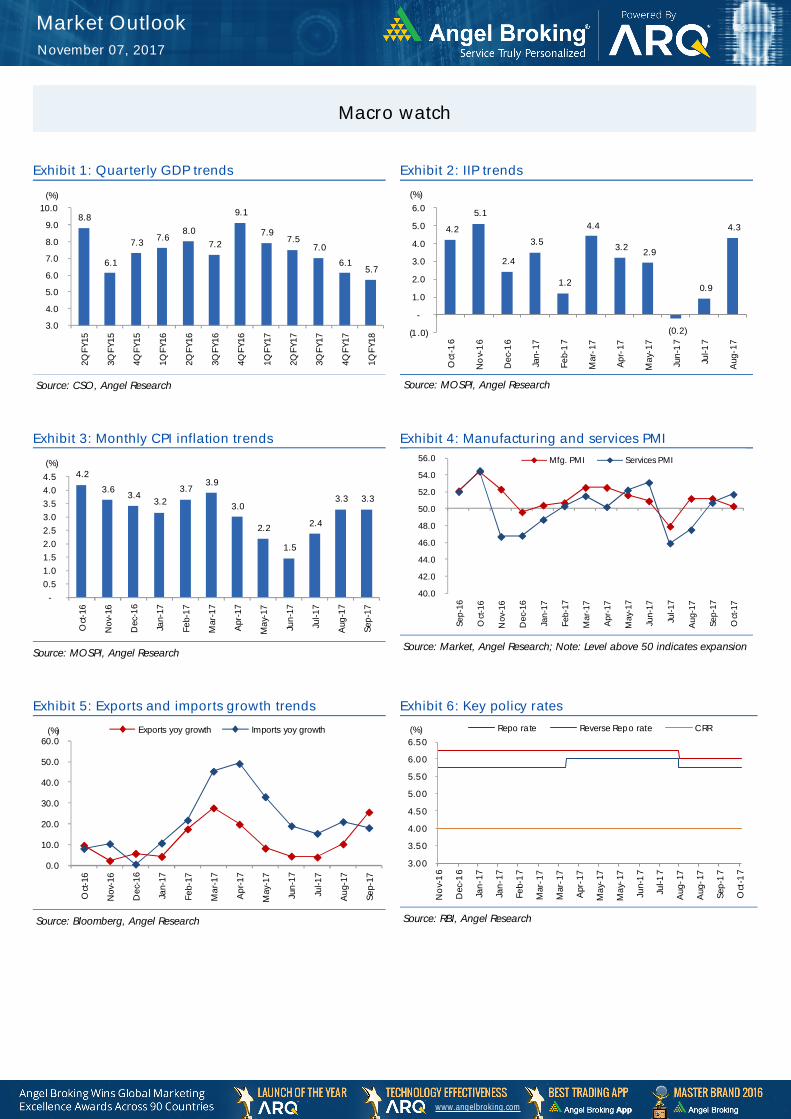
Macro watch
Exhibit 1: Quarterly GDP trends
Source: CSO, Angel Research
Exhibit 2: IIP trends
Source: MOSPI, Angel Research
Exhibit 3: Monthly CPI inflation trends
Source: MOSPI, Angel Research
Exhibit 4: Manufacturing and services PMI
Source: Market, Angel Research; Note: Level above 50 indicates expansion
Exhibit 5: Exports and imports growth trends
Source: Bloomberg, Angel Research
Exhibit 6: Key policy rates
Source: RBI, Angel Research
8.8
6.1
7.3 7.6 8.0
7.2
9.1
7.9 7.5
7.0
6.1 5.7
3.0
4.0
5.0
6.0
7.0
8.0
9.0
10.0
2QFY
15
3QFY
15
4QFY
15
1QFY
16
2QFY
16
3QFY
16
4QFY
16
1QFY
17
2QFY
17
3QFY
17
4QFY
17
1QFY
18
(%)
4.2
5.1
2.4
3.5
1.2
4.4
3.2 2.9
(0.2)
0.9
4.3
(1.0)
-
1.0
2.0
3.0
4.0
5.0
6.0
Oct
-16
No
v-1
6
Dec
-16
Jan-
17
Feb-
17
Mar
-17
Apr
-17
May
-17
Jun-
17
Jul-1
7
Aug
-17
(%)
4.2
3.6 3.4
3.2 3.7
3.9
3.0
2.2
1.5
2.4
3.3 3.3
-
0.5
1.0
1.5
2.0
2.5
3.0
3.5
4.0
4.5
Oct
-16
Nov
-16
Dec
-16
Jan-
17
Feb-
17
Mar
-17
Apr
-17
May
-17
Jun-
17
Jul-1
7
Aug
-17
Sep-
17
(%)
40.0
42.0
44.0
46.0
48.0
50.0
52.0
54.0
56.0 Se
p-16
Oct
-16
Nov
-16
Dec
-16
Jan-
17
Feb-
17
Mar
-17
Apr
-17
May
-17
Jun-
17
Jul-1
7
Aug
-17
Sep-
17
Oct
-17
Mfg. PMI Services PMI
0.0
10.0
20.0
30.0
40.0
50.0
60.0
Oct
-16
Nov
-16
Dec
-16
Jan-
17
Feb-
17
Mar
-17
Apr
-17
May
-17
Jun-
17
Jul-1
7
Aug
-17
Sep-
17
Exports yoy growth Imports yoy growth(%)
3.00
3.50
4.00
4.50
5.00
5.50
6.00
6.50
No
v-1
6
Dec
-16
Jan-
17
Jan-
17
Feb-
17
Mar
-17
Mar
-17
Apr
-17
May
-17
May
-17
Jun-
17
Jul-1
7
Aug
-17
Aug
-17
Sep-
17
Oct
-17
Repo rate Reverse Repo rate CRR(%)
www.angelbroking.com
Market Outlook November 07, 2017
www.angelbroking.com
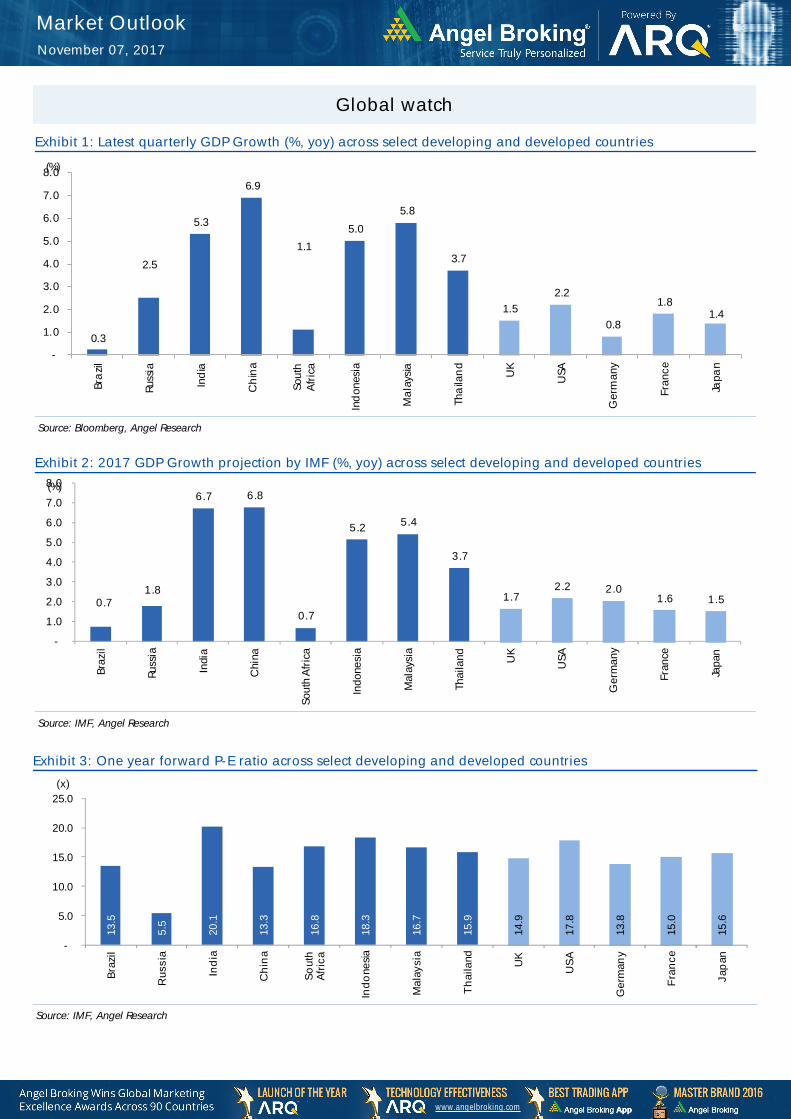
Global watch
Exhibit 1: Latest quarterly GDP Growth (%, yoy) across select developing and developed countries
Source: Bloomberg, Angel Research
Exhibit 2: 2017 GDP Growth projection by IMF (%, yoy) across select developing and developed countries
Source: IMF, Angel Research
Exhibit 3: One year forward P-E ratio across select developing and developed countries
Source: IMF, Angel Research
0.3
2.5
5.3
6.9
1.1
5.0
5.8
3.7
1.5 2.2
0.8
1.8 1.4
-
1.0
2.0
3.0
4.0
5.0
6.0
7.0
8.0
Bra
zil
Russ
ia
Ind
ia
Ch
ina
Sout
hA
fric
a
Ind
ones
ia
Ma
lays
ia
Tha
ilan
d
UK
USA
Ger
man
y
Fran
ce
Japa
n
(%)
0.7 1.8
6.7 6.8
0.7
5.2 5.4
3.7
1.7 2.2 2.0
1.6 1.5
-
1.0
2.0
3.0
4.0
5.0
6.0
7.0
8.0
Braz
il
Russ
ia
Indi
a
Chi
na
Sout
h A
fric
a
Indo
nesi
a
Mal
aysi
a
Thai
land UK
USA
Ger
man
y
Fran
ce
Japa
n
(%)
13.5
5.5
20.1
13.3
16.8
18.3
16.7
15.9
14.9
17.8
13.8
15.0
15.6
-
5.0
10.0
15.0
20.0
25.0
Braz
il
Rus
sia
Indi
a
Chi
na
Sout
h Af
rica
Indo
nesia
Mal
aysi
a
Thai
land UK
USA
Ger
man
y
Fran
ce
Japa
n
(x)
www.angelbroking.com
Market Outlook November 07, 2017
www.angelbroking.com
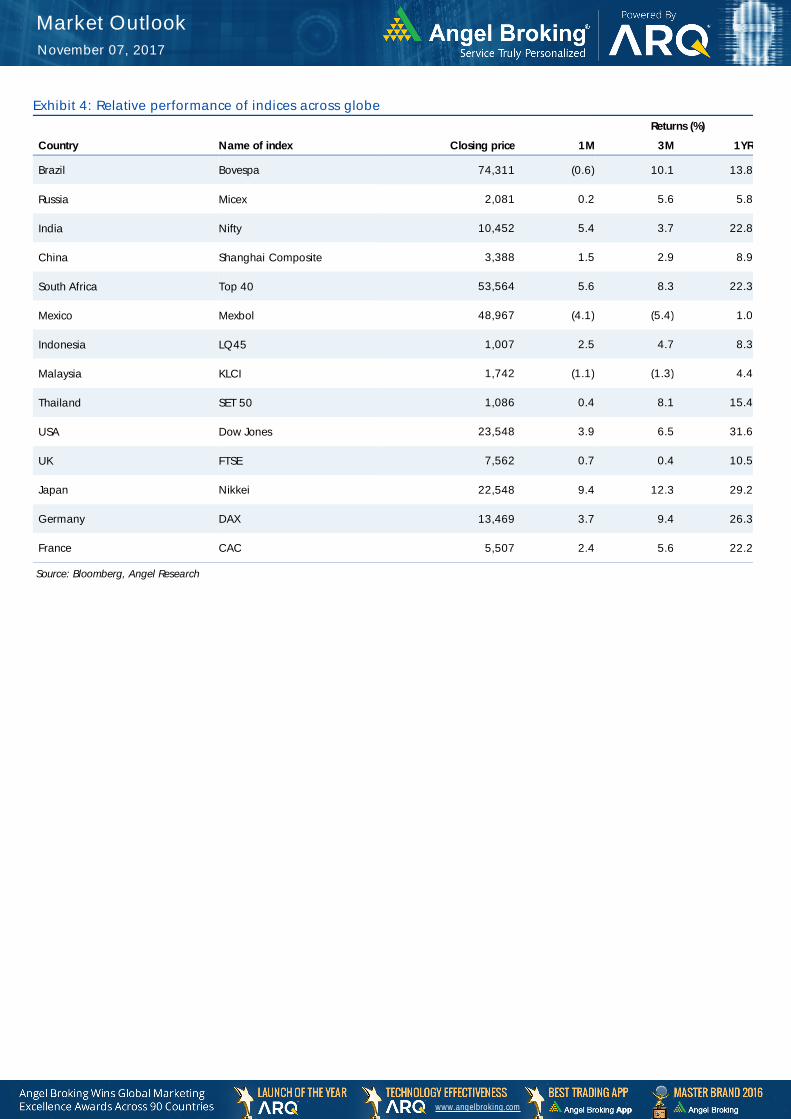
Exhibit 4: Relative performance of indices across globe
Returns (%)
Country Name of index Closing price 1M 3M 1YR
Brazil Bovespa 74,311 (0.6) 10.1 13.8
Russia Micex 2,081 0.2 5.6 5.8
India Nifty 10,452 5.4 3.7 22.8
China Shanghai Composite 3,388 1.5 2.9 8.9
South Africa Top 40 53,564 5.6 8.3 22.3
Mexico Mexbol 48,967 (4.1) (5.4) 1.0
Indonesia LQ45 1,007 2.5 4.7 8.3
Malaysia KLCI 1,742 (1.1) (1.3) 4.4
Thailand SET 50 1,086 0.4 8.1 15.4
USA Dow Jones 23,548 3.9 6.5 31.6
UK FTSE 7,562 0.7 0.4 10.5
Japan Nikkei 22,548 9.4 12.3 29.2
Germany DAX 13,469 3.7 9.4 26.3
France CAC 5,507 2.4 5.6 22.2
Source: Bloomberg, Angel Research p68in4
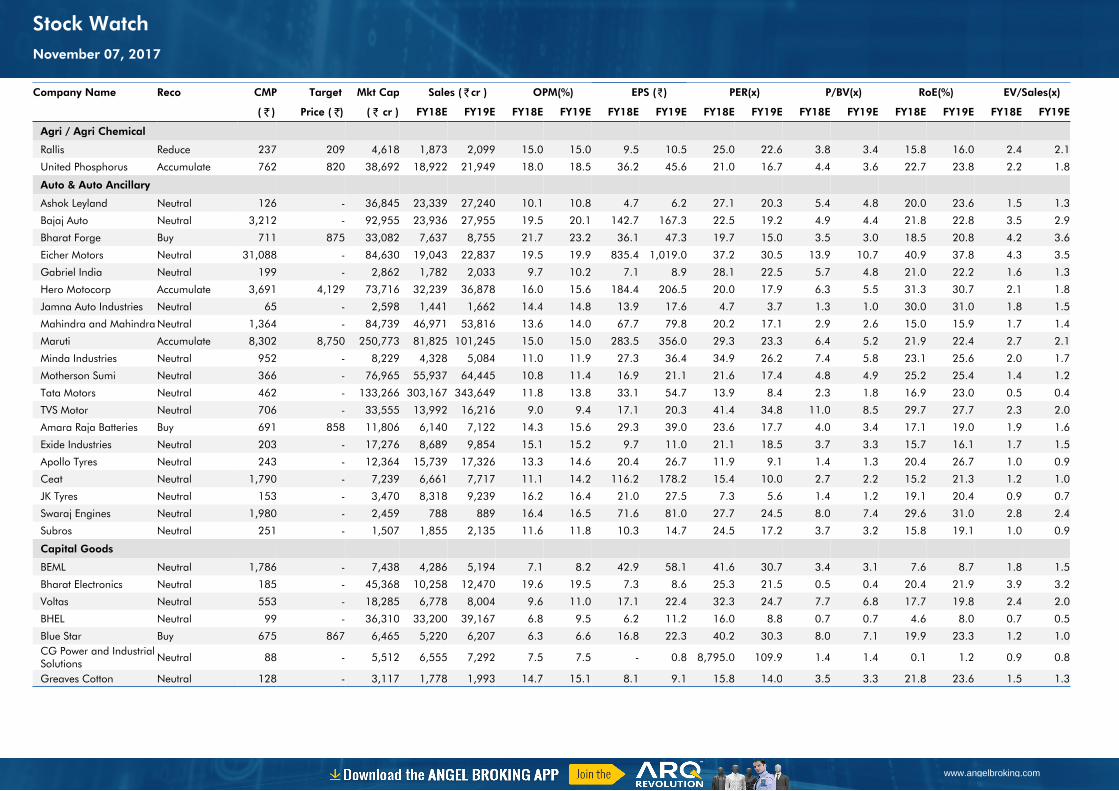
Company Name Reco CMP Target Mkt Cap Sales ( ₹cr ) OPM(%) EPS (₹) PER(x) P/BV(x) RoE(%) EV/Sales(x)
( ₹ ) Price ( ₹) ( ₹ cr ) FY18E FY19E FY18E FY19E FY18E FY19E FY18E FY19E FY18E FY19E FY18E FY19E FY18E FY19E
Agri / Agri Chemical
Rallis Reduce 237 209 4,618 1,873 2,099 15.0 15.0 9.5 10.5 25.0 22.6 3.8 3.4 15.8 16.0 2.4 2.1
United Phosphorus Accumulate 762 820 38,692 18,922 21,949 18.0 18.5 36.2 45.6 21.0 16.7 4.4 3.6 22.7 23.8 2.2 1.8
Auto & Auto Ancillary
Ashok Leyland Neutral 126 - 36,845 23,339 27,240 10.1 10.8 4.7 6.2 27.1 20.3 5.4 4.8 20.0 23.6 1.5 1.3
Bajaj Auto Neutral 3,212 - 92,955 23,936 27,955 19.5 20.1 142.7 167.3 22.5 19.2 4.9 4.4 21.8 22.8 3.5 2.9
Bharat Forge Buy 711 875 33,082 7,637 8,755 21.7 23.2 36.1 47.3 19.7 15.0 3.5 3.0 18.5 20.8 4.2 3.6
Eicher Motors Neutral 31,088 - 84,630 19,043 22,837 19.5 19.9 835.4 1,019.0 37.2 30.5 13.9 10.7 40.9 37.8 4.3 3.5
Gabriel India Neutral 199 - 2,862 1,782 2,033 9.7 10.2 7.1 8.9 28.1 22.5 5.7 4.8 21.0 22.2 1.6 1.3
Hero Motocorp Accumulate 3,691 4,129 73,716 32,239 36,878 16.0 15.6 184.4 206.5 20.0 17.9 6.3 5.5 31.3 30.7 2.1 1.8
Jamna Auto Industries Neutral 65 - 2,598 1,441 1,662 14.4 14.8 13.9 17.6 4.7 3.7 1.3 1.0 30.0 31.0 1.8 1.5
Mahindra and Mahindra Neutral 1,364 - 84,739 46,971 53,816 13.6 14.0 67.7 79.8 20.2 17.1 2.9 2.6 15.0 15.9 1.7 1.4
Maruti Accumulate 8,302 8,750 250,773 81,825 101,245 15.0 15.0 283.5 356.0 29.3 23.3 6.4 5.2 21.9 22.4 2.7 2.1
Minda Industries Neutral 952 - 8,229 4,328 5,084 11.0 11.9 27.3 36.4 34.9 26.2 7.4 5.8 23.1 25.6 2.0 1.7
Motherson Sumi Neutral 366 - 76,965 55,937 64,445 10.8 11.4 16.9 21.1 21.6 17.4 4.8 4.9 25.2 25.4 1.4 1.2
Tata Motors Neutral 462 - 133,266 303,167 343,649 11.8 13.8 33.1 54.7 13.9 8.4 2.3 1.8 16.9 23.0 0.5 0.4
TVS Motor Neutral 706 - 33,555 13,992 16,216 9.0 9.4 17.1 20.3 41.4 34.8 11.0 8.5 29.7 27.7 2.3 2.0
Amara Raja Batteries Buy 691 858 11,806 6,140 7,122 14.3 15.6 29.3 39.0 23.6 17.7 4.0 3.4 17.1 19.0 1.9 1.6
Exide Industries Neutral 203 - 17,276 8,689 9,854 15.1 15.2 9.7 11.0 21.1 18.5 3.7 3.3 15.7 16.1 1.7 1.5
Apollo Tyres Neutral 243 - 12,364 15,739 17,326 13.3 14.6 20.4 26.7 11.9 9.1 1.4 1.3 20.4 26.7 1.0 0.9
Ceat Neutral 1,790 - 7,239 6,661 7,717 11.1 14.2 116.2 178.2 15.4 10.0 2.7 2.2 15.2 21.3 1.2 1.0
JK Tyres Neutral 153 - 3,470 8,318 9,239 16.2 16.4 21.0 27.5 7.3 5.6 1.4 1.2 19.1 20.4 0.9 0.7
Swaraj Engines Neutral 1,980 - 2,459 788 889 16.4 16.5 71.6 81.0 27.7 24.5 8.0 7.4 29.6 31.0 2.8 2.4
Subros Neutral 251 - 1,507 1,855 2,135 11.6 11.8 10.3 14.7 24.5 17.2 3.7 3.2 15.8 19.1 1.0 0.9
Capital Goods
BEML Neutral 1,786 - 7,438 4,286 5,194 7.1 8.2 42.9 58.1 41.6 30.7 3.4 3.1 7.6 8.7 1.8 1.5
Bharat Electronics Neutral 185 - 45,368 10,258 12,470 19.6 19.5 7.3 8.6 25.3 21.5 0.5 0.4 20.4 21.9 3.9 3.2
Voltas Neutral 553 - 18,285 6,778 8,004 9.6 11.0 17.1 22.4 32.3 24.7 7.7 6.8 17.7 19.8 2.4 2.0
BHEL Neutral 99 - 36,310 33,200 39,167 6.8 9.5 6.2 11.2 16.0 8.8 0.7 0.7 4.6 8.0 0.7 0.5
Blue Star Buy 675 867 6,465 5,220 6,207 6.3 6.6 16.8 22.3 40.2 30.3 8.0 7.1 19.9 23.3 1.2 1.0CG Power and Industrial Solutions Neutral 88 - 5,512 6,555 7,292 7.5 7.5 - 0.8 8,795.0 109.9 1.4 1.4 0.1 1.2 0.9 0.8
Greaves Cotton Neutral 128 - 3,117 1,778 1,993 14.7 15.1 8.1 9.1 15.8 14.0 3.5 3.3 21.8 23.6 1.5 1.3
www.angelbroking.com
Stock WatchNovember 07, 2017

Company Name Reco CMP Target Mkt Cap Sales ( ₹cr ) OPM(%) EPS (₹) PER(x) P/BV(x) RoE(%) EV/Sales(x)
( ₹ ) Price ( ₹) ( ₹ cr ) FY18E FY19E FY18E FY19E FY18E FY19E FY18E FY19E FY18E FY19E FY18E FY19E FY18E FY19E
Capital Goods
KEC International Accumulate 316 350 8,112 9,779 11,113 9.4 9.8 14.2 18.2 22.2 17.3 4.3 3.5 21.1 22.1 1.1 1.0
KEI Industries Accumulate 334 380 2,597 3,001 3,391 10.0 10.0 13.0 16.1 25.7 20.7 4.7 3.9 18.2 18.7 1.0 0.9
Thermax Neutral 969 - 11,550 4,125 4,747 10.3 10.8 26.7 31.5 36.3 30.8 4.1 3.7 11.2 12.0 2.5 2.2
VATech Wabag Accumulate 593 681 3,239 3,867 4,126 9.6 10.0 34.9 39.8 17.0 14.9 2.8 2.4 17.7 17.5 0.9 0.8
Cement
ACC Neutral 1,797 - 33,743 12,255 13,350 13.5 14.3 58.0 66.2 31.0 27.1 3.7 3.4 11.5 12.2 2.7 2.5
Ambuja Cements Neutral 280 - 55,648 10,250 11,450 17.5 19.0 7.2 8.3 38.9 33.8 2.8 2.6 7.0 7.8 5.2 4.6
India Cements Neutral 182 - 5,621 6,135 6,750 14.8 15.2 8.5 11.5 21.5 15.9 1.1 1.0 4.8 6.2 1.3 1.1
JK Cement Neutral 1,000 - 6,990 4,150 4,775 19.2 20.0 49.0 63.5 20.4 15.8 3.2 2.8 17.0 18.5 2.1 1.8
J K Lakshmi Cement Neutral 442 - 5,202 3,422 3,757 15.5 17.0 13.5 23.2 32.8 19.1 3.4 2.9 10.8 15.5 1.9 1.7
Orient Cement Neutral 177 - 3,623 2,215 3,233 16.8 17.0 5.9 6.9 30.0 25.6 2.3 2.1 10.8 10.1 2.6 1.8
UltraTech Cement Neutral 4,421 - 121,362 28,250 35,150 20.2 23.5 77.5 122.2 57.0 36.2 4.8 4.4 9.6 14.8 4.8 3.8
Construction
KNR Constructions Neutral 271 - 3,816 1,846 2,203 14.5 14.5 12.1 13.7 22.4 19.9 1.2 1.1 17.5 16.7 2.1 1.8
Larsen & Toubro Neutral 1,223 - 171,280 95,787 109,476 10.2 11.6 44.5 50.8 27.5 24.1 3.4 3.2 12.9 13.1 2.3 2.1
Gujarat Pipavav Port Neutral 136 - 6,558 739 842 61.6 62.7 5.1 6.2 26.6 22.1 3.3 3.2 12.7 14.9 8.3 7.2
PNC Infratech Neutral 197 - 5,045 2,040 2,935 13.0 13.0 6.4 9.0 30.7 21.9 0.8 0.7 9.7 12.2 2.5 1.8
Simplex Infra Neutral 544 - 2,692 6,012 6,619 11.6 11.7 21.1 31.0 25.9 17.6 1.8 1.6 6.5 8.6 1.0 0.9
Sadbhav Engineering Neutral 311 - 5,329 3,823 4,426 10.7 10.8 10.3 11.8 30.2 26.3 3.6 3.2 10.1 10.5 1.7 1.5
NBCC Neutral 264 - 23,756 9,099 12,706 6.4 6.4 7.3 9.6 36.3 27.6 1.6 1.3 27.5 30.5 2.5 1.8
MEP Infra Neutral 103 - 1,668 2,403 2,910 18.3 16.8 2.4 6.1 43.6 16.9 16.6 11.2 35.2 55.8 1.9 1.5
SIPL Neutral 123 - 4,317 2,060 2,390 46.8 47.7 (5.8) (3.1) 4.6 5.2 (14.2) (2.3) 6.9 6.4
Engineers India Neutral 189 - 12,729 1,795 2,611 21.1 22.4 5.9 8.1 32.0 23.3 2.3 2.2 12.9 16.1 5.5 3.6
Financials
Axis Bank Accumulate 534 580 127,924 32,558 35,843 3.5 3.2 27.8 41.0 19.2 13.0 2.1 1.8 11.4 14.9 - -
Bank of Baroda Neutral 172 - 39,632 22,533 26,079 2.4 2.4 12.0 20.9 14.3 8.2 0.9 0.9 6.6 11.0 - -
Canara Bank Neutral 406 - 24,256 17,925 20,235 2.0 2.1 18.5 36.5 22.0 11.1 0.8 0.8 3.4 6.2 - -
Can Fin Homes Neutral 456 - 6,074 586 741 3.5 3.5 107.8 141.0 4.2 3.2 0.9 0.8 24.1 25.6 - -Cholamandalam Inv. & Fin. Co. Neutral 1,266 - 19,780 2,826 3,307 6.3 6.3 53.7 64.6 23.6 19.6 4.0 3.4 18.3 18.9 - -
Dewan Housing Finance Accumulate 642 712 20,135 2,676 3,383 2.4 2.7 37.4 49.7 17.2 12.9 2.3 2.0 13.8 16.2 - -
Equitas Holdings Buy 144 235 4,894 1,125 1,380 9.6 9.8 1.5 6.0 96.3 24.1 2.2 2.0 2.4 8.2 - -
Federal Bank Accumulate 117 125 22,723 4,896 5,930 2.8 3.1 5.4 7.6 21.7 15.4 1.9 1.7 8.5 11.0 - -
www.angelbroking.com
Stock WatchNovember 07, 2017

Company Name Reco CMP Target Mkt Cap Sales ( ₹cr ) OPM(%) EPS (₹) PER(x) P/BV(x) RoE(%) EV/Sales(x)
( ₹ ) Price ( ₹) ( ₹ cr ) FY18E FY19E FY18E FY19E FY18E FY19E FY18E FY19E FY18E FY19E FY18E FY19E FY18E FY19E
Financials
GIC Housing Buy 475 655 2,556 376 477 3.6 3.7 33.0 40.0 14.4 11.9 2.6 2.2 20.0 23.0 - -
HDFC Bank Neutral 1,831 - 473,130 55,236 63,253 4.5 4.4 68.9 82.4 26.6 22.2 4.6 3.8 18.7 18.5 - -
ICICI Bank Neutral 316 - 202,846 42,361 51,378 3.6 3.9 18.4 25.7 17.2 12.3 1.9 1.8 11.3 15.0 - -
Karur Vysya Bank Buy 126 180 7,617 3,289 3,630 3.7 3.9 10.8 14.1 11.6 9.0 1.4 1.2 12.5 14.7 - -
LIC Housing Finance Neutral 607 - 30,620 4,895 6,332 3.4 3.7 50.7 66.8 12.0 9.1 2.4 2.0 21.7 23.8 - -
Punjab Natl.Bank Neutral 201 - 42,804 23,708 25,758 2.1 2.1 5.9 16.4 34.2 12.3 1.0 1.0 3.0 8.3 - -
RBL Bank Neutral 518 - 21,411 2,309 2,888 2.6 2.5 16.4 19.1 31.7 27.2 4.0 3.5 13.3 13.8 - -
Repco Home Finance Buy 614 825 3,840 496 597 4.4 4.2 38.5 48.7 16.0 12.6 2.9 2.4 19.6 20.6 - -
South Ind.Bank Neutral 31 - 5,648 3,195 3,567 3.0 3.1 3.0 3.8 10.4 8.2 1.0 0.9 10.5 11.9 - -
St Bk of India Neutral 329 - 283,951 105,827 121,056 2.4 2.5 16.1 25.6 20.4 12.9 1.6 1.5 6.6 9.9 - -
Union Bank Neutral 176 - 12,814 14,650 16,225 2.3 2.3 23.1 32.5 7.6 5.4 0.6 0.5 7.1 9.2 - -
Yes Bank Neutral 320 - 73,284 11,088 13,138 3.0 2.9 84.0 99.3 3.8 3.2 0.6 0.5 16.3 16.8 - -
FMCG
Akzo Nobel India Neutral 1,840 - 8,825 3,164 3,607 13.8 13.7 58.6 67.9 31.4 27.1 7.7 6.8 24.5 25.1 2.6 2.3
Asian Paints Neutral 1,162 - 111,497 17,603 20,615 18.6 18.6 2,128.9 2,543.3 0.6 0.5 11.5 9.7 28.0 28.9 6.1 5.2
Britannia Neutral 4,650 - 55,832 9,690 11,278 14.8 15.4 84.0 101.0 55.4 46.0 20.2 16.0 40.6 39.0 5.7 4.9
Colgate Neutral 1,044 - 28,394 4,420 5,074 24.9 25.3 28.6 32.8 36.5 31.8 14.4 11.6 43.8 40.5 6.2 5.3
Dabur India Neutral 343 - 60,420 8,346 9,344 19.6 19.9 7.8 9.0 44.0 38.1 8.9 8.0 25.2 24.8 6.8 6.0
GlaxoSmith Con* Neutral 5,510 - 23,171 5,072 5,760 18.2 18.4 176.3 199.2 31.3 27.7 6.6 6.0 21.2 21.7 3.9 3.4
Godrej Consumer Neutral 970 - 66,109 10,171 11,682 20.8 21.5 21.7 27.1 44.7 35.8 10.1 8.6 22.3 23.4 6.6 5.7
HUL Neutral 1,240 - 268,428 37,077 41,508 20.3 21.8 5,189.9 6,318.5 0.2 0.2 37.8 32.3 74.8 82.0 7.1 6.3
ITC Neutral 265 - 322,535 44,588 49,853 37.0 37.3 9.6 11.0 27.6 24.1 6.8 6.4 25.1 27.3 6.7 6.0
Marico Neutral 314 - 40,463 6,788 7,766 18.5 19.2 7.1 8.5 44.2 36.9 15.5 13.2 36.9 38.0 5.8 5.1
Nestle* Neutral 7,597 - 73,250 10,083 11,182 20.0 20.9 119.7 141.3 63.5 53.8 223.7 204.5 36.7 39.8 6.9 6.2
Tata Global Neutral 234 - 14,775 7,121 7,641 11.9 12.3 6.9 8.0 33.9 29.3 2.3 2.2 6.8 7.2 1.9 1.7Procter & Gamble Hygiene Neutral 8,848 - 28,720 3,034 3,579 27.1 27.7 167.7 198.8 52.8 44.5 14.2 12.2 28.8 29.5 8.9 7.4
IT
HCL Tech^ Buy 849 1,014 121,080 50,009 54,608 22.1 22.1 62.8 67.6 13.5 12.6 3.0 2.6 22.4 20.6 2.1 1.8
Infosys Buy 929 1,120 213,299 70,333 75,960 26.0 26.0 61.7 65.9 15.1 14.1 2.9 2.6 18.9 18.7 2.4 2.2
TCS Neutral 2,667 - 525,513 123,384 134,488 26.1 26.1 133.2 143.7 20.0 18.6 5.5 5.2 27.6 27.8 3.9 3.5
Tech Mahindra Buy 460 533 44,916 31,015 33,496 15.0 15.0 35.6 38.1 12.9 12.1 2.2 2.1 17.0 16.3 1.2 1.1
www.angelbroking.com
Stock WatchNovember 07, 2017
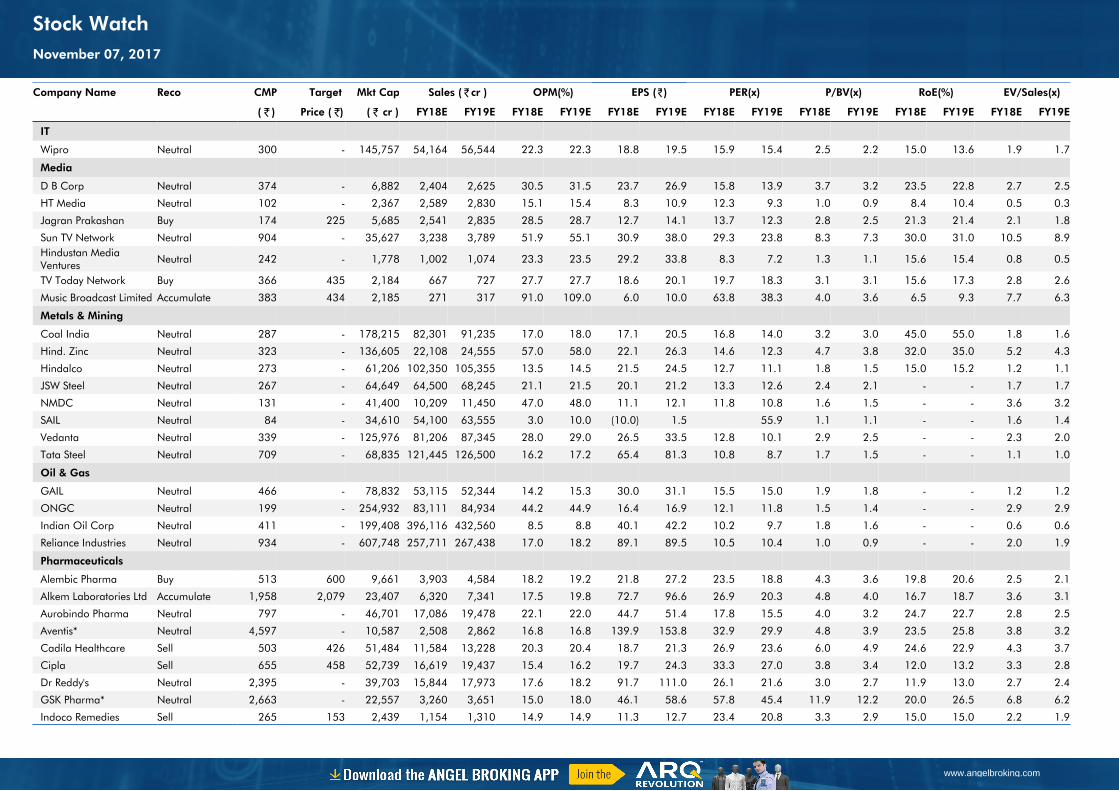
Company Name Reco CMP Target Mkt Cap Sales ( ₹cr ) OPM(%) EPS (₹) PER(x) P/BV(x) RoE(%) EV/Sales(x)
( ₹ ) Price ( ₹) ( ₹ cr ) FY18E FY19E FY18E FY19E FY18E FY19E FY18E FY19E FY18E FY19E FY18E FY19E FY18E FY19E
IT
Wipro Neutral 300 - 145,757 54,164 56,544 22.3 22.3 18.8 19.5 15.9 15.4 2.5 2.2 15.0 13.6 1.9 1.7
Media
D B Corp Neutral 374 - 6,882 2,404 2,625 30.5 31.5 23.7 26.9 15.8 13.9 3.7 3.2 23.5 22.8 2.7 2.5
HT Media Neutral 102 - 2,367 2,589 2,830 15.1 15.4 8.3 10.9 12.3 9.3 1.0 0.9 8.4 10.4 0.5 0.3
Jagran Prakashan Buy 174 225 5,685 2,541 2,835 28.5 28.7 12.7 14.1 13.7 12.3 2.8 2.5 21.3 21.4 2.1 1.8
Sun TV Network Neutral 904 - 35,627 3,238 3,789 51.9 55.1 30.9 38.0 29.3 23.8 8.3 7.3 30.0 31.0 10.5 8.9Hindustan Media Ventures Neutral 242 - 1,778 1,002 1,074 23.3 23.5 29.2 33.8 8.3 7.2 1.3 1.1 15.6 15.4 0.8 0.5
TV Today Network Buy 366 435 2,184 667 727 27.7 27.7 18.6 20.1 19.7 18.3 3.1 3.1 15.6 17.3 2.8 2.6
Music Broadcast Limited Accumulate 383 434 2,185 271 317 91.0 109.0 6.0 10.0 63.8 38.3 4.0 3.6 6.5 9.3 7.7 6.3
Metals & Mining
Coal India Neutral 287 - 178,215 82,301 91,235 17.0 18.0 17.1 20.5 16.8 14.0 3.2 3.0 45.0 55.0 1.8 1.6
Hind. Zinc Neutral 323 - 136,605 22,108 24,555 57.0 58.0 22.1 26.3 14.6 12.3 4.7 3.8 32.0 35.0 5.2 4.3
Hindalco Neutral 273 - 61,206 102,350 105,355 13.5 14.5 21.5 24.5 12.7 11.1 1.8 1.5 15.0 15.2 1.2 1.1
JSW Steel Neutral 267 - 64,649 64,500 68,245 21.1 21.5 20.1 21.2 13.3 12.6 2.4 2.1 - - 1.7 1.7
NMDC Neutral 131 - 41,400 10,209 11,450 47.0 48.0 11.1 12.1 11.8 10.8 1.6 1.5 - - 3.6 3.2
SAIL Neutral 84 - 34,610 54,100 63,555 3.0 10.0 (10.0) 1.5 55.9 1.1 1.1 - - 1.6 1.4
Vedanta Neutral 339 - 125,976 81,206 87,345 28.0 29.0 26.5 33.5 12.8 10.1 2.9 2.5 - - 2.3 2.0
Tata Steel Neutral 709 - 68,835 121,445 126,500 16.2 17.2 65.4 81.3 10.8 8.7 1.7 1.5 - - 1.1 1.0
Oil & Gas
GAIL Neutral 466 - 78,832 53,115 52,344 14.2 15.3 30.0 31.1 15.5 15.0 1.9 1.8 - - 1.2 1.2
ONGC Neutral 199 - 254,932 83,111 84,934 44.2 44.9 16.4 16.9 12.1 11.8 1.5 1.4 - - 2.9 2.9
Indian Oil Corp Neutral 411 - 199,408 396,116 432,560 8.5 8.8 40.1 42.2 10.2 9.7 1.8 1.6 - - 0.6 0.6
Reliance Industries Neutral 934 - 607,748 257,711 267,438 17.0 18.2 89.1 89.5 10.5 10.4 1.0 0.9 - - 2.0 1.9
Pharmaceuticals
Alembic Pharma Buy 513 600 9,661 3,903 4,584 18.2 19.2 21.8 27.2 23.5 18.8 4.3 3.6 19.8 20.6 2.5 2.1
Alkem Laboratories Ltd Accumulate 1,958 2,079 23,407 6,320 7,341 17.5 19.8 72.7 96.6 26.9 20.3 4.8 4.0 16.7 18.7 3.6 3.1
Aurobindo Pharma Neutral 797 - 46,701 17,086 19,478 22.1 22.0 44.7 51.4 17.8 15.5 4.0 3.2 24.7 22.7 2.8 2.5
Aventis* Neutral 4,597 - 10,587 2,508 2,862 16.8 16.8 139.9 153.8 32.9 29.9 4.8 3.9 23.5 25.8 3.8 3.2
Cadila Healthcare Sell 503 426 51,484 11,584 13,228 20.3 20.4 18.7 21.3 26.9 23.6 6.0 4.9 24.6 22.9 4.3 3.7
Cipla Sell 655 458 52,739 16,619 19,437 15.4 16.2 19.7 24.3 33.3 27.0 3.8 3.4 12.0 13.2 3.3 2.8
Dr Reddy's Neutral 2,395 - 39,703 15,844 17,973 17.6 18.2 91.7 111.0 26.1 21.6 3.0 2.7 11.9 13.0 2.7 2.4
GSK Pharma* Neutral 2,663 - 22,557 3,260 3,651 15.0 18.0 46.1 58.6 57.8 45.4 11.9 12.2 20.0 26.5 6.8 6.2
Indoco Remedies Sell 265 153 2,439 1,154 1,310 14.9 14.9 11.3 12.7 23.4 20.8 3.3 2.9 15.0 15.0 2.2 1.9
www.angelbroking.com
Stock WatchNovember 07, 2017

Company Name Reco CMP Target Mkt Cap Sales ( ₹cr ) OPM(%) EPS (₹) PER(x) P/BV(x) RoE(%) EV/Sales(x)
( ₹ ) Price ( ₹) ( ₹ cr ) FY18E FY19E FY18E FY19E FY18E FY19E FY18E FY19E FY18E FY19E FY18E FY19E FY18E FY19E
Pharmaceuticals
Ipca labs Neutral 526 - 6,635 3,593 4,022 14.5 15.5 19.4 25.2 27.1 20.9 2.5 2.2 9.5 11.2 1.9 1.7
Lupin Buy 1,035 1,467 46,747 18,657 21,289 21.3 23.3 52.8 66.7 19.6 15.5 3.0 2.5 16.3 17.5 2.5 2.1
Natco Pharma Accumulate 959 1,057 16,712 1,886 2,016 32.3 29.5 23.2 22.0 41.4 43.5 8.7 7.7 20.9 17.6 8.7 8.1
Sun Pharma Neutral 541 - 129,895 32,899 36,451 26.9 25.4 31.6 32.3 17.1 16.8 3.0 2.6 18.7 18.8 3.6 3.1
Syngene International Accumulate 503 557 10,064 1,402 1,823 32.8 36.0 15.9 20.7 31.7 24.4 5.9 4.9 18.7 20.0 7.2 5.5
Power
Tata Power Neutral 85 - 23,112 32,547 33,806 20.5 20.5 4.7 5.4 18.2 16.0 1.7 1.5 10.5 10.5 1.7 1.6
NTPC Neutral 179 - 147,800 86,070 101,246 28.3 30.7 12.9 16.2 13.9 11.1 1.4 1.3 10.6 12.4 3.1 2.8
Power Grid Accumulate 211 223 110,256 29,183 32,946 89.7 90.0 18.0 20.8 11.7 10.1 2.0 1.7 17.7 18.2 7.7 7.2
Real Estate
Prestige Estate Neutral 299 - 11,205 4,607 5,146 21.0 22.2 7.9 9.8 37.8 30.5 2.3 2.2 10.3 12.0 3.6 3.3
MLIFE Buy 443 522 2,272 487 590 12.3 17.8 21.0 31.2 21.1 14.2 1.1 1.0 5.2 7.4 3.4 2.8
Telecom
Bharti Airtel Neutral 533 - 212,961 97,903 105,233 36.0 36.3 9.3 11.1 57.3 48.2 2.8 2.6 5.0 5.6 3.1 2.8
Idea Cellular Neutral 101 - 36,303 35,012 37,689 27.1 27.7 (4.4) (2.7) 1.6 1.6 (6.8) (4.6) 2.3 2.1
zOthers
Abbott India Neutral 4,376 - 9,298 3,244 3,723 14.9 16.1 167.5 209.4 26.1 20.9 5.8 4.8 23.7 24.8 2.5 2.1
Asian Granito Buy 493 570 1,482 1,169 1,286 12.5 12.5 16.0 19.7 30.8 25.0 3.3 2.9 10.7 11.6 1.5 1.3
Bajaj Electricals Neutral 393 - 3,989 4,646 5,301 6.7 7.6 16.1 22.3 24.4 17.6 4.0 3.4 16.4 19.2 0.9 0.8
Banco Products (India) Neutral 219 - 1,563 1,530 1,695 13.2 12.7 19.0 20.0 11.5 10.9 1.8 1.6 0.2 0.2 0.9 103.5Coffee Day Enterprises Ltd Neutral 221 - 4,553 3,494 3,913 17.4 18.0 4.8 5.7 - 38.8 2.0 1.9 - 0.1 1.8 1.5
Elecon Engineering Neutral 78 - 874 171 201 15.0 16.2 36.0 43.0 2.2 1.8 0.2 0.2 0.1 0.1 4.5 3.8
Garware Wall Ropes Neutral 903 - 1,975 928 1,003 15.2 15.2 39.4 43.2 22.9 20.9 3.8 3.2 16.5 15.4 2.0 1.8
Goodyear India* Neutral 814 - 1,878 1,717 1,866 11.8 12.3 47.9 49.8 17.0 16.4 2.6 2.3 15.6 15.7 0.8 112.9
Hitachi Neutral 2,390 - 6,500 2,355 2,715 10.3 10.8 49.0 60.9 48.8 39.3 11.4 9.0 0.2 0.2 2.8 2.4
HSIL Neutral 436 - 3,152 2,240 2,670 14.6 15.0 17.0 22.0 25.7 19.8 2.1 2.0 0.1 0.1 1.6 1.3
Interglobe Aviation Neutral 1,242 - 44,928 22,570 27,955 14.2 15.0 63.6 81.8 19.6 15.2 10.3 8.7 0.5 0.6 1.7 1.3
Jyothy Laboratories Neutral 391 - 7,097 1,781 2,044 14.1 15.0 9.4 10.5 41.8 37.2 8.9 8.4 0.2 0.2 4.2 3.6
Linc Pen & Plastics Neutral 247 - 365 420 462 9.3 9.3 15.3 17.1 16.1 14.4 2.7 2.8 16.9 19.5 0.9 0.8
M M Forgings Neutral 851 - 1,028 542 642 20.1 21.0 41.6 56.8 20.5 15.0 2.8 2.4 0.1 0.2 2.3 2.0
Mirza International Neutral 162 - 1,949 1,148 1,285 18.0 18.0 8.0 9.4 20.2 17.3 3.3 2.8 16.3 16.1 1.9 1.6
Navkar Corporation Buy 192 265 2,740 561 617 41.5 41.5 11.5 12.7 16.7 15.1 1.8 1.6 10.5 10.4 5.6 4.8
Nilkamal Neutral 1,629 - 2,431 2,317 2,525 11.4 11.1 96.0 105.0 17.0 15.5 2.9 2.5 0.2 0.2 1.0 0.9
www.angelbroking.com
Stock WatchNovember 07, 2017
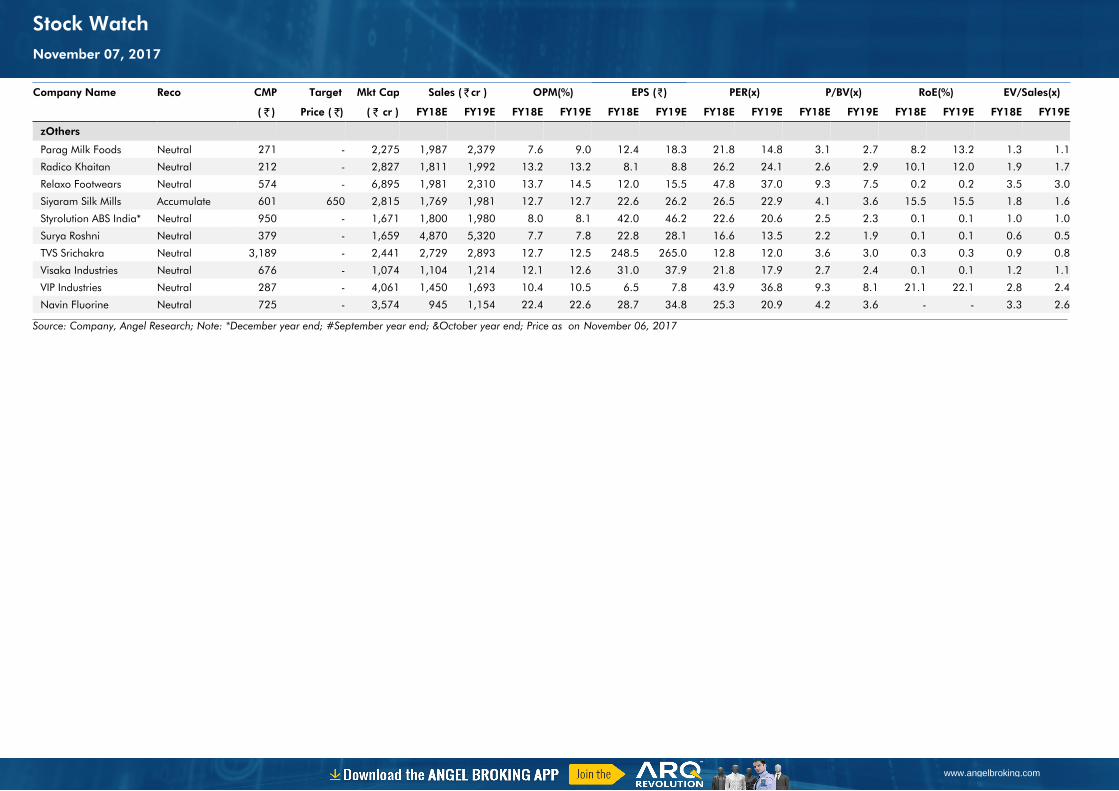
Company Name Reco CMP Target Mkt Cap Sales ( ₹cr ) OPM(%) EPS (₹) PER(x) P/BV(x) RoE(%) EV/Sales(x)
( ₹ ) Price ( ₹) ( ₹ cr ) FY18E FY19E FY18E FY19E FY18E FY19E FY18E FY19E FY18E FY19E FY18E FY19E FY18E FY19E
zOthers
Parag Milk Foods Neutral 271 - 2,275 1,987 2,379 7.6 9.0 12.4 18.3 21.8 14.8 3.1 2.7 8.2 13.2 1.3 1.1
Radico Khaitan Neutral 212 - 2,827 1,811 1,992 13.2 13.2 8.1 8.8 26.2 24.1 2.6 2.9 10.1 12.0 1.9 1.7
Relaxo Footwears Neutral 574 - 6,895 1,981 2,310 13.7 14.5 12.0 15.5 47.8 37.0 9.3 7.5 0.2 0.2 3.5 3.0
Siyaram Silk Mills Accumulate 601 650 2,815 1,769 1,981 12.7 12.7 22.6 26.2 26.5 22.9 4.1 3.6 15.5 15.5 1.8 1.6
Styrolution ABS India* Neutral 950 - 1,671 1,800 1,980 8.0 8.1 42.0 46.2 22.6 20.6 2.5 2.3 0.1 0.1 1.0 1.0
Surya Roshni Neutral 379 - 1,659 4,870 5,320 7.7 7.8 22.8 28.1 16.6 13.5 2.2 1.9 0.1 0.1 0.6 0.5
TVS Srichakra Neutral 3,189 - 2,441 2,729 2,893 12.7 12.5 248.5 265.0 12.8 12.0 3.6 3.0 0.3 0.3 0.9 0.8
Visaka Industries Neutral 676 - 1,074 1,104 1,214 12.1 12.6 31.0 37.9 21.8 17.9 2.7 2.4 0.1 0.1 1.2 1.1
VIP Industries Neutral 287 - 4,061 1,450 1,693 10.4 10.5 6.5 7.8 43.9 36.8 9.3 8.1 21.1 22.1 2.8 2.4
Navin Fluorine Neutral 725 - 3,574 945 1,154 22.4 22.6 28.7 34.8 25.3 20.9 4.2 3.6 - - 3.3 2.6
Source: Company, Angel Research; Note: *December year end; #September year end; &October year end; Price as on November 06, 2017
www.angelbroking.com
Stock WatchNovember 07, 2017
Research Team Tel: 022 - 39357800 E-mail: [email protected] Website: www.angelbroking.com
DISCLAIMER
Angel Broking Private Limited (hereinafter referred to as “Angel”) is a registered Member of National Stock Exchange of India Limited,Bombay Stock Exchange Limited and Metropolitan Stock Exchange Limited. It is also registered as a Depository Participant with CDSL and Portfolio Manager with SEBI. It also has registration with AMFI as a Mutual Fund Distributor. Angel Broking Private Limited is a registered entity with SEBI for Research Analyst in terms of SEBI (Research Analyst) Regulations, 2014 vide registration number INH000000164. Angel or its associates has not been debarred/ suspended by SEBI or any other regulatory authority for accessing /dealing in securities Market. Angel or its associates/analyst has not received any compensation / managed or co-managed public offering of securities of the company covered by Analyst during the past twelve months.
This document is solely for the personal information of the recipient, and must not be singularly used as the basis of any investmentdecision. Nothing in this document should be construed as investment or financial advice. Each recipient of this document should make such investigations as they deem necessary to arrive at an independent evaluation of an investment in the securities of the companies referred to in this document (including the merits and risks involved), and should consult their own advisors to determine the merits and risks of such an investment.
Reports based on technical and derivative analysis center on studying charts of a stock's price movement, outstanding positions andtrading volume, as opposed to focusing on a company's fundamentals and, as such, may not match with a report on a company'sfundamentals. Investors are advised to refer the Fundamental and Technical Research Reports available on our website to evaluate the contrary view, if any.
The information in this document has been printed on the basis of publicly available information, internal data and other reliablesources believed to be true, but we do not represent that it is accurate or complete and it should not be relied on as such, as thisdocument is for general guidance only. Angel Broking Pvt. Limited or any of its affiliates/ group companies shall not be in any wayresponsible for any loss or damage that may arise to any person from any inadvertent error in the information contained in this report.Angel Broking Pvt. Limited has not independently verified all the information contained within this document. Accordingly, we cannottestify, nor make any representation or warranty, express or implied, to the accuracy, contents or data contained within this document.While Angel Broking Pvt. Limited endeavors to update on a reasonable basis the information discussed in this material, there may beregulatory, compliance, or other reasons that prevent us from doing so.
This document is being supplied to you solely for your information, and its contents, information or data may not be reproduced,redistributed or passed on, directly or indirectly.
Neither Angel Broking Pvt. Limited, nor its directors, employees or affiliates shall be liable for any loss or damage that may arise fromor in connection with the use of this information.
www.angelbroking.com
Market OutlookNovember 07, 2017
Related Documents