PATIENTS’ PERCEPTIONS REGARDING NURSING CARE IN THE GENERAL SURGICAL WARDS AT KENYATTA NATIONAL HOSPITAL RESEARCH DISSERTATION SUBMITTED IN PARTIAL FULFILMENT OF THE AWARD OF MASTER OF SCIENCE IN NURSING (MEDICAL- SURGICAL) DEGREE OF THE UNIVERSITY OF NAIROBI BY: ELWIN SHAWA H56/65303/2010 i

Welcome message from author
This document is posted to help you gain knowledge. Please leave a comment to let me know what you think about it! Share it to your friends and learn new things together.
Transcript
PATIENTS’ PERCEPTIONS REGARDING NURSING CARE IN THE
GENERAL SURGICAL WARDS AT KENYATTA NATIONAL HOSPITAL
RESEARCH DISSERTATION SUBMITTED IN PARTIAL FULFILMENT
OF THE AWARD OF MASTER OF SCIENCE IN NURSING (MEDICAL-
SURGICAL) DEGREE OF THE UNIVERSITY OF NAIROBI
BY:
ELWIN SHAWA
H56/65303/2010
i

SEPTEMBER, 2012
2
DECLARATIONI, Elwin Shawa, declare that this research dissertation is my
original work and that is has not been presented in any
institution for an academic award.
Signature: ……………………………………. Date: …………………………………..
i
DEDICATIONI dedicate this research dissertation to my lovely wife, Hilda
Shawa and daughter, Roselyn. You endured the pain of being alone
at home physically throughout this period of my studies but
spiritually, the family bonds grew stronger. You remain my great
inspiration in my life.
ii
CERTIFICATE OF APPROVALThis research dissertation has been supervised and approved by:
Mrs. Lilian A. Omondi, BScN, MScN (Medical-Surgical),
Lecturer, School of Nursing Sciences (University of Nairobi)
Signature: …………………………………….. Date: ………………………………..
Mr. Anthony Ayieko Ong’any, BScN, MSc (Clinical Psychology)
Lecturer, School of Nursing Sciences (University of Nairobi)
Signature: ………………………………………….. Date: ………………………………iii

iv
ACKNOWLEDGEMENTI thank my God for his favour and grace that has enabled me work
on this dissertation. I thank my supervisors; Mrs. Lilian Omondi
and Mr. Anthony Ayieko Ong’any for their endless guidance and
motivation throughout the research process.
I am grateful to the Malawi Government, Ministry of Health for
scholarship to pursue this course. I also thank the management of
Kamuzu College of Nursing, a Constituent college of the
University of Malawi for effectively coordinating the
scholarship.
I am indebted to the entire School of Nursing Sciences,
University of Nairobi staff and my classmates for the support
they have awarded me.
Lastly, I would like to thank my wife, daughter and parents for
spiritual, moral and emotional support throughout the entire
period of my studies.
May God bless you all!
v
TABLE OFCONTENTSDECLARATION..........................................................iDEDICATION..........................................................ii
CERTIFICATE OF APPROVAL............................................iiiACKNOWLEDGEMENT.....................................................iv
TABLE OFCONTENTS.....................................................vTABLES..............................................................ix
FIGURES..............................................................xABBREVATIONS/ACRONYMS...............................................xi
OPERATIONAL DEFINITIONS............................................xiiABSTRACT..........................................................xiii
CHAPTER ONE: INTRODUCTION............................................11.1 BACKGROUND INFORMATION..........................................1
1-2 PROBLEM STATEMENT...............................................3
1.3 STUDY JUSTIFICATION.............................................4
1.4 RESEARCH OBJECTIVES.............................................4
1.4.1 Broad Objective..........................................41.4.2 Specific Objectives......................................41.5 RESEARCH QUESTION...............................................5
1.6 RESEARCH HYPOTHESIS.............................................5
1.7 EXPECTED BENEFITS...............................................5
1.8 THEORETICAL FRAMEWORK......................................51.9 CONCEPTUAL FRAMEWORK............................................8
vi
CHAPTER TWO: LITERATURE REVIEW.......................................92.1 INTRODUCTION....................................................9
2.2 QUALITY OF NURSING CARE.........................................9
2.3 PATIENTS’ SATISFACTION AND EXPECTATIONS WITH NURSING CARE......11
2.4 NURSING ACTIVITIES DURING PREOPERATIVE AND POST OPERATIVE PATIENT
CARE...............................................................14
2.5 SUMMARY........................................................16
CHAPTER THREE: METHODOLOGY.........................................17
3.1 STUDY DESIGN..............................................173.2 STUDY AREA................................................173.4 STUDY POPULATION..........................................173.4.1Inclusion criteria.......................................183.4.2.............................................Exclusion criteria
183.5 SAMPLE SIZE DETERMINATION......................................18
3.6 SAMPLING PROCEDURE.............................................19
3.7 DATA COLLECTION TOOLS..........................................19
3.8 VARIABLES UNDER STUDY..........................................20
3.8.1 Independent variables included;.........................203.8.2 Dependent variable......................................203.8.3 Outcome variables.......................................203.9 RESEARCH ASSISTANT TRAINING....................................20
vii
3.10 DATA QUALITY ASSURANCE...................................203.11 DATA MANAGEMENT AND ANALYSIS.............................213.12 STUDY ASSUMPTIONS.............................................21
3.13 ETHICAL CONSIDERATION.........................................21
3.14 STUDY LIMITATIONS.............................................21
CHAPTER 4: FINDINGS/ RESULTS AND DATA ANALYSIS....................23
4.1 DEMOGRAPHIC FACTORS............................................23
4.2 PATIENTS EXPECTATION OF NURSING................................28
4.3 PATIENTS EXPERIENCES/CHALLENGES................................35
4.4 PATIENTS’ SATISFACTION WITH NURSING CARE........................384.5 PATIENTS’ PERCEPTION OF NURSING CARE............................44
CHAPTER FIVE: DISCUSSION OF THE RESULTS.............................475.0: INTRODUCTION..................................................47
5.1 PATIENTS EXPECTATIONS..........................................47
5.2 PATIENTS’ EXPERIENCES AND CHALLENGES...........................50
5.3 PATIENTS’ SATISFACTION OF NURSING CARE.........................53
5.4 PATIENTS’ PERCEPTIONS..........................................55
5.5 CONCLUSION.....................................................56
5.6 RECOMMENDATION.................................................57
REFERENCES..........................................................59
APPENDICES..........................................................64
viii
APPENDIX I: EXPENDITURE............................................64
APPENDIX II: TIME FRAME GHANT CHART................................65
APPENDIX III: QUESTIONNAIRE FOR DATA COLLECTION....................66
APPENDIX IV: CONSENT EXPLANATION...................................73
APPENDIX V: QUESTIONNAIRE FOR DATA COLLECTION KISWAHILI VERSION...75
APPENDIX VI: CONSENT EXPLANATION KISWAHILI VERSION.................81
APPENDIX VII: LETTER TO NATIONAL COUNCIL FOR SCIENCE AND TECHNOLOGY83
APPENDIX VIII: LETTER TO KENYATTA NATIONAL HOSPITAL ETHICS COMMITTEE
...................................................................84
APPENDIX IX: APPROVAL LETTER FROM UON/KNH ETHICS COMMITTEE.........85APPENDIX X: DUMMY TABLES FOR DATA ANALYSIS........................88
ix
TABLESTable 4.1: Demographic characteristics of the respondentsTable 4.2:Patients’ Mean Responses on patients Expectations by Age distributionTable 4.3:Participants’ mean responses by gender distribution on patients’ expectationsTable 4.4:Patients’ mean responses on patients’ expectations by ReligionTable 4.5: Patients’ mean responses on patients’ expectations bymarital statusTable4.6: Participants’ Responses on the Patients expectation of nursingTable 4.7: Relationship between Patients’ characteristics and Patients ExpectationsTable 4.8:Patients’ mean responses on patients’ experiences by age distribution.Table 4.9: Participants mean responses on patients’ experiences by gender.Table4.10:Participants mean responses on patients’ experiences byreligionTable 4.11: Participants responses on patients’ experiences by marital status.Table 4.12:Participants mean responses on patients’ experiences by level of educationTable4.13 : Participants’ responses on the Patients’ experience/challenges in the wardsTable 4.14 : Patients experiencesTable 4.15: Challenges encountered in the wards
x
Table 4.16: Patients’ characteristics and Experiences and challengesTable 4.17: Participants mean responses on patients’ satisfactionTable 4.18: Responses on the level of satisfaction by gender distributionTable 4.19: Responses on the level of satisfaction by level of education distribution.Table4.20: Patients’ satisfaction with nursing care providedTable 4.21: Relationship between Patients’ characteristics and SatisfactionTable 4.22: Patients Perceptions of quality of nursing careTable 4.23: Patients’ characteristics(age, gender and level of Education) against PerceptionsTable 4.24: Relationship between Patients’ Expectations and Satisfaction
xi
FIGURESFigure4.1 : Average response on Patients’ expectations of nursingcareFigure 4.2: Average Patients responses on Experiences and
Challenge……………………….
xii
ABBREVATIONS/ACRONYMSAMA - American Medical Association
ANA - American Nurses Association
JCAHO - Joint Commission on Accreditation of Healthcare
Organization
KIPPRA - Kenya Institute of Public Policy Research and
Analysis
KMTC - Kenya Medical Training College
KNH - Kenyatta National Hospital
MNH - Muhimbili National Hospital
NNRU - National Nursing Research Unit
PACU - Post Anaesthetic Care Unit
QNC - Quality Nursing Care
SPSS - Statistical Package for Social Sciences
UK - United Kingdom
UON - University of Nairobi
xiii
WHO - World Health Organization
OPERATIONAL DEFINITIONSGeneral Surgical ward: Wards within the surgical department that
admits non-amenity patients requiring emergency or elective
surgical interventions.
Nursing care: Health care services provided by nurses that meet
patients’ physical, psychological and spiritual needs.
Patients’ challenges: Patients’ unmet demands or difficulties
faced while receiving nursing care.
Patients’ expectations: Things those patients anticipate from
nurses as they provide care to patients.
Patients’ experience: Events or observations encountered by
patients while receiving nursing care.
xiv
Patients’ perceptions: Refers to how the patient understands the
way nursing care is provided. It is patient’s representation of
how they view nursing care in their own opinion.
Patients’ satisfaction: It is patient’s feeling of contentment
when their needs and expectations have been met.
Quality nursing care: It is the nursing care that meets patients’
needs and expectations and also meets the professional standards.
xv
ABSTRACTBackground: Nursing care is a major component of the health
services because it is one of the determinants of quality health
services. The anecdotal patients’ care evaluation and media
reports have portrayed negative publicity and image regarding
nursing care in certain hospitals. Patients’ perceptions
regarding nursing care is thought to be the determinant of
quality nursing care.
Aim of the study: To explore patients’ perceptions and
experiences regarding nursing care in surgical wards.
Methods: A descriptive cross-sectional study was conducted at
Kenyatta National Hospital in general surgical wards between
April and June, 2012. The study population was adult
postoperative patients admitted in the general surgical wards
(5A, 5B and 5D). The data collection tool was a structured
questionnaire with open and closed questions. Ethical clearance
was secured from University of Nairobi and Kenyatta National
Hospital Ethics Committee. Participation in the study was
xvi
voluntary and based on patients’ ability to give informed
consent.
Results: A total of 168 adult patients from general surgical
wards were approached and 167 of them participated in the study
(non-response rate of 0.6%). Most patients agreed that they
expected nurses to be knowledgeable with an average response of
86% and strongly disagreed that nurses should be rude and harsh
(44%). The elderly reported that they had a better experience of
pain management than the younger patients (m>3.36). Almost all
patients reported that nurses were usually responding quickly
when they needed pain medication. The elderly were very satisfied
with nursing care with mean response (m>4.00). Most patients
(52.4%) were satisfied with wound dressing. Generally, (50.2%)
with a mean response (m>2.50) were satisfied with nursing care
provided though some complained that nurses were not introducing
themselves (41%), some nurses were rude (16.7%), their privacy
was not respected and nurses were not providing adequate
information. Most participants (40.5%) indicated that they had a
good perception of the nursing care and 22.6% recommended that
xvii
nursing staff should be added and 11.3% reported that quality of
nursing care was poor.
Conclusion and recommendation: Patients’ perceptions were
influenced by how nurses were conducting themselves towards
patients. The need to improve on nurses’ interpersonal skills and
relationship, and behaviour towards patients was recommended.
xviii
CHAPTER ONE: INTRODUCTION
1.1 BACKGROUND INFORMATIONNursing care is a major component of health care services that
helps alleviate anxiety in surgical patients. Negative patients’
perceptions about nursing care add to the stress that they
already have due to surgery. This may also be influenced by what
they expect nurses to be doing for them and nurses behaviour
towards the patients.
It was noted that in highly industrialized countries, some 5000-
9000 major operations are performed per 100,000 people per year,
and the rates in East Africa in early 1990s were in the range of
70-500/100,000 (Nordberg, et.al, 2001). These rates do not
reflect current prevalence of surgical cases admitted in
hospitals, it is expected that the updated prevalence could be
higher. Among the patients admitted in hospitals, it was observed
that hospitalization for surgery is associated with increased
anxiety. It was also shown that post-operative pain and anxiety
continue to be problematic for patients after the surgery (Allen,
et.al, 2002). Therefore, it is expected that nursing care needs
1
to be engaged and should provide individualized care that
acknowledges the emotional, physical, spiritual and environmental
dimensions of patients. A study conducted in Uganda found that
patients’ perceptions of quality nursing care include; human
rights, receiving information, access to services as well as
safety, privacy, respect, politeness, kindness and continuity of
care (Nankhumbi, 2005). According to the Kenya Institute of
Public Policy Research and Analysis (KIPPRA) report (1994) facets
of patients satisfaction range from politeness of providers to
waiting for services (Ojwang, et.al, 2010). The report pointed
out complaints that nurses in Kenya public hospitals were rude,
impolite and offered cold reception.
In the general surgical wards, patients undergo two phases of
nursing care i.e.; preoperative and postoperative nursing care.
Nurses have the duty to meet patients’ needs and expectations
specific to each phase of surgical care. Preoperative phase is
that time during the surgical experiences that begins with client
to have surgery and ends with transfer of patient to operating
unit (White, 2007). In this phase, patients are expected to be
assessed by nurses during the planning of their care, to be2
taught about their condition, treatment options, surgical
procedure, and to be evaluated in anticipation of surgery. The
purpose of preoperative care is to evaluate the patient’s
readiness for surgery, identify potential risks and hazards of
surgery, advise patient about the surgical procedure, prepare
patient for postoperative experiences, plan for home care and
provide emotional support (Pearson & Osborn, 2010).
Postoperative nursing care involves maintaining the airway,
monitoring vital signs, assessing the effects of anaesthetic
agents, assessing patients for complication and providing comfort
and pain relief (Smeltzer & Bare, 2004). This is an immediate
postoperative care which is usually provided in a Postanaesthetic
Care Unit (PACU), which is before the patient is taken back to
the surgical ward. In addition to the immediate postoperative
nursing care, the general postoperative care provided in surgical
ward focuses on promoting the patients’ recovery and initiating
the teaching, follows up care and referrals essential for
recovery and rehabilitation after discharge.
Therefore, the study explored patients perceptions regarding
nursing care provided in surgical wards focusing on preoperative3
and postoperative phases. Understanding the patients’ perceptions
of nursing care provided in surgical wards is very important
because it would assist in identifying strengths and weaknesses
of the type of care provided from patients’ perspective. This
eventually could help in improving the nursing care so as to meet
the satisfaction of the consumers.
1-2 PROBLEM STATEMENTIn the KIPPRA report (1994), the public complained that nurses
were rude and offered cold reception in public hospitals. Another
study conducted in Tanzania at Muhimbili National Hospital (MNH)
revealed that patients were dissatisfied with the attitude of
health professionals (Muhondwa, et.al, 2008). The study further
revealed that nurses treated patients and relatives of
hospitalized patients as inferior. Though, some studies conducted
in Jordan found out that majority of participants had positive
experiences regarding time nurses spent with patients as well as
respect for patients, there were still reports of patients’
dissatisfaction with information provided because they felt the
information given was inadequate (Ahmad & Alasad, 2004). Hence,
it is not only time nurses spent with patients and respect for
4
patients that would determine patients’ perceptions of nursing
care but also other factors such as adequate information about
their condition and treatment, kindness, cheerfulness, and among
others. This could be supported by a study which was conducted in
Ethiopia found that patients had lowest satisfaction with nursing
care in the amount and type of information nurses gave them
(Chaka, 2005).
Nurses’ attitudes towards patients have great influence on
patients’ perceptions of nursing care. Most surgical patients are
anxious and stressed about their surgery. They have a lot of
expectations from nurses about their care. Hence, they require a
lot of information about their conditions, procedures, treatment
options and expectations after surgery. Some unpublished routine
surveys have been done at Kenyatta National Hospital (KNH)
regarding customers care satisfaction in various departments
however; some themes were not adequately addressed. This study
therefore, intended to explore some thematic areas that have not
been addressed such as perceptions and experiences regarding
nursing care.
5
1.3 STUDY JUSTIFICATIONAccording to JCAHO, 2011, and patients’ bill of Rights, patients
have a right to quality care and information regarding their
care. Many health organization and health institutions are
striving to achieve high quality services so as to attract more
consumers. Patients would like to go to institutions that provide
nursing care that is holistic and patient centered. Since
surgical patients have high level of anxiety that would also
affect the overall outcome of their health, nurses need to have
the skills of providing care that would alleviate their anxiety.
Nursing care makes a bigger portion of all health services in
health organizations; therefore, exploring patients’ perceptions
and experiences is crucial in identifying areas of patients’
satisfaction and dissatisfaction. The study would add to the body
of knowledge of nursing discipline in area of patients’
satisfaction. It could also allow nurses to understand what
patients expect from them and also clarifying any misinformation
patients may have regarding nursing care. This would enhance the
image of nursing through behavior modification. It could also
assist nurses to develop nursing care plans that are patient
6
centered because patients expectations and experiences would be
considered. Hence, providing quality nursing care that is
consistent with patients’ expectations while maintaining
standards of nursing in surgical wards. The results may be used
in quality assurance programmes.
1.4 RESEARCH OBJECTIVES
1.4.1 Broad ObjectiveThe broad objective was to explore patients’ perceptions and
experiences regarding nursing care in surgical wards at Kenyatta
National Hospital.
1.4.2 Specific Objectives1. To determine patients’ expectations from nurses about their
care.
2. To determine patients’ experiences encountered while
receiving nursing care.
3. To assess patients’ satisfaction of nursing care in surgical
wards.
1.5 RESEARCH QUESTIONWhy are patients having negative perceptions of nursing care?
7
1.6 RESEARCH HYPOTHESISPatients’ perceptions regarding nursing care are not influenced
by nurses’ attitudes towards their care.
1.7 EXPECTED BENEFITS It would add to the body of knowledge of nursing discipline.
Feedback from the patients would be the basis for
improvement of nursing practice.
The study tested the King’s Theory of Goal Attainment in
clinical set up.
1.8 THEORETICAL FRAMEWORKThe study was based on the Imogine King’s Theory of Goal
attainment. The major elements of King’s middle range Theory of
Goal of Attainment are seen in the interpersonal system. Two
people, who are usually strangers, come together in a health care
organization to help and be helped to maintain a state of health
that permits function in roles (George, 2002).
King’s theory of nurse-patient interaction states that nursing is
viewed as “interpersonal process of action, reaction, interaction
and transaction, whereby nurse and patient share information
about their perceptions in the nursing situation” and as “a
8
process of human interaction, between nurse and patient whereby
each perceives the other and the situation, and through
communications, they set goals, explore means and agree on means
to achieve goals” (Basavanthappa, 2007). According to King’s
theory, perception had been described as a process in which data
obtained through the senses and from memory are organized,
interpreted and transformed. This process of human interaction
with the environment influences behaviour, provides meaning to
experience, represents the individual’s image of reality and
learning. Communication represents and is part of, the
information aspect of interaction and may occur within a person
as well as between people. Transaction represents the aspect of
human interaction in which values are apparent and involve
compromising, conferring and social exchange. When transactions
occur between nurses and clients, the goals are attained.
The theory had been chosen because it identified how patients’
characteristics and nurses’ attributes affected the patients’
perceptions regarding nursing care. Nurse-patient relationship is
a mutual relationship whereby both interact in order to
understand one another. This can be demonstrated by a study9
conducted by Lemoniadou, et.al, (2003), in Greece whereby the
researchers were comparing surgical patients’ autonomy, privacy
and informed consent with nursing interventions. It was found
that nurse responsibilities in supporting patient’s autonomy,
informed consent and privacy were perceived as the best by
nurses. Patients on the other hand, perceived this support as
occasional. Then it was concluded that the discrepancies in
perception was due to the fact that patients perceptions were
based on their personal experiences, where as nurses responded on
the basis of their general view of specific situation. Another
scenario that demonstrates the concept of interaction,
communication and perception is a study conducted in South
Australia which viewed surgical nursing care as engaged
(involving patients in their care) or detached (not involving
patients in their care) by women (Koch, et.al, 1997). According
to the study, the engaged nurse was the one who is actively
involved in care of the patient and was perceived to be a
positive experience. The engaged nurse acknowledged the physical,
emotional, spiritual and environmental aspects of the patient and
provided care that assisted the recovery from surgery. While the
10
detached nurse was perceived as negative experience because was
using a procedural approach to care and avoided personal contact
with the patient. This led to feelings of vulnerability and
insecurity for the patients (Koch, 1997). Here the detached nurse
ignored King Law of nurse-patient interaction which says ‘nurses
and patients in mutual presence, interacting purposefully, make
transaction in nursing situation based on each individual
perceptions, purposeful communication and valued goal’.
11
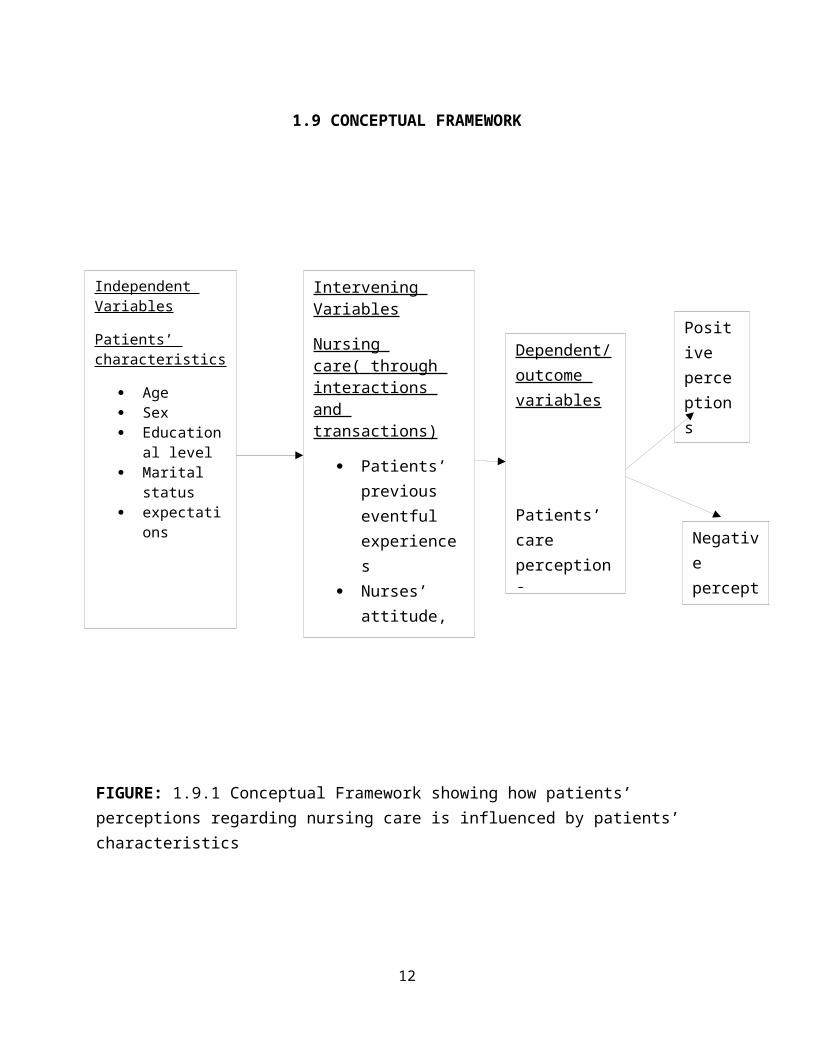
1.9 CONCEPTUAL FRAMEWORK
FIGURE: 1.9.1 Conceptual Framework showing how patients’ perceptions regarding nursing care is influenced by patients’ characteristics
12
Independent Variables
Patients’ characteristics
Age Sex Education
al level Marital
status expectati
ons
Intervening Variables
Nursing care( through interactions and transactions)
Patients’ previous eventful experiences
Nurses’ attitude, skills and
Dependent/outcome variables
Patients’ care perceptions
Negative perceptions
Positive perceptions
CHAPTER TWO: LITERATURE REVIEW
2.1 INTRODUCTIONPatients seek quality nursing care (QNC) when they visit the
hospital. Patients’ perceptions and satisfaction are one of the
elements that determine quality nursing care. The literature
review focused on quality of nursing care, patients’ perceptions
and satisfaction, expectations and nursing activities done during
preoperative and postoperative nursing care in a general surgical
ward. It also reviewed studies that have been done in relation to
patients’ perceptions of nursing care.
2.2 QUALITY OF NURSING CARETo understand the definition of QNC, there was need to understand
what quality is from a health perspective. According to World
Health Organization (WHO, 2000) quality has been defined as the
process of meeting the needs and expectations of patients and
health service staff. The American Medical Association (AMA,
1991), also defined quality as the degree to which care services
influence the probability of optimal patient outcome. The WHO,
(2006), identified effectiveness, efficiency, accessibility;
acceptability/patient-centeredness, equitability and safety as
13
dimensions that help to define quality. The health care services
should be effective in such a way that is adherent to an evidence
base and results in improved health outcomes for individuals and
communities based on needs. It should also be efficient in a
manner that maximizes resource use and avoids waste. The health
care services should be accessible in terms of being timely and
be provided in a setting where skills and resources are
appropriate to medical need. The WHO (2006), emphasized that the
health care services should be accepted or be patient centered in
which it takes into account the preferences and aspirations of
individual service users. It should also be equitable whereby it
does not vary in quality because of personal characteristics such
as gender, race, ethnicity, or socioeconomic status. Lastly, it
should be safe, that is, it should minimize risks and harm to
service users. These dimensions as described by WHO are what the
health consumers expect from any health professionals.
Since nursing care makes one of the major components of health
care service in a hospital, it is necessary to define nursing.
According to Virginia Henderson definition, nursing is the unique
function of the nurse to assist the individual, sick or well, in14
the performance of those activities contributing to health or its
recovery (or to peaceful death) that he would perform unaided if
he had the necessary strength, will or knowledge, and to do this
in such a way as to help him gain independence as rapidly as
possible (Lewis, et.al, 2007). American Nurses Association,
(2003) defined nursing as “the protection, promotion and
optimization of health and abilities, prevention of illness and
injury, alleviation of suffering through the diagnosis and
treatment of human response, and advocacy in the care of
individuals, families, communities and populations” (Lewis,
et.al, 2007). It can be concluded that QNC can be described as
the processes or activities performed by nurses that are aimed at
protecting, promoting and maintaining health of individual
through meeting physical, psychological and spiritual needs.
National Nursing Research Unit(NNRU) (UK), 2008 defined QNC as a
good experience for patients with six core elements which are;
holistic approach to physical, mental and emotional needs;
patient centered and continuous of care; efficiency and
effectiveness combined with humanity and compassion; professional
high quality evidence-based practice; safe, effective and prompt
15
nursing interactions; patient empowerment, support and advocacy
and seamless care through effective treatment with other
professionals.
Many studies done on QNC revealed that when measuring QNC it is
important to consider the patients’ satisfaction with nursing
care (Al-Doghaitler, 2000, & Debono & Travaglia, 2009). Patients
become more satisfied if their needs are met. As health
professionals, nurses are accountable for quality and systematic
improvement of nursing practice (Burhans, & Alligood, 2010).
Quality of nursing care according to Australian nurses’
organization included themes of patients’ need fulfillment and
therapeutic effectiveness mediated through selective focusing
(Burhans, & Alligood, 2010). QNC in Thailand was perceived as
one that met patients’ physical, psychological and extra needs.
The nurses who were providing QNC were perceived to have good
attitude and professional manners, showed kindness, trust and
honesty as well as clinical competence (Zhao & Akkadechanunt,
2004). Nursing care that brought about patients joy, smile and
understanding was perceived as quality care. A study in China
revealed that patients perceived QNC when nurses showed a nice16
attitude towards them and caring for them (Zhao & Akkadechanunt,
2004). Teaching diseases and nursing related knowledge to
patients and providing care as needed promptly was also perceived
as QNC by patients (Zhao & Akkadechanunt, 2004). It was observed
that quality of care demands that we pay attention to the needs
of patients and clients and use methods that have been tested to
be safe, affordable and reduce deaths, illness and disability and
health care workers are expected to practice according to set
standards (Ghana Health services, 2004).
Quality Nursing Care satisfies the needs and expectations of
patients. Patients are likely to care more about the
communication, listening, kindness and responsiveness of their
nurses (Burhans, & Alligood, 2010). Therefore, assessment of
quality of care from patients’ perspective has been
operationalised as patient satisfaction (Rafii, et.al, 2008).
2.3 PATIENTS’ SATISFACTION AND EXPECTATIONS WITH NURSING CAREThe nurse-patients relationship sets the tone of the care
experience and has a powerful impact on patient satisfaction.
Patients see nurses’ interactions with others on the care team
and draw conclusions about the hospital based on their
17
observations (Zhao & Akkadechanunt, 2004). The authors also
argued that, nurses’ attitudes towards their work, coworkers, and
the organization affect patients and family judgment of the
things that could not be seen behind the scenes. Chaka, (2005),
pointed out that patients’ satisfaction with nursing care is
considered an important factor in explaining patients’
perceptions of service quality. Stimson and Webb (1975) suggested
that satisfaction is related to perceptions of outcome of care
and extent to which it meets patients’ expectations. Chaka,
(2005) agreed with Pascoe (1983) definition of patients’
satisfaction as a health care recipient’s reaction to outstanding
aspects of the context, process and results of their service
experience. High ratings for patient satisfaction are considered
a desired outcome of health care (Moscato, et.al, 2007). The
authors continued to explain that satisfaction has been shown to
be a factor in patient follow through, clinical outcomes and
health quality. Components of care experience identified as
contributors to patient satisfaction include prior experiences,
individualized care, patient values, perspectives and expressed
needs, coordination of care, information and education, physical
18
comfort and pain relief, emotional support to alleviate fears and
anxieties, involvement of family and friends, continuity during
transition out of the hospital and access to care (Moscato,
et.al, 2007). O’Connell, et.al, (1999), also identified a number
of factors that are known to influence patient satisfaction.
These factors include; patients’ expectations of the service and
the actual service received; the age of the patient (younger
patients are said to be more discerning, voicing greater
dissatisfaction with care), that patients tended to be more
critical of attitudinal aspects of care rather than technical
aspects; and gender (women are believed to be voicing greater
satisfaction with their care than did men).
A study conducted in Turkey on the patients expectations and
satisfaction of nursing care, revealed that patients’
expectations of nursing care were found to be cheerfulness,
concern, understanding, courtesy and benevolence (Ozsoy, et.al,
2007). These expectations of nursing care ranged between 30% and
90% and were not related to nurses’ knowledge and competence. It
was also found that patients expected to be informed by nurses
about their medication and treatment. The study further revealed19
that between 14% and 90% of patients stated that they were
informed and trained on service, treatment and care including
home care. On patients’ satisfaction, it was found that the
majority of patients were satisfied concerning their orientation
to the ward, information on treatment and home care and nurses’
prompt answers to the calls for help.
Another study done in Pakistan, (Khan, et.al, 2007) showed that
out of 122 patients who agreed to participate in a study, 45% of
patients were satisfied with the care provided, while 55% were
partially dissatisfied. Among six dimensions of care, 94% liked
nursing practice of keeping privacy of patients, 84% had negative
experiences as they observed nurses were not attentive to their
needs, particularly at night. It was concluded that the patients’
expectations were not sufficiently met.
Ahmed & Alasad, (2004), conducted a study in Jordan which was
looking at predictors of patients’ experiences of nursing care in
Medical and surgical wards found that 63% of patients considered
the time nurses spent with them as adequate and the provided
information was perceived as inadequate. This meant that patients
20
were expecting to be told more about their conditions and
treatment. Samina, et.al, (2008), conducted a study on patients’
perceptions of nursing care at a large teaching hospital in
India. The results showed that a relatively higher percentage of
patients had poor perceptions regarding explanation and
information and caring attitude aspect of nursing care (31.6% and
11.5%) respectively. However, more than 95% patients had good
perception of responsiveness, availability and ward organization
capability of nurses.
There are so many factors that influence patients’ perceptions of
nursing care. Nurses need to understand that it is not only the
competence and knowledge that would make patients to be satisfied
with nursing care but also the way they behave and interact with
the patients and the way they treat patients will determine the
quality of nursing care nurses provided.
2.4 NURSING ACTIVITIES DURING PREOPERATIVE AND POST OPERATIVE PATIENT CAREPreoperative period begins when the patient is scheduled for
surgery and ends at the time of transfer to the surgical suit
(Ignatavicius, et.al, 1999). The aim of the preoperative period
21
is to prepare the patient for the surgery. Hence, the nurse
conducts assessment of the patient in order to identify any
special needs, to highlight potential problems and to provide a
baseline against which to measure postoperative progress
(Stellenberg & Bruce, 2007). After a thorough assessment, the
nurse develops an individualized teaching care plan to help
client and family through the surgical experience. Preoperative
care mainly consists of education to reduce anxiety and
postoperative complications and to promote cooperation in
postoperative procedures (Ignatavicius, et.al, 1999). Therefore,
the nurse acts as an educator, an advocate and promoter of
health. Some of the activities done in preoperative period
include; patient history taking, physical assessment, performing
psychosocial assessment, ensuring that the basic routine
laboratory investigations are done, preoperative teaching,
ensuring that the patient has made an informed consent and
physical preparation of the patient for surgery. The nurse is
also responsible for coordination of patient care to all
concerned health professionals.
22
The most important responsibility of the nurse in preoperative
period is giving information to the patients and their family
members which featured highly in the review of literature as
patients complained that the information given was inadequate.
According to Alexander, et.al, (2006), giving information does
not only reduce preoperative anxiety and stress but also promotes
recovery. Patients who have received structured preoperative
information or teaching have been found to mobilize earlier
postoperatively, to have shorter postoperative hospital stay and
to have a reduced need for analgesics postoperatively (Alexander,
et.al, 2006). After the information has been given, the nurse
ensures that the patient make an informed consent. Surgery of any
type involves invasion of the body and require informed consent
from the client or legal guardian. Consent implies that one has
been provided with information necessary to understand the
following; the nature of and reason for surgery, all available
options and the risks associated with each option, risks of
surgical procedure and its potential outcomes, the risks
associated with administration of anaesthesia (Ignatavicius,
et.al, 1999). The nurse is not responsible for providing detailed
23
information about the surgical procedure, rather, the nurse
clarifies facts that have been presented by the physician and
dispels myths that the client and the family may have about the
perioperative experience.
Postoperative phase begins with the admission of the patient to
PACU and ends with a follow up evaluation in the clinical setting
or at Home (Smeltzer & Bare, 2004). Smeltzer & Bare, (2004)
stated that during the first 24 hour after surgery, nursing care
of the hospitalized patient on the general medical-surgical unit
involves continuing to help the patient recover from the effects
of anaesthesia, frequently assessing the patient’s physiological
status, monitoring the complications, managing pain and
implementing measures designed to achieve the long range goals of
independence with self care, successful management of the
therapeutic regimen, discharge to home and full recovery.
Ignatavicius, et.al, (1999) stated that the nursing care primary
concern in the initial hours after admission to the clinical unit
include; adequate ventilation, hemodynamic stability, incisional
pain, surgical site integrity, nausea and vomiting, neurological
status, and spontaneous voiding. The pulse rate, blood pressure24
and respiration rate are recorded at least every 15 minutes for
the first hour and every 30 minutes for the next two hours.
Thereafter, they are measured less frequently if they remain
stable.
2.5 SUMMARYIt can be summarized that patients’ perceptions of nursing care
determines the quality of nursing care. The level of patient’s
satisfaction with the nursing care also determines the quality of
nursing care. Patient’s satisfaction is affected by patient’s
characteristics, nurses’ behaviour and professional knowledge and
skills. Therefore, the patient may become more satisfied with
nursing care if nurses meet patient’s needs, expectations and
provide adequate information on patient’s condition and
treatment.
25
CHAPTER THREE: METHODOLOGY
3.1 STUDY DESIGNThis was a quantitative and qualitative descriptive cross-
sectional study aimed at describing patients’ perceptions
regarding nursing care in the general surgical wards at KNH. The
quantitative variables included; patients’ demographic variables,
expectations and level of satisfaction. Qualitative variables
included; patients’ perception of nursing care and challenges.
The study was conducted between April and June, 2012.
3.2 STUDY AREAThe study was conducted at Kenyatta National Hospital (KNH). KNH
is the biggest national referral hospital in Kenya and it is also
a regional referral hospital in East Africa. KNH is in the
central province of Nairobi located off Mbagathi Road. It also
acts as a teaching institution for University of Nairobi (UON)
College of Health Sciences and Kenya Medical Training College
(KMTC). It has 50 wards, 22 out-patient clinics, 24 theatres (16
specialized) and Accident and Emergency Department. It has bed
capacity of 1800, and 209 out of it is for the private wing. On
average, its bed occupancy rate goes up to 300%, and in addition
26
at any given day, the hospital hosts in its wards between 2500
and 3000 patients. It has an estimated total number of 1700
nurses, 200 doctors.
The study was conducted in general surgical wards situated on the
5th floor of the tower block namely; 5A, 5B and 5D. The general
surgical wards perform both elective and emergency operations
(KNH, 2010).
3.4 STUDY POPULATIONThe study population was adult inpatients admitted in the general
surgical wards 5A, 5B and 5D at KNH.
3.4.1Inclusion criteria
The patients recruited in the study included those who:
Had undergone surgery.
Were in stable general condition postoperative, fully
conscious.
Stayed in the ward for two or more days postoperatively.
Consented to participate in the study.
3.4.2 Exclusion criteriaPatients who were excluded from the study included those:
Who were not operated on
27
who did not consented to participate
who stayed in the ward for less than two days
postoperatively
who were in comatose state
who were confused.
3.5 SAMPLE SIZE DETERMINATIONThe sample size was calculated using the following formula
(Mugenda and Mugenda, 2003)
n= (Z α /2) 2 P(1-P)
d2
where; n=the desired sample where population > 10 000
z=standard normal deviate (1.96) corresponding to 95% confidence
limit.
d=degree of precision usually set at 0.05
P= prevalence/proportion. (Estimated proportion 0.5). Since the
patients’ perceptions regarding nursing care was not known, P
taken as 50%
1.962 x 0.5x0.5/(0.5)2
n= 384
28
The study was adjusted for finite population as follows, Fishers’
et al. (1998)
nf=n/1+(n/N)
Where; nf=desired sample for population < 10 000
n=desired sample size for population > 10 000.
N=estimate of the population size (300)
nf= 384/1+(384/300)
=168
3.6 SAMPLING PROCEDUREThe study used systematic random sampling. This technique was
chosen because of its simplicity for it added a degree of system
into random selection of subjects. It is a type of probability
sampling whereby the researcher ensure that all the members of
the population have equal chances of being selected as the
starting point or the initial subject, (Basavanthappa, 2007). A
list of all postoperative patients was obtained from ward
registers through the help of ward nurse in-charge. The first two
patients in the register books were selected by random to
determine the starting point. Sampling interval for systematic
sampling was determined by dividing sample size by total
29
population of patients in the register. Sampling interval
(k)=N/n; 300/168=1.79.Therefore, the sampling interval determined
was 2. Hence every second patient was chosen to participate in
the study from the list (1+2), (3+2)…..
3.7 DATA COLLECTION TOOLSStructured questionnaire with closed and open ended questions
written in both English and Kiswahili were used. The study
assistants assisted the participants to answer the questions. The
questionnaire had sections seeking information on participants’
demographic data; patients’ expectations, experiences and
challenges with nursing care. The participants were also asked to
explain how they perceived the nursing care and the level of
satisfaction.
3.8 VARIABLES UNDER STUDY
3.8.1 Independent variables included; Patients’ age
Patients’ gender
Patients’ level of education
Patients’ marital status
Previous hospitalization
30
3.8.2 Dependent variable Patients’ perception of nursing care
3.8.3 Outcome variablesCare satisfaction.
3.9 RESEARCH ASSISTANT TRAININGThree registered nurses (RN) were recruited through assistance of
the ward in-charges, and were trained as research assistants. The
training included the study expectations, purpose and objectives,
use of the study tool and how to assist patients in answering the
questionnaire.
3.10 DATA QUALITY ASSURANCEData collection tool was adapted from Hospital Consumers
Assessment of Healthcare Providers and Systems (HCAPS) survey
tool developed by Centers for Medicare and Medicaid Services in
UK. It was then modified to meet the study objectives. It was
also reviewed and approved by the KNH/UON Research Ethics
committee. The research assistants were selected among RNs who
had experience in nurse-patient interactions. The study tool was
pretested in patients with orthopaedic conditions and some areas
were amended such as patients’ roles were deleted. Participants’
details remained anonymous and confidentiality was guaranteed to
31
protect their privacy. Data analysis was done with the assistance
of a Biostatistician.
3.11 DATA MANAGEMENT AND ANALYSISThe information in the study tool was checked for completeness
before entering into Excel spreadsheet on the computer. The raw
data was cleaned, coded and entered into the computer as soon as
data was generated. Data analysis was done using SPSS version 20.
The quantitative data was summarized using descriptive
statistics. The qualitative data was grouped into themes and as
narratives and then was summarized using descriptive statistics.
Inferential statistics such as t-tests, ANOVA and Pearson
correlation was used to find relationships of the variables and
its significance.
3.12 STUDY ASSUMPTIONSThe researcher assumed that the respondents were honest with the
information they gave
3.13 ETHICAL CONSIDERATIONThe Kenyan Constitution, 2010, emphasizes on the persons rights
as follows; that every person has inherent dignity and has the
right to be treated with dignity and respect; right for
32
protection and not to be subjected to any form of harm/violence
from either public or private sources. A person has the right to
privacy and not to have information relating to their family or
private affairs revealed unnecessarily to unauthorized persons.
To protect the rights and welfare of participants and minimize
risk of physical and mental discomfort, harm or dangers from
research procedures, ethical clearance was sought from KNH and
UON Research Ethics Committee. Professionally, researchers are
obliged to protect participants’ from harm and respect their
rights. The principle investigator ensured that all the research
assistants were trained on professionalism, ethics and
participants rights through training. Permission was granted from
ward in-charges to access the participants. Respect for
individual participants was expressed by recognizing that their
autonomy and right to self-determination underpin their ability
to make judgments and decisions for themselves. Therefore, nature
and purpose of the research was explained to the prospective
participants, and then informed written consent was sought from
the respondents before taking part in the study. Participants
were informed that they had the right to withdraw from the
33
research at any time without any prejudice. Subject to
legislation, participants were informed that information obtained
during investigation was confidential. That the information could
only be disclosed to an authorized persons providing direct care
to the patient if need be and with prior consent. Otherwise,
participants had the right to expect that information provided
would be treated confidentially and anonymity would be observed
during publication to conceal the true identity of the
participant. Participants were also informed that the study
attracted no incentives or favor and was purely voluntary. That
the study did not pose any physical harm except the discomfort of
answering questions and time spent to respond. The principle
investigator was obliged to inform the participants of any
encounter with evidence of psychological or physical danger to
their future well-being, if not already aware, as act as
appropriate. The report emanating from the study would be
disseminated to University of Nairobi, Kenyatta National Hospital
and the Ethics committee and the ward in charges inform of
abstracts and scientific conferences and publications.
34

3.14 STUDY LIMITATIONSThere was language barrier between the principal investigator and
respondents which could have affected the outcome of the study.
But, it was corrected by recruiting research assistants who were
more fluent in Kiswahili language.
35
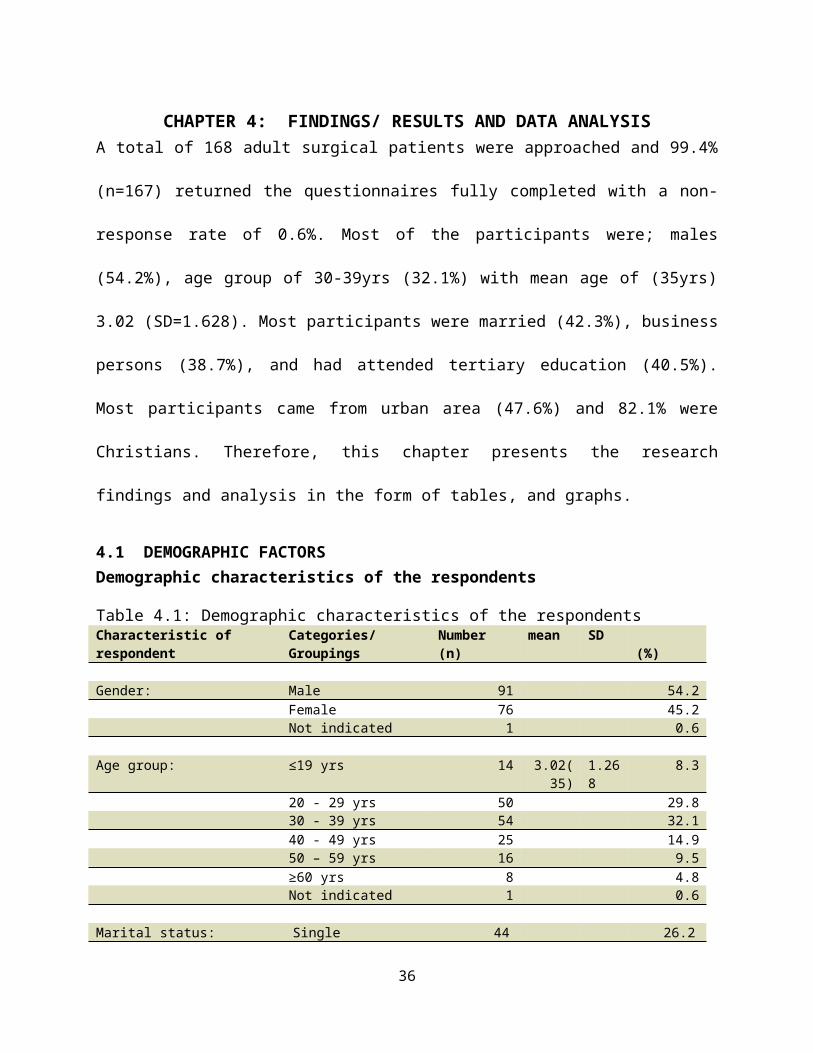
CHAPTER 4: FINDINGS/ RESULTS AND DATA ANALYSISA total of 168 adult surgical patients were approached and 99.4%
(n=167) returned the questionnaires fully completed with a non-
response rate of 0.6%. Most of the participants were; males
(54.2%), age group of 30-39yrs (32.1%) with mean age of (35yrs)
3.02 (SD=1.628). Most participants were married (42.3%), business
persons (38.7%), and had attended tertiary education (40.5%).
Most participants came from urban area (47.6%) and 82.1% were
Christians. Therefore, this chapter presents the research
findings and analysis in the form of tables, and graphs.
4.1 DEMOGRAPHIC FACTORSDemographic characteristics of the respondents
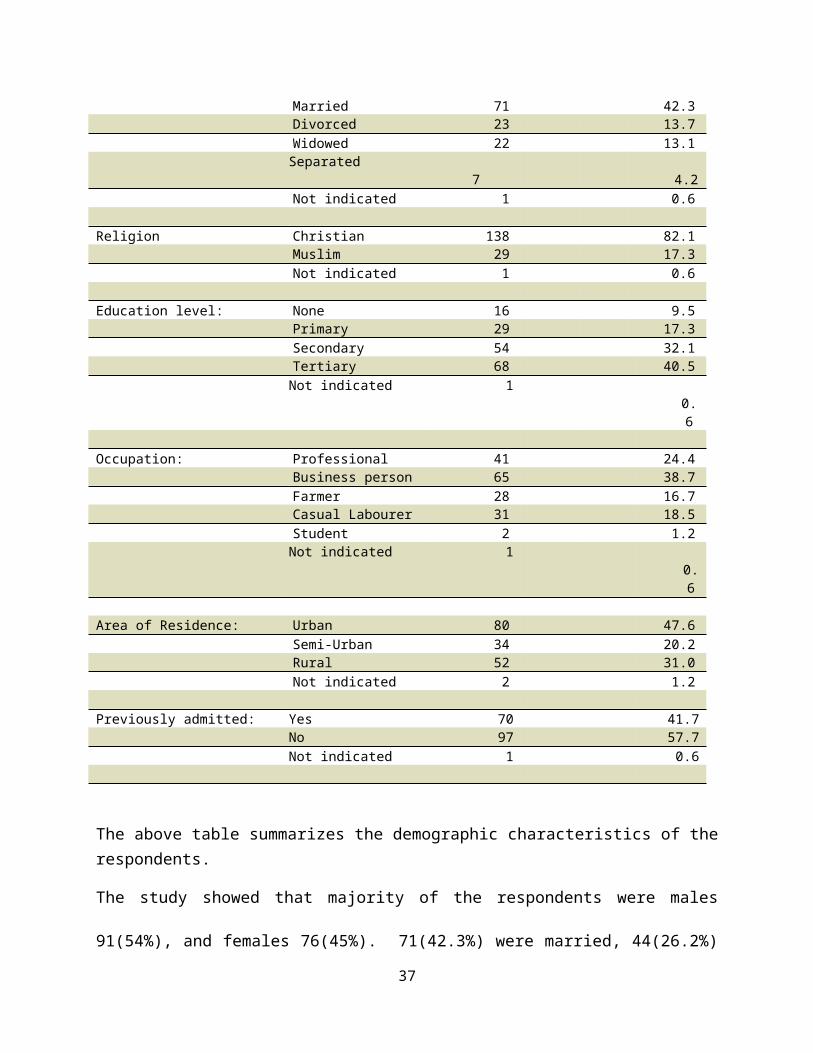
Table 4.1: Demographic characteristics of the respondentsCharacteristic of respondent
Categories/ Groupings
Number (n)
mean SD (%)
Gender: Male 91 54.2Female 76 45.2Not indicated 1 0.6
Age group: ≤19 yrs 14 3.02(35)
1.268
8.3
20 - 29 yrs 50 29.8 30 - 39 yrs 54 32.1 40 - 49 yrs 25 14.9
50 – 59 yrs 16 9.5≥60 yrs 8 4.8Not indicated 1 0.6
Marital status: Single 44 26.2
36
Married 71 42.3Divorced 23 13.7Widowed 22 13.1Separated
7 4.2
Not indicated 1 0.6
Religion Christian 138 82.1Muslim 29 17.3Not indicated 1 0.6
Education level: None 16 9.5Primary 29 17.3Secondary 54 32.1Tertiary 68 40.5Not indicated 1
0.6
Occupation: Professional 41 24.4Business person 65 38.7
Farmer 28 16.7 Casual Labourer 31 18.5 Student 2 1.2 Not indicated 1
0.6
Area of Residence: Urban 80 47.6 Semi-Urban 34 20.2 Rural 52 31.0 Not indicated 2 1.2 Previously admitted: Yes 70 41.7
No 97 57.7Not indicated 1 0.6
The above table summarizes the demographic characteristics of therespondents.
The study showed that majority of the respondents were males
91(54%), and females 76(45%). 71(42.3%) were married, 44(26.2%)
37
never married, 22(13.1%) were widowed while 7(4.2%) were
separated. Most of the respondents had attained college/tertiary
level of education 68(40.5%) followed by Secondary education
54(32.1%), Primary 29(17.3%) and 16(9.5%) did not attended any
formal education.
The age of the respondents ranged from less than 19 years to 60
years and above. The age group with more response was 30 - 39
years 54(32.1%) followed by 20 – 29years 50(29.8%)
Most participants 138(82.1%) were Christians followed by
29(17.3%) were Muslims.
Most participants 65(38.7%) were business persons, 41(24.4%) were
professionals followed by 31(18.5%) were casual labourers, and
80(47.6%) were urban residents followed by 52(31.0%) were from
rural areas.
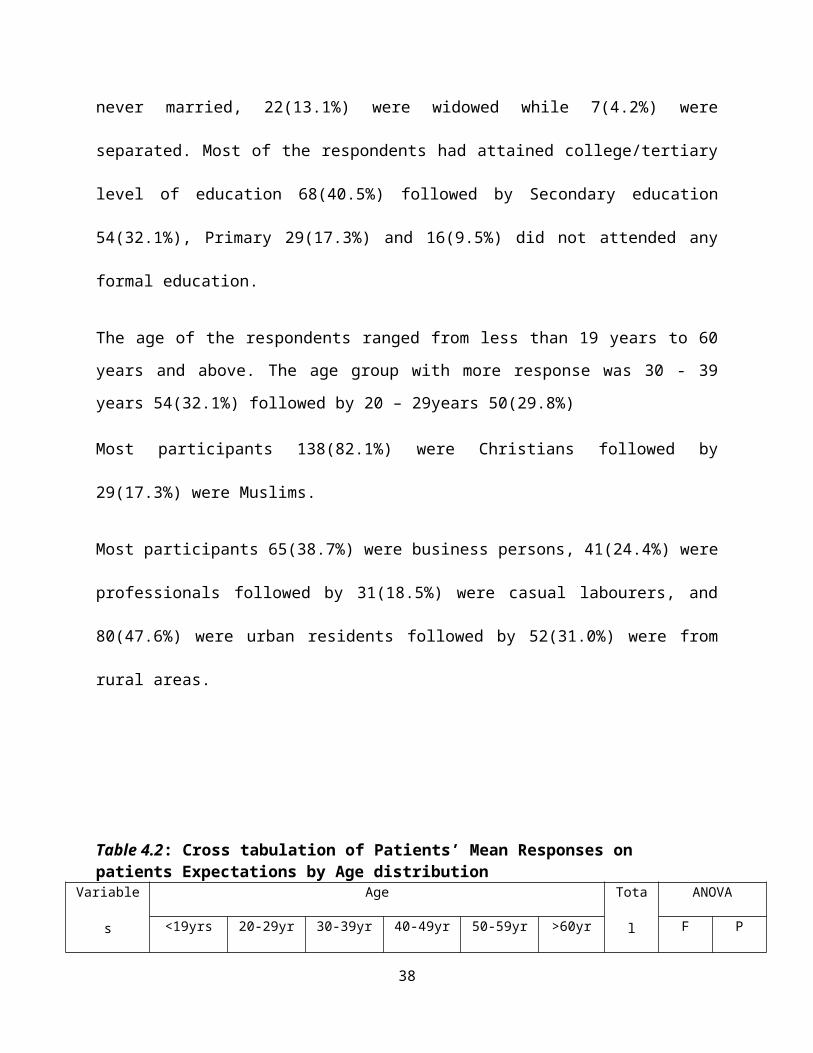
Table 4.2: Cross tabulation of Patients’ Mean Responses on patients Expectations by Age distribution
Variable
s
Age Tota
l
ANOVA
<19yrs 20-29yr 30-39yr 40-49yr 50-59yr >60yr F P
38
mean
Kind 4.00(9.
3%)
3.58(29
.7)
3.43(30
.7)
3.76(15
.6)
3.56(9.
5)
4.00(5
.3)
3.61 1.32
1
0.25
6
Cheerful 4.07(9.
0)
3.68(29
.2)
3.57(30
.6)
4.00(15
.8)
3.94(10
.0)
4.25(5
.4)
3.78 1.88
7
0.09
9
Responsi
ve
3.86(8.
9)
3.52(29
.1)
3.59(30
.2)
3.80(15
.7)
3.94(10
.4)
4.25(5
.6)
3.62 2.77
2
0.02
0
Rude 2.64(10
.2)
2.26(31
.0)
2.11(30
.8)
2.04(14
.0)
2.19(9.
6)
2.00(4
.4)
2.19 0.64
1
0.66
9
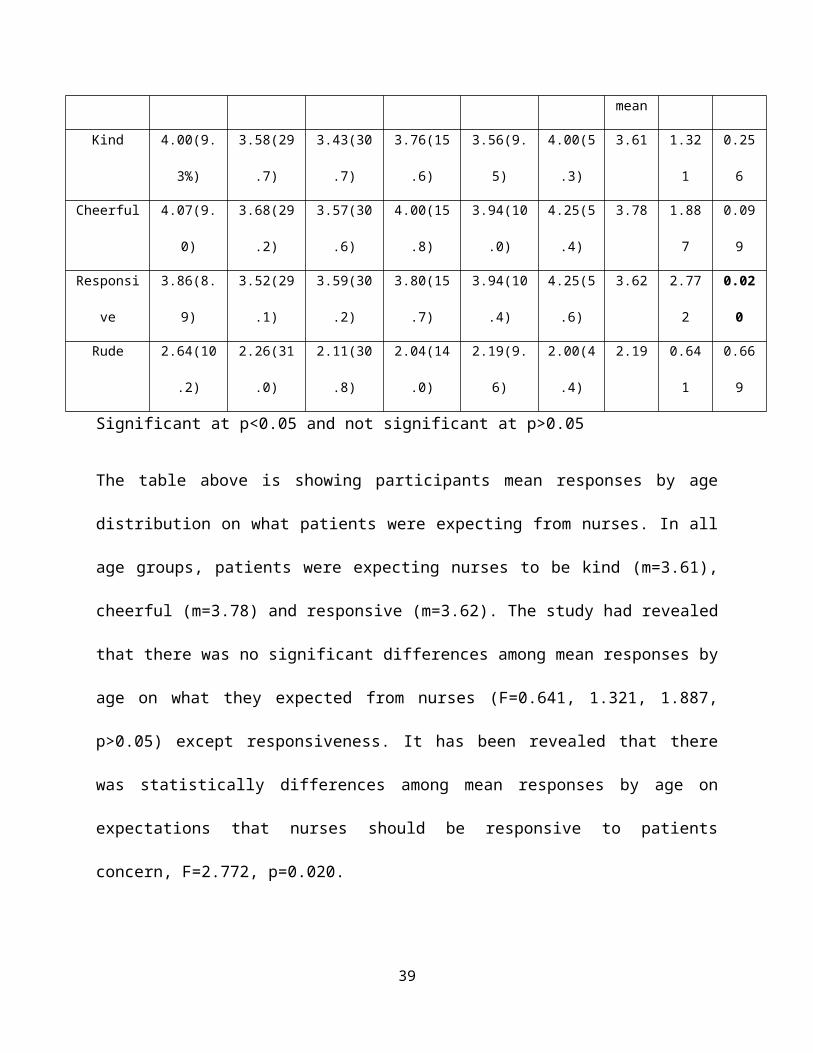
Significant at p<0.05 and not significant at p>0.05
The table above is showing participants mean responses by age
distribution on what patients were expecting from nurses. In all
age groups, patients were expecting nurses to be kind (m=3.61),
cheerful (m=3.78) and responsive (m=3.62). The study had revealed
that there was no significant differences among mean responses by
age on what they expected from nurses (F=0.641, 1.321, 1.887,
p>0.05) except responsiveness. It has been revealed that there
was statistically differences among mean responses by age on
expectations that nurses should be responsive to patients
concern, F=2.772, p=0.020.
39
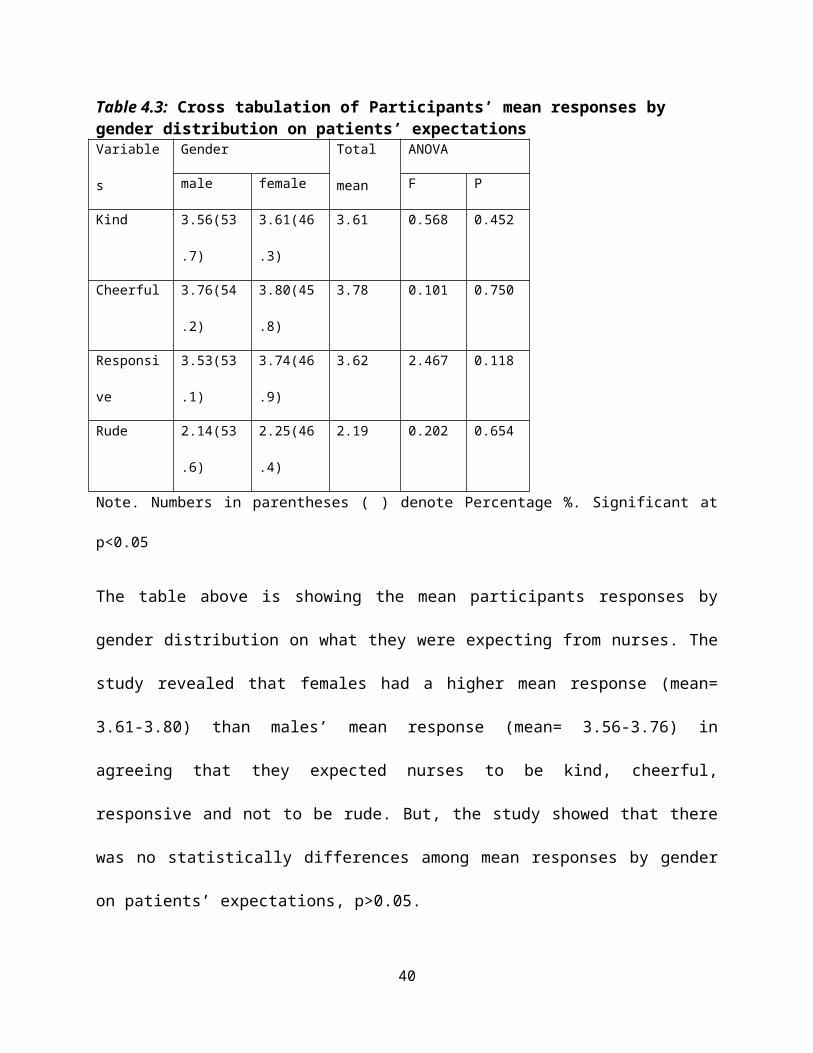
Table 4.3: Cross tabulation of Participants’ mean responses by gender distribution on patients’ expectations Variable
s
Gender Total
mean
ANOVA
male female F P
Kind 3.56(53
.7)
3.61(46
.3)
3.61 0.568 0.452
Cheerful 3.76(54
.2)
3.80(45
.8)
3.78 0.101 0.750
Responsi
ve
3.53(53
.1)
3.74(46
.9)
3.62 2.467 0.118
Rude 2.14(53
.6)
2.25(46
.4)
2.19 0.202 0.654
Note. Numbers in parentheses ( ) denote Percentage %. Significant at
p<0.05
The table above is showing the mean participants responses by
gender distribution on what they were expecting from nurses. The
study revealed that females had a higher mean response (mean=
3.61-3.80) than males’ mean response (mean= 3.56-3.76) in
agreeing that they expected nurses to be kind, cheerful,
responsive and not to be rude. But, the study showed that there
was no statistically differences among mean responses by gender
on patients’ expectations, p>0.05.
40
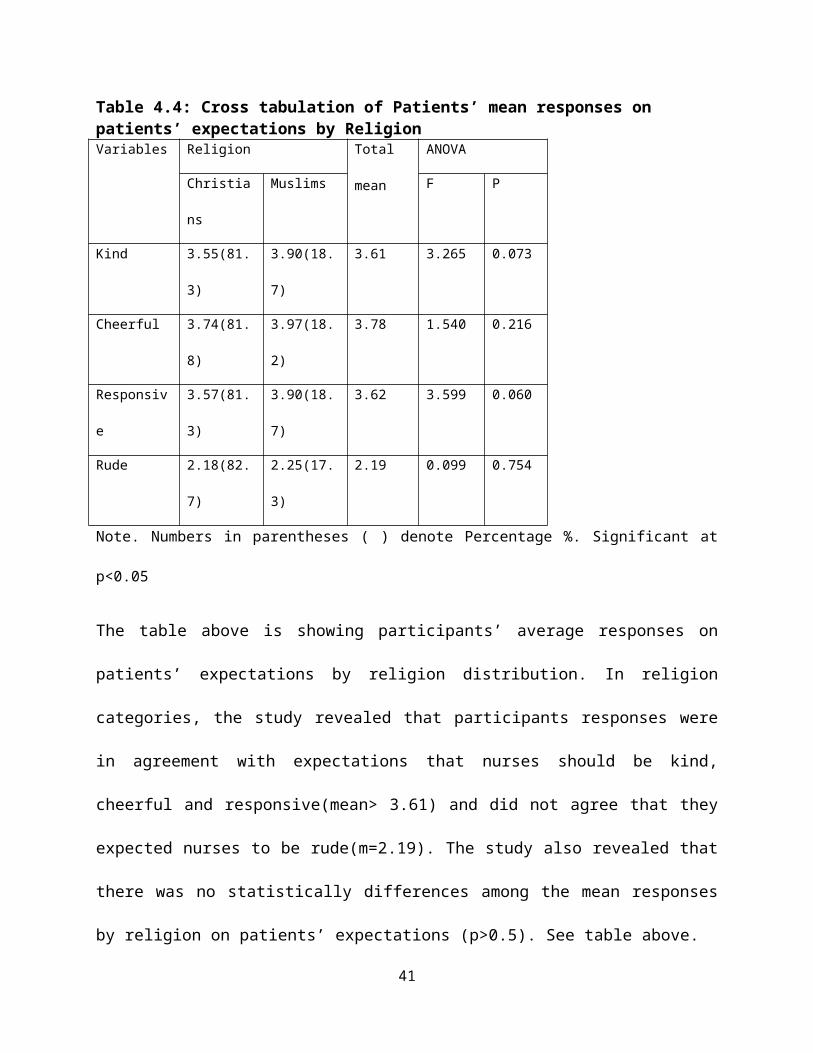
Table 4.4: Cross tabulation of Patients’ mean responses on patients’ expectations by ReligionVariables Religion Total
mean
ANOVA
Christia
ns
Muslims F P
Kind 3.55(81.
3)
3.90(18.
7)
3.61 3.265 0.073
Cheerful 3.74(81.
8)
3.97(18.
2)
3.78 1.540 0.216
Responsiv
e
3.57(81.
3)
3.90(18.
7)
3.62 3.599 0.060
Rude 2.18(82.
7)
2.25(17.
3)
2.19 0.099 0.754
Note. Numbers in parentheses ( ) denote Percentage %. Significant at
p<0.05
The table above is showing participants’ average responses on
patients’ expectations by religion distribution. In religion
categories, the study revealed that participants responses were
in agreement with expectations that nurses should be kind,
cheerful and responsive(mean> 3.61) and did not agree that they
expected nurses to be rude(m=2.19). The study also revealed that
there was no statistically differences among the mean responses
by religion on patients’ expectations (p>0.5). See table above.
41

42
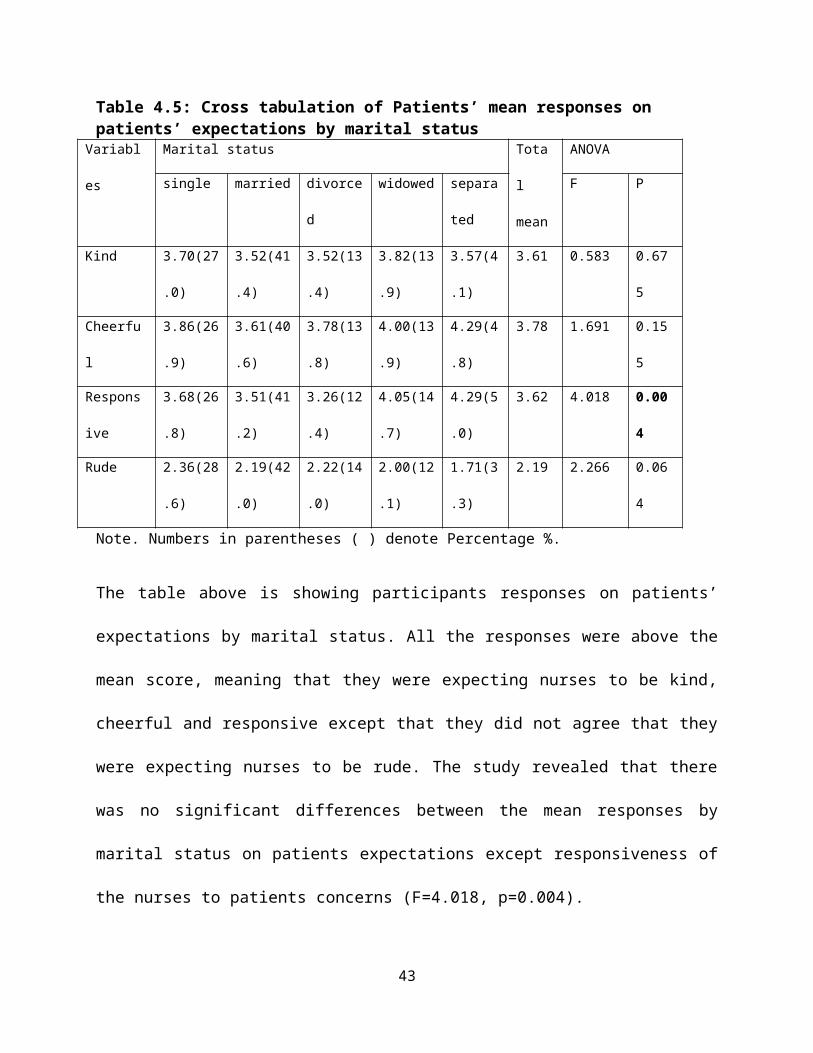
Table 4.5: Cross tabulation of Patients’ mean responses on patients’ expectations by marital status
Variabl
es
Marital status Tota
l
mean
ANOVA
single married divorce
d
widowed separa
ted
F P
Kind 3.70(27
.0)
3.52(41
.4)
3.52(13
.4)
3.82(13
.9)
3.57(4
.1)
3.61 0.583 0.67
5
Cheerfu
l
3.86(26
.9)
3.61(40
.6)
3.78(13
.8)
4.00(13
.9)
4.29(4
.8)
3.78 1.691 0.15
5
Respons
ive
3.68(26
.8)
3.51(41
.2)
3.26(12
.4)
4.05(14
.7)
4.29(5
.0)
3.62 4.018 0.00
4
Rude 2.36(28
.6)
2.19(42
.0)
2.22(14
.0)
2.00(12
.1)
1.71(3
.3)
2.19 2.266 0.06
4
Note. Numbers in parentheses ( ) denote Percentage %.
The table above is showing participants responses on patients’
expectations by marital status. All the responses were above the
mean score, meaning that they were expecting nurses to be kind,
cheerful and responsive except that they did not agree that they
were expecting nurses to be rude. The study revealed that there
was no significant differences between the mean responses by
marital status on patients expectations except responsiveness of
the nurses to patients concerns (F=4.018, p=0.004).
43
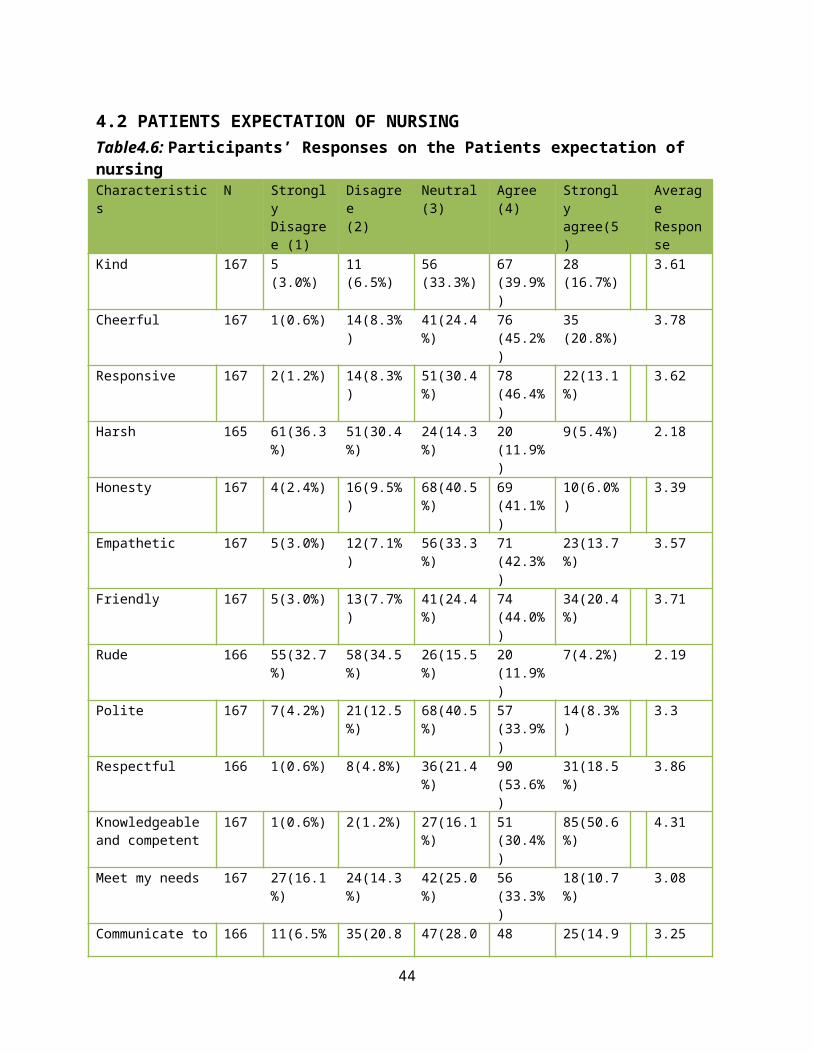
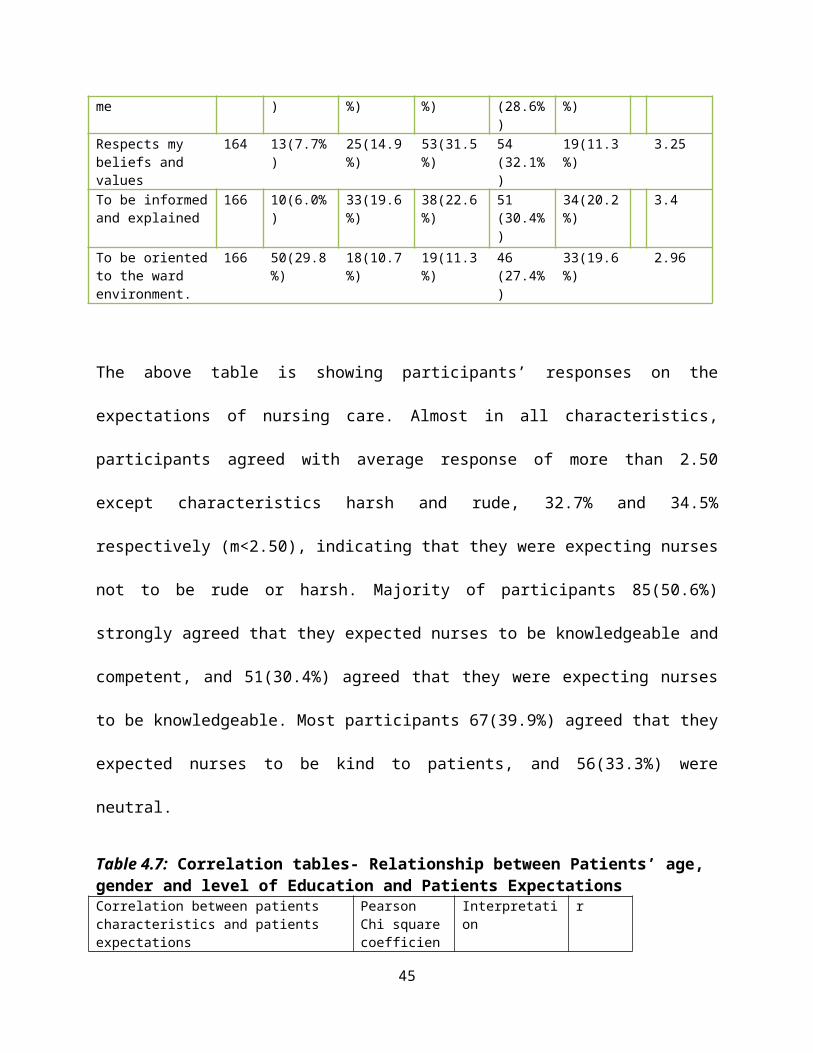
4.2 PATIENTS EXPECTATION OF NURSINGTable4.6: Participants’ Responses on the Patients expectation of nursingCharacteristics
N Strongly Disagree (1)
Disagree(2)
Neutral(3)
Agree(4)
Strongly agree(5)
Average Response
Kind 167 5(3.0%)
11(6.5%)
56(33.3%)
67(39.9%)
28(16.7%)
3.61
Cheerful 167 1(0.6%) 14(8.3%)
41(24.4%)
76(45.2%)
35(20.8%)
3.78
Responsive 167 2(1.2%) 14(8.3%)
51(30.4%)
78(46.4%)
22(13.1%)
3.62
Harsh 165 61(36.3%)
51(30.4%)
24(14.3%)
20(11.9%)
9(5.4%) 2.18
Honesty 167 4(2.4%) 16(9.5%)
68(40.5%)
69(41.1%)
10(6.0%)
3.39
Empathetic 167 5(3.0%) 12(7.1%)
56(33.3%)
71(42.3%)
23(13.7%)
3.57
Friendly 167 5(3.0%) 13(7.7%)
41(24.4%)
74(44.0%)
34(20.4%)
3.71
Rude 166 55(32.7%)
58(34.5%)
26(15.5%)
20(11.9%)
7(4.2%) 2.19
Polite 167 7(4.2%) 21(12.5%)
68(40.5%)
57(33.9%)
14(8.3%)
3.3
Respectful 166 1(0.6%) 8(4.8%) 36(21.4%)
90(53.6%)
31(18.5%)
3.86
Knowledgeable and competent
167 1(0.6%) 2(1.2%) 27(16.1%)
51(30.4%)
85(50.6%)
4.31
Meet my needs 167 27(16.1%)
24(14.3%)
42(25.0%)
56(33.3%)
18(10.7%)
3.08
Communicate to 166 11(6.5% 35(20.8 47(28.0 48 25(14.9 3.25
44
me ) %) %) (28.6%)
%)
Respects my beliefs and values
164 13(7.7%)
25(14.9%)
53(31.5%)
54(32.1%)
19(11.3%)
3.25
To be informedand explained
166 10(6.0%)
33(19.6%)
38(22.6%)
51(30.4%)
34(20.2%)
3.4
To be orientedto the ward environment.
166 50(29.8%)
18(10.7%)
19(11.3%)
46(27.4%)
33(19.6%)
2.96
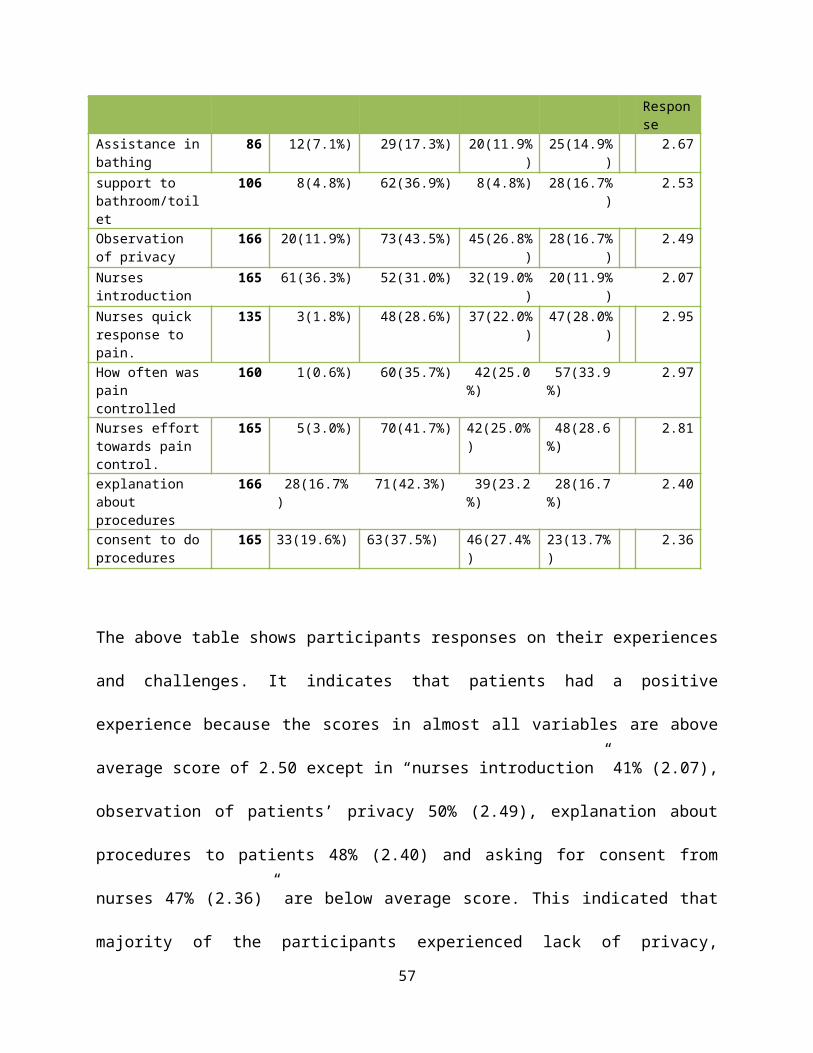
The above table is showing participants’ responses on the
expectations of nursing care. Almost in all characteristics,
participants agreed with average response of more than 2.50
except characteristics harsh and rude, 32.7% and 34.5%
respectively (m<2.50), indicating that they were expecting nurses
not to be rude or harsh. Majority of participants 85(50.6%)
strongly agreed that they expected nurses to be knowledgeable and
competent, and 51(30.4%) agreed that they were expecting nurses
to be knowledgeable. Most participants 67(39.9%) agreed that they
expected nurses to be kind to patients, and 56(33.3%) were
neutral.
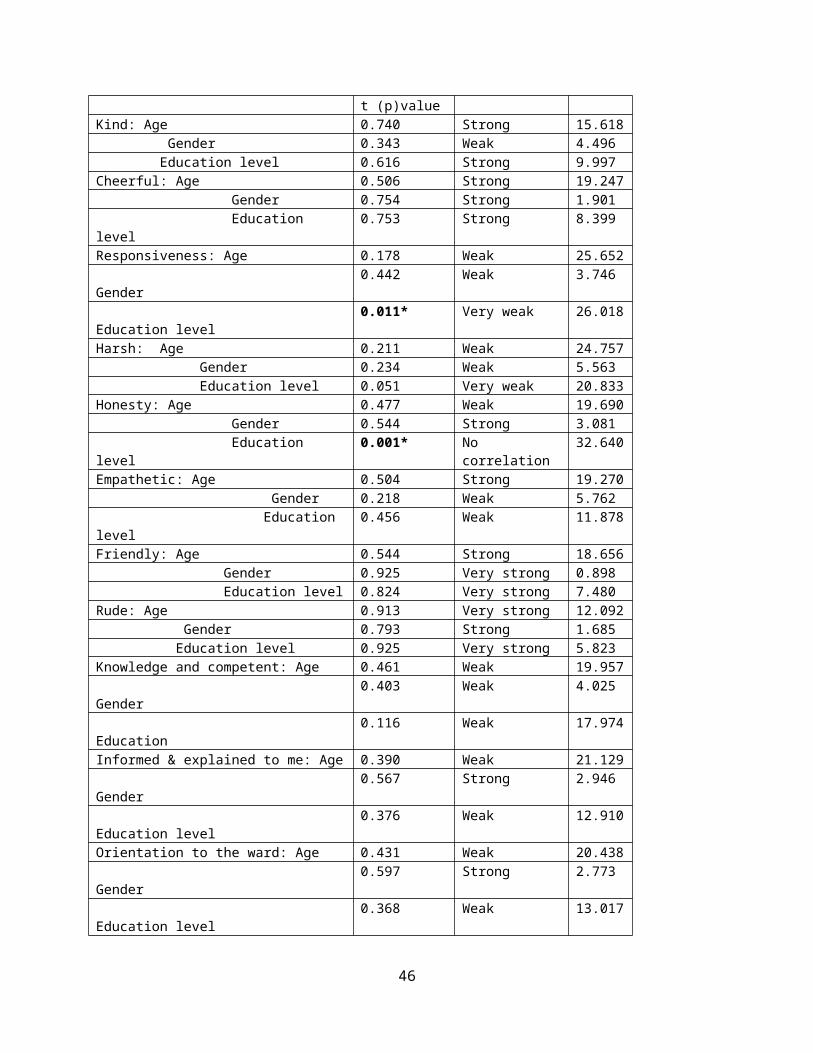
Table 4.7: Correlation tables- Relationship between Patients’ age, gender and level of Education and Patients ExpectationsCorrelation between patients characteristics and patients expectations
Pearson Chi squarecoefficien
Interpretation
r
45
t (p)valueKind: Age 0.740 Strong 15.618 Gender 0.343 Weak 4.496 Education level 0.616 Strong 9.997Cheerful: Age 0.506 Strong 19.247 Gender 0.754 Strong 1.901 Education level
0.753 Strong 8.399
Responsiveness: Age 0.178 Weak 25.652 Gender
0.442 Weak 3.746
Education level
0.011* Very weak 26.018
Harsh: Age 0.211 Weak 24.757 Gender 0.234 Weak 5.563 Education level 0.051 Very weak 20.833Honesty: Age 0.477 Weak 19.690 Gender 0.544 Strong 3.081 Education level
0.001* No correlation
32.640
Empathetic: Age 0.504 Strong 19.270 Gender 0.218 Weak 5.762 Education level
0.456 Weak 11.878
Friendly: Age 0.544 Strong 18.656 Gender 0.925 Very strong 0.898 Education level 0.824 Very strong 7.480Rude: Age 0.913 Very strong 12.092 Gender 0.793 Strong 1.685 Education level 0.925 Very strong 5.823Knowledge and competent: Age 0.461 Weak 19.957 Gender
0.403 Weak 4.025
Education
0.116 Weak 17.974
Informed & explained to me: Age 0.390 Weak 21.129 Gender
0.567 Strong 2.946
Education level
0.376 Weak 12.910
Orientation to the ward: Age 0.431 Weak 20.438 Gender
0.597 Strong 2.773
Education level
0.368 Weak 13.017
46
Pearson Correlation: Significant at p<0.05. *categories column dodiffer significantly from each other at the level of 0.05.
The table above is showing that there was positive relationship
between patients’ gender, age and level of education and what
they were expecting from nurses but there were no significant
differences among their responses, p>0.05.
0% 20%
40%
60%
80%
100%
72%76%
72%44% 68%
71%74%
44%66%
77%86%
62%65%65%59%
Average response
Orientation Respects my beliefs and values
Communication Meet all my needsKnowledgeable RespectfulPolite RudeFriendly EmpatheticHonesty HarshResponsive CheerfulKind
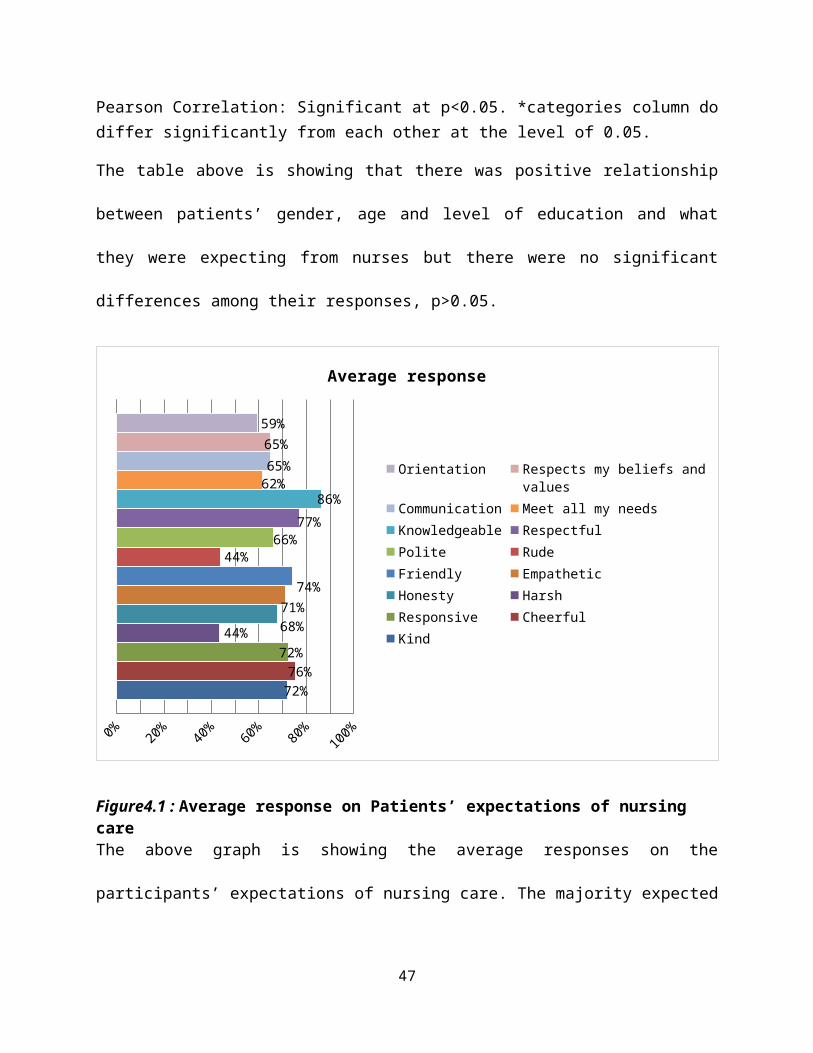
Figure4.1 : Average response on Patients’ expectations of nursing careThe above graph is showing the average responses on the
participants’ expectations of nursing care. The majority expected
47

nurses to be knowledgeable (86%) and also did not expect nurses
to be harsh and rude (44% respectively).
48
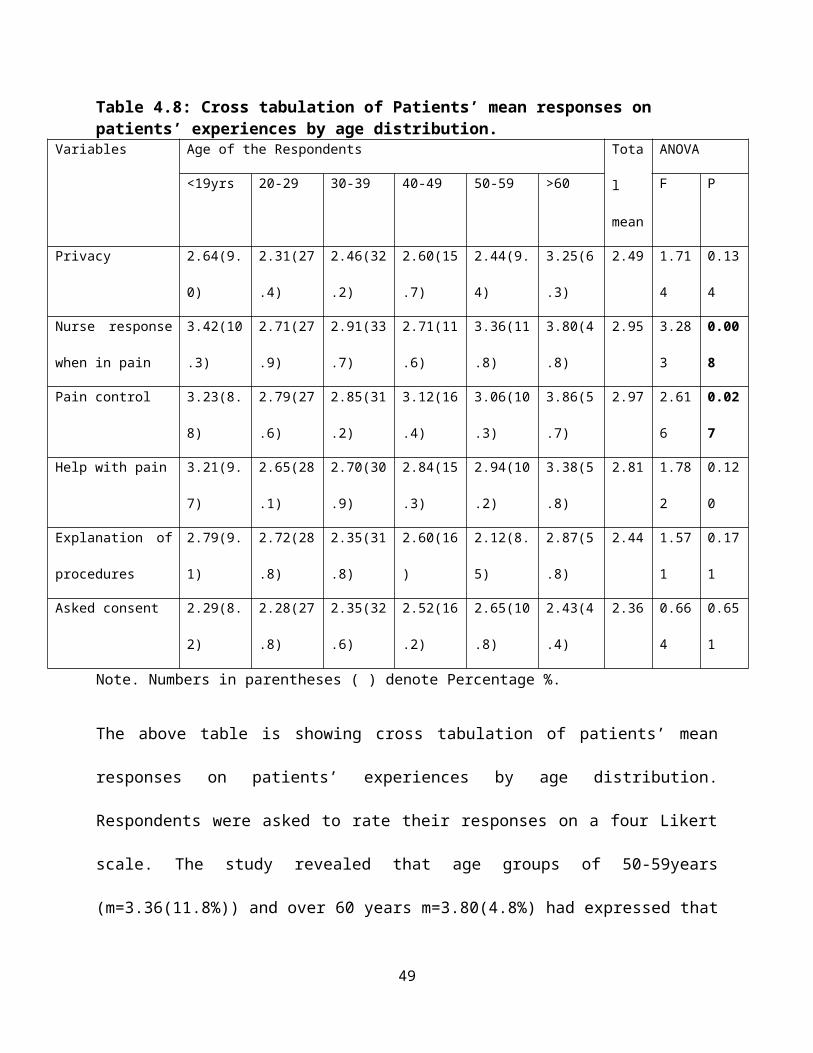
Table 4.8: Cross tabulation of Patients’ mean responses on patients’ experiences by age distribution.
Variables Age of the Respondents Tota
l
mean
ANOVA
<19yrs 20-29 30-39 40-49 50-59 >60 F P
Privacy 2.64(9.
0)
2.31(27
.4)
2.46(32
.2)
2.60(15
.7)
2.44(9.
4)
3.25(6
.3)
2.49 1.71
4
0.13
4
Nurse response
when in pain
3.42(10
.3)
2.71(27
.9)
2.91(33
.7)
2.71(11
.6)
3.36(11
.8)
3.80(4
.8)
2.95 3.28
3
0.00
8
Pain control 3.23(8.
8)
2.79(27
.6)
2.85(31
.2)
3.12(16
.4)
3.06(10
.3)
3.86(5
.7)
2.97 2.61
6
0.02
7
Help with pain 3.21(9.
7)
2.65(28
.1)
2.70(30
.9)
2.84(15
.3)
2.94(10
.2)
3.38(5
.8)
2.81 1.78
2
0.12
0
Explanation of
procedures
2.79(9.
1)
2.72(28
.8)
2.35(31
.8)
2.60(16
)
2.12(8.
5)
2.87(5
.8)
2.44 1.57
1
0.17
1
Asked consent 2.29(8.
2)
2.28(27
.8)
2.35(32
.6)
2.52(16
.2)
2.65(10
.8)
2.43(4
.4)
2.36 0.66
4
0.65
1
Note. Numbers in parentheses ( ) denote Percentage %.
The above table is showing cross tabulation of patients’ mean
responses on patients’ experiences by age distribution.
Respondents were asked to rate their responses on a four Likert
scale. The study revealed that age groups of 50-59years
(m=3.36(11.8%)) and over 60 years m=3.80(4.8%) had expressed that
49
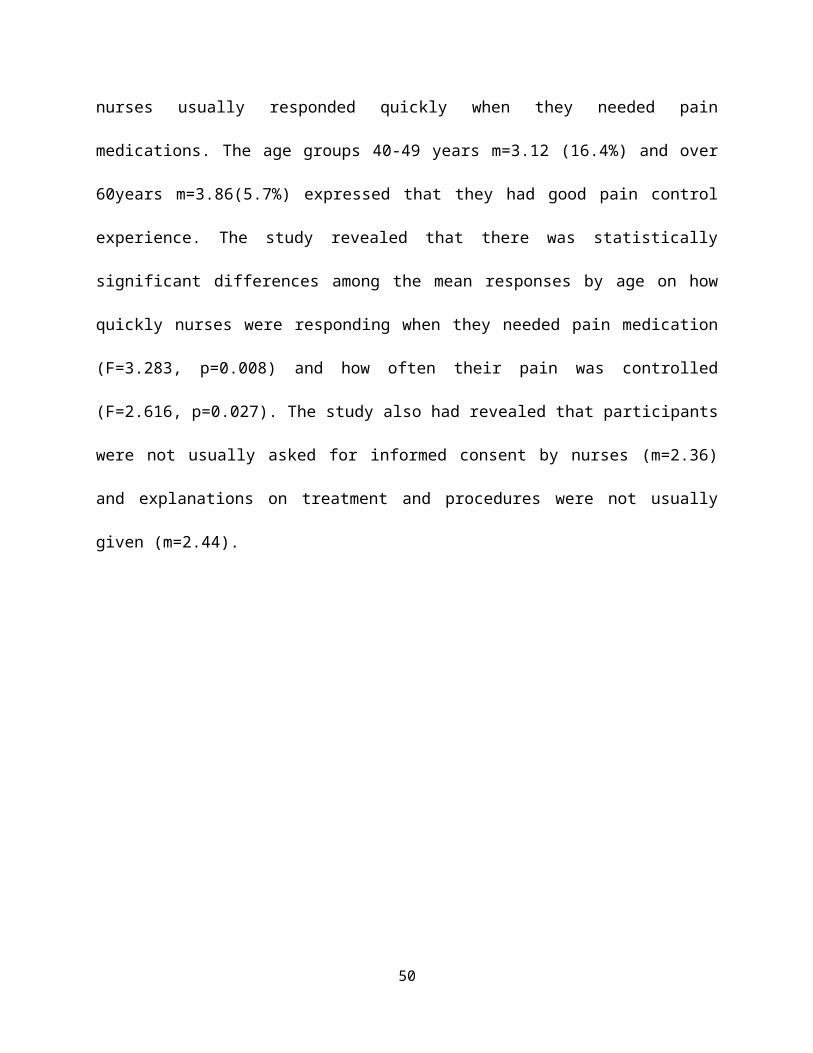
nurses usually responded quickly when they needed pain
medications. The age groups 40-49 years m=3.12 (16.4%) and over
60years m=3.86(5.7%) expressed that they had good pain control
experience. The study revealed that there was statistically
significant differences among the mean responses by age on how
quickly nurses were responding when they needed pain medication
(F=3.283, p=0.008) and how often their pain was controlled
(F=2.616, p=0.027). The study also had revealed that participants
were not usually asked for informed consent by nurses (m=2.36)
and explanations on treatment and procedures were not usually
given (m=2.44).
50
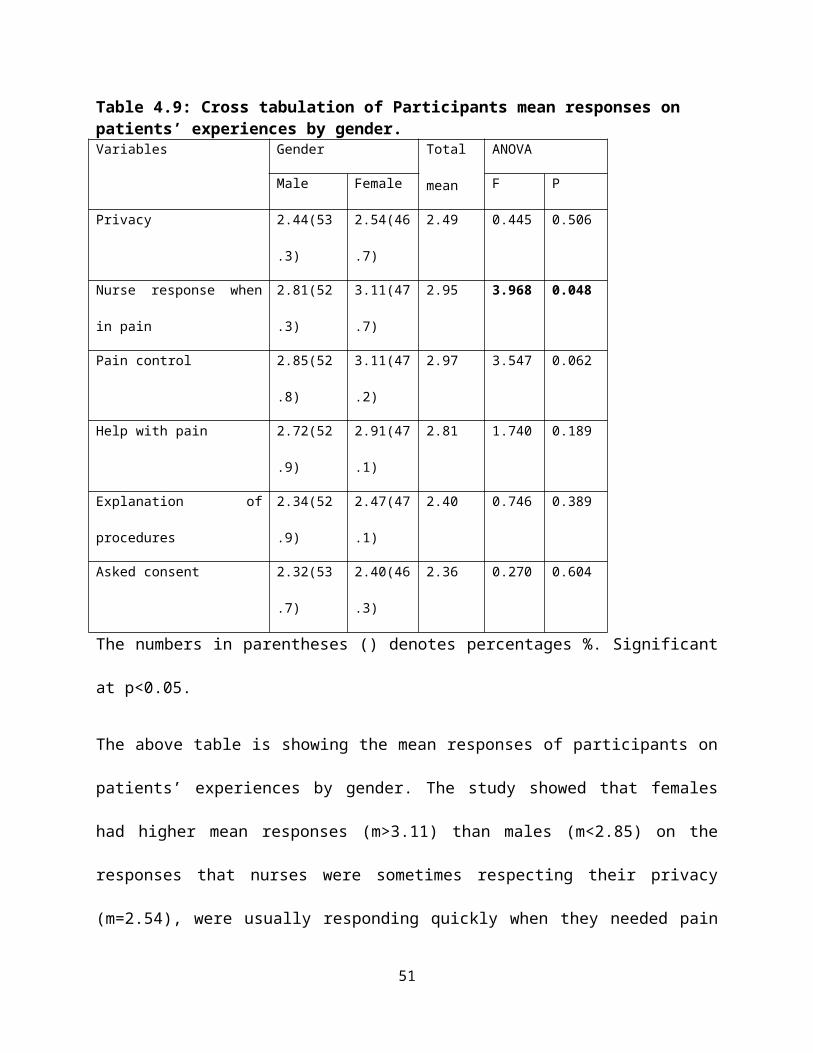
Table 4.9: Cross tabulation of Participants mean responses on patients’ experiences by gender.Variables Gender Total
mean
ANOVA
Male Female F P
Privacy 2.44(53
.3)
2.54(46
.7)
2.49 0.445 0.506
Nurse response when
in pain
2.81(52
.3)
3.11(47
.7)
2.95 3.968 0.048
Pain control 2.85(52
.8)
3.11(47
.2)
2.97 3.547 0.062
Help with pain 2.72(52
.9)
2.91(47
.1)
2.81 1.740 0.189
Explanation of
procedures
2.34(52
.9)
2.47(47
.1)
2.40 0.746 0.389
Asked consent 2.32(53
.7)
2.40(46
.3)
2.36 0.270 0.604
The numbers in parentheses () denotes percentages %. Significant
at p<0.05.
The above table is showing the mean responses of participants on
patients’ experiences by gender. The study showed that females
had higher mean responses (m>3.11) than males (m<2.85) on the
responses that nurses were sometimes respecting their privacy
(m=2.54), were usually responding quickly when they needed pain
51
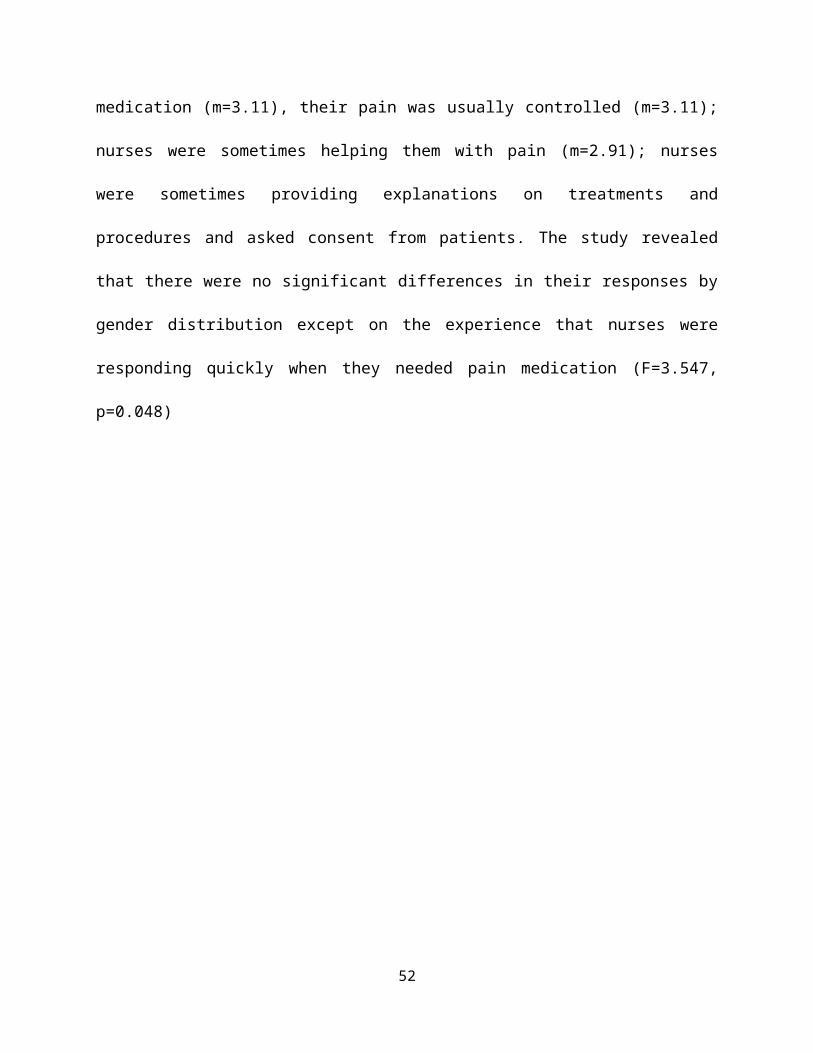
medication (m=3.11), their pain was usually controlled (m=3.11);
nurses were sometimes helping them with pain (m=2.91); nurses
were sometimes providing explanations on treatments and
procedures and asked consent from patients. The study revealed
that there were no significant differences in their responses by
gender distribution except on the experience that nurses were
responding quickly when they needed pain medication (F=3.547,
p=0.048)
52
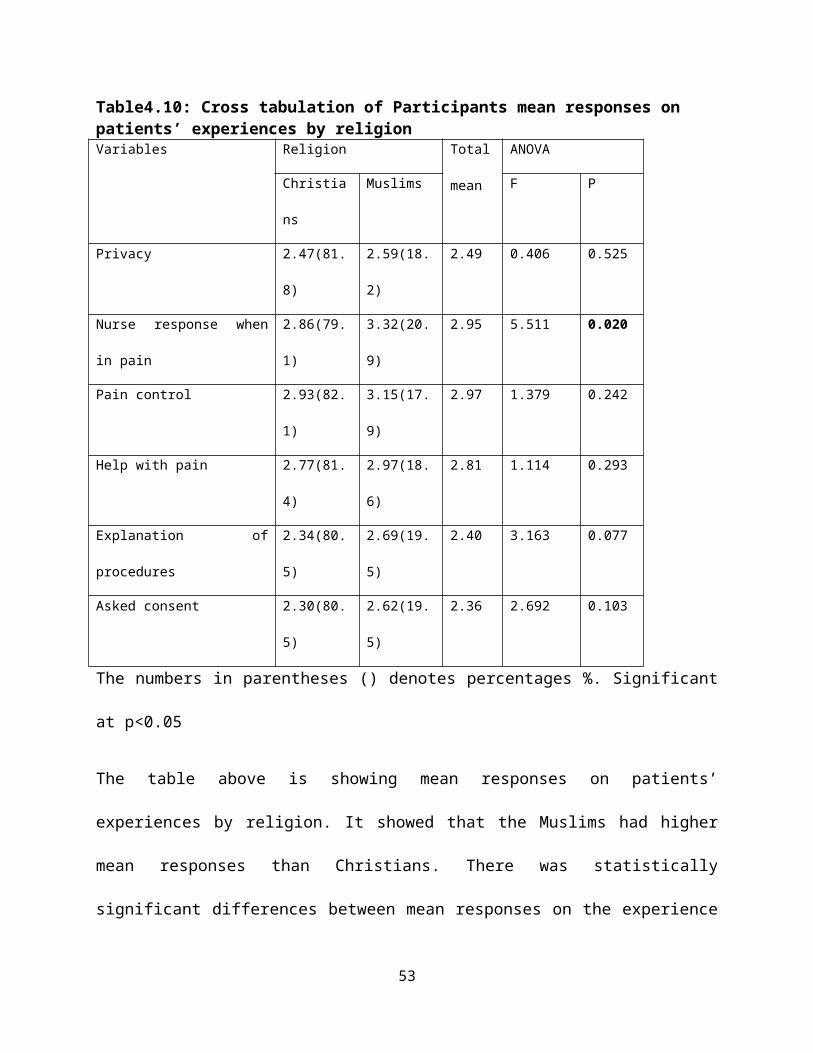
Table4.10: Cross tabulation of Participants mean responses on patients’ experiences by religionVariables Religion Total
mean
ANOVA
Christia
ns
Muslims F P
Privacy 2.47(81.
8)
2.59(18.
2)
2.49 0.406 0.525
Nurse response when
in pain
2.86(79.
1)
3.32(20.
9)
2.95 5.511 0.020
Pain control 2.93(82.
1)
3.15(17.
9)
2.97 1.379 0.242
Help with pain 2.77(81.
4)
2.97(18.
6)
2.81 1.114 0.293
Explanation of
procedures
2.34(80.
5)
2.69(19.
5)
2.40 3.163 0.077
Asked consent 2.30(80.
5)
2.62(19.
5)
2.36 2.692 0.103
The numbers in parentheses () denotes percentages %. Significant
at p<0.05
The table above is showing mean responses on patients’
experiences by religion. It showed that the Muslims had higher
mean responses than Christians. There was statistically
significant differences between mean responses on the experience
53
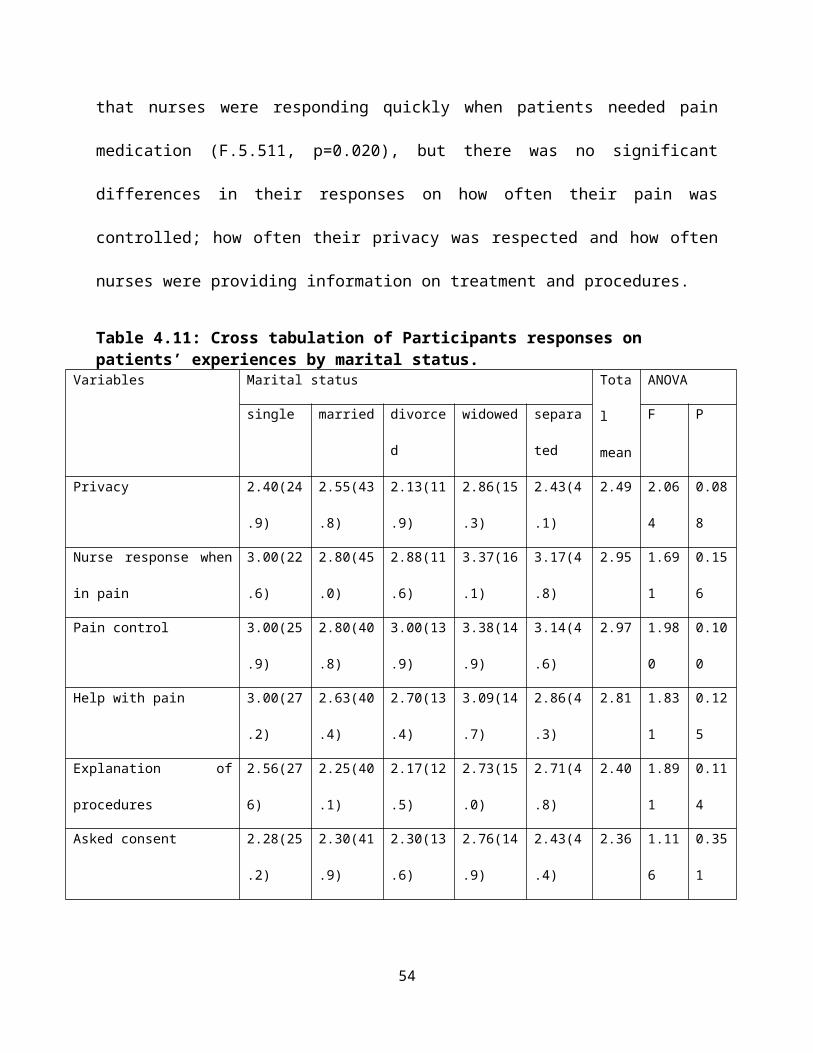
that nurses were responding quickly when patients needed pain
medication (F.5.511, p=0.020), but there was no significant
differences in their responses on how often their pain was
controlled; how often their privacy was respected and how often
nurses were providing information on treatment and procedures.
Table 4.11: Cross tabulation of Participants responses on patients’ experiences by marital status.
Variables Marital status Tota
l
mean
ANOVA
single married divorce
d
widowed separa
ted
F P
Privacy 2.40(24
.9)
2.55(43
.8)
2.13(11
.9)
2.86(15
.3)
2.43(4
.1)
2.49 2.06
4
0.08
8
Nurse response when
in pain
3.00(22
.6)
2.80(45
.0)
2.88(11
.6)
3.37(16
.1)
3.17(4
.8)
2.95 1.69
1
0.15
6
Pain control 3.00(25
.9)
2.80(40
.8)
3.00(13
.9)
3.38(14
.9)
3.14(4
.6)
2.97 1.98
0
0.10
0
Help with pain 3.00(27
.2)
2.63(40
.4)
2.70(13
.4)
3.09(14
.7)
2.86(4
.3)
2.81 1.83
1
0.12
5
Explanation of
procedures
2.56(27
6)
2.25(40
.1)
2.17(12
.5)
2.73(15
.0)
2.71(4
.8)
2.40 1.89
1
0.11
4
Asked consent 2.28(25
.2)
2.30(41
.9)
2.30(13
.6)
2.76(14
.9)
2.43(4
.4)
2.36 1.11
6
0.35
1
54
The numbers in parentheses () denotes percentages %. Significant
at p<0.05
The table above is showing mean responses of participants on the
patients’ experiences. The study showed that there were no
significant differences among the participants responses by
marital status distribution, p>0.05. The study revealed that the
single, divorced, widowed and separated had their mean responses
(m>3.00), showing that they usually experienced that nurses were
responding quickly when they were in pain and their pain was
usually controlled. The study showed that there were no
statistically significant differences in responses on patients’
experiences’ by marital status distribution, p>0.05
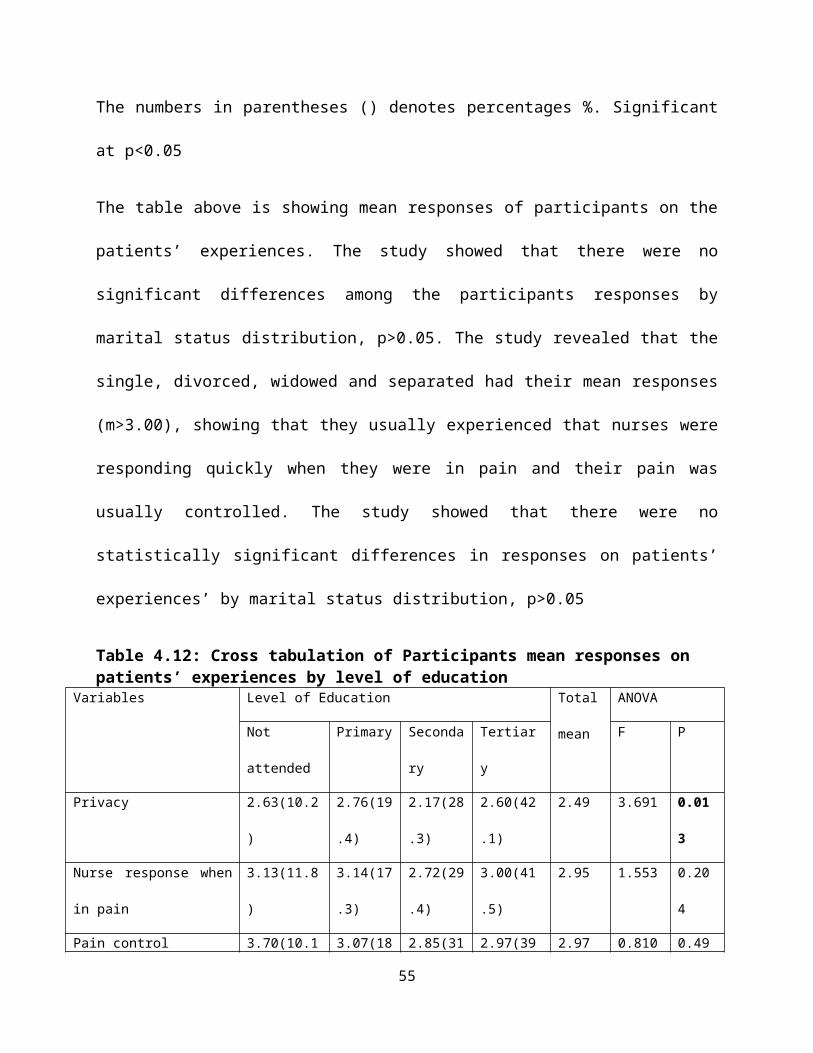
Table 4.12: Cross tabulation of Participants mean responses on patients’ experiences by level of education
Variables Level of Education Total
mean
ANOVA
Not
attended
Primary Seconda
ry
Tertiar
y
F P
Privacy 2.63(10.2
)
2.76(19
.4)
2.17(28
.3)
2.60(42
.1)
2.49 3.691 0.01
3
Nurse response when
in pain
3.13(11.8
)
3.14(17
.3)
2.72(29
.4)
3.00(41
.5)
2.95 1.553 0.20
4
Pain control 3.70(10.1 3.07(18 2.85(31 2.97(39 2.97 0.810 0.49
55
) .7) .8) .4) 0
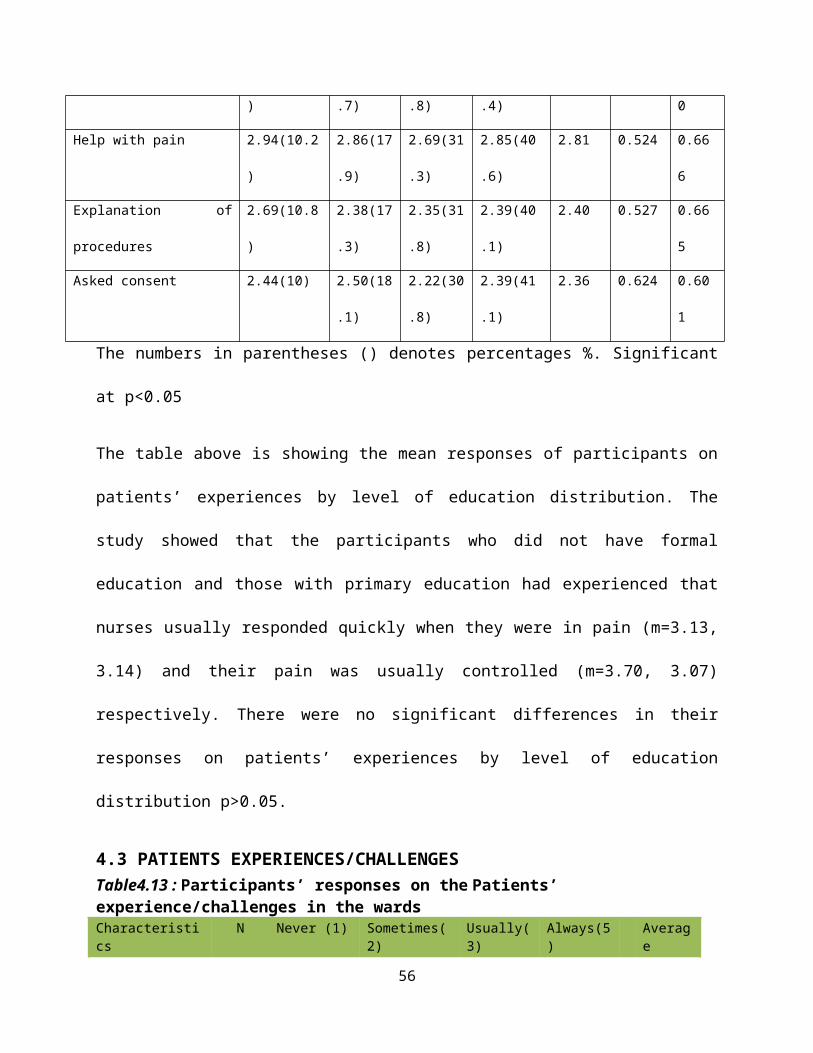
Help with pain 2.94(10.2
)
2.86(17
.9)
2.69(31
.3)
2.85(40
.6)
2.81 0.524 0.66
6
Explanation of
procedures
2.69(10.8
)
2.38(17
.3)
2.35(31
.8)
2.39(40
.1)
2.40 0.527 0.66
5
Asked consent 2.44(10) 2.50(18
.1)
2.22(30
.8)
2.39(41
.1)
2.36 0.624 0.60
1
The numbers in parentheses () denotes percentages %. Significant
at p<0.05
The table above is showing the mean responses of participants on
patients’ experiences by level of education distribution. The
study showed that the participants who did not have formal
education and those with primary education had experienced that
nurses usually responded quickly when they were in pain (m=3.13,
3.14) and their pain was usually controlled (m=3.70, 3.07)
respectively. There were no significant differences in their
responses on patients’ experiences by level of education
distribution p>0.05.
4.3 PATIENTS EXPERIENCES/CHALLENGESTable4.13 : Participants’ responses on the Patients’ experience/challenges in the wardsCharacteristics
N Never (1) Sometimes(2)
Usually(3)
Always(5)
Average
56
Response
Assistance inbathing
86 12(7.1%) 29(17.3%) 20(11.9%)
25(14.9%)
2.67
support to bathroom/toilet
106 8(4.8%) 62(36.9%) 8(4.8%) 28(16.7%)
2.53
Observation of privacy
166 20(11.9%) 73(43.5%) 45(26.8%)
28(16.7%)
2.49
Nurses introduction
165 61(36.3%) 52(31.0%) 32(19.0%)
20(11.9%)
2.07
Nurses quick response to pain.
135 3(1.8%) 48(28.6%) 37(22.0%)
47(28.0%)
2.95
How often waspain controlled
160 1(0.6%) 60(35.7%) 42(25.0%)
57(33.9%)
2.97
Nurses efforttowards pain control.
165 5(3.0%) 70(41.7%) 42(25.0%)
48(28.6%)
2.81
explanation about procedures
166 28(16.7%)
71(42.3%) 39(23.2%)
28(16.7%)
2.40
consent to doprocedures
165 33(19.6%) 63(37.5%) 46(27.4%)
23(13.7%)
2.36
The above table shows participants responses on their experiences
and challenges. It indicates that patients had a positive
experience because the scores in almost all variables are above
average score of 2.50 except in “nurses introduction” 41% (2.07),
observation of patients’ privacy 50% (2.49), explanation about
procedures to patients 48% (2.40) and asking for consent from
nurses 47% (2.36)” are below average score. This indicated that
majority of the participants experienced lack of privacy,
57
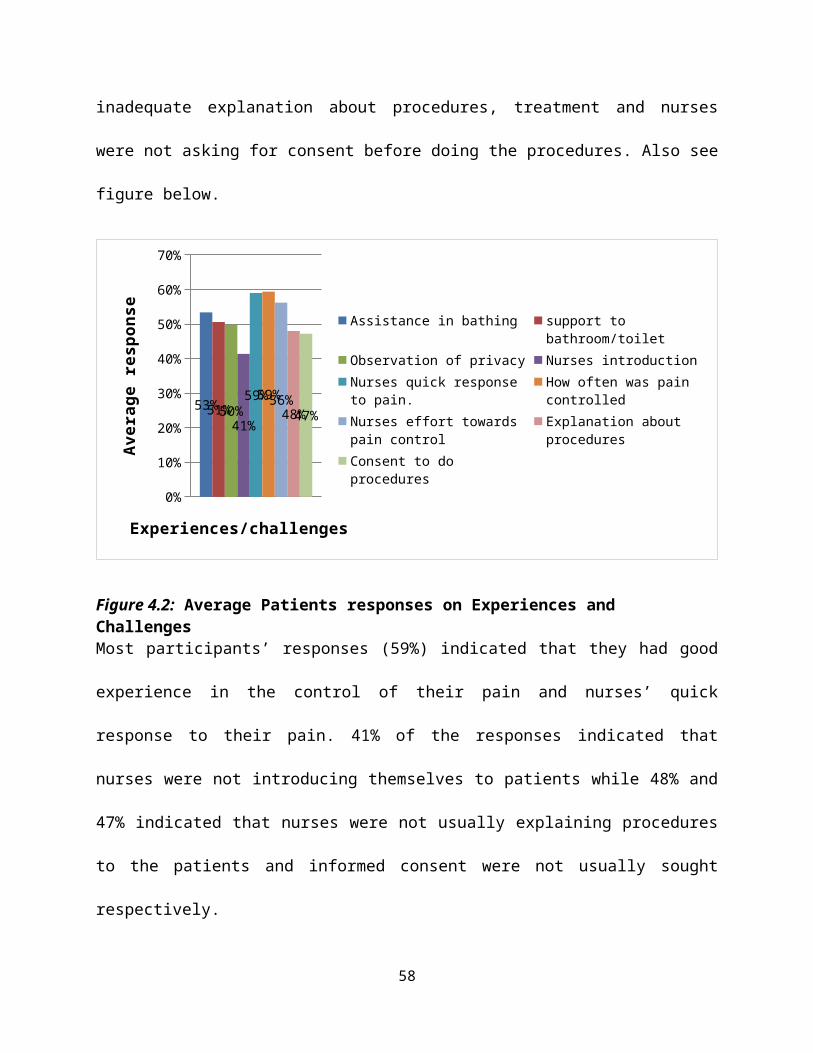
inadequate explanation about procedures, treatment and nurses
were not asking for consent before doing the procedures. Also see
figure below.
0%
10%
20%
30%
40%
50%
60%
70%
53%51%50%41%
59%59%56%48%47%
Assistance in bathing support to bathroom/toilet
Observation of privacy Nurses introductionNurses quick response to pain.
How often was pain controlled
Nurses effort towards pain control
Explanation about procedures
Consent to do procedures
Experiences/challenges
Aver
age
resp
onse
Figure 4.2: Average Patients responses on Experiences and ChallengesMost participants’ responses (59%) indicated that they had good
experience in the control of their pain and nurses’ quick
response to their pain. 41% of the responses indicated that
nurses were not introducing themselves to patients while 48% and
47% indicated that nurses were not usually explaining procedures
to the patients and informed consent were not usually sought
respectively.
58
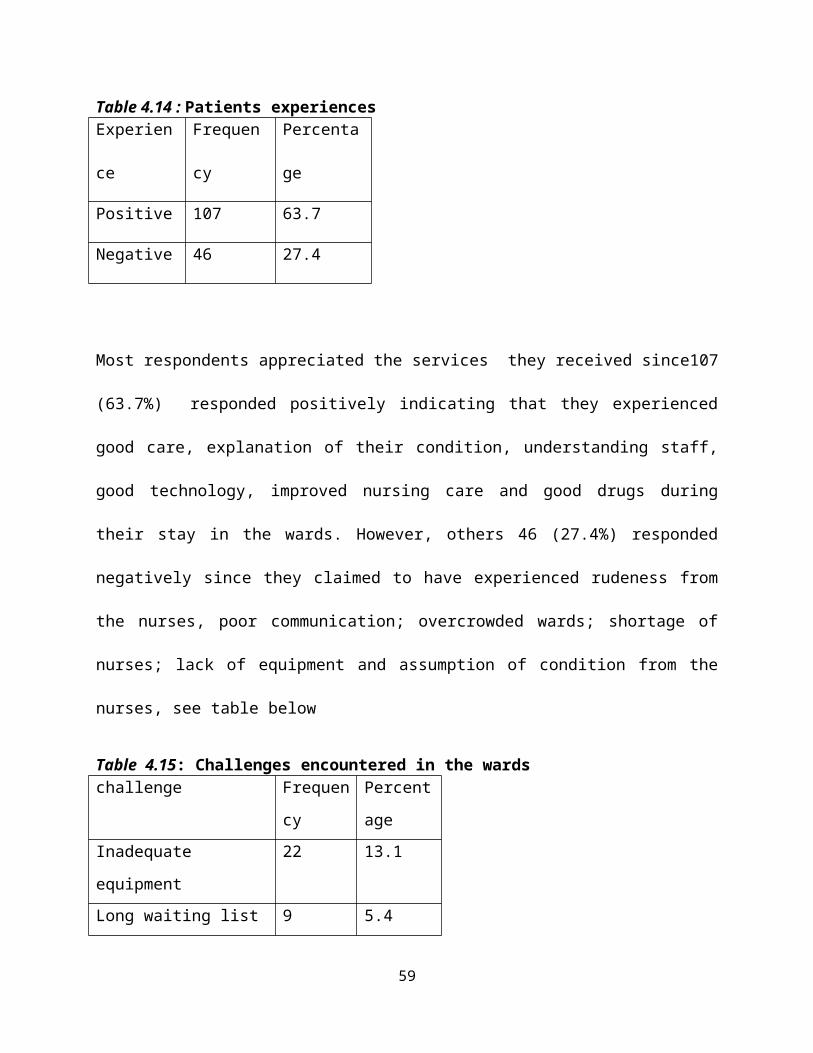
Table 4.14 : Patients experiencesExperien
ce
Frequen
cy
Percenta
ge
Positive 107 63.7
Negative 46 27.4
Most respondents appreciated the services they received since107
(63.7%) responded positively indicating that they experienced
good care, explanation of their condition, understanding staff,
good technology, improved nursing care and good drugs during
their stay in the wards. However, others 46 (27.4%) responded
negatively since they claimed to have experienced rudeness from
the nurses, poor communication; overcrowded wards; shortage of
nurses; lack of equipment and assumption of condition from the
nurses, see table below
Table 4.15: Challenges encountered in the wardschallenge Frequen
cy
Percent
age Inadequate
equipment
22 13.1
Long waiting list 9 5.4
59
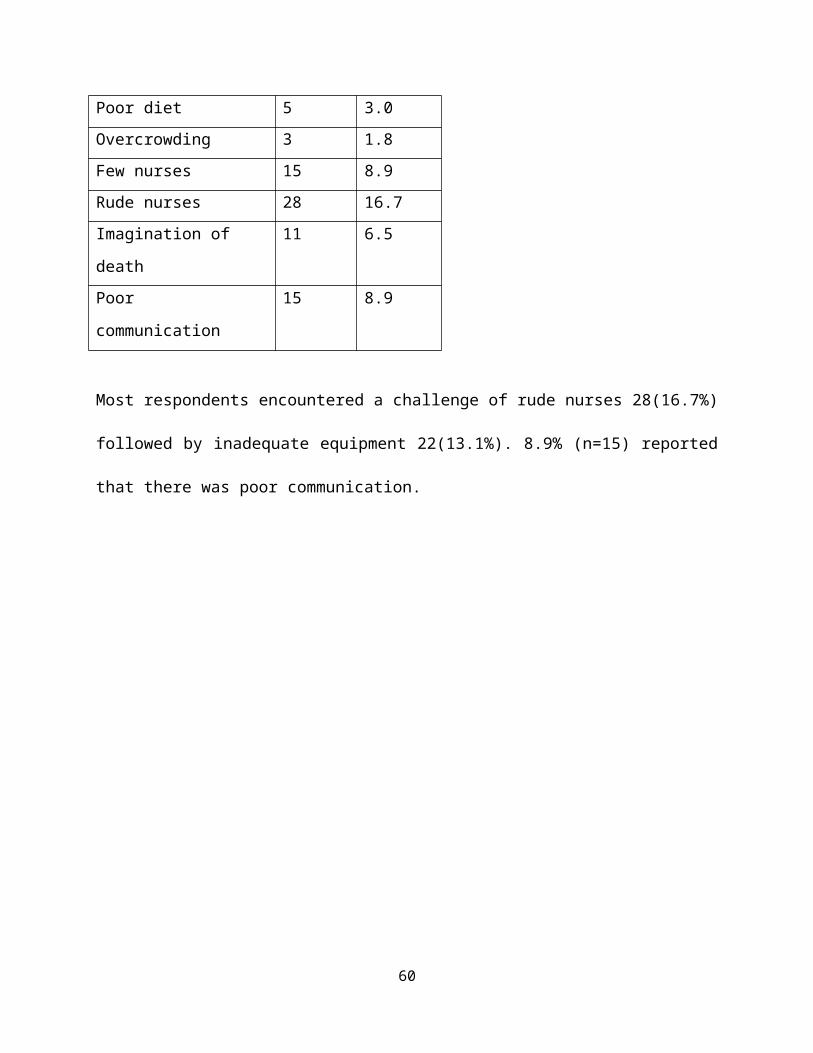
Poor diet 5 3.0Overcrowding 3 1.8Few nurses 15 8.9Rude nurses 28 16.7Imagination of
death
11 6.5
Poor
communication
15 8.9
Most respondents encountered a challenge of rude nurses 28(16.7%)
followed by inadequate equipment 22(13.1%). 8.9% (n=15) reported
that there was poor communication.
60
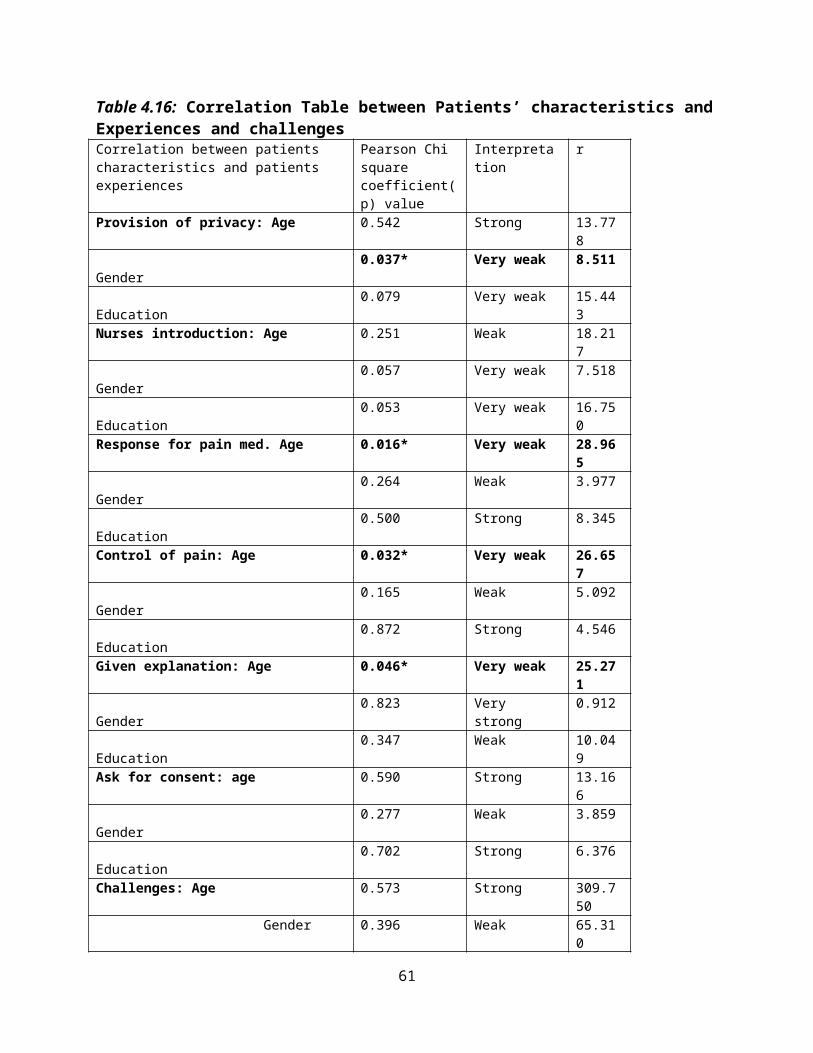
Table 4.16: Correlation Table between Patients’ characteristics andExperiences and challengesCorrelation between patients characteristics and patients experiences
Pearson Chi square coefficient(p) value
Interpretation
r
Provision of privacy: Age 0.542 Strong 13.778
Gender
0.037* Very weak 8.511
Education
0.079 Very weak 15.443
Nurses introduction: Age 0.251 Weak 18.217
Gender
0.057 Very weak 7.518
Education
0.053 Very weak 16.750
Response for pain med. Age 0.016* Very weak 28.965
Gender
0.264 Weak 3.977
Education
0.500 Strong 8.345
Control of pain: Age 0.032* Very weak 26.657
Gender
0.165 Weak 5.092
Education
0.872 Strong 4.546
Given explanation: Age 0.046* Very weak 25.271
Gender
0.823 Very strong
0.912
Education
0.347 Weak 10.049
Ask for consent: age 0.590 Strong 13.166
Gender
0.277 Weak 3.859
Education
0.702 Strong 6.376
Challenges: Age 0.573 Strong 309.750
Gender 0.396 Weak 65.310
61
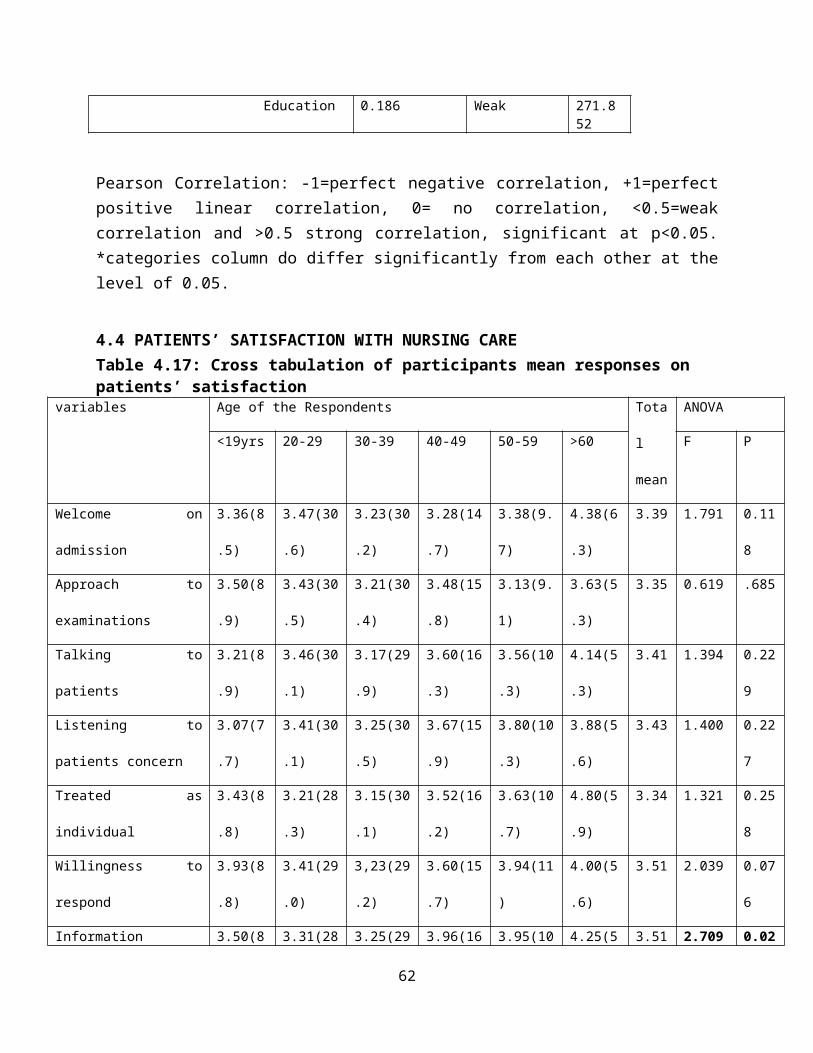
Education 0.186 Weak 271.852
Pearson Correlation: -1=perfect negative correlation, +1=perfectpositive linear correlation, 0= no correlation, <0.5=weakcorrelation and >0.5 strong correlation, significant at p<0.05.*categories column do differ significantly from each other at thelevel of 0.05.
4.4 PATIENTS’ SATISFACTION WITH NURSING CARETable 4.17: Cross tabulation of participants mean responses on patients’ satisfaction
variables Age of the Respondents Tota
l
mean
ANOVA
<19yrs 20-29 30-39 40-49 50-59 >60 F P
Welcome on
admission
3.36(8
.5)
3.47(30
.6)
3.23(30
.2)
3.28(14
.7)
3.38(9.
7)
4.38(6
.3)
3.39 1.791 0.11
8
Approach to
examinations
3.50(8
.9)
3.43(30
.5)
3.21(30
.4)
3.48(15
.8)
3.13(9.
1)
3.63(5
.3)
3.35 0.619 .685
Talking to
patients
3.21(8
.9)
3.46(30
.1)
3.17(29
.9)
3.60(16
.3)
3.56(10
.3)
4.14(5
.3)
3.41 1.394 0.22
9
Listening to
patients concern
3.07(7
.7)
3.41(30
.1)
3.25(30
.5)
3.67(15
.9)
3.80(10
.3)
3.88(5
.6)
3.43 1.400 0.22
7
Treated as
individual
3.43(8
.8)
3.21(28
.3)
3.15(30
.1)
3.52(16
.2)
3.63(10
.7)
4.80(5
.9)
3.34 1.321 0.25
8
Willingness to
respond
3.93(8
.8)
3.41(29
.0)
3,23(29
.2)
3.60(15
.7)
3.94(11
)
4.00(5
.6)
3.51 2.039 0.07
6
Information 3.50(8 3.31(28 3.25(29 3.96(16 3.95(10 4.25(5 3.51 2.709 0.02
62
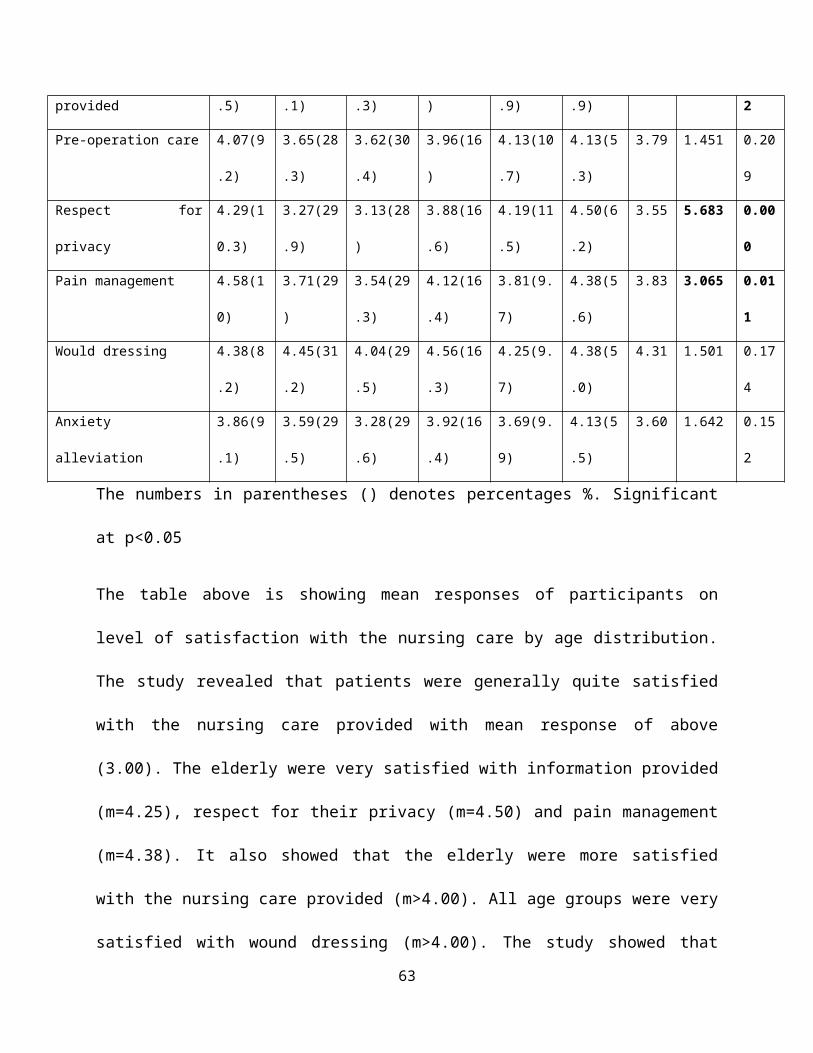
provided .5) .1) .3) ) .9) .9) 2
Pre-operation care 4.07(9
.2)
3.65(28
.3)
3.62(30
.4)
3.96(16
)
4.13(10
.7)
4.13(5
.3)
3.79 1.451 0.20
9
Respect for
privacy
4.29(1
0.3)
3.27(29
.9)
3.13(28
)
3.88(16
.6)
4.19(11
.5)
4.50(6
.2)
3.55 5.683 0.00
0
Pain management 4.58(1
0)
3.71(29
)
3.54(29
.3)
4.12(16
.4)
3.81(9.
7)
4.38(5
.6)
3.83 3.065 0.01
1
Would dressing 4.38(8
.2)
4.45(31
.2)
4.04(29
.5)
4.56(16
.3)
4.25(9.
7)
4.38(5
.0)
4.31 1.501 0.17
4
Anxiety
alleviation
3.86(9
.1)
3.59(29
.5)
3.28(29
.6)
3.92(16
.4)
3.69(9.
9)
4.13(5
.5)
3.60 1.642 0.15
2
The numbers in parentheses () denotes percentages %. Significant
at p<0.05
The table above is showing mean responses of participants on
level of satisfaction with the nursing care by age distribution.
The study revealed that patients were generally quite satisfied
with the nursing care provided with mean response of above
(3.00). The elderly were very satisfied with information provided
(m=4.25), respect for their privacy (m=4.50) and pain management
(m=4.38). It also showed that the elderly were more satisfied
with the nursing care provided (m>4.00). All age groups were very
satisfied with wound dressing (m>4.00). The study showed that
63
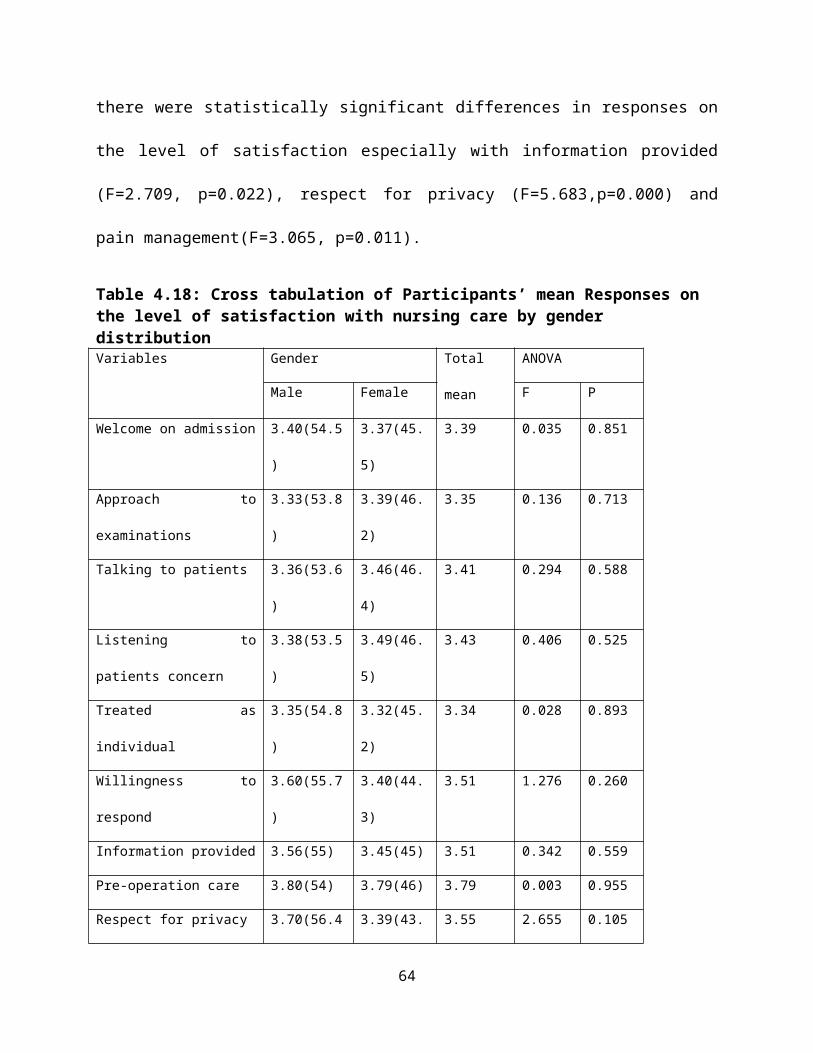
there were statistically significant differences in responses on
the level of satisfaction especially with information provided
(F=2.709, p=0.022), respect for privacy (F=5.683,p=0.000) and
pain management(F=3.065, p=0.011).
Table 4.18: Cross tabulation of Participants’ mean Responses on the level of satisfaction with nursing care by gender distributionVariables Gender Total
mean
ANOVA
Male Female F P
Welcome on admission 3.40(54.5
)
3.37(45.
5)
3.39 0.035 0.851
Approach to
examinations
3.33(53.8
)
3.39(46.
2)
3.35 0.136 0.713
Talking to patients 3.36(53.6
)
3.46(46.
4)
3.41 0.294 0.588
Listening to
patients concern
3.38(53.5
)
3.49(46.
5)
3.43 0.406 0.525
Treated as
individual
3.35(54.8
)
3.32(45.
2)
3.34 0.028 0.893
Willingness to
respond
3.60(55.7
)
3.40(44.
3)
3.51 1.276 0.260
Information provided 3.56(55) 3.45(45) 3.51 0.342 0.559
Pre-operation care 3.80(54) 3.79(46) 3.79 0.003 0.955
Respect for privacy 3.70(56.4 3.39(43. 3.55 2.655 0.105
64
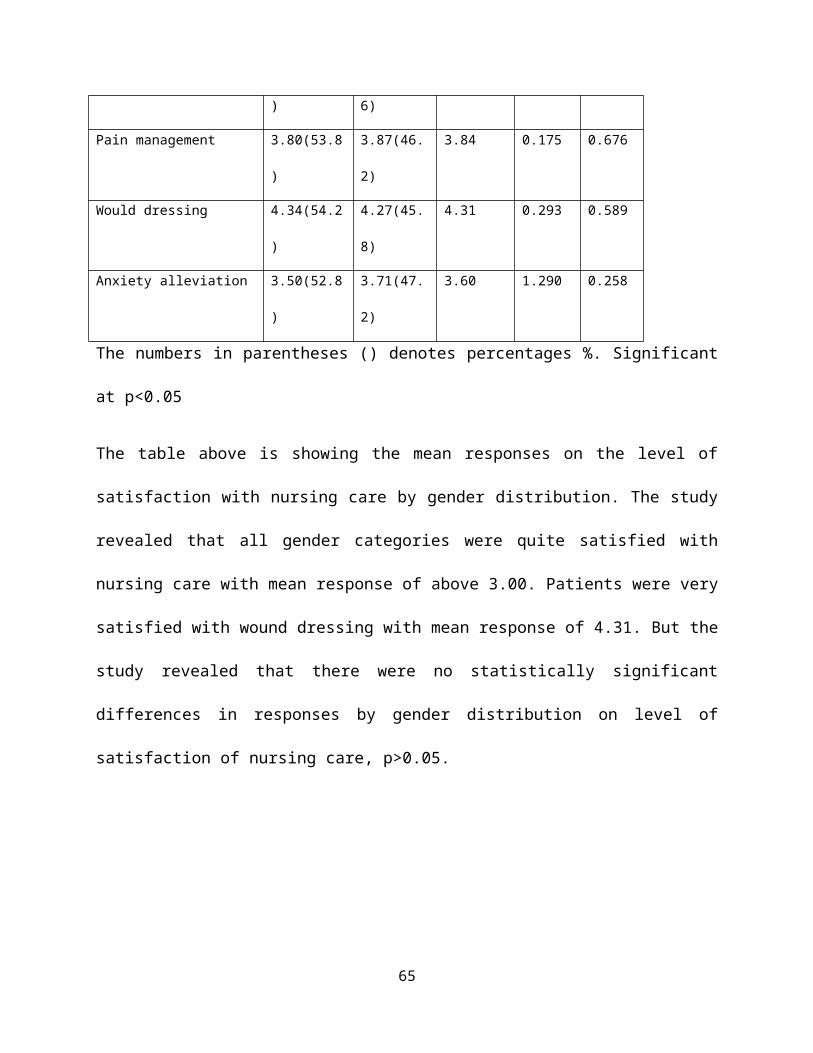
) 6)
Pain management 3.80(53.8
)
3.87(46.
2)
3.84 0.175 0.676
Would dressing 4.34(54.2
)
4.27(45.
8)
4.31 0.293 0.589
Anxiety alleviation 3.50(52.8
)
3.71(47.
2)
3.60 1.290 0.258
The numbers in parentheses () denotes percentages %. Significant
at p<0.05
The table above is showing the mean responses on the level of
satisfaction with nursing care by gender distribution. The study
revealed that all gender categories were quite satisfied with
nursing care with mean response of above 3.00. Patients were very
satisfied with wound dressing with mean response of 4.31. But the
study revealed that there were no statistically significant
differences in responses by gender distribution on level of
satisfaction of nursing care, p>0.05.
65
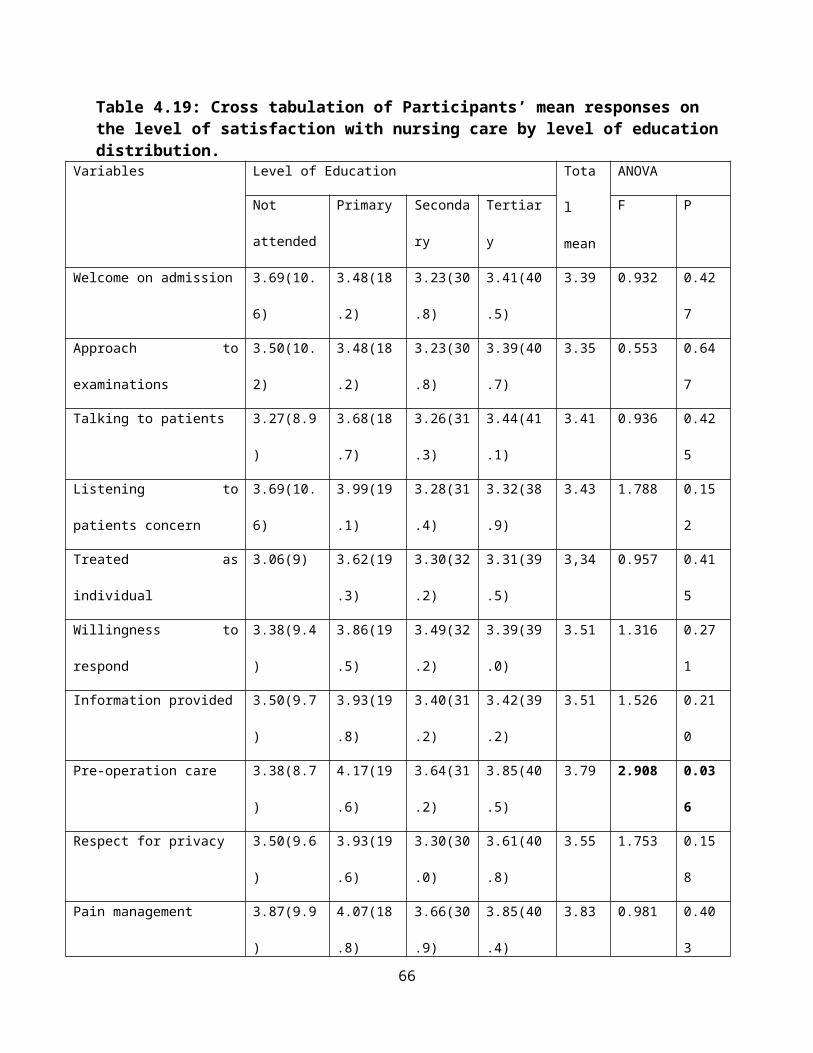
Table 4.19: Cross tabulation of Participants’ mean responses on the level of satisfaction with nursing care by level of educationdistribution.
Variables Level of Education Tota
l
mean
ANOVA
Not
attended
Primary Seconda
ry
Tertiar
y
F P
Welcome on admission 3.69(10.
6)
3.48(18
.2)
3.23(30
.8)
3.41(40
.5)
3.39 0.932 0.42
7
Approach to
examinations
3.50(10.
2)
3.48(18
.2)
3.23(30
.8)
3.39(40
.7)
3.35 0.553 0.64
7
Talking to patients 3.27(8.9
)
3.68(18
.7)
3.26(31
.3)
3.44(41
.1)
3.41 0.936 0.42
5
Listening to
patients concern
3.69(10.
6)
3.99(19
.1)
3.28(31
.4)
3.32(38
.9)
3.43 1.788 0.15
2
Treated as
individual
3.06(9) 3.62(19
.3)
3.30(32
.2)
3.31(39
.5)
3,34 0.957 0.41
5
Willingness to
respond
3.38(9.4
)
3.86(19
.5)
3.49(32
.2)
3.39(39
.0)
3.51 1.316 0.27
1
Information provided 3.50(9.7
)
3.93(19
.8)
3.40(31
.2)
3.42(39
.2)
3.51 1.526 0.21
0
Pre-operation care 3.38(8.7
)
4.17(19
.6)
3.64(31
.2)
3.85(40
.5)
3.79 2.908 0.03
6
Respect for privacy 3.50(9.6
)
3.93(19
.6)
3.30(30
.0)
3.61(40
.8)
3.55 1.753 0.15
8
Pain management 3.87(9.9
)
4.07(18
.8)
3.66(30
.9)
3.85(40
.4)
3.83 0.981 0.40
3
66
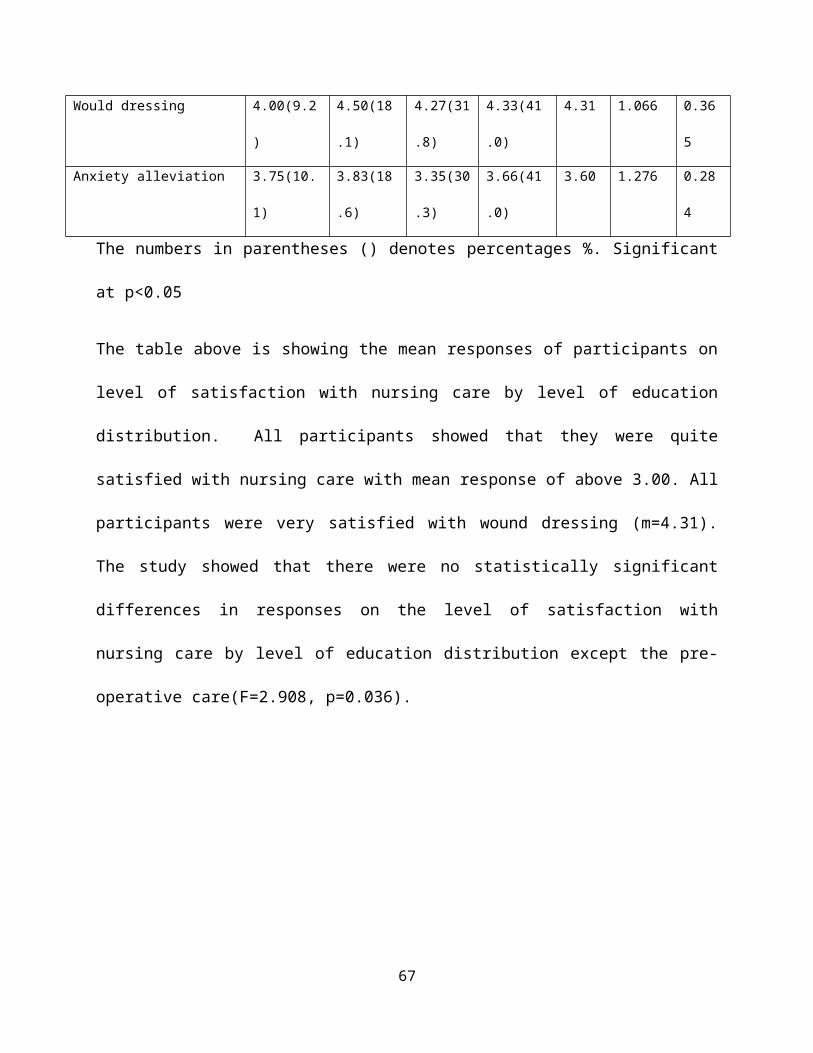
Would dressing 4.00(9.2
)
4.50(18
.1)
4.27(31
.8)
4.33(41
.0)
4.31 1.066 0.36
5
Anxiety alleviation 3.75(10.
1)
3.83(18
.6)
3.35(30
.3)
3.66(41
.0)
3.60 1.276 0.28
4
The numbers in parentheses () denotes percentages %. Significant
at p<0.05
The table above is showing the mean responses of participants on
level of satisfaction with nursing care by level of education
distribution. All participants showed that they were quite
satisfied with nursing care with mean response of above 3.00. All
participants were very satisfied with wound dressing (m=4.31).
The study showed that there were no statistically significant
differences in responses on the level of satisfaction with
nursing care by level of education distribution except the pre-
operative care(F=2.908, p=0.036).
67
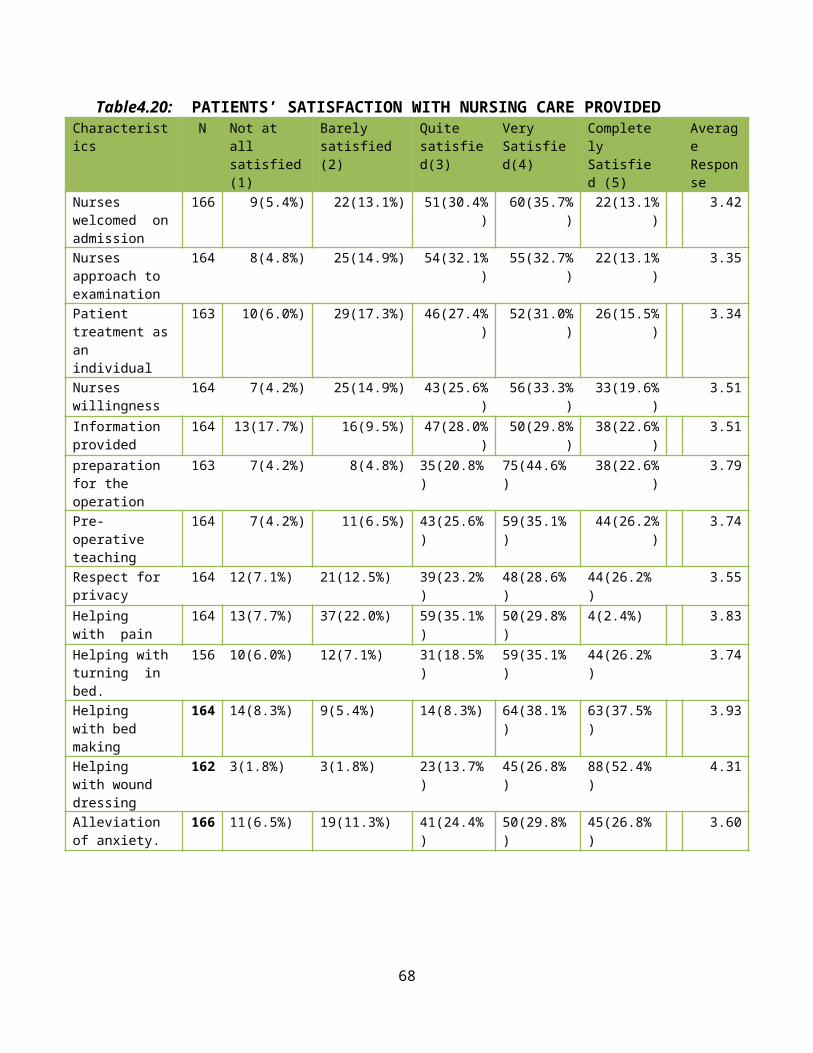
Table4.20: PATIENTS’ SATISFACTION WITH NURSING CARE PROVIDEDCharacteristics
N Not at all satisfied(1)
Barely satisfied (2)
Quite satisfied(3)
Very Satisfied(4)
CompletelySatisfied (5)
AverageResponse
Nurses welcomed onadmission
166 9(5.4%) 22(13.1%) 51(30.4%)
60(35.7%)
22(13.1%)
3.42
Nurses approach to examination
164 8(4.8%) 25(14.9%) 54(32.1%)
55(32.7%)
22(13.1%)
3.35
Patient treatment asan individual
163 10(6.0%) 29(17.3%) 46(27.4%)
52(31.0%)
26(15.5%)
3.34
Nurses willingness
164 7(4.2%) 25(14.9%) 43(25.6%)
56(33.3%)
33(19.6%)
3.51
Information provided
164 13(17.7%) 16(9.5%) 47(28.0%)
50(29.8%)
38(22.6%)
3.51
preparation for the operation
163 7(4.2%) 8(4.8%) 35(20.8%)
75(44.6%)
38(22.6%)
3.79
Pre-operative teaching
164 7(4.2%) 11(6.5%) 43(25.6%)
59(35.1%)
44(26.2%)
3.74
Respect for privacy
164 12(7.1%) 21(12.5%) 39(23.2%)
48(28.6%)
44(26.2%)
3.55
Helping with pain
164 13(7.7%) 37(22.0%) 59(35.1%)
50(29.8%)
4(2.4%) 3.83
Helping withturning in bed.
156 10(6.0%) 12(7.1%) 31(18.5%)
59(35.1%)
44(26.2%)
3.74
Helping with bed making
164 14(8.3%) 9(5.4%) 14(8.3%) 64(38.1%)
63(37.5%)
3.93
Helping with wound dressing
162 3(1.8%) 3(1.8%) 23(13.7%)
45(26.8%)
88(52.4%)
4.31
Alleviation of anxiety.
166 11(6.5%) 19(11.3%) 41(24.4%)
50(29.8%)
45(26.8%)
3.60
68
The table above is showing level of patient’s satisfaction with
nursing care. It shows that majority of respondents were quite
satisfied with nursing care with a mean response of above 3.00.
Most respondents 88(52.4%) were more satisfied with wound
dressing with mean response of (mean=4.31) followed by bed making
38.1% (n=64) with mean response of (mean=3.93).
69
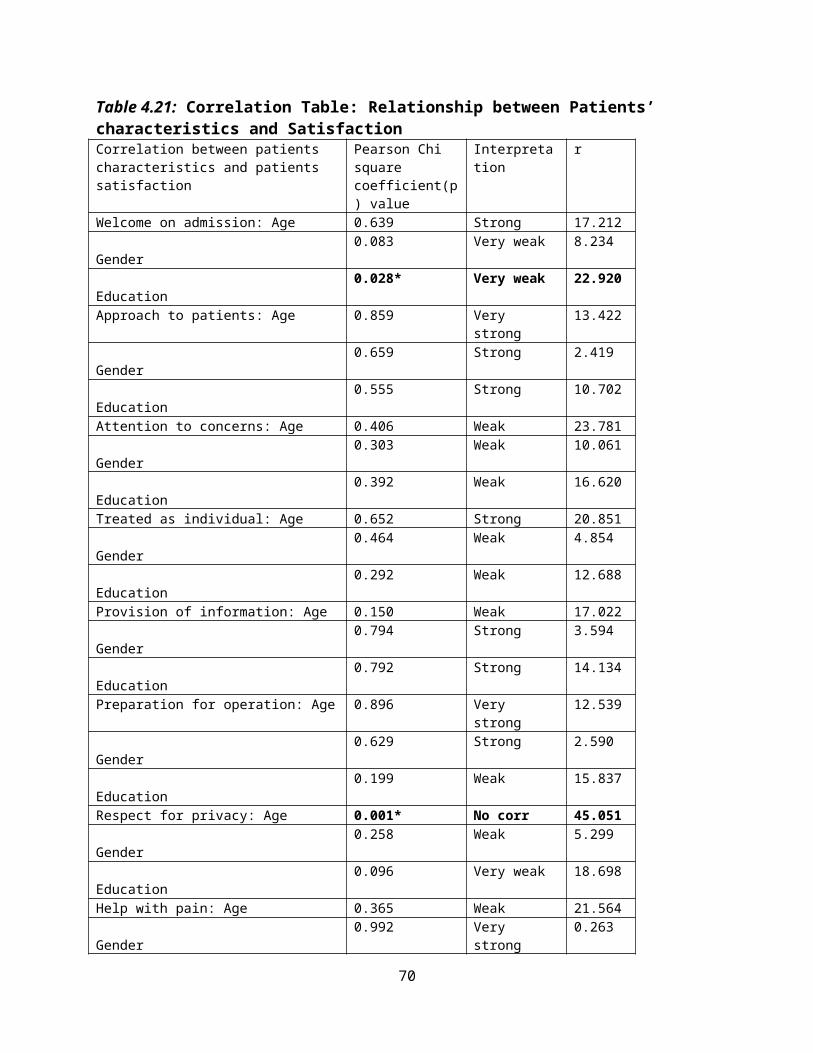
Table 4.21: Correlation Table: Relationship between Patients’ characteristics and SatisfactionCorrelation between patients characteristics and patients satisfaction
Pearson Chi square coefficient(p) value
Interpretation
r
Welcome on admission: Age 0.639 Strong 17.212 Gender
0.083 Very weak 8.234
Education
0.028* Very weak 22.920
Approach to patients: Age 0.859 Very strong
13.422
Gender
0.659 Strong 2.419
Education
0.555 Strong 10.702
Attention to concerns: Age 0.406 Weak 23.781 Gender
0.303 Weak 10.061
Education
0.392 Weak 16.620
Treated as individual: Age 0.652 Strong 20.851 Gender
0.464 Weak 4.854
Education
0.292 Weak 12.688
Provision of information: Age 0.150 Weak 17.022 Gender
0.794 Strong 3.594
Education
0.792 Strong 14.134
Preparation for operation: Age 0.896 Very strong
12.539
Gender
0.629 Strong 2.590
Education
0.199 Weak 15.837
Respect for privacy: Age 0.001* No corr 45.051 Gender
0.258 Weak 5.299
Education
0.096 Very weak 18.698
Help with pain: Age 0.365 Weak 21.564 Gender
0.992 Very strong
0.263
70
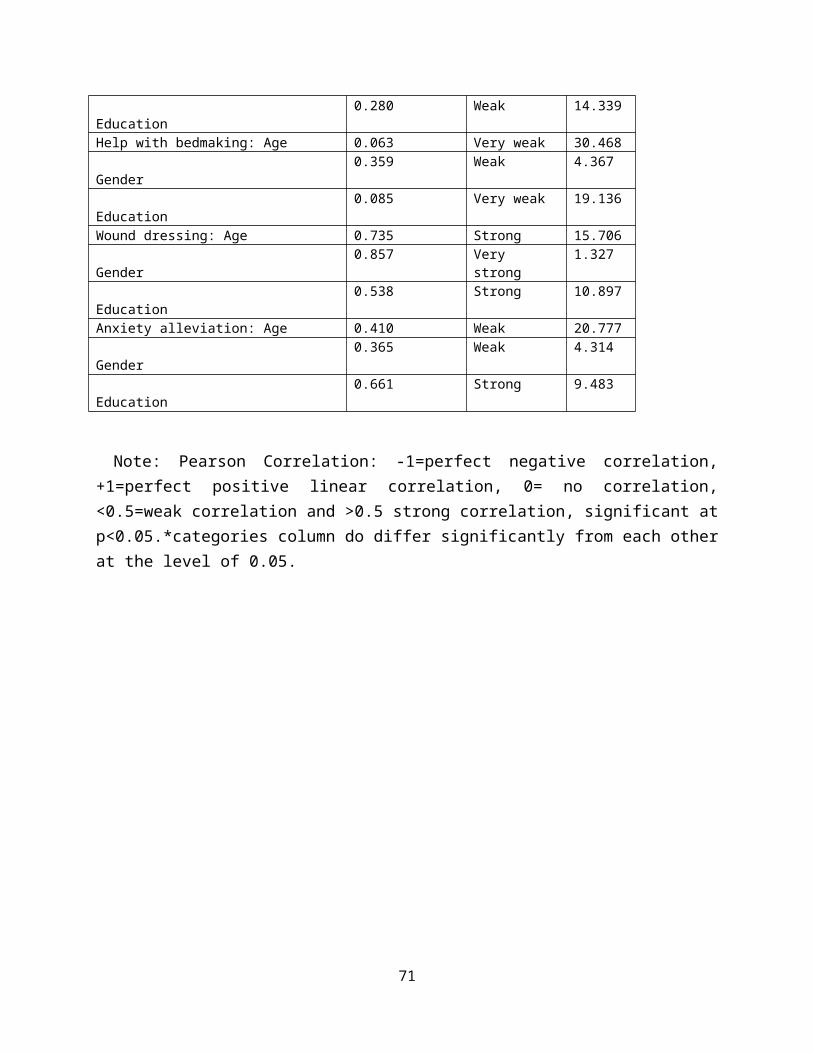
Education
0.280 Weak 14.339
Help with bedmaking: Age 0.063 Very weak 30.468 Gender
0.359 Weak 4.367
Education
0.085 Very weak 19.136
Wound dressing: Age 0.735 Strong 15.706 Gender
0.857 Very strong
1.327
Education
0.538 Strong 10.897
Anxiety alleviation: Age 0.410 Weak 20.777 Gender
0.365 Weak 4.314
Education
0.661 Strong 9.483
Note: Pearson Correlation: -1=perfect negative correlation,+1=perfect positive linear correlation, 0= no correlation,<0.5=weak correlation and >0.5 strong correlation, significant atp<0.05.*categories column do differ significantly from each otherat the level of 0.05.
71
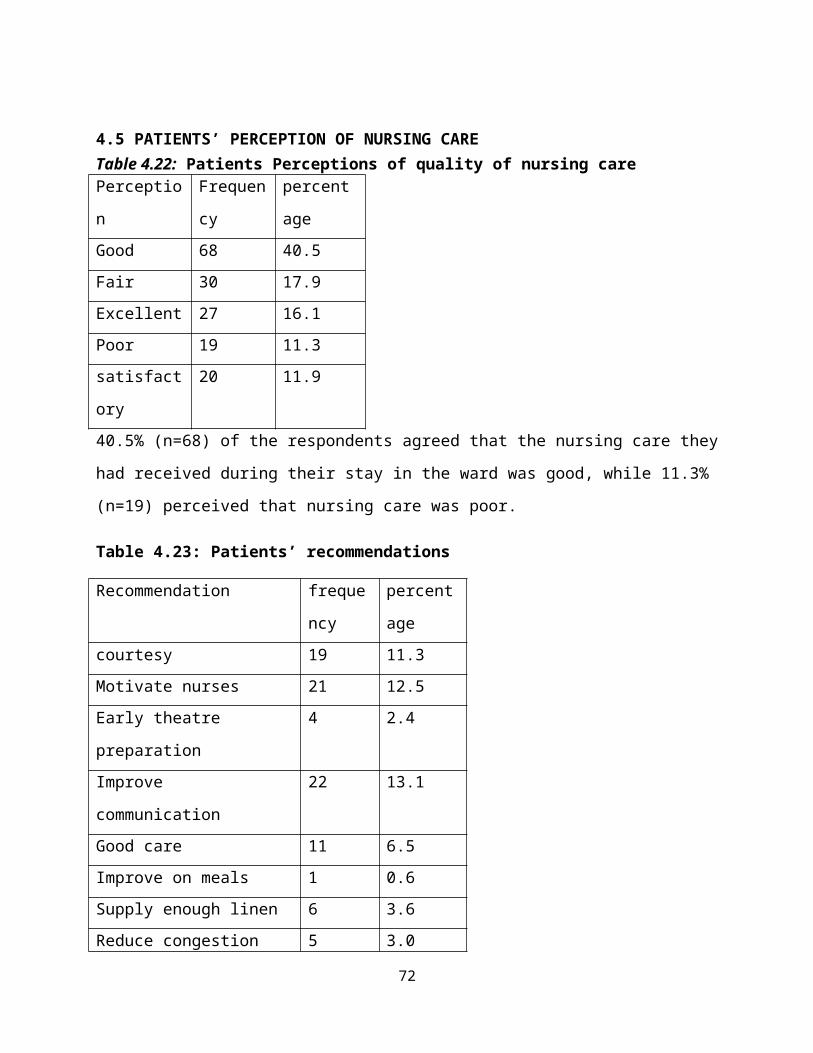
4.5 PATIENTS’ PERCEPTION OF NURSING CARETable 4.22: Patients Perceptions of quality of nursing carePerceptio
n
Frequen
cy
percent
ageGood 68 40.5Fair 30 17.9Excellent 27 16.1Poor 19 11.3satisfact
ory
20 11.9
40.5% (n=68) of the respondents agreed that the nursing care they
had received during their stay in the ward was good, while 11.3%
(n=19) perceived that nursing care was poor.
Table 4.23: Patients’ recommendations
Recommendation freque
ncy
percent
agecourtesy 19 11.3Motivate nurses 21 12.5Early theatre
preparation
4 2.4
Improve
communication
22 13.1
Good care 11 6.5Improve on meals 1 0.6Supply enough linen 6 3.6Reduce congestion 5 3.0
72
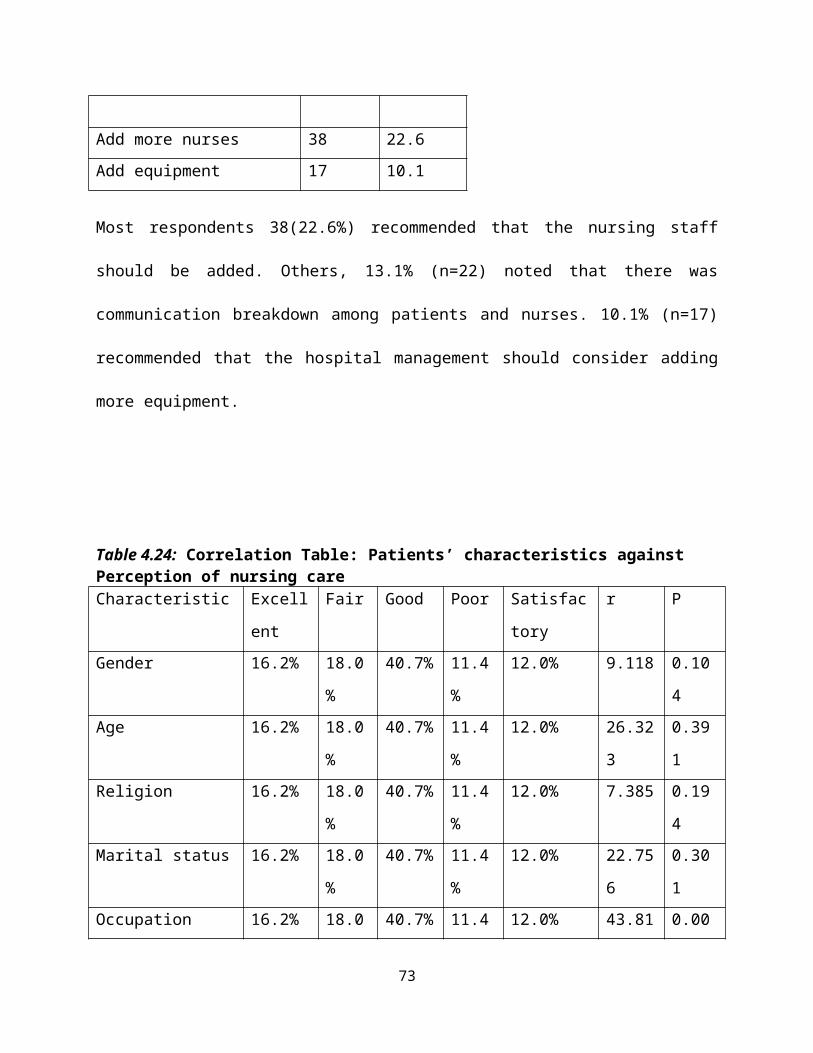
Add more nurses 38 22.6Add equipment 17 10.1
Most respondents 38(22.6%) recommended that the nursing staff
should be added. Others, 13.1% (n=22) noted that there was
communication breakdown among patients and nurses. 10.1% (n=17)
recommended that the hospital management should consider adding
more equipment.
Table 4.24: Correlation Table: Patients’ characteristics against Perception of nursing careCharacteristic Excell
ent
Fair Good Poor Satisfac
tory
r P
Gender 16.2% 18.0
%
40.7% 11.4
%
12.0% 9.118 0.10
4Age 16.2% 18.0
%
40.7% 11.4
%
12.0% 26.32
3
0.39
1Religion 16.2% 18.0
%
40.7% 11.4
%
12.0% 7.385 0.19
4Marital status 16.2% 18.0
%
40.7% 11.4
%
12.0% 22.75
6
0.30
1Occupation 16.2% 18.0 40.7% 11.4 12.0% 43.81 0.00
73
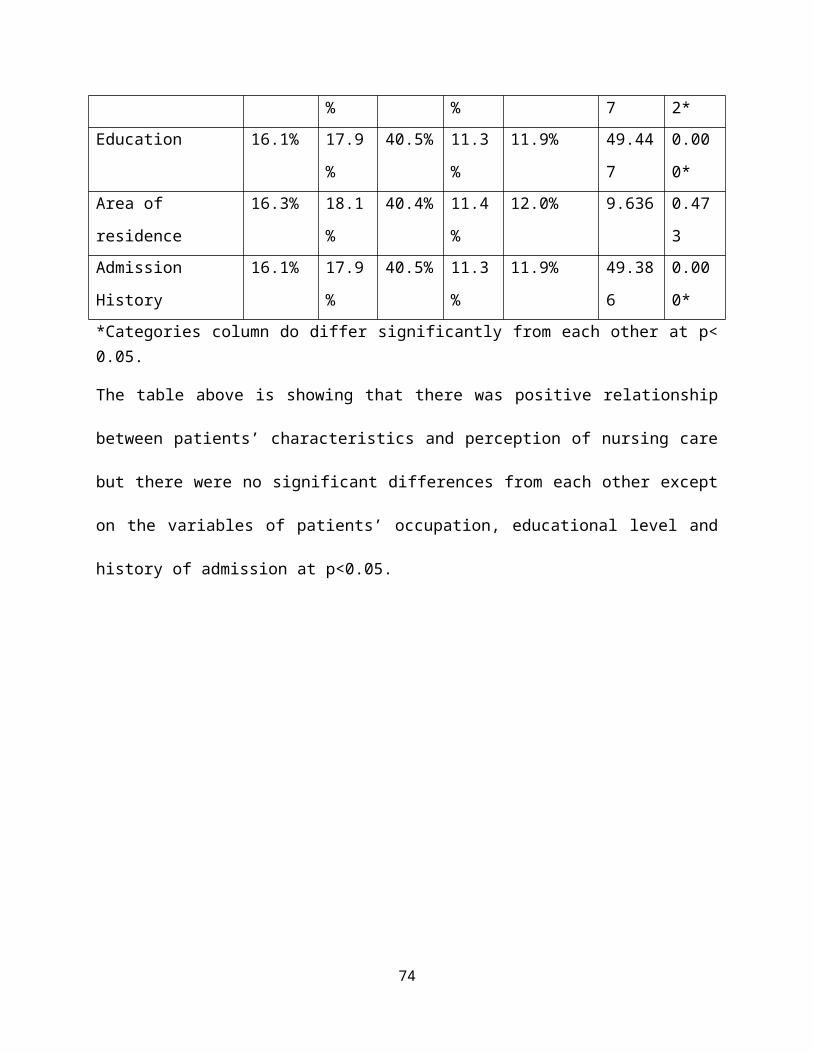
% % 7 2*Education 16.1% 17.9
%
40.5% 11.3
%
11.9% 49.44
7
0.00
0*Area of
residence
16.3% 18.1
%
40.4% 11.4
%
12.0% 9.636 0.47
3Admission
History
16.1% 17.9
%
40.5% 11.3
%
11.9% 49.38
6
0.00
0**Categories column do differ significantly from each other at p<0.05.
The table above is showing that there was positive relationship
between patients’ characteristics and perception of nursing care
but there were no significant differences from each other except
on the variables of patients’ occupation, educational level and
history of admission at p<0.05.
74
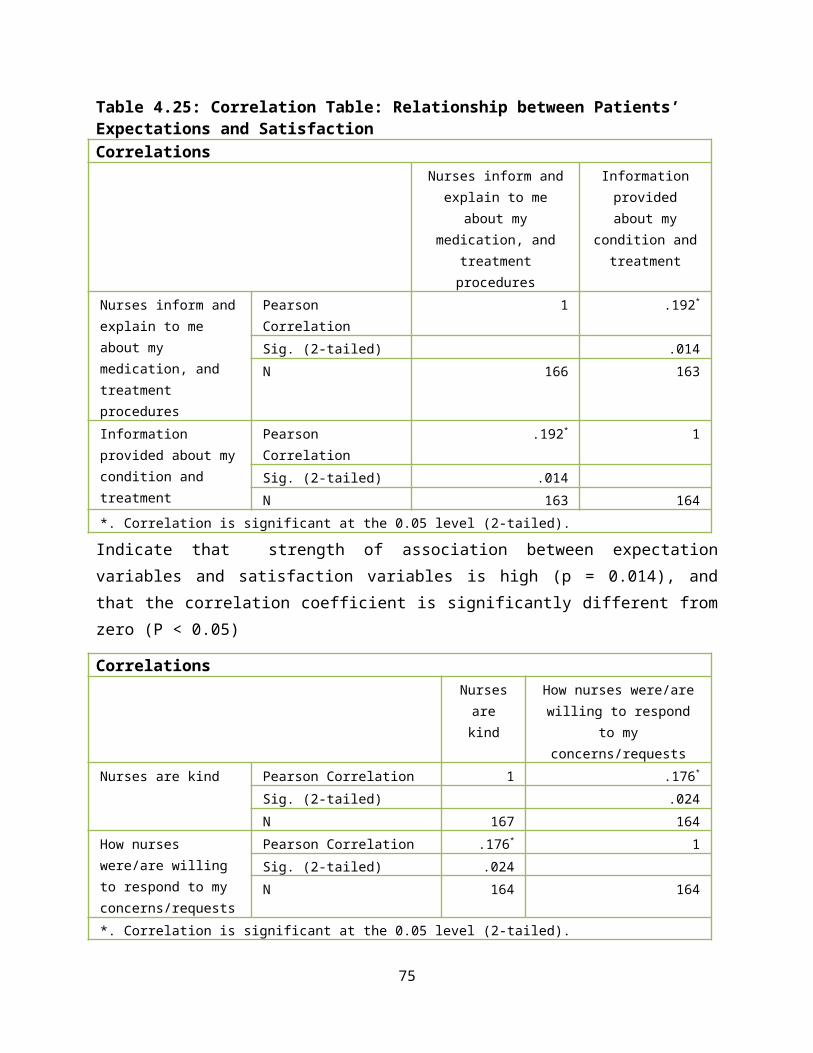
Table 4.25: Correlation Table: Relationship between Patients’ Expectations and SatisfactionCorrelations
Nurses inform andexplain to me
about mymedication, and
treatmentprocedures
Informationprovidedabout my
condition andtreatment
Nurses inform andexplain to me about my medication, and treatment procedures
Pearson Correlation
1 .192*
Sig. (2-tailed) .014N 166 163
Information provided about mycondition and treatment
Pearson Correlation
.192* 1
Sig. (2-tailed) .014N 163 164
*. Correlation is significant at the 0.05 level (2-tailed).
Indicate that strength of association between expectationvariables and satisfaction variables is high (p = 0.014), andthat the correlation coefficient is significantly different fromzero (P < 0.05)
CorrelationsNursesarekind
How nurses were/arewilling to respond
to myconcerns/requests
Nurses are kind Pearson Correlation 1 .176*
Sig. (2-tailed) .024N 167 164
How nurses were/are willing to respond to my concerns/requests
Pearson Correlation .176* 1Sig. (2-tailed) .024N 164 164
*. Correlation is significant at the 0.05 level (2-tailed).
75
Indicate that strength of association between expectationvariables and satisfaction variables is high (p = 0.024), andthat the correlation coefficient is significantly different fromzero (P < 0.05)
76
CHAPTER FIVE: DISCUSSION OF THE RESULTS
5.0: INTRODUCTIONPatient’s perceptions regarding nursing care is one of the
predictors of consumers’ satisfaction with nursing care provided.
In this study, patients in the surgical wards were evaluated
according to patients’ understanding or assessment of nursing
care provided in their own perspective. Although many studies
have been conducted on the quality of nursing, little have been
studied on how patients’ expectations and experiences/challenges
can influence patient’s perception of nursing care. This looked
at how patients’ expectations and experiences influence their
perception of nursing care.
5.1 PATIENTS EXPECTATIONSPatients’ expectations are the characteristics that the patients
expect from nurses as they provide nursing care to patients. If
these expectations are met patients are able to appreciate the
quality of nursing care they have received. The expectations
under study were; that patients expected nurses to be kind,
cheerful, responsive, honesty and friendly, and not to be hash
and rude. Other expectations were that they expected nurses to be77
knowledgeable and competent, communicate to patients about the
nursing care, inform and explain treatment, medication and
procedures to patients and orienting the patients to the ward
environment and regulations.
The study had revealed that almost in all age groups of
participants, they agreed that they were expecting nurses to be
kind (m=3.61). But, the age groups of less than 19 years(9.3%)
and over 60 years(5.3%) strongly agreed that they expected nurses
to be kind(m=4.00). The study showed that there were no
statistically significant differences in responses that they were
expecting nurses to be kind, p>0.05. On nurses to be cheerful;
although participants agreed that they expected nurses to be
cheerful (m=3.78), there were no significant differences in
responses that they expected nurses to be cheerful by age
distribution, p>0.05. The age group of over 60 years strongly
agreed that they expected nurses to be responsive (m=4.25), and
there were statistically significant differences in responses
(F=2.272, p=0.020). Although, all age groups strongly disagreed
that they were expecting nurses to be rude, there were no
significant differences in responses, p>0.05. These findings can78
be compared with the study findings done in Uganda which found
that patients were expecting nurses to be kind, polite and
continued care (Nankhumbi, 2005). The study referred above did
not find any significant differences in responses by patients’
characteristics.
On participants’ mean responses on the patients’ expectations by
gender, the study revealed that females had a higher mean
responses ranging from (m=3.61-3.78), than males (m=3.56-3.76).
This indicated that more females were expecting that nurses
should be kind, cheerful, and responsive and not to be rude. But,
these mean responses did not show that there were statistically
significant differences in responses by gender distribution,
p>0.05. Hence gender had little influence on patients’
expectations.
Participants’ mean responses by religion were that they agreed
that they were expecting nurses to be kind, cheerful, and
responsive but not rude. The study also revealed that there were
more Christians (82.7%) than Muslims (17.3%) that participated in
the study. Among the Christians (81.3%) m=3.55 agreed that they
79
expected nurses to be kind and 18.3% (m=3.90) of Muslims agreed
that they expected nurses to be kind. Although, the study
revealed that Muslims had a higher mean response (m>3.90) than
Christians (m<3.74), there were no significant differences in
responses by religion distribution, p>0.05. Therefore, religion
did not affect what patients were expecting from nursing care.
Participants mean responses on patients’ expectations by marital
status revealed that all categories were expecting that nurses
should be kind, cheerful, and responsive and strongly disagreed
that nurses should be rude. The separated (4.8%) and widowed
(13.9%) strongly agreed that they were expecting nurses to be
cheerful (m=4.29 and m=4.00 respectively) and also to be
responsive to patients’ concerns (m=4.29 and 4.05 respectively).
The study also showed that there was statistically significant
differences among mean patients’ responses by marital status on
patients’ expectation of nurses responsiveness to patient’s
concerns (F=4.018, p=0.004). It could be said that marital status
had some influences on what patients were expecting from nurses.
80
The study revealed that 50.6% of participants with an average
response of 86% strongly agreed that they were expecting nurses
to be knowledgeable and competent of their work. That is why
patients become dissatisfied with nursing care if inadequate
information about their condition and treatment was given. This
can be supported by a study done in India which showed that there
was relatively higher percentage of patients (31.6%) who had poor
perceptions regarding explanation and information (Samina, et al,
2008). Participants were in agreement with almost all
expectations because the mean response was above 50% except that
they did not agree that they expected nurses to be rude and harsh
(34%), Table 4.6 page 28. Generally, the study revealed that
there was a strong positive linear correlation between patients
characteristics such as age, and educational level, and other
patients demographic characteristic and expectations but did not
show significant differences among the patients’ characteristics
at p<0.05. These findings are in consistent with the study done
in Turkey on patients’ expectations of nursing care. It was found
that patients were expecting nurses to be cheerful, knowledgeable
and competent, and to be informed of the treatment (Ozsoy, et al,
81
2007). It was also observed that patients whose expectations were
met were very satisfied with nursing care. Therefore, this study
had revealed that patients were expecting nurses to orient them
to the ward; respect believes and values; communicate nursing
care to them and not to be harsh and being rude to patients.
5.2 PATIENTS’ EXPERIENCES AND CHALLENGESThe participants were asked to rate how often they encountered
the given experiences using a four point Likert scale. The study,
therefore, illustrated that elderly patients (aged above 50
years) had a better experience of pain management by nurses than
younger patients (m>3.36). The study revealed that there was
statistically significant differences among the mean responses by
age on how quickly nurses were responding when patients needed
pain medications (F=3.283, p=0.008) and on how often pain was
controlled (F=2.616, p=0.027). The study also showed that
participants were not usually asked for informed consent (m=2.36)
and explanation on treatment and procedures were not usually
given (m=2.44).
The study illustrated that females had higher mean response
(m>3.11) than males (m<2.85) that nurses were sometimes82
respecting their privacy; nurses were responding quickly when
they wanted pain medication; their pain was usually controlled;
and sometimes explanations on treatment and procedures were
provided. The study found out that there were no statistically
significant differences in responses by gender distribution
except on the experience that nurses were responding quickly when
they wanted pain medication (F=3.547, p=0.048).
The Muslims had higher mean response (m=2.59-3.32) than the
Christians (m=2.30-2.97) that they experienced nurses were
sometimes respecting their privacy; nurses were usually
responding quickly when they wanted pain medication and their
pain was usually controlled; explanations on treatment and
procedures were sometimes provided and informed consents were
sometimes obtained. The study revealed that there were
statistically significant differences in responses by religion on
the experience that nurses were responding quickly when patients
wanted pain medication (F=5.511, p=0.020), but there were no
statistically significant differences in responses on other
experiences that they encountered.
83
Although, the single, divorced, widowed and separated had higher
mean response(m>3.00) than the married (m<2.80) that nurses were
usually responding quickly when they wanted pain medication and
their pain was usually controlled, there were no statistically
significant differences in responses by marital status, p>0.05.
Patients who have not had any formal education and those with
primary education had higher mean response (m>3.07≤3.70) than
those with secondary and tertiary education that nurses were
usually responding quickly when they wanted pain medication and
their pain was usually controlled. The study showed that there
were no significant differences in responses by level of
education.
Generally, majority of participants (63.7%) expressed positive
experience. It was found that patients had a positive experience
because the scores in almost all variables were above average
score of 50% except in “nurses introduction” (36.3%) reported
that nurses never introduced themselves; observation of patients’
privacy (43.5%) reported that nurses were sometimes observing
patients’ privacy, explanation about procedures to patients (48%)
84
and asking for consent from patients (47%) were below average
score, (Figure 4.2 page 35). It was interesting to note that most
patients expressed positive experiences of quick response of
nurses when they needed pain medication and having their pain
well controlled (59%). This study has revealed that post surgical
pain nursing management was good. The study also found out that
nurses were not always protecting patients’ privacy; nurses were
not always introducing themselves to patients; were not always
providing explanations on treatment and procedures; and were not
always obtaining informed consent from patients.
Though the study showed that there was positive linear
correlation between patients’ age, level of education and other
characteristics, and the variable of patients experiences and
challenges, there were no significant differences in participants
responses (p>0.05).
Currently, most people are aware of their rights as a patient.
Since majority of participants had gone to school there could be
high probability that they were exposed to many sources of health
information. Therefore, if nurses did not respect patients’
85
rights such as right to privacy, and right to information, it was
easy for patients to conclude that they had a negative nursing
experience. This can have a very negative impact for surgical
patients because these patients have high level of anxiety and
stress. Patients needed a lot of information about their
conditions, treatment options and procedures. The key to a good
nurse-patient relationship is self introductions of nurses to
patients and it helps in creating a friendly atmosphere. Hence,
it assists in alleviating patients’ anxiety. Better patients
hospital experiences encourages and gives hope to many patients
as trust between nurse and patients increases. Carrying out
nursing activities professionally will also help patients have a
positive experience while in the ward. A correlation study
conducted in UK that looked at priorities for improving patients’
Hospital experience. It found that hospital staffs who responded
better to patients’ concerns or complaints, the more likely that
patients recommended the hospital to others (Hospital Pulse
Report, 2008).
Most respondents encountered challenges of shortage of nurses and
also rude nurses (16.7%) followed by inadequate equipment86
(13.1%). See table 4.15 page 37. It was interesting to note that
patients acknowledged that shortage of nurses in public hospitals
is a big problem, but the problem of nurses being rude to the
patients was highly mentioned. KIPPRA report (1994) also
highlighted that the public was complaining of nurses being rude
to patients. Inadequate nursing personnel, material resources and
unfriendly behaviour of nurses towards patients can have negative
implication on quality of nursing care.
5.3 PATIENTS’ SATISFACTION OF NURSING CAREPatients’ satisfaction is one of the indicators that measures
quality of nursing care. Participants were asked to rate their
level of satisfaction on a five-point Likert scale.
The elderly (age group of over 60 years) were very satisfied with
nursing care with mean response of m>4.00. They were very
satisfied with information provided (m=4.25); respect for privacy
(m=4.50); and pain management (m=4.38). All participants of all
age groups were very satisfied with wound dressing (m>4.00). The
age group of less than 19 year to 59 years were very satisfied
with pre-operative care (m=4.13). Generally, all patients were
quite satisfied with nursing care, however, the study found that87
there were no statistically significant differences in responses,
p>0.05. It appeared that most patients were more satisfied with
wound dressing and pain management. The study was consistent with
one study which found that elderly patients reported themselves
very satisfied with nursing care (Chaka, 2005).
Regarding gender of participants, the study revealed that all
participants were satisfied with nursing care with mean response
of (m>3.00). All participants were very satisfied with wound
dressing (m=4.31). This study did not show that there was
difference in the level of satisfaction between males and females
which is in contrast with other study done in Ethiopia, (Chaka,
2005) reported that female patients (74%) were more satisfied
compared to male patients (69%).
Participants were quite satisfied with nursing care regardless of
their level of education with mean response of (m>3.00). Although
the study showed that most participants were very satisfied with
wound dressing (m=4.31), there were no statistically significant
differences in responses by level of education. Chaka (2005),
88
conducted a study that showed that illiterate were more satisfied
with nursing care than literate patients.
Majority of respondents were satisfied with the nursing care
m>3.00 (50.2%). Most patients were satisfied with wound dressing
m=4.31 (52.4%) followed by bed making m=3.93 (38.1%). This was
encouraging finding because despite the challenge of inadequate
nursing personnel, patients were still receiving basic nursing
care. The study showed that there was positive linear correlation
between patients’ age, gender and level of education and other
patients’ characteristics and level of satisfaction. The study
revealed that there were no statistically significant differences
from each other at p<0.05. The study also showed that about 17%
of participants were not satisfied with information provided
about their treatment and conditions. One study concluded that
type of information that nurses gave patients about treatment and
conditions was one of the major cause of dissatisfaction (Samina,
et.al, 2008). About 35.7% were very satisfied with the way nurses
welcomed patients in the ward. It is believed that the genesis
of good patient-nurse relationship begins at admission and it is
at this time that patients can predict whether they are going to89
receive quality nursing care or not. Although 28.6% were very
satisfied with how nurses respected their privacy, 12.5% were
barely satisfied with respect to privacy. Self-guarding patients’
privacy is the nursing responsibility. Nurses should be
advocating for protection of patients’ rights from any abuse
either by fellow nurses or other health professionals. Patients
are going to appreciate nursing care if they feel safe within
nurses’ jurisdiction. Generally, patients were satisfied with
nursing care provided. These findings can be compared with the
study that was done in Pakistan. The Pakistan study found that
94% of patients liked nursing practice of keeping privacy of
patients and overall patients’ satisfaction of nursing care was
45% and 55% were dissatisfied (Khan, et al,2007). But, this study
had revealed that satisfaction level of patients was above mean
response of 50%. It can be concluded that there was relative
relationship between patients’ characteristics and the level of
satisfaction, but there was no significant differences among
patients characteristics and level of satisfaction p<0.05.
90
5.4 PATIENTS’ PERCEPTIONSParticipants were asked to give their recommendations on how
nursing care can be improved and also give their perception of
quality of nursing care they had received. 22.6% of the
participants recommended that management should add more nurses
to cover for shortage and improve efficiency. Other respondents
(13.1%) noted that there was communication breakdown between
patients and nurses. They recommended that nurses should improve
on interpersonal skills and they should have positive attitude
towards patients. Other participants (12.5%) also observed that
for more efficiency, nurses should be motivated by improving
working conditions such as provision of adequate resources.
On perception of quality of nursing care, 40.5% felt that
quality of nursing care was good while 11.3% reported that
quality of nursing care was poor. Though the study showed that
there was positive correlation between patients’ characteristics
and patients’ perception of nursing care, there were no
statistically significant differences from each other, p<0.05.
Patients perceived the quality of nursing depending on how much
satisfactory they were with the nursing care. Patients’
91
expectations also influenced level of patients’ satisfaction
because most of the patients agreed with most of them. The more
patients’ expectations are met, the more satisfactory the
patients would become and this would give good perception of
nursing care. The study showed that there were positive
correlation between patients’ expectations and their level of
satisfaction with nursing care. Therefore, in testing the
hypothesis that patients’ perceptions are not influenced by
nurses’ attitude, the Pearson correlation test was used. It
looked at the correlation of patients’ expectations and patients’
satisfaction with how nurses conduct themselves when carrying out
nursing activities. The hypothesis was rejected at 5% level of
significance t= 0.014, 0.024, p<0.05 (see table 4.24 page 46).
Therefore, it can be concluded that patients’ perceptions were
influenced by nurses’ attitudes.
5.5 CONCLUSION Patients expected nurses to be kind, friendly,
knowledgeable, responsive, but did not expect nurses to
be rude and harsh to them.
Majority had positive experience of nursing care.
92
Patients felt that nurses were not usually providing
explanation on treatment and procedures.
Patients were not usually asked for informed consent.
Nurses were not introducing themselves to patients
The elderly indicated that they had better pain control
experience than the young patients.
Patients were satisfied with wound dressing, post
surgical pain control and bed making.
Patients were not satisfied with the information provided
about their conditions and treatment by nurses.
Most patients perceived that nursing care provided was
good.
Patients felt that nurses were rude.
The study found that patients’ expectations can have some
influences on patients’ satisfaction level of care.
This study has revealed that patients’ perceptions
regarding nursing care are influenced by nurses’
attitudes or the way nurses interact with patients.
The results can be generalized because KNH receives
patients from all parts of the country.
93
5.6 RECOMMENDATIONBased on the findings of the study the investigator recommends
the following;
1. Assessment should include patients’ care expectations
especially at admission so as to incorporate them in the
nursing care plan.
2. There is need for nurses to establish good rapport with
patients in order to promote trust between the nurse and the
patient hence reducing the chances of patients labeling
nurses as rude people and also will make patients feel at
home. Nurses also need to acquire customer care skills
through organized seminars/trainings by the hospital
management.
3. Nurses should be advocating for patients rights in the
wards. They should be the first ones to respect patients’
rights such as right to privacy and information. Patients
feel satisfied if their rights are respected.
4. The hospital management should consider employing more
nurses since most patients felt that they did not receive
satisfactory nursing care due to shortage of nurses and
94
equipment e.g. beds, linen. Management also should consider
awarding nurses who are performing better in terms of nurse-
patient relationship.
5. Need to carry out a study to find out factors that affect
nurses’ attitudes towards patients.
6. The hospital to use the findings in addressing the
challenges that patients are encountering in general
surgical wards. Things that were found to be satisfying
should be encouraged and try to change things that patients
were not satisfied.
95
REFERENCESAhmad M.M. & Alasaad J.A. (2004). Predictors of Patients
Experiences of Nursing Care in Medical-Surgical Wards:
International Journal of Nursing Practice, Vol. 10, Issue 5, pp.235-41.
Al-Doghaither A.H. (2000), Patients’ Satisfaction with Nursing
Services at King Khalid University Hospital, Riyadh, Saudi
Arabia. SSFCM Journal, Vol. 7 Issue 3.
Alexander M.A., Fawcett J.N., & Runciman P.J. (2006). Nursing
Practice Hospital and Home; The Adult. 3rd Edition. Churchill
Livingstone Elsevier, Edinburg.
Allen C., Carr E., Barrett R., Brockbank K., Cox C., & North
N. (2002). Prevalence and Pattern of Anxiety in Patients
undergoing Gynaecological Surgery: Institute of Health and Community
Studies Bournemouth University, Salisbury Health care NHS Trust.
http://www.eprints.bournemouth.ac.uk/11680/1/Anxiety.pdf
visited on 20/1/2012.
American Medical Association (1991). Clinical Governance-
Introduction.
96
http://www.clinicalgovernance.scot.nhs.uk/section1/qualityinhe
althcare.asp
Basavanthappa B.T. (2007). Nursing Research. 2nd Edition;
Jaypee Brothers Medical Publishers, New Delhi.
Basavanthappa B.T. (2007). Nursing Theories . 1st Edition;
Jaypee Brothers Medical Publishers, New Delhi.
Burhans L.M. & Alligood M.R. (2010). Quality Nursing care in
the Words of Nurses: Journal of Advanced Nursing, Vol.66. Issue 8
pp1689-1697.
Chaka B. (2005). Adult Patient Satisfaction with Nursing Care.
http://www.aau.edu.cf visited on 28/11/2011
Debono D., & Travaglia J. (2009), Complaints and Patients’
Satisfaction: A Comprehensive Review of the Literature. Centre
for Clinical Governance Research, University of New South
Wales, Sydney.
George J.B. (2002). Nursing Theories, The Base for Professional
nursing Practice. 5th Edition, Prentice Hall, Upper Saddle
River.
97
Ghana Health Services (2004). Health Care Quality Assurance
Manual: http://www.ghanaqhp.org/fileadmin visited on 6/12/2011
Ignatavicius D.D., Workman M.L., & Mishler M.A. (1999).
Medical Surgical Nursing Across the Health Continuum. 3rd
Edition, W.B. Saunders Company, Philadelphia.
Khan M.H., Hassan R., Anwar S., Babar T.S., & Babar K.S.
(2007). Patient Satisfaction with Nursing care. Rawal Medical
Journal: Vol.32, Issue 1 pp 27-29.
Kenya Law Report, (2010). The Constitution of Kenya; Revised
Edition. National Council for Law Reporting, Nairobi.
Koch T., Krali K.D., & Wotton K. (1997). Engagement and
Detachment: Understanding Patients Experiences with Nursing
care. Journal of Advanced Nursing; pp399-407.
Lemonidou C., Merkouris A., Kilpi H.L., Valimaki M., Dassen
T., Gasull M., Scott P.A., Tafas C., & Arndt M. (2003). A
Comparison of Surgical Patients’ and Nurses’ perceptions of
patients’ Autonomy, Privacy and Informed Consent in Nursing
Interventions. Clinical Effectiveness in Nursing. Vol.7 pp73-83.
98
Moscato S.R., Valanis B., Gullion C.M., Tanner C., Shepiro
S.E., & Izumi S. (2007). Predictors of Patients Satisfaction
with Telephone nursing services: Clinical Nursing Research. Vol.16.
Issue 2. http://www.hinari-gw.who.int.
Muhondwa E.P.Y., Leshabari M.T., Mwangu M., Mbembali N., &
Ezekiel M.J. (2008). Patients Satisfaction at Muhimbili
National Hospital in DaresSalaam, Tanzania: East African Journal of
Public Health. Vol. 5 Issue 2 (internet source).
Nankumbi J. (2005). Patients’ Attitude Towards Satisfaction
with the Quality of Nursing Care. Makerere University Research
Reporting. http://www.dspace.mak.au.ug. Visited on 28/11/2011
National Nursing Research Unit (2008). High Quality nursing
care-What is it and How can we best ensure its delivery. Policy
Plus Evidence, Issues and Opinions in Health care: Issue: 13.
Nordberg E., Mwobobia I., & Muniu E. (2001). Major and Minor
Surgery Output at District Level in Kenya: Review and Issues
in Need of Further Research. Africa Journal of Health Sciences; Vol.9,
Issue: 1-2.
99
http://www.ajol.info/index.php/ajhs/article/viewfile/30752/230
43. visited on 19/1/2012.
O’Connell B., Young J., & Twigg D (1999). Patient Satisfaction
with Nursing Care: A measurement Conundrum. International Journal of
Nursing Practice. Vol. 5 pp72-77
Ojwang B.O, Ogutu E.A & Matu P.M. (2010). Nurses’ Impoliteness
as an Impediment to Patients Rights in selected Kenyan
Hospitals.
http://www.hhrjournal.org/index.php/hhr/article/viewarticle/37
2/577 visited on 28/11/2011
Ozsoy S.A, Ozgur G. & Akyol A.D. (2007). Patients Expectation
and Satisfaction with Nursing care in Turkey: a literature
Review. International Nursing Review. Vol. 54 pp249-255
Pearson & Osborn (2010). Nursing Management of the Surgical
Patients.
http://www.bookdev.com/pearson/osborn/chapter/m15_osb01023_01_
SE_C25.pdf visited on 26/11/2011
100
Rafii F, Hajinezhad M.E. & Haghani H. (2008). Nurse caring in
Iran and its relationship with Patient satisfaction: Australian
Journal of Advanced Nursing. Vol. 26. Issue2 pp 75-84
Samina M, Gadri G.J, Tabish S.A, Samiya M & Riyaz R. (2008).
Patients’ Perception of nursing care at Large Teaching
Hospital in India: International Journal of Health Sciences. Vol.2.
Issue. 2 pp92-100
Smeltzer S.C & Bare B. (2004). Brunner and Suddarths’ Text
book of Medical Surgical Nursing. 10th Edition. Lippincott
William and Wilkins, Philadelphia.
Stellenberg E.L. & Bruce J.C. (2007). Nursing Practice;
Medical Surgical Nursing for Hospital and community, African
Edition. Churchill Livingstone Elsevier, Edinburg.
White L. (2007). Foundations of Nursing. 2nd Edition, Delmar.
New York.
World Health Organization (2006), Quality of care: A process
for making strategic choices in health system.
101
http://www.who.int/management/quality/assurance/qualitycare_B.
def.pdf. visited on 10/12/2011
Zhao S.H. & Akkadechanunt T. (2011). Patients’ Perceptions of
Quality Nursing Care in a Chinese Hospital: International Journal of
Nursing and Midwifery. Vol. 3 Issue 9. Pp145-149.
102
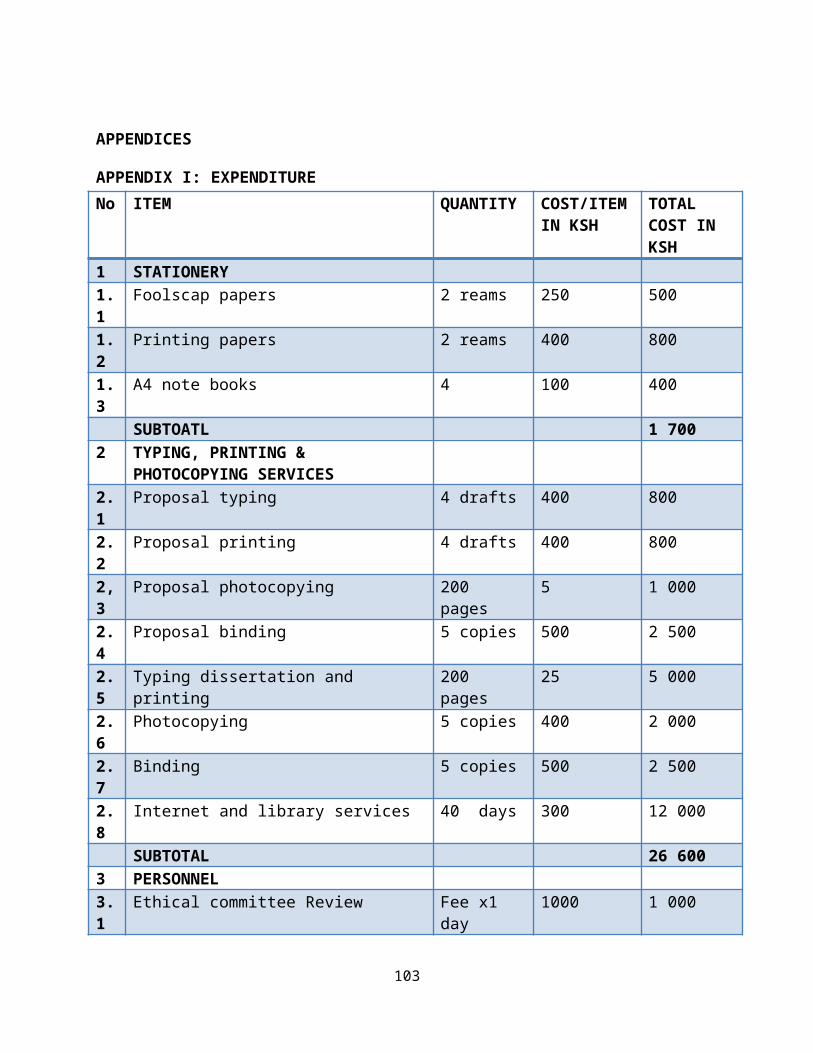
APPENDICES
APPENDIX I: EXPENDITURE No ITEM QUANTITY COST/ITEM
IN KSHTOTAL COST IN KSH
1 STATIONERY1.1
Foolscap papers 2 reams 250 500
1.2
Printing papers 2 reams 400 800
1.3
A4 note books 4 100 400
SUBTOATL 1 7002 TYPING, PRINTING &
PHOTOCOPYING SERVICES2.1
Proposal typing 4 drafts 400 800
2.2
Proposal printing 4 drafts 400 800
2,3
Proposal photocopying 200 pages
5 1 000
2.4
Proposal binding 5 copies 500 2 500
2.5
Typing dissertation and printing
200 pages
25 5 000
2.6
Photocopying 5 copies 400 2 000
2.7
Binding 5 copies 500 2 500
2.8
Internet and library services 40 days 300 12 000
SUBTOTAL 26 6003 PERSONNEL3.1
Ethical committee Review Fee x1 day
1000 1 000
103
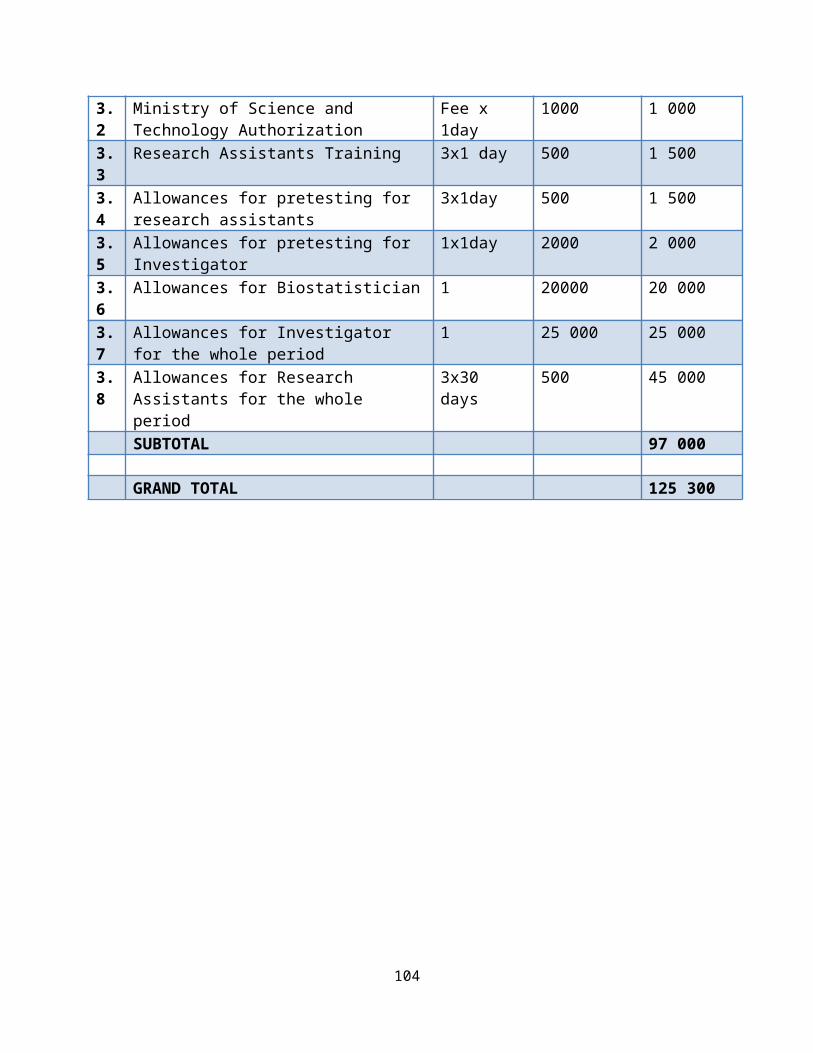
3.2
Ministry of Science and Technology Authorization
Fee x 1day
1000 1 000
3.3
Research Assistants Training 3x1 day 500 1 500
3.4
Allowances for pretesting for research assistants
3x1day 500 1 500
3.5
Allowances for pretesting for Investigator
1x1day 2000 2 000
3.6
Allowances for Biostatistician 1 20000 20 000
3.7
Allowances for Investigator for the whole period
1 25 000 25 000
3.8
Allowances for Research Assistants for the whole period
3x30 days
500 45 000
SUBTOTAL 97 000
GRAND TOTAL 125 300
104
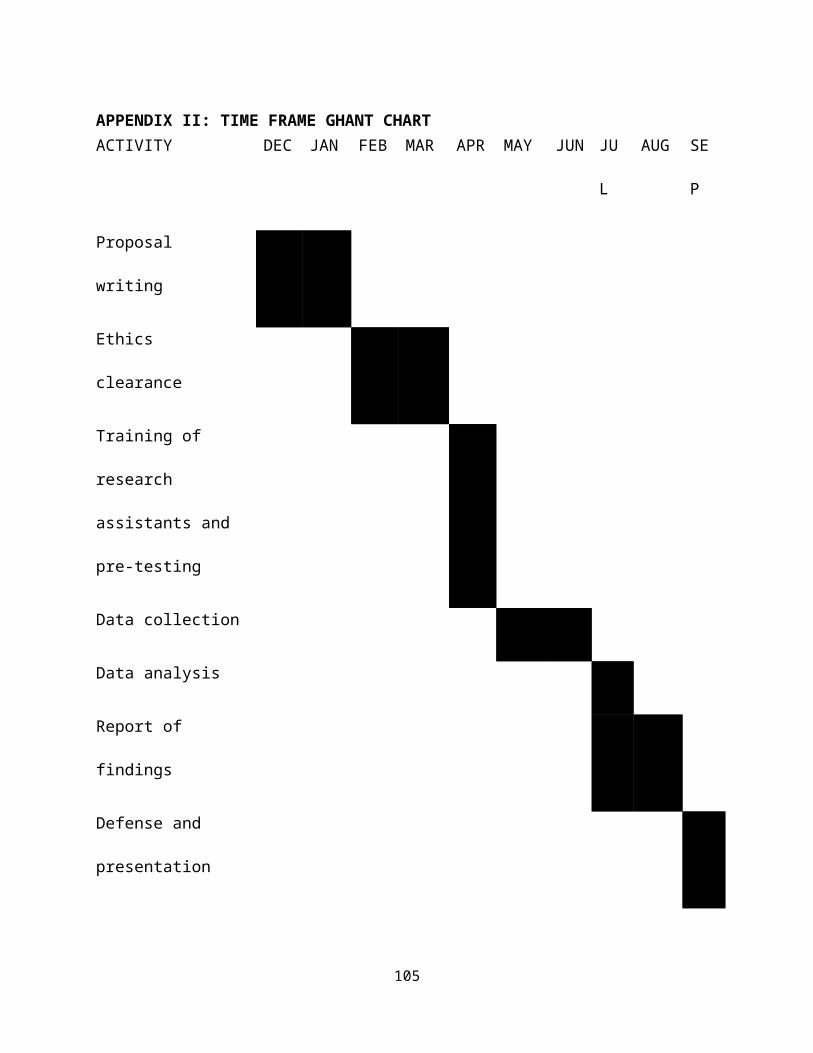
APPENDIX II: TIME FRAME GHANT CHARTACTIVITY DEC JAN FEB MAR APR MAY JUN JU
L
AUG SE
P
Proposal
writing
Ethics
clearance
Training of
research
assistants and
pre-testing
Data collection
Data analysis
Report of
findings
Defense and
presentation
105

106
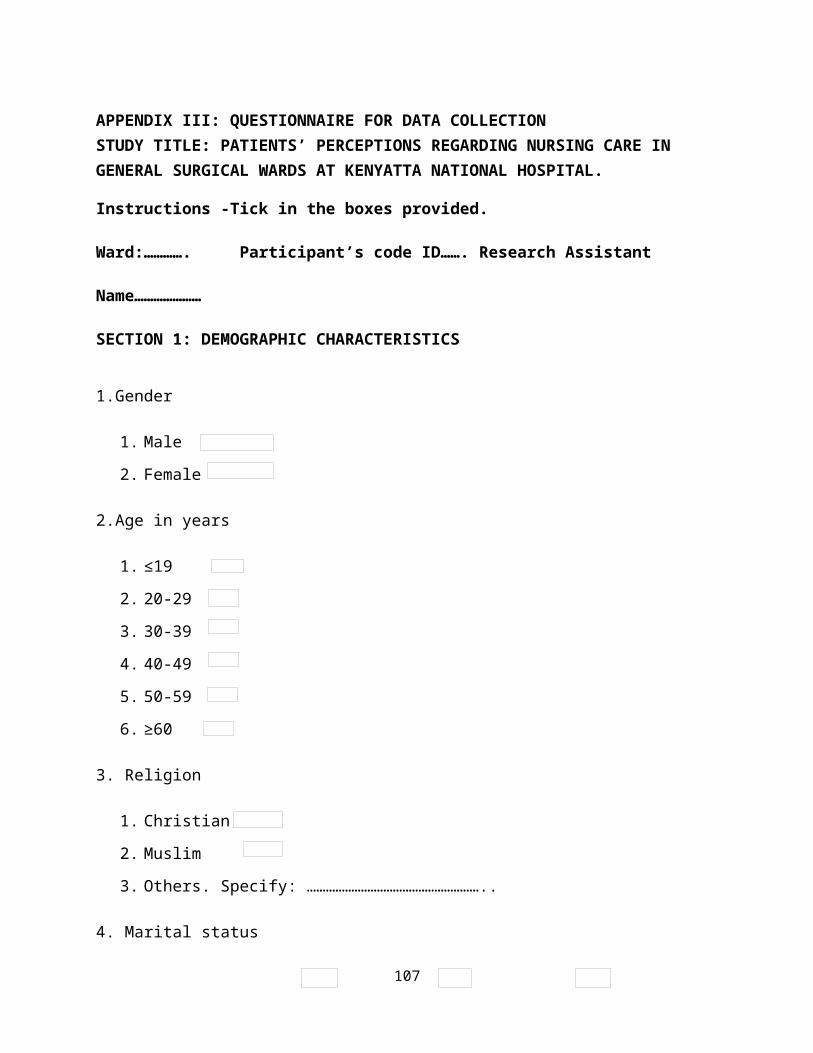
APPENDIX III: QUESTIONNAIRE FOR DATA COLLECTIONSTUDY TITLE: PATIENTS’ PERCEPTIONS REGARDING NURSING CARE IN GENERAL SURGICAL WARDS AT KENYATTA NATIONAL HOSPITAL.
Instructions -Tick in the boxes provided.
Ward:…………. Participant’s code ID……. Research Assistant
Name…………………
SECTION 1: DEMOGRAPHIC CHARACTERISTICS
1.Gender
1. Male
2. Female
2.Age in years
1. ≤19
2. 20-29
3. 30-39
4. 40-49
5. 50-59
6. ≥60
3. Religion
1. Christian
2. Muslim
3. Others. Specify: ………………………………………………..
4. Marital status
107
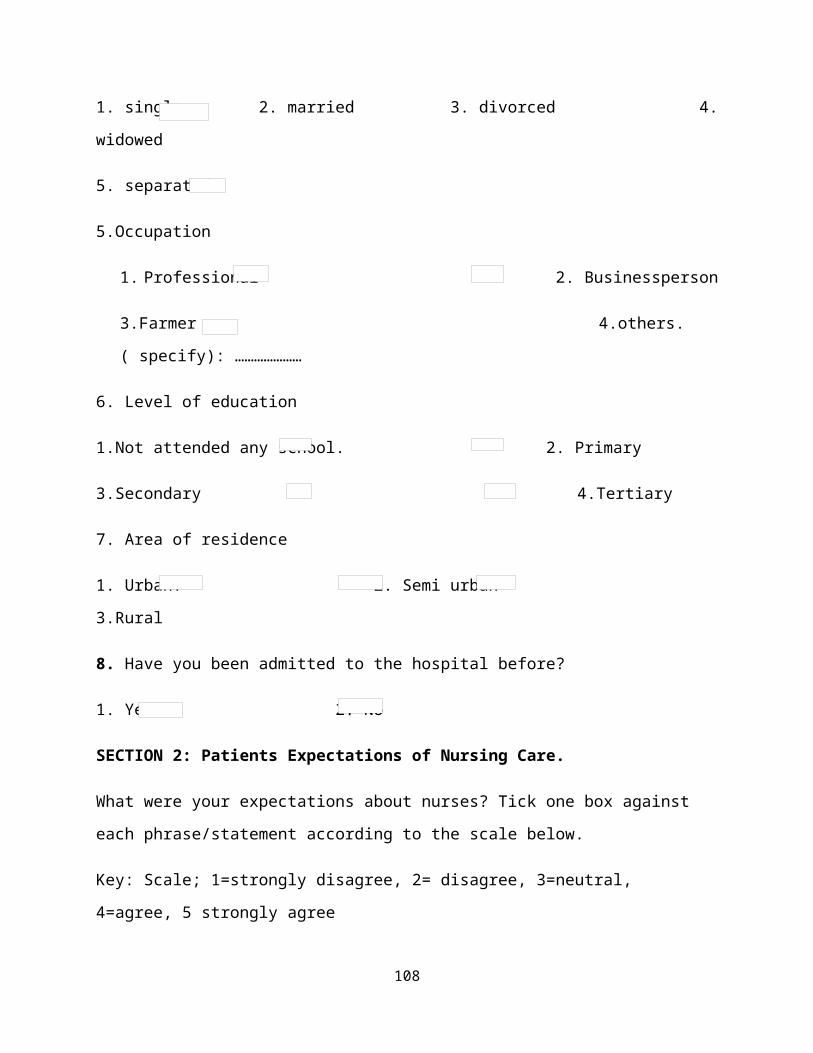
1. single 2. married 3. divorced 4.
widowed
5. separated
5.Occupation
1. Professional 2. Businessperson
3.Farmer 4.others.
( specify): …………………
6. Level of education
1.Not attended any school. 2. Primary
3.Secondary 4.Tertiary
7. Area of residence
1. Urban. 2. Semi urban
3.Rural
8. Have you been admitted to the hospital before?
1. Yes 2. No
SECTION 2: Patients Expectations of Nursing Care.
What were your expectations about nurses? Tick one box against
each phrase/statement according to the scale below.
Key: Scale; 1=strongly disagree, 2= disagree, 3=neutral,
4=agree, 5 strongly agree
108
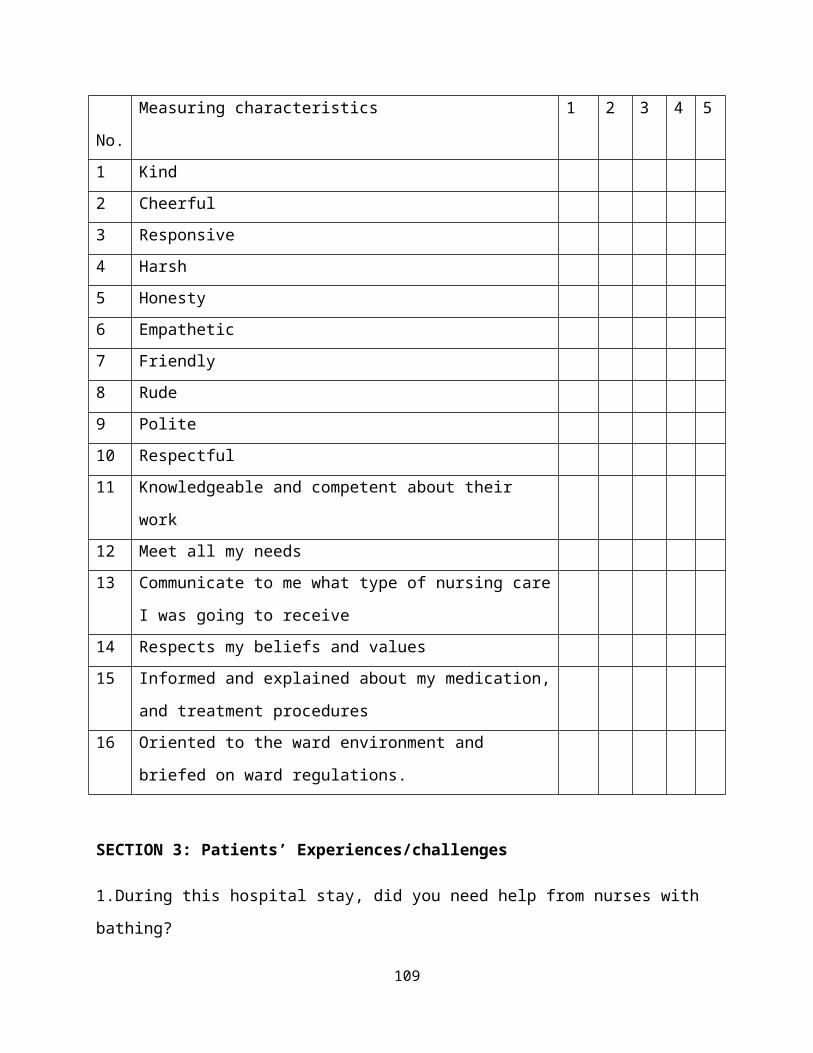
No.
Measuring characteristics 1 2 3 4 5
1 Kind2 Cheerful3 Responsive 4 Harsh 5 Honesty 6 Empathetic7 Friendly8 Rude9 Polite10 Respectful 11 Knowledgeable and competent about their
work12 Meet all my needs13 Communicate to me what type of nursing care
I was going to receive14 Respects my beliefs and values15 Informed and explained about my medication,
and treatment procedures16 Oriented to the ward environment and
briefed on ward regulations.
SECTION 3: Patients’ Experiences/challenges
1.During this hospital stay, did you need help from nurses with
bathing?
109
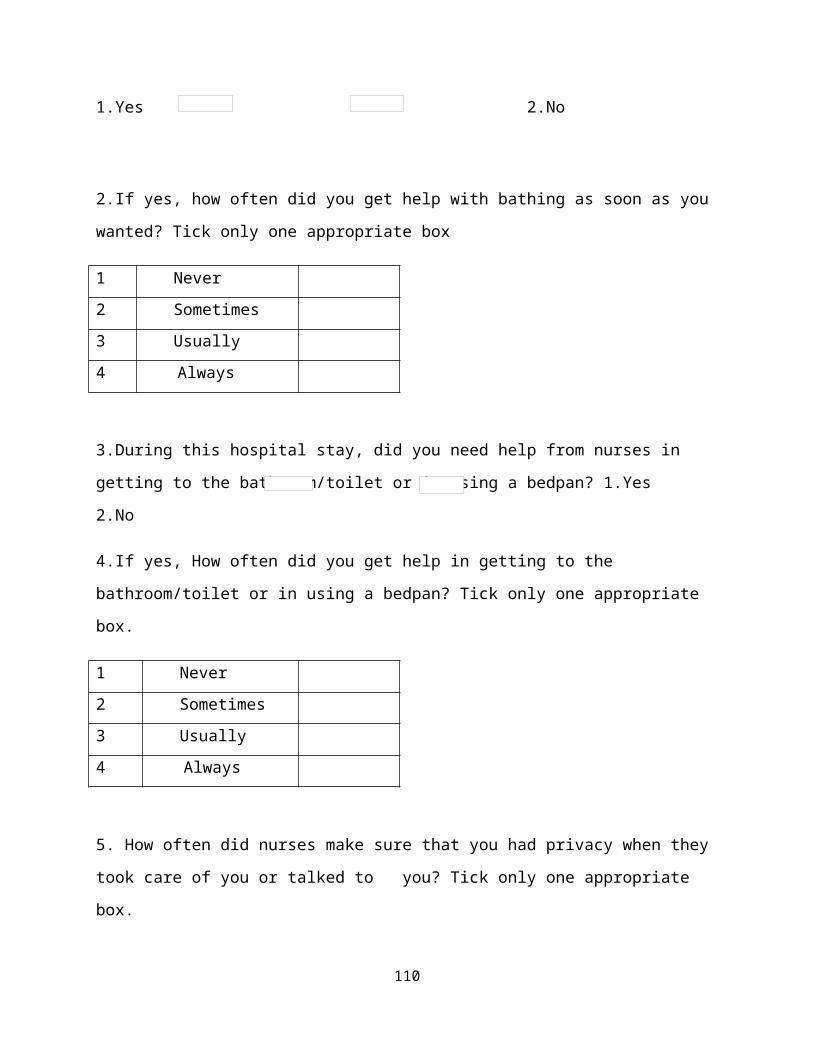
1.Yes 2.No
2.If yes, how often did you get help with bathing as soon as you
wanted? Tick only one appropriate box
1 Never 2 Sometimes 3 Usually 4 Always
3.During this hospital stay, did you need help from nurses in
getting to the bathroom/toilet or in using a bedpan? 1.Yes
2.No
4.If yes, How often did you get help in getting to the
bathroom/toilet or in using a bedpan? Tick only one appropriate
box.
1 Never 2 Sometimes 3 Usually 4 Always
5. How often did nurses make sure that you had privacy when they
took care of you or talked to you? Tick only one appropriate
box.
110
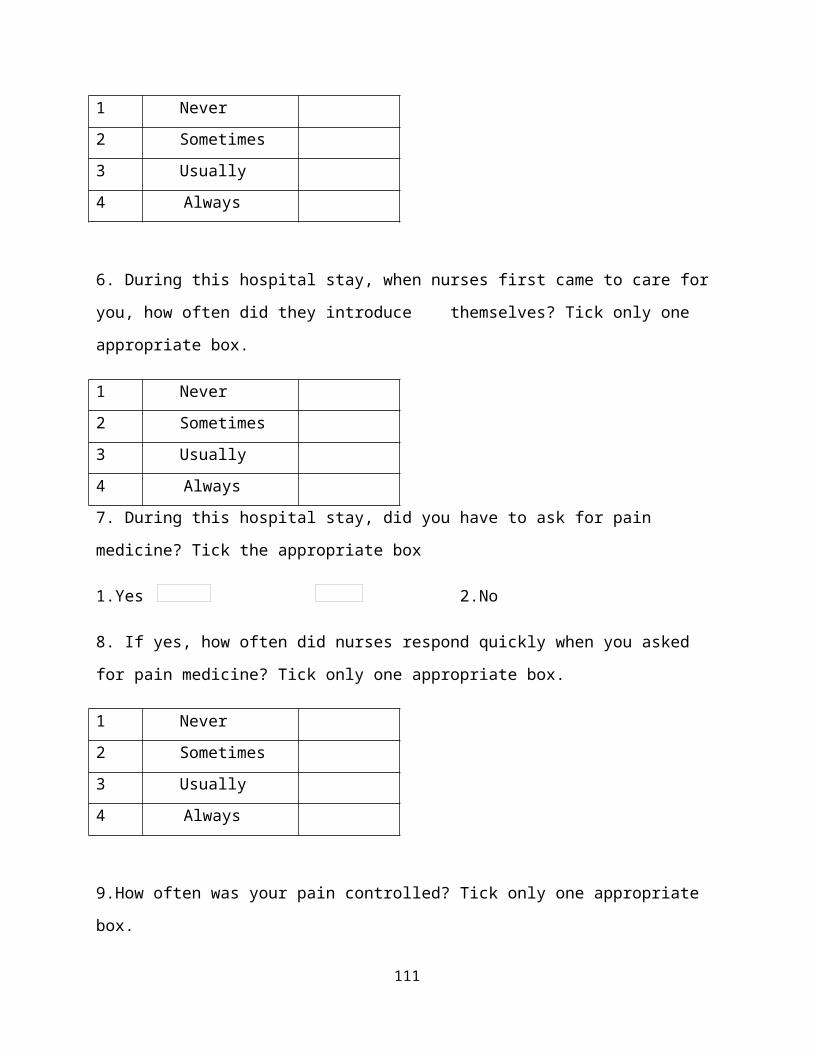
1 Never 2 Sometimes 3 Usually 4 Always
6. During this hospital stay, when nurses first came to care for
you, how often did they introduce themselves? Tick only one
appropriate box.
1 Never 2 Sometimes 3 Usually 4 Always 7. During this hospital stay, did you have to ask for pain
medicine? Tick the appropriate box
1.Yes 2.No
8. If yes, how often did nurses respond quickly when you asked
for pain medicine? Tick only one appropriate box.
1 Never 2 Sometimes 3 Usually 4 Always
9.How often was your pain controlled? Tick only one appropriate
box.
111
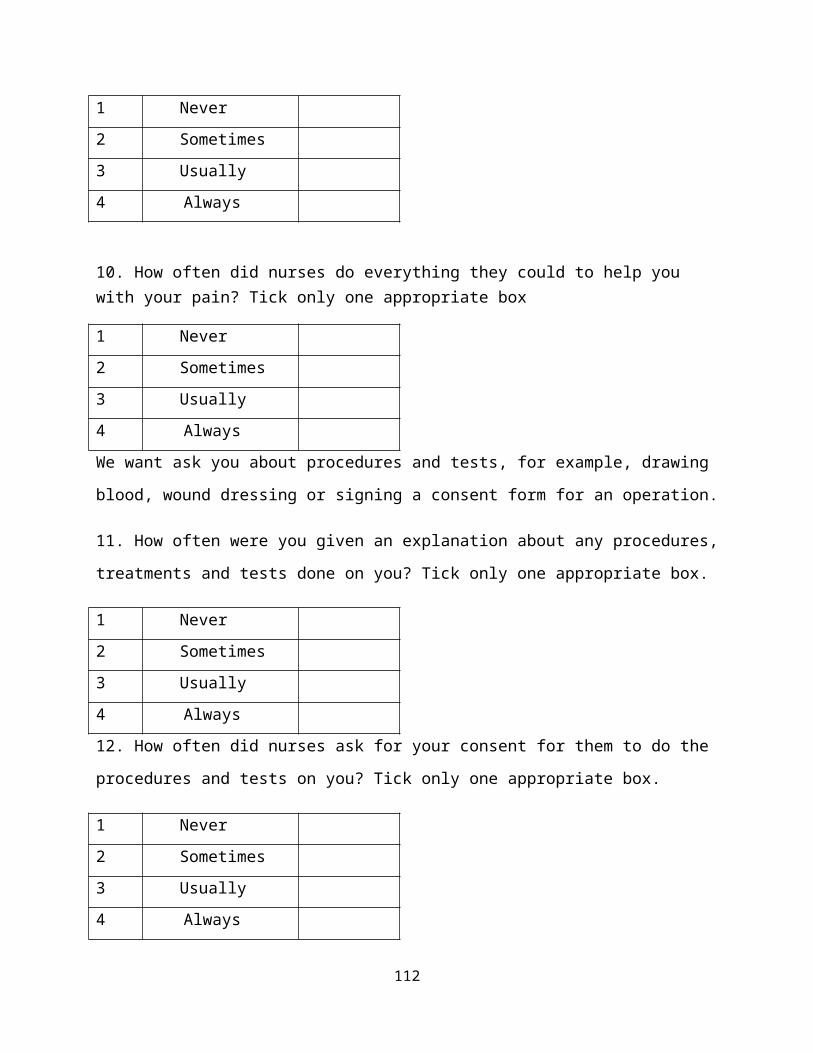
1 Never 2 Sometimes 3 Usually 4 Always
10. How often did nurses do everything they could to help you with your pain? Tick only one appropriate box
1 Never 2 Sometimes 3 Usually 4 Always We want ask you about procedures and tests, for example, drawing
blood, wound dressing or signing a consent form for an operation.
11. How often were you given an explanation about any procedures,
treatments and tests done on you? Tick only one appropriate box.
1 Never 2 Sometimes 3 Usually 4 Always 12. How often did nurses ask for your consent for them to do the
procedures and tests on you? Tick only one appropriate box.
1 Never 2 Sometimes 3 Usually 4 Always
112
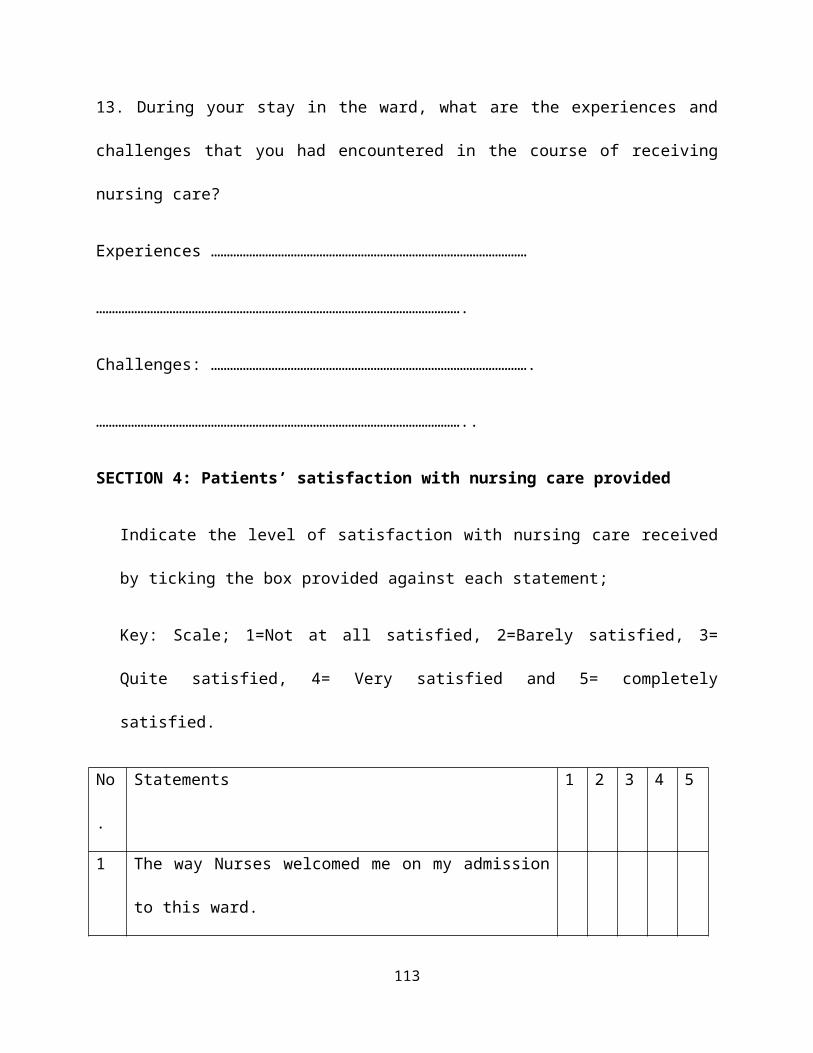
13. During your stay in the ward, what are the experiences and
challenges that you had encountered in the course of receiving
nursing care?
Experiences ………………………………………………………………………………………
…………………………………………………………………………………………………….
Challenges: ……………………………………………………………………………………….
……………………………………………………………………………………………………..
SECTION 4: Patients’ satisfaction with nursing care provided
Indicate the level of satisfaction with nursing care received
by ticking the box provided against each statement;
Key: Scale; 1=Not at all satisfied, 2=Barely satisfied, 3=
Quite satisfied, 4= Very satisfied and 5= completely
satisfied.
No
.
Statements 1 2 3 4 5
1 The way Nurses welcomed me on my admission
to this ward.
113
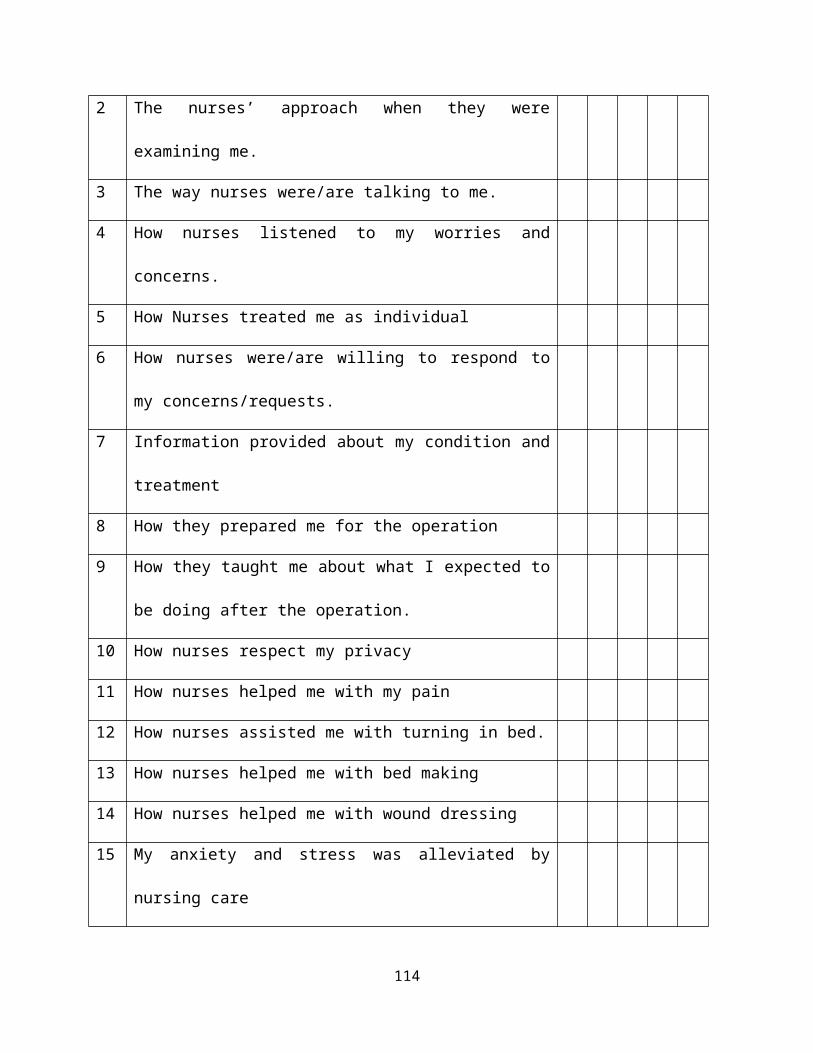
2 The nurses’ approach when they were
examining me.
3 The way nurses were/are talking to me.
4 How nurses listened to my worries and
concerns.
5 How Nurses treated me as individual
6 How nurses were/are willing to respond to
my concerns/requests.
7 Information provided about my condition and
treatment
8 How they prepared me for the operation
9 How they taught me about what I expected to
be doing after the operation.
10 How nurses respect my privacy
11 How nurses helped me with my pain
12 How nurses assisted me with turning in bed.
13 How nurses helped me with bed making
14 How nurses helped me with wound dressing
15 My anxiety and stress was alleviated by
nursing care
114
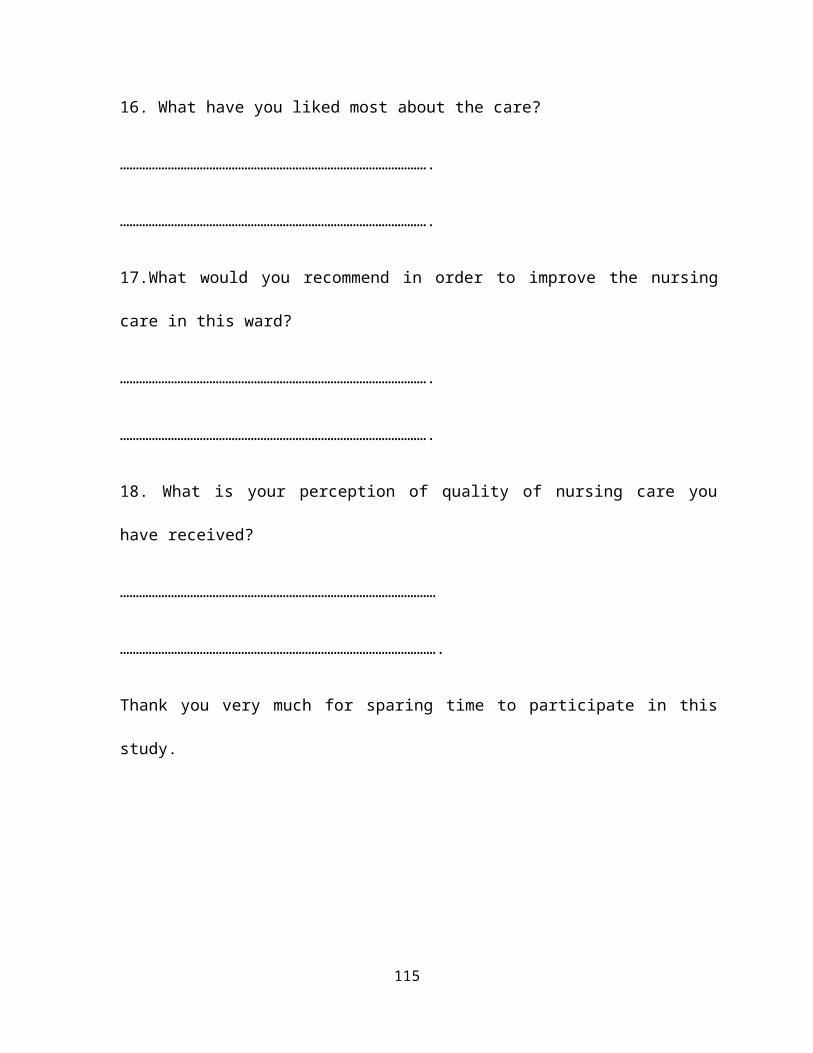
16. What have you liked most about the care?
…………………………………………………………………………………….
…………………………………………………………………………………….
17.What would you recommend in order to improve the nursing
care in this ward?
…………………………………………………………………………………….
…………………………………………………………………………………….
18. What is your perception of quality of nursing care you
have received?
………………………………………………………………………………………
……………………………………………………………………………………….
Thank you very much for sparing time to participate in this
study.
115
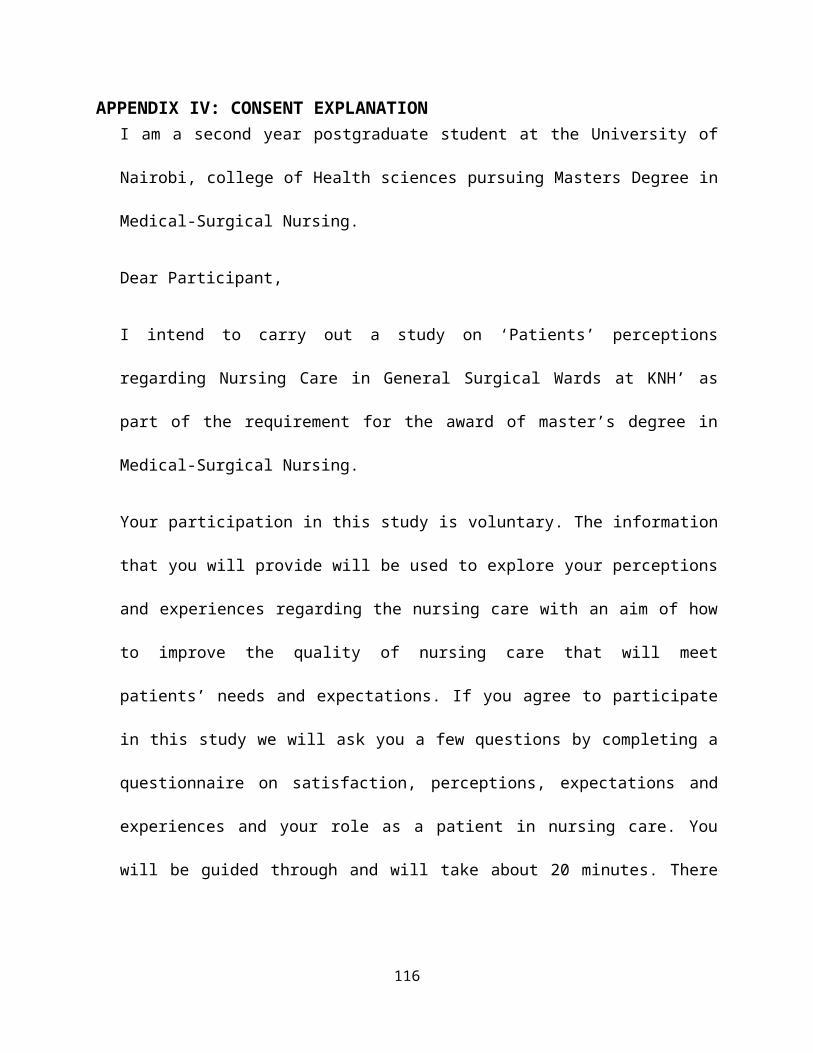
APPENDIX IV: CONSENT EXPLANATIONI am a second year postgraduate student at the University of
Nairobi, college of Health sciences pursuing Masters Degree in
Medical-Surgical Nursing.
Dear Participant,
I intend to carry out a study on ‘Patients’ perceptions
regarding Nursing Care in General Surgical Wards at KNH’ as
part of the requirement for the award of master’s degree in
Medical-Surgical Nursing.
Your participation in this study is voluntary. The information
that you will provide will be used to explore your perceptions
and experiences regarding the nursing care with an aim of how
to improve the quality of nursing care that will meet
patients’ needs and expectations. If you agree to participate
in this study we will ask you a few questions by completing a
questionnaire on satisfaction, perceptions, expectations and
experiences and your role as a patient in nursing care. You
will be guided through and will take about 20 minutes. There
116
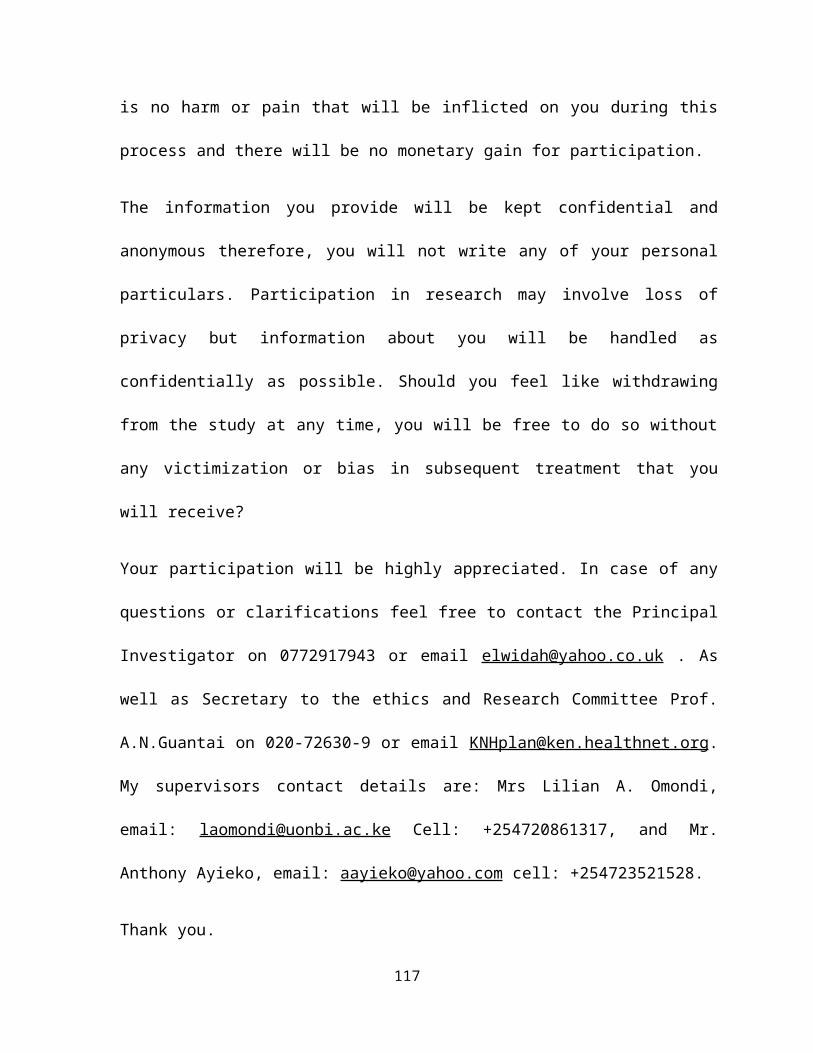
is no harm or pain that will be inflicted on you during this
process and there will be no monetary gain for participation.
The information you provide will be kept confidential and
anonymous therefore, you will not write any of your personal
particulars. Participation in research may involve loss of
privacy but information about you will be handled as
confidentially as possible. Should you feel like withdrawing
from the study at any time, you will be free to do so without
any victimization or bias in subsequent treatment that you
will receive?
Your participation will be highly appreciated. In case of any
questions or clarifications feel free to contact the Principal
Investigator on 0772917943 or email [email protected] . As
well as Secretary to the ethics and Research Committee Prof.
A.N.Guantai on 020-72630-9 or email [email protected].
My supervisors contact details are: Mrs Lilian A. Omondi,
email: [email protected] Cell: +254720861317, and Mr.
Anthony Ayieko, email: [email protected] cell: +254723521528.
Thank you.
117
Elwin Shawa (Principal Investigator)
INFORMED CONSENT
I, ………………………………………….. having read the consent explanation and
explained to, do voluntarily agree to take part in this study
on “Patients’ Perceptions Regarding nursing care in General
Surgical Wards at KNH” on the ……….. day of ………, 2012. I am
also aware that I can withdraw from the study without losing
any benefits or treatment.
Signed ……………………………………………….
Witness ……………………………………………….
Date …………………………………………………….
APPENDIX V: QUESTIONNAIRE FOR DATA COLLECTION KISWAHILI VERSIONMASWALI YA UTAFITI
118

UTAFITI JUU YA: MTAZAMO WA WAGONJWA JUU YA HUDUMA YA UUGUZI
KATIKA WODI YA UPASUAJI, HOSPITALI KUU YA KENYATTA
Maagizo: Weka alama ya (√) katika schemu zilizotengwa.
Wodi:……… Kitambulisho cha mshiriki:……………… Jina la Msaidizi wa
mtafiti:…………
SEHEMU YA KWANZA: HULKA YA MSHIRIKI
1.Jinsia. 1 mme ( ) 2 Mke ( )
2.Umri (Miaka) 1. <19 ( ), 2. 20-29 ( ), 3. 30-39 ( ), 4. 40-49
( ), 5. 50-59 ( ), 6. >60 ( ).
3.Dini: 1. Mkristo ( ), 2. Muisilamu ( ), 3. Nyinginezo ( )
4.Kuoa/Kuolewa: 1.Bado ( ), 2. Nimeotewa/Nimeoa ( ), 3. Talakiwa
( ), 4. Mjane ( ), 5. Tumeachana ( )
5.Shughuli zako: 1. Mtaalamu ( ), 2. Mkulima ( ), 3.
Mfanyibiashara ( ), 4. Nyingine (eleza) …….
6.Kiwango cha elimu: 1. Sijaenda shule ( ), 2.Shule ya Msingi
( ), 3. Shule ya upili ( ), 4. Chuo ( ).
7. Makaazi: 1. Mjini ( ), 2. Mjimdogo ( ), 3. Kijiji ( ).
8.Ume wahi kulazwa Hospitalini? 1.Ndio ( ). 2. La ( ).
SEHEMU YA PILI: Matarajio ya Wagonjwa kwa Huduma ya Uuguzi.
Una matarajio gani kwa wauguzi? Weka alama (√) mbele ya matarajio
yaliyo hapa chini kuonyesha kiwango cha kukubaliana kwako.
119

Kiwango cha kukubaliana: 1=Nakataa kabisa, 2=Nakataa, 3=sina
maoni, 4=Nakubaliana 5=Nakubaliana sana.
No
.
Hulka za wauguzi 1 2 3 4 5
1 Mwenye huruma2 Mcheshi 3 Mwenye kuajibika4 Mkali 5 Muadilifu 6 Anayehisi pamoja nawe 7 Mpenda urafiki8 Mjeuri 9 Mpole 10 Mwenye Heshima11 Anayeyatimiza mahitaji yangu12 Anakekutana na haja zangu13 Ananieleza ni huduma gani ya uuguzi nitapokea14 Anaheshimu itikadi zangu15 Ananifahamisha na kunieleza madawa yangu na
huduma zote za matibabu16 Alinijulisha mazingira ya wodi na kanuni zake
SEHEMU YA TATU: Hisia/changamoto za wagonjwa
1.Ulipokaa hospitali je, ulihitaji msaada wa muuguzi wakati wa
kuoga?
120

1. Ndiyo ( ). 2. La ( )
2.Kama ndiyo; mara ngapi ulipata msaada huo mara tu ulipohitaji.
Weka alama (√) kwa kisanduku kimoja.
1 Sikupata 2 Mara
nyingine3 Kawaida4 Kila wakati3.wakati ulipokaa hospitalini, je, ulihitaji msaada wa muuguzi
kufika kwa bafu/msaalani au kutumia chombo cha kuendea haja. 1.
Ndiyo ( ). 2. La ( ).
4.Kama ni ndiyo; ni mara ngapi ulipata msaada kufika
msalaani/bafu au kutumia bakuli ya kuendea haja?
1 Sikupata 2 Mara
nyingine3 Kawaida4 Kila wakati5. Ni mara ngapi wauguzi walihakikisha umesitirika wakati
walipokuhudumia au kuongea nawe? Toa jibu moja.
1 Sikupata
121
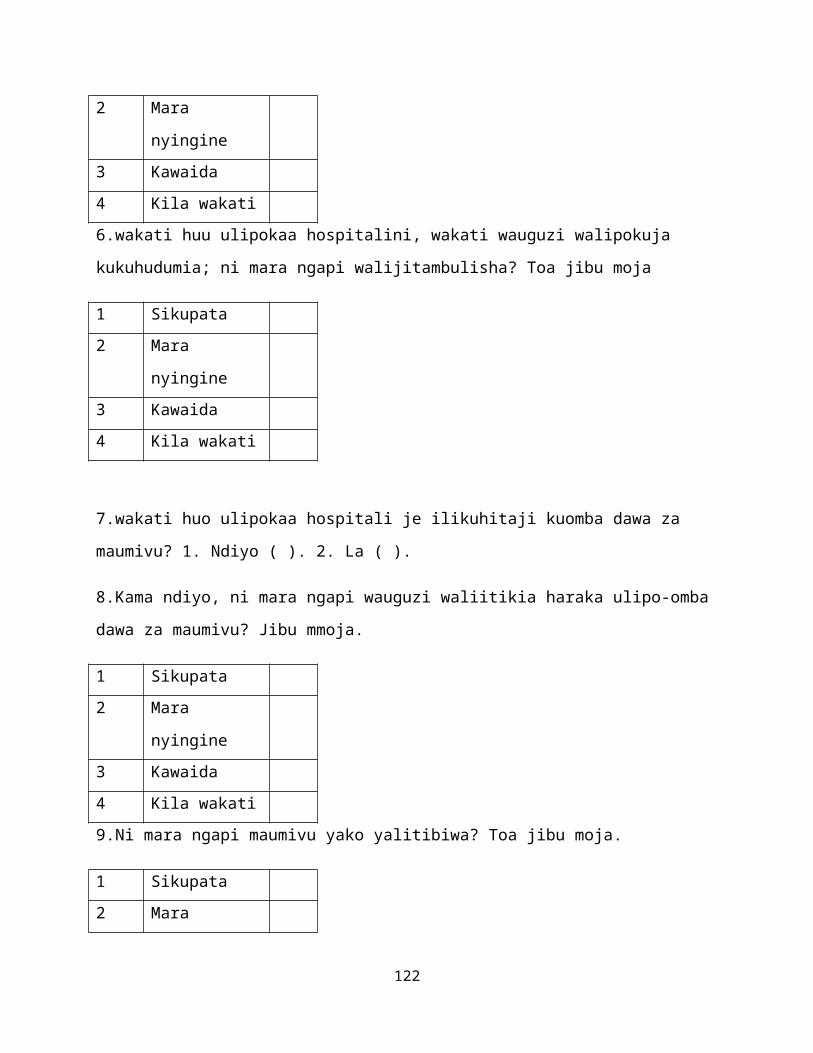
2 Mara
nyingine3 Kawaida4 Kila wakati6.wakati huu ulipokaa hospitalini, wakati wauguzi walipokuja
kukuhudumia; ni mara ngapi walijitambulisha? Toa jibu moja
1 Sikupata 2 Mara
nyingine3 Kawaida4 Kila wakati
7.wakati huo ulipokaa hospitali je ilikuhitaji kuomba dawa za
maumivu? 1. Ndiyo ( ). 2. La ( ).
8.Kama ndiyo, ni mara ngapi wauguzi waliitikia haraka ulipo-omba
dawa za maumivu? Jibu mmoja.
1 Sikupata 2 Mara
nyingine3 Kawaida4 Kila wakati9.Ni mara ngapi maumivu yako yalitibiwa? Toa jibu moja.
1 Sikupata 2 Mara
122

nyingine3 Kawaida4 Kila wakati10. Ni mara ngapi wauguzi walifanya juhudi zozote walizoweza
kukusaidia na mauunivu? (Toa jibu moja).
1 Sikupata 2 Mara
nyingine3 Kawaida4 Kila wakatiTungependa kuku-uliza kuhusu taratibu, na chunguzi zingine kama
kutoa damu, kufunga kidonda na kuweka sahihi yu idhini ya
upasuaji.
11.Mara ngapi ulipewa maelezo kuhusu taratibu, matibabu au
chunguzi ulizofanyiwa? (Toa jibu moja).
1 Sikupata 2 Mara
nyingine3 Kawaida4 Kila wakati12.Ni mara ngapi wauguzi walikuomba idhini ya kukufanyia taratibu
au uchuuguzi? Toa jibu moja.
1 Sikupata 2 Mara
nyingine
123
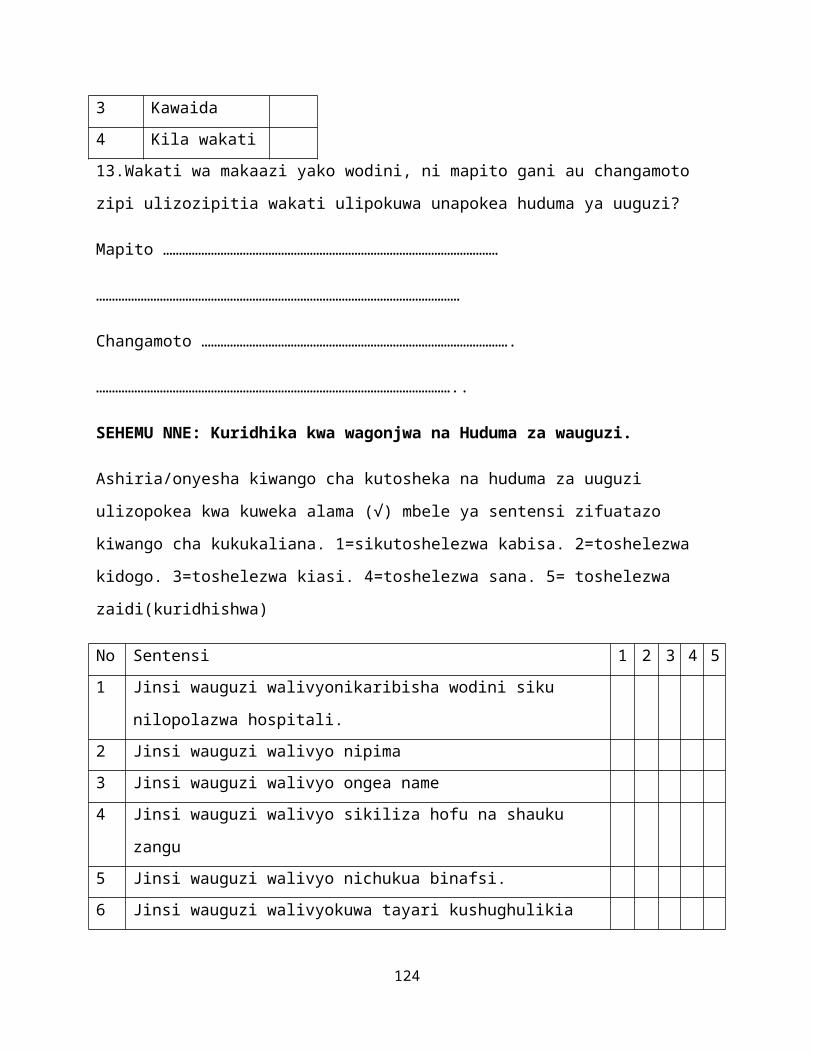
3 Kawaida4 Kila wakati13.Wakati wa makaazi yako wodini, ni mapito gani au changamoto
zipi ulizozipitia wakati ulipokuwa unapokea huduma ya uuguzi?
Mapito ……………………………………………………………………………………………
……………………………………………………………………………………………………
Changamoto …………………………………………………………………………………….
…………………………………………………………………………………………………..
SEHEMU NNE: Kuridhika kwa wagonjwa na Huduma za wauguzi.
Ashiria/onyesha kiwango cha kutosheka na huduma za uuguzi
ulizopokea kwa kuweka alama (√) mbele ya sentensi zifuatazo
kiwango cha kukukaliana. 1=sikutoshelezwa kabisa. 2=toshelezwa
kidogo. 3=toshelezwa kiasi. 4=toshelezwa sana. 5= toshelezwa
zaidi(kuridhishwa)
No Sentensi 1 2 3 4 51 Jinsi wauguzi walivyonikaribisha wodini siku
nilopolazwa hospitali.2 Jinsi wauguzi walivyo nipima3 Jinsi wauguzi walivyo ongea name4 Jinsi wauguzi walivyo sikiliza hofu na shauku
zangu5 Jinsi wauguzi walivyo nichukua binafsi.6 Jinsi wauguzi walivyokuwa tayari kushughulikia
124

shauku na mahitaji yangu.7 Maelezo niliyopewa juu ya hali yangu ya matibabu8 Jinsi walivyo nitayarisha kwa upasuaji.9 Jinsi walivyonifundisha niliyotarajiwa kuyafanya
baada ya upasuaji10 Jinsi vile wauguzi walivyo niheshimu kifaragha11 Jinsi wauguzi watishughulikia maumivu12 Jinsi wauguzi walinisaidia kugeuka kitandani13 Jinsi wauguzi walinisaidia kutandika kitanda14 Jinsi wauguzi walinisaidia kufunga vidonda15 Shauku na hisia zangu zilitoka kutokana na huduma
za wauguzi
16. Ni kitu gani umefurahia zaidi juu ya huduma hizi?
……………………………………………………………………………………………………..
………………………………………………………………………………………………………
17.Ni nini ungetamani kitekelezwe ilikuboresha huduma za uuguzi
katika wodi hii?
……………………………………………………………………………………………………..
……………………………………………………………………………………………………..
18.Una mtazamo gani juu ya kiwango cha huduma za uuguzi
ulizopokea.
……………………………………………………………………………………………………………………………………………………………………………
…………………………………
125

Ansante sana kwa mda wako na kuhusika katika utafiti huu.
126

APPENDIX VI: CONSENT EXPLANATION KISWAHILI VERSIONMAELEZO YA RIDHIA
Mimi ni mwanfunzi wa mwaka wa pili katika chuo kikuu cha Nairobi
nikisomea shahada ya pili ya uuguzi katika matibabu na upasuaji.
Mpendwa Mshiriki,
Natarajia kutafiti juu ya “Mtazamo wa wagonjwa juu ya Huduma ya
uuguzi katika wodi za upasuaji katika Hospitali kuu ya Kenyatta”
ikiwa sehemu ya mahitaji ya kufuzukwa shahada ya pili ya uuguzi
wa upasuaji.
Kushiriki kwako katika utafiti huu ni hiari Habari zote
utakazotoa zitatumiwa kuangalia mtazamo na mapito yako juu ya
huduma ya uuguzi kwa lengo la kuboresha kiwango cha huduma hizi
ili kukutana na mahitaji na matarajio ya wagonjwa. Ukikubali
kushiriki katika utafiti huu, tutakuuliza maswali machache kwa
kujaza jarida la maswali juu ya kutosheka, mtazamo, matarajio na
mapito na jukumu lako kama mgonjwa unayepokea huduma za uuguzi.
Utaelekezwa kwa takribani dakika ishirini. Hakutakuwa na madhara
au maumivu kwako na pia hakutakuwa na faida ya kifedha kwa
kushiriki kwako.
Habari utakazotoa hapa hazitatolewa kwa yeyote nawe hutatambuliwa
kivyovyote, huta andika chochote cha kukutambulisha. Kushiriki
katika utafiti kunaweza kuleta kutambuliwa, lakini habari zote
zinazokuhusu hazitafichuliwa kamwe. Utakapojihisi kujiondoa
katika utafiti huu wakati wowote utakuwa huru kufanya hivyo bila
wasiwasi au athari zozote mbaya katika matibabu utakayopokea
baadaye.
127
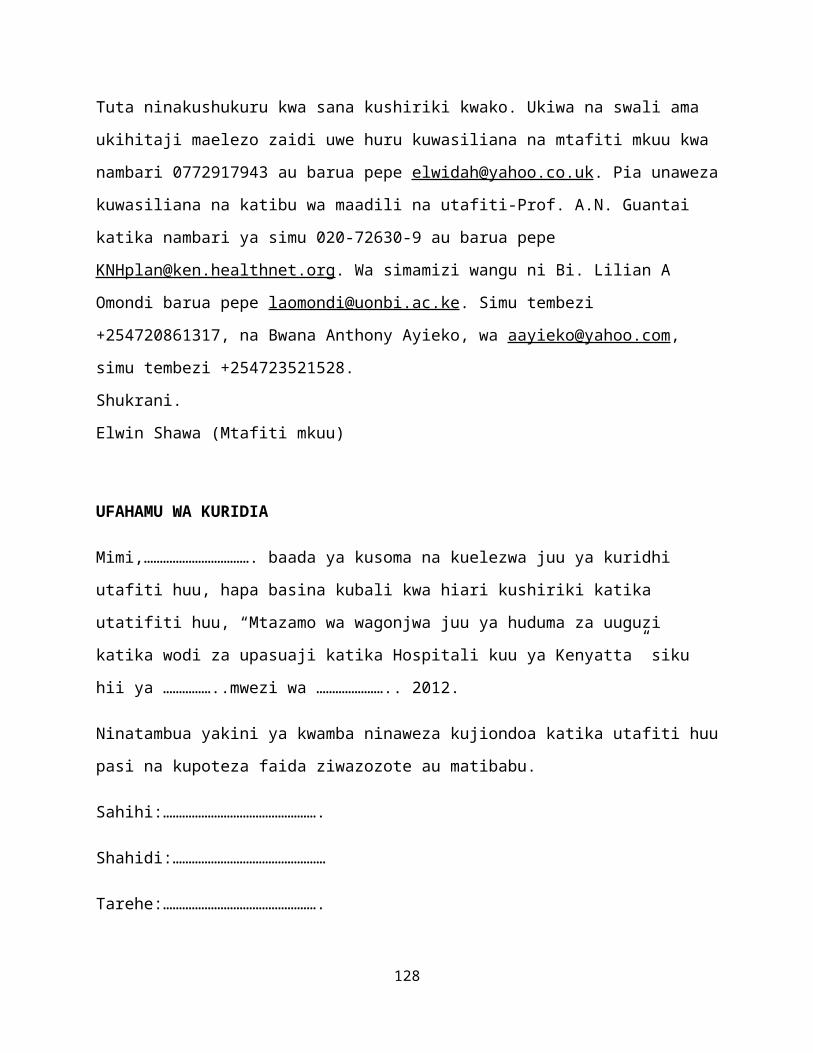
Tuta ninakushukuru kwa sana kushiriki kwako. Ukiwa na swali ama
ukihitaji maelezo zaidi uwe huru kuwasiliana na mtafiti mkuu kwa
nambari 0772917943 au barua pepe [email protected]. Pia unaweza
kuwasiliana na katibu wa maadili na utafiti-Prof. A.N. Guantai
katika nambari ya simu 020-72630-9 au barua pepe
[email protected]. Wa simamizi wangu ni Bi. Lilian A
Omondi barua pepe [email protected]. Simu tembezi
+254720861317, na Bwana Anthony Ayieko, wa [email protected],
simu tembezi +254723521528.
Shukrani.
Elwin Shawa (Mtafiti mkuu)
UFAHAMU WA KURIDIA
Mimi,……………………………. baada ya kusoma na kuelezwa juu ya kuridhi
utafiti huu, hapa basina kubali kwa hiari kushiriki katika
utatifiti huu, “Mtazamo wa wagonjwa juu ya huduma za uuguzi
katika wodi za upasuaji katika Hospitali kuu ya Kenyatta” siku
hii ya ……………..mwezi wa ………………….. 2012.
Ninatambua yakini ya kwamba ninaweza kujiondoa katika utafiti huu
pasi na kupoteza faida ziwazozote au matibabu.
Sahihi:………………………………………….
Shahidi:…………………………………………
Tarehe:………………………………………….
128

129
APPENDIX VII: LETTER TO NATIONAL COUNCIL FOR SCIENCE AND TECHNOLOGYElwin Shawa,
University of Nairobi,
School of Nursing Sciences,
6th February, 2012
TO,
The Chairperson,
National Council for Science and Technology
P.O. Box 30623-00100
Nairobi.
Dear Sir/Madam,
RE: RESEARCH AUTHORIZATION REQUEST
I am a second year postgraduate student pursuing Masters of
Science in Nursing (Medical-Surgical Nursing). I am writing to
request your permission to carry out research on “Patients’
Perceptions Regarding Nursing Care in General Surgical Wards at
KNH”. The study will be carried out in general surgical wards.
Your consideration will be highly appreciated and it will go a
130
long way in facilitating my study completion and also research
findings will be utilized both locally and internationally in
provision of quality nursing care.
Thank you.
Yours faithfully,
Elwin Shawa
APPENDIX VIII: LETTER TO KENYATTA NATIONAL HOSPITAL ETHICS COMMITTEEElwin Shawa,
University of Nairobi,
School of Nursing Sciences,
6th February, 2012
TO,
The Chairperson,
Kenyatta National Hospital Ethics Committee
P.O. Box 20723-00202
Nairobi.
Dear Sir/Madam,
RE: RESEARCH AUTHORIZATION REQUEST131
I am a second year postgraduate student pursuing Masters of
Science in Nursing (Medical-Surgical Nursing). I am writing to
request your permission to carry out research on “Patients’
Perceptions Regarding Nursing Care in general Surgical Wards at
KNH”. The study will be carried out in general surgical wards.
Your consideration will be highly appreciated and it will go a
long way in facilitating my study completion and also research
findings will be utilized both locally and internationally in
provision of quality nursing care.
Thank you.
Yours faithfully,
Elwin Shawa
APPENDIX IX: APPROVAL LETTER FROM UON/KNH ETHICS COMMITTEE
132
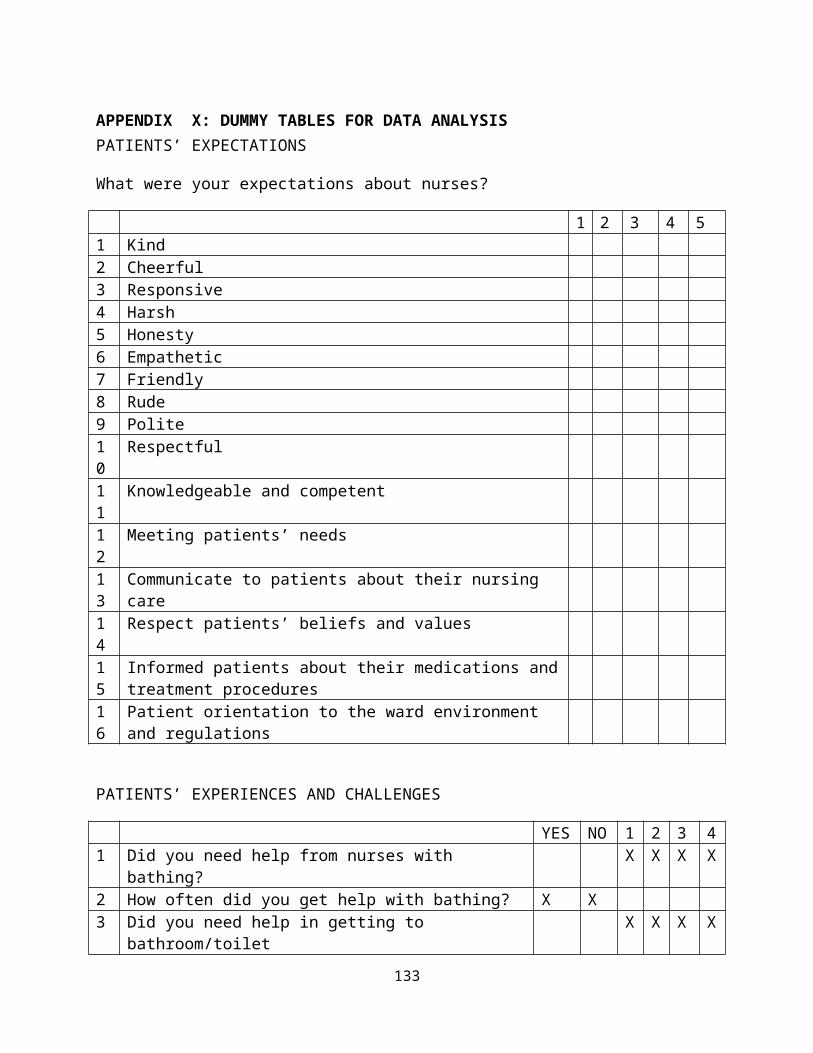
APPENDIX X: DUMMY TABLES FOR DATA ANALYSISPATIENTS’ EXPECTATIONS
What were your expectations about nurses?
1 2 3 4 51 Kind 2 Cheerful 3 Responsive4 Harsh5 Honesty6 Empathetic7 Friendly8 Rude9 Polite10
Respectful
11
Knowledgeable and competent
12
Meeting patients’ needs
13
Communicate to patients about their nursing care
14
Respect patients’ beliefs and values
15
Informed patients about their medications andtreatment procedures
16
Patient orientation to the ward environment and regulations
PATIENTS’ EXPERIENCES AND CHALLENGES
YES NO 1 2 3 41 Did you need help from nurses with
bathing?X X X X
2 How often did you get help with bathing? X X3 Did you need help in getting to
bathroom/toiletX X X X
133
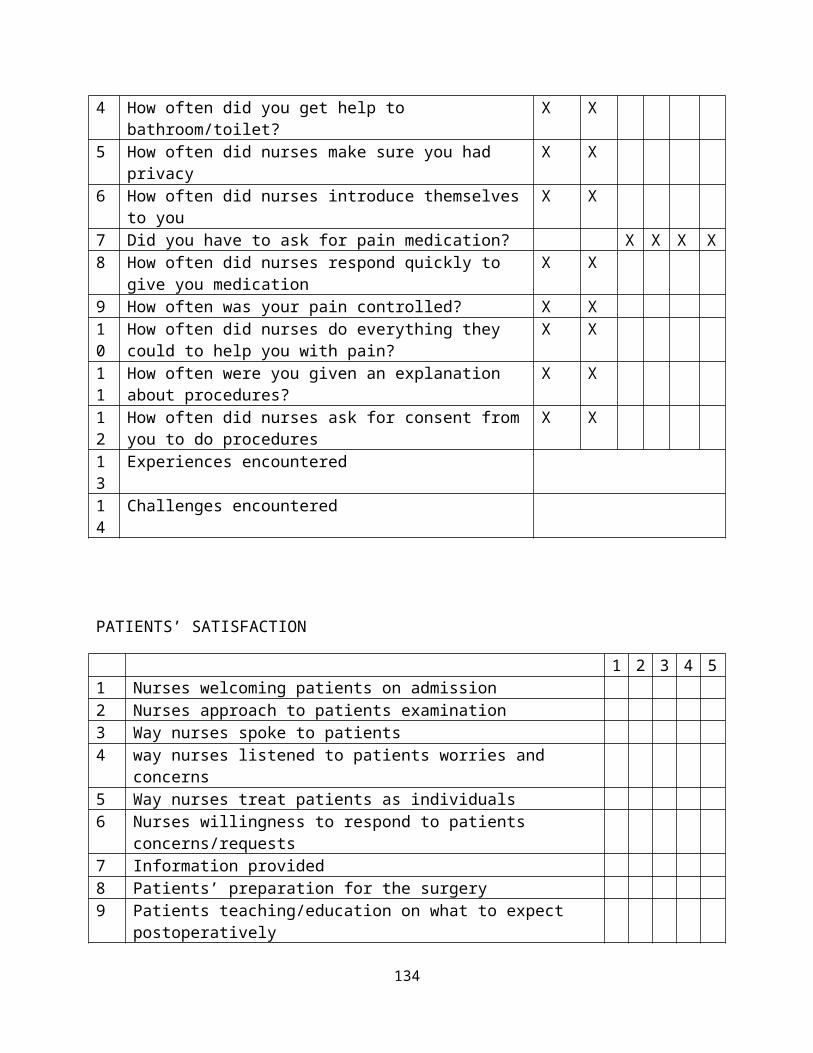
4 How often did you get help to bathroom/toilet?
X X
5 How often did nurses make sure you had privacy
X X
6 How often did nurses introduce themselvesto you
X X
7 Did you have to ask for pain medication? X X X X8 How often did nurses respond quickly to
give you medicationX X
9 How often was your pain controlled? X X10
How often did nurses do everything they could to help you with pain?
X X
11
How often were you given an explanation about procedures?
X X
12
How often did nurses ask for consent fromyou to do procedures
X X
13
Experiences encountered
14
Challenges encountered
PATIENTS’ SATISFACTION
1 2 3 4 51 Nurses welcoming patients on admission2 Nurses approach to patients examination3 Way nurses spoke to patients4 way nurses listened to patients worries and
concerns5 Way nurses treat patients as individuals6 Nurses willingness to respond to patients
concerns/requests7 Information provided8 Patients’ preparation for the surgery9 Patients teaching/education on what to expect
postoperatively
134
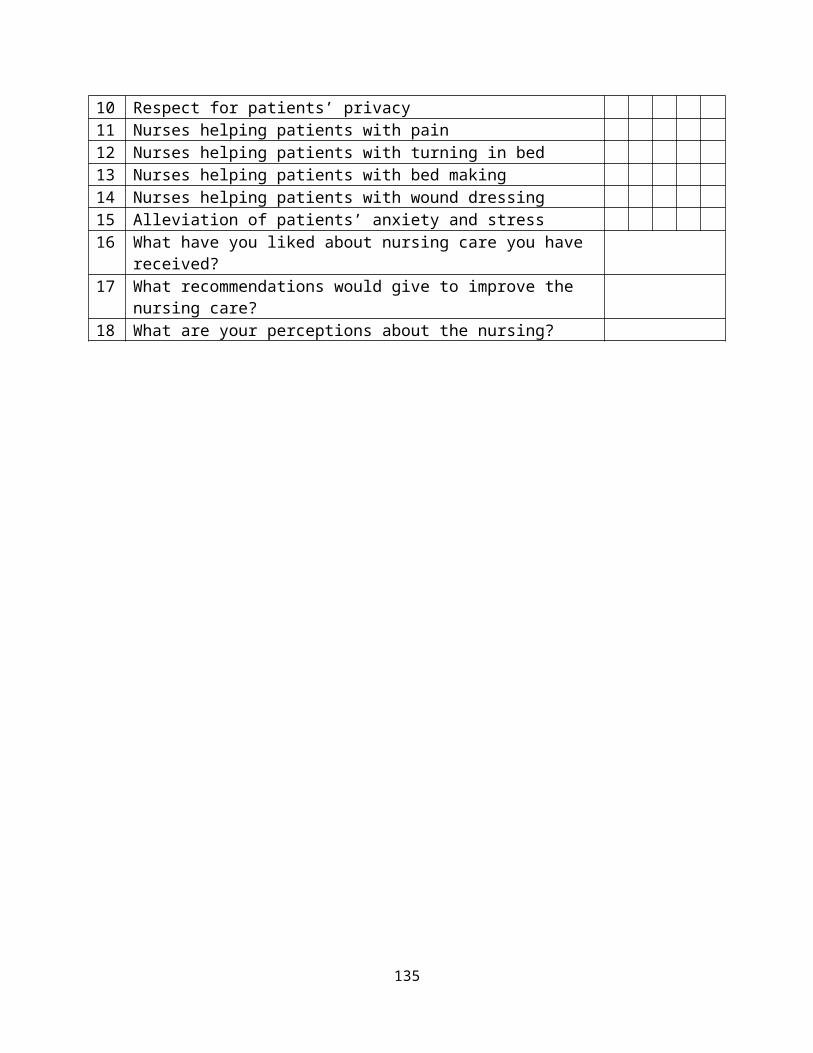
10 Respect for patients’ privacy11 Nurses helping patients with pain12 Nurses helping patients with turning in bed13 Nurses helping patients with bed making14 Nurses helping patients with wound dressing15 Alleviation of patients’ anxiety and stress16 What have you liked about nursing care you have
received?17 What recommendations would give to improve the
nursing care?18 What are your perceptions about the nursing?
135
Related Documents