1 ©2011 MFMER | slide-1 Patient Radiation Exposure Tracking with an Automated Database William Pavlicek PhD Dept of Radiology Mayo Clinic Arizona AAPM /COMP Meeting Vancover, BC July-Aug 2011 ©2011 MFMER | slide-2 Patient Exposures with Imaging ©2011 MFMER | slide-3 ©2011 MFMER | slide-4 Options Exist: Tracking Patient Exposure • Siemens • Philips • General Electric • Toshiba • Radiance • others

Welcome message from author
This document is posted to help you gain knowledge. Please leave a comment to let me know what you think about it! Share it to your friends and learn new things together.
Transcript
1
©2011 MFMER | slide-1
Patient Radiation Exposure Tracking with an Automated Database
William Pavlicek PhDDept of RadiologyMayo Clinic Arizona
AAPM /COMP Meeting Vancover, BCJuly-Aug 2011
©2011 MFMER | slide-2
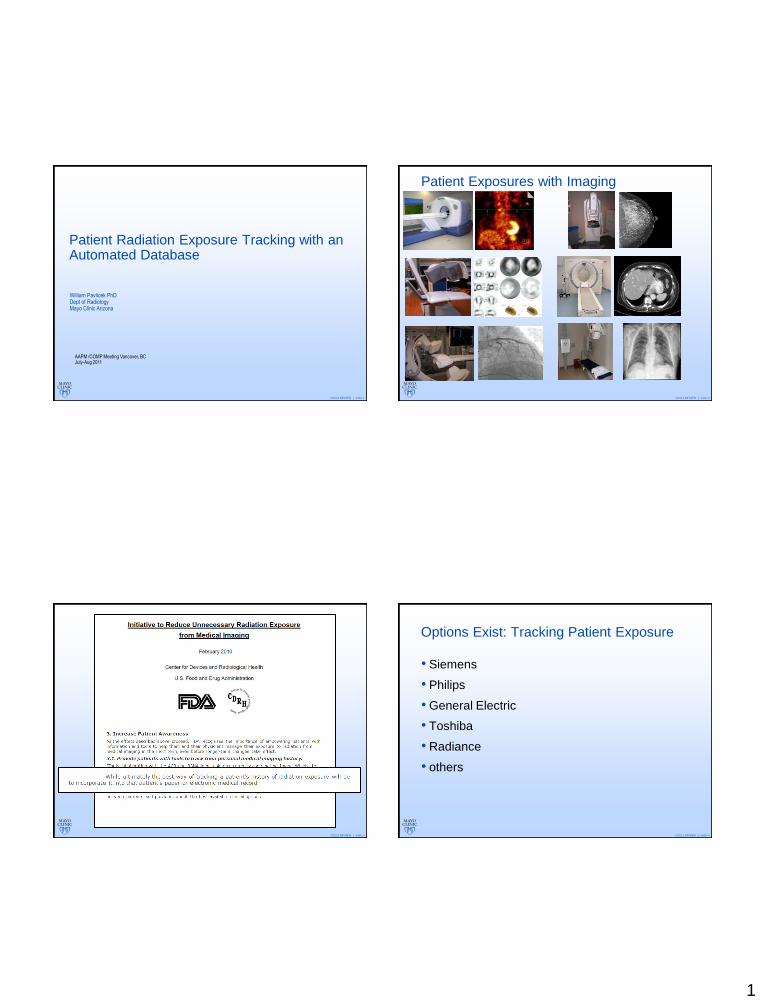
Patient Exposures with Imaging
©2011 MFMER | slide-3 ©2011 MFMER | slide-4
Options Exist: Tracking Patient Exposure
• Siemens
• Philips
• General Electric
• Toshiba
• Radiance
• others
2
©2011 MFMER | slide-5
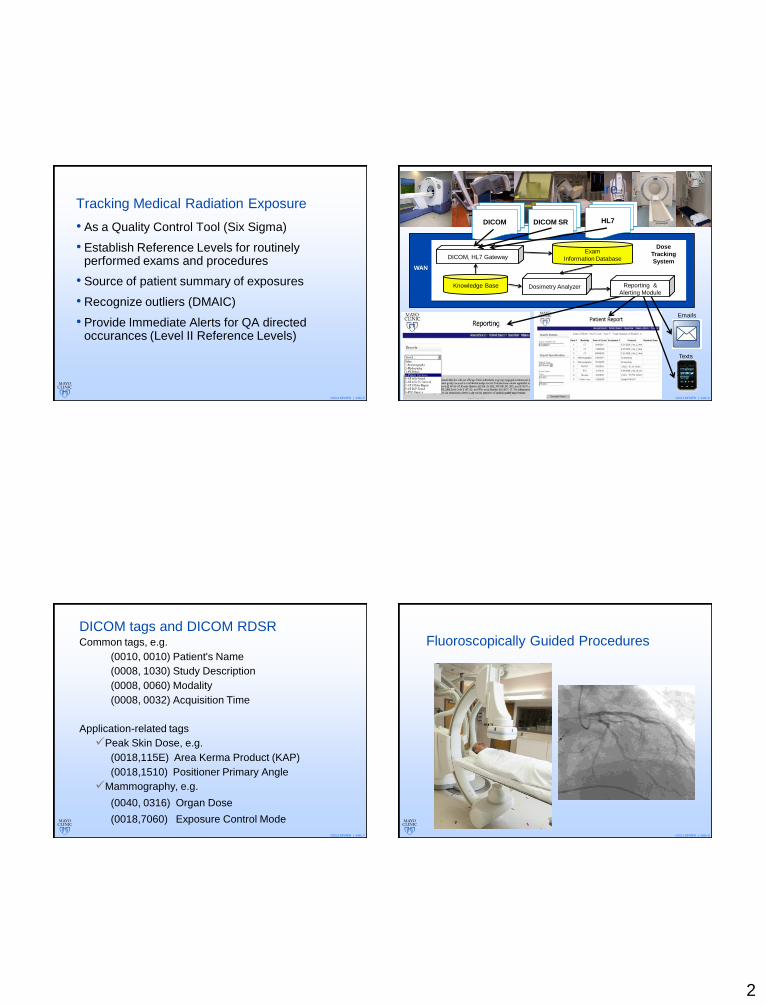
Tracking Medical Radiation Exposure
• As a Quality Control Tool (Six Sigma)
• Establish Reference Levels for routinely performed exams and procedures
• Source of patient summary of exposures
• Recognize outliers (DMAIC)
• Provide Immediate Alerts for QA directed occurances (Level II Reference Levels)
©2011 MFMER | slide-6
System Architecture
Knowledge Base
Exam
Information Database
Dosimetry Analyzer
Emails
WAN
Dose
Tracking
SystemDICOM, HL7 Gateway
DICOM DICOM SR HL7
Texts
Reporting &
Alerting Module
©2011 MFMER | slide-7
DICOM tags and DICOM RDSRCommon tags, e.g.
(0010, 0010) Patient's Name
(0008, 1030) Study Description
(0008, 0060) Modality
(0008, 0032) Acquisition Time
Application-related tags
Peak Skin Dose, e.g.
(0018,115E) Area Kerma Product (KAP)
(0018,1510) Positioner Primary Angle
Mammography, e.g.
(0040, 0316) Organ Dose
(0018,7060) Exposure Control Mode
©2011 MFMER | slide-8
Fluoroscopically Guided Procedures
3
©2011 MFMER | slide-9
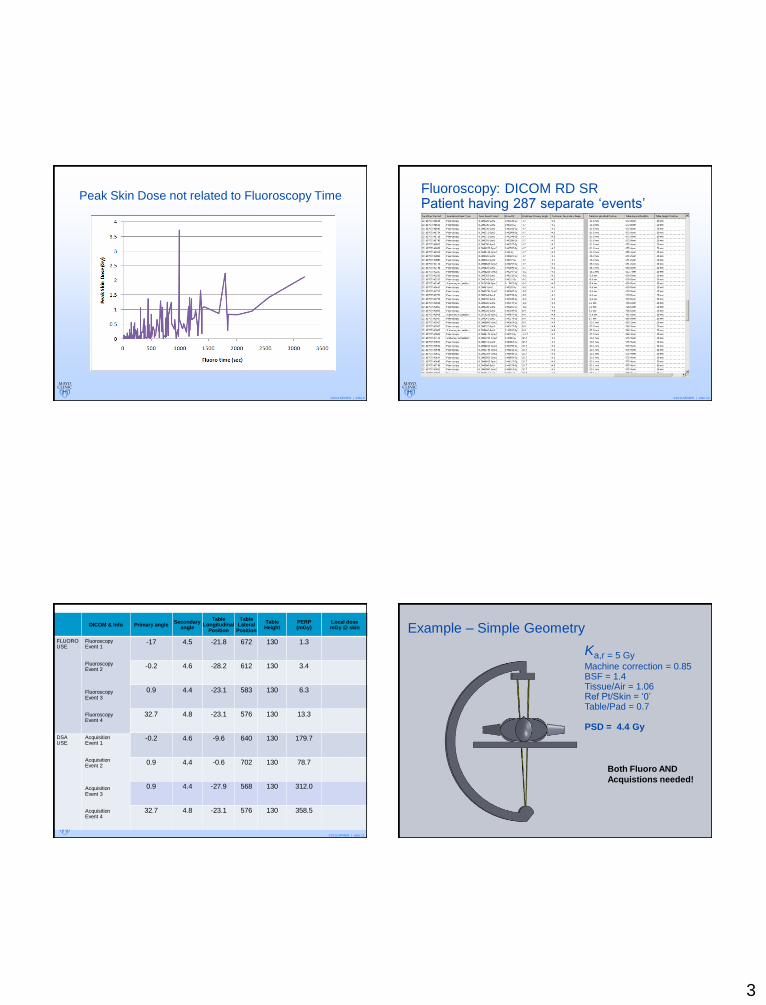
Peak Skin Dose not related to Fluoroscopy Time
©2011 MFMER | slide-10
Fluoroscopy: DICOM RD SRPatient having 287 separate ‘events’
©2011 MFMER | slide-11
DICOM & Info Primary angleSecondary
angle
Table Longitudinal
Position
Table Lateral
Position
Table Height
PERP (mGy)
Local dosemGy @ skin
FLUOROUSE
Fluoroscopy Event 1
Fluoroscopy Event 2
Fluoroscopy Event 3
Fluoroscopy Event 4
-17 4.5 -21.8 672 130 1.3
-0.2 4.6 -28.2 612 130 3.4
0.9 4.4 -23.1 583 130 6.3
32.7 4.8 -23.1 576 130 13.3
DSAUSE
Acquisition Event 1
Acquisition Event 2
Acquisition Event 3
Acquisition Event 4
-0.2 4.6 -9.6 640 130 179.7
0.9 4.4 -0.6 702 130 78.7
0.9 4.4 -27.9 568 130 312.0
32.7 4.8 -23.1 576 130 358.5
©2011 MFMER | slide-12
Example – Simple Geometry
Ka,r = 5 Gy
Machine correction = 0.85BSF = 1.4Tissue/Air = 1.06Ref Pt/Skin = ‘0’Table/Pad = 0.7
PSD = 4.4 Gy
Both Fluoro AND
Acquistions needed!
4
©2011 MFMER | slide-13
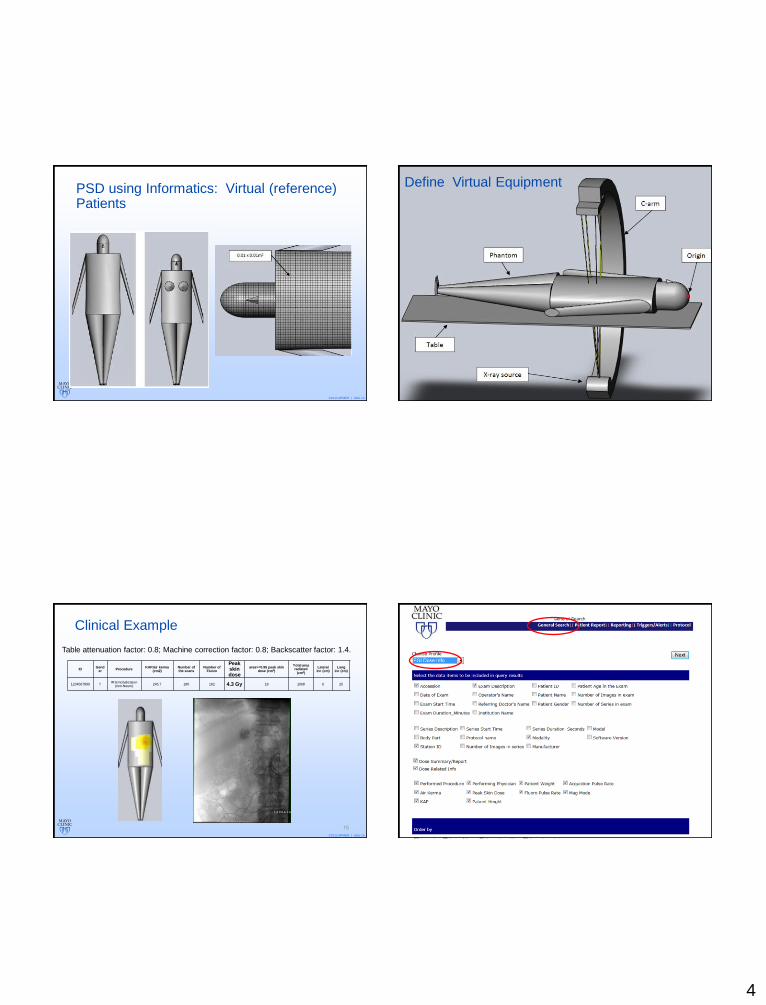
PSD using Informatics: Virtual (reference) Patients
©2011 MFMER | slide-14
Define Virtual Equipment
©2011 MFMER | slide-15
15
Table attenuation factor: 0.8; Machine correction factor: 0.8; Backscatter factor: 1.4.
IDGend
erProcedure
KAP/air kerma (cm2)
Number of the scans
Number of Fluoro
Peak skin dose
area>=0.95 peak skin dose (cm2)
Total area radiated
(cm2)
Lateral inc (cm)
Long inc (cm)
1234567890 fIR Emobalization
(non-Neuro)245.7 180 162 4.3 Gy 18 1068 6 25
Clinical Example
©2011 MFMER | slide-16
5
©2011 MFMER | slide-17
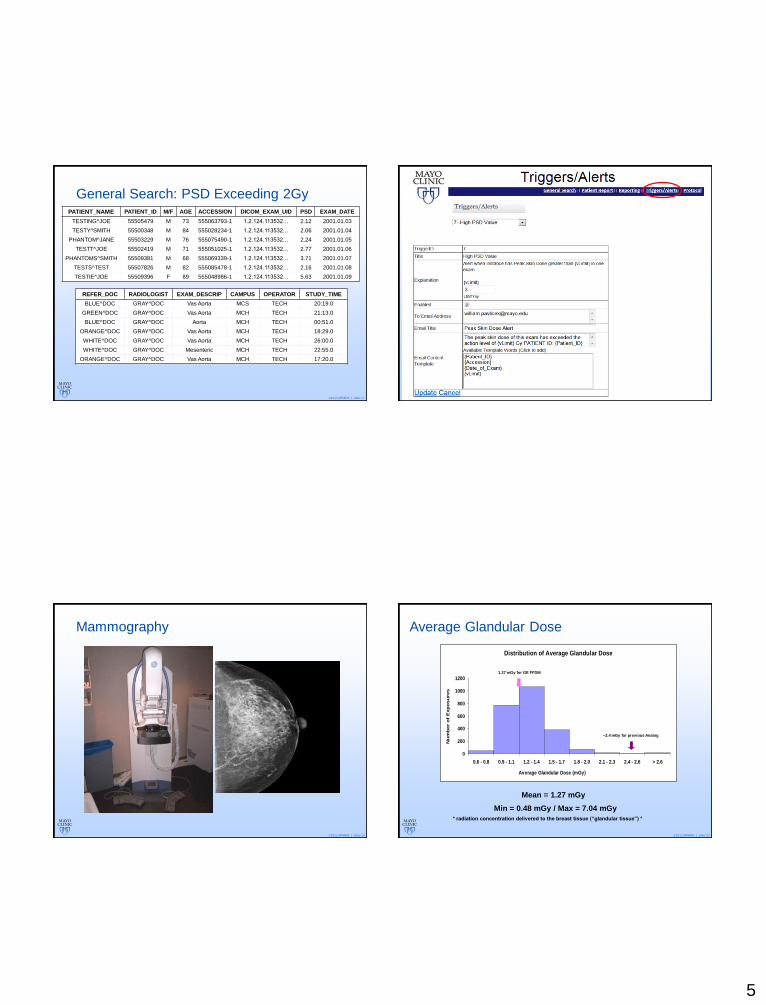
General Search: PSD Exceeding 2GyPATIENT_NAME PATIENT_ID M/F AGE ACCESSION DICOM_EXAM_UID PSD EXAM_DATE
TESTING^JOE 55505479 M 73 555063793-1 1.2.124.113532… 2.12 2001.01.03
TESTY^SMITH 55500348 M 84 555028234-1 1.2.124.113532… 2.06 2001.01.04
PHANTOM^JANE 55503229 M 76 555075490-1 1.2.124.113532… 2.24 2001.01.05
TESTT^JOE 55502419 M 71 555051025-1 1.2.124.113532… 2.77 2001.01.06
PHANTOMS^SMITH 55509381 M 68 555069339-1 1.2.124.113532… 3.71 2001.01.07
TESTS^TEST 55507826 M 82 555085478-1 1.2.124.113532… 2.16 2001.01.08
TESTIE^JOE 55509396 F 89 555048986-1 1.2.124.113532… 5.63 2001.01.09
REFER_DOC RADIOLOGIST EXAM_DESCRIP CAMPUS OPERATOR STUDY_TIME
BLUE^DOC GRAY^DOC Vas Aorta MCS TECH 20:19.0
GREEN^DOC GRAY^DOC Vas Aorta MCH TECH 21:13.0
BLUE^DOC GRAY^DOC Aorta MCH TECH 00:51.0
ORANGE^DOC GRAY^DOC Vas Aorta MCH TECH 18:29.0
WHITE^DOC GRAY^DOC Vas Aorta MCH TECH 26:00.0
WHITE^DOC GRAY^DOC Mesenteric MCH TECH 22:55.0
ORANGE^DOC GRAY^DOC Vas Aorta MCH TECH 17:20.0
©2011 MFMER | slide-18
©2011 MFMER | slide-19
Mammography
©2011 MFMER | slide-20
~2.4 mGy for previous Analog
Distribution of Average Glandular Dose
0
200
400
600
800
1000
1200
0.6 - 0.8 0.9 - 1.1 1.2 - 1.4 1.5 - 1.7 1.8 - 2.0 2.1 - 2.3 2.4 - 2.6 > 2.6
Average Glandular Dose (mGy)
Nu
mb
er
of
Exp
osu
res
1.27 mGy for GE FFDM
~2.4 mGy for previous Analog
Average Glandular Dose
Mean = 1.27 mGy
Min = 0.48 mGy / Max = 7.04 mGy
* radiation concentration delivered to the breast tissue (“glandular tissue”) *
6
©2011 MFMER | slide-21
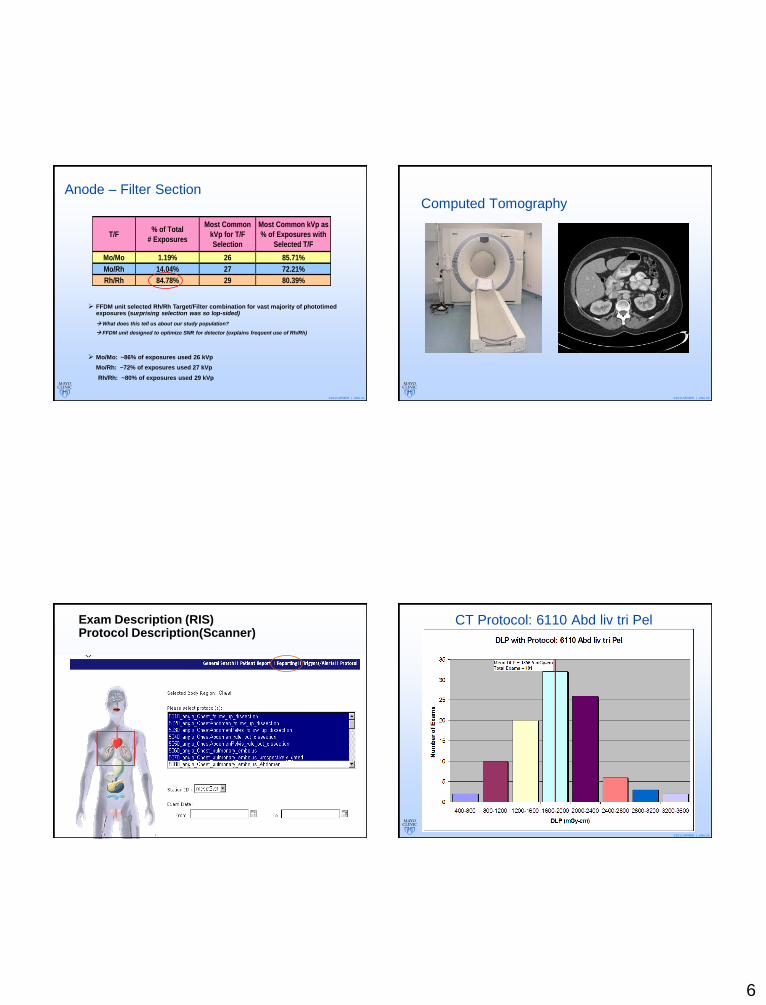
FFDM unit selected Rh/Rh Target/Filter combination for vast majority of phototimed exposures (surprising selection was so lop-sided)
What does this tell us about our study population?
FFDM unit designed to optimize SNR for detector (explains frequent use of Rh/Rh)
Mo/Mo: ~86% of exposures used 26 kVp
Mo/Rh: ~72% of exposures used 27 kVp
Rh/Rh: ~80% of exposures used 29 kVp
T/F% of Total
# Exposures
Most Common
kVp for T/F
Selection
Most Common kVp as
% of Exposures with
Selected T/F
Mo/Mo 1.19% 26 85.71%
Mo/Rh 14.04% 27 72.21%
Rh/Rh 84.78% 29 80.39%
Anode – Filter Section
©2011 MFMER | slide-22
Computed Tomography
©2011 MFMER | slide-23
Exam Description (RIS) Protocol Description(Scanner)
©2011 MFMER | slide-24
CT Protocol: 6110 Abd liv tri Pel
7
©2011 MFMER | slide-25
PerfusionAlerts
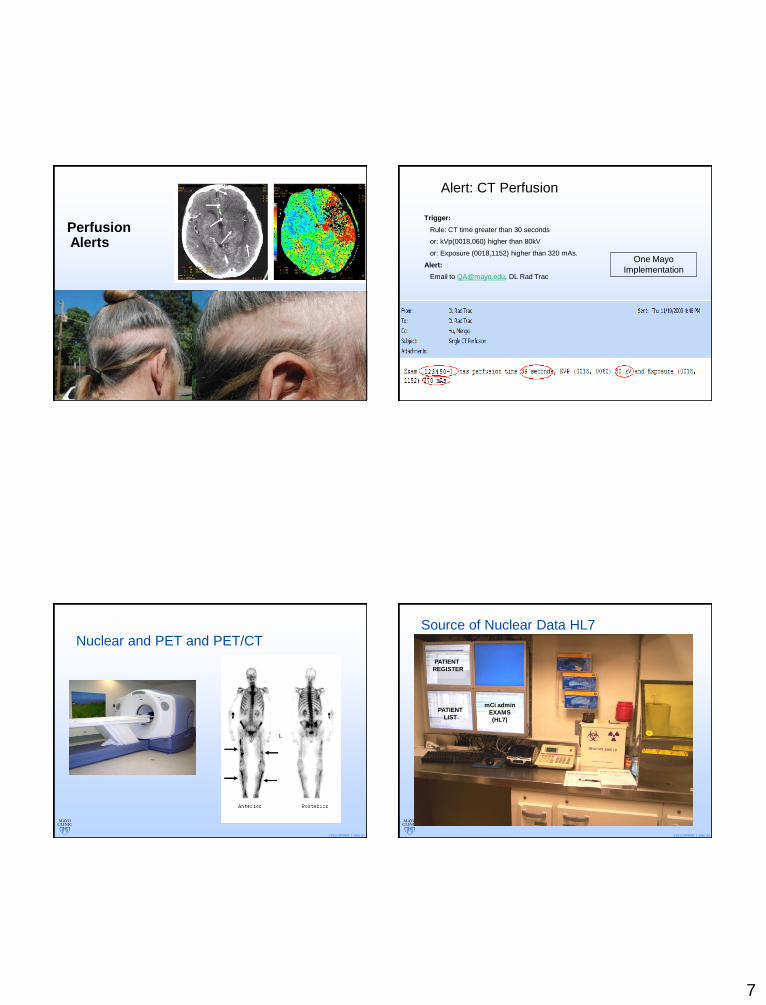
©2011 MFMER | slide-26
Alert: CT Perfusion
Trigger:
Rule: CT time greater than 30 seconds
or: kVp(0018,060) higher than 80kV
or: Exposure (0018,1152) higher than 320 mAs.
Alert:
Email to [email protected], DL Rad Trac
One Mayo
Implementation
©2011 MFMER | slide-27
Nuclear and PET and PET/CT
©2011 MFMER | slide-28
Source of Nuclear Data HL7
PATIENT
REGISTER
PATIENT
LIST
mCi admin
EXAMS
(HL7)
8
©2011 MFMER | slide-29
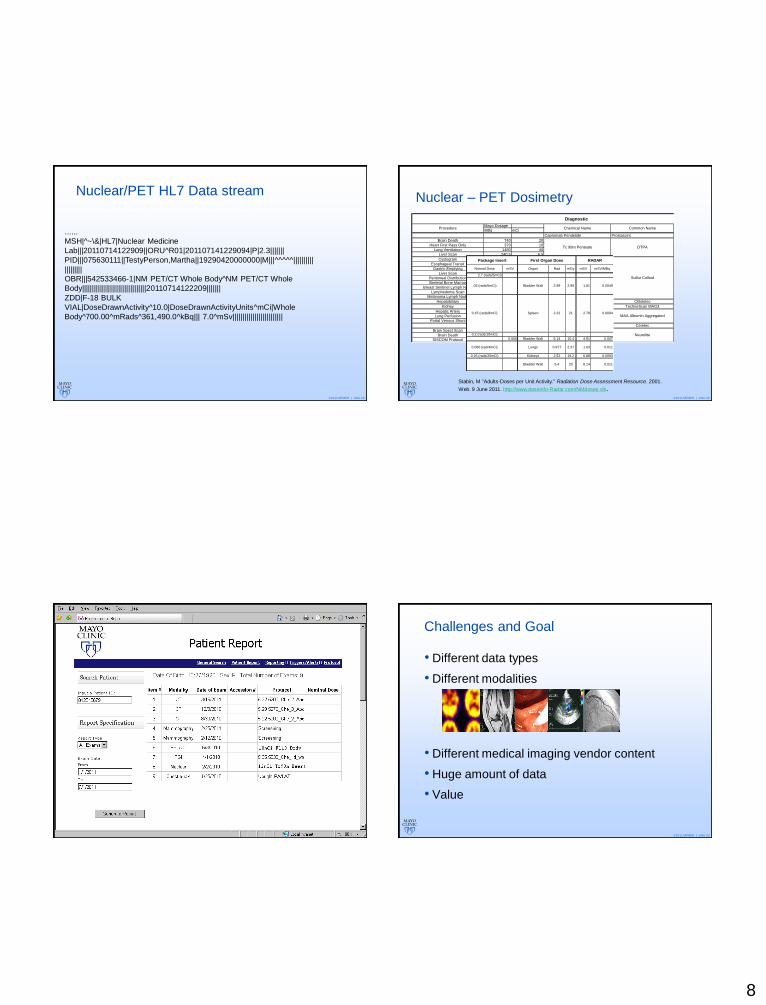
Nuclear/PET HL7 Data stream
......
MSH|^~\&|HL7|Nuclear Medicine
Lab|||20110714122909||ORU^R01|201107141229094|P|2.3|||||||
PID|||075630111||TestyPerson,Martha||19290420000000|M|||^^^^^||||||||||
|||||||||
OBR|||542533466-1|NM PET/CT Whole Body^NM PET/CT Whole
Body||||||||||||||||||||||||||||||||20110714122209|||||||
ZDD|F-18 BULK
VIAL|DoseDrawnActivity^10.0|DoseDrawnActivityUnits^mCi|Whole
Body^700.00^mRads^361,490.0^kBq||| 7.0^mSv|||||||||||||||||||||||||
©2011 MFMER | slide-30
Mayo Dosage
MBq mCi
Capromab Pendetide Prostascint
Brain Death 740 20
Heart First Pass Only 370 10
Lung Ventilation 1480 40
Liver Scan 240.5 6.5
Cystogram 37 1
Esophageal Transit 7.4 3 doses 200uCi 3 doses
Gastric Emptying 37 1
Liver Scan 240.5 6.5
Peritoneal Distribution 74 2
Skeletal Bone Marrow 370 10
Breast Sentinel Lymph Node 37 1
Lymphedema Scan 18.5 2 doses 500uCi 2 doses
Melanoma Lymph Node 74 or 148 2 or 4
Hepatobiliary 148 4 Tc 99m Mebrofenin Chloletec
Kidney 370 10 Tc 99m Mertiatide TechneScan MAG3
Hepatic Artery 148 4
Lung Perfusion 222 6
Portal Venous Shunt 148 4
Tc 99m Exametazime Ceretec
Brain Spect Scan 925 25
Brain Death 740 20
SISCOM Protocol 555-1295 15-35
Diagnostic
Sulfur Colloid
Chemical Name Common NameProcedure
Tc 99m Penteate DTPA
Tc 99m Albumin Aggregated MAA Albumin Aggregated
Tc 99m Sulfur Colloid
Tc 99m Bicisate Neurolite
2.7 (rads/5mCi)
0.2 (rads/10mCi)
0.666 Bladder Wall 6.14 10.4 4.51 0.007
0.26 (rads/20mCi) Kidneys 2.52 19.2 6.88 0.0093
212.22Spleen0.15 (rads/8mCi)
Package Insert First Organ Dose RADAR
Rad mGy mSV mSV/MBqNormal Dose mSV Organ
0.011
.03 (rads/5mCi) Bladder Wall 2.99 2.99
1.632.370.977
1.81 0.0049
0.00942.78
Bladder Wall
Lungs0.060 (rad/4mCi)
20 8.14 0.0115.4
Stabin, M "Adults-Doses per Unit Activity." Radiation Dose Assessment Resource. 2001.
Web. 9 June 2011. http://www.doseinfo-Radar.com/NMdoses.xls.
Nuclear – PET Dosimetry
©2011 MFMER | slide-31 ©2011 MFMER | slide-32
Challenges and Goal
• Different data types
• Different modalities
• Different medical imaging vendor content
• Huge amount of data
• Value
9
©2011 MFMER | slide-33
Team Members and I ‘Thank you’!
Dr. Muhong Zhang,
ASU
Dr. Eric Huettl,
MCA
Dr. Brian Chong,
MCA
Gene Paden, MS.,
MCA
Dr. Teresa Wu,
ASU
Yasaman
Khodadadegan
Stephen Sabyan,
R.T. (R), MCA
Dr. Richard Morin,
MCJ
Dr. Kevin
Nelson, MCJ
Dr. Beth
Schueler, MCR
Dr. Steve
Langer, MCR
Dr. Kenneth
Fetterly, MCR
Related Documents


![[HL7 INTERFACE SPECIFICATION] - cortexmed.com · HL7 Minimal Lower ... ADT – Process patient demographic information communicated from a hospital or physician ’s ... [HL7 INTERFACE](https://static.cupdf.com/doc/110x72/5b145cb87f8b9a487c8cad39/hl7-interface-specification-hl7-minimal-lower-adt-process-patient.jpg)