Journal of Engineering Science and Technology Vol. 10, No. 3 (2015) 383 - 403 © School of Engineering, Taylor’s University 383 PARAMETRIC STUDY OF OUTER-BRACE SCFS IN RIGHT- ANGLE TWO-PLANAR TUBULAR DKT-JOINTS OF OFFSHORE JACKET STRUCTURES H. AHMADI 1, *, M. A. LOTFOLLAHI-YAGHIN 1 , A. AMINFAR 2 1 Faculty of Civil Engineering, University of Tabriz, Tabriz 5166616471, Iran 2 Islamic Azad University, Science and Research Branch, Tabriz, Iran *Corresponding Author: [email protected] Abstract In the present paper, a set of parametric FE stress analyses is carried out for two-planar welded tubular DKT-joints under two different axial load cases. Analysis results are used to present general remarks on the effect of geometrical parameters on the stress concentration factors (SCFs) at the inner saddle, outer saddle, crown toe, and crown heel positions on the main (outer) brace. Based on the results of finite element analyses which are verified against the experimental data, a complete set of SCF database is constructed. Then a new set of SCF parametric equations is developed through nonlinear regression analysis for the fatigue design of two-planar DKT-joints under axial loads. An assessment study of these equations is conducted against the experimental data and the satisfaction of criteria regarding the acceptance of parametric equations is checked. Significant effort has been devoted by researchers to the study of SCFs in various uni-planar tubular connections. Nevertheless, for multi-planar joints covering the majority of practical applications, very few investigations have been reported due to the complexity and high cost involved. Keywords: Offshore jacket structure, Multi-planar tubular joint, KT-joint, Fatigue, Stress concentration factor (SCF), Parametric equation. 1. Introduction Steel circular hollow sections (CHSs) are widely used in offshore structures due to their good resistances against bending, torsion and buckling, and a high strength-to-weight ratio. In a tubular joint, the members are connected by welding the prepared profiled end of the brace members onto the outer surface of the chord member.

Welcome message from author
This document is posted to help you gain knowledge. Please leave a comment to let me know what you think about it! Share it to your friends and learn new things together.
Transcript

Journal of Engineering Science and Technology Vol. 10, No. 3 (2015) 383 - 403 © School of Engineering, Taylor’s University
383
PARAMETRIC STUDY OF OUTER-BRACE SCFS IN RIGHT-ANGLE TWO-PLANAR TUBULAR DKT-JOINTS OF OFFSHORE
JACKET STRUCTURES
H. AHMADI1,*, M. A. LOTFOLLAHI-YAGHIN
1, A. AMINFAR
2
1 Faculty of Civil Engineering, University of Tabriz, Tabriz 5166616471, Iran 2 Islamic Azad University, Science and Research Branch, Tabriz, Iran
*Corresponding Author: [email protected]
Abstract
In the present paper, a set of parametric FE stress analyses is carried out for
two-planar welded tubular DKT-joints under two different axial load cases.
Analysis results are used to present general remarks on the effect of geometrical parameters on the stress concentration factors (SCFs) at the inner saddle, outer
saddle, crown toe, and crown heel positions on the main (outer) brace. Based on
the results of finite element analyses which are verified against the experimental
data, a complete set of SCF database is constructed. Then a new set of SCF
parametric equations is developed through nonlinear regression analysis for the
fatigue design of two-planar DKT-joints under axial loads. An assessment study of these equations is conducted against the experimental data and the
satisfaction of criteria regarding the acceptance of parametric equations is
checked. Significant effort has been devoted by researchers to the study of
SCFs in various uni-planar tubular connections. Nevertheless, for multi-planar
joints covering the majority of practical applications, very few investigations have been reported due to the complexity and high cost involved.
Keywords: Offshore jacket structure, Multi-planar tubular joint, KT-joint, Fatigue,
Stress concentration factor (SCF), Parametric equation.
1. Introduction
Steel circular hollow sections (CHSs) are widely used in offshore structures due
to their good resistances against bending, torsion and buckling, and a high
strength-to-weight ratio. In a tubular joint, the members are connected by welding
the prepared profiled end of the brace members onto the outer surface of the
chord member.
384 H. Ahmadi et al.
Journal of Engineering Science and Technology March 2015, Vol. 10(3)
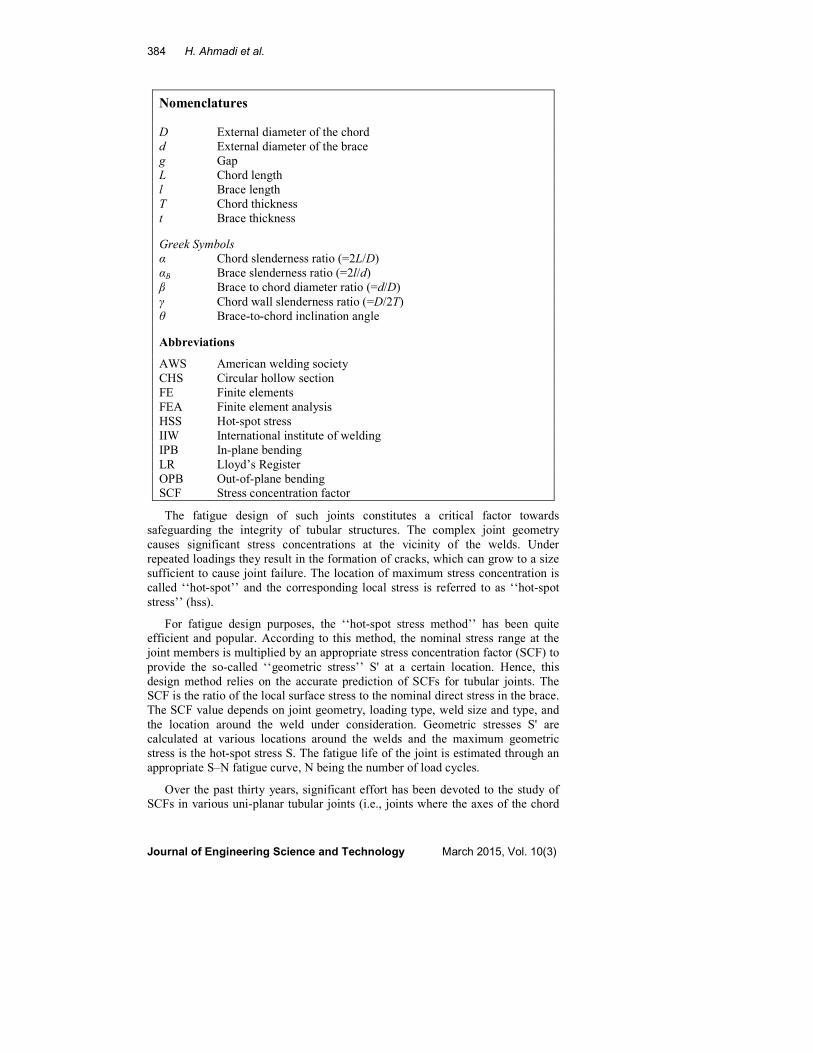
Nomenclatures
D External diameter of the chord
d External diameter of the brace
g Gap
L Chord length
l Brace length
T Chord thickness
t Brace thickness
Greek Symbols
α Chord slenderness ratio (=2L/D)
αB Brace slenderness ratio (=2l/d)
β Brace to chord diameter ratio (=d/D)
γ Chord wall slenderness ratio (=D/2T)
θ Brace-to-chord inclination angle
Abbreviations
AWS American welding society
CHS Circular hollow section
FE Finite elements
FEA Finite element analysis
HSS Hot-spot stress
IIW International institute of welding
IPB In-plane bending
LR Lloyd’s Register
OPB Out-of-plane bending
SCF Stress concentration factor
The fatigue design of such joints constitutes a critical factor towards
safeguarding the integrity of tubular structures. The complex joint geometry
causes significant stress concentrations at the vicinity of the welds. Under
repeated loadings they result in the formation of cracks, which can grow to a size
sufficient to cause joint failure. The location of maximum stress concentration is
called ‘‘hot-spot’’ and the corresponding local stress is referred to as ‘‘hot-spot
stress’’ (hss).
For fatigue design purposes, the ‘‘hot-spot stress method’’ has been quite
efficient and popular. According to this method, the nominal stress range at the
joint members is multiplied by an appropriate stress concentration factor (SCF) to
provide the so-called ‘‘geometric stress’’ S' at a certain location. Hence, this
design method relies on the accurate prediction of SCFs for tubular joints. The
SCF is the ratio of the local surface stress to the nominal direct stress in the brace.
The SCF value depends on joint geometry, loading type, weld size and type, and
the location around the weld under consideration. Geometric stresses S' are
calculated at various locations around the welds and the maximum geometric
stress is the hot-spot stress S. The fatigue life of the joint is estimated through an
appropriate S–N fatigue curve, N being the number of load cycles.
Over the past thirty years, significant effort has been devoted to the study of
SCFs in various uni-planar tubular joints (i.e., joints where the axes of the chord

Parametric Study of Outer-Brace SCFS in Right-Angle Two-Planar Tubular . . . . 385
Journal of Engineering Science and Technology March 2015, Vol. 10(3)
and the braces lay in the same plane). As a result, many parametric design
equations (formulae) in terms of the joint geometrical parameters have been
proposed, providing SCF values at certain locations adjacent to the weld for
several loading conditions. Multi-planar joints are an intrinsic feature of offshore
tubular structures. As can be seen in Fig. 1, right-angle 2-planar DKT-joints
connecting the braces to the main legs are of the most critical tubular joints in a
typical jacket structure. The multi-planar effect plays an important role in the
stress distribution at the brace-to-chord intersection areas of the spatial tubular
joints. For such multi-planar connections, the parametric stress formulae of
simple uni-planar tubular joints are not applicable in SCF prediction.
Nevertheless, for multi-planar joints which cover the majority of practical
applications, very few investigations have been reported due to the complexity
and high cost involved. The second section reviews the research works currently
available in the literature.
The value of SCF along the weld toe of a tubular joint is mainly determined
by the joint geometry under any specific loading condition. In order to study the
behaviour of tubular joints and to relate this behaviour easily to the geometrical
properties of the joint, a set of non-dimensional geometrical parameters has been
defined. Figure 2 shows a right-angle 2-planar tubular DKT-joint with the four
commonly named locations along the brace-chord intersection of the outer brace:
inner saddle, outer saddle, crown toe, and crown heel. Geometrical parameters (β,
γ, τ, ζ, α, and αB) respective to chord and brace diameters D and d, and the
corresponding wall thicknesses T and t are also shown in Fig. 2.
Fig. 1. Multi-planar DKT-joints in a typical jacket structure.
In the present paper, parametric stress analysis has been carried out for 81
steel multi-planar (right-angle 2-planar) tubular DKT-joints under two different
axial loading conditions. The analysis results are used to present general remarks
on the effect of geometrical parameters including τ (brace to chord thickness

386 H. Ahmadi et al.
Journal of Engineering Science and Technology March 2015, Vol. 10(3)
ratio), γ (chord wall slenderness ratio), β (brace to chord diameter ratio) and θ
(outer brace-to-chord inclination angle) on the SCF values at the inner saddle,
outer saddle, crown toe, and crown heel positions of the chord side on the main
(outer) brace. To study the multi-planar effect and to investigate the effect of
loading condition, SCFs in multi-planar joints under two axial load cases are
compared with the SCFs in a uni-planar KT-joint having the same geometrical
properties. Based on the multi-planar DKT-joint FE models which are verified
against both experimental results and the predictions of Lloyd’s Register (LR)
equations, a complete set of SCF database is constructed for two considered axial
load cases at four weld toe locations: inner saddle, outer saddle, crown toe, and
crown heel. The FE models cover a wide range of geometrical parameters.
Through nonlinear regression analysis, a new set of SCF parametric equations is
established for the fatigue design of multi-planar DKT-joints under axial loads.
An assessment study of these equations is conducted against the experimental
data and the satisfaction of the criteria regarding the acceptance of parametric
equations is also checked.
Fig. 2. Geometrical notation for a Right-Angle 2-Planar tubular DKT-joint.
2. Literature Review
For the uni-planar tubular joints, the reader is referred for example to [1-3] (for
SCF calculation at the saddle and crown positions of simple uni-planar T-, Y-, X-,
K- and KT-joints), [4] (for SCF determination in uni-planar overlapped tubular
joints), and [5-9] (for the study of SCF distribution along the weld toe of various
uni-planar joints). Following paragraph reviews the research works on the SCF
calculation in the multi-planar tubular joints.

Parametric Study of Outer-Brace SCFS in Right-Angle Two-Planar Tubular . . . . 387
Journal of Engineering Science and Technology March 2015, Vol. 10(3)
Karamanos et al. [10] proposed a set of parametric equations to determine the
SCFs for multi-planar welded CHS XX-connections. In this study, weld profile
was modelled using 20-node solid elements while 8-node shell elements were
used to model the chord and braces. This research covered the various loading
modes including reference and carry-over loadings. Chiew et al. [11] studied the
stress concentrations in DX-joints due to axial loads. Chiew et al. [12] developed
a set of design formulae to determine the SCFs for multi-planar tubular XX-joints
under axial, IPB and OPB loadings. Van Wingerde et al. [13] presented the
equations and graphs to predict the SCFs for multi-planar KK-joints. The aim of
this study was to simplify the equations for design purposes. Karamanos et al.
[14] proposed SCF equations in multi-planar welded tubular DT-joints including
bending effects. Woghiren and Brennan [15] developed a set of parametric
formulae to predict the values of SCF in multi-planar rack-stiffened tubular KK-
joints. An experimental database of SCFs for acrylic specimens of multi-planar
K- and KT-joints has been presented In the HSE OTH 91 353 [16] prepared by
Lloyd’s Register. This report covers only the values of SCFs at the chord inner
and outer saddle positions.
It can be seen that in the case of multi-planar joints, the studied connection
types and load cases are very limited. Despite the frequent use of multi-planar
CHS DKT-joints in the design of offshore jacket structures (see Fig. 1), no
parametric equation is available to predict the SCF values in such tubular joints.
3. Numerical Simulation of Tubular Joints
Theoretical calculation of SCFs is difficult and the results from a strain gauged
acrylic model test are not always reliable because the welding profile is not
included in such specimens. The most accurate and reliable method for
determining the SCFs is by testing strain gauged large scale or practical size steel
joint specimens. However, due to its high cost and testing facility limitations,
such a method is difficult to be used to study comprehensively the joints with
various geometrical parameters and load conditions. Finite element method which
has been used successfully to analyse the joints with various geometrical sizes
and different load conditions is adopted in this study.
3.1. Geometrical characteristics of the models
To investigate the stress concentration in multi-planar tubular DKT-joints, 81
models are generated and analysed using the multi-purpose FEM based
software package, ANSYS [17]. The aim is to study the effect of dimensionless
geometrical parameters on the SCF values at the inner saddle, outer saddle,
crown toe, and crown heel positions on the outer brace. Different values are
assigned to each non-dimensional parameter are as follows: β = 0.3, 0.4, 0.5;
γ = 12, 18, 24; τ = 0.3, 0.6, 0.9; θ = 30°, 45°, 60°. These values cover the
practical range of the normalised parameters typically found in multi-planar
tubular joints of offshore structures. Geometrical characteristics of all braces
are identical in each specific model. According to the values of γ, τ and β in
each joint, the values of diameter and the wall thickness of the braces are
changed from one model to another. According to Lotfollahi-Yaghin and
Ahmadi [9], providing that the gap between the central and outer braces is not
388 H. Ahmadi et al.
Journal of Engineering Science and Technology March 2015, Vol. 10(3)
very large, the relative gap (ζ= g / D) has no considerable effect on the SCF
values in a tubular KT-joint. The validity range for this conclusion is 0.2 ≤ ζ ≤
0.6. Hence, a typical value of ζ = 0.2 is assigned for all joints. The values of α
and αB which are fixed in all joints are 16 and 8, respectively. The reasons for
choosing these specific values are given in sub-section 3.3. The 81 generated
models span the following ranges of the geometric parameters:
0.3 ≤ β ≤ 0.5
12 ≤ γ ≤ 24
0.3 ≤ τ ≤ 0.9
30° ≤ θ ≤ 60°
3.2. Element type and mesh generation method
The choice of element type for the analysis depends on the geometry of the joint
and the purpose for which the results of the analysis are to be used. It has to be a
compromise between the accuracy of representation and the computer time taken
to analyse a particular model. The entire tubular joint can be modelled by 3D
brick elements. Using this type of element, the weld profile is simulated as a
sharp notch. This method will produce more accurate and detailed stress
distribution near the intersection in comparison with a simple shell analysis. In the
present study, ANSYS element type SOLID95 is used to model the chord, brace
and weld profile. These elements have compatible displacements and are well suited
to model curved boundaries. The element is defined by 20 nodes having three
degrees of freedom per node. The element may have any spatial orientation.
A sub-zone mesh generation method is used during the FE modelling, in order
to guarantee the mesh quality. In this method, the entire structure is divided into
several different zones according to the computational requirements. The mesh of
each zone is generated separately and then the mesh of entire structure is obtained
by merging the meshes of all the sub-zones. This method can easily control the
mesh quantity and quality and avoid badly distorted elements. The mesh
generated by this method for a multi-planar right-angle tubular DKT-joint is
shown in Fig. 3. It should be noted that in this study, the welding size along the
brace-chord intersection satisfies the AWS specifications [18]. Modelling of the
weld profile according to AWS [18] is extensively discussed in Lotfollahi-Yaghin
and Ahmadi [9]. The models are meshed in such a way that leads to a
compromise between the accuracy of results and the computer analysing time,
software generated file volume, etc. To verify the convergence of FE analysis,
converging test is done and the meshes with different densities are used in this
test, before generating the 81 models.
3.3. Boundary conditions
As shown in Fig. 3, due to the symmetry in geometry of the connection and either
symmetry or antisymmetry in loading conditions (Fig. 4), only one fourth of the
entire multi-planar right-angle DKT-joint and equivalent uni-planar KT-
connection are modelled. The chord end fixity conditions of tubular joints in
offshore structures may range from “almost fixed” to “almost pinned” with
generally being closer to “almost fixed” [2]. In practice, value of α in over 60% of
(1)

Parametric Study of Outer-Brace SCFS in Right-Angle Two-Planar Tubular . . . . 389
Journal of Engineering Science and Technology March 2015, Vol. 10(3)
tubular joints is in excess of 20 and is bigger than 40 in 35% of the joints [19].
According to Morgan and Lee [20], changing the end restraint from fixed to
pinned results in a maximum increase of 15% in the SCF at crown for α = 6
joints, and this increase reduces to only 8% for α = 8. In view of the fact that the
effect of chord end restraints is only significant for joints with α < 8 for high β
and γ values, which do not commonly occur in practice, both chord ends are
assumed to be fixed, with the corresponding nodes restrained. Efthymiou [2]
showed that sufficiently long chord greater than six chord diameters (i.e., α ≥ 12)
must be used to ensure that the stresses at the brace-chord intersection are not
affected by the end condition. Hence in this study, a realistic value of α = 16 was
assigned for all the models. The effect of brace length on SCF has been studied by
Chang and Dover [5]. It was concluded that there is no effect when the ratio αB is
greater than the critical value. In the present study, in order to avoid the effect of
short brace length, a realistic value of αB = 8 is selected for all joints.
Fig. 3. Generated mesh and the view along the chord’s longitudinal axis.
Fig. 4. Studied loading conditions.
(b) Multi-planar DKT-joint (a) Uni-planar KT-joint

390 H. Ahmadi et al.
Journal of Engineering Science and Technology March 2015, Vol. 10(3)
3.4. Loading conditions, analysis, and SCF extraction
Two different axial loading conditions are considered in the present research to
study the SCFs in multi-planar DKT-joints. As shown in Fig. 4, in the 1st loading
condition, all three braces located on the 0° plane are subjected to compressive
loads while the ones on the 90° plane are under tensile loading. In the 2nd loading
condition, tensile loads are applied to all six braces. Equivalent uni-planar KT-
joints are subjected to tensile axial loads exerted on the central and outer braces.
Static numerical calculations of the linear elastic type are appropriate to
determine the SCFs in tubular joints [21]. This type of analysis is used in the
present study. The Young’s modulus and Poisson’s ratio are taken to be 207 GPa
and 0.3, respectively. The widely accepted conventional approach for fatigue
strength assessment of tubular joints is to use the geometric stresses at the weld
toe. According to IIW-XV-E [22], the peak stress is calculated from extrapolating
the geometrical stresses at the two points in a linear way to the weld toe position.
The minimum and maximum distances from the extrapolation region to the weld
toe for chord member are 0.4T and 1.4T respectively; where T is the thickness of
chord member. Therefore, the value of peak stress can be calculated as follows:
σ weld toe = 1.4σ1 – 0.4σ2 (2)
where σ1 and σ2 are the von Mises stresses measured at the distance of 0.4T and
1.4T from the weld toe, respectively.
3.5. Verification of the finite element model
The accuracy of the FEA predictions should be verified against the experimental
test results. As far as the authors are aware, there is no experimental database of
SCFs for steel uni-planar and multi-planar tubular KT-joints currently available in
the literature. In order to validate the finite element model, several related
geometries including T-, Y- and K-joints are modelled and the FE results are
validated against the LR equations [3] and test results published in HSE OTH 354
report [3]. The method of modelling the chord, the vertical brace, the inclined
brace and the weld profile, and also the mesh generation procedure (including the
selection of the element type) and the analysis method are identical for the
validating models and the considered uni-planar and multi-planar KT-joints.
Hence, the conclusion of the verification of the T-, Y- and K-joints with the
experimental test results can be used to validate the generated uni-planar and
multi-planar KT-joint models [9, 15].
Verification results which are separately presented at saddle and crown
positions are summarised in Table 1. In this table, e1 denotes the percentage of
relative difference between the predictions of LR equations and test results, and e2
denotes the percentage of relative difference between the results of FE model and
experimental results. Hence, |e1|–|e2| indicates the difference between the accuracy
of LR equations and FE model. Positive sign for value of |e1|–|e2| means that the
FE model presented in this study is more accurate for predicting the values of
SCF in comparison with LR equations. It can be concluded from the comparison
of the FE results with experimental data and the values predicted by LR equations
that the finite element model is considered to be adequate to produce valid results.

Parametric Study of Outer-Brace SCFS in Right-Angle Two-Planar Tubular . . . . 391
Journal of Engineering Science and Technology March 2015, Vol. 10(3)
Table 1. Verification of the FEA results using
the experimental data and predictions of LR equations.
(1) Project reference: JISSP, (2) Source: HSE OTH 354 [3], (3) e1 = (Test − LR Eqs.) / Test;
e2 = (Test − FE) / Test, (4) ζ = 0.15
4. Results of Numerical Parametric Study
This section presents the results of numerical parametric study carried out to
investigate the effect of non-dimensional geometrical parameters including β, γ, τ,
and θ on the stress concentrations at the inner saddle, outer saddle, crown toe, and
crown heel positions on the outer brace of the 2-planar right-angle DKT-joints.
4.1. Effect of brace-to-chord diameter ratio (β) on the SCFs
The parameter β is the ratio of brace diameter to chord diameter. Hence, increase
of the β in the models having constant value of chord diameter leads to increase
of brace diameter. This sub-section presents the results of investigating the effect
of β on the SCFs. In this study, the influence of the parameters τ and γ over the
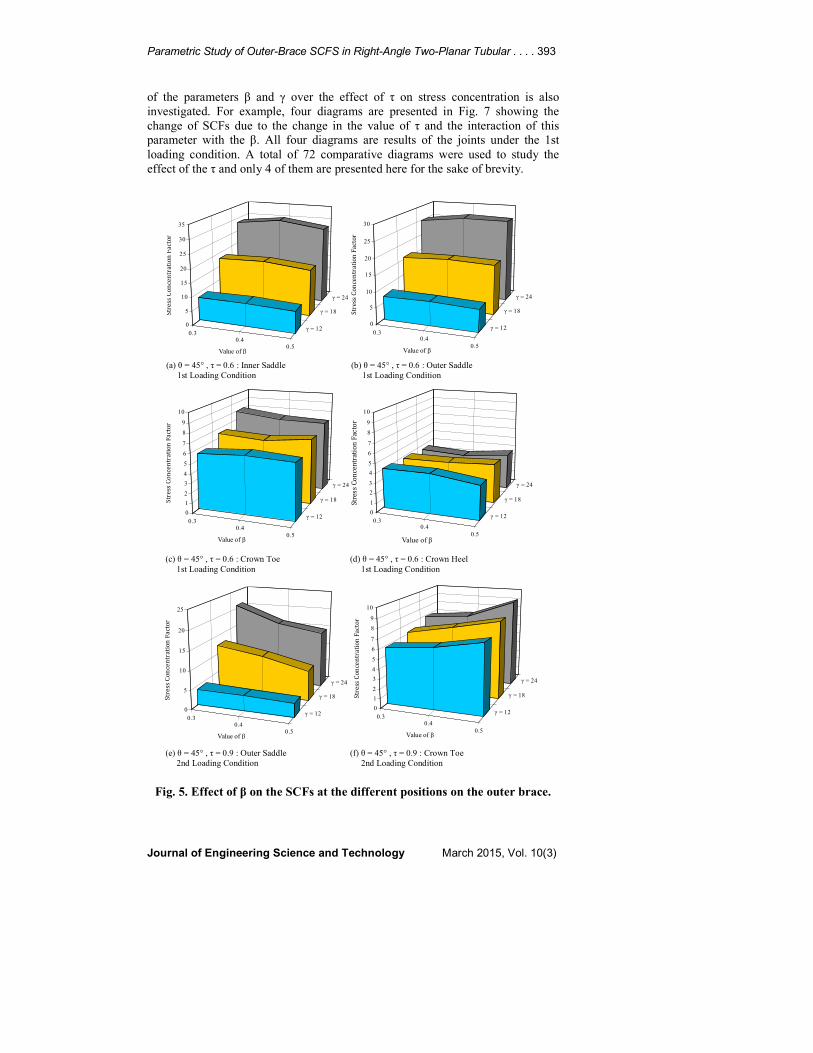
effect of β on stress concentration is also investigated. For example, six diagrams
are presented in Fig. 5 showing the change of SCFs due to the change in the value
of β and the interaction of this parameter with the γ. Corresponding geometrical
parameters, the position for the extraction of SCF, and the considered loading
condition are given in the legend of each diagram. A total of 72 comparative
diagrams were used to study the effect of the β and only 6 of them are presented
here for the sake of brevity.
The general remarks which are concluded through investigating the effect of β
on the stress concentration can be summarised as follows:
a. Under the 1st loading condition, for small values of the γ and τ (say γ = 12 and
τ = 0.3), increasing the β from 0.3 to 0.5 leads to decrease of SCFs at both inner
and outer saddle positions in the joints with small values of θ (say θ = 30°).
However, such increase in the β results in the increase of SCFs at these
positions in the joints having big θ values (say θ = 60°). For intermediate values
of θ (say θ = 45°), SCF change in these two positions due to the increase of the
β follows this pattern: SCFβ=0.4 > SCFβ=0.3; SCFβ=0.5 < SCFβ=0.4.
b. Under the 1st loading condition, in joints with intermediate and bigger values of γ
and τ (say γ = 18, 24; τ = 0.6, 0.9), the maximum SCF at inner saddle position
always occurs in joints having intermediate value of the β (say β = 0.4).
c. Under the 1st loading condition, the change of the SCFs at the crown toe and
crown heel positions due to the increase of the β does not follow a regular
Joint
Type
(1)
θ α τ γ β Position Test(2)
LR
Eqs.(2) FEA
e1(3)
(%)
e2(3)
(%)
|e1|-
|e2|
(%)
T 90 6.2 0.99 20.3 0.8 Saddle 11.4 10.54 11.26 8 1 +7
Crown 5.4 3.92 4.6 27 15 +12
Y 45 6.2 1.05 20.3 0.8 Saddle 8.3 5.48 5.46 32 34 -2
Crown 4.7 3.5 4.7 25 0 +25
K (4) 45 12.6 1.0 20.3 0.5 Saddle 6.8 4.8 6.76 29.5 0.5 +29
Crown 4.6 4.56 4.8 1 -4 -3
392 H. Ahmadi et al.
Journal of Engineering Science and Technology March 2015, Vol. 10(3)
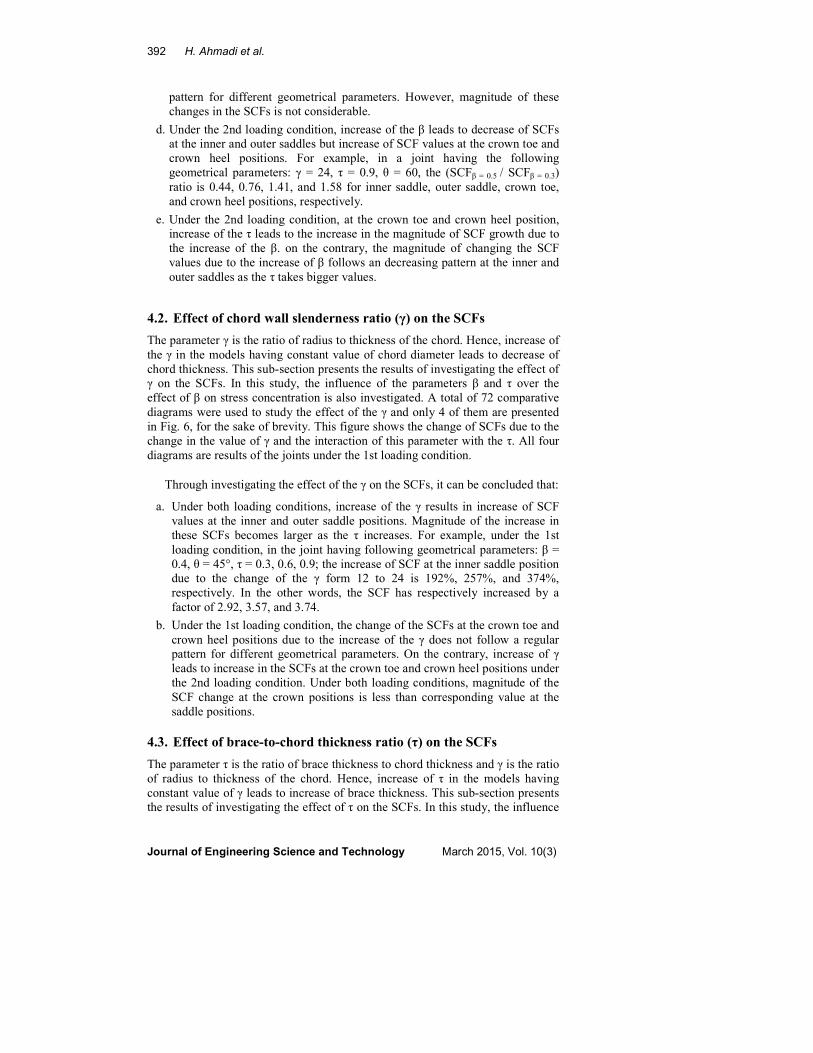
pattern for different geometrical parameters. However, magnitude of these
changes in the SCFs is not considerable.
d. Under the 2nd loading condition, increase of the β leads to decrease of SCFs
at the inner and outer saddles but increase of SCF values at the crown toe and
crown heel positions. For example, in a joint having the following
geometrical parameters: γ = 24, τ = 0.9, θ = 60, the (SCFβ = 0.5 / SCFβ = 0.3)
ratio is 0.44, 0.76, 1.41, and 1.58 for inner saddle, outer saddle, crown toe,
and crown heel positions, respectively.
e. Under the 2nd loading condition, at the crown toe and crown heel position,
increase of the τ leads to the increase in the magnitude of SCF growth due to
the increase of the β. on the contrary, the magnitude of changing the SCF
values due to the increase of β follows an decreasing pattern at the inner and
outer saddles as the τ takes bigger values.
4.2. Effect of chord wall slenderness ratio (γ) on the SCFs
The parameter γ is the ratio of radius to thickness of the chord. Hence, increase of
the γ in the models having constant value of chord diameter leads to decrease of
chord thickness. This sub-section presents the results of investigating the effect of
γ on the SCFs. In this study, the influence of the parameters β and τ over the
effect of β on stress concentration is also investigated. A total of 72 comparative
diagrams were used to study the effect of the γ and only 4 of them are presented
in Fig. 6, for the sake of brevity. This figure shows the change of SCFs due to the
change in the value of γ and the interaction of this parameter with the τ. All four
diagrams are results of the joints under the 1st loading condition.
Through investigating the effect of the γ on the SCFs, it can be concluded that:
a. Under both loading conditions, increase of the γ results in increase of SCF
values at the inner and outer saddle positions. Magnitude of the increase in
these SCFs becomes larger as the τ increases. For example, under the 1st
loading condition, in the joint having following geometrical parameters: β =
0.4, θ = 45°, τ = 0.3, 0.6, 0.9; the increase of SCF at the inner saddle position
due to the change of the γ form 12 to 24 is 192%, 257%, and 374%,
respectively. In the other words, the SCF has respectively increased by a
factor of 2.92, 3.57, and 3.74.
b. Under the 1st loading condition, the change of the SCFs at the crown toe and
crown heel positions due to the increase of the γ does not follow a regular
pattern for different geometrical parameters. On the contrary, increase of γ
leads to increase in the SCFs at the crown toe and crown heel positions under
the 2nd loading condition. Under both loading conditions, magnitude of the
SCF change at the crown positions is less than corresponding value at the
saddle positions.
4.3. Effect of brace-to-chord thickness ratio (τ) on the SCFs
The parameter τ is the ratio of brace thickness to chord thickness and γ is the ratio
of radius to thickness of the chord. Hence, increase of τ in the models having
constant value of γ leads to increase of brace thickness. This sub-section presents
the results of investigating the effect of τ on the SCFs. In this study, the influence
Parametric Study of Outer-Brace SCFS in Right-Angle Two-Planar Tubular . . . . 393
Journal of Engineering Science and Technology March 2015, Vol. 10(3)
of the parameters β and γ over the effect of τ on stress concentration is also
investigated. For example, four diagrams are presented in Fig. 7 showing the
change of SCFs due to the change in the value of τ and the interaction of this
parameter with the β. All four diagrams are results of the joints under the 1st
loading condition. A total of 72 comparative diagrams were used to study the
effect of the τ and only 4 of them are presented here for the sake of brevity.
Fig. 5. Effect of β on the SCFs at the different positions on the outer brace.
0.30.4
0.5
γ = 12
γ = 18
γ = 24
0
5
10
15
20
25
30
35
Str
ess C
on
ce
ntr
ati
on
Fa
cto
r
Value of β
0.30.4
0.5
γ = 12
γ = 18
γ = 24
0
5
10
15
20
25
30
Str
ess C
on
ce
ntr
ati
on
Fa
cto
rValue of β
(a) θ = 45° , τ = 0.6 : Inner Saddle
1st Loading Condition
(b) θ = 45° , τ = 0.6 : Outer Saddle
1st Loading Condition
0.30.4
0.5
γ = 12
γ = 18
γ = 24
0
1
2
3
4
5
6
7
8
9
10
Str
ess C
on
ce
ntr
ati
on
Fa
cto
r
Value of β
0.30.4
0.5
γ = 12
γ = 18
γ = 24
0
1
2
3
4
5
6
7
8
9
10
Str
es
s C
on
ce
ntr
ati
on
Fa
cto
r
Value of β
(c) θ = 45° , τ = 0.6 : Crown Toe
1st Loading Condition
(d) θ = 45° , τ = 0.6 : Crown Heel
1st Loading Condition
0.30.4
0.5
γ = 12
γ = 18
γ = 24
0
5
10
15
20
25
Str
ess C
on
ce
ntr
ati
on
Fa
cto
r
Value of β
0.30.4
0.5
γ = 12
γ = 18
γ = 24
0
1
2
3
4
5
6
7
8
9
10
Str
ess C
on
ce
ntr
ati
on
Fa
cto
r
Value of β
(e) θ = 45° , τ = 0.9 : Outer Saddle
2nd Loading Condition
(f) θ = 45° , τ = 0.9 : Crown Toe
2nd Loading Condition

394 H. Ahmadi et al.
Journal of Engineering Science and Technology March 2015, Vol. 10(3)
Fig. 6. Effect of γ on the SCFs at the different positions on the outer brace.
Main conclusions of investigating the effect of the τ on the SCF values are
summarised as follows:
a. Under both loading conditions, increase of the τ results in increase of SCF
values at all four considered positions: inner saddle, outer saddle, crown toe,
and crown heel.
b. At the inner and outer saddle positions, magnitude of SCF growth due to the
increase of the τ is larger under the 1st loading condition compared to the 2nd
one. For example, on the outer saddle of a joint having the following
geometrical parameters: β = 0.5, γ = 24, θ = 45°, the (SCFτ = 0.9 / SCFτ = 0.3)
ratio is 4.59 and 4.12 under the 1st and 2nd loading conditions, respectively.
c. The magnitude of increase in the SCF values due to the increase of the τ is
highly remarkable in comparison with the other geometrical parameters. For
example, as can be seen in Fig. 7, due to the change of the τ from 0.3 to 0.9 in a
joint with β = 0.3, the SCFs have increased by a factor of 2.48, 2.64, 4.34, and
4.63 at the crown heel, crown toe, inner saddle, and outer saddle positions,
respectively. It can also be seen that magnitude of the SCF changes at the crown
positions is less than corresponding values at the saddle positions.
1218
24
τ = 0.3
τ = 0.6
τ = 0.9
0
5
10
15
20
25
30
35
40
Str
ess C
on
ce
ntr
ati
on
Fa
cto
r
Value of γ
(a) θ = 45° , β = 0.4 : Inner Saddle (b) θ = 45° , β = 0.4 : Outer Saddle
(c) θ = 45° , β = 0.4 : Crown Toe (d) θ = 45° , β = 0.4 : Crown Heel
1218
24
τ = 0.3
τ = 0.6
τ = 0.9
0
5
10
15
20
25
30
35
40
45
Stre
ss
Co
nc
en
tra
tio
n F
acto
r
Value of γ
1218
24
τ = 0.3
τ = 0.6
τ = 0.9
0
2
4
6
8
10
12
Str
ess C
on
ce
ntr
ati
on
Fa
cto
r
Value of γ
1218
24
τ = 0.3
τ = 0.6
τ = 0.9
0
1
2
3
4
5
6
Str
ess
Co
nce
ntr
ati
on
Fa
cto
r
Value of γ

Parametric Study of Outer-Brace SCFS in Right-Angle Two-Planar Tubular . . . . 395
Journal of Engineering Science and Technology March 2015, Vol. 10(3)
Fig. 7. Effect of τ on the SCFs at the different positions on the outer brace.
4.4. Effect of outer brace inclination angle (θ) on the SCFs
This sub-section presents the results of studying the effect of outer brace
inclination angle θ on the SCFs at different positions and its interaction with the
other dimensionless geometrical parameters. A total of 72 comparative diagrams
were used to study the effect of the θ and only 4 of them are presented in Fig. 8
showing the change of SCFs due to the change in the value of θ and the
interaction of this parameter with the β. All four diagrams are results of the joints
under the 1st loading condition.
Through investigating the effect of the θ on the SCFs, it can be concluded that:
a. Under both loading conditions, increase of the θ from 30° to 60° leads to
increase of SCF values at inner and outer saddle positions.
b. Under the 1st loading condition, the change of the SCFs at the crown toe
and crown heel positions due to the increase of the θ does not follow a
regular pattern for different geometrical parameters. On the contrary, under
the 2nd loading condition, increase of the θ always results in increase of
SCF value at the crown toe and crown heel positions.
c. Under both loading conditions, magnitude of effect of different geometrical
parameters on the SCFs follows the below order:
Effect of τ > Effect of γ > Effect of θ > Effect of β
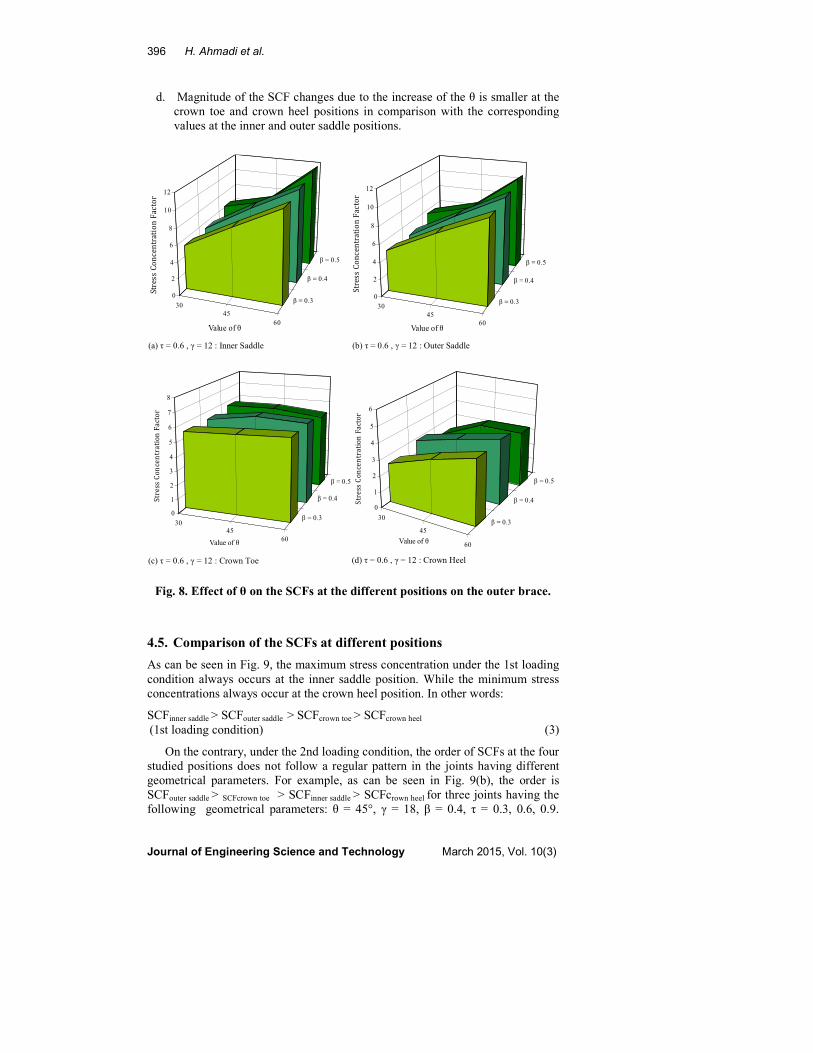
(c) θ = 30° , γ = 18 : Crown Toe (d) θ = 30° , γ = 18 : Crown Heel
(a) θ = 30° , γ = 18 : Inner Saddle (b) θ = 30° , γ = 18 : Outer Saddle
0.3
0.6
0.9
β = 0.3
β = 0.4
β = 0.5
0
2
4
6
8
10
12
14
16
18
Str
es
s C
on
ce
ntr
ati
on
Fa
cto
r
Value of τ
0.3
0.6
0.9
β = 0.3
β = 0.4
β = 0.50
2
4
6
8
10
12
14
16
Str
es
s C
on
ce
ntr
ati
on
Fa
cto
r
Value of τ
0.3
0.6
0.9β = 0.3
β = 0.4
β = 0.5
0
2
4
6
8
10
12
Str
ess C
on
ce
ntra
tio
n F
acto
r
Value of τ
0.3
0.6
0.9
β = 0.3
β = 0.4
β = 0.5
0
1
2
3
4
5
6
Str
es
s C
on
ce
ntr
ati
on
Fa
cto
r
Value of τ
396 H. Ahmadi et al.
Journal of Engineering Science and Technology March 2015, Vol. 10(3)
d. Magnitude of the SCF changes due to the increase of the θ is smaller at the
crown toe and crown heel positions in comparison with the corresponding
values at the inner and outer saddle positions.
Fig. 8. Effect of θ on the SCFs at the different positions on the outer brace.
4.5. Comparison of the SCFs at different positions
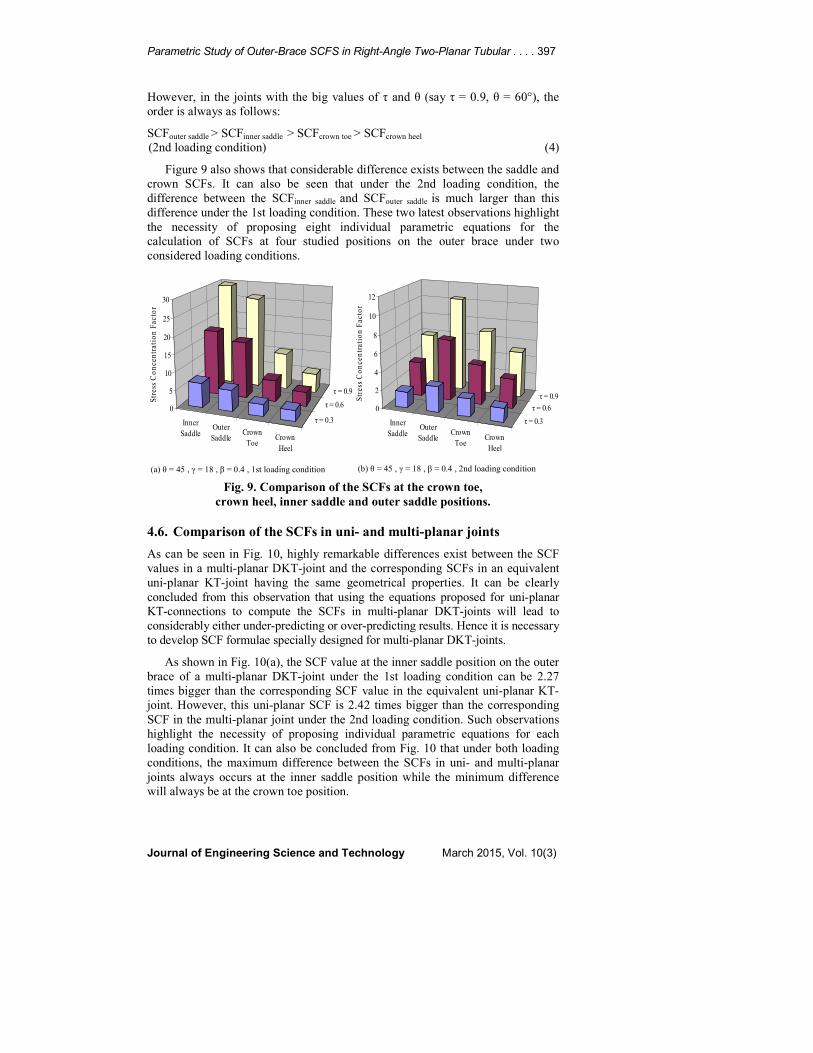
As can be seen in Fig. 9, the maximum stress concentration under the 1st loading
condition always occurs at the inner saddle position. While the minimum stress
concentrations always occur at the crown heel position. In other words:
SCFinner saddle > SCFouter saddle > SCFcrown toe > SCFcrown heel
(1st loading condition) (3)
On the contrary, under the 2nd loading condition, the order of SCFs at the four
studied positions does not follow a regular pattern in the joints having different
geometrical parameters. For example, as can be seen in Fig. 9(b), the order is
SCFouter saddle > SCFcrown toe > SCFinner saddle > SCFcrown heel for three joints having the
following geometrical parameters: θ = 45°, γ = 18, β = 0.4, τ = 0.3, 0.6, 0.9.
30
45
60
β = 0.3
β = 0.4
β = 0.5
0
2
4
6
8
10
12
Str
es
s C
on
ce
ntr
ati
on
Fa
cto
r
Value of θ
30
45
60
β = 0.3
β = 0.4
β = 0.5
0
2
4
6
8
10
12
Str
es
s C
on
ce
ntr
ati
on
Fa
cto
r
Value of θ
(c) τ = 0.6 , γ = 12 : Crown Toe (d) τ = 0.6 , γ = 12 : Crown Heel
(a) τ = 0.6 , γ = 12 : Inner Saddle (b) τ = 0.6 , γ = 12 : Outer Saddle
3045
60
β = 0.3
β = 0.4
β = 0.5
0
1
2
3
4
5
6
7
8
Stre
ss
Co
nce
ntr
ati
on
Fa
cto
r
Value of θ
30
45
60
β = 0.3
β = 0.4
β = 0.5
0
1
2
3
4
5
6
Str
ess C
on
ce
ntr
ati
on
Fa
cto
r
Value of θ
Parametric Study of Outer-Brace SCFS in Right-Angle Two-Planar Tubular . . . . 397
Journal of Engineering Science and Technology March 2015, Vol. 10(3)
However, in the joints with the big values of τ and θ (say τ = 0.9, θ = 60°), the
order is always as follows:
SCFouter saddle > SCFinner saddle > SCFcrown toe > SCFcrown heel
(2nd loading condition) (4)
Figure 9 also shows that considerable difference exists between the saddle and
crown SCFs. It can also be seen that under the 2nd loading condition, the
difference between the SCFinner saddle and SCFouter saddle is much larger than this
difference under the 1st loading condition. These two latest observations highlight
the necessity of proposing eight individual parametric equations for the
calculation of SCFs at four studied positions on the outer brace under two
considered loading conditions.
Fig. 9. Comparison of the SCFs at the crown toe,
crown heel, inner saddle and outer saddle positions.
4.6. Comparison of the SCFs in uni- and multi-planar joints
As can be seen in Fig. 10, highly remarkable differences exist between the SCF
values in a multi-planar DKT-joint and the corresponding SCFs in an equivalent
uni-planar KT-joint having the same geometrical properties. It can be clearly
concluded from this observation that using the equations proposed for uni-planar
KT-connections to compute the SCFs in multi-planar DKT-joints will lead to
considerably either under-predicting or over-predicting results. Hence it is necessary
to develop SCF formulae specially designed for multi-planar DKT-joints.
As shown in Fig. 10(a), the SCF value at the inner saddle position on the outer
brace of a multi-planar DKT-joint under the 1st loading condition can be 2.27
times bigger than the corresponding SCF value in the equivalent uni-planar KT-
joint. However, this uni-planar SCF is 2.42 times bigger than the corresponding
SCF in the multi-planar joint under the 2nd loading condition. Such observations
highlight the necessity of proposing individual parametric equations for each
loading condition. It can also be concluded from Fig. 10 that under both loading
conditions, the maximum difference between the SCFs in uni- and multi-planar
joints always occurs at the inner saddle position while the minimum difference
will always be at the crown toe position.
Inner
SaddleOuter
SaddleCrown
ToeCrown
Heel
τ = 0.3
τ = 0.6
τ = 0.9
0
5
10
15
20
25
30
Str
ess
Co
nc
en
tra
tio
n F
ac
tor
Inner
SaddleOuter
SaddleCrown
ToeCrown
Heel
τ = 0.3
τ = 0.6
τ = 0.9
0
2
4
6
8
10
12
Str
ess
Co
nc
en
tra
tio
n F
ac
tor
(a) θ = 45 , γ = 18 , β = 0.4 , 1st loading condition (b) θ = 45 , γ = 18 , β = 0.4 , 2nd loading condition

398 H. Ahmadi et al.
Journal of Engineering Science and Technology March 2015, Vol. 10(3)
Fig. 10. Comparison of the SCFs in uni- and multi-planar joints.
5. Development of Parametric Equations for the Outer Brace
Although the FEM has been successfully utilised to analyse the tubular joints, the
extensive use of such a numerical method is not feasible in a normal day-to-day
design office operation. Instead, parametric design equations expressed in the
form of the non-dimensional geometrical parameters are useful and desirable for
fatigue design. In the present study, eight individual parametric equations are
proposed for the calculation of the SCFs at the inner saddle, outer saddle, crown
toe, and crown heel positions on the outer brace of a right-angle 2-planar DKT-
joint subjected to two considered axial loading conditions.
5.1. Nonlinear regression analysis
The parametric equations are derived based on multiple nonlinear regression
analyses performed by the statistical software package, SPSS. Values of
dependent variable (i.e., SCF) and independent variables (β, γ, τ, and θ) constitute
the input data which is imported as a matrix. Each row of this matrix involves the
information about the value of SCF at a certain position in a multi-planar tubular
DKT-joint having specific geometrical properties. The number of rows and
columns of input matrix for each equation are 81 (number of the joints) and 5
(number of variables), respectively. Hence the whole FEM SCF database is
arranged as eight 81×5 input matrices.
When the dependent (i.e., SCF) and independent (i.e., β, γ, τ, and θ) variables
are defined, a model expression must be built with defined parameters. The
parameters of the model expression are unknown coefficients and exponents. The
researcher must specify a starting value for each parameter, preferably as close as
possible to the expected final solution. Poor starting values can result in failure to
converge or in convergence on a solution that is local (rather than global) or is
physically impossible. Various model expressions must be built to derive a
parametric equation having a high coefficient of correlation.
After performing nonlinear analyses, the following parametric equations are
proposed for predicting the SCF values at the inner saddle, outer saddle, crown
(a) θ = 30 , τ = 0.6 , γ = 18 , β = 0.4 (b) θ = 45 , τ = 0.3 , γ = 18 , β = 0.4
0 1 2 3 4 5 6 7 8
Equivalent Uni-
Planar Joint
Multi-Planar Joint
(1st Loading
Condition)
Multi-Planar Joint
(2nd Loading
Condition)
Stress Concentration Factor
Inner Saddle Outer Saddle Crown Toe Crown Heel
0 2 4 6 8 10 12 14
Equivalent Uni-
Planar Joint
Multi-Planar Joint
(1st Loading
Condition)
Multi-Planar Joint
(2nd Loading
Condition)
Stress Concentration Factor
Inner Saddle Outer Saddle Crown Toe Crown Heel

Parametric Study of Outer-Brace SCFS in Right-Angle Two-Planar Tubular . . . . 399
Journal of Engineering Science and Technology March 2015, Vol. 10(3)
toe, and crown heel positions of the chord side on the outer brace of a right-angle
2-planar DKT-joint under two considered axial loading conditions:
Inner saddle:
SCF = 0.278 β0.038
γ1.734
τ1.179
θ1.228
(1st loading condition) R
2 = 0.988 (5)
SCF = 0.027 β-1.350
γ1.598
τ1.146
θ1.381
(2nd
loading condition) R2 = 0.970 (6)
Outer saddle:
SCF = 0.274 β0.155
γ1.745
τ1.203
θ1.251
(1st loading condition) R
2 = 0.989 (7)
SCF = 0.047 β-0.539 γ1.838 τ1.154 θ1.454 (2nd loading condition) R2 = 0.989 (8)
Crown toe:
SCF = 3.458 β0.003 γ0.395 τ1.026 θ-0.123 (1st loading condition) R2 = 0.944 (9)
SCF = 4.930 β0.528
γ0.336
τ0.980
θ0.247
(2nd
loading condition) R2 = 0.973 (10)
Crown heel:
SCF = 3.458 β0.003
γ0.395
τ1.026
θ-0.123
(1st loading condition) R
2 = 0.944 (11)
SCF = 2.108 β-0.114
γ0.327
τ0.790
θ0.185
(2nd
loading condition) R2 = 0.840 (12)
In the above equations, R2 denotes the coefficient of correlation and θ should
be inserted in radians.
5.2. Assessment according to UK DoE acceptance criteria [23]
The UK Department of Energy (UK DoE) [23] recommends the following
assessment criteria regarding the applicability of the commonly used SCF
parametric equations (P/R stands for the ratio of the predicted SCF from a given
equation to the recorded SCF from test or analysis):
• For a given dataset, if % SCFs under-predicting ≤ 25%, i.e., [%P/R < 1.0]
≤ 25%, and if % SCFs considerably under-predicting ≤ 5%, i.e., [%P/R <
0.8] ≤ 5%, then accept the equation. If, in addition, the percentage SCFs
considerably over-predicting ≤ 50%, i.e., [%P/R > 1.5] ≥ 50%, then the
equation is regarded as generally conservative.
• If the acceptance criteria is nearly met, i.e., 25% < [%P/R < 1.0] ≤ 30%,
and/or 5% < [%P/R < 0.8] ≤ 7.5%, then the equation is regarded as
borderline and engineering judgment must be used to determine acceptance
or rejection. Otherwise reject the equation as it is too optimistic.
In view of the fact that for a mean fit equation, there is always a large
percentage of under-prediction, the requirement for joint under-prediction, i.e.,
P/R < 1.0, can be completely removed in the assessment of parametric equations
[24]. Assessment results according to the UK DoE criteria are tabulated in Table
2. It can be seen that all the proposed equations except from Eqs. (6) and (11),
satisfy the criteria and consequently are accepted according to the UK DoE [23].
Equations (6) and (11) require revision to satisfy the criteria. SCFs obtained by
these equations are multiplied by individual coefficients in such a way that the
resulting SCF satisfies the UK DoE criteria. This idea can be expressed as follows:
Design Factor = SCFDesign / SCFEquation (13)

400 H. Ahmadi et al.
Journal of Engineering Science and Technology March 2015, Vol. 10(3)
where values of SCFEquation are calculated from the proposed equations and the
values of SCFDesign are expected to satisfy the UK DoE acceptance criteria.
Multiple comparative analyses were carried out to determine the optimum
values of design factors. The results showed that the optimum design factors are
1.32 and 1.03 for Eqs. (6) and (11), respectively. Hence, the following equations
should be used for design purposes:
SCFDesign = 0.035 β-1.350
γ1.598
τ1.146
θ1.381
(Inner saddle; 2nd
loading condition) (14)
SCFDesign = 3.562 β0.003 γ0.395 τ1.026 θ-0.123 (Crown heel; 1st loading condition) (15)
SCFDesign = 1.00 × SCFOther Eqs. (16)
Table 2. Results of equation assessment
according to UK DoE [23] acceptance criteria.
Respective
position
Load case Equation Conditions Overall
status %P/R < 0.8 %P/R > 1.5
Inner saddle
Outer saddle
1st loading
condition
Eq. (5) 3.7 % < 5 %
OK.
0 % < 50 %
OK.
accepted
2nd loading
condition
Eq. (6) 17 % > 5 % 0 % < 50 %
OK.
requires
revision
1st loading
condition
Eq. (7) 3.7 % < 5 %
OK.
1.2 % < 50 %
OK.
accepted
2nd loading
condition
Eq. (8) 4.9 % < 5 %
OK.
0 % < 50 %
OK.
accepted
Crown toe
Crown heel
1st loading
condition
Eq. (9) 2.5 % < 5 %
OK.
0 % < 50 %
OK.
accepted
2nd loading condition
Eq. (10) 0 % < 5 % OK.
0 % < 50 % OK.
accepted
1st loading
condition
Eq. (11) 8.6 % > 5 % 0 % < 50 %
OK.
requires
revision
2nd loading condition
Eq. (12) 4.9 % < 5 % OK.
0 % < 50 % OK.
accepted
5.3. Verification using the experimental data
Table 3 presents the results of validating the proposed equations at the inner and
outer saddle positions under the 1st loading condition using the data from a
strain gauged acrylic model test. The source of the experimental data is the HSE
OTH 91 353 report prepared by Lloyd’s Register [16] in which a
comprehensive experimental database of SCFs for acrylic complex joints
including multi-planar and overlapped K- and KT-joints has been presented.
This report covers only the value of SCF at the chord inner and outer saddle
positions. As can be seen in Table 3, there is a good agreement between the
predictions of the proposed equations and the experimental measurements. It
must be noted that since the weld profile is not included in an acrylic specimen,
the SCFs obtained from the acrylic model tests are typically 5-10% bigger than
the realistic values in the steel tubular joints.

Parametric Study of Outer-Brace SCFS in Right-Angle Two-Planar Tubular . . . . 401
Journal of Engineering Science and Technology March 2015, Vol. 10(3)
Table 3. Results of validating the proposed equations
at the inner and outer saddle positions using the data from
a strain gauged acrylic model test.
(1) Source: HSE OTH 91 353 [16], (2) Difference = (Experimental SCF / SCF predicted by proposed Equation) – 1.0
6. Conclusions
In the present paper, the results of parametric FE stress analyses were used to
present general remarks on the effect of geometrical parameters on the SCF
values at the inner saddle, outer saddle, crown toe, and crown heel positions on
the outer brace of the two-planar tubular DKT-joints under two different axial
load cases. Thereafter based on the results of FE models and using the nonlinear
regression analysis, a new set of SCF design equations was established for the
fatigue design of multi-planar DKT-joints under axial loads. The detailed and
quantitative results of parametric study which were extensively discussed in the
text are not repeated here for the sake of brevity.
Highly remarkable differences exist between the SCF values in a multi-planar
DKT-joint and the corresponding SCFs in an equivalent uni-planar KT-joint
having the same geometrical properties. It can be clearly concluded from this
observation that using the equations proposed for uni-planar KT-connections to
compute the SCFs in multi-planar DKT-joints will lead to considerably either
under-predicting or over-predicting results. Hence it is necessary to develop SCF
formulae specially designed for multi-planar DKT-joints. Good results of
equation assessment according to UK DoE acceptance criteria, high values of
correlation coefficients, and the good agreement between the predictions of
proposed equations and the experimental data guaranty the accuracy of the
equations. Hence, the developed equations can reliably be used for fatigue design
of offshore structures.
References
1. Efthymiou, M.; and Durkin, S. (1985). Stress concentrations in T/Y and
gap/overlap K-joints. Proceedings of the Conference on the Behaviour of
Offshore Structures, 429-40.
2. Efthymiou, M. (1988). Development of SCF formulae and generalized
influence functions for use in fatigue analysis. OTJ 88, Surrey, UK.
3. Health and Safety Executive (UK). (1997) OTH 354: Stress concentration
factors for simple tubular joints- assessment of existing and development of
new parametric formulae. London: Health and Safety Executive (Prepared by
Lloyd’s Register of Shipping).
4. Gao, F.; Shao, Y.B.; and Gho, W.M. (2007). Stress and strain concentration
factors of completely overlapped tubular joints under lap brace IPB load.
Journal of Constructional Steel Research, 63(3), 305-316.
Geometrical parameters
SCF value at the inner saddle SCF value at the outer saddle
Experimental(1)
Eq. (5) Difference(2)
Experimental(1)
Eq. (7) Difference(2)
D = 150 mm,
θ = 45, τ = 0.6,
β = 0.5, γ = 12
9.64 8.19 17.7% 7.60 7.51 1.2%
402 H. Ahmadi et al.
Journal of Engineering Science and Technology March 2015, Vol. 10(3)
5. Chang, E.; and Dover, W.D. (1999). Parametric equations to predict stress
distributions along the intersection of tubular X and DT-joints. International
Journal of Fatigue, 21(6), 619-635.
6. Shao, Y.B. (2004). Proposed equations of stress concentration factor (SCF)
for gap tubular K-joints subjected to bending load. International Journal of
Space Structures, 19, 137-147.
7. Ahmadi, H.; and Lotfollahi-Yaghin, M.A. (2008). Geometrical effect on the
stress distribution along the weld toe for tubular KT-joints under balanced
axial loading. Proceeding of the 8th International Conference on Coasts,
Ports and Marine Structures, ICOPMAS.
8. Shao, Y.B.; Du, Z.F.; and Lie, S.T. (2009). Prediction of hot spot stress
distribution for tubular K-joints under basic loadings. Journal of
Constructional Steel Research, 65(10-11), 2011-2026.
9. Lotfollahi-Yaghin, M.A. and Ahmadi, H. (2010). Effect of geometrical
parameters on SCF distribution along the weld toe of tubular KT-joints under
balanced axial loads. International Journal of Fatigue, 32(4), 703-719.
10. Karamanos, S.A.; Romeijn, A.; and Wardenier, J. (1999). Stress concentrations
in multi-planar welded CHS XX-connections. Journal of Constructional Steel
Research, 50(3), 259-282.
11. Chiew, S.P.; Soh, C.K.; Fung, T.C.; and Soh, A.K. (1999). Numerical study
of multiplanar tubular DX-joints subject to axial loads. Computers &
Structures, 72(6), 746-761.
12. Chiew, S.P., Soh, C.K.; and Wu, N.W. (2000). General SCF design equations
for steel multiplanar tubular XX-joints. International Journal of Fatigue,
22(4), 283-293.
13. Wingerde, A.M.; Packer, J.A.; and Wardenier, J. (2001). Simplified SCF
formulae and graphs for CHS and RHS K- and KK-connections. Journal of
Constructional Steel Research, 57(3), 221-252.
14. Karamanos, S.A.; Romeijn, A.; and Wardenier, J. (2002). SCF equations in
multi-planar welded tubular DT-joints including bending effects. Marine
Structures, 15(2), 157-173.
15. Woghiren, C.O.; and Brennan, F.P. (2009). Weld toe stress concentrations in
multi planar stiffened tubular KK Joints. International Journal of Fatigue,
31(1), 164-172.
16. Health and Safety Executive (UK). (1992). OTH 91 353: Stress concentration
factors for tubular complex joints. London: Health and Safety Executive
(Prepared by Lloyd’s Register of Shipping).
17. Swanson Analysis Systems Inc. (2007). ANSYS user’s manual. US.
18. American Welding Society (AWS) (2002). Structural welding code. AWS D
1.1:2002. American Welding Society Inc, Miami.
19. Smedley, P.; and Fisher, P. (1991). Stress concentration factors for simple
tubular joints. Proceedings of the First International Offshore and Polar
Engineering Conference (ISOPE 91).
20. Morgan, M.R.; and Lee, M.M.K. (1997). Prediction of stress concentrations
and degrees of bending in axially loaded tubular K-joints. Journal of
Constructional Steel Research, 45(1), 67-97.
Parametric Study of Outer-Brace SCFS in Right-Angle Two-Planar Tubular . . . . 403
Journal of Engineering Science and Technology March 2015, Vol. 10(3)
21. N’Diaye, A.; Hariri, S.; Pluvinage, G.; and Azari, Z. (2007). Stress con-
centration factor analysis for notched welded tubular T-joints. International
Journal of Fatigue, 29(8), 1554-1570.
22. IIW-XV-E. (1999). Recommended fatigue design procedure for welded
hollow section joints. IIW Docs., XV-1035-99/XIII-1804-99, International
Institute of Welding, Paris.
23. UK Department of Energy. (1983). Background notes to the fatigue guidance
of offshore tubular joints. HMSO, London.
24. Bomel Consulting Engineers. (1994). Assessment of SCF equations using
Shell/KSEPL finite element data. C5970R02.01 REV C.
Related Documents