1 KEY DETERMINANTS FOR BOOSTING INVESTMENT: THE GREEK CASE Panagiotis Barkas 1 DPhil Candidate in Economics University of Athens Mauro Pisu Senior Economist / Head of Greece and Italy Desk OECD Economics Department Abstract Aggregate investment has declined markedly since the start of the global financial crisis. Reviving investment and improving its quality is crucial to supporting the nascent recovery and raising living standards. This will hinge primarily on improving the business environment, by lowering product market regulations and enhancing the regulatory quality, so as to strengthen investment incentives, attract more FDI, and raise Greece’s integration into global value chains. Other key policies involve further streamlining insolvency procedures, building an innovation system, overcoming problems in the banking sector and enhancing the quality of public investment through long term planning. 1.1 The collapse in investment during the crisis has reduced Greece’s stock of productive capital. The fall in the productive capital stock is one of the main factors, along with total factor productivity (TFP), behind the falling potential output growth. Potential GDP growth rate started declining in the early 2000s, due to diminishing TFP and employment growth (Figure 1.1, Panel A). The collapse of investment in the wake of the crisis has been such that the productive stock capital is now shrinking as the deprecation rate exceeds the investment rate, dragging down potential GDP growth. Weak capital accumulation is also holding back labour productivity growth, hurting living standards (Figure 1.1, Panel B). 1 The principal author worked on this paper as part of his doctoral research and as a consultant for the OECD Economics Directorate. The study was published by the OECD as part of the 2018 OECD Economic Survey of Greece. Any mistakes are sole responsibility of the author. The full report may be accessed here.

Welcome message from author
This document is posted to help you gain knowledge. Please leave a comment to let me know what you think about it! Share it to your friends and learn new things together.
Transcript
1
KEY DETERMINANTS FOR BOOSTING INVESTMENT: THE GREEK CASE
Panagiotis Barkas1
DPhil Candidate in Economics
University of Athens
Mauro Pisu
Senior Economist / Head of Greece and Italy Desk
OECD Economics Department
Abstract
Aggregate investment has declined markedly since the start of the global financial crisis.
Reviving investment and improving its quality is crucial to supporting the nascent recovery and
raising living standards. This will hinge primarily on improving the business environment, by
lowering product market regulations and enhancing the regulatory quality, so as to strengthen
investment incentives, attract more FDI, and raise Greece’s integration into global value chains.
Other key policies involve further streamlining insolvency procedures, building an innovation
system, overcoming problems in the banking sector and enhancing the quality of public
investment through long term planning.
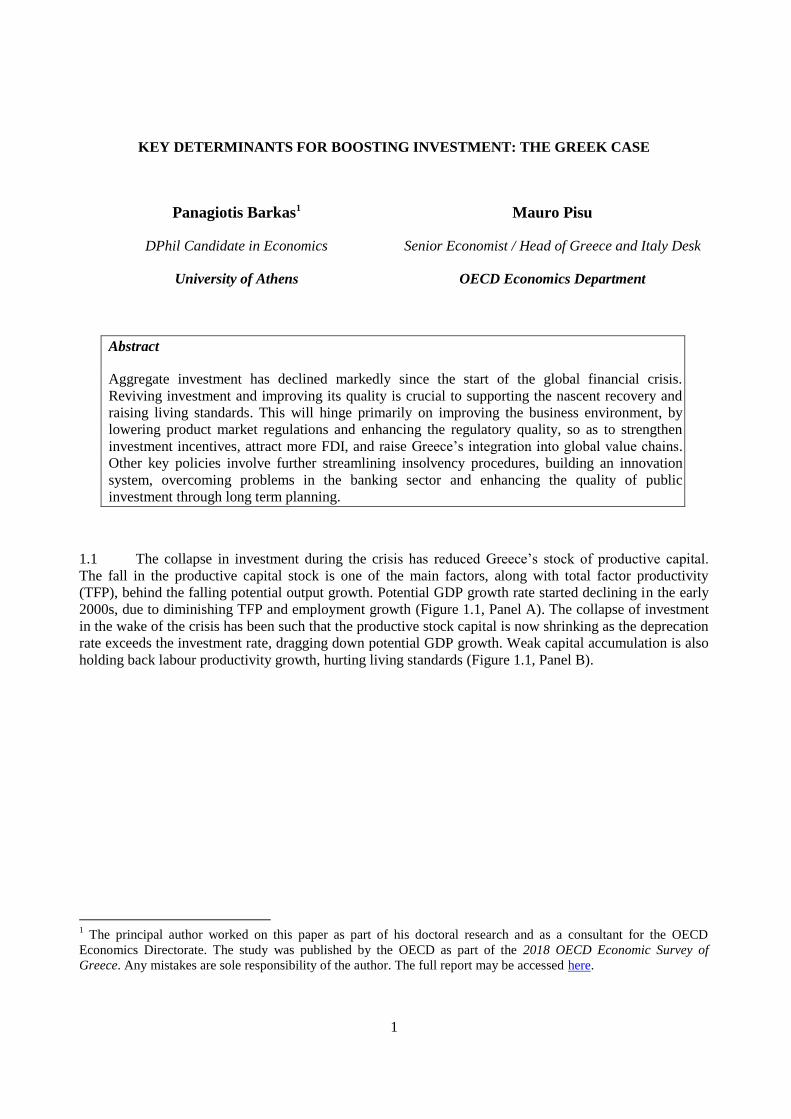
1.1 The collapse in investment during the crisis has reduced Greece’s stock of productive capital.
The fall in the productive capital stock is one of the main factors, along with total factor productivity
(TFP), behind the falling potential output growth. Potential GDP growth rate started declining in the early
2000s, due to diminishing TFP and employment growth (Figure 1.1, Panel A). The collapse of investment
in the wake of the crisis has been such that the productive stock capital is now shrinking as the deprecation
rate exceeds the investment rate, dragging down potential GDP growth. Weak capital accumulation is also
holding back labour productivity growth, hurting living standards (Figure 1.1, Panel B).
1 The principal author worked on this paper as part of his doctoral research and as a consultant for the OECD
Economics Directorate. The study was published by the OECD as part of the 2018 OECD Economic Survey of
Greece. Any mistakes are sole responsibility of the author. The full report may be accessed here.
2
Figure 1.1 Low investment is dragging down potential output and labour productivity growth
Source: OECD (2017), OECD Economic Outlook: Statistics and Projections (database).
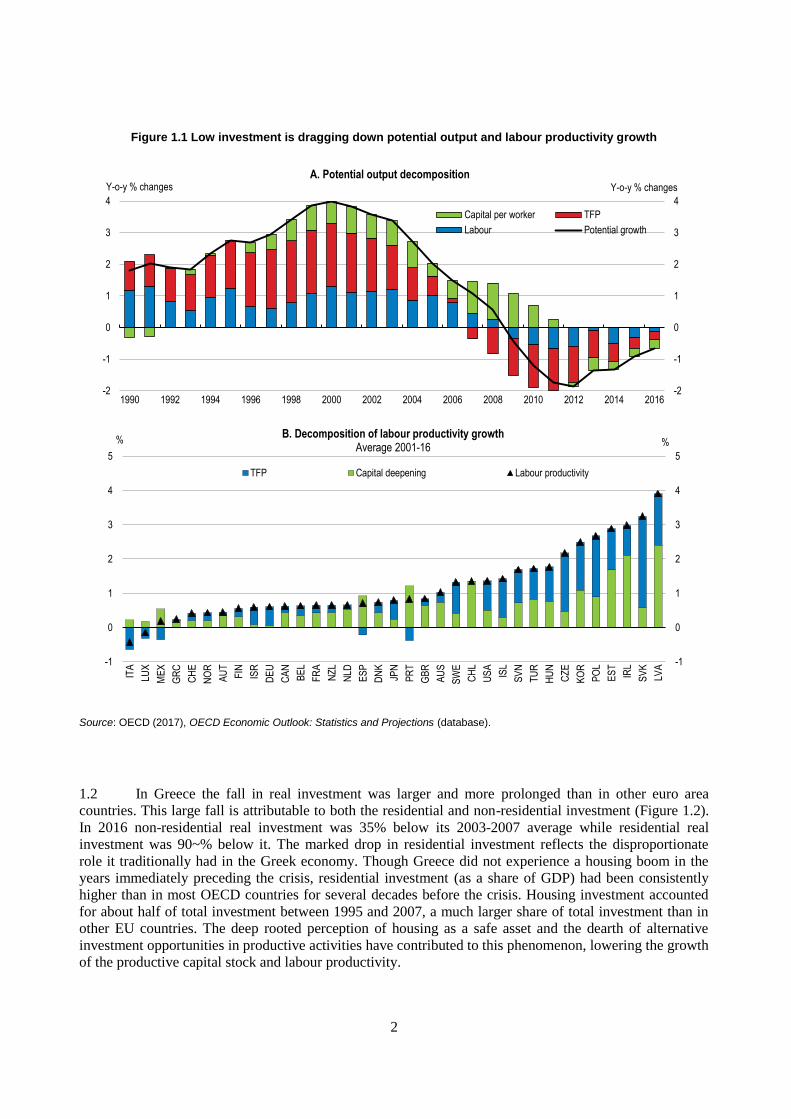
1.2 In Greece the fall in real investment was larger and more prolonged than in other euro area
countries. This large fall is attributable to both the residential and non-residential investment (Figure 1.2).
In 2016 non-residential real investment was 35% below its 2003-2007 average while residential real
investment was 90~% below it. The marked drop in residential investment reflects the disproportionate
role it traditionally had in the Greek economy. Though Greece did not experience a housing boom in the
years immediately preceding the crisis, residential investment (as a share of GDP) had been consistently
higher than in most OECD countries for several decades before the crisis. Housing investment accounted
for about half of total investment between 1995 and 2007, a much larger share of total investment than in
other EU countries. The deep rooted perception of housing as a safe asset and the dearth of alternative
investment opportunities in productive activities have contributed to this phenomenon, lowering the growth
of the productive capital stock and labour productivity.
-2
-1
0
1
2
3
4
-2
-1
0
1
2
3
4
1990 1992 1994 1996 1998 2000 2002 2004 2006 2008 2010 2012 2014 2016
Y-o-y % changesY-o-y % changesA. Potential output decomposition
Capital per worker TFP
Labour Potential growth
-1
0
1
2
3
4
5
-1
0
1
2
3
4
5
ITA
LUX
ME
X
GR
C
CH
E
NO
R
AU
T
FIN
ISR
DE
U
CA
N
BE
L
FR
A
NZ
L
NLD
ES
P
DN
K
JPN
PR
T
GB
R
AU
S
SW
E
CH
L
US
A
ISL
SV
N
TU
R
HU
N
CZ
E
KO
R
PO
L
ES
T
IRL
SV
K
LVA
%%B. Decomposition of labour productivity growth
Average 2001-16
TFP Capital deepening Labour productivity
3
Figure 1.2 Investment dropped more than elsewhere
1. Real gross fixed capital formation.
2. Includes Euro area countries which are OECD members.
Source: OECD (2017), OECD Economic Outlook: Statistics and Projections (database).
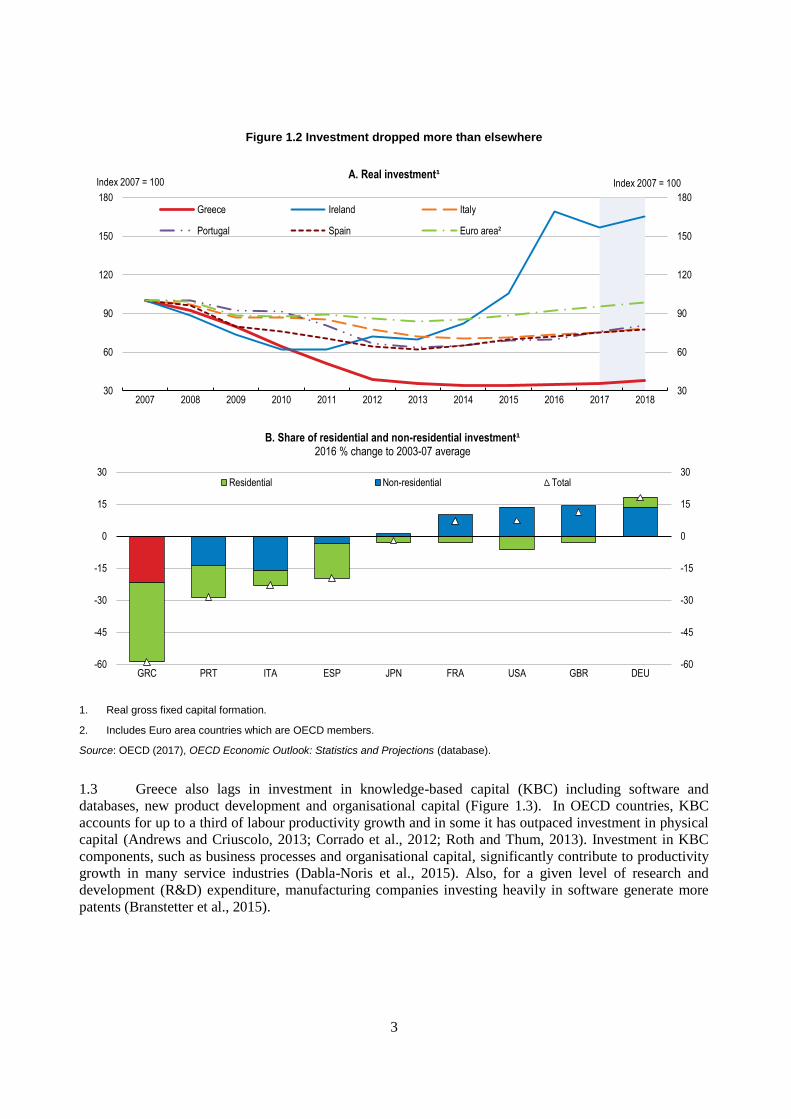
1.3 Greece also lags in investment in knowledge-based capital (KBC) including software and
databases, new product development and organisational capital (Figure 1.3). In OECD countries, KBC
accounts for up to a third of labour productivity growth and in some it has outpaced investment in physical
capital (Andrews and Criuscolo, 2013; Corrado et al., 2012; Roth and Thum, 2013). Investment in KBC
components, such as business processes and organisational capital, significantly contribute to productivity
growth in many service industries (Dabla-Noris et al., 2015). Also, for a given level of research and
development (R&D) expenditure, manufacturing companies investing heavily in software generate more
patents (Branstetter et al., 2015).
30
60
90
120
150
180
30
60
90
120
150
180
2007 2008 2009 2010 2011 2012 2013 2014 2015 2016 2017 2018
A. Real investment¹
Greece Ireland Italy
Portugal Spain Euro area²
Index 2007 = 100 Index 2007 = 100
-60
-45
-30
-15
0
15
30
-60
-45
-30
-15
0
15
30
GRC PRT ITA ESP JPN FRA USA GBR DEU
B. Share of residential and non-residential investment¹2016 % change to 2003-07 average
Residential Non-residential Total
4
Figure 1.3 Business investment in fixed and knowledge-based capital (KBC) is low
% of business sectors' gross valued added, 2013
Note: KBC comprises computerised information, like software and databases; innovative property, including research and development (R&D) and new product development in financial services (among other things); and economic competencies, including firms’ human and structural resources such as firm-specific training, brand equity, and organisational capital.
Source: OECD (2015), OECD Science, Technology and Industry Scoreboard 2015: Innovation for growth and society.
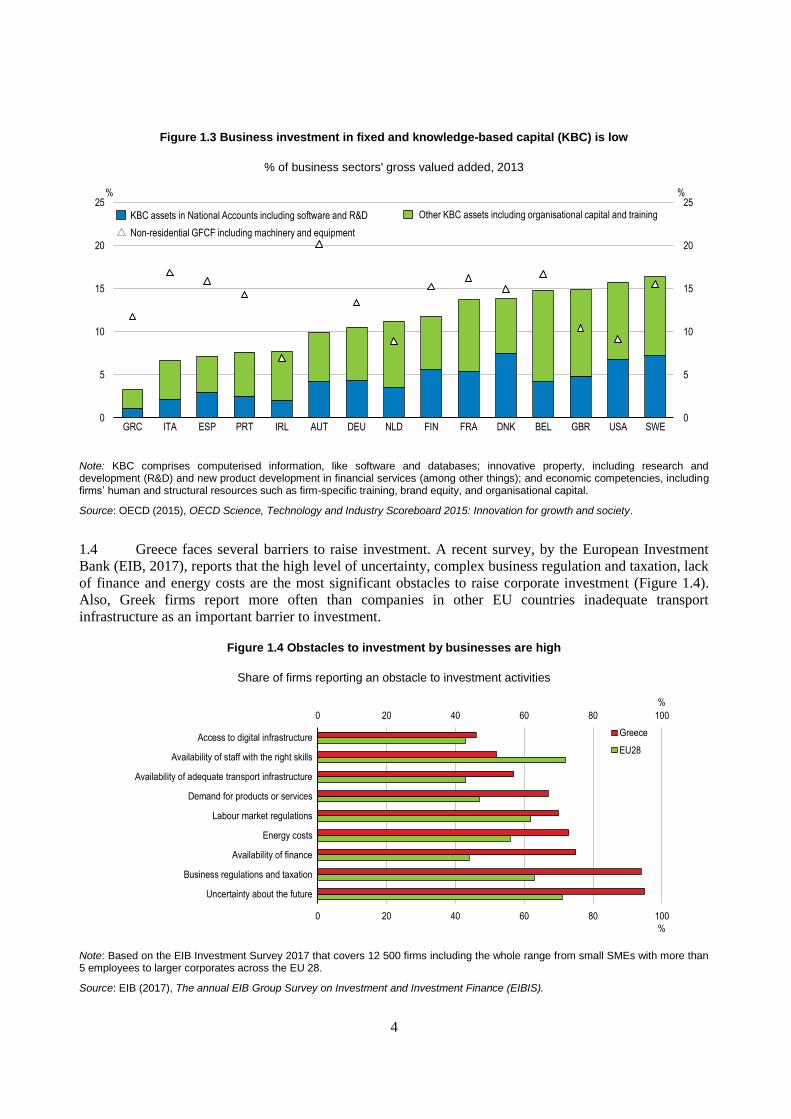
1.4 Greece faces several barriers to raise investment. A recent survey, by the European Investment
Bank (EIB, 2017), reports that the high level of uncertainty, complex business regulation and taxation, lack
of finance and energy costs are the most significant obstacles to raise corporate investment (Figure 1.4).
Also, Greek firms report more often than companies in other EU countries inadequate transport
infrastructure as an important barrier to investment.
Figure 1.4 Obstacles to investment by businesses are high
Share of firms reporting an obstacle to investment activities
Note: Based on the EIB Investment Survey 2017 that covers 12 500 firms including the whole range from small SMEs with more than 5 employees to larger corporates across the EU 28.
Source: EIB (2017), The annual EIB Group Survey on Investment and Investment Finance (EIBIS).
0
5
10
15
20
25
0
5
10
15
20
25
GRC ITA ESP PRT IRL AUT DEU NLD FIN FRA DNK BEL GBR USA SWE
%%
KBC assets in National Accounts including software and R&D Other KBC assets including organisational capital and training
Non-residential GFCF including machinery and equipment
0 20 40 60 80 100
0 20 40 60 80 100
Uncertainty about the future
Business regulations and taxation
Availability of finance
Energy costs
Labour market regulations
Demand for products or services
Availability of adequate transport infrastructure
Availability of staff with the right skills
Access to digital infrastructure
%
%
Greece
EU28
5
1.5 Reviving investment will therefore require policy actions spanning different areas. This chapter
focuses on policies to lower product market regulation and improve regulatory quality – to enhance
competition, transparency and attract additional foreign direct investment; accelerating insolvency
procedures – to speed up the reorganisation of struggling but still viable firms and the liquidation of those
that are not viable any longer – boosting innovation and investment in KBC – to raise productivity and
switch to higher value added products; restarting lending to firms by overcoming problems in the banking
sector. Finally, this chapter focuses on ways to enhance public investment so as to improve the quality of
infrastructure.
Lowering product market regulation and enhancing regulatory quality
1.6 Encouraging competition by reducing regulatory barriers is key to strengthening incentives to
invest. Ample empirical evidence shows that market competition fosters investment and productivity
(Nickell, 1996; Blundell et al., 1999; Aghion et al., 2004). More competition also strengthens incentives to
innovate and adopt better management practices, and invest in information and communication
technologies (ICT) and knowledge-based capital (KBC) (Fuentes Hutfilter et al. 2016). As underlined in
the previous OECD survey (OECD, 2016) and Arkolakis et al. (2015), product market reforms would also
improve external competitiveness and promote exports by lowering production costs without requiring
further downward wage adjustment.
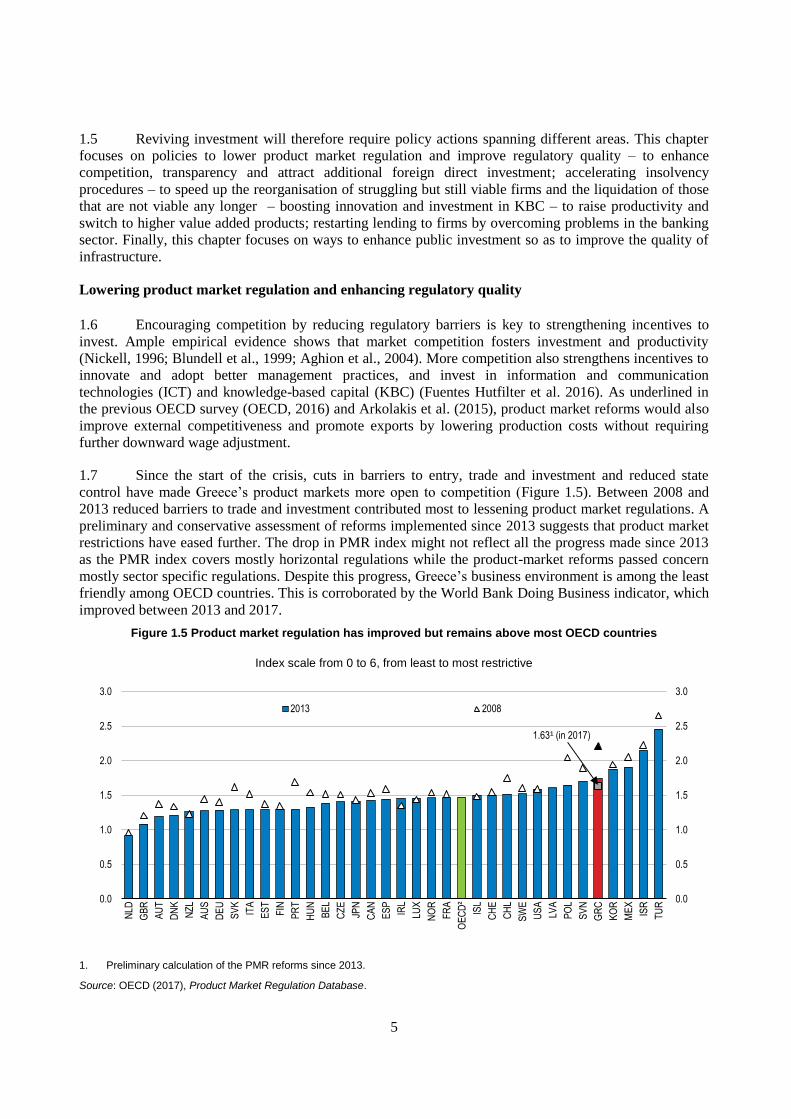
1.7 Since the start of the crisis, cuts in barriers to entry, trade and investment and reduced state
control have made Greece’s product markets more open to competition (Figure 1.5). Between 2008 and
2013 reduced barriers to trade and investment contributed most to lessening product market regulations. A
preliminary and conservative assessment of reforms implemented since 2013 suggests that product market
restrictions have eased further. The drop in PMR index might not reflect all the progress made since 2013
as the PMR index covers mostly horizontal regulations while the product-market reforms passed concern
mostly sector specific regulations. Despite this progress, Greece’s business environment is among the least
friendly among OECD countries. This is corroborated by the World Bank Doing Business indicator, which
improved between 2013 and 2017.
Figure 1.5 Product market regulation has improved but remains above most OECD countries
Index scale from 0 to 6, from least to most restrictive
1. Preliminary calculation of the PMR reforms since 2013.
Source: OECD (2017), Product Market Regulation Database.
0.0
0.5
1.0
1.5
2.0
2.5
3.0
0.0
0.5
1.0
1.5
2.0
2.5
3.0
NLD
GB
R
AU
T
DN
K
NZ
L
AU
S
DE
U
SV
K
ITA
ES
T
FIN
PR
T
HU
N
BE
L
CZ
E
JPN
CA
N
ES
P
IRL
LUX
NO
R
FR
A
OE
CD
²
ISL
CH
E
CH
L
SW
E
US
A
LVA
PO
L
SV
N
GR
C
KO
R
ME
X
ISR
TU
R
2013 2008
1.63¹ (in 2017)
6
1.8 Regulatory restrictions in the service sector can be especially damaging. In Greece the service
sector accounts for about 80% of GDP, above the OECD average (about 74%). Also, services account for
about 40% of Greece’s total exports in gross terms and more that 70% in value added terms. Regulated
professions accounted for about 30% of total private sector employment in 2010. Close to 18% of all
employees in Greece were working in jobs that required a license, while about 13% of all employees were
working in strictly regulated professions where regulations impose additional administrative licenses and
entry and conduct restrictions (Athanassiou et al., 2015).
1.9 Since 2010 Greece undertook an extensive legislative reform to streamline regulation of and ease
entry into a large number of regulated professions. The reform was complex and implementation followed
the recommendations of the national competition commission (HCC) (OECD, 2013; KEPE 2015). This
resulted in opening up to competition 75% of the 350 regulated professions in Greece, through various
measures (e.g. increase in the allowed number of notaries and reduction in notary fees; elimination of
unfair restrictions for access to the engineering profession; relaxation of rules for the establishment of new
pharmacies).
1.10 An assessment of the reform of 11 regulated professions suggests it has had a positive effect on
employment. Without the reform the crisis would have caused a larger fall in employment in these
regulated professions and the employment recovery would have started later. The reform had not clear
impact on prices and the quality of services provided (KEPE, 2015).
1.11 As highlighted in previous Surveys (OECD, 2013; OECD, 2015), the liberalisation of regulated
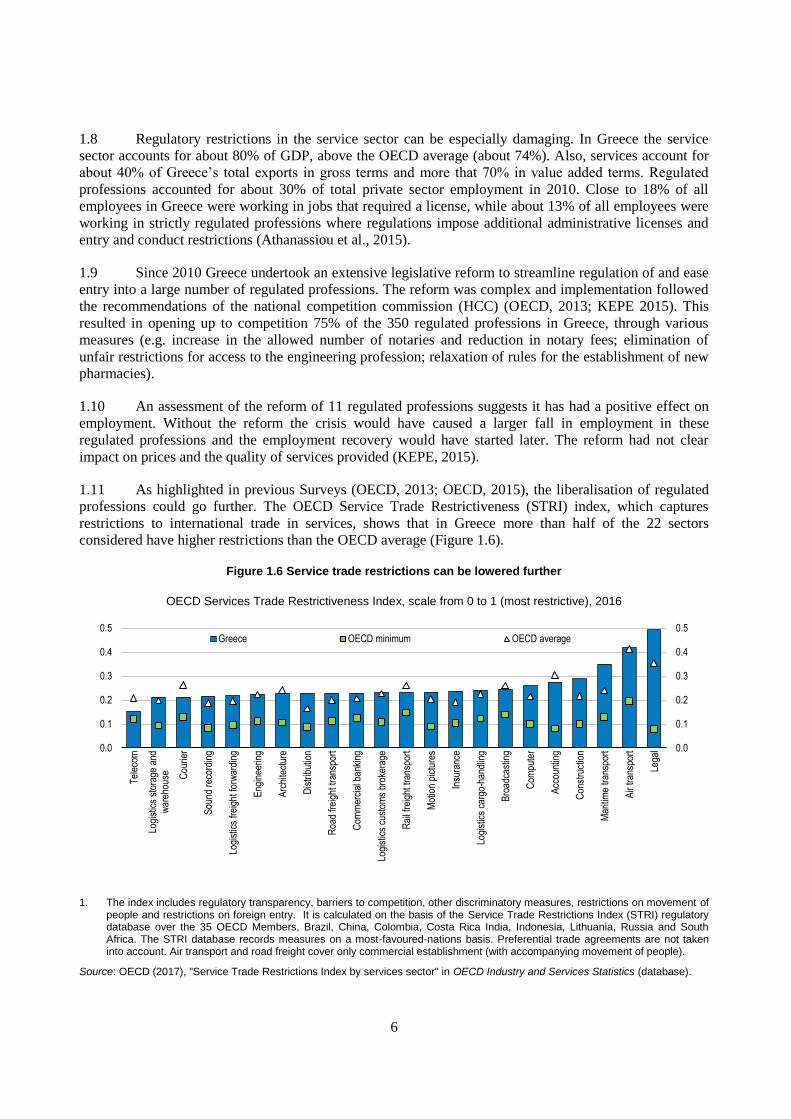
professions could go further. The OECD Service Trade Restrictiveness (STRI) index, which captures
restrictions to international trade in services, shows that in Greece more than half of the 22 sectors
considered have higher restrictions than the OECD average (Figure 1.6).
Figure 1.6 Service trade restrictions can be lowered further
OECD Services Trade Restrictiveness Index, scale from 0 to 1 (most restrictive), 2016
1. The index includes regulatory transparency, barriers to competition, other discriminatory measures, restrictions on movement of people and restrictions on foreign entry. It is calculated on the basis of the Service Trade Restrictions Index (STRI) regulatory database over the 35 OECD Members, Brazil, China, Colombia, Costa Rica India, Indonesia, Lithuania, Russia and South Africa. The STRI database records measures on a most-favoured-nations basis. Preferential trade agreements are not taken into account. Air transport and road freight cover only commercial establishment (with accompanying movement of people).
Source: OECD (2017), "Service Trade Restrictions Index by services sector" in OECD Industry and Services Statistics (database).
0.0
0.1
0.2
0.3
0.4
0.5
0.0
0.1
0.2
0.3
0.4
0.5
Tel
ecom
Logi
stic
s st
orag
e an
dw
areh
ouse C
ourie
r
Sou
nd r
ecor
ding
Logi
stic
s fr
eigh
t for
war
ding
Eng
inee
ring
Arc
hite
ctur
e
Dis
trib
utio
n
Roa
d fr
eigh
t tra
nspo
rt
Com
mer
cial
ban
king
Logi
stic
s cu
stom
s br
oker
age
Rai
l fre
ight
tran
spor
t
Mot
ion
pict
ures
Insu
ranc
e
Logi
stic
s ca
rgo-
hand
ling
Bro
adca
stin
g
Com
pute
r
Acc
ount
ing
Con
stru
ctio
n
Mar
itim
e tr
ansp
ort
Air
tran
spor
t
Lega
l
Greece OECD minimum OECD average
7
1.12 Relative to the OECD average, Greece performs especially well in telecommunications and
postal services. Legal, construction and maritime transport services are instead the three sectors with the
highest restrictions relative to the OECD average (Fig 1.6). For instance, in legal services EU nationality is
required to obtain a license to practice domestic law, only licensed lawyers can own shares in law firms
and board members and managers of law firms must be licensed lawyers. In construction services, there
are discriminatory measures related to public procurement processes against potential bidders and the State
controls two major firms in this sector. In maritime transport services, foreigners cannot own more than
49% of local maritime transport companies, the cabotage market is closed for non-EU registered vessels
(as in all EU countries). Moreover, majority ownership by Greek or EU nationals is a precondition for the
registration of vessels under the national flag. Also, certain technical agreements are exempt from
competition law while some services are reserved for specific entities at ports (OECD, 2016).
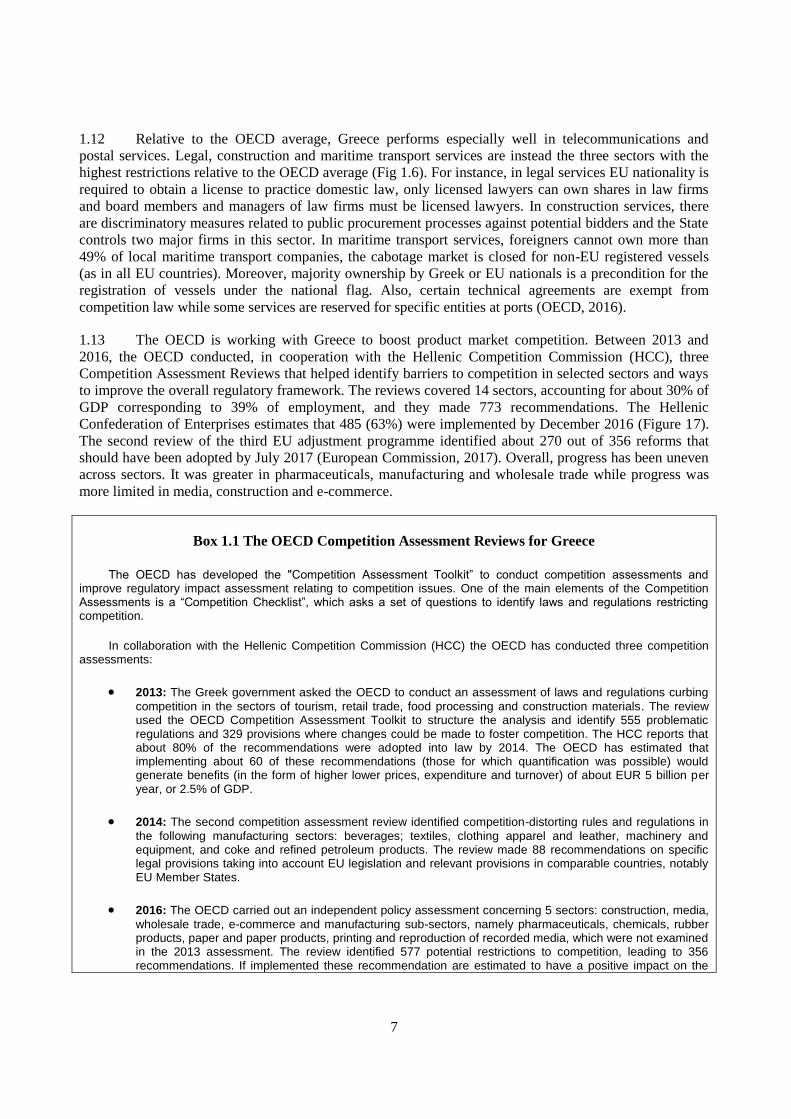
1.13 The OECD is working with Greece to boost product market competition. Between 2013 and
2016, the OECD conducted, in cooperation with the Hellenic Competition Commission (HCC), three
Competition Assessment Reviews that helped identify barriers to competition in selected sectors and ways
to improve the overall regulatory framework. The reviews covered 14 sectors, accounting for about 30% of
GDP corresponding to 39% of employment, and they made 773 recommendations. The Hellenic
Confederation of Enterprises estimates that 485 (63%) were implemented by December 2016 (Figure 17).
The second review of the third EU adjustment programme identified about 270 out of 356 reforms that
should have been adopted by July 2017 (European Commission, 2017). Overall, progress has been uneven
across sectors. It was greater in pharmaceuticals, manufacturing and wholesale trade while progress was
more limited in media, construction and e-commerce.
Box 1.1 The OECD Competition Assessment Reviews for Greece
The OECD has developed the "Competition Assessment Toolkit” to conduct competition assessments and improve regulatory impact assessment relating to competition issues. One of the main elements of the Competition Assessments is a “Competition Checklist”, which asks a set of questions to identify laws and regulations restricting competition.
In collaboration with the Hellenic Competition Commission (HCC) the OECD has conducted three competition assessments:
2013: The Greek government asked the OECD to conduct an assessment of laws and regulations curbing
competition in the sectors of tourism, retail trade, food processing and construction materials. The review used the OECD Competition Assessment Toolkit to structure the analysis and identify 555 problematic regulations and 329 provisions where changes could be made to foster competition. The HCC reports that about 80% of the recommendations were adopted into law by 2014. The OECD has estimated that implementing about 60 of these recommendations (those for which quantification was possible) would generate benefits (in the form of higher lower prices, expenditure and turnover) of about EUR 5 billion per year, or 2.5% of GDP.
2014: The second competition assessment review identified competition-distorting rules and regulations in
the following manufacturing sectors: beverages; textiles, clothing apparel and leather, machinery and equipment, and coke and refined petroleum products. The review made 88 recommendations on specific legal provisions taking into account EU legislation and relevant provisions in comparable countries, notably EU Member States.
2016: The OECD carried out an independent policy assessment concerning 5 sectors: construction, media,
wholesale trade, e-commerce and manufacturing sub-sectors, namely pharmaceuticals, chemicals, rubber products, paper and paper products, printing and reproduction of recorded media, which were not examined in the 2013 assessment. The review identified 577 potential restrictions to competition, leading to 356 recommendations. If implemented these recommendation are estimated to have a positive impact on the
8
Greek economy of around EUR 414 million.
Source: http://www.oecd.org/daf/competition/greece-competition-assessment-reviews.htm
1.14 The implementation of the recommendations of the three Competition Assessments, in the
context of strong domestic ownership, would be an important step to promote competition, and strengthen
incentives to invest. Reducing horizontal product market restrictions would also help. The government
should expand the role of one-stop shops and ensure they have the resources and capabilities to work
effectively. The competences of existing one-stop shops have recently been expanded to tax- and
insurance-related sectors. In 2016 a new law entered into force aiming at simplifying the procedures to
create new companies, also remotely through the e-one-stop shop, which is expected to be operational in
early 2018. One-stop shops have proved to be effective in simplifying export procedures (McLinden,
2013). The Greek Government is currently preparing a study, in cooperation with the European
Commission to expand further one-stop shops and shift them to electronic platform. The “silence is
consent” rule, whereby licences are automatically issued if the competent authority does not act within the
statutory period, could be expanded. The 2013 investment licensing law has replaced ex-ante licensing
with simple notification and ex-post monitoring of compliance, though only for selected sectors and
simplified licensing procedures.
Figure 1.7 Progress on implementing OECD competition assessment toolkit recommendations¹
2013-16
1. The OECD's Competition Assessment Toolkit aims to help governments to eliminate barriers to competition by providing a method for identifying unnecessary restraints on market activities and developing alternative, less restrictive measures that still achieve government policy objectives.
Source: European Commission (2017), “The ESM Stability Support Programme: Greece, First & Second Reviews July 2017 Background Report”, Institutional Paper 064, November 2017.
1.15 As reported in the 2016 OECD Economic Survey, recent changes in competition policy and the
Hellenic Competition Commission (HCC) have brought the legal framework closer to OECD best
practices. The HCC has continued to show dedication and commitment to competitive markets by
vigorously enforcing competition laws, despite severe resource constraints. In 2015, the HCC imposed the
93.3 95.5
72.8
83.9
6.7 4.5
27.2
16.1
0
20
40
60
80
100
120
0
20
40
60
80
100
120
Competition Assessment I Competition Assessment II Competition Assessment III Total
%%
Implemented Partially implemented and not implemented
9
highest fine ever in Greece on a single undertaking (EUR 31.5 million) for abuse of dominance in the beer
market. In 2016, the HCC imposed fines for about EUR 11.5 million, which were all upheld by appeal
courts (with only some minor reductions). In 2016, the HCC also imposed for the first time procedural
fines relating to submission of misleading data and obstruction of investigations.
1.16 However, the lack of resources is hampering the work of the HCC. The budget of the HCC is
financed through a levy on limited liability companies. Because of the lasting crisis, its budget has declined
considerably, from EUR 9.7 million in 2011, to EUR 7.7 million in 2015 and EUR 5.4 million in 2017.
Also, the HCC has to turn over 80% of its yearly saving to the central government. Tight budget
constraints have forced the staff to reduce transfers to islands for investigations (or concentrate
investigations in non-touristic periods). Moreover, scarce resources have weakened advocacy activities as
law enforcement is understandably given priority. The 2015 MoU envisaged an increase of the HCC’s
advocacy unit by twelve additional posts. However, between 2014 and 2016, the staff of the HCC
(excluding administrative support and IT experts) declined from 64 to 57 people.
1.17 As the economic and fiscal situation improves, the government should make sure HCC has the
financial and human resources commensurate to its responsibilities. Eliminating the rule allowing the
central government to claw-back 80% of the HCC’s yearly savings would go in the right direction. Going
forward the HCC could be tasked to conduct competition assessments regularly so as to raise the profile
and importance of competition issues in public and political debates and maintain the momentum. A good
example of institutional reform to deal with the periodical review of the role of competition and the market
regulation is Canada’s Competition Policy Review Panel.
Boosting foreign direct investment and integration in global value chains
1.18 Given the low level of savings, foreign direct investment (FDI) can play an important role in
reviving investments in Greece. Also, FDI generates benefits that go well beyond the direct additional
investment it engenders:
FDI can generate, with the right conditions, technology spillovers and productivity gains to the
host country (e.g. Iordanoglou and Matsaganis, 2017; OECD, 2015a; OECD 2010c, Lee, 2005).
FDI can contribute to the export performance of the host country as foreign affiliates tend to be
more export-oriented than domestic companies (e.g. Kneller and Pisu, 2004; OECD, 2000; Ahn
et al., 2004).
Finally, FDI is a building block of global value chains (GVCs). GVCs coordinated by
multinational enterprises account for 80% of global trade (OECD, WTO and UNCTAD, 2013).
Across countries integration in GVCs is positively associated with skills development and
productivity growth (OECD (2017). GVCs enable domestic firms to access world markets
through MNEs' supply chains. The size of manufacturing as a share of GDP is positively
associated with integration in GVCs, especially through backward engagement (i.e. imports of
inputs used to produce final goods or intermediates to be exported) (OECD, WTO & UNCTAD,
2013).
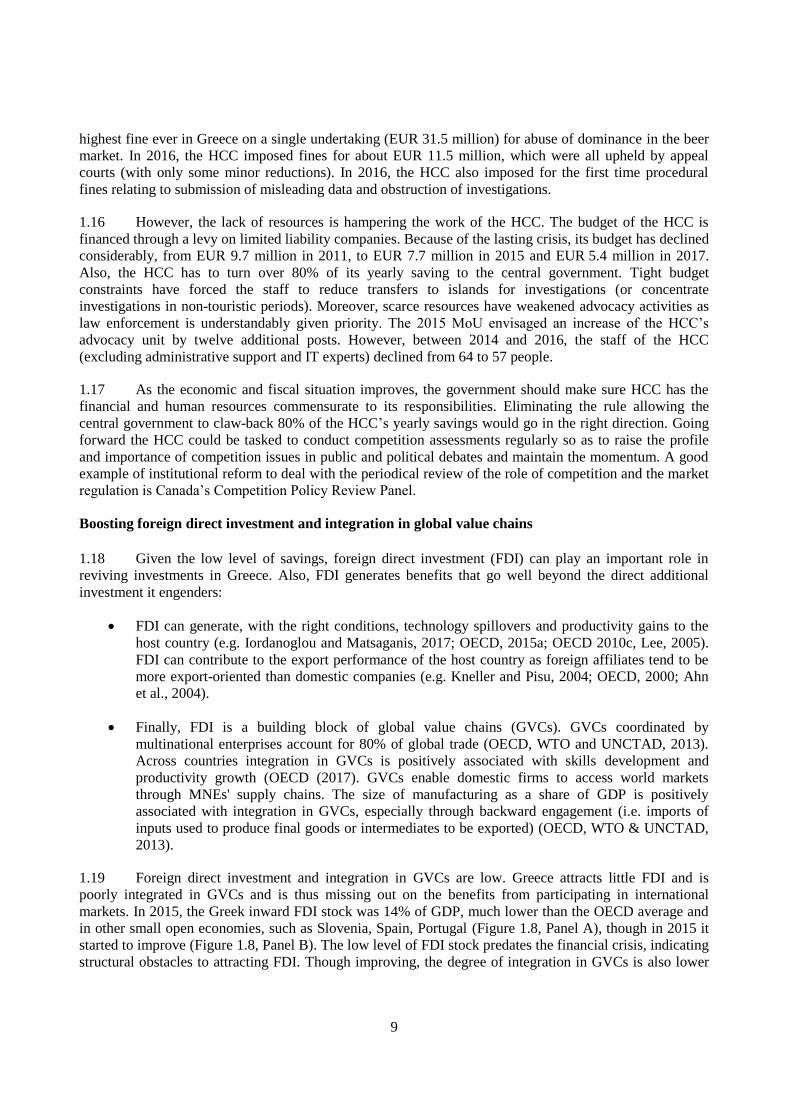
1.19 Foreign direct investment and integration in GVCs are low. Greece attracts little FDI and is
poorly integrated in GVCs and is thus missing out on the benefits from participating in international
markets. In 2015, the Greek inward FDI stock was 14% of GDP, much lower than the OECD average and
in other small open economies, such as Slovenia, Spain, Portugal (Figure 1.8, Panel A), though in 2015 it
started to improve (Figure 1.8, Panel B). The low level of FDI stock predates the financial crisis, indicating
structural obstacles to attracting FDI. Though improving, the degree of integration in GVCs is also lower
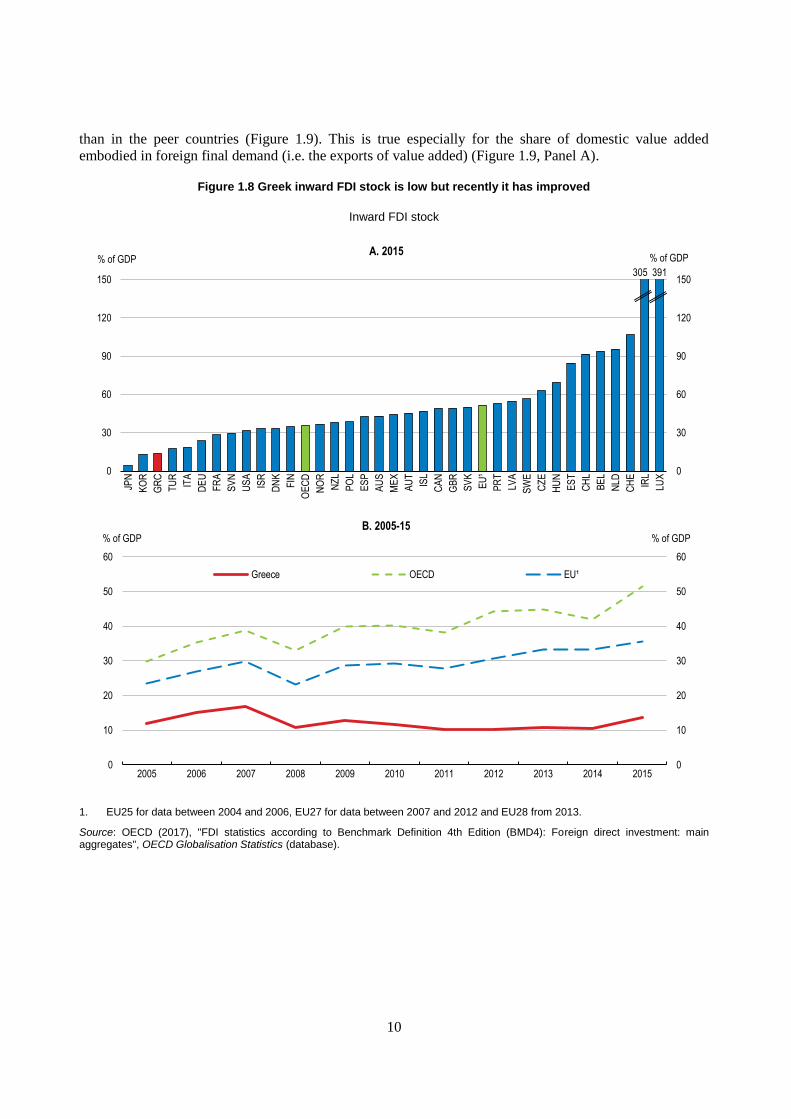
10
than in the peer countries (Figure 1.9). This is true especially for the share of domestic value added
embodied in foreign final demand (i.e. the exports of value added) (Figure 1.9, Panel A).
Figure 1.8 Greek inward FDI stock is low but recently it has improved
Inward FDI stock
1. EU25 for data between 2004 and 2006, EU27 for data between 2007 and 2012 and EU28 from 2013.
Source: OECD (2017), "FDI statistics according to Benchmark Definition 4th Edition (BMD4): Foreign direct investment: main aggregates", OECD Globalisation Statistics (database).
0
30
60
90
120
150
0
30
60
90
120
150
JPN
KO
R
GR
C
TU
R
ITA
DE
U
FR
A
SV
N
US
A
ISR
DN
K
FIN
OE
CD
NO
R
NZ
L
PO
L
ES
P
AU
S
ME
X
AU
T
ISL
CA
N
GB
R
SV
K
EU
¹
PR
T
LVA
SW
E
CZ
E
HU
N
ES
T
CH
L
BE
L
NLD
CH
E
IRL
LUX
% of GDP% of GDPA. 2015
305 391
0
10
20
30
40
50
60
0
10
20
30
40
50
60
2005 2006 2007 2008 2009 2010 2011 2012 2013 2014 2015
% of GDP% of GDPB. 2005-15
Greece OECD EU¹
11
Figure 1.9 There is ample scope to deepen participation in global value chains
Source: OECD (2017), "TiVA Nowcast Estimates" in OECD International Trade and Balance of Payments Statistics (database).
The poor business environment hinders FDI and integration in global value chains
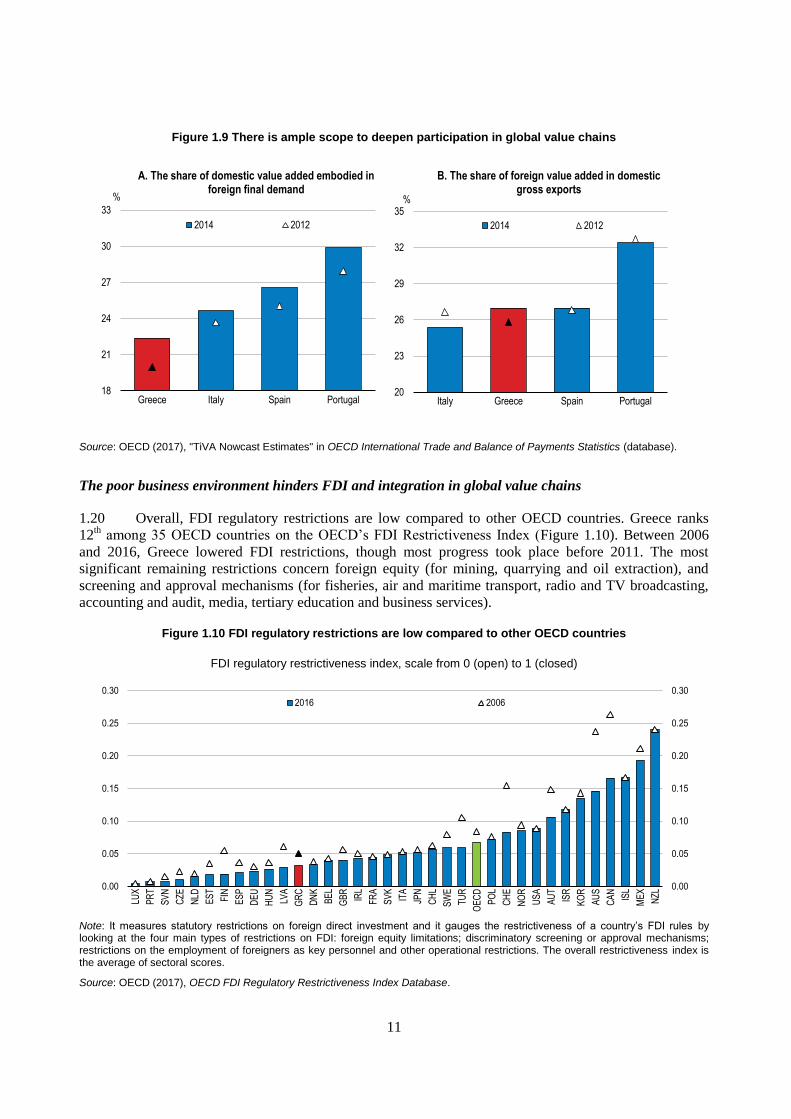
1.20 Overall, FDI regulatory restrictions are low compared to other OECD countries. Greece ranks
12th among 35 OECD countries on the OECD’s FDI Restrictiveness Index (Figure 1.10). Between 2006
and 2016, Greece lowered FDI restrictions, though most progress took place before 2011. The most
significant remaining restrictions concern foreign equity (for mining, quarrying and oil extraction), and
screening and approval mechanisms (for fisheries, air and maritime transport, radio and TV broadcasting,
accounting and audit, media, tertiary education and business services).
Figure 1.10 FDI regulatory restrictions are low compared to other OECD countries
FDI regulatory restrictiveness index, scale from 0 (open) to 1 (closed)
Note: It measures statutory restrictions on foreign direct investment and it gauges the restrictiveness of a country’s FDI rules by looking at the four main types of restrictions on FDI: foreign equity limitations; discriminatory screening or approval mechanisms; restrictions on the employment of foreigners as key personnel and other operational restrictions. The overall restrictiveness index is the average of sectoral scores.
Source: OECD (2017), OECD FDI Regulatory Restrictiveness Index Database.
18
21
24
27
30
33
Greece Italy Spain Portugal
%
A. The share of domestic value added embodied in foreign final demand
2014 2012
20
23
26
29
32
35
Italy Greece Spain Portugal
%
B. The share of foreign value added in domestic gross exports
2014 2012
0.00
0.05
0.10
0.15
0.20
0.25
0.30
0.00
0.05
0.10
0.15
0.20
0.25
0.30
LUX
PR
T
SV
N
CZE
NLD
ES
T
FIN
ES
P
DE
U
HU
N
LVA
GR
C
DN
K
BE
L
GB
R
IRL
FRA
SV
K
ITA
JPN
CH
L
SW
E
TUR
OE
CD
PO
L
CH
E
NO
R
US
A
AU
T
ISR
KO
R
AU
S
CA
N
ISL
ME
X
NZL
2016 2006
12
1.21 A attracting more FDI then hinges on improving the business environment, lowering product
market restrictions, improving the quality of infrastructure and institutions as well as the efficiency of the
public administration. These are also some of the main policy determinants of integration in GVCs
(OECD, WTO and UNCTAD, 2013). As highlighted above, the business environment can be further
improved by lowering PMR restrictions. Also, according to the 2017-2018 Global Competitiveness Report
Greece ranks 130th out of 137 countries on the burden of government regulation, 112
th as regards to FDI
and technology transfer and 61st on the protection of intellectual property rights (WEF, 2017b).
Iordanoglou and Matsaganis (2017) underline the role of bureaucratic obstacles and hostile attitude against
foreign investment at all levels of government in Greece as a factor holding back FDI. Acting on all these
factors will improve Greece’s attractiveness as FDI destination.
1.22 The ongoing privatisation presents an opportunity to attract FDI in key sectors such as transport,
energy and tourism. Some positive results are already apparent from the privatisation of the Piraeus and
Thessaloniki ports. The privatisation of the Piraeus port will result in an increase in GDP by 0.8% in 2025
and could contribute to long-term reduction of public debt by 2.3 percentage points of GDP (IOBE, 2016).
Also, construction works and the operation of the port will create more than 31 000 new jobs overall.
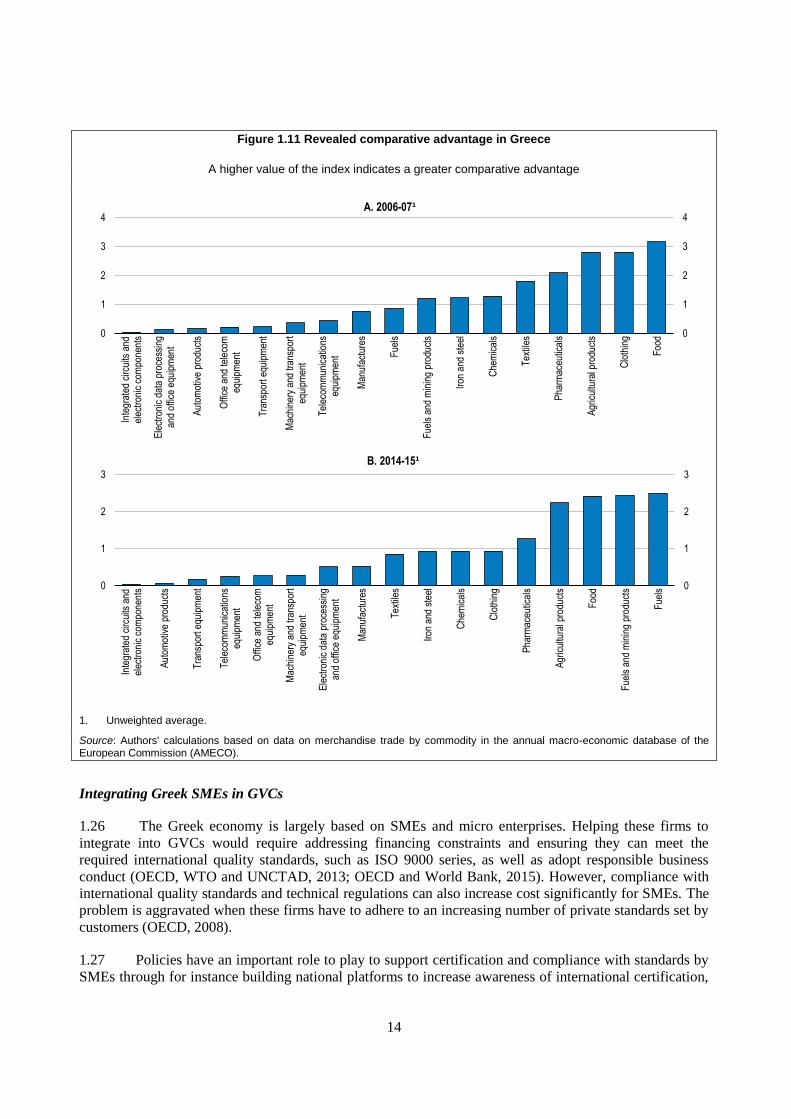
1.23 Attracting FDI in sectors having a relative comparative advantage (RCA) would be especially
beneficial for Greece. Empirical research suggests that FDI offers the potential of raising the quality of
exports thereby enhancing RCA (Harding and Javorcik, 2012). Policies aiming at attracting FDI in
comparative advantage sectors could then accelerate GVCs integration. Box 2 shows that Greece has a
comparative advantage in the food sector, agricultural products, fuels, minerals and pharmaceuticals.
Policies to attract FDI in these sectors could entail incentives to participate in international fairs and fast
track approval process for instance.
1.24 Recent legislation to attract FDI and promote strategic investment more broadly includes the
2010 law “Acceleration and Transparency of Implementation of Strategic Investments" (Fast Track Law)
and the 2013 law “Creation of a Development Friendly Environment for Strategic and Private
Investments". These aim at simplifying licencing procedures and providing limited tax incentives.
Enterprise Greece is the agency within the Ministry of Economic and Development with responsibilities
over assessing project proposals and granting them the fast track status if they meet certain criteria.
1.25 More recently, the 2016 law establishing state aid schemes for private investments introduced a
range of financial incentives covering tangible and intangible capital with the aim of attracting FDI in
addition to encouraging entrepreneurships, innovative SMEs and innovation clusters. Incentives for major
investment projects include a fixed corporate income tax rate for 12 years, tax exemption equal to 10% of
eligible expenditure (capped at EUR 5 billion) and fast track licencing procedures.
13
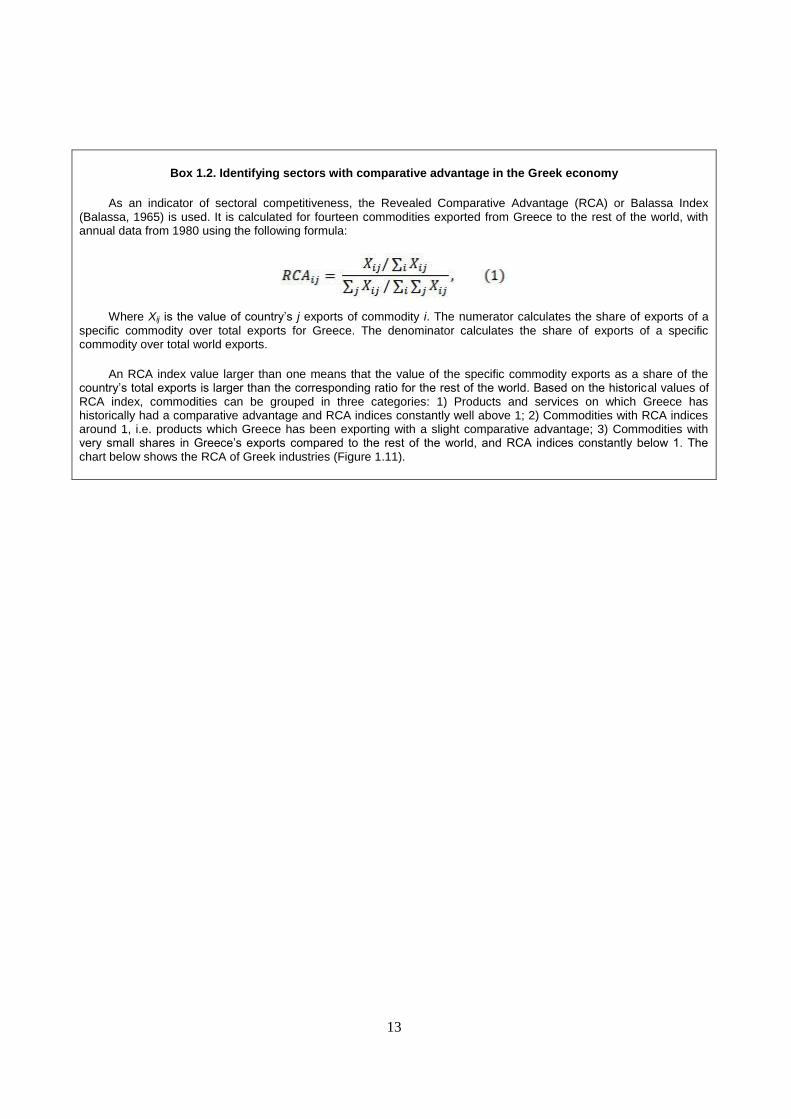
Box 1.2. Identifying sectors with comparative advantage in the Greek economy
As an indicator of sectoral competitiveness, the Revealed Comparative Advantage (RCA) or Balassa Index (Balassa, 1965) is used. It is calculated for fourteen commodities exported from Greece to the rest of the world, with annual data from 1980 using the following formula:
Where Xij is the value of country’s j exports of commodity i. The numerator calculates the share of exports of a
specific commodity over total exports for Greece. The denominator calculates the share of exports of a specific commodity over total world exports.
An RCA index value larger than one means that the value of the specific commodity exports as a share of the country’s total exports is larger than the corresponding ratio for the rest of the world. Based on the historical values of RCA index, commodities can be grouped in three categories: 1) Products and services on which Greece has historically had a comparative advantage and RCA indices constantly well above 1; 2) Commodities with RCA indices around 1, i.e. products which Greece has been exporting with a slight comparative advantage; 3) Commodities with very small shares in Greece’s exports compared to the rest of the world, and RCA indices constantly below 1. The chart below shows the RCA of Greek industries (Figure 1.11).
14
Figure 1.11 Revealed comparative advantage in Greece
A higher value of the index indicates a greater comparative advantage
1. Unweighted average.
Source: Authors' calculations based on data on merchandise trade by commodity in the annual macro-economic database of the European Commission (AMECO).
Integrating Greek SMEs in GVCs
1.26 The Greek economy is largely based on SMEs and micro enterprises. Helping these firms to
integrate into GVCs would require addressing financing constraints and ensuring they can meet the
required international quality standards, such as ISO 9000 series, as well as adopt responsible business
conduct (OECD, WTO and UNCTAD, 2013; OECD and World Bank, 2015). However, compliance with
international quality standards and technical regulations can also increase cost significantly for SMEs. The
problem is aggravated when these firms have to adhere to an increasing number of private standards set by
customers (OECD, 2008).
1.27 Policies have an important role to play to support certification and compliance with standards by
SMEs through for instance building national platforms to increase awareness of international certification,
0
1
2
3
4
0
1
2
3
4
Inte
grat
ed c
ircui
ts a
ndel
ectr
onic
com
pone
nts
Ele
ctro
nic
data
pro
cess
ing
and
offic
e eq
uipm
ent
Aut
omot
ive
prod
ucts
Offi
ce a
nd te
leco
meq
uipm
ent
Tra
nspo
rt e
quip
men
t
Mac
hine
ry a
nd tr
ansp
ort
equi
pmen
t
Tel
ecom
mun
icat
ions
equi
pmen
t
Man
ufac
ture
s
Fue
ls
Fue
ls a
nd m
inin
g pr
oduc
ts
Iron
and
ste
el
Che
mic
als
Tex
tiles
Pha
rmac
eutic
als
Agr
icul
tura
l pro
duct
s
Clo
thin
g
Foo
d
A. 2006-07¹
0
1
2
3
0
1
2
3
Inte
grat
ed c
ircui
ts a
ndel
ectr
onic
com
pone
nts
Aut
omot
ive
prod
ucts
Tra
nspo
rt e
quip
men
t
Tel
ecom
mun
icat
ions
equi
pmen
t
Offi
ce a
nd te
leco
meq
uipm
ent
Mac
hine
ry a
nd tr
ansp
ort
equi
pmen
t
Ele
ctro
nic
data
pro
cess
ing
and
offic
e eq
uipm
ent
Man
ufac
ture
s
Tex
tiles
Iron
and
ste
el
Che
mic
als
Clo
thin
g
Pha
rmac
eutic
als
Agr
icul
tura
l pro
duct
s
Foo
d
Fue
ls a
nd m
inin
g pr
oduc
ts
Fue
ls
B. 2014-15¹
15
sharing experiences and best practices, and facilitating matching between potential partners. For instance,
in Mexico some first-tier suppliers of Volkswagen have helped second-tier suppliers to improve quality –
by helping them to gain quality certification specific to the automotive sector based on ISO 9001 – so as to
enter or remain in Volkswagen global value chains. Mexico’s National Network of Productive
Associations promotes horizontal and vertical links between SMEs, governments, institutions and
intermediate organisations. Also, initiatives such as group certification for SMEs in geographical regions
might be useful, if trust could be gained in effective control mechanisms (OECD, 2008).
Streamlining insolvency procedures and strengthening contract enforcement
1.28 Investment and entrepreneurship heavily rely on the ability of capital to freely and quickly move
between profitable market opportunities. The role of insolvency frameworks becomes crucial in
restructuring companies that are still viable and liquidating those that are not. An efficient insolvency
regime should deliver the largest recovery rate for creditors with the least direct loss in the value of the
insolvent firm as going concern. If creditors are not protected or allowed to participate in insolvency
proceedings, they will have less incentive to lend in the future. That leads to a less developed credit market
and lower investment (Claessens and Klapper, 2002).
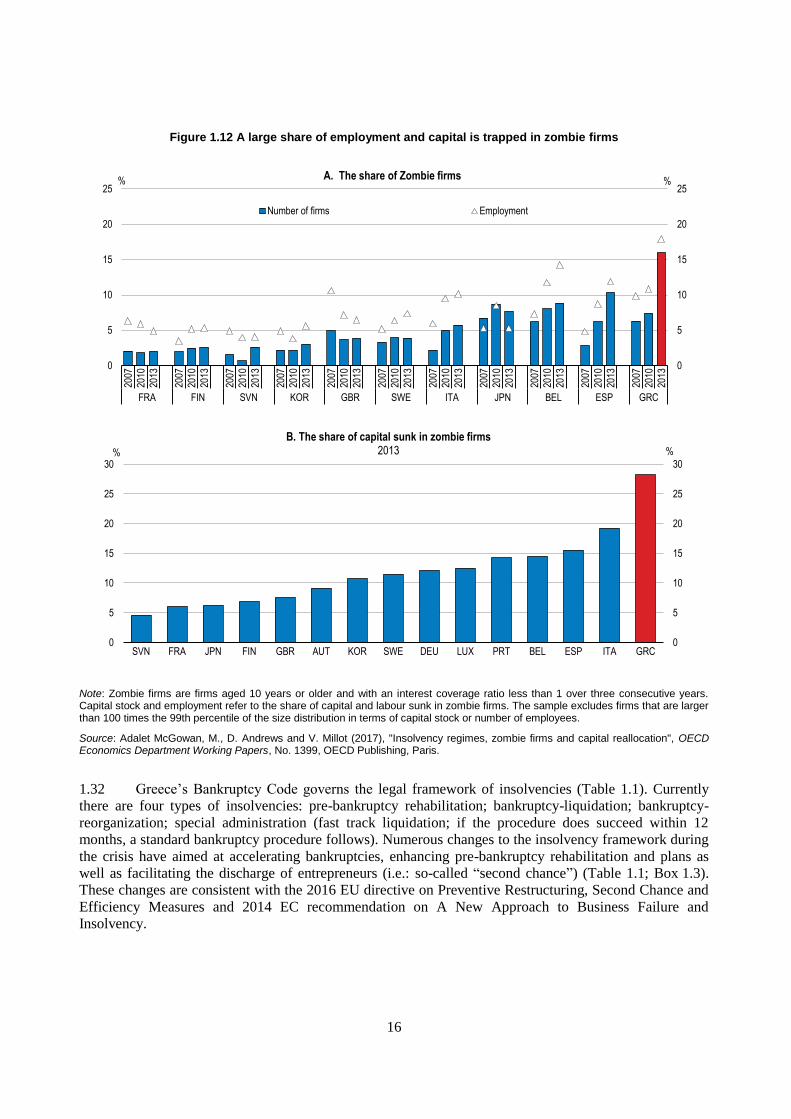
1.30 Long and costly insolvency procedures trap capital and other resources in low productive firms,
reducing allocative efficiency and depressing domestic investment. Evidence suggests that a nontrivial
share of the collapse in aggregate business investment in Greece is attributable to the survival of firms
having persistent problems meeting interest payments, the so-called zombie firms (Adalet McGowan et al.,
2017). As of 2013, Greece had the highest share of capital and employment trapped in zombie firms. This
was true also in 2003, suggesting persistent problems in restructuring insolvent firms or making them exit
the market (Figure 1.12). A high share of capital and employment trapped in zombie firms signals high
resource misallocation, lowering productivity. Moreover, it weakens incentives for non-zombie firms and
financial institutions to invest and innovate (congestion effect), while also raising the cost of capital and
labour through their artificial scarcity. Empirical evidence from OECD countries indicate that reducing
barriers to corporate restructuring can contribute to significantly reduce the share of capital sunk in zombie
firms (Adalet McGowan et al., 2017), thus directly reducing resource misallocation and increasing
productivity. Such reforms can also raise investment by non-zombie firms by reducing congestion.
1.31 Besides, the market congestion generated by zombie firms can create barriers to entry, thus
lowering investment from potential market entrants. Simulations suggest that lowering the share of capital
trapped in Greek zombie firms from nearly 30% to 5% would increase investment for a typical non-zombie
Greek firm by nearly 5%. According to Adalet McGowan et al. (2017: p. 12), Greece could benefit more
than any other country analysed in the sample from insolvency reform.
16
Figure 1.12 A large share of employment and capital is trapped in zombie firms
Note: Zombie firms are firms aged 10 years or older and with an interest coverage ratio less than 1 over three consecutive years. Capital stock and employment refer to the share of capital and labour sunk in zombie firms. The sample excludes firms that are larger than 100 times the 99th percentile of the size distribution in terms of capital stock or number of employees.
Source: Adalet McGowan, M., D. Andrews and V. Millot (2017), "Insolvency regimes, zombie firms and capital reallocation", OECD Economics Department Working Papers, No. 1399, OECD Publishing, Paris.
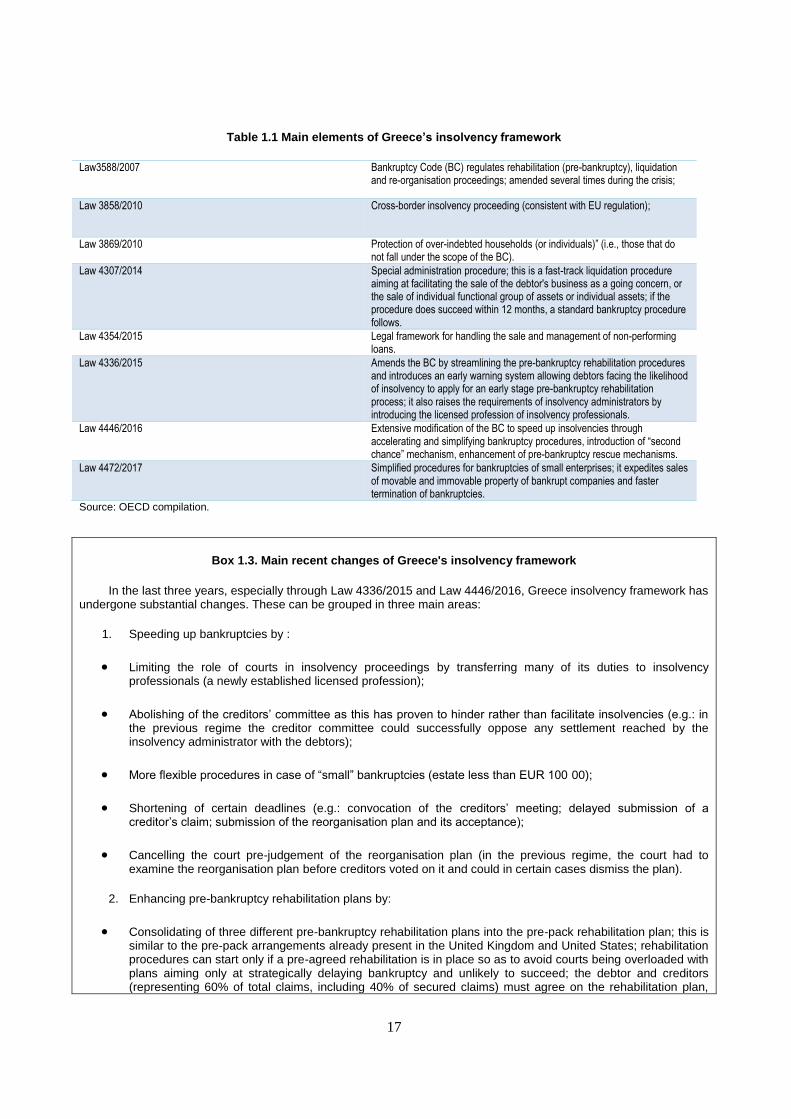
1.32 Greece’s Bankruptcy Code governs the legal framework of insolvencies (Table 1.1). Currently
there are four types of insolvencies: pre-bankruptcy rehabilitation; bankruptcy-liquidation; bankruptcy-
reorganization; special administration (fast track liquidation; if the procedure does succeed within 12
months, a standard bankruptcy procedure follows). Numerous changes to the insolvency framework during
the crisis have aimed at accelerating bankruptcies, enhancing pre-bankruptcy rehabilitation and plans as
well as facilitating the discharge of entrepreneurs (i.e.: so-called “second chance”) (Table 1.1; Box 1.3).
These changes are consistent with the 2016 EU directive on Preventive Restructuring, Second Chance and
Efficiency Measures and 2014 EC recommendation on A New Approach to Business Failure and
Insolvency.
0
5
10
15
20
25
0
5
10
15
20
25
2007
2010
2013
2007
2010
2013
2007
2010
2013
2007
2010
2013
2007
2010
2013
2007
2010
2013
2007
2010
2013
2007
2010
2013
2007
2010
2013
2007
2010
2013
2007
2010
2013
FRA FIN SVN KOR GBR SWE ITA JPN BEL ESP GRC
%A. The share of Zombie firms
Number of firms Employment
%
0
5
10
15
20
25
30
0
5
10
15
20
25
30
SVN FRA JPN FIN GBR AUT KOR SWE DEU LUX PRT BEL ESP ITA GRC
%%
B. The share of capital sunk in zombie firms 2013
17
Table 1.1 Main elements of Greece’s insolvency framework
Law3588/2007 Bankruptcy Code (BC) regulates rehabilitation (pre-bankruptcy), liquidation and re-organisation proceedings; amended several times during the crisis;
Law 3858/2010 Cross-border insolvency proceeding (consistent with EU regulation);
Law 3869/2010 Protection of over-indebted households (or individuals)” (i.e., those that do not fall under the scope of the BC).
Law 4307/2014 Special administration procedure; this is a fast-track liquidation procedure aiming at facilitating the sale of the debtor's business as a going concern, or the sale of individual functional group of assets or individual assets; if the procedure does succeed within 12 months, a standard bankruptcy procedure follows.
Law 4354/2015 Legal framework for handling the sale and management of non-performing loans.
Law 4336/2015 Amends the BC by streamlining the pre-bankruptcy rehabilitation procedures and introduces an early warning system allowing debtors facing the likelihood of insolvency to apply for an early stage pre-bankruptcy rehabilitation process; it also raises the requirements of insolvency administrators by introducing the licensed profession of insolvency professionals.
Law 4446/2016 Extensive modification of the BC to speed up insolvencies through accelerating and simplifying bankruptcy procedures, introduction of “second chance” mechanism, enhancement of pre-bankruptcy rescue mechanisms.
Law 4472/2017 Simplified procedures for bankruptcies of small enterprises; it expedites sales of movable and immovable property of bankrupt companies and faster termination of bankruptcies.
Source: OECD compilation.
Box 1.3. Main recent changes of Greece's insolvency framework
In the last three years, especially through Law 4336/2015 and Law 4446/2016, Greece insolvency framework has undergone substantial changes. These can be grouped in three main areas:
1. Speeding up bankruptcies by :
Limiting the role of courts in insolvency proceedings by transferring many of its duties to insolvency professionals (a newly established licensed profession);
Abolishing of the creditors’ committee as this has proven to hinder rather than facilitate insolvencies (e.g.: in the previous regime the creditor committee could successfully oppose any settlement reached by the insolvency administrator with the debtors);
More flexible procedures in case of “small” bankruptcies (estate less than EUR 100 00);
Shortening of certain deadlines (e.g.: convocation of the creditors’ meeting; delayed submission of a creditor’s claim; submission of the reorganisation plan and its acceptance);
Cancelling the court pre-judgement of the reorganisation plan (in the previous regime, the court had to examine the reorganisation plan before creditors voted on it and could in certain cases dismiss the plan).
2. Enhancing pre-bankruptcy rehabilitation plans by:
Consolidating of three different pre-bankruptcy rehabilitation plans into the pre-pack rehabilitation plan; this is similar to the pre-pack arrangements already present in the United Kingdom and United States; rehabilitation procedures can start only if a pre-agreed rehabilitation is in place so as to avoid courts being overloaded with plans aiming only at strategically delaying bankruptcy and unlikely to succeed; the debtor and creditors (representing 60% of total claims, including 40% of secured claims) must agree on the rehabilitation plan,
18
which needs be ratified by the court; ratification binds all creditors even those that have dissented or did not participate
Introducing creditor-driven rehabilitation; creditors (representing 60% of total claims, including 40% of secured claims) can agree on a rehabilitation plan without the participation of the debtor and submit to the court for ratification, provided that the debtor is unable to meet overdue financial obligations in a general and permanent way (i.e. cessation of payments); the opposition of the debtor does not preclude the ratification of the plan as the court will base its decision mainly on the opinion of the financial expert accompanying the plan;
Introducing new procedures to deal with non-cooperating shareholders;
3. Facilitating the discharge of entrepreneurs (“second chance”) by:
Shortening the period from 10 to two years, starting from the start of bankruptcy proceedings, after which the entrepreneur can be fully discharged from any of the creditors' claims that have not been fully satisfied; the entrepreneur is discharged any time after bankruptcy ends; entrepreneurs have the right to this discharge only once.
Source: Karatzas, C.M., V. Salaka and A.S. Tsatsi (2017), "Insolvency Proceedings in Greece after Recent Reforms", Emerging Markets Restructuring Journal, Vol. 3; "Insolveny and Directors' duties in Greece: Overview", available at www.ukpracticalw.thomsonreuters.com accessed in August 2017; "Restructuring & Insolvency in Greece" available at www.lexology .com accessed on August 2017.
1.33 Also, in 2017 the Greek Parliament passed a law to facilitate out-of-court dispute resolution and
speed up the settlement of debt of non-financial corporations and professionals. The new law is debtor
friendly and is initiated by the debtor by submitting a proposal for settling her/his debts. Enterprises cannot
apply for this mechanism when a single creditor accounts for at least 85% of the total claims. The debt
settlement agreement needs to be ratified by the court. If the court decides not to ratify the out-of-court
agreement, the agreement is no longer valid and initial claims are restored. The start of electronic auctions
in November 2017 is expected to accelerate enforcement procedures (EC, 2017) by supporting a thriving
secondary market for repossessed assets.
1.34 Overall, these changes to the insolvency framework and out-of-court business dispute resolution
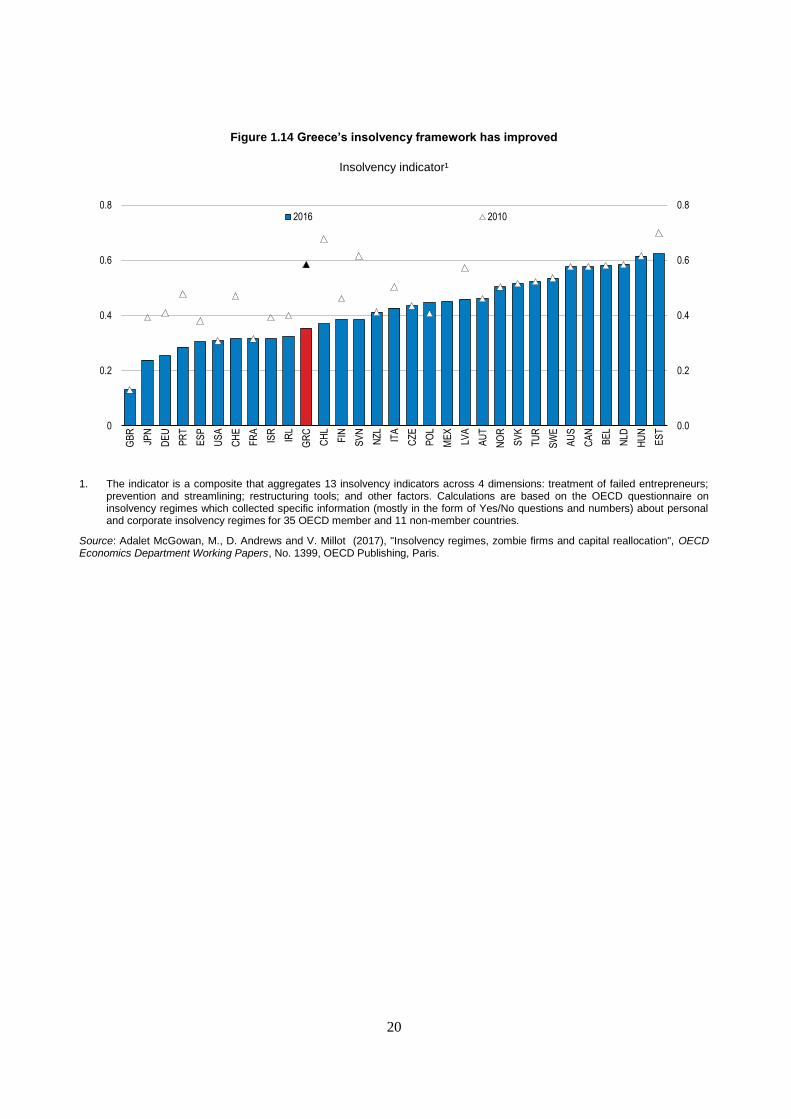
mechanism go in the right direction. The cross-country OECD policy indicator of insolvency regimes (Box
1.4) shows a marked improvement in Greece from 2010 to 2016 to below the OECD average (Figure 1.14).
Greece is the country that along with Chile, Germany, Japan, Portugal and Slovenia made the largest
progress on insolvency procedures. The sub-components of the index show progress in all of the three
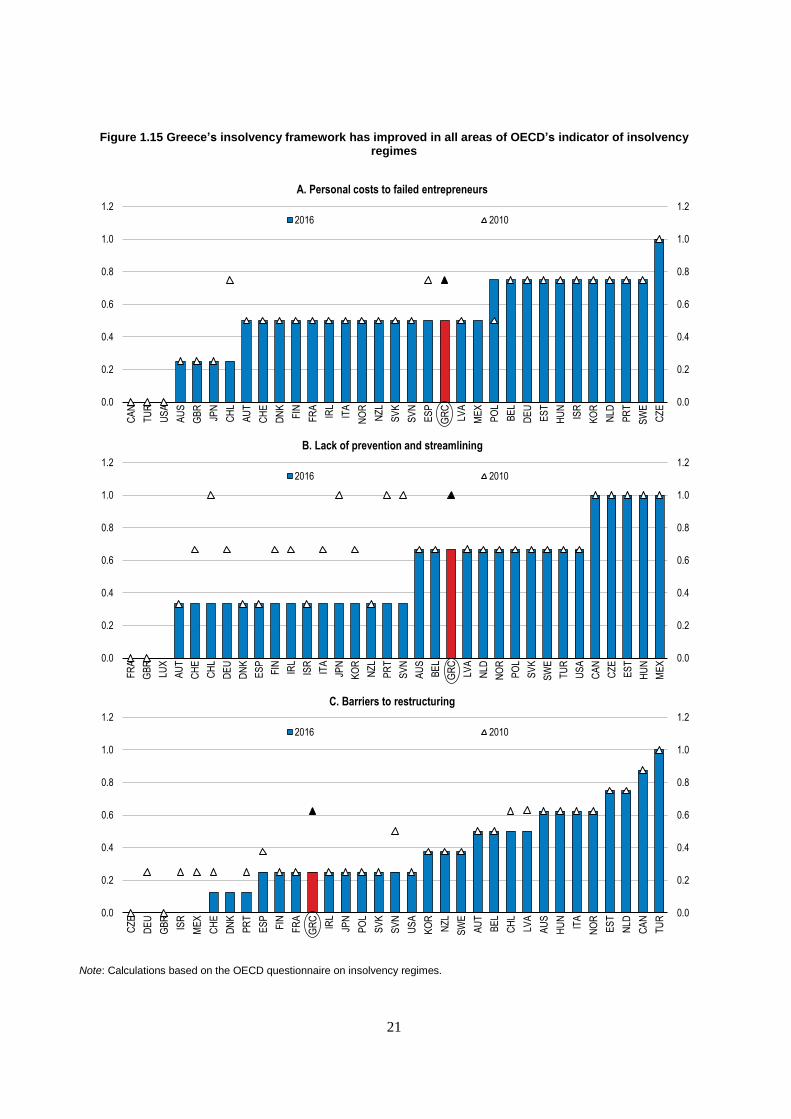
areas covered by the index: personal costs to failed entrepreneurs, lack of prevention and streamlining and
barriers to restructuring (Figure 1.15). The insolvency framework index included in the World Bank's
Doing Business database corroborates these improvements as Greece's distance to the frontier decreased
between 2010 and 2017.
19
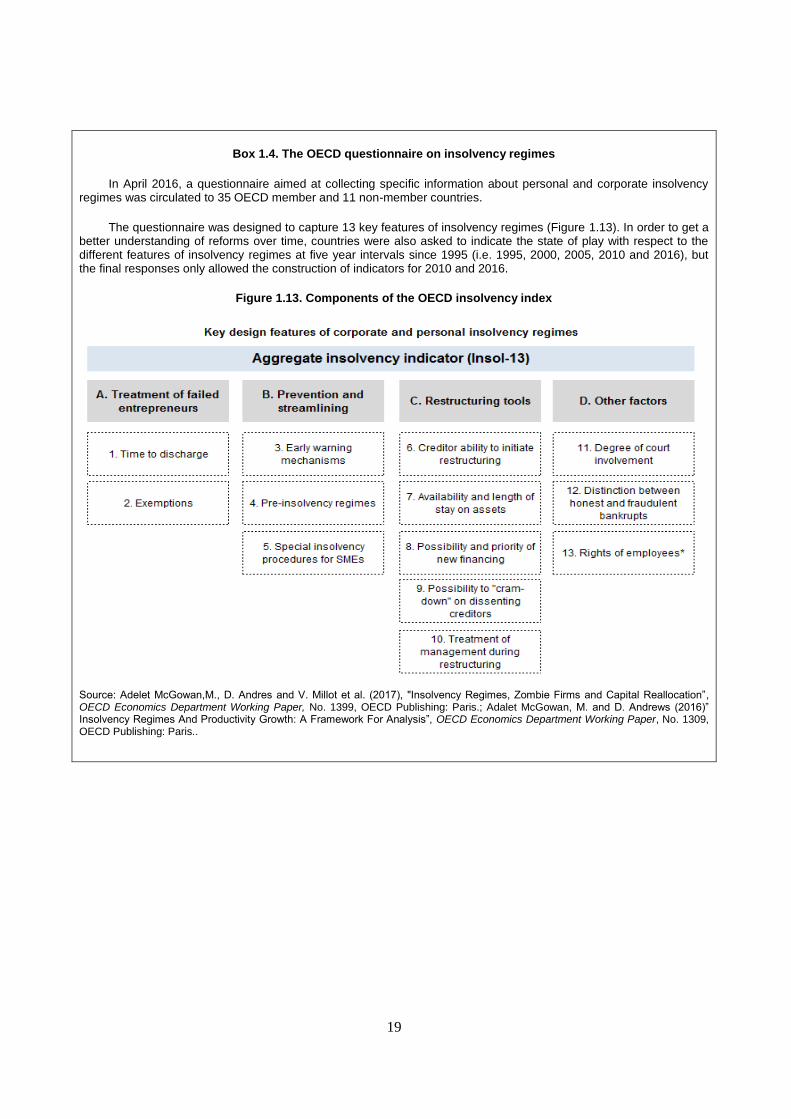
Box 1.4. The OECD questionnaire on insolvency regimes
In April 2016, a questionnaire aimed at collecting specific information about personal and corporate insolvency regimes was circulated to 35 OECD member and 11 non-member countries.
The questionnaire was designed to capture 13 key features of insolvency regimes (Figure 1.13). In order to get a better understanding of reforms over time, countries were also asked to indicate the state of play with respect to the different features of insolvency regimes at five year intervals since 1995 (i.e. 1995, 2000, 2005, 2010 and 2016), but the final responses only allowed the construction of indicators for 2010 and 2016.
Figure 1.13. Components of the OECD insolvency index
Source: Adelet McGowan,M., D. Andres and V. Millot et al. (2017), "Insolvency Regimes, Zombie Firms and Capital Reallocation”, OECD Economics Department Working Paper, No. 1399, OECD Publishing: Paris.; Adalet McGowan, M. and D. Andrews (2016)” Insolvency Regimes And Productivity Growth: A Framework For Analysis”, OECD Economics Department Working Paper, No. 1309, OECD Publishing: Paris..
20
Figure 1.14 Greece’s insolvency framework has improved
Insolvency indicator¹
1. The indicator is a composite that aggregates 13 insolvency indicators across 4 dimensions: treatment of failed entrepreneurs; prevention and streamlining; restructuring tools; and other factors. Calculations are based on the OECD questionnaire on insolvency regimes which collected specific information (mostly in the form of Yes/No questions and numbers) about personal and corporate insolvency regimes for 35 OECD member and 11 non-member countries.
Source: Adalet McGowan, M., D. Andrews and V. Millot (2017), "Insolvency regimes, zombie firms and capital reallocation", OECD Economics Department Working Papers, No. 1399, OECD Publishing, Paris.
0.0
0.2
0.4
0.6
0.8
0
0.2
0.4
0.6
0.8
GB
R
JPN
DE
U
PR
T
ES
P
US
A
CH
E
FR
A
ISR
IRL
GR
C
CH
L
FIN
SV
N
NZ
L
ITA
CZ
E
PO
L
ME
X
LVA
AU
T
NO
R
SV
K
TU
R
SW
E
AU
S
CA
N
BE
L
NLD
HU
N
ES
T
2016 2010
21
Figure 1.15 Greece’s insolvency framework has improved in all areas of OECD’s indicator of insolvency regimes
Note: Calculations based on the OECD questionnaire on insolvency regimes.
0.0
0.2
0.4
0.6
0.8
1.0
1.2
0.0
0.2
0.4
0.6
0.8
1.0
1.2
CA
N
TU
R
US
A
AU
S
GB
R
JPN
CH
L
AU
T
CH
E
DN
K
FIN
FR
A
IRL
ITA
NO
R
NZ
L
SV
K
SV
N
ES
P
GR
C
LVA
ME
X
PO
L
BE
L
DE
U
ES
T
HU
N
ISR
KO
R
NLD
PR
T
SW
E
CZ
E
A. Personal costs to failed entrepreneurs
2016 2010
0.0
0.2
0.4
0.6
0.8
1.0
1.2
0.0
0.2
0.4
0.6
0.8
1.0
1.2
FR
A
GB
R
LUX
AU
T
CH
E
CH
L
DE
U
DN
K
ES
P
FIN IRL
ISR
ITA
JPN
KO
R
NZ
L
PR
T
SV
N
AU
S
BE
L
GR
C
LVA
NLD
NO
R
PO
L
SV
K
SW
E
TU
R
US
A
CA
N
CZ
E
ES
T
HU
N
ME
X
B. Lack of prevention and streamlining
2016 2010
0.0
0.2
0.4
0.6
0.8
1.0
1.2
0.0
0.2
0.4
0.6
0.8
1.0
1.2
CZ
E
DE
U
GB
R
ISR
ME
X
CH
E
DN
K
PR
T
ES
P
FIN
FR
A
GR
C
IRL
JPN
PO
L
SV
K
SV
N
US
A
KO
R
NZ
L
SW
E
AU
T
BE
L
CH
L
LVA
AU
S
HU
N
ITA
NO
R
ES
T
NLD
CA
N
TU
R
C. Barriers to restructuring
2016 2010
22
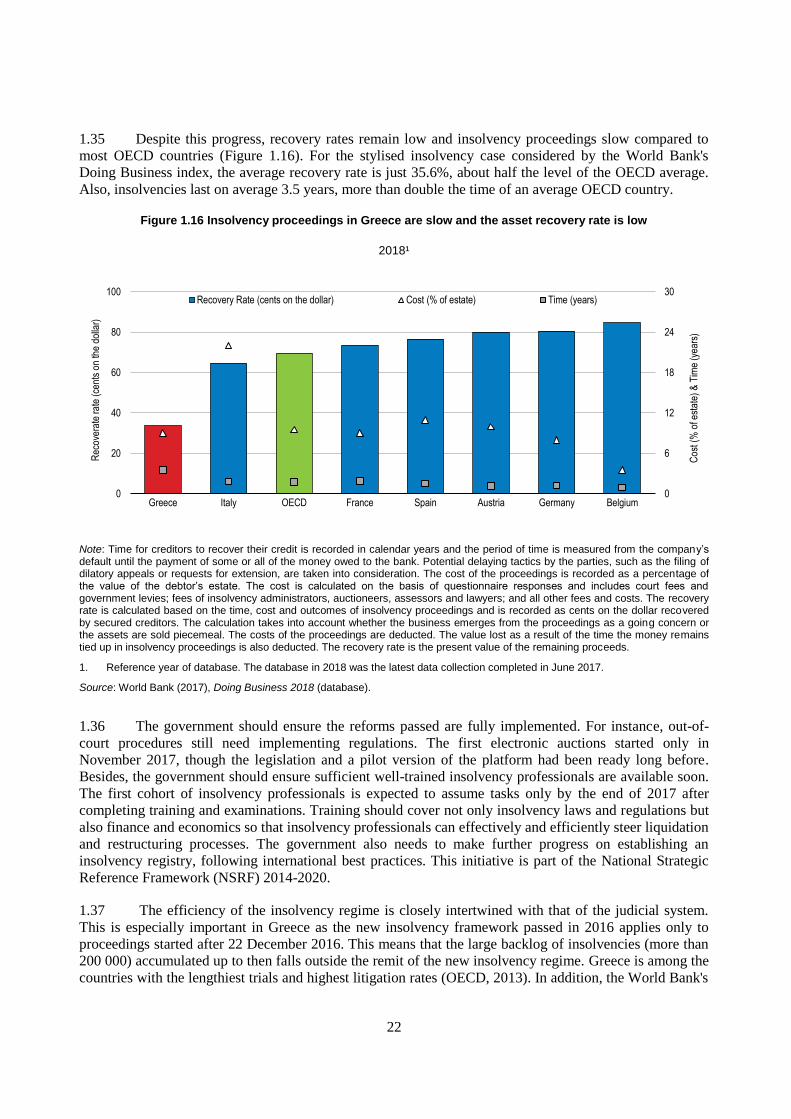
1.35 Despite this progress, recovery rates remain low and insolvency proceedings slow compared to
most OECD countries (Figure 1.16). For the stylised insolvency case considered by the World Bank's
Doing Business index, the average recovery rate is just 35.6%, about half the level of the OECD average.
Also, insolvencies last on average 3.5 years, more than double the time of an average OECD country.
Figure 1.16 Insolvency proceedings in Greece are slow and the asset recovery rate is low
2018¹
Note: Time for creditors to recover their credit is recorded in calendar years and the period of time is measured from the company’s default until the payment of some or all of the money owed to the bank. Potential delaying tactics by the parties, such as the filing of dilatory appeals or requests for extension, are taken into consideration. The cost of the proceedings is recorded as a percentage of the value of the debtor’s estate. The cost is calculated on the basis of questionnaire responses and includes court fees and government levies; fees of insolvency administrators, auctioneers, assessors and lawyers; and all other fees and costs. The recovery rate is calculated based on the time, cost and outcomes of insolvency proceedings and is recorded as cents on the dollar recovered by secured creditors. The calculation takes into account whether the business emerges from the proceedings as a going concern or the assets are sold piecemeal. The costs of the proceedings are deducted. The value lost as a result of the time the money remains tied up in insolvency proceedings is also deducted. The recovery rate is the present value of the remaining proceeds.
1. Reference year of database. The database in 2018 was the latest data collection completed in June 2017.
Source: World Bank (2017), Doing Business 2018 (database).
1.36 The government should ensure the reforms passed are fully implemented. For instance, out-of-
court procedures still need implementing regulations. The first electronic auctions started only in
November 2017, though the legislation and a pilot version of the platform had been ready long before.
Besides, the government should ensure sufficient well-trained insolvency professionals are available soon.
The first cohort of insolvency professionals is expected to assume tasks only by the end of 2017 after
completing training and examinations. Training should cover not only insolvency laws and regulations but
also finance and economics so that insolvency professionals can effectively and efficiently steer liquidation
and restructuring processes. The government also needs to make further progress on establishing an
insolvency registry, following international best practices. This initiative is part of the National Strategic
Reference Framework (NSRF) 2014-2020.
1.37 The efficiency of the insolvency regime is closely intertwined with that of the judicial system.
This is especially important in Greece as the new insolvency framework passed in 2016 applies only to
proceedings started after 22 December 2016. This means that the large backlog of insolvencies (more than
200 000) accumulated up to then falls outside the remit of the new insolvency regime. Greece is among the
countries with the lengthiest trials and highest litigation rates (OECD, 2013). In addition, the World Bank's
0
6
12
18
24
30
0
20
40
60
80
100
Greece Italy OECD France Spain Austria Germany Belgium
Cos
t (%
of e
stat
e) &
Tim
e (y
ears
)
Rec
over
ate
rate
(ce
nts
on th
e do
llar)
Recovery Rate (cents on the dollar) Cost (% of estate) Time (years)
23
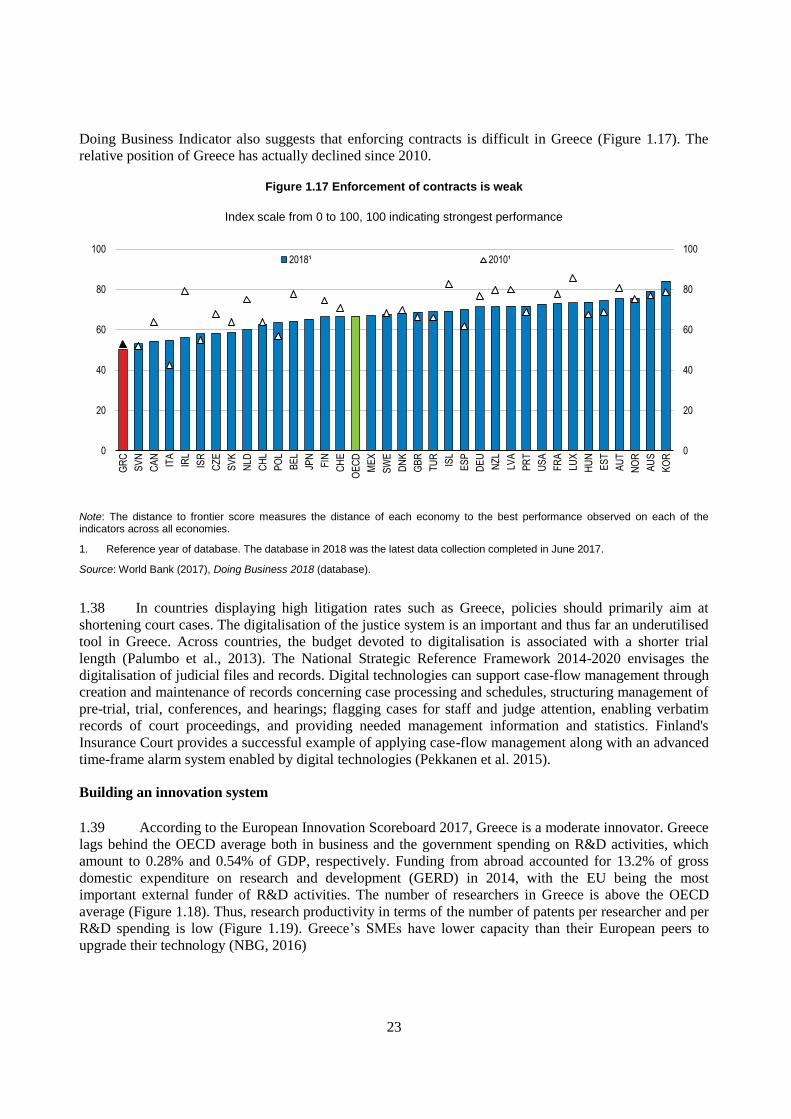
Doing Business Indicator also suggests that enforcing contracts is difficult in Greece (Figure 1.17). The
relative position of Greece has actually declined since 2010.
Figure 1.17 Enforcement of contracts is weak
Index scale from 0 to 100, 100 indicating strongest performance
Note: The distance to frontier score measures the distance of each economy to the best performance observed on each of the indicators across all economies.
1. Reference year of database. The database in 2018 was the latest data collection completed in June 2017.
Source: World Bank (2017), Doing Business 2018 (database).
1.38 In countries displaying high litigation rates such as Greece, policies should primarily aim at
shortening court cases. The digitalisation of the justice system is an important and thus far an underutilised
tool in Greece. Across countries, the budget devoted to digitalisation is associated with a shorter trial
length (Palumbo et al., 2013). The National Strategic Reference Framework 2014-2020 envisages the
digitalisation of judicial files and records. Digital technologies can support case-flow management through
creation and maintenance of records concerning case processing and schedules, structuring management of
pre-trial, trial, conferences, and hearings; flagging cases for staff and judge attention, enabling verbatim
records of court proceedings, and providing needed management information and statistics. Finland's
Insurance Court provides a successful example of applying case-flow management along with an advanced
time-frame alarm system enabled by digital technologies (Pekkanen et al. 2015).
Building an innovation system
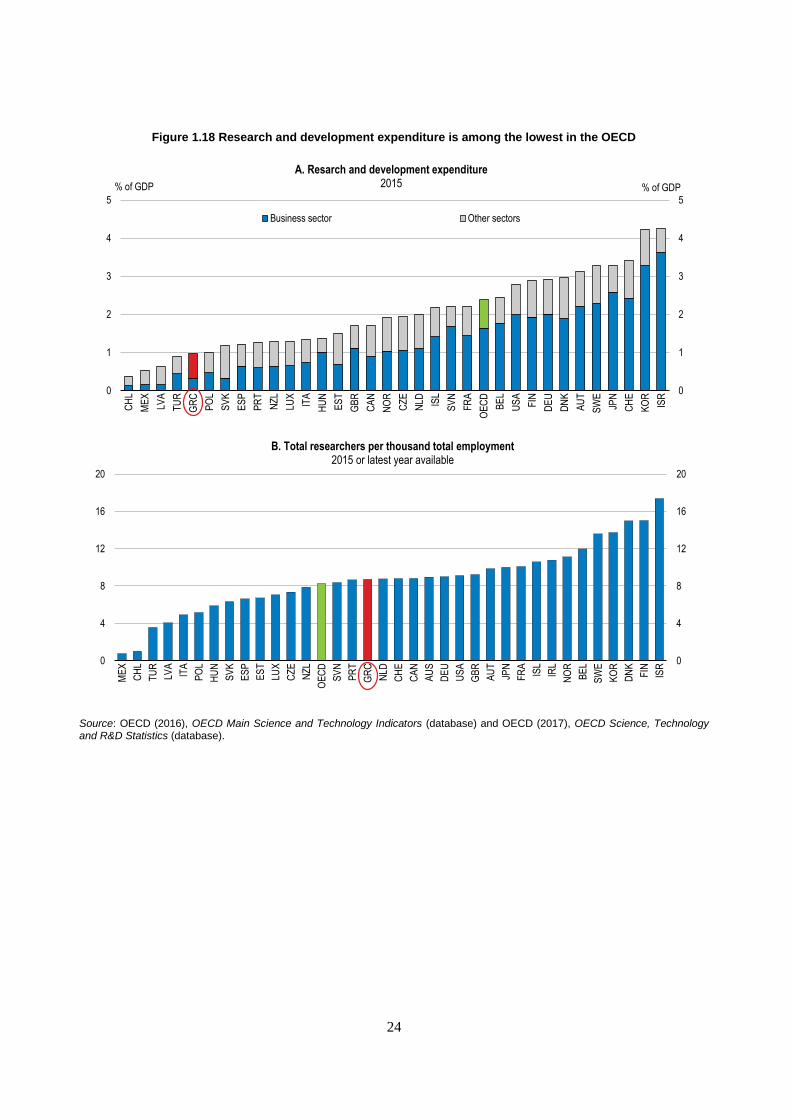
1.39 According to the European Innovation Scoreboard 2017, Greece is a moderate innovator. Greece
lags behind the OECD average both in business and the government spending on R&D activities, which
amount to 0.28% and 0.54% of GDP, respectively. Funding from abroad accounted for 13.2% of gross
domestic expenditure on research and development (GERD) in 2014, with the EU being the most
important external funder of R&D activities. The number of researchers in Greece is above the OECD
average (Figure 1.18). Thus, research productivity in terms of the number of patents per researcher and per
R&D spending is low (Figure 1.19). Greece’s SMEs have lower capacity than their European peers to
upgrade their technology (NBG, 2016)
0
20
40
60
80
100
0
20
40
60
80
100
GR
C
SV
N
CA
N
ITA
IRL
ISR
CZ
E
SV
K
NLD
CH
L
PO
L
BE
L
JPN
FIN
CH
E
OE
CD
ME
X
SW
E
DN
K
GB
R
TU
R
ISL
ES
P
DE
U
NZ
L
LVA
PR
T
US
A
FR
A
LUX
HU
N
ES
T
AU
T
NO
R
AU
S
KO
R
2018¹ 2010¹
24
Figure 1.18 Research and development expenditure is among the lowest in the OECD
Source: OECD (2016), OECD Main Science and Technology Indicators (database) and OECD (2017), OECD Science, Technology and R&D Statistics (database).
0
1
2
3
4
5
0
1
2
3
4
5
CH
L
ME
X
LVA
TU
R
GR
C
PO
L
SV
K
ES
P
PR
T
NZ
L
LUX
ITA
HU
N
ES
T
GB
R
CA
N
NO
R
CZ
E
NLD IS
L
SV
N
FR
A
OE
CD
BE
L
US
A
FIN
DE
U
DN
K
AU
T
SW
E
JPN
CH
E
KO
R
ISR
% of GDP% of GDP
A. Resarch and development expenditure2015
Business sector Other sectors
0
4
8
12
16
20
0
4
8
12
16
20
ME
X
CH
L
TU
R
LVA
ITA
PO
L
HU
N
SV
K
ES
P
ES
T
LUX
CZ
E
NZ
L
OE
CD
SV
N
PR
T
GR
C
NLD
CH
E
CA
N
AU
S
DE
U
US
A
GB
R
AU
T
JPN
FR
A
ISL
IRL
NO
R
BE
L
SW
E
KO
R
DN
K
FIN
ISR
B. Total researchers per thousand total employment2015 or latest year available
25
Figure 1.19 Research productivity is low
1. European Patent Office (EPO).
2. 2013 for Latvia, Iceland and the Slovak Republic. 2013 for Canada and Mexico and 2012 for Israel for the number of researchers only, due to lack of the data. For Switzerland, the number of researchers in 2014 is estimated based on available data in 2012 and 2015.
Source: OECD (2017), OECD Main Science and Technology Indicators (database) and Eurostat.
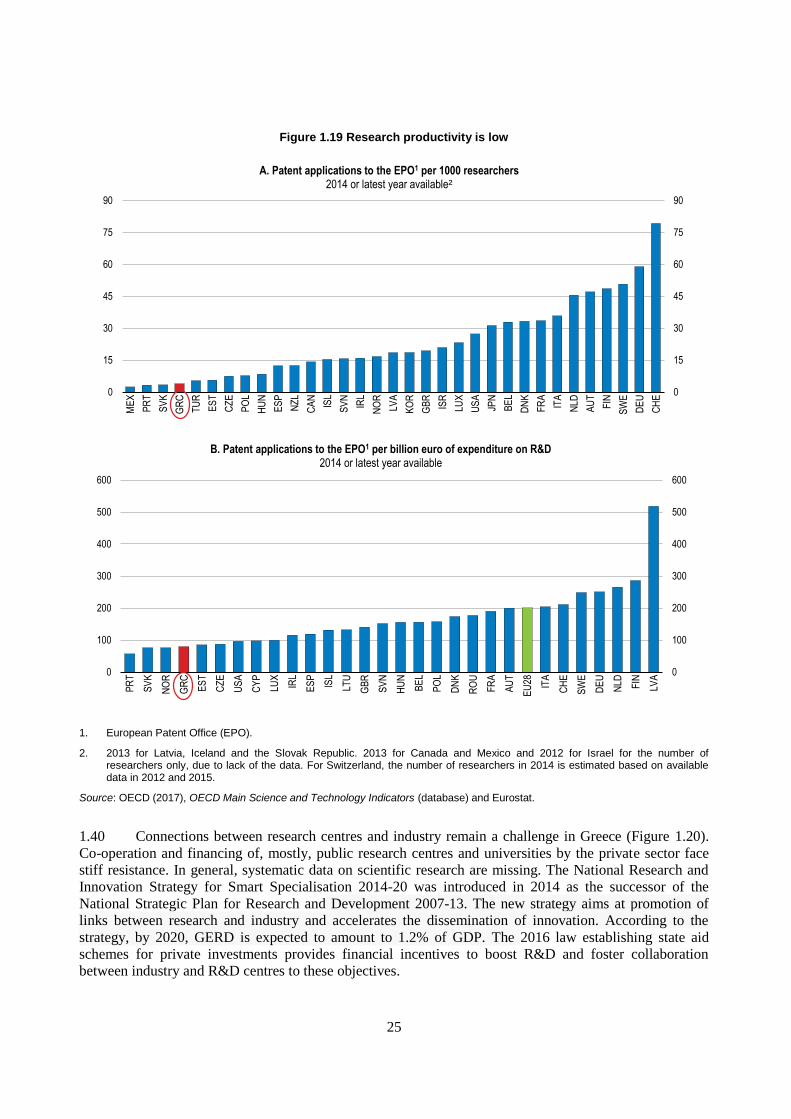
1.40 Connections between research centres and industry remain a challenge in Greece (Figure 1.20).
Co-operation and financing of, mostly, public research centres and universities by the private sector face
stiff resistance. In general, systematic data on scientific research are missing. The National Research and
Innovation Strategy for Smart Specialisation 2014-20 was introduced in 2014 as the successor of the
National Strategic Plan for Research and Development 2007-13. The new strategy aims at promotion of
links between research and industry and accelerates the dissemination of innovation. According to the
strategy, by 2020, GERD is expected to amount to 1.2% of GDP. The 2016 law establishing state aid
schemes for private investments provides financial incentives to boost R&D and foster collaboration
between industry and R&D centres to these objectives.
0
15
30
45
60
75
90
0
15
30
45
60
75
90
ME
X
PR
T
SV
K
GR
C
TU
R
ES
T
CZ
E
PO
L
HU
N
ES
P
NZ
L
CA
N
ISL
SV
N
IRL
NO
R
LVA
KO
R
GB
R
ISR
LUX
US
A
JPN
BE
L
DN
K
FR
A
ITA
NLD
AU
T
FIN
SW
E
DE
U
CH
E
A. Patent applications to the EPO1 per 1000 researchers2014 or latest year available²
0
100
200
300
400
500
600
0
100
200
300
400
500
600
PR
T
SV
K
NO
R
GR
C
ES
T
CZ
E
US
A
CY
P
LUX
IRL
ES
P
ISL
LTU
GB
R
SV
N
HU
N
BE
L
PO
L
DN
K
RO
U
FR
A
AU
T
EU
28 ITA
CH
E
SW
E
DE
U
NLD FIN
LVA
B. Patent applications to the EPO1 per billion euro of expenditure on R&D 2014 or latest year available
26
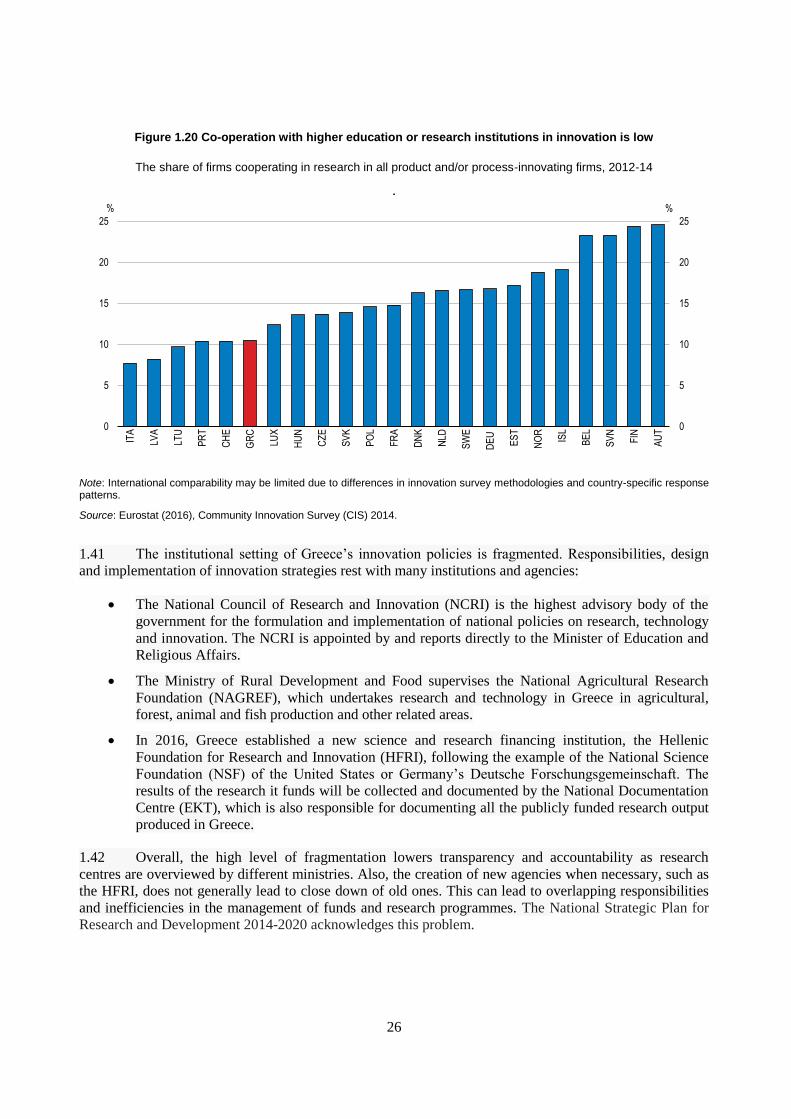
Figure 1.20 Co-operation with higher education or research institutions in innovation is low
The share of firms cooperating in research in all product and/or process-innovating firms, 2012-14
.
Note: International comparability may be limited due to differences in innovation survey methodologies and country-specific response patterns.
Source: Eurostat (2016), Community Innovation Survey (CIS) 2014.
1.41 The institutional setting of Greece’s innovation policies is fragmented. Responsibilities, design
and implementation of innovation strategies rest with many institutions and agencies:
The National Council of Research and Innovation (NCRI) is the highest advisory body of the
government for the formulation and implementation of national policies on research, technology
and innovation. The NCRI is appointed by and reports directly to the Minister of Education and
Religious Affairs.
The Ministry of Rural Development and Food supervises the National Agricultural Research
Foundation (NAGREF), which undertakes research and technology in Greece in agricultural,
forest, animal and fish production and other related areas.
In 2016, Greece established a new science and research financing institution, the Hellenic
Foundation for Research and Innovation (HFRI), following the example of the National Science
Foundation (NSF) of the United States or Germany’s Deutsche Forschungsgemeinschaft. The
results of the research it funds will be collected and documented by the National Documentation
Centre (EKT), which is also responsible for documenting all the publicly funded research output
produced in Greece.
1.42 Overall, the high level of fragmentation lowers transparency and accountability as research
centres are overviewed by different ministries. Also, the creation of new agencies when necessary, such as
the HFRI, does not generally lead to close down of old ones. This can lead to overlapping responsibilities
and inefficiencies in the management of funds and research programmes. The National Strategic Plan for
Research and Development 2014-2020 acknowledges this problem.
0
5
10
15
20
25
0
5
10
15
20
25
ITA
LVA
LTU
PR
T
CH
E
GR
C
LUX
HU
N
CZ
E
SV
K
PO
L
FR
A
DN
K
NLD
SW
E
DE
U
ES
T
NO
R
ISL
BE
L
SV
N
FIN
AU
T
%%
27
1.43 Government-funded research should be consolidated into one framework. Agencies should be
merged and line of responsibilities and accountabilities simplified. Simplification will help identify
strengths and weaknesses of research centres and projects and improve the allocation of funds.
1.44 The use and effective enforcement of intellectual property rights (IPRs) is another important
policy measure to encourage innovation. Evidence from six case studies on major innovations suggests that
IPRs contributed at least partially to R&D appropriation (WIPO, 2015). IPRs encourage disclosure (unlike
trade secrets) by allowing innovators to share technologies on terms they choose. As such IPRs enable the
development of technology markets. International bodies such as the World Trade Organisation (WTO)
and World Intellectual Property Organisation (WIPO) require their members to undertake binding
commitments to protect IPRs. The OECD has also developed guidelines on specific aspects of IPRs, such
as access to research data from public sources and licensing of inventions (OECD, 2007).
1.45 The IPRs regimes concern not only large and multinational enterprises but also innovative start-
ups and SMEs. Yet, in OECD countries SMEs tend to underutilise IPRs (OECD, 2015a). This is especially
problematic in Greece given the large share of micro-firms and SMEs, which lack resources and capacity
to file for patents. In this area recent important progress has involved the creation of the profession of
patent attorney, which will extend considerably the pool of professionals who, after having obtained the
required accreditation, can represent clients filing for patents. This change is expected to accelerate and
improve the quantity and quality of patent applications.
1.46 Public procurement is another tool that could be used to develop the innovation capacity of the
country. Good practices from OECD countries show that public procurement can be used to foster
innovation. For example, by specifying functional rather than technical criteria in calls for tenders, the
government could foster competition among firms that wish to provide the service in the most cost
effective way. In a recent survey among OECD countries (OECD, 2017h) almost 80% of responding
countries reported to support innovation through the procurement process; also half of them have
developed an action plan for innovation procurement. Greece is taking the first steps towards an action
plan to support innovation through public procurement. Its smart specialisation strategy 2014-2020
includes a programme on Pre-commercial Procurement, conducted by the General Secretariat for Research
and Technology (GSRT) and the Ministry of Education, Research and Religious Affairs. A pilot
programme is under preparation.
1.47 The measurement and impact assessment of actions related to procurement for innovation needs
to be established. There is currently no formalised system in place for doing so and there are no quantified
targets for procurement for innovation in Greece. Impact assessments, evaluation studies and/or studies of
state of play regarding procurement for innovation do exist, but their feedback is usually underutilised for
the improvement of the innovation system.
Reviving bank lending to firms
1.48 Bank lending rates have declined to pre-crisis levels after peaking in 2011. Their decline was
more moderate than in other Eurozone countries. To date, Greek lending rates remain well above those in
other EU countries and Greek banks' interest rate differential with EU countries is higher than in the pre-
crisis period (Figure 1.21).
1.49 Despite the gradual decline in lending rates, bank credit to non-financial corporations is still
falling (Figure 1.21 and Figure 1.22, Panel A). As of mid-2017, bank credit was at the same level as in
2006 or 30% below the 2009 peak. The 2015 uncertainties relating to the third EU adjustment programme
halted the recovery of bank credit that had started in 2014 (Figure 1.22, Panel A). On the supply side,
banks tightened credit standards as banks' risk perception rose and their risk tolerance declined (Figure
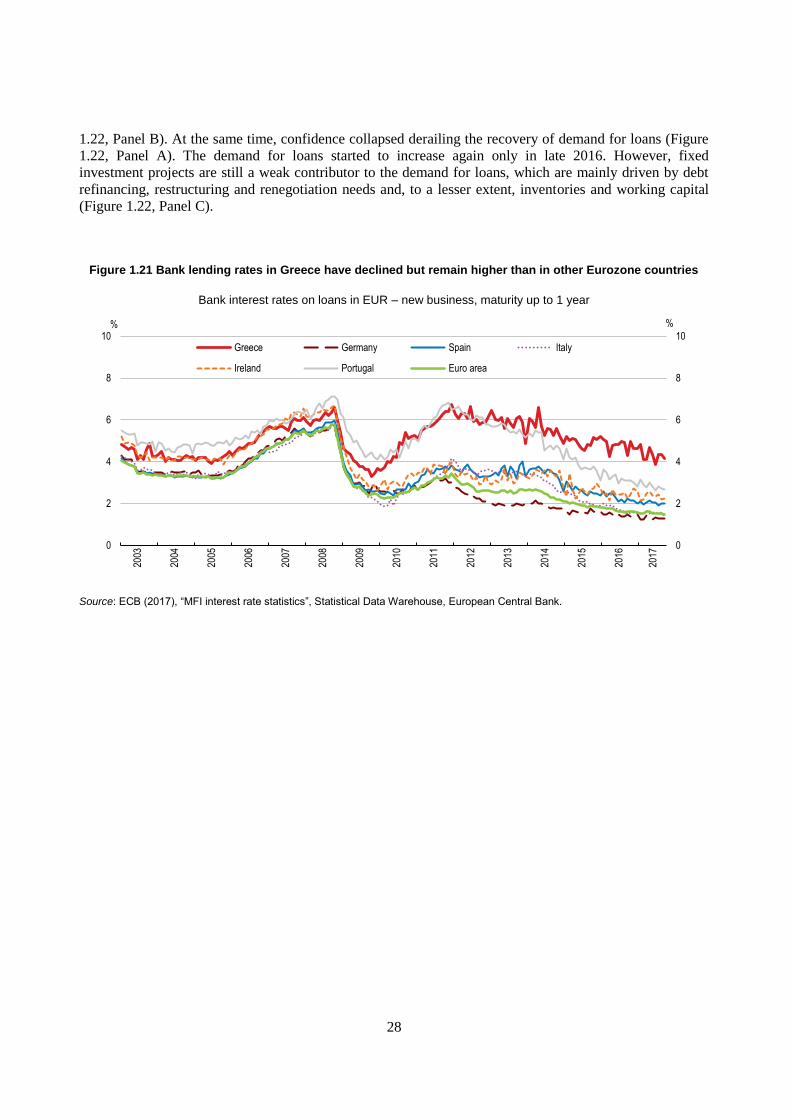
28
1.22, Panel B). At the same time, confidence collapsed derailing the recovery of demand for loans (Figure
1.22, Panel A). The demand for loans started to increase again only in late 2016. However, fixed
investment projects are still a weak contributor to the demand for loans, which are mainly driven by debt
refinancing, restructuring and renegotiation needs and, to a lesser extent, inventories and working capital
(Figure 1.22, Panel C).
Figure 1.21 Bank lending rates in Greece have declined but remain higher than in other Eurozone countries
Bank interest rates on loans in EUR – new business, maturity up to 1 year
Source: ECB (2017), “MFI interest rate statistics”, Statistical Data Warehouse, European Central Bank.
0
2
4
6
8
10
0
2
4
6
8
10
2003
2004
2005
2006
2007
2008
2009
2010
2011
2012
2013
2014
2015
2016
2017
%%
Greece Germany Spain Italy
Ireland Portugal Euro area
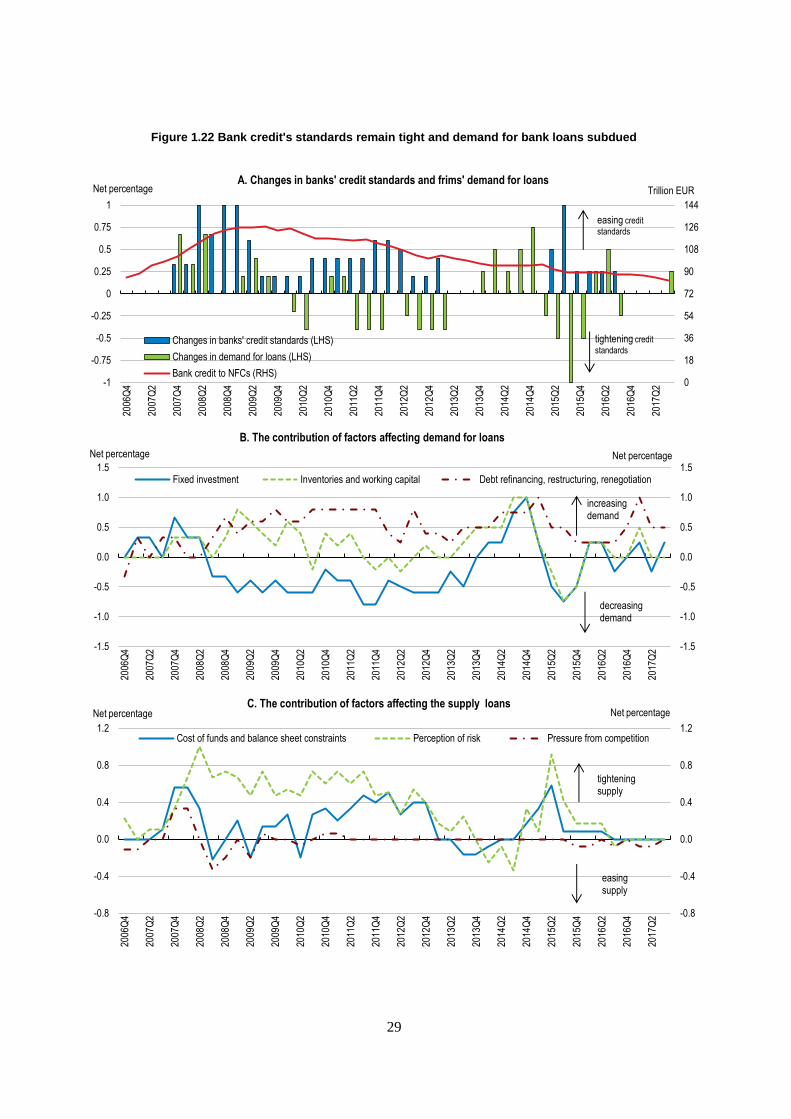
29
Figure 1.22 Bank credit's standards remain tight and demand for bank loans subdued
0
18
36
54
72
90
108
126
144
-1
-0.75
-0.5
-0.25
0
0.25
0.5
0.75
1
2006
Q4
2007
Q2
2007
Q4
2008
Q2
2008
Q4
2009
Q2
2009
Q4
2010
Q2
2010
Q4
2011
Q2
2011
Q4
2012
Q2
2012
Q4
2013
Q2
2013
Q4
2014
Q2
2014
Q4
2015
Q2
2015
Q4
2016
Q2
2016
Q4
2017
Q2
Trillion EURA. Changes in banks' credit standards and frims' demand for loans
Changes in banks' credit standards (LHS)
Changes in demand for loans (LHS)
Bank credit to NFCs (RHS)
Net percentage
-1.5
-1.0
-0.5
0.0
0.5
1.0
1.5
-1.5
-1.0
-0.5
0.0
0.5
1.0
1.5
2006
Q4
2007
Q2
2007
Q4
2008
Q2
2008
Q4
2009
Q2
2009
Q4
2010
Q2
2010
Q4
2011
Q2
2011
Q4
2012
Q2
2012
Q4
2013
Q2
2013
Q4
2014
Q2
2014
Q4
2015
Q2
2015
Q4
2016
Q2
2016
Q4
2017
Q2
B. The contribution of factors affecting demand for loans
Fixed investment Inventories and working capital Debt refinancing, restructuring, renegotiation
increasing demand
decreasing demand
easing credit
standards
tightening credit
standards
-0.8
-0.4
0.0
0.4
0.8
1.2
-0.8
-0.4
0.0
0.4
0.8
1.2
2006
Q4
2007
Q2
2007
Q4
2008
Q2
2008
Q4
2009
Q2
2009
Q4
2010
Q2
2010
Q4
2011
Q2
2011
Q4
2012
Q2
2012
Q4
2013
Q2
2013
Q4
2014
Q2
2014
Q4
2015
Q2
2015
Q4
2016
Q2
2016
Q4
2017
Q2
C. The contribution of factors affecting the supply loans
Cost of funds and balance sheet constraints Perception of risk Pressure from competition
Net percentageNet percentage
tightening supply
easing supply
Net percentage Net percentage
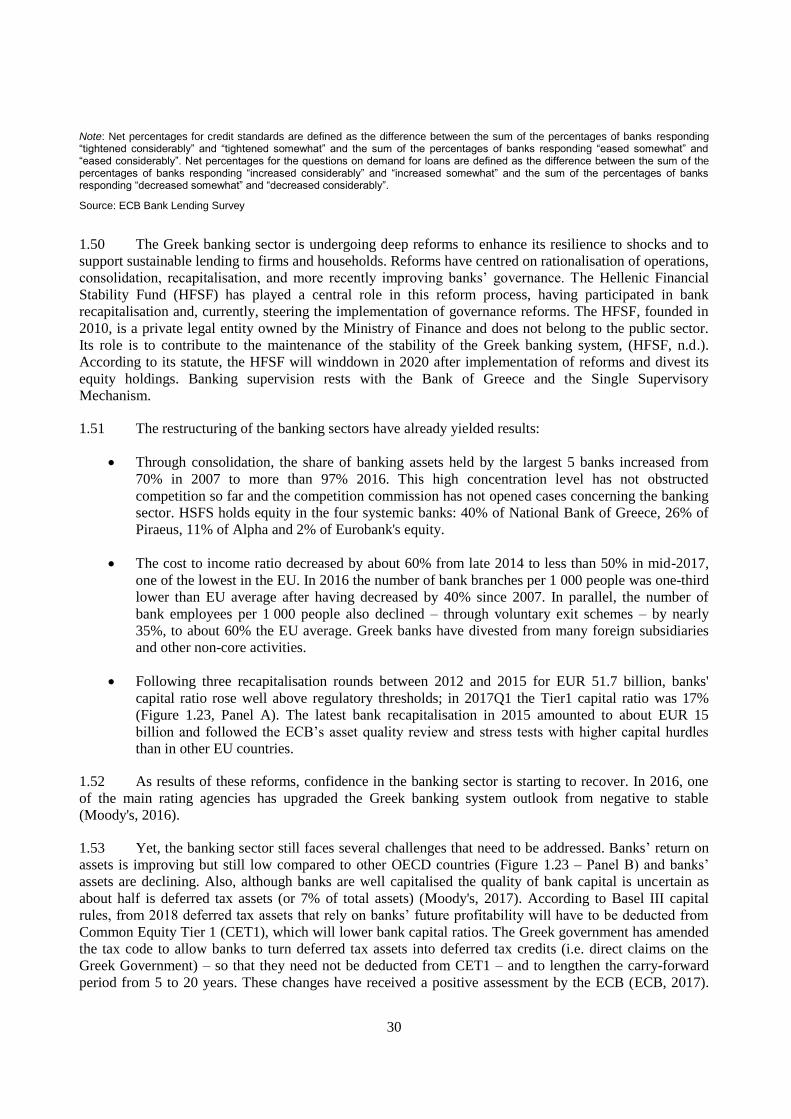
30
Note: Net percentages for credit standards are defined as the difference between the sum of the percentages of banks responding “tightened considerably” and “tightened somewhat” and the sum of the percentages of banks responding “eased somewhat” and “eased considerably”. Net percentages for the questions on demand for loans are defined as the difference between the sum of the percentages of banks responding “increased considerably” and “increased somewhat” and the sum of the percentages of banks responding “decreased somewhat” and “decreased considerably”.
Source: ECB Bank Lending Survey
1.50 The Greek banking sector is undergoing deep reforms to enhance its resilience to shocks and to
support sustainable lending to firms and households. Reforms have centred on rationalisation of operations,
consolidation, recapitalisation, and more recently improving banks’ governance. The Hellenic Financial
Stability Fund (HFSF) has played a central role in this reform process, having participated in bank
recapitalisation and, currently, steering the implementation of governance reforms. The HFSF, founded in
2010, is a private legal entity owned by the Ministry of Finance and does not belong to the public sector.
Its role is to contribute to the maintenance of the stability of the Greek banking system, (HFSF, n.d.).
According to its statute, the HFSF will winddown in 2020 after implementation of reforms and divest its
equity holdings. Banking supervision rests with the Bank of Greece and the Single Supervisory
Mechanism.
1.51 The restructuring of the banking sectors have already yielded results:
Through consolidation, the share of banking assets held by the largest 5 banks increased from
70% in 2007 to more than 97% 2016. This high concentration level has not obstructed
competition so far and the competition commission has not opened cases concerning the banking
sector. HSFS holds equity in the four systemic banks: 40% of National Bank of Greece, 26% of
Piraeus, 11% of Alpha and 2% of Eurobank's equity.
The cost to income ratio decreased by about 60% from late 2014 to less than 50% in mid-2017,
one of the lowest in the EU. In 2016 the number of bank branches per 1 000 people was one-third
lower than EU average after having decreased by 40% since 2007. In parallel, the number of
bank employees per 1 000 people also declined – through voluntary exit schemes – by nearly
35%, to about 60% the EU average. Greek banks have divested from many foreign subsidiaries
and other non-core activities.
Following three recapitalisation rounds between 2012 and 2015 for EUR 51.7 billion, banks'
capital ratio rose well above regulatory thresholds; in 2017Q1 the Tier1 capital ratio was 17%
(Figure 1.23, Panel A). The latest bank recapitalisation in 2015 amounted to about EUR 15
billion and followed the ECB’s asset quality review and stress tests with higher capital hurdles
than in other EU countries.
1.52 As results of these reforms, confidence in the banking sector is starting to recover. In 2016, one
of the main rating agencies has upgraded the Greek banking system outlook from negative to stable
(Moody's, 2016).
1.53 Yet, the banking sector still faces several challenges that need to be addressed. Banks’ return on
assets is improving but still low compared to other OECD countries (Figure 1.23 – Panel B) and banks’
assets are declining. Also, although banks are well capitalised the quality of bank capital is uncertain as
about half is deferred tax assets (or 7% of total assets) (Moody's, 2017). According to Basel III capital
rules, from 2018 deferred tax assets that rely on banks’ future profitability will have to be deducted from
Common Equity Tier 1 (CET1), which will lower bank capital ratios. The Greek government has amended
the tax code to allow banks to turn deferred tax assets into deferred tax credits (i.e. direct claims on the
Greek Government) – so that they need not be deducted from CET1 – and to lengthen the carry-forward
period from 5 to 20 years. These changes have received a positive assessment by the ECB (ECB, 2017).
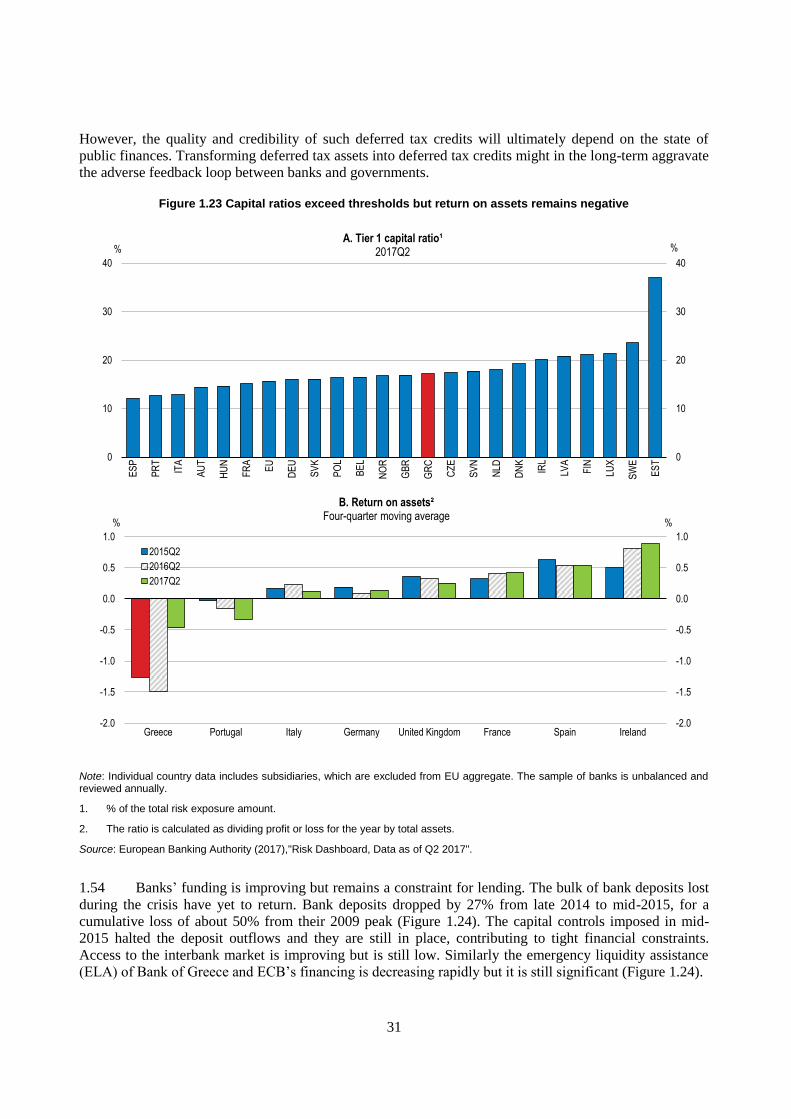
31
However, the quality and credibility of such deferred tax credits will ultimately depend on the state of
public finances. Transforming deferred tax assets into deferred tax credits might in the long-term aggravate
the adverse feedback loop between banks and governments.
Figure 1.23 Capital ratios exceed thresholds but return on assets remains negative
Note: Individual country data includes subsidiaries, which are excluded from EU aggregate. The sample of banks is unbalanced and reviewed annually.
1. % of the total risk exposure amount.
2. The ratio is calculated as dividing profit or loss for the year by total assets.
Source: European Banking Authority (2017),"Risk Dashboard, Data as of Q2 2017".
1.54 Banks’ funding is improving but remains a constraint for lending. The bulk of bank deposits lost
during the crisis have yet to return. Bank deposits dropped by 27% from late 2014 to mid-2015, for a
cumulative loss of about 50% from their 2009 peak (Figure 1.24). The capital controls imposed in mid-
2015 halted the deposit outflows and they are still in place, contributing to tight financial constraints.
Access to the interbank market is improving but is still low. Similarly the emergency liquidity assistance
(ELA) of Bank of Greece and ECB’s financing is decreasing rapidly but it is still significant (Figure 1.24).
0
10
20
30
40
0
10
20
30
40
ES
P
PR
T
ITA
AU
T
HU
N
FR
A
EU
DE
U
SV
K
PO
L
BE
L
NO
R
GB
R
GR
C
CZ
E
SV
N
NLD
DN
K
IRL
LVA
FIN
LUX
SW
E
ES
T
%%A. Tier 1 capital ratio¹
2017Q2
-2.0
-1.5
-1.0
-0.5
0.0
0.5
1.0
-2.0
-1.5
-1.0
-0.5
0.0
0.5
1.0
Greece Portugal Italy Germany United Kingdom France Spain Ireland
%%
B. Return on assets²Four-quarter moving average
2015Q2
2016Q2
2017Q2
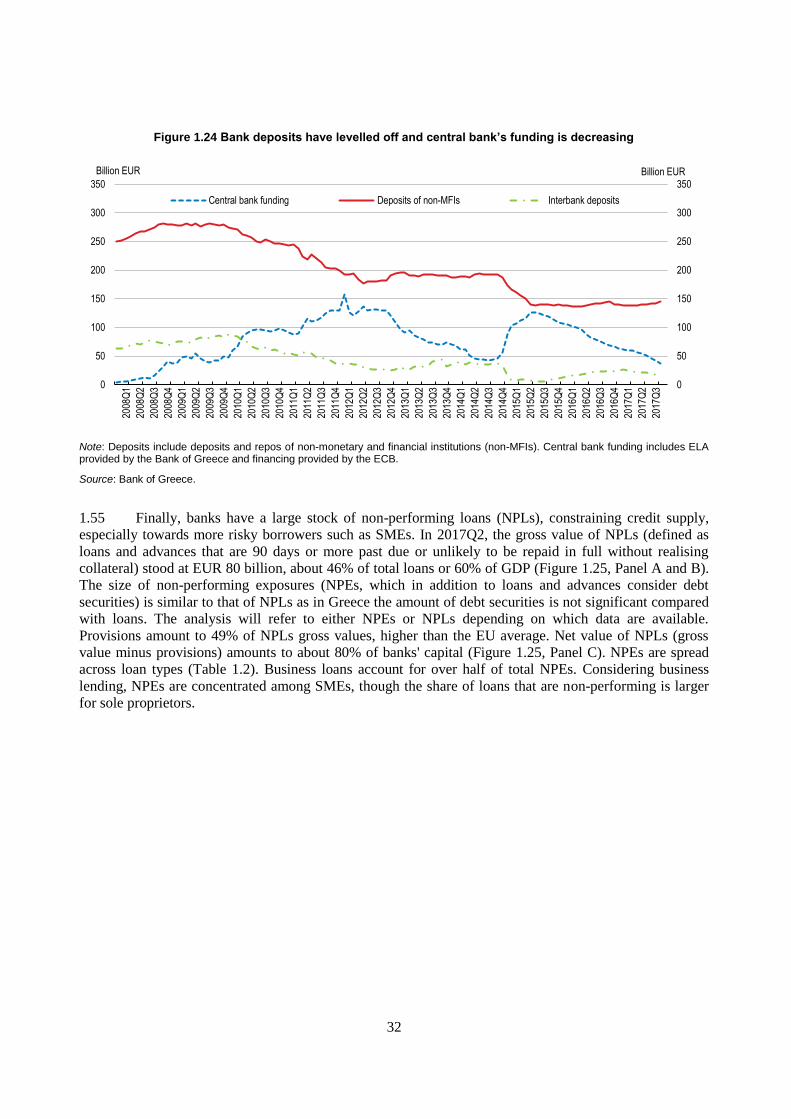
32
Figure 1.24 Bank deposits have levelled off and central bank’s funding is decreasing
Note: Deposits include deposits and repos of non-monetary and financial institutions (non-MFIs). Central bank funding includes ELA provided by the Bank of Greece and financing provided by the ECB.
Source: Bank of Greece.
1.55 Finally, banks have a large stock of non-performing loans (NPLs), constraining credit supply,
especially towards more risky borrowers such as SMEs. In 2017Q2, the gross value of NPLs (defined as
loans and advances that are 90 days or more past due or unlikely to be repaid in full without realising
collateral) stood at EUR 80 billion, about 46% of total loans or 60% of GDP (Figure 1.25, Panel A and B).
The size of non-performing exposures (NPEs, which in addition to loans and advances consider debt
securities) is similar to that of NPLs as in Greece the amount of debt securities is not significant compared
with loans. The analysis will refer to either NPEs or NPLs depending on which data are available.
Provisions amount to 49% of NPLs gross values, higher than the EU average. Net value of NPLs (gross
value minus provisions) amounts to about 80% of banks' capital (Figure 1.25, Panel C). NPEs are spread
across loan types (Table 1.2). Business loans account for over half of total NPEs. Considering business
lending, NPEs are concentrated among SMEs, though the share of loans that are non-performing is larger
for sole proprietors.
0
50
100
150
200
250
300
350
0
50
100
150
200
250
300
350
2008
Q1
2008
Q2
2008
Q3
2008
Q4
2009
Q1
2009
Q2
2009
Q3
2009
Q4
2010
Q1
2010
Q2
2010
Q3
2010
Q4
2011
Q1
2011
Q2
2011
Q3
2011
Q4
2012
Q1
2012
Q2
2012
Q3
2012
Q4
2013
Q1
2013
Q2
2013
Q3
2013
Q4
2014
Q1
2014
Q2
2014
Q3
2014
Q4
2015
Q1
2015
Q2
2015
Q3
2015
Q4
2016
Q1
2016
Q2
2016
Q3
2016
Q4
2017
Q1
2017
Q2
2017
Q3
Billion EURBillion EUR
Central bank funding Deposits of non-MFIs Interbank deposits
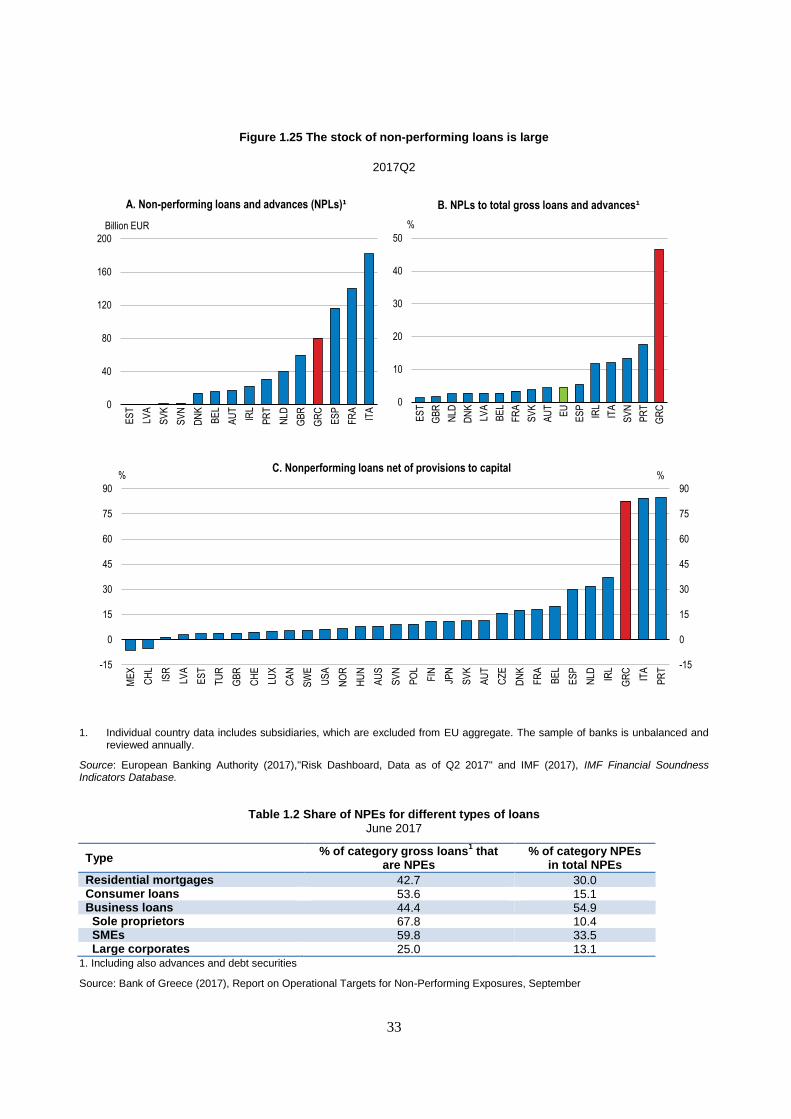
33
Figure 1.25 The stock of non-performing loans is large
2017Q2
1. Individual country data includes subsidiaries, which are excluded from EU aggregate. The sample of banks is unbalanced and reviewed annually.
Source: European Banking Authority (2017),"Risk Dashboard, Data as of Q2 2017" and IMF (2017), IMF Financial Soundness Indicators Database.
Table 1.2 Share of NPEs for different types of loans
June 2017
Type % of category gross loans
1 that
are NPEs % of category NPEs
in total NPEs
Residential mortgages 42.7 30.0 Consumer loans 53.6 15.1 Business loans 44.4 54.9 Sole proprietors 67.8 10.4 SMEs 59.8 33.5 Large corporates 25.0 13.1
1. Including also advances and debt securities
Source: Bank of Greece (2017), Report on Operational Targets for Non-Performing Exposures, September
0
40
80
120
160
200
ES
T
LVA
SV
K
SV
N
DN
K
BE
L
AU
T
IRL
PR
T
NLD
GB
R
GR
C
ES
P
FR
A
ITA
A. Non-performing loans and advances (NPLs)¹
Billion EUR
0
10
20
30
40
50
ES
T
GB
R
NLD
DN
K
LVA
BE
L
FR
A
SV
K
AU
T
EU
ES
P
IRL
ITA
SV
N
PR
T
GR
C
%
B. NPLs to total gross loans and advances¹
-15
0
15
30
45
60
75
90
-15
0
15
30
45
60
75
90
ME
X
CH
L
ISR
LVA
ES
T
TU
R
GB
R
CH
E
LUX
CA
N
SW
E
US
A
NO
R
HU
N
AU
S
SV
N
PO
L
FIN
JPN
SV
K
AU
T
CZ
E
DN
K
FR
A
BE
L
ES
P
NLD IR
L
GR
C
ITA
PR
T
%%C. Nonperforming loans net of provisions to capital
34
1.56 The rise in NPEs is partly attributable to the deep and prolonged crisis and bank governance
problems. Private debt relative to GDP and the share of loans to non-financial corporations remain low
compared to other OECD countries but the long crisis has eroded the capacity of households and
businesses to pay their debts. Also, even before the onset of the crisis the NPL ratio in Greece was 4.5% (in
2007) higher than the 3% average for the euro area (HBA, 2017). This suggests bank governance problems
and deficient risk management contributed to misallocate credit. The IMF’s 2006 Financial Stability
Report (IMF, 2006) underlined limited capabilities across banks and lack of data for performing effective
risk management, provisioning policies not aligned with risk exposures, high level of NPLs compared with
euro area countries.
Bank governance is improving
1.57 To reap the full benefits of the banking sector reforms banks’ governance will have to improve.
Poor corporate governance has allowed close links between banks, business and political interests to
proliferate, skewing lending decisions and contributing to the rise in NPLs. Eligibility criteria for banks'
boards were weak, resulting in poor management. Credit risks were not properly assessed due to
insufficient risk controls, lack of data and uneven use of credit-scoring methodologies (IMF, 2006).
1.58 The HFSF is implementing corporate governance reforms. It is reviewing the four systemic
banks’ adoption of new corporate governance standards and recommending changes. Reforms have made
progress since the banks were consolidated and recapitalised in 2015. In 2016, the four systemic banks
replaced many members of their boards to conform to the new strict ‘fit and proper’ criteria. The HFSF is
leading an in-depth review of the governance and performance of the four systemic banks' boards of
directors and their committees, which aims to establish at the board level a culture of evaluation and a
focus on managing NPLs. Building on the board assessment already undertaken in 2016, the new review
aims at establishing an evaluation culture and discipline at the board level, and evaluating risk- and audit-
board committees with particular focus on non-performing loan management.
1.59 Further progress on corporate governance is a precondition for HFSF to divest its equity holdings
in the banks by 2020. After the conclusion of the in-depth review of the governance framework and
performance of the banks' board of directors, the HFSF should pursue its recommendations and continue to
align corporate governance standards with international best practices. The government should ensure
HFSF’s continued independence and authority to fully implement the compulsory corporate governance
standards. In the last two years, directors and senior executive turnover at HFSF was high. This may have
hampered HFSF’s regular reporting and operations. There should be more stability in HFSF’s senior
management, while ensuring that senior managers meet strict fit and proper criteria.
Reducing non-performing loans
1.60 Reducing NPLs is paramount to restore the banking sector to health and revive bank credit. NPEs
restrict credit supply through two main channels: lowering profitability and tying up capital as impaired
assets carry higher risk weights (Ayirat et al., 2015).
1.61 Accelerating their disposal hinges on complementary policies (Aiyar et al., 2015a; Liu and
Rosenbeg, 2013): (i) tightening regulatory policies; (ii) developing a market for distressed debt. Improving
insolvency and debt restructuring proceedings is also important and discussed in a separate section.
Urgency is needed as lowering NPLs to pre-crisis levels will take considerable time. The recent experience
of Ireland and Spain shows that NPLs start declining only 2 to 3 years after the first decisive actions
(ECOFIN, 2017).
35
Tightening regulatory policy
1.62 Banks' supervisors have taken several steps to improve the regulatory framework of NPLs. Initial
improvements by the BoG were informed by diagnostic studies commissioned in 2013 and 2015 to a
private sector firm to assess the quality of the loan portfolio of Greek banks, review existing forbearance
measures and foreclosure solutions and assess the capacity of banks to deal with impaired loans in an
effective way (NBG, 2014; Plaskovitis, 2016). The main findings pointed to the predominance of
forbearance measures, limited use of foreclosures, delays in handling denounced loans (i.e. loans where the
contract has been terminated), and insufficient portfolio segmentation.
1.63 Following this assessment, the BoG has issued new and detailed supervisory guidance on NPLs,
including a new reporting framework which goes well beyond the European Banking Authority’s
guidelines (ECB, 2016; BoG). In line with the ECB's guidance (ECB, 2017), it requires banks to develop
NPL reduction strategies, including quantitative targets (Table 1.3) and to establish dedicated units to
manage NPLs.
1.64 The introduction of quantitative NPL disposal targets is an important step forward. Setting and
enforcing targets is the approach followed by Ireland and Cyprus after the crisis and Japan in the late 1990s
and early 2000s to reducing large stocks of NPLs. According to Greek banks’ current targets, the NPL ratio
should drop to 42% in 2018 and 34% in 2019 (BoG 2017). These targets expect most NPLs will be cured
as the economy improves (i.e. they will become performing loans). Write-offs are also expected to play an
important role, with limited roles for liquidations, collections and loan sales.
1.65 So far banks have been able to meet NPL disposal targets. But banks expect NPL inflows to
remain high. The targets become more ambitious from 2018. Supervisors should ensure that targets are
realistic. They should provide robust, proactive and intrusive supervision to ensure prudent NPL
recognition and provisioning as well as strong capital buffers, as highlighted by a recent ECOFIN report on
NPLs (ECOFIN, 2017). Non-compliance with NPL targets should trigger supervisory measures, speeding
up bank restructuring. Moreover, efforts should be pursued to enhance the capacity of banks to manage
NPLs internally, which is still low. Supervisors need to ensure independent internal units specialising in
the management and recovery of NPLs are established in all major banks and that they are well resourced.
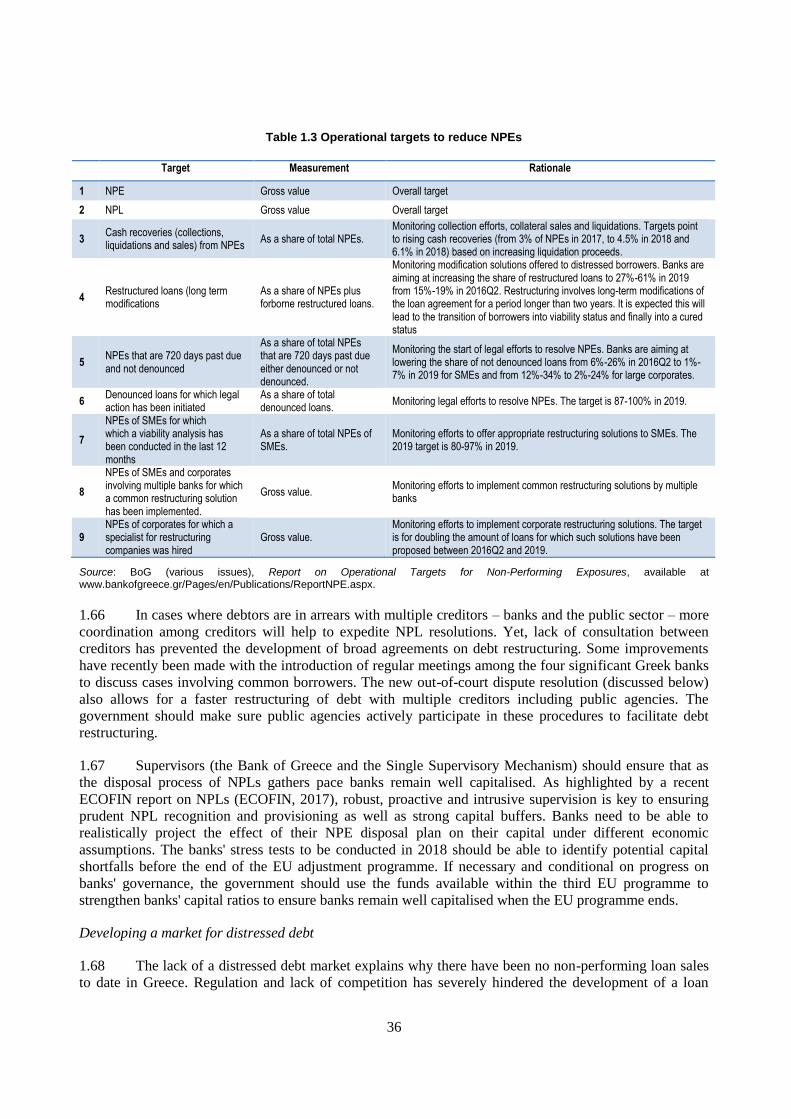
36
Table 1.3 Operational targets to reduce NPEs
Target Measurement Rationale
1 NPE Gross value Overall target
2 NPL Gross value Overall target
3 Cash recoveries (collections, liquidations and sales) from NPEs
As a share of total NPEs. Monitoring collection efforts, collateral sales and liquidations. Targets point to rising cash recoveries (from 3% of NPEs in 2017, to 4.5% in 2018 and 6.1% in 2018) based on increasing liquidation proceeds.
4 Restructured loans (long term modifications
As a share of NPEs plus forborne restructured loans.
Monitoring modification solutions offered to distressed borrowers. Banks are aiming at increasing the share of restructured loans to 27%-61% in 2019 from 15%-19% in 2016Q2. Restructuring involves long-term modifications of the loan agreement for a period longer than two years. It is expected this will lead to the transition of borrowers into viability status and finally into a cured status
5 NPEs that are 720 days past due and not denounced
As a share of total NPEs that are 720 days past due either denounced or not denounced.
Monitoring the start of legal efforts to resolve NPEs. Banks are aiming at lowering the share of not denounced loans from 6%-26% in 2016Q2 to 1%-7% in 2019 for SMEs and from 12%-34% to 2%-24% for large corporates.
6 Denounced loans for which legal action has been initiated
As a share of total denounced loans.
Monitoring legal efforts to resolve NPEs. The target is 87-100% in 2019.
7
NPEs of SMEs for which which a viability analysis has been conducted in the last 12 months
As a share of total NPEs of SMEs.
Monitoring efforts to offer appropriate restructuring solutions to SMEs. The 2019 target is 80-97% in 2019.
8
NPEs of SMEs and corporates involving multiple banks for which a common restructuring solution has been implemented.
Gross value. Monitoring efforts to implement common restructuring solutions by multiple banks
9 NPEs of corporates for which a specialist for restructuring companies was hired
Gross value. Monitoring efforts to implement corporate restructuring solutions. The target is for doubling the amount of loans for which such solutions have been proposed between 2016Q2 and 2019.
Source: BoG (various issues), Report on Operational Targets for Non-Performing Exposures, available at www.bankofgreece.gr/Pages/en/Publications/ReportNPE.aspx.
1.66 In cases where debtors are in arrears with multiple creditors – banks and the public sector – more
coordination among creditors will help to expedite NPL resolutions. Yet, lack of consultation between
creditors has prevented the development of broad agreements on debt restructuring. Some improvements
have recently been made with the introduction of regular meetings among the four significant Greek banks
to discuss cases involving common borrowers. The new out-of-court dispute resolution (discussed below)
also allows for a faster restructuring of debt with multiple creditors including public agencies. The
government should make sure public agencies actively participate in these procedures to facilitate debt
restructuring.
1.67 Supervisors (the Bank of Greece and the Single Supervisory Mechanism) should ensure that as
the disposal process of NPLs gathers pace banks remain well capitalised. As highlighted by a recent
ECOFIN report on NPLs (ECOFIN, 2017), robust, proactive and intrusive supervision is key to ensuring
prudent NPL recognition and provisioning as well as strong capital buffers. Banks need to be able to
realistically project the effect of their NPE disposal plan on their capital under different economic
assumptions. The banks' stress tests to be conducted in 2018 should be able to identify potential capital
shortfalls before the end of the EU adjustment programme. If necessary and conditional on progress on
banks' governance, the government should use the funds available within the third EU programme to
strengthen banks' capital ratios to ensure banks remain well capitalised when the EU programme ends.
Developing a market for distressed debt
1.68 The lack of a distressed debt market explains why there have been no non-performing loan sales
to date in Greece. Regulation and lack of competition has severely hindered the development of a loan
37
servicing (i.e. loan administration) industry in Greece. A new law regulating non-bank loan servicers was
approved only in 2015 (Law 4354/2015) and the BoG issued implementing regulation in 2016. This is the
first attempt in Greece to foster a secondary market for distressed debts (Sakkas and Bazinas, 2016). The
new law and implementing regulation follow international best practices as they allow for the licensing of
loan servicing activities to nonbank entities, thus lowering the cost of entry into this industry (IMF, 2015).
The BoG is responsible for issuing licences, based on pre-defined criteria, and revoking them in the case of
infringements (e.g.: fraud). Licensed servicers will have to abide by the supervisory framework for NPLs
issued by the BoG. They will be able to operate in three areas: management, transfer (i.e. purchase) and
refinancing of loans. Refinancing will require an additional license from the BoG. The possibility of
restructuring and refinancing non-performing loans is a key aspect of the reform as it enables licensed
servicers to turn around distressed borrowers by offering new loans. This possibility can then help enlarge
non-bank sources of finance and improve access to finance by distressed borrowers. However, the
legislation on loan servicing only concerns large corporate loans and does not apply to SME loans,
consumer loans or primary residence mortgages.
1.69 The recent increase in the number of licensed loan services is welcome and will help to develop a
distressed debt markets. Allowing loan servicers to manage or purchase SME loans would accelerate
resolution of distressed debt given the large number of distressed SME borrowers in Greece. Japan
provides a good example of developing a distressed debt market in a relationship banking environment
with many SMEs.
1.70 Tax incentives for banks to dispose of NPLs need to be clarified and streamlined. Loan servicing
legislation introduced some tax-related provisions, but these are partly inconsistent with those provided by
the 2003 securitisation law and are less advantageous. The 2003 securitisation law offered full tax
exemption on loans transfers (HFSF, 2016). Instead, the loan servicing legislation offers less generous
incentives (Watson Farley & Williams, 2016). Aligning the tax incentives provided by the loan servicing
industry legislation with those of the securitisation law would enhance tax transparency and encourage the
disposal of non-performing loans. Clear tax incentives are an important tool to support prices of non-
performing loans in the secondary market (KPMG, 2016). Making them temporary, with for instance
sunset clauses, could accelerate their effects.
1.71 Facilitating and expediting the sales of collateral would also help create a distressed debt market.
Greece’s tax code provides no tax incentives to speed up collateral sales (ECB, 2016). The start of e-
auctions is a welcome, if delayed, development. The United States has a well-developed distressed debt
market (Altman, 2012; Aiyar et al., 2015a, 2015b). Following GAAP rules on the treatment of NPLs, US
banks are obliged to: 1) suspend the accrual of interest income from NPLs after 90 days past due on
payment or if the loan is deemed uncollectable; and 2) write down of NPLs to the collateral value after 6
months, with the collateral value based on the current price and no account for any forecast increase in
market valuation. As results, the United States debt market, has contributed to keeping the stock of NPLs
low. NPLs peaked at 5% of gross loans in 2009 and have since then declined to below 2%.
1.72 The timely and smooth introduction of the International Financial Reporting Standard (IFRS) rule
(IFRS9), planned for 2018, could help develop a distressed debt market. IFRS9 will introduce a new
approach for the valuation of financial assets and liabilities, including a forward-looking expected loss
value of impaired loans. This is radically different from the current, backward looking approach of Greek
(and EU) banks (IAS39). Current rules also allow for the accrual of interest income from NPLs, thus
inflating banks’ profitability and discouraging the write off of NPLs, and do not provide clear guidance for
the valuation of collateral.
38
Enhancing public investment
1.73 Public investment in Greece decreased drastically early in the crisis, as in other crisis-hit
countries. From 2011 onwards public investment started to recover and reached a level above that of Italy,
Portugal, Spain and the EU28 average (Figure 1.26). However, resources allocated to the public investment
programme continued to shrink, from EUR 6.65 billion in 2013 to EUR 6.29 billion in 2016.
Figure 1.26. Public investment has fallen
General government gross fixed capital formation as % of GDP
Source: Eurostat (2017), Government statistics (database).
1.74 Public investment is largely co-financed by EU funds. Between 2010 and 2017, public
investment co-financed by the EU accounted for more than 70% of total public investment (Figure 1.27).
The large share of EU funds protected investment from more severe cuts during the crisis. As a result, the
share of public investment in total expenditure remained relatively stable between 2013 and 2017 in the
range of 11-12% (Figure 1.28).
0
1
2
3
4
5
6
7
0
1
2
3
4
5
6
7
2007 2008 2009 2010 2011 2012 2013 2014 2015 2016
% %
Greece Spain France Italy Portugal EU28
39
Figure 1.27. EU co-financing of public investment spending is sizeable
Public Investment Programme (PIP) cash expenditure
Source: Ministry of Finance and State General Accounting Office.
Figure 1.28.The share of public investment in total budget expenditure remains stable
Public investment budget expenditure as % of total budget expenditure
Source: Ministry of Finance, State General Accounting Office and Bank of Greece.
1.75 EU funds for public investment will remain significant in the coming years. For the 2014-2020
programming period, the European Structural Investment Funds allocated EUR 4.3 billion to environment
protection and resource efficiency, EUR 2.5 billion to transport and energy networks and EUR 0.8 billion
to information and communication technology. The government plans to raise public investment that is not
co-financed by the EU from EUR 0.8 billion in 2016 to EUR 1 billion in 2017-18 and EUR 1.5 billion
from 2019-21.
0.0
1.5
3.0
4.5
6.0
7.5
9.0
0.0
1.5
3.0
4.5
6.0
7.5
9.0
2014 2015 2016 2017 2018 2019 2020 2021
Trillion EURTrillion EUR
Co-financed with the EU Domestic (no co-financement) Total
0
2
4
6
8
10
12
0
2
4
6
8
10
12
2012 2013 2014 2015 2016 2017
40
1.76 Greece’s public investment needs are large as the public-capital stock is low. In 2013 it stood at
45% of GDP against the OECD average of 49%. Also, the perception of Greece’s infrastructure quality
still lags that of most OECD countries, especially for railways (Figure 1.29). Moreover, poor intermodal
connections – especially between ports and railways – in addition to cumbersome customs procedures and
low competences, the low quality of logistics services hamper logistics (Figure 1.30). These problems raise
trade costs. In Greece the export lead time (the time between the placing of an order and the receipt of the
goods) is 3 days for port and airport transportation and 6 days for rail and road transportation, against 2
days on average in high income OECD countries. A similar gap exists for import lead times (World Bank,
2017).
Figure 1.29. Infrastructure lags other countries
Global Competitiveness Index, scale from 1 to 7 (best), 20017-18
1. Unweighted average.
Source: World Economic Forum, "The Global Competitiveness Report 2017-2018".
0
1
2
3
4
5
6
7
CZ
EH
UN
BE
LG
RC
ITA
IRL
AU
SO
EC
D¹
GB
RC
AN
DN
KD
EU
ES
PS
WE
US
AA
UT
FR
AP
RT
JPN
NLD
CH
EA. Roads
0
1
2
3
4
5
6
7
HU
NC
ZE
AU
TIT
AG
RC
CH
EA
US
OE
CD
¹F
RA
IRL
PR
TJP
NC
AN
DE
UE
SP
SW
EG
BR
DN
KU
SA
BE
LN
LD
C. Ports
0
1
2
3
4
5
6
7
HU
NIT
AG
RC
AU
SA
UT
CZ
EO
EC
D¹
IRL
PR
TG
BR
JPN
BE
LF
RA
DE
UE
SP
SW
EC
AN
US
AD
NK
CH
EN
LD
D. Air transport
0
1
2
3
4
5
6
7
GR
CH
UN
IRL
AU
SIT
AP
RT
CZ
EO
EC
D¹
DN
KS
WE
GB
RB
EL
CA
NA
UT
DE
UE
SP
US
AF
RA
NLD
JPN
CH
E
B. Railroad
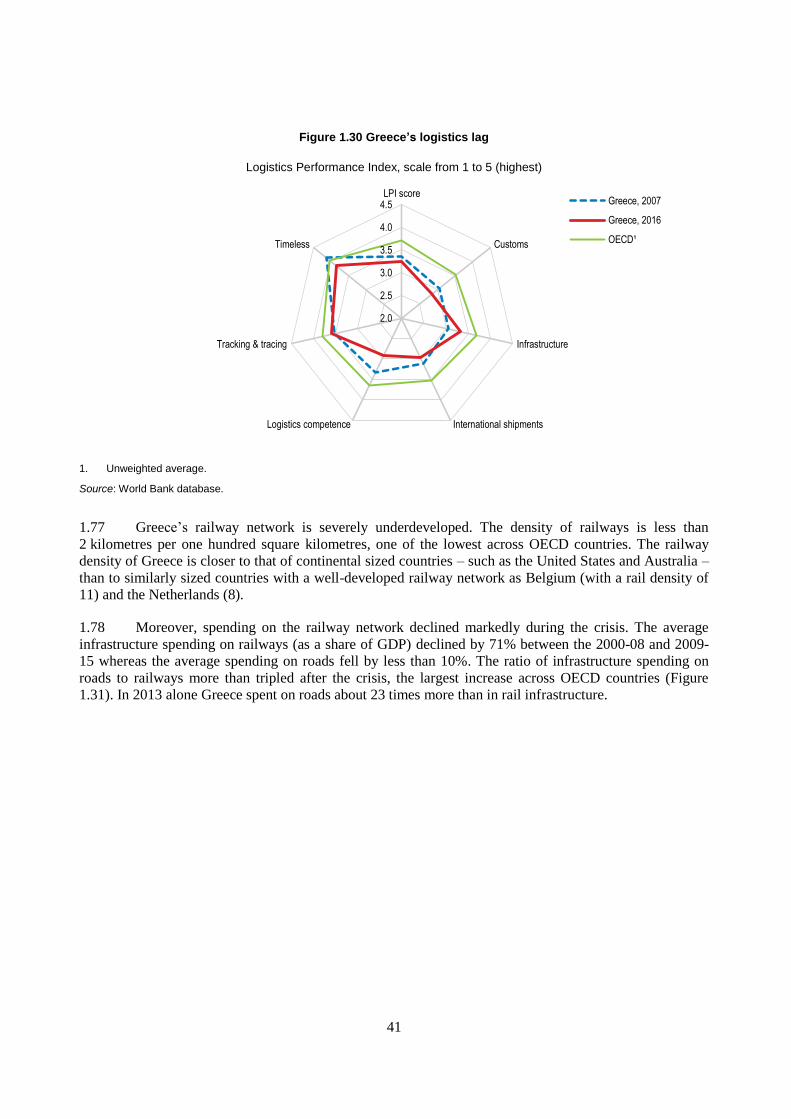
41
Figure 1.30 Greece’s logistics lag
Logistics Performance Index, scale from 1 to 5 (highest)
1. Unweighted average.
Source: World Bank database.
1.77 Greece’s railway network is severely underdeveloped. The density of railways is less than
2 kilometres per one hundred square kilometres, one of the lowest across OECD countries. The railway
density of Greece is closer to that of continental sized countries – such as the United States and Australia –
than to similarly sized countries with a well-developed railway network as Belgium (with a rail density of
11) and the Netherlands (8).
1.78 Moreover, spending on the railway network declined markedly during the crisis. The average
infrastructure spending on railways (as a share of GDP) declined by 71% between the 2000-08 and 2009-
15 whereas the average spending on roads fell by less than 10%. The ratio of infrastructure spending on
roads to railways more than tripled after the crisis, the largest increase across OECD countries (Figure
1.31). In 2013 alone Greece spent on roads about 23 times more than in rail infrastructure.
2.0
2.5
3.0
3.5
4.0
4.5LPI score
Customs
Infrastructure
International shipmentsLogistics competence
Tracking & tracing
Timeless
Greece, 2007
Greece, 2016
OECD¹
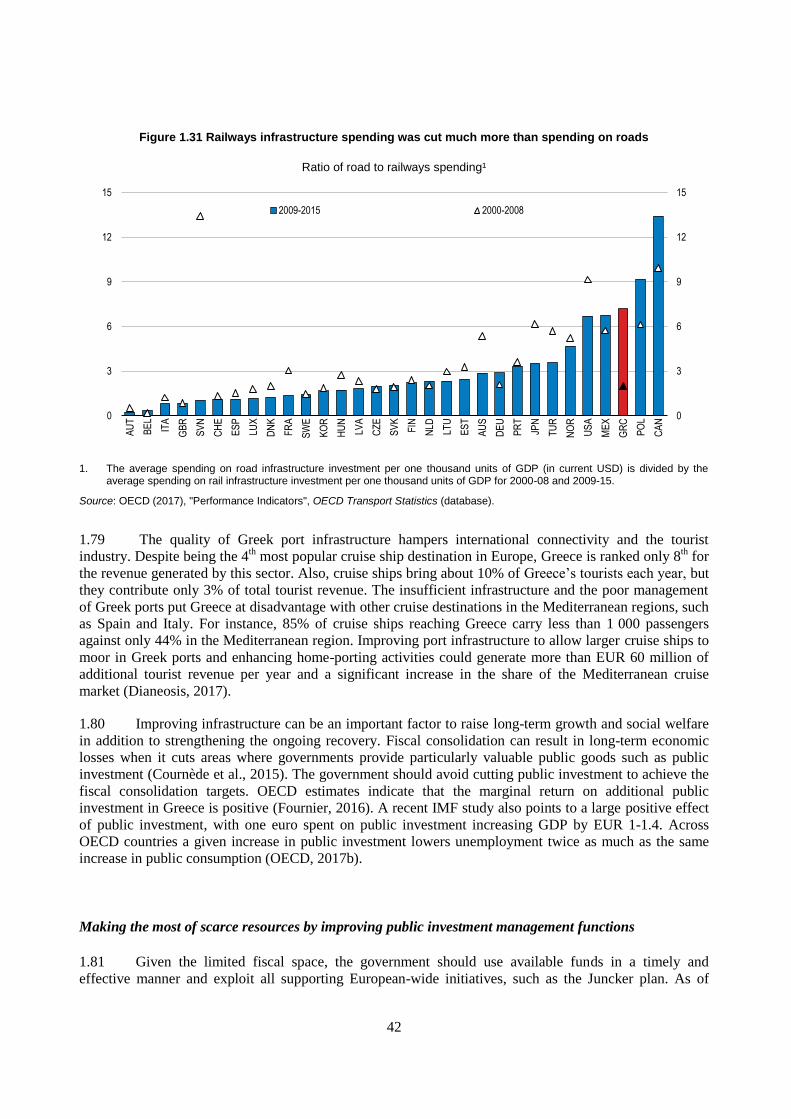
42
Figure 1.31 Railways infrastructure spending was cut much more than spending on roads
Ratio of road to railways spending¹
1. The average spending on road infrastructure investment per one thousand units of GDP (in current USD) is divided by the average spending on rail infrastructure investment per one thousand units of GDP for 2000-08 and 2009-15.
Source: OECD (2017), "Performance Indicators", OECD Transport Statistics (database).
1.79 The quality of Greek port infrastructure hampers international connectivity and the tourist
industry. Despite being the 4th most popular cruise ship destination in Europe, Greece is ranked only 8
th for
the revenue generated by this sector. Also, cruise ships bring about 10% of Greece’s tourists each year, but
they contribute only 3% of total tourist revenue. The insufficient infrastructure and the poor management
of Greek ports put Greece at disadvantage with other cruise destinations in the Mediterranean regions, such
as Spain and Italy. For instance, 85% of cruise ships reaching Greece carry less than 1 000 passengers
against only 44% in the Mediterranean region. Improving port infrastructure to allow larger cruise ships to
moor in Greek ports and enhancing home-porting activities could generate more than EUR 60 million of
additional tourist revenue per year and a significant increase in the share of the Mediterranean cruise
market (Dianeosis, 2017).
1.80 Improving infrastructure can be an important factor to raise long-term growth and social welfare
in addition to strengthening the ongoing recovery. Fiscal consolidation can result in long-term economic
losses when it cuts areas where governments provide particularly valuable public goods such as public
investment (Cournède et al., 2015). The government should avoid cutting public investment to achieve the
fiscal consolidation targets. OECD estimates indicate that the marginal return on additional public
investment in Greece is positive (Fournier, 2016). A recent IMF study also points to a large positive effect
of public investment, with one euro spent on public investment increasing GDP by EUR 1-1.4. Across
OECD countries a given increase in public investment lowers unemployment twice as much as the same
increase in public consumption (OECD, 2017b).
Making the most of scarce resources by improving public investment management functions
1.81 Given the limited fiscal space, the government should use available funds in a timely and
effective manner and exploit all supporting European-wide initiatives, such as the Juncker plan. As of
0
3
6
9
12
15
0
3
6
9
12
15
AU
T
BE
L
ITA
GB
R
SV
N
CH
E
ES
P
LUX
DN
K
FR
A
SW
E
KO
R
HU
N
LVA
CZ
E
SV
K
FIN
NLD
LTU
ES
T
AU
S
DE
U
PR
T
JPN
TU
R
NO
R
US
A
ME
X
GR
C
PO
L
CA
N
2009-2015 2000-2008
43
September 2017, Greece ranked third among European countries for the use of resources (as a share of
GDP) allocated through the Juncker plan. Also, user fees could be used better and more extensively
mobilised as fees are currently often below cost-recovery levels and congestion charges are not applied in
Greece (PWC, 2017). These instruments could generate additional resources to fund investment and
maintenance spending and encourage more efficient use of existing infrastructure.
1.82 Public investment can be more effective. Burdensome administrative procedures often delay
public works and inflate project costs. The incomplete land registry is a major problem as it results in
delays in land acquisition. Completing the land registry should become a national priority. For instance, in
2016 delays in issuing permissions, relating for instance to archaeological reviews, halted works in the
Ionian highway and triggered hefty penalty payments from the government to contractors. The highway
fully opened only in mid-2017 after several years of delay. A complete registry is necessary to clearly
identify all of the state’s non-financial assets and to develop a strategy to maximise their social and
economic value (Bova et al., 2013).
1.83 Shortcomings in the planning stage often lead to modification of contracts during works and
higher costs. For instance, none of the 6 Greek road projects audited by European Court of Auditors (ECA,
2013) were delivered at the original contract price. The average cost increase was 36%, the highest among
the four countries (Germany, Greece, Poland and Spain) considered. The report also finds that in Greece,
like in Poland, high capital requirements have led to large tenders being awarded to only major project
management companies. These companies had to register and qualify ex-ante with the Ministry. This is not
the case in Poland and Germany, where all companies can participate in tenders without pre-qualification.
The report also finds that re-measurement of works and contract updates after their initial signing usually
lead to large modifications, delays and higher costs. Among the four audited countries, Greece had the
largest average delay of transport projects, 16 months or 57% later than expected, compared with 9 months
and 41% on average for the four other countries. This calls for better management and ex ante design of
public investment projects, particularly when other parties are also involved.
1.83 Also, public investment payments in Greece are disbursed towards the end of the year (Figure
1.32). This is partly due to the cycle of projects that are mostly carried out from March to October.
However, the large payment spike in December also indicates delays in certifying contracting obligations
after the completion of works and the availability of resources.
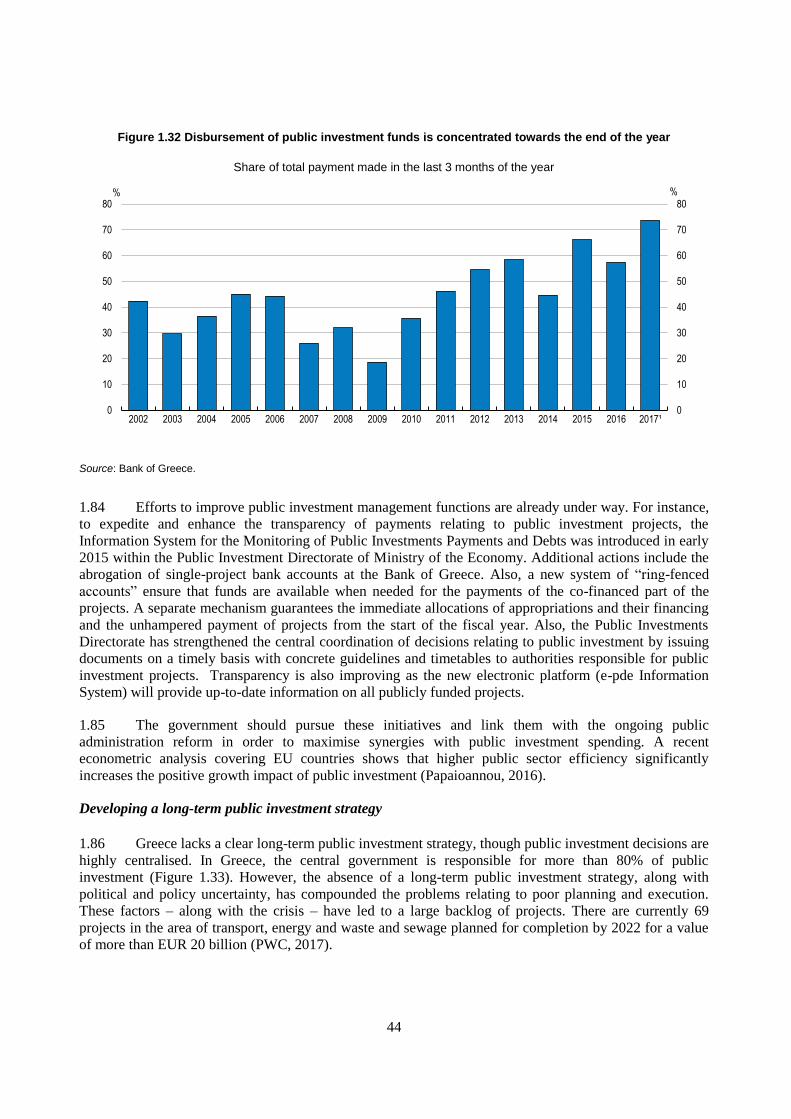
44
Figure 1.32 Disbursement of public investment funds is concentrated towards the end of the year
Share of total payment made in the last 3 months of the year
Source: Bank of Greece.
1.84 Efforts to improve public investment management functions are already under way. For instance,
to expedite and enhance the transparency of payments relating to public investment projects, the
Information System for the Monitoring of Public Investments Payments and Debts was introduced in early
2015 within the Public Investment Directorate of Ministry of the Economy. Additional actions include the
abrogation of single-project bank accounts at the Bank of Greece. Also, a new system of “ring-fenced
accounts” ensure that funds are available when needed for the payments of the co-financed part of the
projects. A separate mechanism guarantees the immediate allocations of appropriations and their financing
and the unhampered payment of projects from the start of the fiscal year. Also, the Public Investments
Directorate has strengthened the central coordination of decisions relating to public investment by issuing
documents on a timely basis with concrete guidelines and timetables to authorities responsible for public
investment projects. Transparency is also improving as the new electronic platform (e-pde Information
System) will provide up-to-date information on all publicly funded projects.
1.85 The government should pursue these initiatives and link them with the ongoing public
administration reform in order to maximise synergies with public investment spending. A recent
econometric analysis covering EU countries shows that higher public sector efficiency significantly
increases the positive growth impact of public investment (Papaioannou, 2016).
Developing a long-term public investment strategy
1.86 Greece lacks a clear long-term public investment strategy, though public investment decisions are
highly centralised. In Greece, the central government is responsible for more than 80% of public
investment (Figure 1.33). However, the absence of a long-term public investment strategy, along with
political and policy uncertainty, has compounded the problems relating to poor planning and execution.
These factors – along with the crisis – have led to a large backlog of projects. There are currently 69
projects in the area of transport, energy and waste and sewage planned for completion by 2022 for a value
of more than EUR 20 billion (PWC, 2017).
0
10
20
30
40
50
60
70
80
0
10
20
30
40
50
60
70
80
2002 2003 2004 2005 2006 2007 2008 2009 2010 2011 2012 2013 2014 2015 2016 2017¹
%%
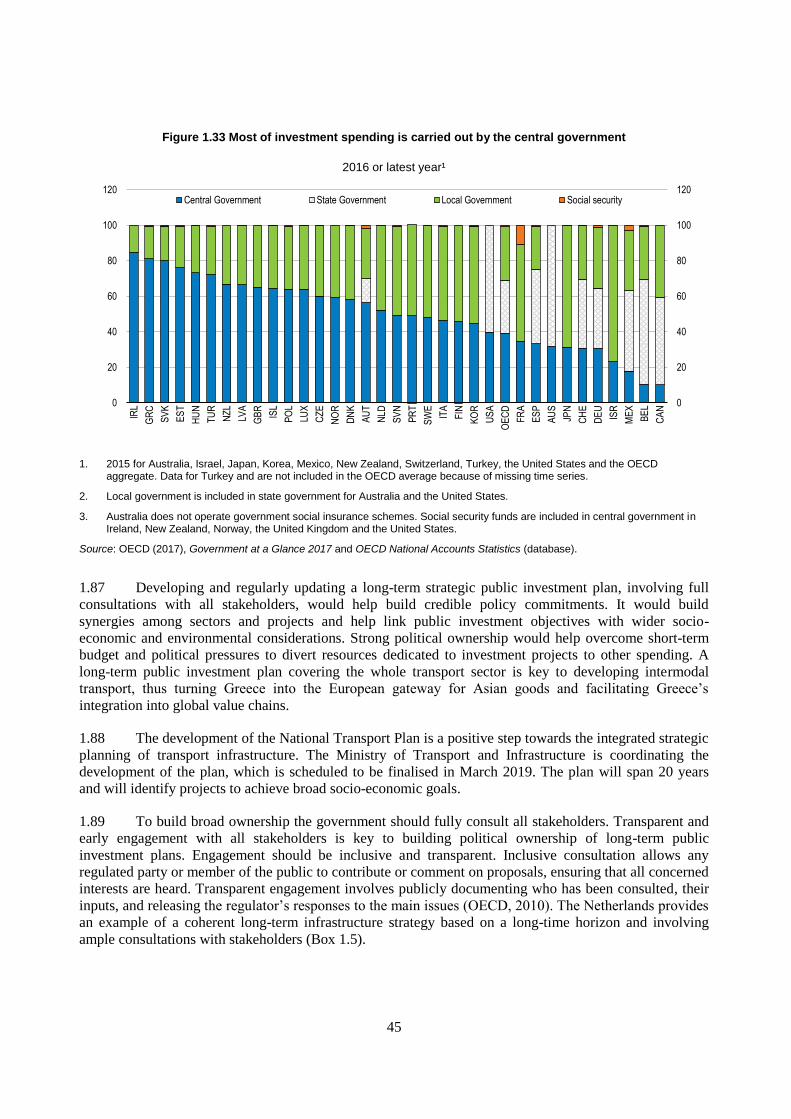
45
Figure 1.33 Most of investment spending is carried out by the central government
2016 or latest year¹
1. 2015 for Australia, Israel, Japan, Korea, Mexico, New Zealand, Switzerland, Turkey, the United States and the OECD aggregate. Data for Turkey and are not included in the OECD average because of missing time series.
2. Local government is included in state government for Australia and the United States.
3. Australia does not operate government social insurance schemes. Social security funds are included in central government in Ireland, New Zealand, Norway, the United Kingdom and the United States.
Source: OECD (2017), Government at a Glance 2017 and OECD National Accounts Statistics (database).
1.87 Developing and regularly updating a long-term strategic public investment plan, involving full
consultations with all stakeholders, would help build credible policy commitments. It would build
synergies among sectors and projects and help link public investment objectives with wider socio-
economic and environmental considerations. Strong political ownership would help overcome short-term
budget and political pressures to divert resources dedicated to investment projects to other spending. A
long-term public investment plan covering the whole transport sector is key to developing intermodal
transport, thus turning Greece into the European gateway for Asian goods and facilitating Greece’s
integration into global value chains.
1.88 The development of the National Transport Plan is a positive step towards the integrated strategic
planning of transport infrastructure. The Ministry of Transport and Infrastructure is coordinating the
development of the plan, which is scheduled to be finalised in March 2019. The plan will span 20 years
and will identify projects to achieve broad socio-economic goals.
1.89 To build broad ownership the government should fully consult all stakeholders. Transparent and
early engagement with all stakeholders is key to building political ownership of long-term public
investment plans. Engagement should be inclusive and transparent. Inclusive consultation allows any
regulated party or member of the public to contribute or comment on proposals, ensuring that all concerned
interests are heard. Transparent engagement involves publicly documenting who has been consulted, their
inputs, and releasing the regulator’s responses to the main issues (OECD, 2010). The Netherlands provides
an example of a coherent long-term infrastructure strategy based on a long-time horizon and involving
ample consultations with stakeholders (Box 1.5).
0
20
40
60
80
100
120
0
20
40
60
80
100
120
IRL
GR
C
SV
K
ES
T
HU
N
TU
R
NZ
L
LVA
GB
R
ISL
PO
L
LUX
CZ
E
NO
R
DN
K
AU
T
NLD
SV
N
PR
T
SW
E
ITA
FIN
KO
R
US
A
OE
CD
FR
A
ES
P
AU
S
JPN
CH
E
DE
U
ISR
ME
X
BE
L
CA
N
Central Government State Government Local Government Social security
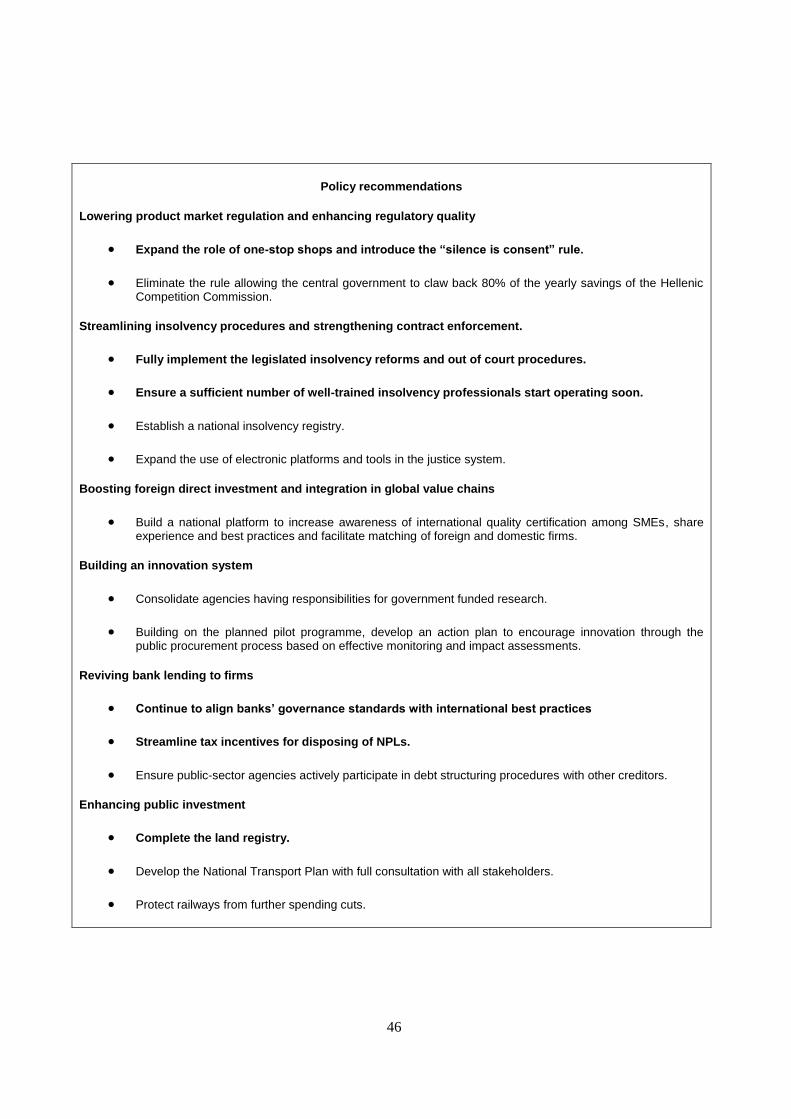
46
Policy recommendations
Lowering product market regulation and enhancing regulatory quality
Expand the role of one-stop shops and introduce the “silence is consent” rule.
Eliminate the rule allowing the central government to claw back 80% of the yearly savings of the Hellenic Competition Commission.
Streamlining insolvency procedures and strengthening contract enforcement.
Fully implement the legislated insolvency reforms and out of court procedures.
Ensure a sufficient number of well-trained insolvency professionals start operating soon.
Establish a national insolvency registry.
Expand the use of electronic platforms and tools in the justice system.
Boosting foreign direct investment and integration in global value chains
Build a national platform to increase awareness of international quality certification among SMEs, share experience and best practices and facilitate matching of foreign and domestic firms.
Building an innovation system
Consolidate agencies having responsibilities for government funded research.
Building on the planned pilot programme, develop an action plan to encourage innovation through the public procurement process based on effective monitoring and impact assessments.
Reviving bank lending to firms
Continue to align banks’ governance standards with international best practices
Streamline tax incentives for disposing of NPLs.
Ensure public-sector agencies actively participate in debt structuring procedures with other creditors.
Enhancing public investment
Complete the land registry.
Develop the National Transport Plan with full consultation with all stakeholders.
Protect railways from further spending cuts.
47
Bibliography
Adalet McGowan, M., D. Andrews and V. Millot (2017), “The Walking Dead? Zombie Firms and
Productivity Performance in OECD Countries”, OECD Economics Department Working Papers,
No. 1372, OECD Publishing, Paris.
Adalet McGowan, M., D. Andrews and V. Millot (2017), "Insolvency regimes, zombie firms and capital
reallocation", OECD Economics Department Working Papers, No. 1399, OECD Publishing, Paris.
Adalet McGowan, M. and D. Andrews (2016), "Insolvency Regimes And Productivity Growth: A
Framework For Analysis", OECD Economics Department Working Papers, No. 1309, OECD
Publishing, Paris. http://dx.doi.org/10.1787/5jlv2jqhxgq6-en.
Aghion, P. et al. (2010), “Volatility and growth: Credit constraints and the composition of investment”,
Journal of Monetary Economics 57(3): 246–265.
Aghion, P. et al. (2005), “Competition and Innovation: An Inverted-U Relationship”, The Quarterly
Journal of Economics, Vol. 120, No. 2 (May, 2005), pp. 701-728.
Aghion, P. et al. (2004), “Entry and Productivity Growth: Evidence from Microlevel Panel Data”, Journal
of the European Economic Association, 2(2-3): 265-276.
Ahn, S. et al. (2004), “The Economic Impacts of Outbound FDI and Trade: The Case of Korea”, Korea
Development Institute, Available, September 2017 at: https://www.oecd.org/sti/sci-
tech/35629244.pdf.
Aizeman, J. and I. Noy (2006), “FDI and trade - Two-way linkages?”, The Quarterly Review of Economics
and Finance, Volume 46, Issue 3, July 2006, Pages 317-337,
https://doi.org/10.1016/j.qref.2006.02.004.
Alesina, A. et al. (2005), “Regulation and Investment”, Journal of the European Economic Association,
Vol. 3, No 4, pp. 791-825, June.
Anzoategui, D. et al. (2016), “Endogenous technology adoption and R&D as sources of business cycle
persistence”, NBER, Working Papers 22005.
Arkolakis C., A. Doxiadis and M. Galenianos (2015), “The challenge of trade adjustment in Greece”, in
“Crisis in the Eurozone periphery: Policy options for Greece”, MIT Press.
Athanasiou, E. et al. (2015), The effects of liberalization of professional requirements in Greece, Study
conducted for the European Commission - DG for Internal Market, Industry, Entrepreneurship and
SMEs, October 2015, Available, August 2017, at:
http://ec.europa.eu/DocsRoom/documents/13363/attachments/1/translations/en/renditions/native.
auf dem Brinke, A. and H. Enderlein (2017), How to make sense of the structural reforms lists for the Euro
Area, Policy Paper No.184, Jacques Delors Institut – Berlin, 25 January 2017, Available, August 28
2017 at: http://www.institutdelors.eu/media/structuralreforms-aufdembrinkeenderlein-ijd-jan17.pdf.
Balassa, B. (1965), “Trade Liberalization and Revealed Comparative Advantage”. Manchester School of
Economic and Social Studies, 33, pp. 99-123.
48
Barkas, P. (2015), ‘International Economic Policies and Keynes Rediscovery in the Greek-Euro Crisis’ in
‘Modern Dilemmas: Understanding Collective Action in the 21st Century’, Dylan Kissane,
Alexandru Volacu (eds.), Ibidem-Verlag publishing, Stuttgart, Germany.
Blöchliger, H. (2017), Decentralisation and quality of public finance: intermediate report, OECD mimeo.
Blöchliger, H., B. Égert and K. Bonesmo Fredriksen (2013), “Fiscal Federalism and its Impact on
Economic Activity, Public Investment and the Performance of Educational Systems”, OECD
Economics Department Working Papers, No. 1051.
Blomström, M. and Kokko, A. (1996), “How Foreign Investment Affects Host Countries”, World Bank
Policy Research Working Paper, No 1745.
Bloom, N. et al. (2012), “Really Uncertain Business Cycles.” NBER Working Paper 18245
Bloom, N., T. Kretschmer and J. van Reenen (2009), “Work-Life Balance, Management Practices and
Productivity”, in R. Freeman and K. Shaw (eds.), International Differences in the Business Practice
and Productivity of Firms, University of Chicago Press, Chicago, United States.
Blundell, R., R. Griffith and J. van Reenen (1999), “Market Share, Market Value and Innovation in a Panel
of British Manufacturing Firms”, Review of Economic Studies, Vol. 66, 529-554.
BoG (various issues), Report on Operational Targets for Non-Performing Exposures, Bank of Greece, Available at
www.bankofgreece.gr/Pages/en/Publications/ReportNPE.aspx.
Bom, P. and J. Lighart (2014), “What have we learned from three decades of research on the productivity
of public Capital”, Journal of Economic Surveys, Vol. 28, Chapter 5.
Boothe, P. (2015), Compete to win: The Wilson panel report six years later, online document, available
June 25, 2017 at: http://www.ceocouncil.ca/wp-content/uploads/2015/02/Boothe-paper-March-2015-
FINAL.pdf.
Borio, C. et al. (2015), “Labour reallocation and productivity dynamics: financial causes, real
consequences”, BIS Working Papers, No. 534, Bank for International Settlements.
BSTDB (2017), Annual Report 2016: Mobilizing resources to deliver greater development impact, Black
Sea Trade and Development Bank, available August 8, 2017 at:
http://www.bstdb.org/publications/BSTDB_Annual_Report_2016.pdf.
Cahuc, P. and F. Kramarz (2004), “De la précarité à la mobilité: vers une Sécurité sociale professionnelle”,
report to ministre de l’Économie, des Finances et de l’Industrie et au ministre de l’Emploi, du
Travail et de la Cohésion sociale, France.
Callen, T. and J.D. Ostry (2003), Japan’s Lost Decade: Policies for Economic Revival, IMF.
Cecchetti, S. and E. Kharroubi (2012), “Reassessing the impact of finance on growth”, BIS, Working
Paper 381.
Chakrabarti, A. (2001), “The Determinants of Foreign Direct Investment: Sensitivity Analyses of Cross-
Country Regressions”, Kyklos, Vol. 54, pp. 89-114.
Claessens, S. and L.F. Klapper (2002), Bankruptcy Around the World: Explanations of its Relative Use,
World Bank Policy Research Working Paper 2865, July 2002, World Bank, Washington, DC,
available August 8, 2017 at:
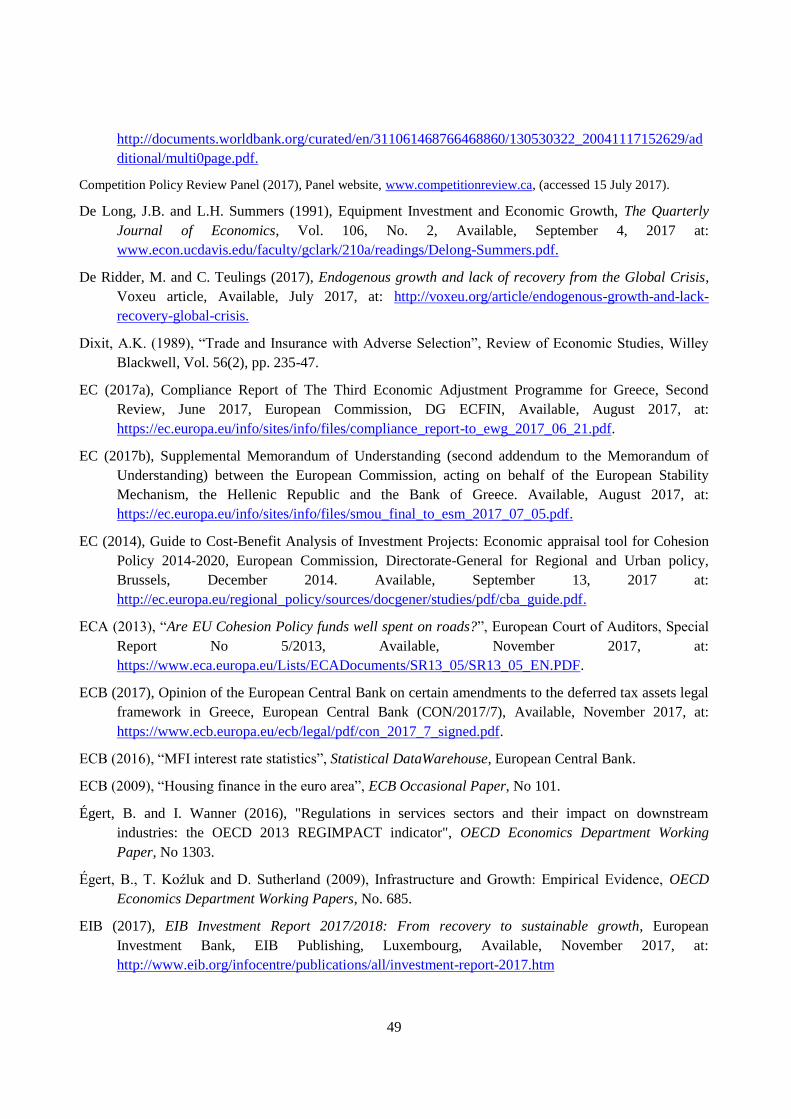
49
http://documents.worldbank.org/curated/en/311061468766468860/130530322_20041117152629/ad
ditional/multi0page.pdf.
Competition Policy Review Panel (2017), Panel website, www.competitionreview.ca, (accessed 15 July 2017).
De Long, J.B. and L.H. Summers (1991), Equipment Investment and Economic Growth, The Quarterly
Journal of Economics, Vol. 106, No. 2, Available, September 4, 2017 at:
www.econ.ucdavis.edu/faculty/gclark/210a/readings/Delong-Summers.pdf.
De Ridder, M. and C. Teulings (2017), Endogenous growth and lack of recovery from the Global Crisis,
Voxeu article, Available, July 2017, at: http://voxeu.org/article/endogenous-growth-and-lack-
recovery-global-crisis.
Dixit, A.K. (1989), “Trade and Insurance with Adverse Selection”, Review of Economic Studies, Willey
Blackwell, Vol. 56(2), pp. 235-47.
EC (2017a), Compliance Report of The Third Economic Adjustment Programme for Greece, Second
Review, June 2017, European Commission, DG ECFIN, Available, August 2017, at:
https://ec.europa.eu/info/sites/info/files/compliance_report-to_ewg_2017_06_21.pdf.
EC (2017b), Supplemental Memorandum of Understanding (second addendum to the Memorandum of
Understanding) between the European Commission, acting on behalf of the European Stability
Mechanism, the Hellenic Republic and the Bank of Greece. Available, August 2017, at:
https://ec.europa.eu/info/sites/info/files/smou_final_to_esm_2017_07_05.pdf.
EC (2014), Guide to Cost-Benefit Analysis of Investment Projects: Economic appraisal tool for Cohesion
Policy 2014-2020, European Commission, Directorate-General for Regional and Urban policy,
Brussels, December 2014. Available, September 13, 2017 at:
http://ec.europa.eu/regional_policy/sources/docgener/studies/pdf/cba_guide.pdf.
ECA (2013), “Are EU Cohesion Policy funds well spent on roads?”, European Court of Auditors, Special
Report No 5/2013, Available, November 2017, at:
https://www.eca.europa.eu/Lists/ECADocuments/SR13_05/SR13_05_EN.PDF.
ECB (2017), Opinion of the European Central Bank on certain amendments to the deferred tax assets legal
framework in Greece, European Central Bank (CON/2017/7), Available, November 2017, at:
https://www.ecb.europa.eu/ecb/legal/pdf/con_2017_7_signed.pdf.
ECB (2016), “MFI interest rate statistics”, Statistical DataWarehouse, European Central Bank.
ECB (2009), “Housing finance in the euro area”, ECB Occasional Paper, No 101.
Égert, B. and I. Wanner (2016), "Regulations in services sectors and their impact on downstream
industries: the OECD 2013 REGIMPACT indicator", OECD Economics Department Working
Paper, No 1303.
Égert, B., T. Koźluk and D. Sutherland (2009), Infrastructure and Growth: Empirical Evidence, OECD
Economics Department Working Papers, No. 685.
EIB (2017), EIB Investment Report 2017/2018: From recovery to sustainable growth, European
Investment Bank, EIB Publishing, Luxembourg, Available, November 2017, at:
http://www.eib.org/infocentre/publications/all/investment-report-2017.htm
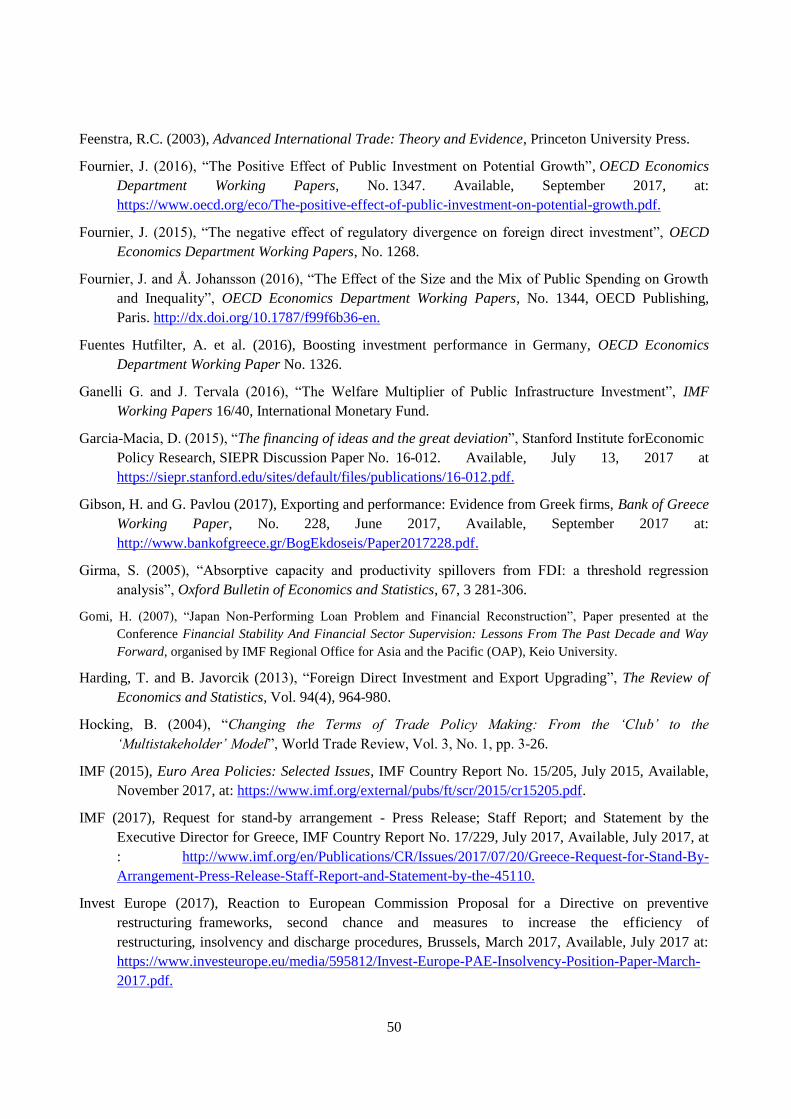
50
Feenstra, R.C. (2003), Advanced International Trade: Theory and Evidence, Princeton University Press.
Fournier, J. (2016), “The Positive Effect of Public Investment on Potential Growth”, OECD Economics
Department Working Papers, No. 1347. Available, September 2017, at:
https://www.oecd.org/eco/The-positive-effect-of-public-investment-on-potential-growth.pdf.
Fournier, J. (2015), “The negative effect of regulatory divergence on foreign direct investment”, OECD
Economics Department Working Papers, No. 1268.
Fournier, J. and Å. Johansson (2016), “The Effect of the Size and the Mix of Public Spending on Growth
and Inequality”, OECD Economics Department Working Papers, No. 1344, OECD Publishing,
Paris. http://dx.doi.org/10.1787/f99f6b36-en.
Fuentes Hutfilter, A. et al. (2016), Boosting investment performance in Germany, OECD Economics
Department Working Paper No. 1326.
Ganelli G. and J. Tervala (2016), “The Welfare Multiplier of Public Infrastructure Investment”, IMF
Working Papers 16/40, International Monetary Fund.
Garcia-Macia, D. (2015), “The financing of ideas and the great deviation”, Stanford Institute forEconomic
Policy Research, SIEPR Discussion Paper No. 16-012. Available, July 13, 2017 at
https://siepr.stanford.edu/sites/default/files/publications/16-012.pdf.
Gibson, H. and G. Pavlou (2017), Exporting and performance: Evidence from Greek firms, Bank of Greece
Working Paper, No. 228, June 2017, Available, September 2017 at:
http://www.bankofgreece.gr/BogEkdoseis/Paper2017228.pdf.
Girma, S. (2005), “Absorptive capacity and productivity spillovers from FDI: a threshold regression
analysis”, Oxford Bulletin of Economics and Statistics, 67, 3 281-306.
Gomi, H. (2007), “Japan Non-Performing Loan Problem and Financial Reconstruction”, Paper presented at the
Conference Financial Stability And Financial Sector Supervision: Lessons From The Past Decade and Way
Forward, organised by IMF Regional Office for Asia and the Pacific (OAP), Keio University.
Harding, T. and B. Javorcik (2013), “Foreign Direct Investment and Export Upgrading”, The Review of
Economics and Statistics, Vol. 94(4), 964-980.
Hocking, B. (2004), “Changing the Terms of Trade Policy Making: From the ‘Club’ to the
‘Multistakeholder’ Model”, World Trade Review, Vol. 3, No. 1, pp. 3-26.
IMF (2015), Euro Area Policies: Selected Issues, IMF Country Report No. 15/205, July 2015, Available,
November 2017, at: https://www.imf.org/external/pubs/ft/scr/2015/cr15205.pdf.
IMF (2017), Request for stand-by arrangement - Press Release; Staff Report; and Statement by the
Executive Director for Greece, IMF Country Report No. 17/229, July 2017, Available, July 2017, at
: http://www.imf.org/en/Publications/CR/Issues/2017/07/20/Greece-Request-for-Stand-By-
Arrangement-Press-Release-Staff-Report-and-Statement-by-the-45110.
Invest Europe (2017), Reaction to European Commission Proposal for a Directive on preventive
restructuring frameworks, second chance and measures to increase the efficiency of
restructuring, insolvency and discharge procedures, Brussels, March 2017, Available, July 2017 at:
https://www.investeurope.eu/media/595812/Invest-Europe-PAE-Insolvency-Position-Paper-March-
2017.pdf.
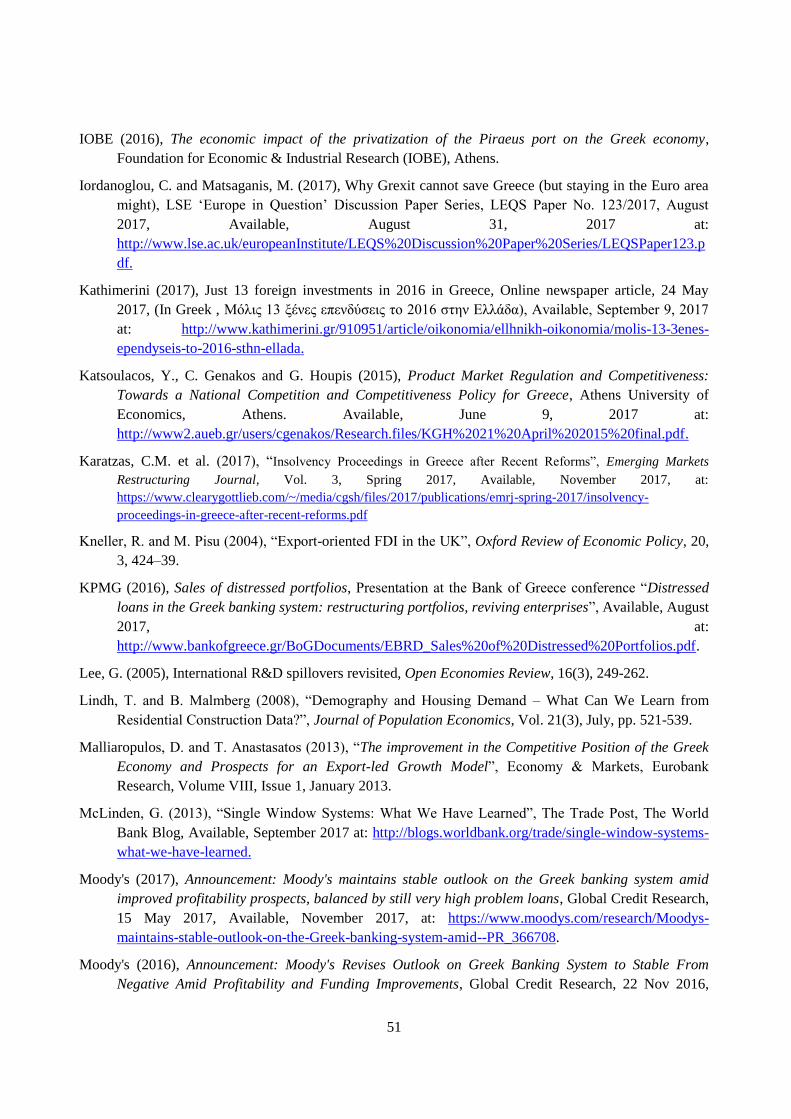
51
IOBE (2016), The economic impact of the privatization of the Piraeus port on the Greek economy,
Foundation for Economic & Industrial Research (IOBE), Athens.
Iordanoglou, C. and Matsaganis, M. (2017), Why Grexit cannot save Greece (but staying in the Euro area
might), LSE ‘Europe in Question’ Discussion Paper Series, LEQS Paper No. 123/2017, August
2017, Available, August 31, 2017 at:
http://www.lse.ac.uk/europeanInstitute/LEQS%20Discussion%20Paper%20Series/LEQSPaper123.p
df.
Kathimerini (2017), Just 13 foreign investments in 2016 in Greece, Online newspaper article, 24 May
2017, (In Greek , Μόλις 13 ξένες επενδύσεις το 2016 στην Ελλάδα), Available, September 9, 2017
at: http://www.kathimerini.gr/910951/article/oikonomia/ellhnikh-oikonomia/molis-13-3enes-
ependyseis-to-2016-sthn-ellada.
Katsoulacos, Y., C. Genakos and G. Houpis (2015), Product Market Regulation and Competitiveness:
Towards a National Competition and Competitiveness Policy for Greece, Athens University of
Economics, Athens. Available, June 9, 2017 at:
http://www2.aueb.gr/users/cgenakos/Research.files/KGH%2021%20April%202015%20final.pdf.
Karatzas, C.M. et al. (2017), “Insolvency Proceedings in Greece after Recent Reforms”, Emerging Markets
Restructuring Journal, Vol. 3, Spring 2017, Available, November 2017, at:
https://www.clearygottlieb.com/~/media/cgsh/files/2017/publications/emrj-spring-2017/insolvency-
proceedings-in-greece-after-recent-reforms.pdf
Kneller, R. and M. Pisu (2004), “Export-oriented FDI in the UK”, Oxford Review of Economic Policy, 20,
3, 424–39.
KPMG (2016), Sales of distressed portfolios, Presentation at the Bank of Greece conference “Distressed
loans in the Greek banking system: restructuring portfolios, reviving enterprises”, Available, August
2017, at:
http://www.bankofgreece.gr/BoGDocuments/EBRD_Sales%20of%20Distressed%20Portfolios.pdf.
Lee, G. (2005), International R&D spillovers revisited, Open Economies Review, 16(3), 249-262.
Lindh, T. and B. Malmberg (2008), “Demography and Housing Demand – What Can We Learn from
Residential Construction Data?”, Journal of Population Economics, Vol. 21(3), July, pp. 521-539.
Malliaropulos, D. and T. Anastasatos (2013), “The improvement in the Competitive Position of the Greek
Economy and Prospects for an Export-led Growth Model”, Economy & Markets, Eurobank
Research, Volume VIII, Issue 1, January 2013.
McLinden, G. (2013), “Single Window Systems: What We Have Learned”, The Trade Post, The World
Bank Blog, Available, September 2017 at: http://blogs.worldbank.org/trade/single-window-systems-
what-we-have-learned.
Moody's (2017), Announcement: Moody's maintains stable outlook on the Greek banking system amid
improved profitability prospects, balanced by still very high problem loans, Global Credit Research,
15 May 2017, Available, November 2017, at: https://www.moodys.com/research/Moodys-
maintains-stable-outlook-on-the-Greek-banking-system-amid--PR_366708.
Moody's (2016), Announcement: Moody's Revises Outlook on Greek Banking System to Stable From
Negative Amid Profitability and Funding Improvements, Global Credit Research, 22 Nov 2016,
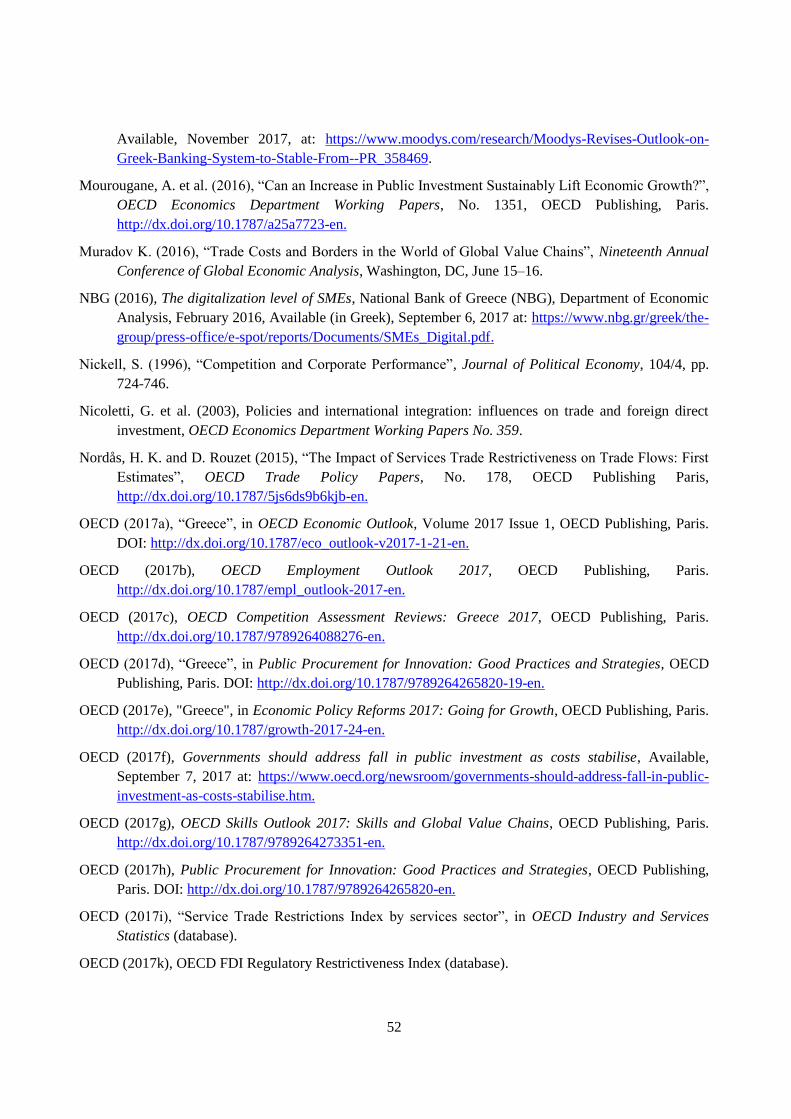
52
Available, November 2017, at: https://www.moodys.com/research/Moodys-Revises-Outlook-on-
Greek-Banking-System-to-Stable-From--PR_358469.
Mourougane, A. et al. (2016), “Can an Increase in Public Investment Sustainably Lift Economic Growth?”,
OECD Economics Department Working Papers, No. 1351, OECD Publishing, Paris.
http://dx.doi.org/10.1787/a25a7723-en.
Muradov K. (2016), “Trade Costs and Borders in the World of Global Value Chains”, Nineteenth Annual
Conference of Global Economic Analysis, Washington, DC, June 15–16.
NBG (2016), The digitalization level of SMEs, National Bank of Greece (NBG), Department of Economic
Analysis, February 2016, Available (in Greek), September 6, 2017 at: https://www.nbg.gr/greek/the-
group/press-office/e-spot/reports/Documents/SMEs_Digital.pdf.
Nickell, S. (1996), “Competition and Corporate Performance”, Journal of Political Economy, 104/4, pp.
724-746.
Nicoletti, G. et al. (2003), Policies and international integration: influences on trade and foreign direct
investment, OECD Economics Department Working Papers No. 359.
Nordås, H. K. and D. Rouzet (2015), “The Impact of Services Trade Restrictiveness on Trade Flows: First
Estimates”, OECD Trade Policy Papers, No. 178, OECD Publishing Paris,
http://dx.doi.org/10.1787/5js6ds9b6kjb-en.
OECD (2017a), “Greece”, in OECD Economic Outlook, Volume 2017 Issue 1, OECD Publishing, Paris.
DOI: http://dx.doi.org/10.1787/eco_outlook-v2017-1-21-en.
OECD (2017b), OECD Employment Outlook 2017, OECD Publishing, Paris.
http://dx.doi.org/10.1787/empl_outlook-2017-en.
OECD (2017c), OECD Competition Assessment Reviews: Greece 2017, OECD Publishing, Paris.
http://dx.doi.org/10.1787/9789264088276-en.
OECD (2017d), “Greece”, in Public Procurement for Innovation: Good Practices and Strategies, OECD
Publishing, Paris. DOI: http://dx.doi.org/10.1787/9789264265820-19-en.
OECD (2017e), "Greece", in Economic Policy Reforms 2017: Going for Growth, OECD Publishing, Paris.
http://dx.doi.org/10.1787/growth-2017-24-en.
OECD (2017f), Governments should address fall in public investment as costs stabilise, Available,
September 7, 2017 at: https://www.oecd.org/newsroom/governments-should-address-fall-in-public-
investment-as-costs-stabilise.htm.
OECD (2017g), OECD Skills Outlook 2017: Skills and Global Value Chains, OECD Publishing, Paris.
http://dx.doi.org/10.1787/9789264273351-en.
OECD (2017h), Public Procurement for Innovation: Good Practices and Strategies, OECD Publishing,
Paris. DOI: http://dx.doi.org/10.1787/9789264265820-en.
OECD (2017i), “Service Trade Restrictions Index by services sector”, in OECD Industry and Services
Statistics (database).
OECD (2017k), OECD FDI Regulatory Restrictiveness Index (database).
53
OECD (2017l), OECD Science, Technology and R&D Statistics (database).
OECD (2016a), OECD Science, Technology and Innovation Outlook 2016, OECD Publishing, Paris.
http://dx.doi.org/10.1787/sti_in_outlook-2016-en.
OECD (2016b), “Venture capital investments”, in Entrepreneurship at a Glance 2016, OECD Publishing,
Paris. DOI: http://dx.doi.org/10.1787/entrepreneur_aag-2016-34-en.
OECD (2016c), OECD Economic Surveys: Greece 2016, OECD Publishing, Paris.
http://dx.doi.org/10.1787/eco_surveys-grc-2016-en.
OECD (2015a), Policy Framework for Investment 2015 Edition, OECD Publishing, Paris.
http://dx.doi.org/10.1787/9789264208667-en.
OECD (2015b), OECD Regulatory Policy Outlook 2015, OECD Publishing, Paris.
http://dx.doi.org/10.1787/9789264238770-en
OECD (2015c), OECD Guidelines on Corporate Governance of State-Owned Enterprises, 2015 Edition,
OECD Publishing, Paris. http://dx.doi.org/10.1787/9789264244160-en.
OECD (2015d), Lifting investment for higher sustainable growth, Chapter 3, OECD Economic Outlook
2015/1.
OECD (2015e), The Future of Productivity, OECD Publishing, Paris. Available, September 2017, at:
www.oecd.org/economy/the-future-of-productivity.htm.
OECD (2015f), “Listing investment for higher sustainable growth”, in OECD Economic Outlook 2015,
OECD Publishing, Paris.
OECD (2014a), The Governance of Regulators, OECD Best Practice Principles for Regulatory Policy,
OECD Publishing. http://dx.doi.org/10.1787/9789264209015-en.
OECD (2014b), Measurement and Reduction of Administrative Burdens in Greece: An Overview of 13
Sectors, OECD Publishing, http://dx.doi.org/10.1787/9789264213524-en.
OECD (2014c), Recommendation of the Council on Effective Public Investment Across Levels of
Government, 12 March 2014, C(2014)32, Available, September 2017, at:
https://www.oecd.org/regional/regional-policy/Principles-Public-Investment.pdf.
OECD (2013a), Interconnected Economies: Benefiting from Global Value Chains, OECD Publishing,
Paris, http://dx.doi.org/10.1787/9789264189560-en.
OECD (2013b), OECD Economic Surveys: Greece 2013, OECD Publishing, Paris.
http://dx.doi.org/10.1787/eco_surveys-grc-2013-en.
OECD (2010a), Making Reform Happen: Lessons from OECD countries, Available, September 2017, at:
http://www.oecd.org/env/making-reform-happen-9789264086296-en.htm.
OECD (2010b), Transparency and Integrity in Lobbying, https://www.oecd.org/gov/ethics/Lobbying-
Brochure.pdf.
OECD (2010c), Investment Reform Index 2010: Monitoring Policies and Institutions for Direct Investment
in South-East Europe, OECD Publishing, Paris.
http://dx.doi.org/10.1787/9789264079588-4-en.
54
OECD (2009), Guidelines for Recipient Country Investment Policies Relating to National Security:
Recommendation adopted by the OECD Council on 25 May 2009, OECD, Paris.
OECD (2008), OECD Guidelines for Multinational Enterprises, OECD Publishing, Paris, Available,
September 2017, at: http://www.oecd.org/corporate/mne/1922428.pdf.
OECD (2007), Compendium of OECD Work in Intellectual Property, OECD, Paris.
OECD (2005), OECD Guiding Principles for Regulatory Quality and Performance, OECD Publishing,
Paris, Available, September 2017, at: www.oecd.org/fr/reformereg/34976533.pdf.
OECD (2003a), Recommendation of the Council on Guidelines for managing conflict of interest in the
public service, OECD Publishing, Paris, Available, September 2017, at:
www.oecd.org/gov/fightingcorruptioninthepublicsector/2957360.pdf.
OECD (2003b), A Checklist for Foreign Direct Investment Incentive Policies, OECD Publishing, Paris.
OECD (2000), “Main Determinants and Impacts of Foreign Direct Investment on China's Economy”,
OECD Working Papers on International Investment, 2000/04, OECD Publishing, Paris.
http://dx.doi.org/10.1787/321677880185.
OECD, WTO and UNCTAD (2013), Implications of Global Value Chains for Trade, Investment,
Development and Jobs, Prepared for the G-20 Leaders Summit, Saint Petersburg (Russian
Federation), Available, September 2017, at:
http://unctad.org/en/PublicationsLibrary/unctad_oecd_wto_2013d1_en.pdf.
Ohashi, K. and M. Singh (2004), “Japan’s Distressed Debt Market”, IMF Working Paper, No. WP/04/86,
IMF.
Ollivaud, P., Y. Guillemette and D. Turner (2016), “Links between weak investment and the slowdown in
productivity and potential output growth across the OECD”, OECD Economics Department Working
Papers, No. 1304, OECD Publishing, Paris. http://dx.doi.org/10.1787/5jlwvz0smq45-en.
Pallis et al. (2017), The development prospects of home-ports cruise industry in Greece, Original in Greek
“Η Αναπτυξιακή Προοπτική της Κρουαζιέρας Αφετηρίας στην Ελλάδα”, Dianeosis research and
analysis organisation, Athens, Available, October 2017, at: https://www.dianeosis.org/wp-
content/uploads/2017/09/limania_krouaziera_final.pdf.
Palumbo, G. et al. (2013), "Judicial Performance and its Determinants: A Cross-Country Perspective",
OECD Economic Policy Papers, No. 5, OECD Publishing, Paris.
http://dx.doi.org/10.1787/5k44x00md5g8-en.
Papaioannou, S.K. (2016), “Public Investment Multipliers in EU Countries: Does the Efficiency of Public
Sector Matter?”, Centre of Planning and Economic Research, Discussion Paper No 150, Available,
June 13, 2017 at: https://www.kepe.gr/images/pdf/D.P/DP_150_Papaioannou.pdf.
Pekkanen, P. et al. (2015), Timeframe Alarm System: Designing a Practical Tool for Caseflow
Management, Justice System Journal, Volume 36, Issue 4.
Plaskovitis, I.S (2016), “Greek banks after the recapitalisation: the agenda for NPL resolution”,
Presentation at the EBRD / BoG Workshop: “Distressed loans in the Greek banking system:
restructuring portfolios, reviving enterprises”, Athens, 10 March 2016, Available, November 2017,
at: http://www.bankofgreece.gr/BoGDocuments/20160310_The_Agenda_for_NPL_Resolution.pdf.
55
Potamitis, S. (2017), “Restructuring & Insolvency in Greece”, Thomson Reuters Practical Law, Available, November
2017, at: www.ukpracticalw.thomsonreuters.com
Potamitis, S. et al. (2017), “Insolvency and Directors' duties in Greece: Overview”, Thomson Reuters Practical Law,
Available, November 2017, at: www.ukpracticalw.thomsonreuters.com
PWC (2017), Infrastructure in Greece: Funding the Future, PriceMarch 2017, Athens, Available,
September 2017, at: https://www.pwc.com/gr/en/publications/greek-thought-
leadership/infrastracture-in-greece-2016-en.pdf.
Rodriguez Palenzuela, D., Dees, S. and the Saving and Investment Task Force (2016), “Savings and
investment behavior in the euro area”, ECB Occasional Paper No 167, January 2016, Available,
September 2017, at:
https://www.ecb.europa.eu/pub/pdf/scpops/ecbop167.en.pdf?2b3674e4d3a69b9162dacf10eb5047a5.
Sakkas, Y.G. and Y.G. Bazinas (2016), The Legal Framework for Non-Performing Loans in Greece,
Eurofenix - The journal of INSOL Europe, Spring 2016, Available, November 2017, at:
http://www.bazinas.com/fresheditor/Uploads/fa4e86e32962fdfe8395e17649b48316.pdf.
SEV (2016), “Η εφαρμογή της εργαλειοθήκης του ΟΟΣΑ για την αξιολόγηση των συνθηκών του
ανταγωνισμού στην Ελλάδα… σε αριθμούς. Πορεία υλοποίησης και νέες συστάσεις. Key facts and
figures” (The implementation of the OECD toolkit for the assessment of competition in Greece… in
numbers. Implementation track and new recommendations. Key facts and figures”), Hellenic
Federation of Enterprises, Available in Greek, 18 July 2017, at:
http://www.sev.org.gr/Uploads/Documents/49884/key_facts_figures.pdf.
Sutherland, D. et al. (2009), “Infrastructure Investment: Links to Growth and the Role of Public Policies”,
OECD Economics Department Working Papers, No. 686, OECD Publishing, Paris.
http://dx.doi.org/10.1787/225678178357.
The National Herald (2016), Road Construction Delays Cost Greece 241.5M Euros, June 23, 2016,
Available, September 2017, at: https://www.thenationalherald.com/127924/road-construction-
delays-cost-greece-241-5m-euros/.
Tradingeconomics (2017), Greece Foreign Direct Investment - Net Inflows, Available, September 2017, at:
https://tradingeconomics.com/greece/foreign-direct-investment.
UN (2010), Integrating Developing Countries’ SMEs into Global Value Chains, Commission on
Investment, Enterprise and Development, UNCTAD/DIAE/ED/2009/5, New York and Geneva,
Available, October 2017, at: http://unctad.org/en/Docs/diaeed20095_en.pdf.
Watson Farley & Williams (2016), New regulatory framework for non-performing loans in Greece, June
2016 Briefing, Available, September 2017, at: http://www.wfw.com/wp-
content/uploads/2016/06/WFW-NewRegulatoryFrameworkForNPLsInGreece.pdf.
World Bank (2017a), Global Indicators of Regulatory Governance: Greece, website, International Bank
for Reconstruction and Development / The World Bank, Washington DC, Available, July 2017, at:
http://rulemaking.worldbank.org/data/explorecountries/greece#cer_assessment.
World Bank (2017b), “Greece, Economy Profile 2017”, in Doing Business 2017: Equal Opportunity for
All, International Bank for Reconstruction and Development / The World Bank, Washington DC,
https://www.pwc.com/gr/en/publications/greek-thought-leadership/infrastracture-in-greece-2016-en.pdf
56
Available, September 2017, at: http://www.doingbusiness.org/reports/global-
reports/~/media/WBG/DoingBusiness/documents/profiles/country/GRC.pdf.
World Bank (2016), Doing Business 2016: Measuring Regulatory Quality and Efficiency, International
Bank for Reconstruction and Development / The World Bank, Washington DC, Available,
September 2017, at:
http://www.doingbusiness.org/~/media/WBG/DoingBusiness/Documents/Annual-
Reports/English/DB16-Full-Report.pdf.
WEF (2017a), The Global Competitiveness Report 2017-2018, World Economic Forum, Geneva,
Switzerland, Available, September 2017, at: http://www3.weforum.org/docs/GCR2017-
2018/05FullReport/TheGlobalCompetitivenessReport2017%E2%80%932018.pdf.
WEF (2017b), The Global Competitiveness Report (database), World Economic Forum, Geneva,
Switzerland.
WIPO (2015), World Intellectual Property Report: Breakthrough Innovation and Economic Growth,
Economics & Statistics Series, World Intellectual Property Organisation, Available, November
2017, at: http://www.wipo.int/edocs/pubdocs/en/wipo_pub_944_2015.pdf.
WTO (2016), Greece: Trade in Value Added and Global Value Chains, Online document, Available,
September 2017, at: https://www.wto.org/english/res_e/statis_e/miwi_e/GR_e.pdf.
Yeaple, S.R. and S.S. Golub (2007), “International Productivity Differences, Infrastructure, and
Comparative Advantage”, Review of International Economics, Vol. 15, No. 2, pp. 223-242.
OECD (2008), Enhancing the Role of SMEs in Global Value Chains, OECD Publishing, Paris.
OECD and World Bank (2015), Inclusive Value Chains, Report prepared for submission to G20 Trade
Ministers Meeting Istanbul, Turkey, 6 October 2015, available at:
https://www.oecd.org/trade/OECD-WBG-g20-gvc-report-2015.pdf
Related Documents