Chapter 1. Growth and Investment Pakistan Economic Survey Pakistan Economic Survey 2002-03 2002-03

Pakistan Economic Survey FY03
Oct 26, 2014
A review of Pakistan's economy in year 2002-03
Welcome message from author
This document is posted to help you gain knowledge. Please leave a comment to let me know what you think about it! Share it to your friends and learn new things together.
Transcript
Chapter 1. Growth and Investment
Pakistan Economic SurveyPakistan Economic Survey2002-032002-03
Chapter 1. Growth and Investment
1. Growth and Investment1. Growth and InvestmentThe outgoing fiscal year 2002-03 has
witnessed a sharp recovery in economic growth accompanied by equally impressive performance of agriculture and large-scale manufacturing. Other significant achievements have been the impressive growth in per capita income, both in rupee and dollar terms, and national savings reaching new heights — exceeding total investment and suggesting a large surplus in the current account balance. When viewed at the backdrop of inhospitable external environment and uncertain geo-political situation Pakistan's growth performance has been impressive in 2002-03. This year has witnessed major corporate scandals and bankruptcies in the United States, resulting in bursting of the equity market bubble; rising uncertainties in the run up to war in Iraq, causing oil prices to rise sharply, and recent outbreak of Severe Acute Respiratory Syndrome (SARS) virus badly affecting business environment in Asia. There developments on international economic scene created uncertainties. The world economic outlook remained subdued and global trade remained sluggish during the outgoing fiscal year.
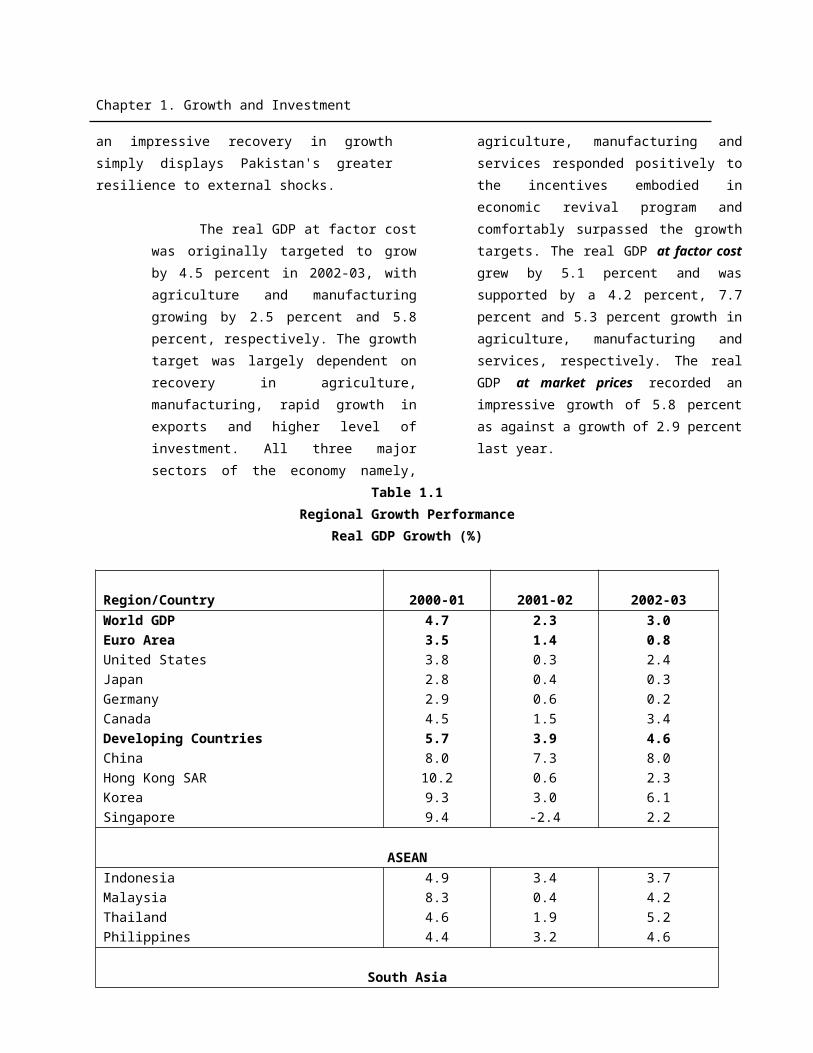
Table 1.1 documents the growth performance of selected regional economies in 2000-03. The performance of the major growth poles of the world economy (US, Japan and Euro Area) are likely to remain subdued with Japan and Euro Area economies growing by less than 1.0 percent in 2002-03. The United States is expected to perform better as compared with last year. Developing countries as a whole is expected to grow by 4.6 percent. China and Korea in Asian region are
expected to be the star performers with growth exceeding 6.0 percent. With the exception of Thailand, the other ASEAN countries are projected to grow by less than 5.0 percent. Barring Iran, the other countries in the Middle East are almost stagnating. In Africa, no country could achieve 5.0 percent growth in 2002-03. In South Asia, Pakistan is the only country which achieved more than 5.0 percent growth in 2002-03. Two points need to be noted as far as Pakistan's growth performance is concerned. Firstly, when compared with major economies of different parts of the world, Pakistan’s growth performance has been impressive. Secondly, in a subdued global economic environment, an impressive recovery in growth simply displays Pakistan's greater resilience to external shocks.
The real GDP at factor cost was originally targeted to grow by 4.5 percent in 2002-03, with agriculture and manufacturing growing by 2.5 percent and 5.8 percent, respectively. The growth target was largely dependent on recovery in agriculture, manufacturing, rapid growth in exports and higher level of investment. All three major sectors of the economy namely, agriculture, manufacturing and services responded positively to the incentives embodied in economic revival program and comfortably surpassed the growth targets. The real GDP at factor cost grew by 5.1 percent and was supported by a 4.2 percent, 7.7 percent and 5.3 percent growth in agriculture, manufacturing and services, respectively. The real GDP at market
Chapter 1. Growth and Investment
prices recorded an impressive growth of 5.8 percent as against a growth of 2.9 percent last year.
Table 1.1Regional Growth Performance
Real GDP Growth (%)
Region/Country 2000-01 2001-02 2002-03World GDP 4.7 2.3 3.0Euro Area 3.5 1.4 0.8United States 3.8 0.3 2.4Japan 2.8 0.4 0.3Germany 2.9 0.6 0.2Canada 4.5 1.5 3.4Developing Countries 5.7 3.9 4.6China 8.0 7.3 8.0Hong Kong SAR 10.2 0.6 2.3Korea 9.3 3.0 6.1Singapore 9.4 -2.4 2.2
ASEANIndonesia 4.9 3.4 3.7Malaysia 8.3 0.4 4.2Thailand 4.6 1.9 5.2Philippines 4.4 3.2 4.6
South AsiaIndia 5.4 4.2 4.4Bangladesh 5.9 5.3 4.4Sri Lanka 6.0 -1.4 3.7Pakistan 2.2 3.4 5.1
Middle EastSaudi Arabia 4.9 1.2 2.1Kuwait 1.4 -1.1 -0.9Iran 5.2 5.7 6.0Egypt 5.1 3.5 2.0
AfricaAlgeria 2.4 2.1 3.1Morocco 1.0 6.5 4.5Tunisia 4.7 5.2 1.9Nigeria 3.9 2.8 0.5Kenya -0.1 1.2 1.2South Africa 3.5 2.8 3.0
Source: World Economic Outlook (IMF), April 2003.
Chapter 1. Growth and Investment
1980's 1990-I 1990-II 2000-02 2002-030
1
2
3
4
5
6
7
8
9
10
6.1
4.9
5.7
4.2
Fig-1: Real GDP/GNP Growth
GDP Growth GNP Growth
% G
row
th
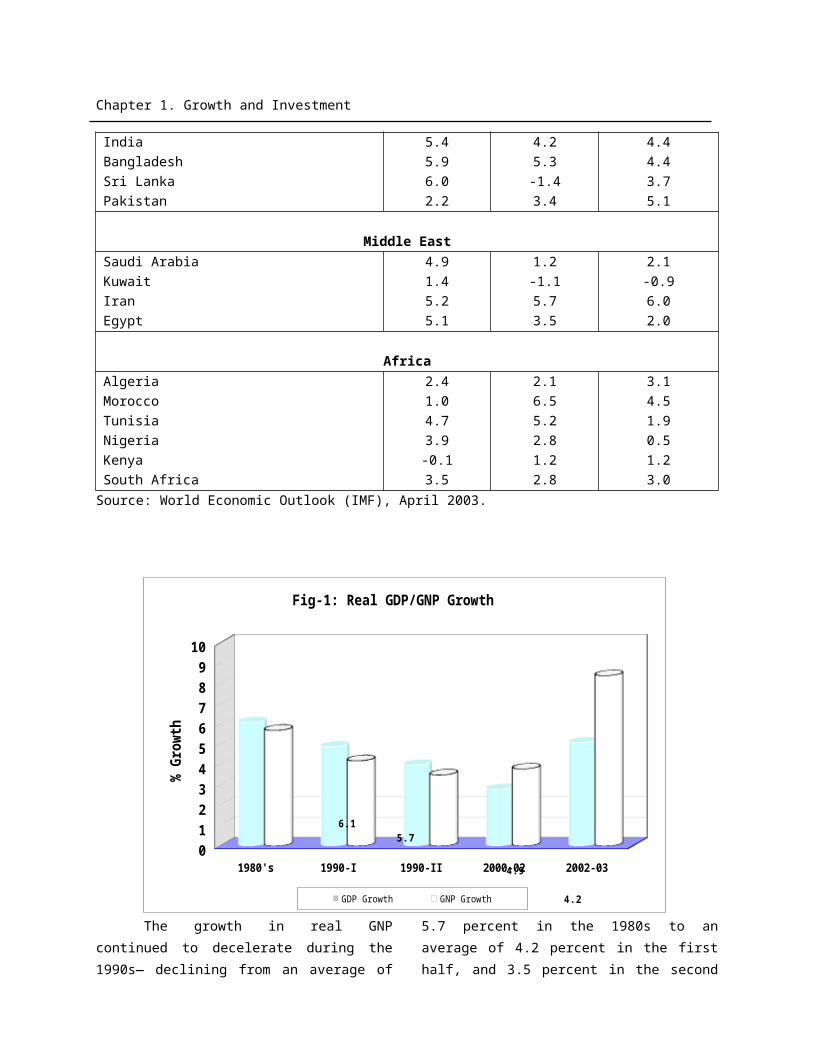
The growth in real GNP continued to decelerate during the 1990s— declining from an average of 5.7 percent in the 1980s to an average of 4.2 percent in the first half, and 3.5 percent in the second half of the 1990s. During the first three years (2000-03) of the new decade, the real GNP grew at an average of 5.4 percent. Most importantly, the real GNP registered a handsome growth of 8.4 percent in 2002-03 as against 5.3 percent last year, mainly on account of 472.2 percent increase in net factor income from abroad, which, in turn, is the result of a sharp increase in the inflow of workers remittances and foreign direct investment in the country [See Fig-1.1]. With population growing by 2.1 percent, the real per capita GNP at market price increased by 6.6 percent in 2002-03 as against an increase of 2.1 percent last year.
Notwithstanding the strong recovery
in growth to 5.1 percent in 2002-03 from 3.4 percent last year, the fact remains that Pakistan’s economic growth decelerated in the 1990s for a variety of reasons, including worsening of macroeconomic environment, serious lapses in implementation of
stabilization policies and structural reforms, adverse law and order situation, inconsistent policies, and poor governance. As against an average growth rate of 6.1 percent in the 1980s, the real GDP growth slowed to an average of 4.9 percent in the first half, 4.0 percent in the second half of the 1990s. Economic growth remained depressed for first two years (2000-02) of the new decade averaging 2.8 percent. Unprecedented drought and the events of 9/11 have been responsible for keeping the growth depressed during 2000-02. Fiscal year 2002-03 exhibits a turnaround in growth [See Fig-1]. The real challenge would now be to sustain this growth momentum.
The manufacturing sector grew by an average annual rate of 8.2 percent in the 1980s, slowed to an average of 4.7 percent in the first half and further to 2.4 percent in the second half of the 1990s. However, it performed well during last three years by growing at annual average rate of 7.0 percent per annum. In fact, over the last decade, the large-scale manufacturing lost almost three-fourth of its growth
Chapter 1. Growth and Investment
momentum. The services sector also slowed from an average of 6.6 percent in the 1980s to 5.1 percent in the first half and further to 4.0 percent in the second half of the 1990s, losing one-third of its growth momentum
during the 1990s. It started regaining its growth momentum during last three years by growing at an average rate of 4.7 percent. [See Table 1.1].
Table 1.1Growth Performance of Real Sector
Item Unit 1980’s 1990-95
1995-00
2000-03
2002-03
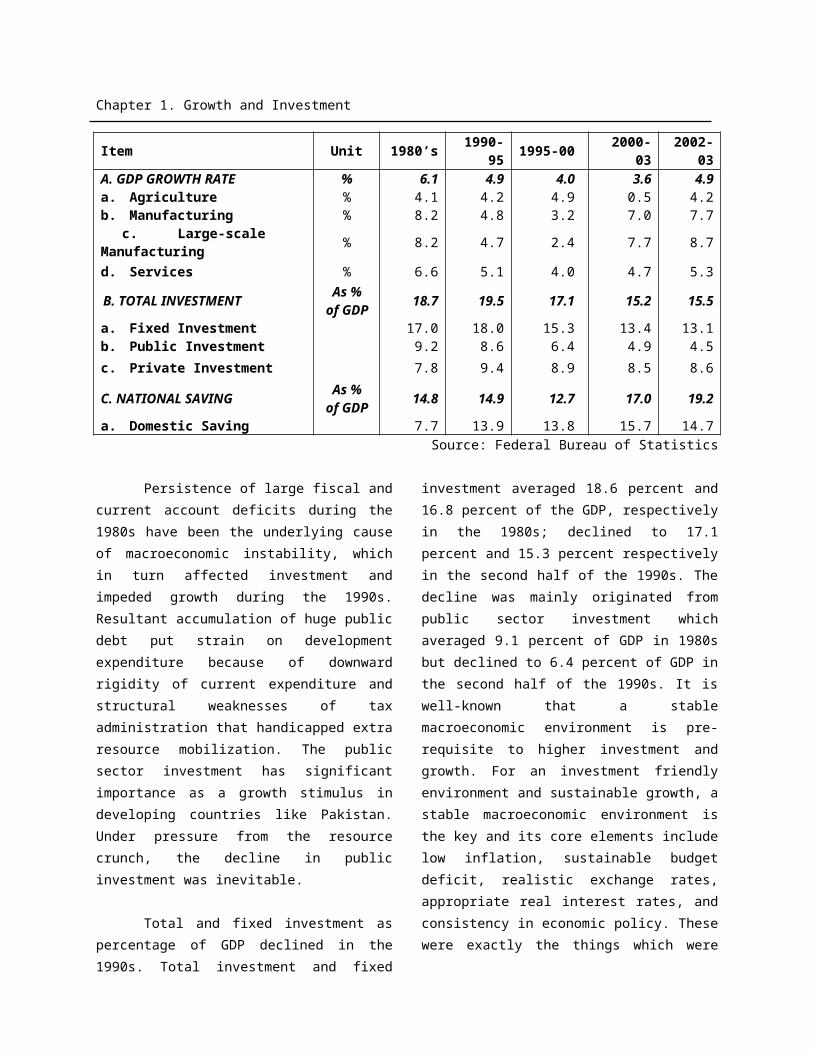
A. GDP GROWTH RATE % 6.1 4.9 4.0 3.6 4.9a. Agriculture % 4.1 4.2 4.9 0.5 4.2b. Manufacturing % 8.2 4.8 3.2 7.0 7.7
c. Large-scale Manufacturing
% 8.2 4.7 2.4 7.7 8.7
d. Services % 6.6 5.1 4.0 4.7 5.3
B. TOTAL INVESTMENTAs %
of GDP
18.7 19.5 17.1 15.2 15.5
a. Fixed Investment 17.0 18.0 15.3 13.4 13.1b. Public Investment 9.2 8.6 6.4 4.9 4.5
c. Private Investment 7.8 9.4 8.9 8.5 8.6
C. NATIONAL SAVINGAs %
of GDP
14.8 14.9 12.7 17.0 19.2
a. Domestic Saving 7.7 13.9 13.8 15.7 14.7Source: Federal Bureau of Statistics
Persistence of large fiscal and current account deficits during the 1980s have been the underlying cause of macroeconomic instability, which in turn affected investment and impeded growth during the 1990s. Resultant accumulation of huge public debt put strain on development expenditure because of downward rigidity of current expenditure and structural weaknesses of tax administration that handicapped extra resource mobilization. The public sector investment has significant importance as a growth stimulus in developing countries like Pakistan. Under pressure from the resource crunch, the decline in public investment was inevitable.
Total and fixed investment as percentage of GDP declined in the 1990s.
Total investment and fixed investment averaged 18.6 percent and 16.8 percent of the GDP, respectively in the 1980s; declined to 17.1 percent and 15.3 percent respectively in the second half of the 1990s. The decline was mainly originated from public sector investment which averaged 9.1 percent of GDP in 1980s but declined to 6.4 percent of GDP in the second half of the 1990s. It is well-known that a stable macroeconomic environment is pre-requisite to higher investment and growth. For an investment friendly environment and sustainable growth, a stable macroeconomic environment is the key and its core elements include low inflation, sustainable budget deficit, realistic exchange rates, appropriate real interest rates, and consistency in economic policy. These were exactly the things which were
Chapter 1. Growth and Investment
ignored in macro-economic policy making during the 1990s.
National saving rate also witnessed a decline from an average of 14.7 percent in the 1980s to 12.7 percent in the second half of the 1990s. Even with low investment rates, the current account showed large deficits during the 1990s. There was a shift by the end of the 1990s to finance investment from domestic sources instead of foreign resources. [See Table-1.1]. National savings as percent of GDP witnessed considerable improvement during the last three years (2000-03) and averaged 17.1 percent of GDP. The rise in national savings owes mainly to the significant turnaround in the current account balance.
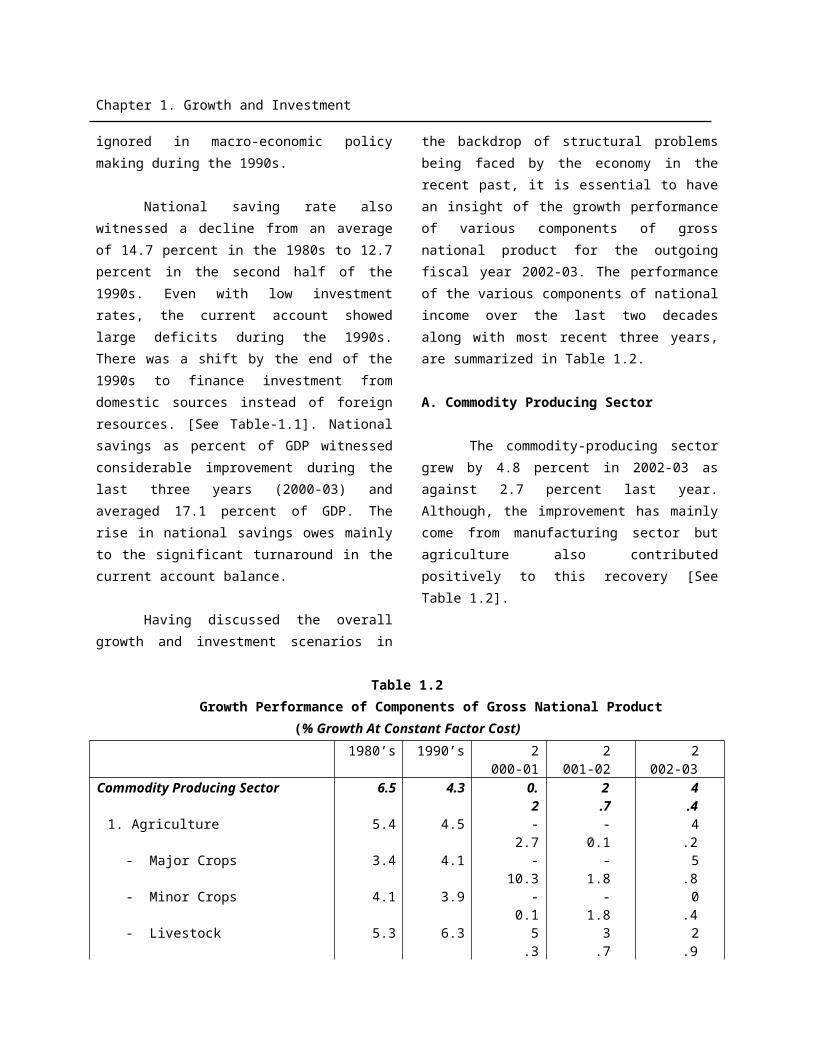
Having discussed the overall growth and investment scenarios in the backdrop of structural problems being faced by the economy in the recent past, it is essential to have an insight of the growth performance of various components of gross national product for the outgoing fiscal year 2002-03. The performance of the various components of national income over the last two decades along with most recent three years, are summarized in Table 1.2.
A. Commodity Producing Sector
The commodity-producing sector grew by 4.8 percent in 2002-03 as against 2.7 percent last year. Although, the im-provement has mainly come from manufac-turing sector but agriculture also contrib-uted positively to this recovery [See Table 1.2].
Table 1.2Growth Performance of Components of Gross National Product
(% Growth At Constant Factor Cost)1980’s 1990’s 2
000-012
001-022
002-03Commodity Producing Sector 6.5 4.3 0
.22
.74
.41. Agriculture 5.4 4.5 -
2.7-
0.14
.2- Major Crops 3.4 4.1 -
10.3-
1.85
.8- Minor Crops 4.1 3.9 -
0.1-
1.80
.4- Livestock 5.3 6.3 5
.33
.72
.9- Fishing 7.3 3.5 -
3.7-
12.01
6.6- Forestry 6.4 6.5 9
.6-
1.38
.92. Mining & Quarrying 9.5 2.9 4
.83
.79
.53. Manufacturing 8.2 4.0 8
.25
.07
.8- Large Scale 8.2 3.5 9
.54
.98
.7- Small Scale 8.4 5.3 5
.35
.35
.34. Construction 4.7 2.6 -
0.44
.33
.4
Chapter 1. Growth and Investment
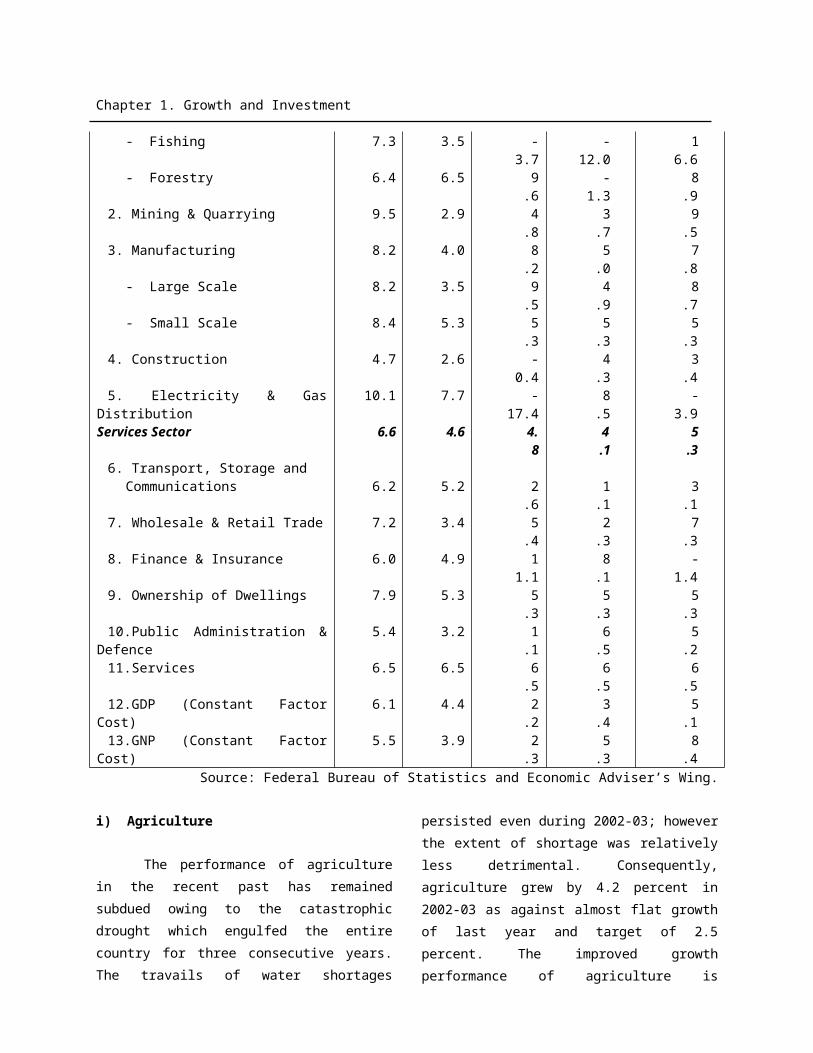
5. Electricity & Gas Distribution 10.1 7.7 -17.4
8.5
-3.9
Services Sector 6.6 4.6 4.8
4.1
5.3
6. Transport, Storage and Communications 6.2 5.2 2
.61
.13
.17. Wholesale & Retail Trade 7.2 3.4 5
.42
.37
.38. Finance & Insurance 6.0 4.9 1
1.18
.1-
1.49. Ownership of Dwellings 7.9 5.3 5
.35
.35
.310.Public Administration &
Defence5.4 3.2 1
.16
.55
.211.Services 6.5 6.5 6
.56
.56
.512.GDP (Constant Factor Cost) 6.1 4.4 2
.23
.45
.113.GNP (Constant Factor Cost) 5.5 3.9 2
.35
.38
.4Source: Federal Bureau of Statistics and Economic Adviser’s Wing.
i) Agriculture
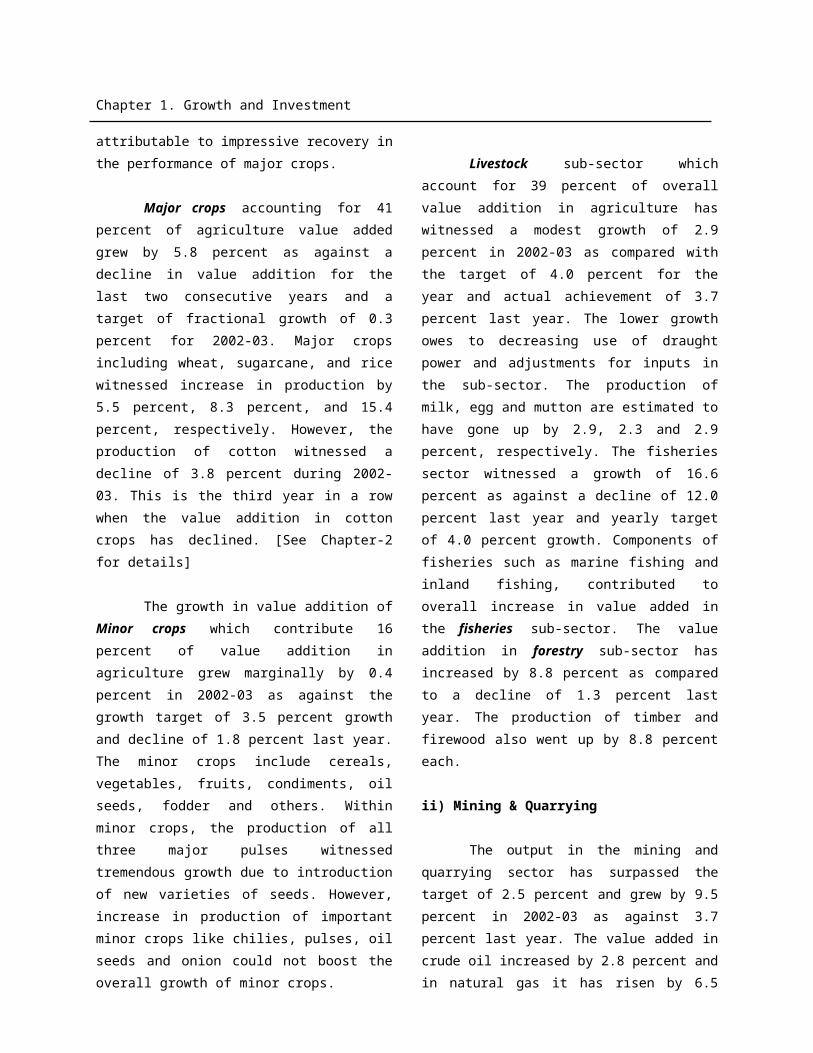
The performance of agriculture in the recent past has remained subdued owing to the catastrophic drought which engulfed the entire country for three consecutive years. The travails of water shortages persisted even during 2002-03; however the extent of shortage was relatively less detrimental. Consequently, agriculture grew by 4.2 percent in 2002-03 as against almost flat growth of last year and target of 2.5 percent. The improved growth performance of agriculture is attributable to impressive recovery in the performance of major crops.
Major crops accounting for 41 percent of agriculture value added grew by 5.8 percent as against a decline in value addition for the last two consecutive years and a target of fractional growth of 0.3 percent for 2002-03. Major crops including wheat, sugarcane, and rice witnessed increase in production by 5.5 percent, 8.3 percent, and 15.4 percent, respectively. However, the production of cotton witnessed a decline of 3.8 percent during
2002-03. This is the third year in a row when the value addition in cotton crops has declined. [See Chapter-2 for details]
The growth in value addition of Minor crops which contribute 16 percent of value addition in agriculture grew marginally by 0.4 percent in 2002-03 as against the growth target of 3.5 percent growth and decline of 1.8 percent last year. The minor crops include cereals, vegetables, fruits, condiments, oil seeds, fodder and others. Within minor crops, the production of all three major pulses witnessed tremendous growth due to introduction of new varieties of seeds. However, increase in production of important minor crops like chilies, pulses, oil seeds and onion could not boost the overall growth of minor crops.
Livestock sub-sector which account for 39 percent of overall value addition in agriculture has witnessed a modest growth of 2.9 percent in 2002-03 as compared with the target of 4.0 percent for the year and
Chapter 1. Growth and Investment
actual achievement of 3.7 percent last year. The lower growth owes to decreasing use of draught power and adjustments for inputs in the sub-sector. The production of milk, egg and mutton are estimated to have gone up by 2.9, 2.3 and 2.9 percent, respectively. The fisheries sector witnessed a growth of 16.6 percent as against a decline of 12.0 percent last year and yearly target of 4.0 percent growth. Components of fisheries such as marine fishing and inland fishing, contributed to overall increase in value added in the fisheries sub-sector. The value addition in forestry sub-sector has increased by 8.8 percent as compared to a decline of 1.3 percent last year. The production of timber and firewood also went up by 8.8 percent each.
ii) Mining & Quarrying
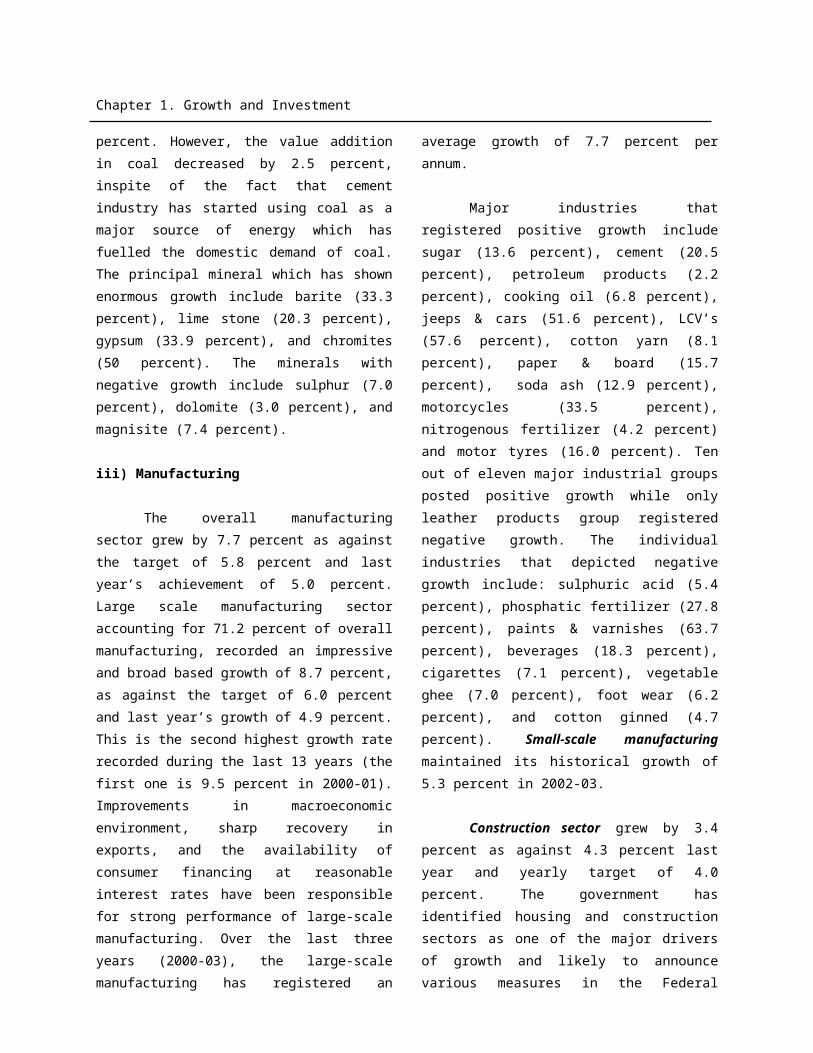
The output in the mining and quarrying sector has surpassed the target of 2.5 percent and grew by 9.5 percent in 2002-03 as against 3.7 percent last year. The value added in crude oil increased by 2.8 percent and in natural gas it has risen by 6.5 percent. However, the value addition in coal decreased by 2.5 percent, inspite of the fact that cement industry has started using coal as a major source of energy which has fuelled the domestic demand of coal. The principal mineral which has shown enormous growth include barite (33.3 percent), lime stone (20.3 percent), gypsum (33.9 percent), and chromites (50 percent). The minerals with negative growth include sulphur (7.0 percent), dolomite (3.0 percent), and magnisite (7.4 percent).
iii) Manufacturing
The overall manufacturing sector grew by 7.7 percent as against the target of 5.8 percent and last year’s achievement of 5.0 percent. Large scale manufacturing
sector accounting for 71.2 percent of overall manufacturing, recorded an impressive and broad based growth of 8.7 percent, as against the target of 6.0 percent and last year’s growth of 4.9 percent. This is the second highest growth rate recorded during the last 13 years (the first one is 9.5 percent in 2000-01). Improvements in macroeconomic environment, sharp recovery in exports, and the availability of consumer financing at reasonable interest rates have been responsible for strong performance of large-scale manufacturing. Over the last three years (2000-03), the large-scale manufacturing has registered an average growth of 7.7 percent per annum.
Major industries that registered positive growth include sugar (13.6 percent), cement (20.5 percent), petroleum products (2.2 percent), cooking oil (6.8 percent), jeeps & cars (51.6 percent), LCV’s (57.6 percent), cotton yarn (8.1 percent), paper & board (15.7 percent), soda ash (12.9 percent), motorcycles (33.5 percent), nitrogenous fertilizer (4.2 percent) and motor tyres (16.0 percent). Ten out of eleven major industrial groups posted positive growth while only leather products group registered negative growth. The individual industries that depicted negative growth include: sulphuric acid (5.4 percent), phosphatic fertilizer (27.8 percent), paints & varnishes (63.7 percent), beverages (18.3 percent), cigarettes (7.1 percent), vegetable ghee (7.0 percent), foot wear (6.2 percent), and cotton ginned (4.7 percent). Small-scale manufacturing maintained its historical growth of 5.3 percent in 2002-03.
Construction sector grew by 3.4 percent as against 4.3 percent last year and yearly target of 4.0 percent. The government has identified housing and construction sectors as one of the major
Chapter 1. Growth and Investment
drivers of growth and likely to announce various measures in the Federal Budget 2003-04 to encourage activities in this sector. Electricity and gas distribution sector registered a decline of 3.9 percent as against an impressive growth of 8.5 percent last year and yearly target of 4.3 percent. This is the only sub-sector in commodity producing sector which registered a negative growth.
B. Services SectorThe Services Sector has been
growing at a faster pace than commodity producing sector of the economy for quite sometime. The trend remained unchanged even during 2002-03 as the services sector grew by 5.3 percent as against 4.1 percent of last year. Within this sector, the wholesale & retail trade and transport, storage and communication sub-sectors grew by 7.3 percent and 3.1 percent, respectively as against 2.3 percent and 1.1 percent of last year.
Finance and insurance sub-sector remained depressed as far as value addition is concerned. The sub-sector registered a decline of 1.4 percent in value addition during 2002-03 as against the target of 5.0 percent positive growth and last year’s actual achievement of 8.1 percent growth. Public administration and defence has depicted a growth of 5.2 percent as against 6.5 percent last year. Two minor sectors that is, ownership of dwellings and social services, have maintained their estimated growth of 5.3 percent and 6.5 percent, respectively.
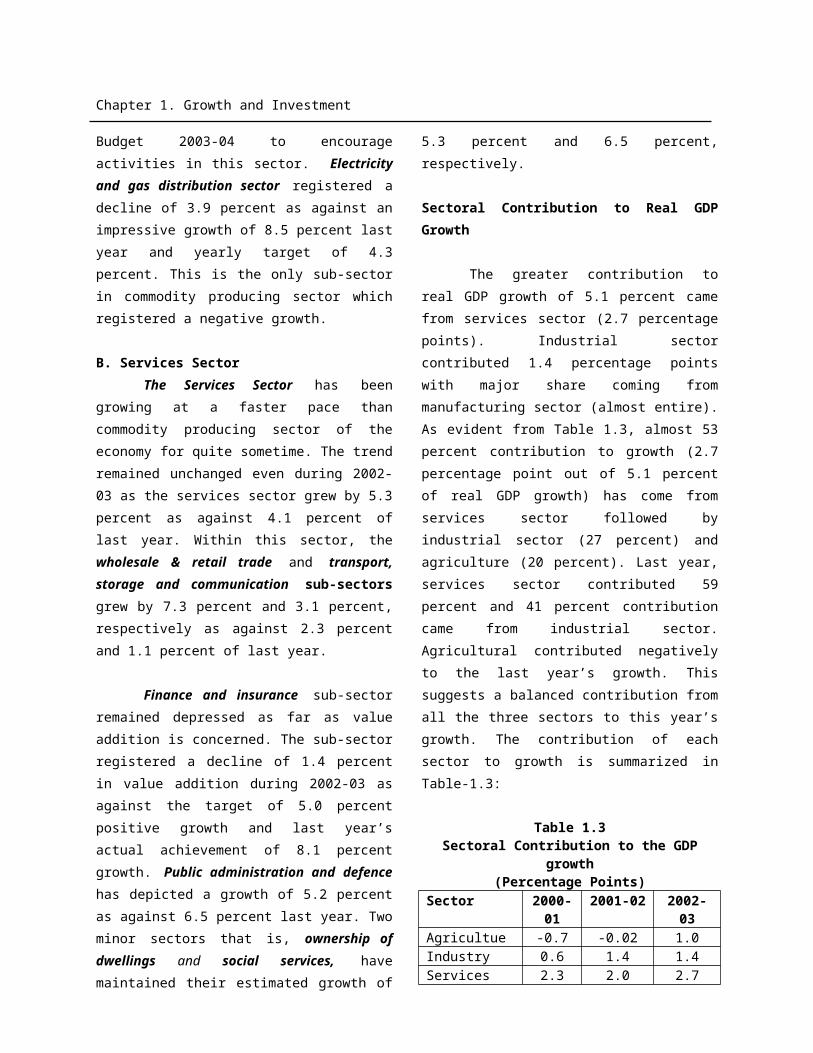
Sectoral Contribution to Real GDP Growth
The greater contribution to real GDP growth of 5.1 percent came from services sector (2.7 percentage points). Industrial
sector contributed 1.4 percentage points with major share coming from manufacturing sector (almost entire). As evident from Table 1.3, almost 53 percent contribution to growth (2.7 percentage point out of 5.1 percent of real GDP growth) has come from services sector followed by industrial sector (27 percent) and agriculture (20 percent). Last year, services sector contributed 59 percent and 41 percent contribution came from industrial sector. Agricultural contributed negatively to the last year’s growth. This suggests a balanced contribution from all the three sectors to this year’s growth. The contribution of each sector to growth is summarized in Table-1.3:
Table 1.3Sectoral Contribution to the GDP
growth(Percentage Points)
Sector 2000-01
2001-02
2002-03
Agricultue -0.7 -0.02 1.0 Industry 0.6 1.4 1.4Services 2.3 2.0 2.7Real GDP (Fc)
2.2 3.4 5.1
Source: Federal Bureau of Statistics.
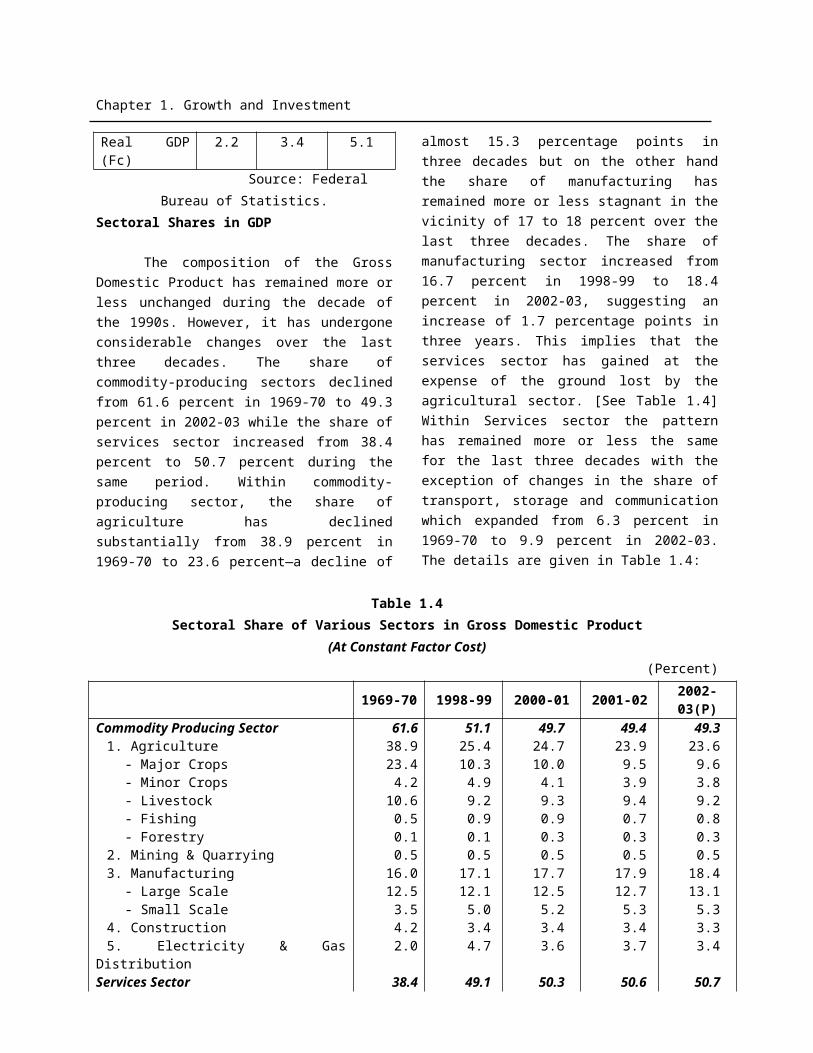
Sectoral Shares in GDP
The composition of the Gross Domestic Product has remained more or less unchanged during the decade of the 1990s. However, it has undergone considerable changes over the last three decades. The share of commodity-producing sectors declined from 61.6 percent in 1969-70 to 49.3 percent in 2002-03 while the share of services sector increased from 38.4 percent to 50.7 percent during the same period. Within commodity-producing sector, the share of agriculture has declined substantially from 38.9 percent in 1969-70 to 23.6 percent—a decline of almost 15.3 percentage points in three decades but on the other hand the
Chapter 1. Growth and Investment
share of manufacturing has remained more or less stagnant in the vicinity of 17 to 18 percent over the last three decades. The share of manufacturing sector increased from 16.7 percent in 1998-99 to 18.4 percent in 2002-03, suggesting an increase of 1.7 percentage points in three years. This implies that the services sector has gained at the expense of the ground lost by the
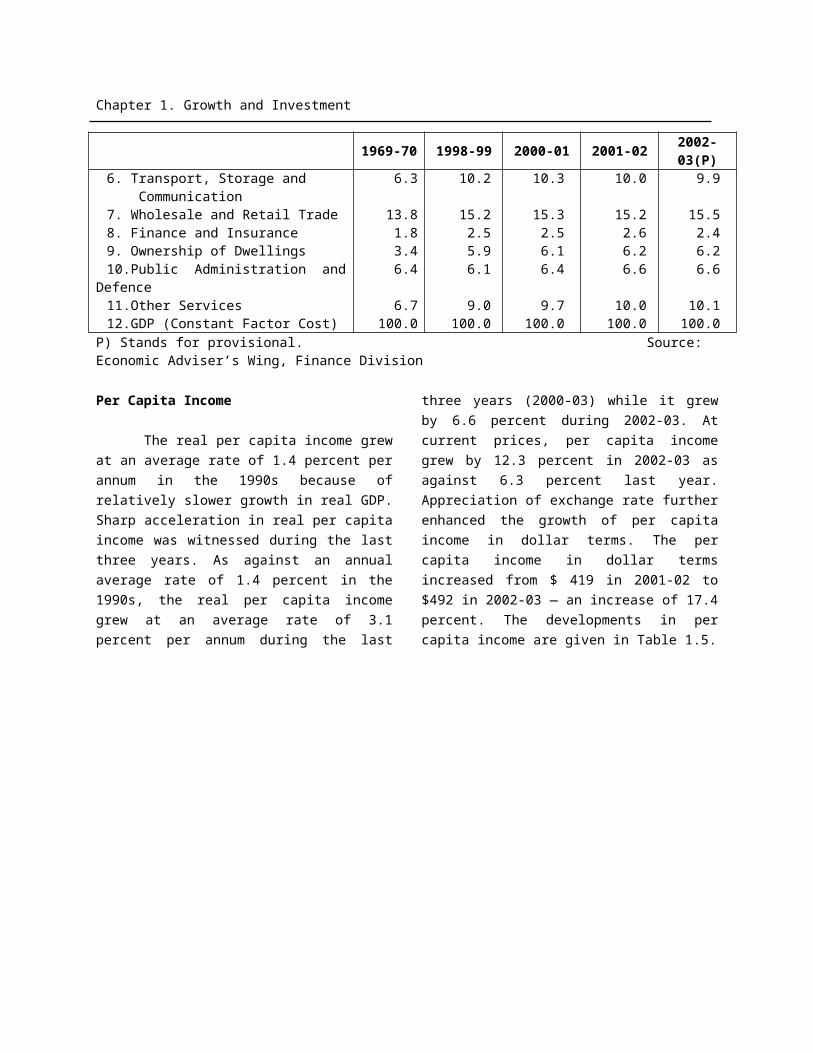
agricultural sector. [See Table 1.4] Within Services sector the pattern has remained more or less the same for the last three decades with the exception of changes in the share of transport, storage and communication which expanded from 6.3 percent in 1969-70 to 9.9 percent in 2002-03. The details are given in Table 1.4:
Table 1.4Sectoral Share of Various Sectors in Gross Domestic Product
(At Constant Factor Cost)(Percent)
1969-70
1998-99 2000-01 2001-02 2002-03(P)
Commodity Producing Sector 61.6 51.1 49.7 49.4 49.31. Agriculture 38.9 25.4 24.7 23.9 23.6
- Major Crops 23.4 10.3 10.0 9.5 9.6- Minor Crops 4.2 4.9 4.1 3.9 3.8- Livestock 10.6 9.2 9.3 9.4 9.2- Fishing 0.5 0.9 0.9 0.7 0.8- Forestry 0.1 0.1 0.3 0.3 0.3
2. Mining & Quarrying 0.5 0.5 0.5 0.5 0.53. Manufacturing 16.0 17.1 17.7 17.9 18.4
- Large Scale 12.5 12.1 12.5 12.7 13.1- Small Scale 3.5 5.0 5.2 5.3 5.3
4. Construction 4.2 3.4 3.4 3.4 3.35. Electricity & Gas Distribution 2.0 4.7 3.6 3.7 3.4
Services Sector 38.4 49.1 50.3 50.6 50.76. Transport, Storage and Communication
6.3 10.2 10.3 10.0 9.9
7. Wholesale and Retail Trade 13.8 15.2 15.3 15.2 15.58. Finance and Insurance 1.8 2.5 2.5 2.6 2.49. Ownership of Dwellings 3.4 5.9 6.1 6.2 6.210.Public Administration and
Defence6.4 6.1 6.4 6.6 6.6
11.Other Services 6.7 9.0 9.7 10.0 10.112.GDP (Constant Factor Cost) 100.0 100.0 100.0 100.0 100.0
P) Stands for provisional. Source: Economic Adviser’s Wing, Finance Division
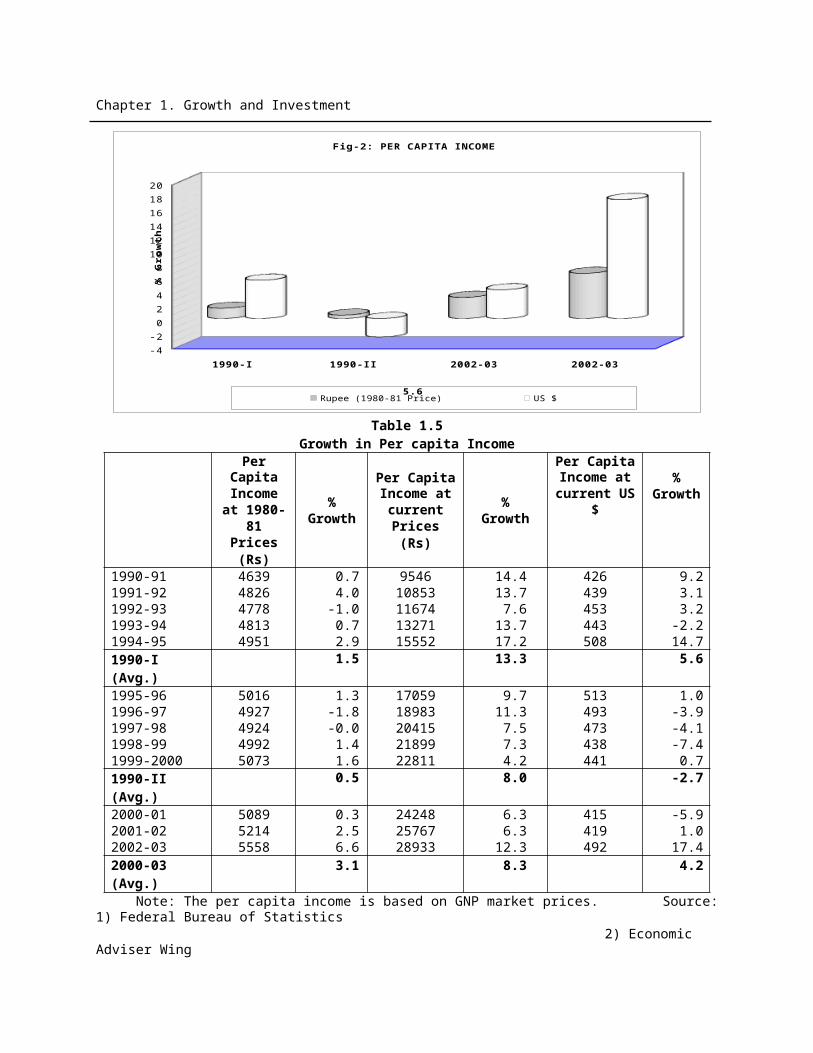
Per Capita Income
The real per capita income grew at an average rate of 1.4 percent per annum in the 1990s because of relatively slower growth in real GDP. Sharp acceleration in real per capita income was witnessed during the last three years. As against an annual average rate of 1.4 percent in the 1990s, the real per capita income grew at
an average rate of 3.1 percent per annum during the last three years (2000-03) while it grew by 6.6 percent during 2002-03. At current prices, per capita income grew by 12.3 percent in 2002-03 as against 6.3 percent last year. Appreciation of exchange rate further enhanced the growth of per capita income in dollar terms. The per capita income in dollar terms increased from $ 419 in 2001-02 to $492 in 2002-03
Chapter 1. Growth and Investment
— an increase of 17.4 percent. The developments in per capita income are
given in Table 1.5.
1990-I 1990-II 2002-03 2002-03
-4
-2
0
2
4
6
8
10
12
14
16
18
20
5.6
Fig-2: PER CAPITA INCOME
Rupee (1980-81 Price) US $
% G
row
th
Table 1.5Growth in Per capita Income
Per Capita Income at 1980-81 Prices
(Rs)
%Growth
Per Capita Income at
current Prices (Rs)
%Growth
Per Capita Income at current US
$
%Growt
h
1990-91 4639 0.7 9546 14.4 426 9.21991-92 4826 4.0 10853 13.7 439 3.11992-93 4778 -1.0 11674 7.6 453 3.21993-94 4813 0.7 13271 13.7 443 -2.21994-95 4951 2.9 15552 17.2 508 14.71990-I (Avg.)
1.5 13.3 5.6
1995-96 5016 1.3 17059 9.7 513 1.01996-97 4927 -1.8 18983 11.3 493 -3.91997-98 4924 -0.0 20415 7.5 473 -4.11998-99 4992 1.4 21899 7.3 438 -7.41999-2000 5073 1.6 22811 4.2 441 0.71990-II (Avg.)
0.5 8.0 -2.7
2000-01 5089 0.3 24248 6.3 415 -5.92001-02 5214 2.5 25767 6.3 419 1.02002-03 5558 6.6 28933 12.3 492 17.42000-03 (Avg.)
3.1 8.3 4.2
Note: The per capita income is based on GNP market prices. Source: 1) Federal Bureau of Statistics
2) Economic Adviser Wing
Chapter 1. Growth and Investment
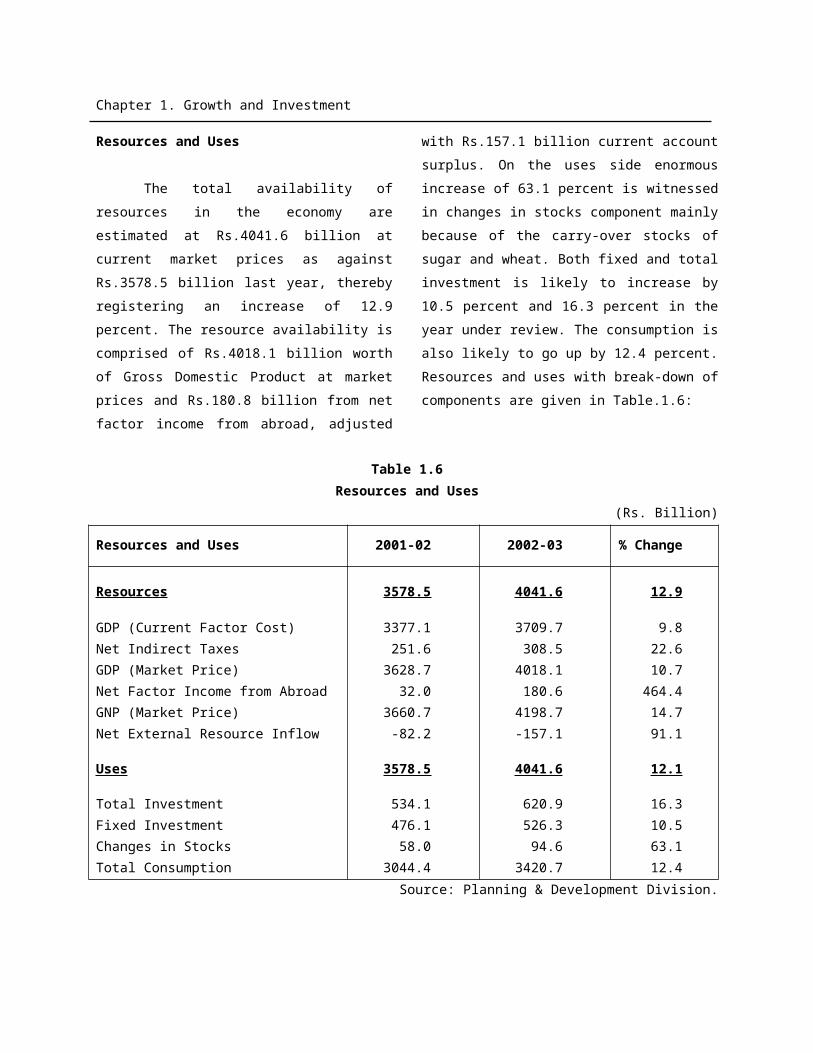
Resources and Uses
The total availability of resources in
the economy are estimated at Rs.4041.6
billion at current market prices as against
Rs.3578.5 billion last year, thereby
registering an increase of 12.9 percent. The
resource availability is comprised of
Rs.4018.1 billion worth of Gross Domestic
Product at market prices and Rs.180.8
billion from net factor income from abroad,
adjusted with Rs.157.1 billion current
account surplus. On the uses side enormous
increase of 63.1 percent is witnessed in
changes in stocks component mainly
because of the carry-over stocks of sugar
and wheat. Both fixed and total investment
is likely to increase by 10.5 percent and
16.3 percent in the year under review. The
consumption is also likely to go up by 12.4
percent. Resources and uses with break-
down of components are given in Table.1.6:
Table 1.6Resources and Uses
(Rs. Billion)
Resources and Uses 2001-02 2002-03%
Change
Resources 3578.5 4041.6 12.9
GDP (Current Factor Cost) 3377.1 3709.7 9.8Net Indirect Taxes 251.6 308.5 22.6GDP (Market Price) 3628.7 4018.1 10.7Net Factor Income from Abroad 32.0 180.6 464.4GNP (Market Price) 3660.7 4198.7 14.7Net External Resource Inflow -82.2 -157.1 91.1
Uses 3578.5 4041.6 12.1
Total Investment 534.1 620.9 16.3Fixed Investment 476.1 526.3 10.5Changes in Stocks 58.0 94.6 63.1Total Consumption 3044.4 3420.7 12.4
Source: Planning & Development Division.
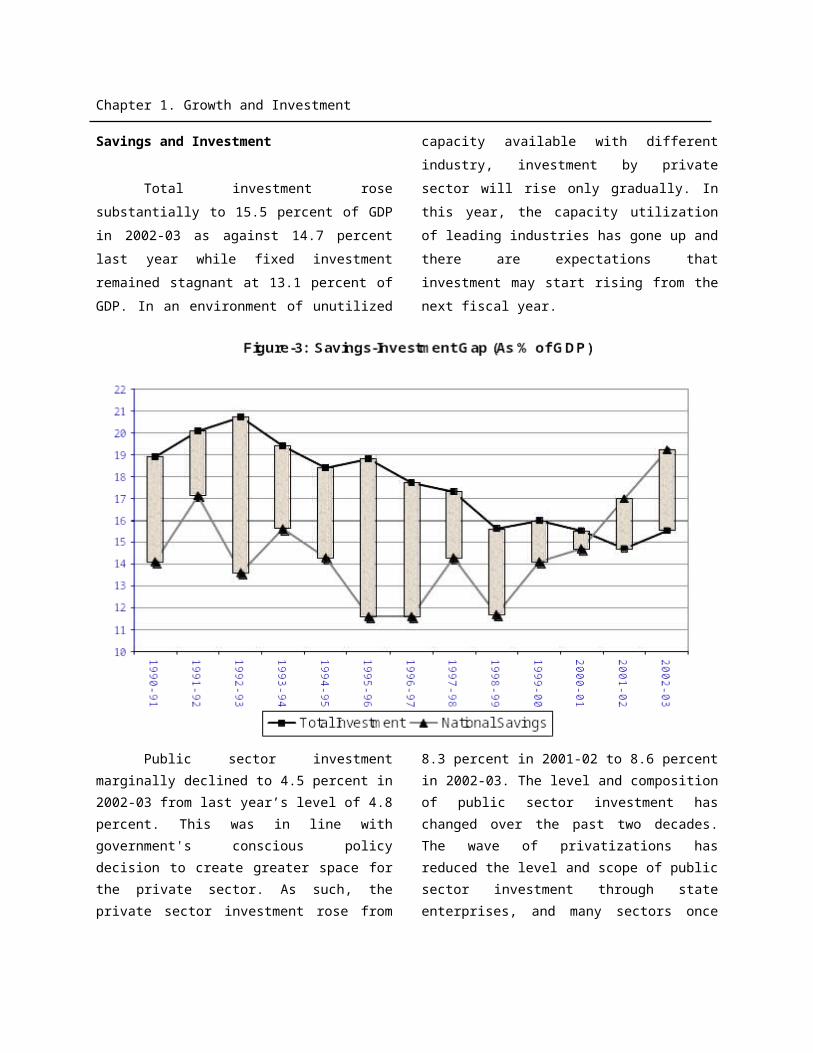
Savings and Investment
Total investment rose substantially
to 15.5 percent of GDP in 2002-03 as
against 14.7 percent last year while fixed
investment remained stagnant at 13.1
percent of GDP. In an environment of
unutilized capacity available with different
industry, investment by private sector will
rise only gradually. In this year, the
capacity utilization of leading industries has
gone up and there are expectations that
investment may start rising from the next
fiscal year.
Chapter 1. Growth and Investment
Public sector investment marginally declined to 4.5 percent in 2002-03 from last year’s level of 4.8 percent. This was in line with government's conscious policy decision to create greater space for the private sector. As such, the private sector investment rose from 8.3 percent in 2001-02 to 8.6 percent in 2002-03. The level and composition of public sector investment has changed over the past two decades. The wave of privatizations has reduced the level
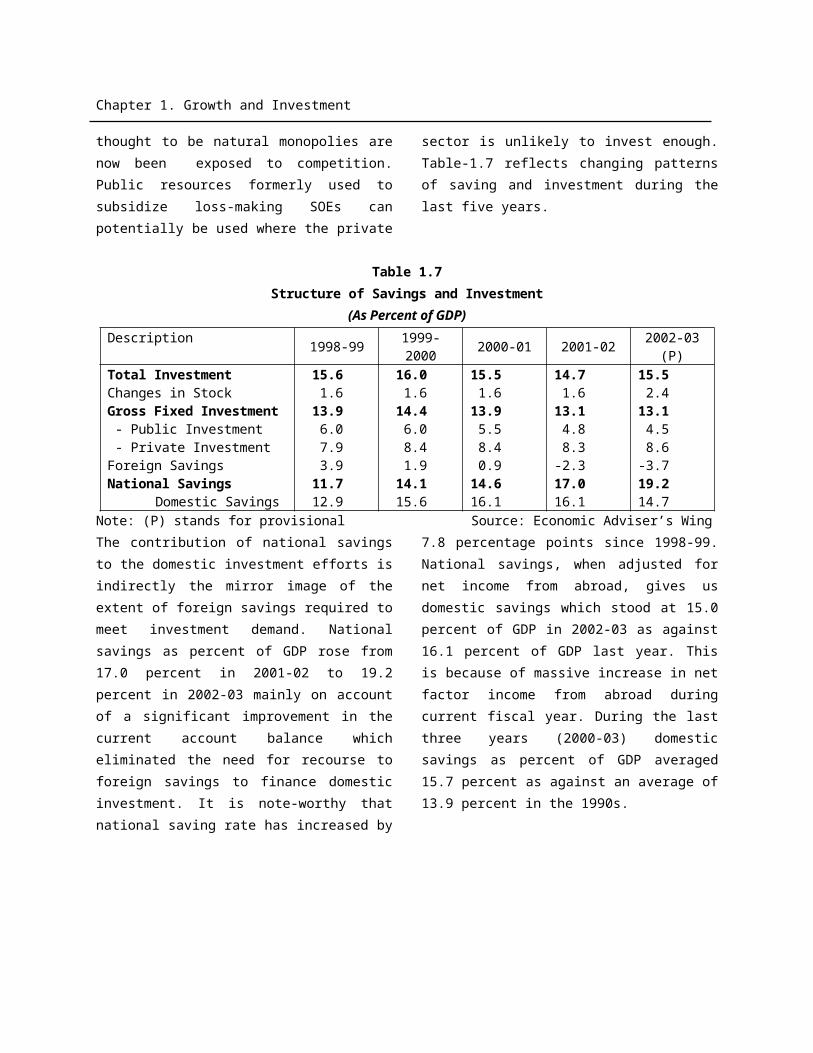
and scope of public sector investment through state enterprises, and many sectors once thought to be natural monopolies are now been exposed to competition. Public resources formerly used to subsidize loss-making SOEs can potentially be used where the private sector is unlikely to invest enough. Table-1.7 reflects changing patterns of saving and investment during the last five years.
Table 1.7Structure of Savings and Investment
(As Percent of GDP)Description 1998-99 1999-
20002000-01 2001-02 2002-03
(P)Total Investment 15.6 16.0 15.5 14.7 15.5Changes in Stock 1.6 1.6 1.6 1.6 2.4Gross Fixed Investment 13.9 14.4 13.9 13.1 13.1 - Public Investment 6.0 6.0 5.5 4.8 4.5
Chapter 1. Growth and Investment
- Private Investment 7.9 8.4 8.4 8.3 8.6Foreign Savings 3.9 1.9 0.9 -2.3 -3.7National Savings 11.7 14.1 14.6 17.0 19.2
Domestic Savings 12.9 15.6 16.1 16.1 14.7Note: (P) stands for provisional Source: Economic Adviser’s WingThe contribution of national savings to the domestic investment efforts is indirectly the mirror image of the extent of foreign savings required to meet investment demand. National savings as percent of GDP rose from 17.0 percent in 2001-02 to 19.2 percent in 2002-03 mainly on account of a significant improvement in the current account balance which eliminated the need for recourse to foreign savings to finance domestic investment. It is note-worthy that national saving rate has increased by 7.8
percentage points since 1998-99. National savings, when adjusted for net income from abroad, gives us domestic savings which stood at 15.0 percent of GDP in 2002-03 as against 16.1 percent of GDP last year. This is because of massive increase in net factor income from abroad during current fiscal year. During the last three years (2000-03) domestic savings as percent of GDP averaged 15.7 percent as against an average of 13.9 percent in the 1990s.
Chapter 2. Agriculture
2. AgricultureAgriculture sector being the lynchpin
of the country’s economy continues to be the single largest sector and a dominant driving force for growth and development of the national economy. It accounts for 24 percent of the GDP and employs 48.4 percent of the total work force. Agriculture contributes to growth as a supplier of raw materials to industry as well as a market for industrial products and also contributes substantially to Pakistan’s exports earnings. Almost 67.5 percent of country’s population are living in rural areas and are directly or indirectly linked with agriculture for their livelihood. Any improvement in agriculture will not only help country’s economic growth to rise at a faster rate but will also benefit a large segment of the country’s population.
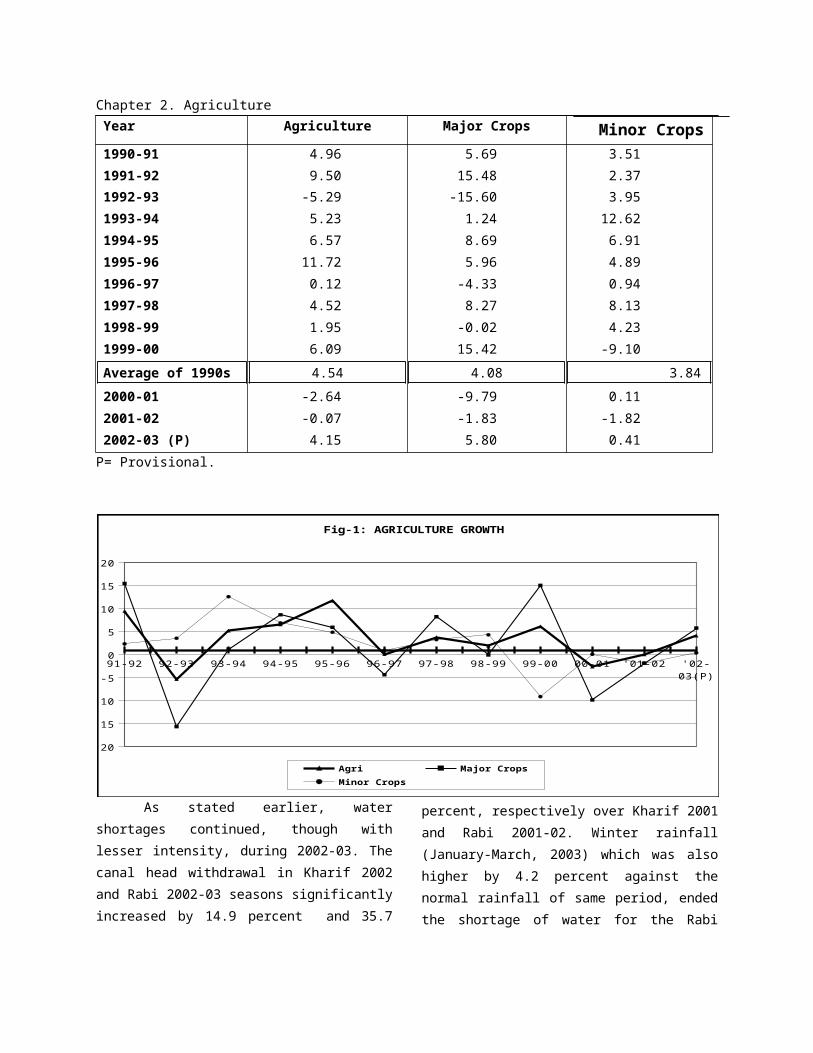
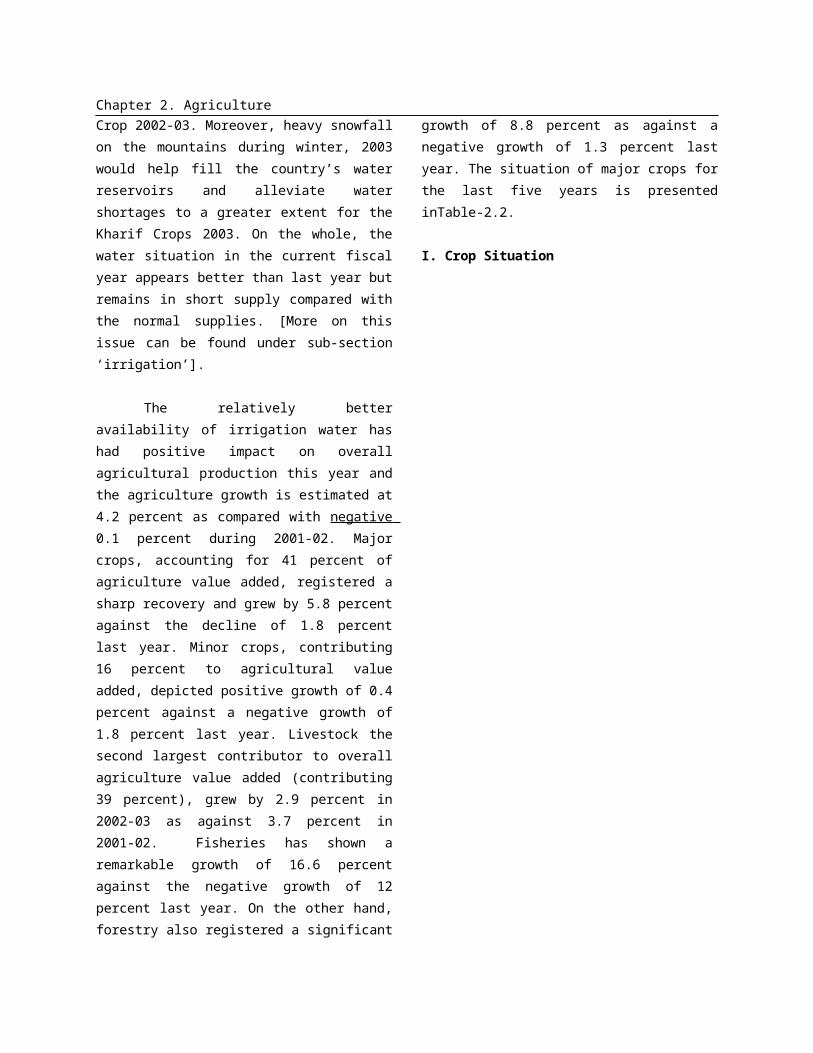
Agriculture sector has grown at an average rate of 4.5 percent per annum during the decade of the 1990s (Table-2.1) . The growth, however, has fluctuated widely – rising by as high as 11.7 percent and declining by 5.3 percent. Over the last three years in general but the first two years (2000-01 and 2001-02) of the new millennium in particular, Pakistan has witnessed crippling drought which badly affected its agriculture. Overall agricultural growth turned negative for these two years (See Table 2.1). The travails of water shortage persisted even during 2002-03, however the extent of shortage was relatively less. Notwithstanding shortage of water, Agriculture grew by 4.2 percent in 2002-03 (See Table 2.1).
Table 2.1
Agriculture Growth(Percent)
Year Agriculture Major Crops Minor Crops1990-911991-92
4.969.50
5.6915.48
3.512.37
1992-931993-941994-951995-961996-971997-981998-991999-00
-5.295.236.57
11.720.124.521.956.09
-15.601.248.695.96
-4.338.27
-0.0215.42
3.9512.62
6.914.890.948.134.23
-9.10
Chapter 2. Agriculture
Average of 1990s
2000-012001-022002-03 (P)
4.54
-2.64-0.074.15
4.08
-9.79-1.835.80
3.84
0.11-1.820.41
P= Provisional.
As stated earlier, water shortages continued, though with lesser intensity, during 2002-03. The canal head withdrawal in Kharif 2002 and Rabi 2002-03 seasons significantly increased by 14.9 percent and 35.7 percent, respectively over Kharif 2001 and Rabi 2001-02. Winter rainfall (January-March, 2003) which was also higher by 4.2 percent against the normal rainfall of same period, ended the shortage of water for the Rabi Crop 2002-03. Moreover, heavy snowfall on the mountains during winter, 2003 would help fill the country’s water reservoirs and alleviate water shortages to a greater extent for the Kharif Crops 2003. On the whole, the water situation in the current fiscal year appears better than last year but remains in short supply compared with the normal supplies. [More on this issue can be found under sub-section ‘irrigation’].
The relatively better availability of irrigation water has had positive impact on overall agricultural production this year and the agriculture growth is estimated at 4.2 percent as compared with negative 0.1 percent during 2001-02. Major crops, accounting for 41 percent of agriculture value added, registered a sharp recovery and grew by 5.8 percent against the decline of 1.8 percent last year. Minor crops, contributing 16 percent to agricultural value added, depicted positive growth of 0.4 percent against a negative growth of 1.8 percent last year. Livestock the second largest contributor to overall agriculture value added (contributing 39 percent), grew by 2.9 percent in 2002-03 as against 3.7 percent in 2001-02. Fisheries has shown a remarkable growth of 16.6 percent against the negative growth of 12 percent last year. On the other hand, forestry also registered a significant growth of 8.8 percent as against a
91-92 92-93 93-94 94-95 95-96 96-97 97-98 98-99 99-00 00-01 '01-02 '02-03(P)
-20
-15
-10
-5
0
5
10
15
20
Fig-1: AGRICULTURE GROWTH
Agri Major Crops Minor Crops
Chapter 2. Agriculturenegative growth of 1.3 percent last year. The situation of major crops for the last five years is presented inTable-2.2.
I. Crop Situation
There are two principal crop seasons in Pakistan, namely the "Kharif" the sowing season of which begins in April-June and harvesting during October-December; and the "Rabi", which begins in October-December and ends in April-May. Rice, sugarcane, cotton, maize, bajra and jowar are “Kharif" crops while wheat, gram, tobacco, rapeseed, barley and mustard are "Rabi" crops. Major crops, such as, wheat, rice, cotton and sugarcane account for 90 percent of value added in major crops. The value added in major crops accounts for 41 percent of value added in overall agriculture. Thus, the four major crops (wheat, rice, cotton, and sugarcane), on average, contribute 37 percent to value added in overall agriculture. The minor crops account for 16 percent of value added in overall agriculture. The performance of the
Chapter 2. Agriculture "Kharif" and "Rabi" crops is discussed in the ensuing pages.
Chapter 2. Agriculture
Table 2.2Production of Major Crops
(000 Tonnes)
Year Cotton(000 bales) Sugarcane Rice Maize Wheat
1998-99
1999-00
2000-01
2001-02
2002-03 (P)
8790(-4.3)
11240(27.9)
10732(-4.5)
10613(-1.1)
10211(-3.8)
55191(3.9)
46333(-16.0)
43606(-5.9)
48042(10.2)
52049(8.3)
4674(7.9)
5156(10.3)
4803(-6.8)
3882(-19.2)
4478(15.4)
1665(9.8)
1652(-0.8)
1643(-0.5)
1664(1.3)
1758(5.6)
17856(-4.5)
21079(18.0)
19024(-9.7)
18227(-4.2)
19235(5.5)
P: Provisional.(July-March) Source: Ministry of Food, Agriculture and Livestock.*: Figures in parentheses are growth rates Federal Bureau of Statistics.
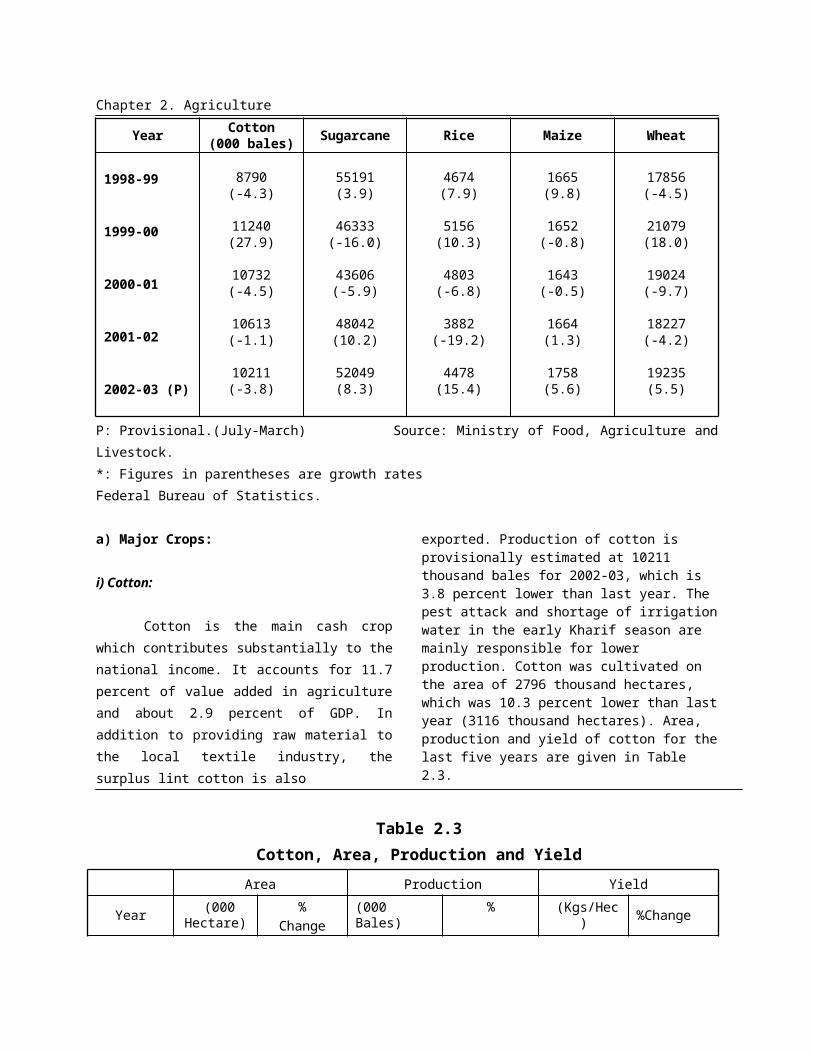
a) Major Crops:
i) Cotton:
Cotton is the main cash crop which contributes substantially to the national income. It accounts for 11.7 percent of value added in agriculture and about 2.9 percent of GDP. In addition to providing raw material to the local textile industry, the surplus lint cotton is also
exported. Production of cotton is provisionally estimated at 10211 thousand bales for 2002-03, which is 3.8 percent lower than last year. The pest attack and shortage of irrigation water in the early Kharif season are mainly responsible for lower production. Cotton was cultivated on the area of 2796 thousand hectares, which was 10.3 percent lower than last year (3116 thousand hectares). Area, production and yield of cotton for the last five years are given in Table 2.3.
Table 2.3Cotton, Area, Production and Yield
Area Production Yield
Year (000 Hectare)
%Change (000 Bales)
% Change
(Kgs/Hec) %Change
1998-991999-002000-012001-022002-03
29232983292731162796
-1.22.0
-1.96.5
-10.3
879011240107321061310211
-4.327.9-4.5-1.1-3.8
511641623579621
-3.025.4-2.8-7.17.2
Chapter 2. Agriculture
(P)
P=Provisional (July-March). Source: Ministry of Food, Agriculture and Livestock Federal Bureau of
Statistics.
90-9
1
91-9
2
92-9
3
93-9
4
94-9
5
95-9
6
96-9
7
97-9
8
98-9
9
99-0
0
00-0
1
01-0
2
02-0
3(P)
5000
6000
7000
8000
9000
10000
11000
12000
13000
14000
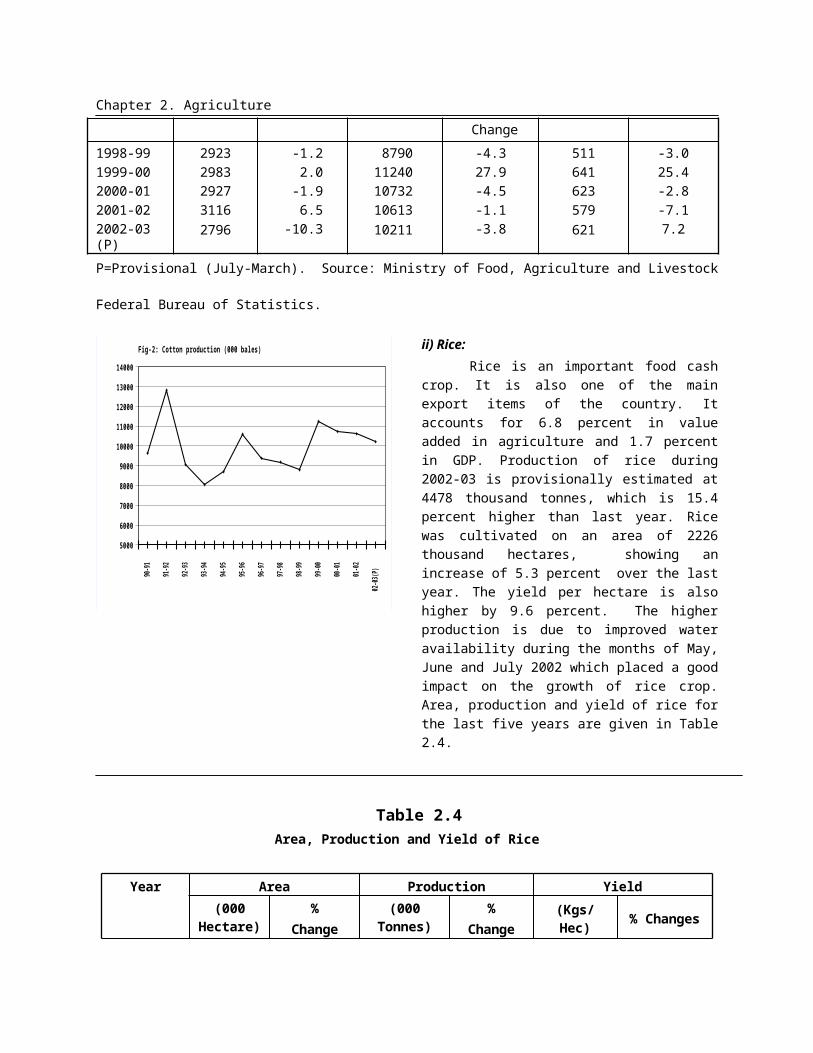
Fig-2: Cotton production (000 bales) ii) Rice:Rice is an important food cash crop. It
is also one of the main export items of the country. It accounts for 6.8 percent in value added in agriculture and 1.7 percent in GDP. Production of rice during 2002-03 is provisionally estimated at 4478 thousand tonnes, which is 15.4 percent higher than last year. Rice was cultivated on an area of 2226 thousand hectares, showing an increase of 5.3 percent over the last year. The yield per hectare is also higher by 9.6 percent. The higher production is due to improved water availability during the months of May, June and July 2002 which placed a good impact on the growth of rice crop. Area, production and yield of rice for the last five years are given in Table 2.4.
Table 2.4Area, Production and Yield of Rice
Year Area Production Yield(000
Hectare)%
Change(000
Tonnes)%
Change(Kgs/Hec)
% Changes
1998-991999-002000-012001-022002-03 (P)
24242515237721142226
4.63.8-5.5-11.15.3
46745156480338824478
7.910.3-6.8-19.215.3
19282050202118362012
3.16.3-1.4-9.19.6
P: Provisional (July-March). Source: Ministry of Food, Agriculture and Livestock.
Federal Bureau of Statistics.
Chapter 2. Agriculture
90-9
1
91-9
2
92-9
3
93-9
4
94-9
5
95-9
6
96-9
7
97-9
8
98-9
9
99-0
0
00-0
1
01-0
2
'02-0
3(P)
2000
2500
3000
3500
4000
4500
5000
5500
Fig-3: Rice production (000 Tonnes)
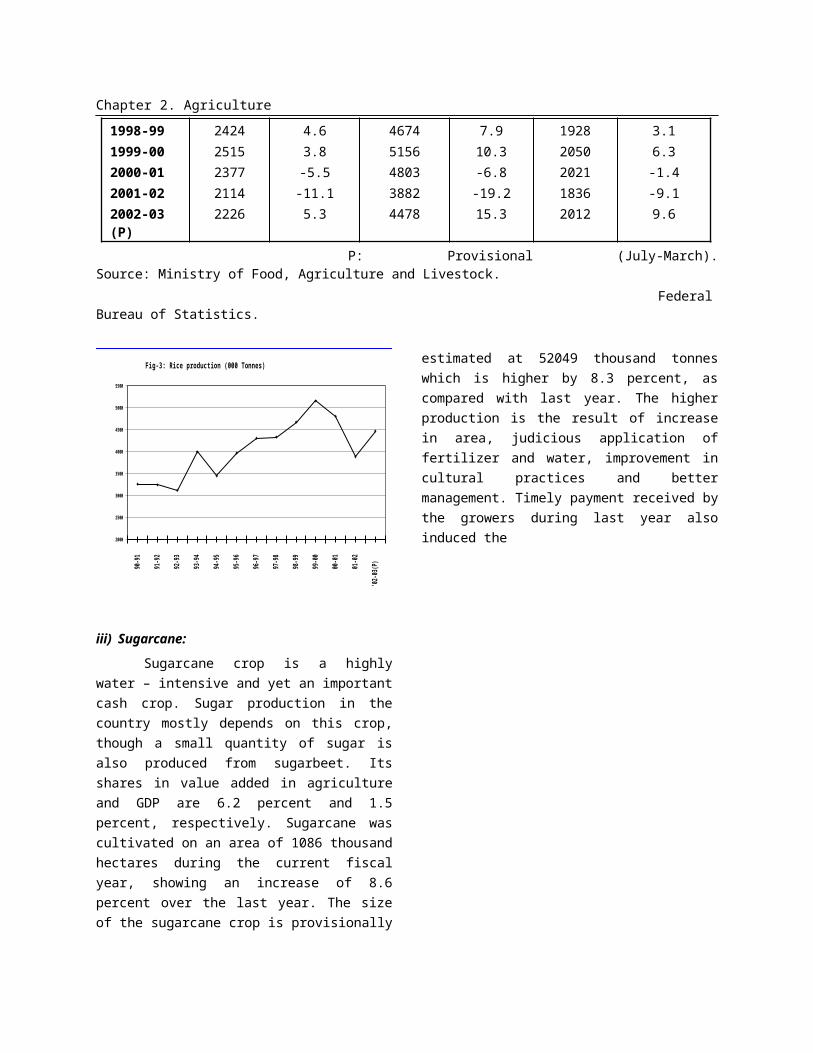
iii) Sugarcane:
Sugarcane crop is a highly water – intensive and yet an important cash crop. Sugar production in the country mostly depends on this crop, though a small quantity of sugar is also produced from sugarbeet. Its shares in value added in agriculture and GDP are 6.2 percent and 1.5 percent, respectively. Sugarcane was cultivated on an area of 1086 thousand hectares during the current fiscal year, showing an increase of 8.6 percent over the last year. The size of the sugarcane crop is provisionally estimated at 52049 thousand tonnes which is higher by 8.3 percent, as compared with last year. The higher production is the result of increase in area, judicious application of fertilizer and water, improvement in cultural practices and better management. Timely payment received by the growers during last year also induced the
farmers to grow more sugarcane. The area, production and yield per hectare for the last five years are given in Table 2.5.
Table 2.5Area, Production and Yield of Sugarcane
Year Area Production Yield(000
Hectare%
Change(000
Tonnes)%
Change(Kgs/Hec.) %
Change1998-991999-002000-012001-022002-03 (P)
11551010961
10001086
9.4-12.6-4.94.18.6
5519146333436064804252049
3.9-16.0-5.910.28.3
4778445874453764804247927
-5.0-3.9-1.15.9-0.2
Chapter 2. AgricultureP: Provisional. (July-March) Source: Ministry of Food, Agriculture and Livestock.
Federal Bureau of Statistics.90
-91
91-9
2
92-9
3
93-9
4
94-9
5
95-9
6
96-9
7
97-9
8
98-9
9
99-0
0
00-0
1
01-0
2
'02-
03(P
)
30000
35000
40000
45000
50000
55000
60000
Fig-4: Sugarcane production (000 Tonnes)
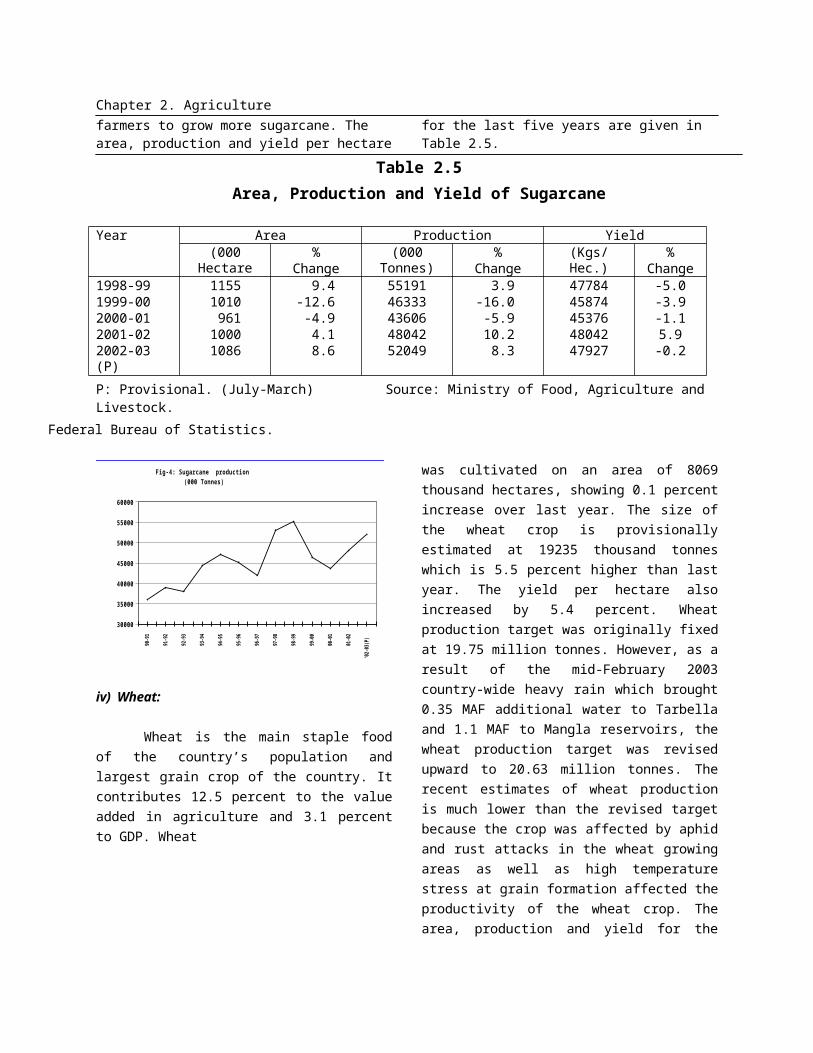
iv) Wheat:
Wheat is the main staple food of the country’s population and largest grain crop of the country. It contributes 12.5 percent to the value added in agriculture and 3.1 percent to GDP. Wheat
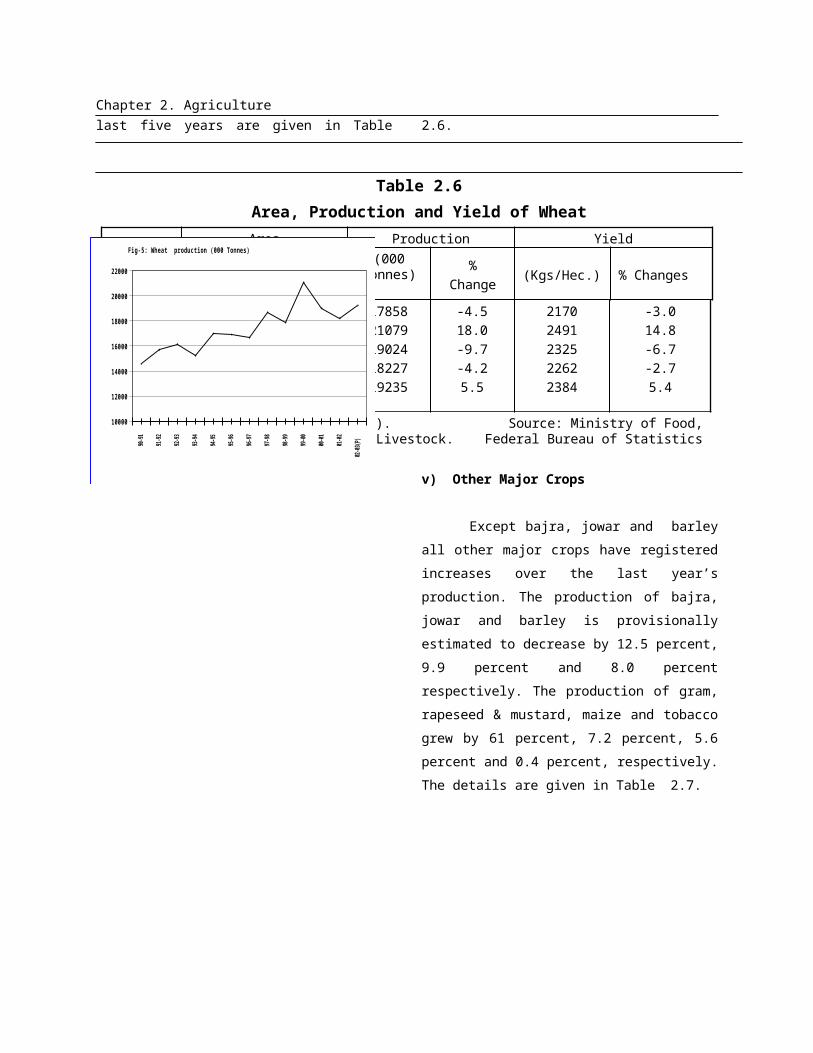
was cultivated on an area of 8069 thousand hectares, showing 0.1 percent increase over last year. The size of the wheat crop is provisionally estimated at 19235 thousand tonnes which is 5.5 percent higher than last year. The yield per hectare also increased by 5.4 percent. Wheat production target was originally fixed at 19.75 million tonnes. However, as a result of the mid-February 2003 country-wide heavy rain which brought 0.35 MAF additional water to Tarbella and 1.1 MAF to Mangla reservoirs, the wheat production target was revised upward to 20.63 million tonnes. The recent estimates of wheat production is much lower than the revised target because the crop was affected by aphid and rust attacks in the wheat growing areas as well as high temperature stress at grain formation affected the productivity of the wheat crop. The area, production and yield for the last five years are given in Table 2.6.
Table 2.6Area, Production and Yield of Wheat
YearArea Production Yield
(000 hectares)
%Change
(000 tonnes)
%Change
(Kgs/Hec.) % Changes
1998-991999-002000-012001-022002-03 (P)
82308463818180588069
-1.52.8
-3.3-1.50.1
1785821079190241822719235
-4.518.0-9.7-4.25.5
21702491232522622384
-3.014.8-6.7-2.75.4
P= Provisional.(July-March). Source: Ministry of Food, Agriculture and Livestock. Federal Bureau of Statistics
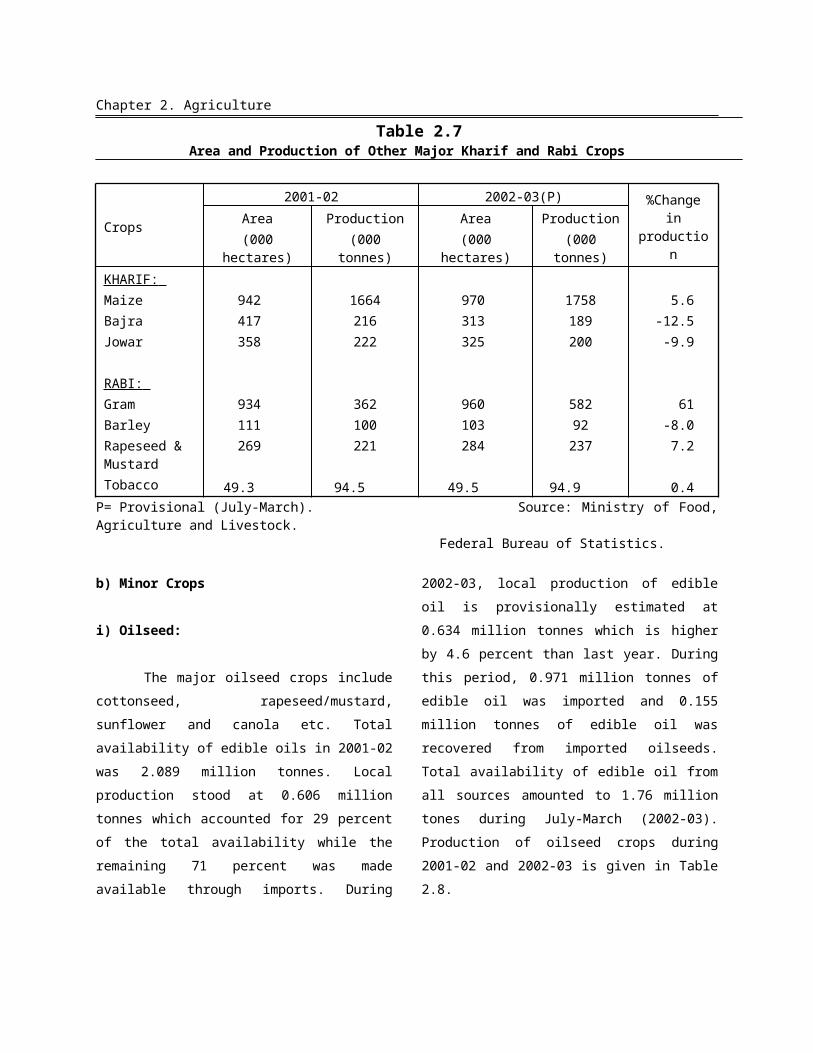
Chapter 2. Agriculturev) Other Major Crops
Except bajra, jowar and barley all
other major crops have registered increases
over the last year’s production. The
production of bajra, jowar and barley is
provisionally estimated to decrease by 12.5
percent, 9.9 percent and 8.0 percent
respectively. The production of gram,
rapeseed & mustard, maize and tobacco
grew by 61 percent, 7.2 percent, 5.6 percent
and 0.4 percent, respectively. The details
are given in Table 2.7.
Table 2.7Area and Production of Other Major Kharif and Rabi Crops
Crops
2001-02 2002-03(P) %Change
in production
Area(000
hectares)Production
(000 tonnes)Area
(000 hectares)
Production(000
tonnes)KHARIF: MaizeBajraJowar
RABI: GramBarleyRapeseed & MustardTobacco
942417358
934111269
49.3
1664216222
362100221
94.5
970313325
960103284
49.5
1758189200
58292237
94.9
5.6-12.5-9.9
61-8.07.2
0.4P= Provisional (July-March). Source: Ministry of Food, Agriculture and Livestock. Federal Bureau of Statistics.
b) Minor Crops
i) Oilseed:
The major oilseed crops include
cottonseed, rapeseed/mustard, sunflower
and canola etc. Total availability of edible oils
in 2001-02 was 2.089 million tonnes. Local
production stood at 0.606 million tonnes
which accounted for 29 percent of the total
availability while the remaining 71 percent
was made available through imports. During
2002-03, local production of edible oil is
provisionally estimated at 0.634 million
90-91
91-92
92-93
93-94
94-95
95-96
96-97
97-98
98-99
99-00
00-01
01-02
02-03
(P)
10000
12000
14000
16000
18000
20000
22000
Fig-5: Wheat production (000 Tonnes)
Chapter 2. Agriculturetonnes which is higher by 4.6 percent than
last year. During this period, 0.971 million
tonnes of edible oil was imported and 0.155
million tonnes of edible oil was recovered
from imported oilseeds. Total availability of
edible oil from all sources amounted to 1.76
million tones during July-March (2002-03).
Production of oilseed crops during 2001-02
and 2002-03 is given in Table 2.8.
Table 2.8Area and Production of Major Oilseed Crops
2001-02 2002-03 (P)Area Production Area Production
(000 Acres)
Seed(000
Tonnes)
Oil(000
Tonnes)(000
Acres)
Seed(000
Tonnes)
Oil(000
Tonnes)CottonseedRapeseed/MustardSunflowerCanolaOthers Total Oil
7772572
281122
-
3612188
19773
-
43360
792905
606
6669649
371223
-
3451217
260136
41469
9952
-634
P= Provisional Source: Pakistan Oilseed Development Board.
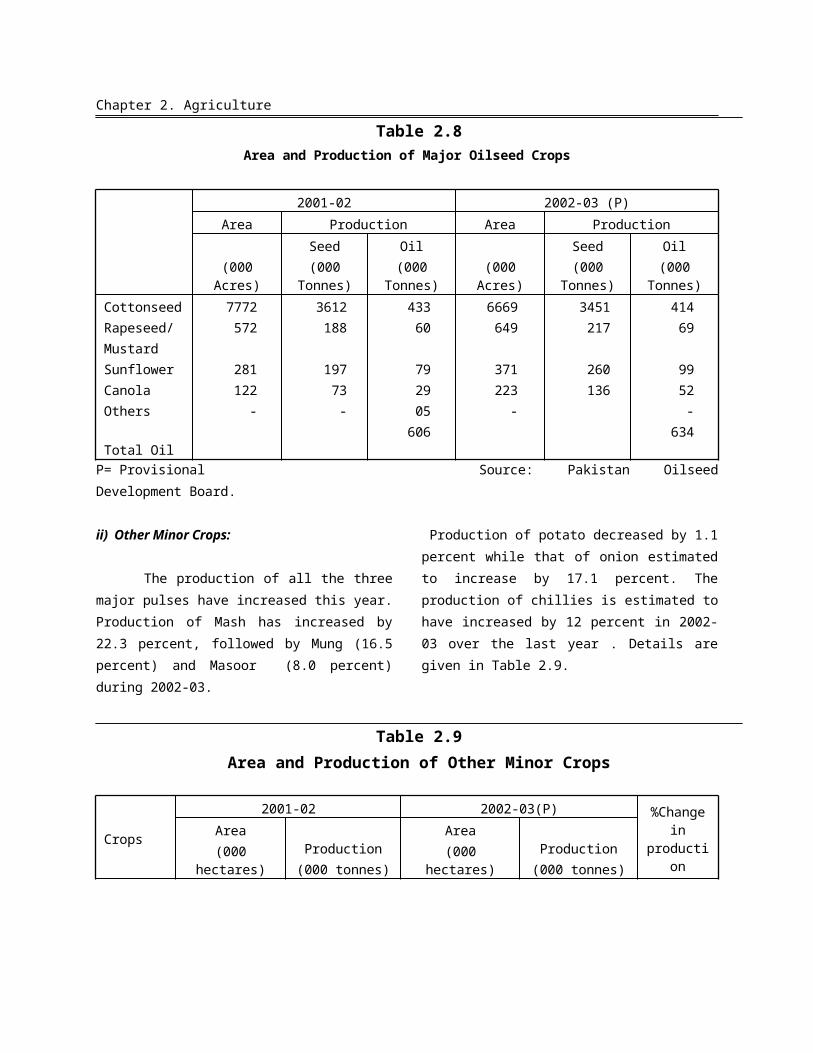
ii) Other Minor Crops:
The production of all the three major pulses have increased this year. Production of Mash has increased by 22.3 percent, followed by Mung (16.5 percent) and Masoor (8.0 percent) during 2002-03.
Production of potato decreased by 1.1 percent while that of onion estimated to increase by 17.1 percent. The production of chillies is estimated to have increased by 12 percent in 2002-03 over the last year . Details are given in Table 2.9.
Table 2.9Area and Production of Other Minor Crops
Crops
2001-02 2002-03(P) %Change in
production
Area(000
hectares)Production
(000 tonnes)Area
(000 hectares)Production
(000 tonnes)MasoorMungMashPotatoOnion
46.1219.245.7
101.5105.6
26.2115.427.8
1721.71385.0
45.8261.458.399.7
106.4
28.3134.434.0
1701.91622.0
8.016.522.3-1.117.1
Chapter 2. Agriculture
Chillies 84.5 93.3 47.4 104.5 12.0
P= Provisional (July-March). Source: Ministry of Food, Agriculture and Livestock. Federal Bureau of Statistics.
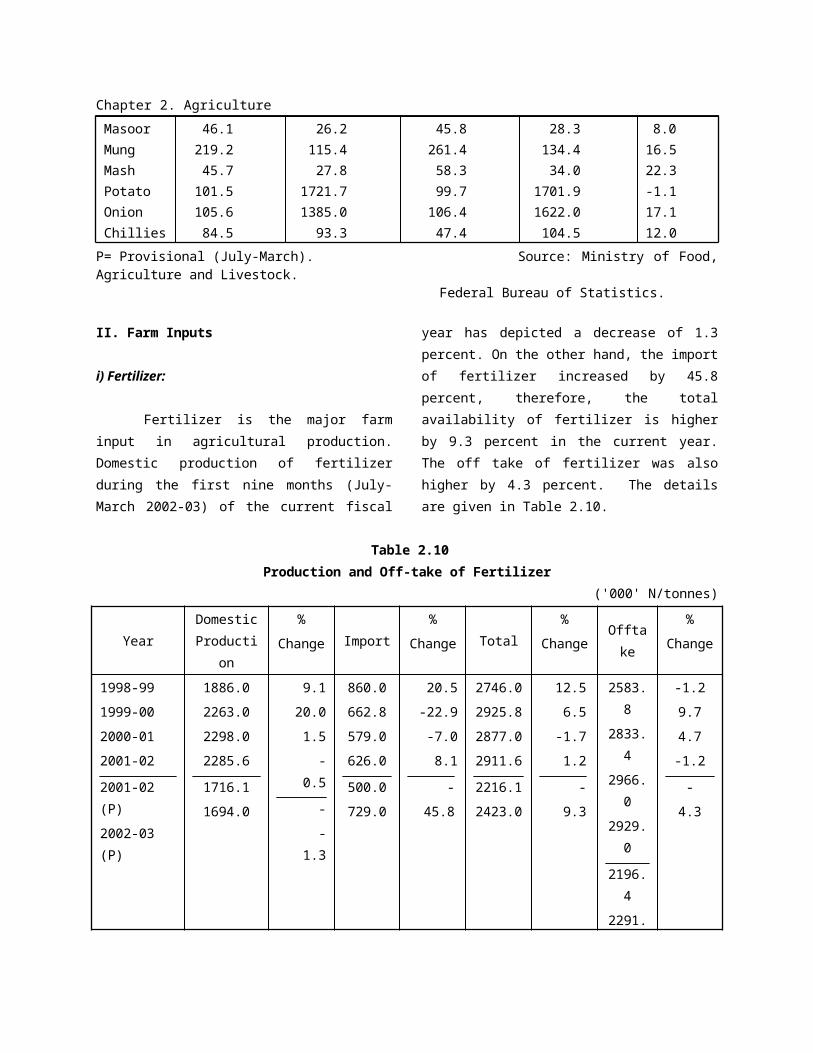
II. Farm Inputs
i) Fertilizer:
Fertilizer is the major farm input in agricultural production. Domestic production of fertilizer during the first nine months (July-March 2002-03) of the current fiscal year has
depicted a decrease of 1.3 percent. On the other hand, the import of fertilizer increased by 45.8 percent, therefore, the total availability of fertilizer is higher by 9.3 percent in the current year. The off take of fertilizer was also higher by 4.3 percent. The details are given in Table 2.10.
Table 2.10Production and Off-take of Fertilizer
('000' N/tonnes)
YearDomestic Productio
n
%
Change
Import
%
Change Total
%
Change
Offtake
%
Change
1998-99
1999-00
2000-01
2001-02
2001-02 (P)
2002-03 (P)
1886.0
2263.0
2298.0
2285.6
1716.1
1694.0
9.1
20.0
1.5
-0.5
-
-1.3
860.0
662.8
579.0
626.0
500.0
729.0
20.5
-22.9
-7.0
8.1
-
45.8
2746.0
2925.8
2877.0
2911.6
2216.1
2423.0
12.5
6.5
-1.7
1.2
-
9.3
2583.8
2833.4
2966.0
2929.0
2196.4
2291.0
-1.2
9.7
4.7
-1.2
-
4.3
P= Provisional (July-March). Source: National Fertilizer Development Centre.
ii) Improved Seed:
Quality seed of improved varieties is the key to enhance agricultural productivity. Seed has the unique position among the various agricultural inputs because the effectiveness of all other inputs mainly depend on the production potential of seeds.
Federal Seed Certification & Registration Department regulates the quality during flow of seed from breeder to growers. The Department performs its functions through seventeen Seed Testing Laboratories and Field Offices, established in various ecological zones of the country.
Chapter 2. AgricultureTo provide certified crop seeds to the
growers in public sector, Seed Corporation in Punjab and Sindh, Departments of Agriculture in Baluchistan and NWFP have been entrusted the task of seed production, processing and marketing. In private sector 394 seed companies including five multinationals have been allowed for certified seed production, processing and marketing.
With the induction of private sector into seed business, improved seed availability has increased by 16.5 percent over the seed requirement in 2001-02. During (July-March) 2002-03, 197.5 thousand tones of improved seed was procured while 147.6 thousand tones of improved seed was distributed, which was 11.9 percent higher than the same period of 2001-02.
iii) Mechanization:
Pakistan food security and agriculture surpluses for export at competitive prices require efficient development and utilization of agricultural resources. Cost of production
of various crops are not competitive due to low productivity mainly due to inefficient farming practices. Farm operations being time specific, demand precision to optimize the efficiencies of agriculture inputs for higher productivity. The future challenges of free market economy and faster globalisation have further necessitated modernization of agricultural machinery through transfer of latest, efficient and cost effective technology to farming system. Efficient use of scarce agriculture resources and accelerated agriculture mechanization is, therefore, vital and demands for a comprehensive strategic planning for the future.
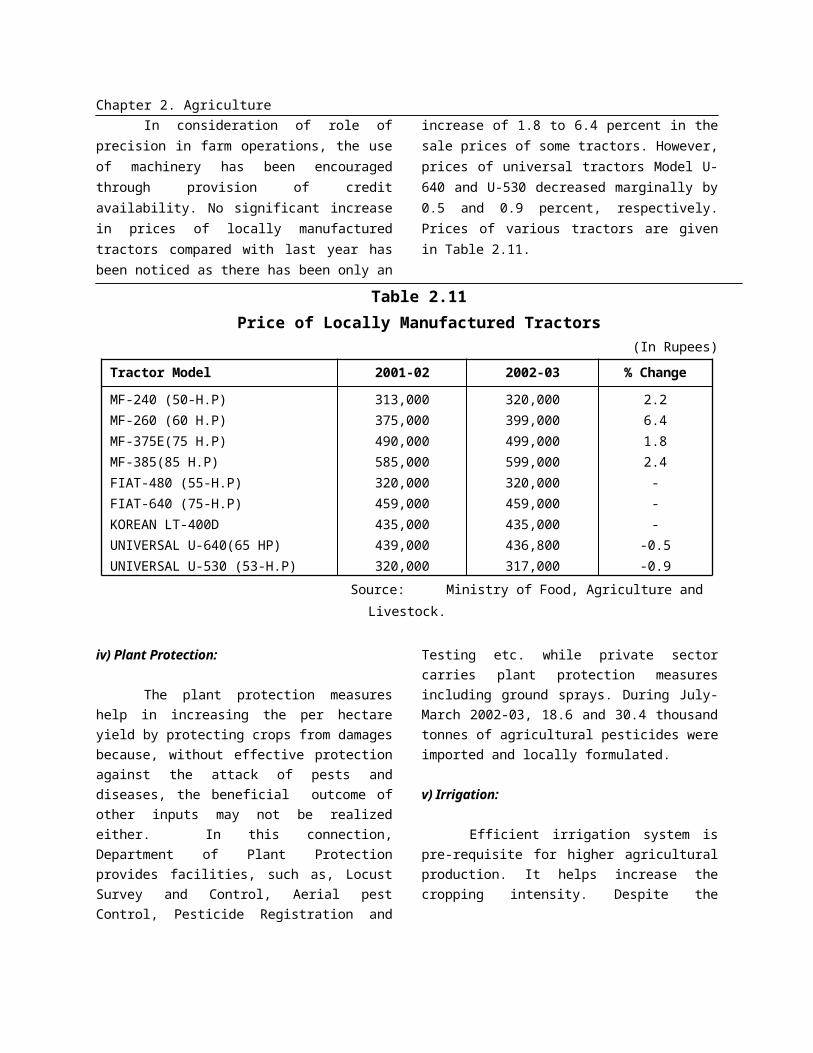
In consideration of role of precision in farm operations, the use of machinery has been encouraged through provision of credit availability. No significant increase in prices of locally manufactured tractors compared with last year has been noticed as there has been only an increase of 1.8 to 6.4 percent in the sale prices of some tractors. However, prices of universal tractors Model U-640 and U-530 decreased marginally by 0.5 and 0.9 percent, respectively. Prices of various tractors are given in Table 2.11.
Table 2.11Price of Locally Manufactured Tractors
(In Rupees)
Tractor Model 2001-02 2002-03 % Change
MF-240 (50-H.P)MF-260 (60 H.P)MF-375E(75 H.P)MF-385(85 H.P)FIAT-480 (55-H.P)FIAT-640 (75-H.P)KOREAN LT-400DUNIVERSAL U-640(65 HP)UNIVERSAL U-530 (53-H.P)
313,000375,000490,000585,000320,000459,000435,000439,000320,000
320,000399,000499,000599,000320,000459,000435,000436,800317,000
2.26.41.82.4---
-0.5-0.9
Source: Ministry of Food, Agriculture and Livestock.
iv) Plant Protection: The plant protection measures help in increasing the per hectare yield by protecting

Chapter 2. Agriculturecrops from damages because, without effective protection against the attack of pests and diseases, the beneficial outcome of other inputs may not be realized either. In this connection, Department of Plant Protection provides facilities, such as, Locust Survey and Control, Aerial pest Control, Pesticide Registration and Testing etc. while private sector carries plant protection measures including ground sprays. During July-March 2002-03, 18.6 and 30.4 thousand tonnes of agricultural pesticides were imported and locally formulated.
v) Irrigation:
Efficient irrigation system is pre-requisite for higher agricultural production. It helps increase the cropping intensity. Despite the existence of good irrigation canal net work in the world,
Pakistan still suffers from wastage of a large amount of water in the irrigation process. Besides, during the last three year the country had experienced severe shortage of water.
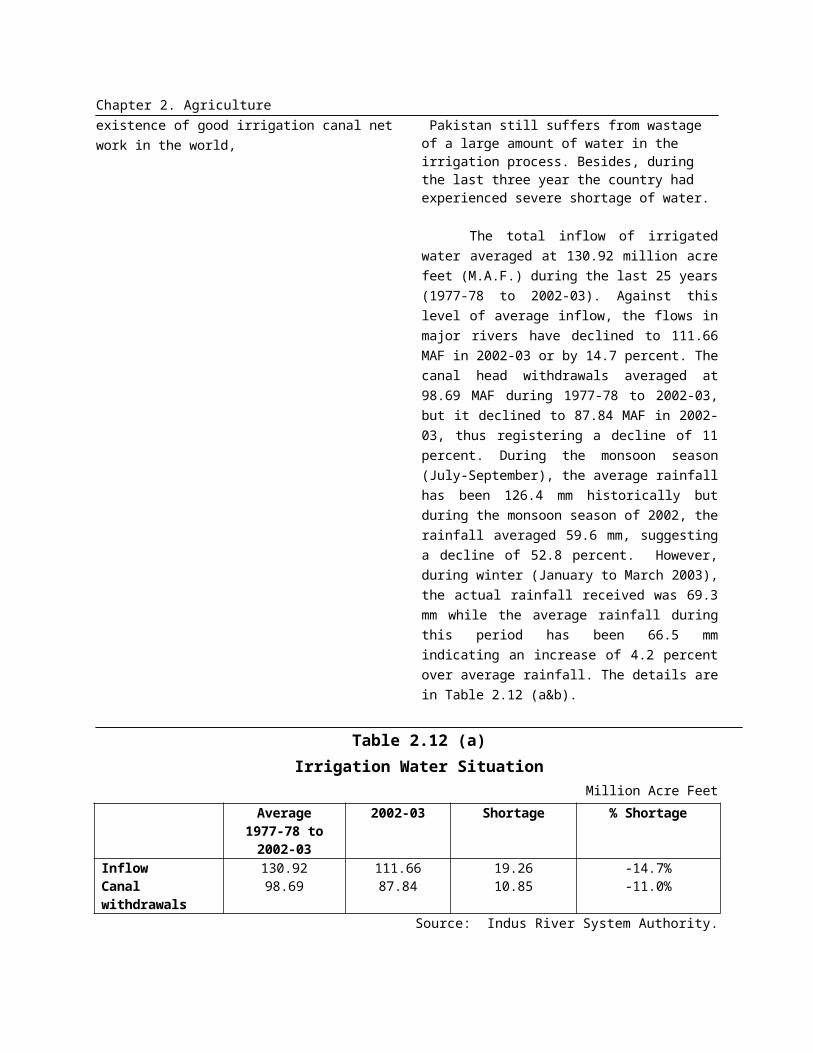
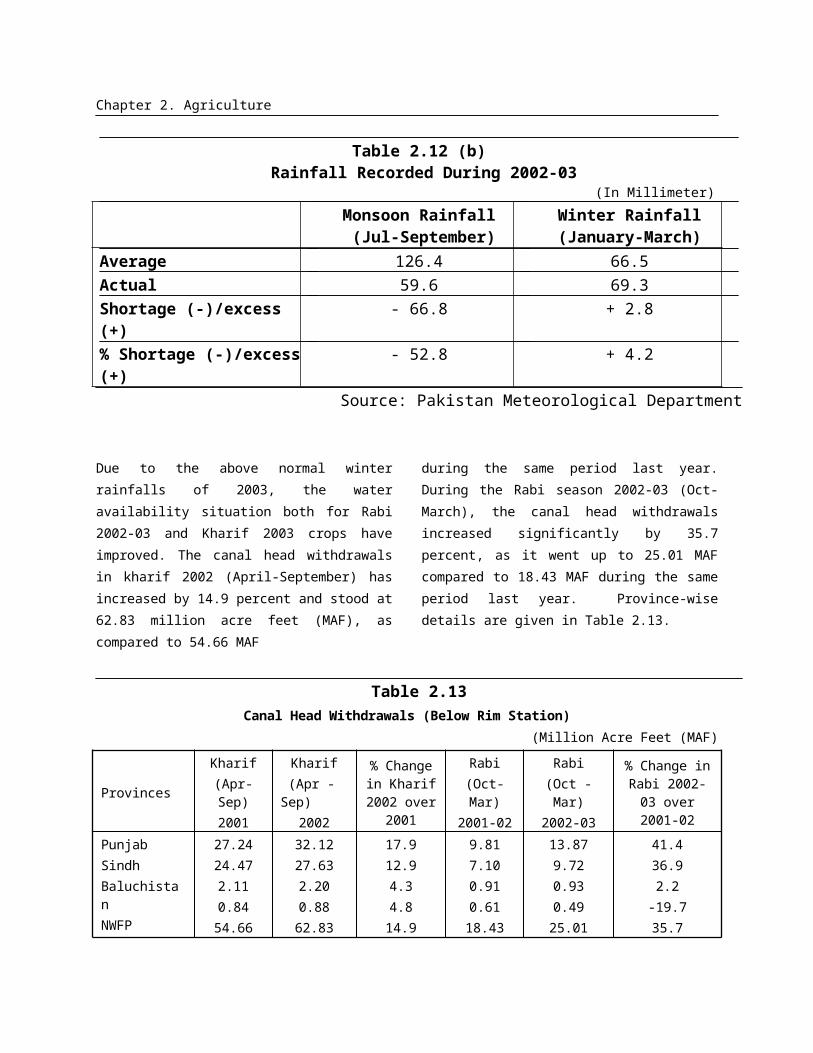
The total inflow of irrigated water averaged at 130.92 million acre feet (M.A.F.) during the last 25 years (1977-78 to 2002-03). Against this level of average inflow, the flows in major rivers have declined to 111.66 MAF in 2002-03 or by 14.7 percent. The canal head withdrawals averaged at 98.69 MAF during 1977-78 to 2002-03, but it declined to 87.84 MAF in 2002-03, thus registering a decline of 11 percent. During the monsoon season (July-September), the average rainfall has been 126.4 mm historically but during the monsoon season of 2002, the rainfall averaged 59.6 mm, suggesting a decline of 52.8 percent. However, during winter (January to March 2003), the actual rainfall received was 69.3 mm while the average rainfall during this period has been 66.5 mm indicating an increase of 4.2 percent over average rainfall. The details are in Table 2.12 (a&b).
Table 2.12 (a)Irrigation Water Situation
Million Acre FeetAverage
1977-78 to 2002-03
2002-03 Shortage % Shortage
InflowCanal withdrawals
130.9298.69
111.6687.84
19.2610.85
-14.7%-11.0%
Source: Indus River System Authority.
Chapter 2. Agriculture
Table 2.12 (b) Rainfall Recorded During 2002-03
(In Millimeter)
Monsoon Rainfall (Jul-September)
Winter Rainfall (January-March)
Average 126.4 66.5Actual 59.6 69.3Shortage (-)/excess (+) - 66.8 + 2.8% Shortage (-)/excess (+)
- 52.8 + 4.2
Source: Pakistan Meteorological Department
Due to the above normal winter rainfalls of 2003, the water availability situation both for Rabi 2002-03 and Kharif 2003 crops have improved. The canal head withdrawals in kharif 2002 (April-September) has increased by 14.9 percent and stood at 62.83 million acre feet (MAF), as compared to 54.66 MAF
during the same period last year. During the Rabi season 2002-03 (Oct-March), the canal head withdrawals increased significantly by 35.7 percent, as it went up to 25.01 MAF compared to 18.43 MAF during the same period last year. Province-wise details are given in Table 2.13.
Table 2.13Canal Head Withdrawals (Below Rim Station)
(Million Acre Feet (MAF)
ProvincesKharif
(Apr-Sep)2001
Kharif (Apr -Sep)
2002
% Change in Kharif
2002 over 2001
Rabi(Oct-Mar)2001-02
Rabi(Oct -Mar)2002-03
% Change in Rabi 2002-03 over 2001-02
PunjabSindhBaluchistanNWFP (CRBC)Total
27.2424.472.110.8454.66
32.1227.632.200.8862.83
17.912.94.34.814.9
9.817.100.910.6118.43
13.879.720.930.4925.01
41.436.92.2
-19.735.7
Source: Indus River System Authority.
vi) Agricultural Credit:
Credit requirements of the farming sector have been increasing over the years with the rise in the use of fertilizer, pesticides and mechanization and hike in their prices. In order to cope with the increasing demand for
agricultural credit, Institutional Credit to the farmers is being provided through Zarai Taraqiate Bank Limited (ZTBL), formerly known as Agricultural Development Bank of Pakistan (ADBP); Commercial Banks, Cooperatives and Domestic Private Banks. Of these, the ZTBL provides the lion share of the
Chapter 2. Agriculturetotal credit disbursement followed by Commercial Banks. The agricultural loans extended to the farming community during (July-March), 2002-03, are discussed below:
a) Production and Development Loans
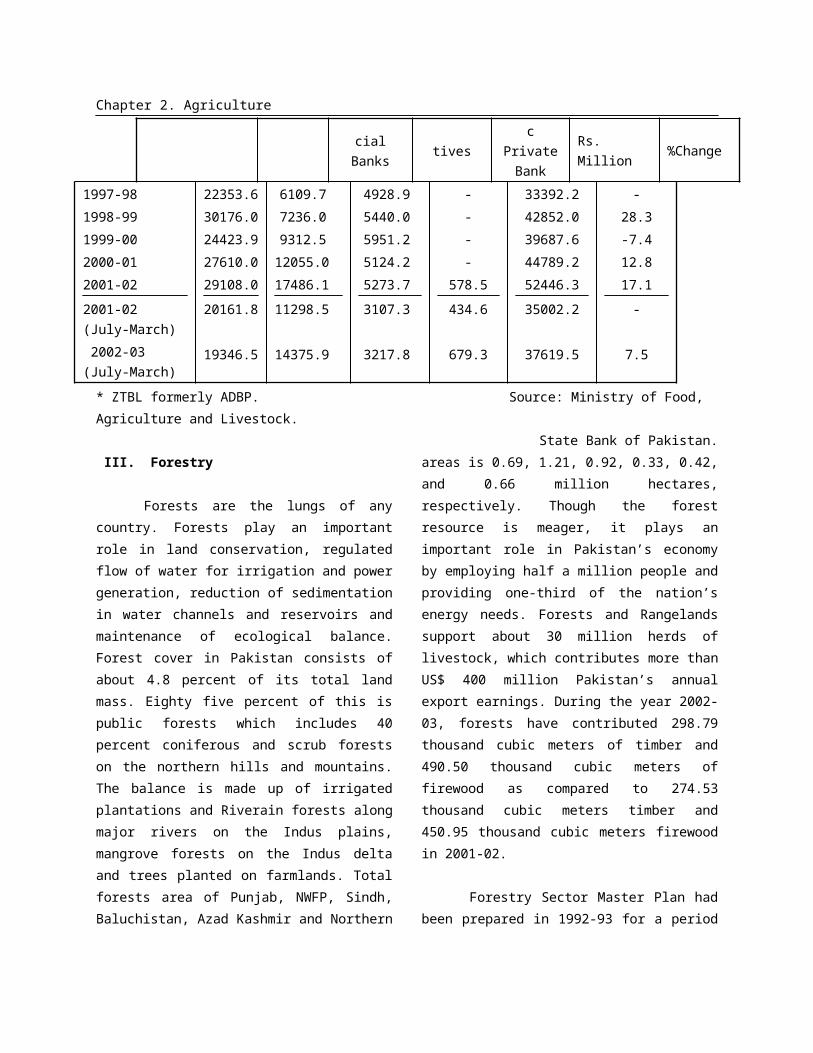
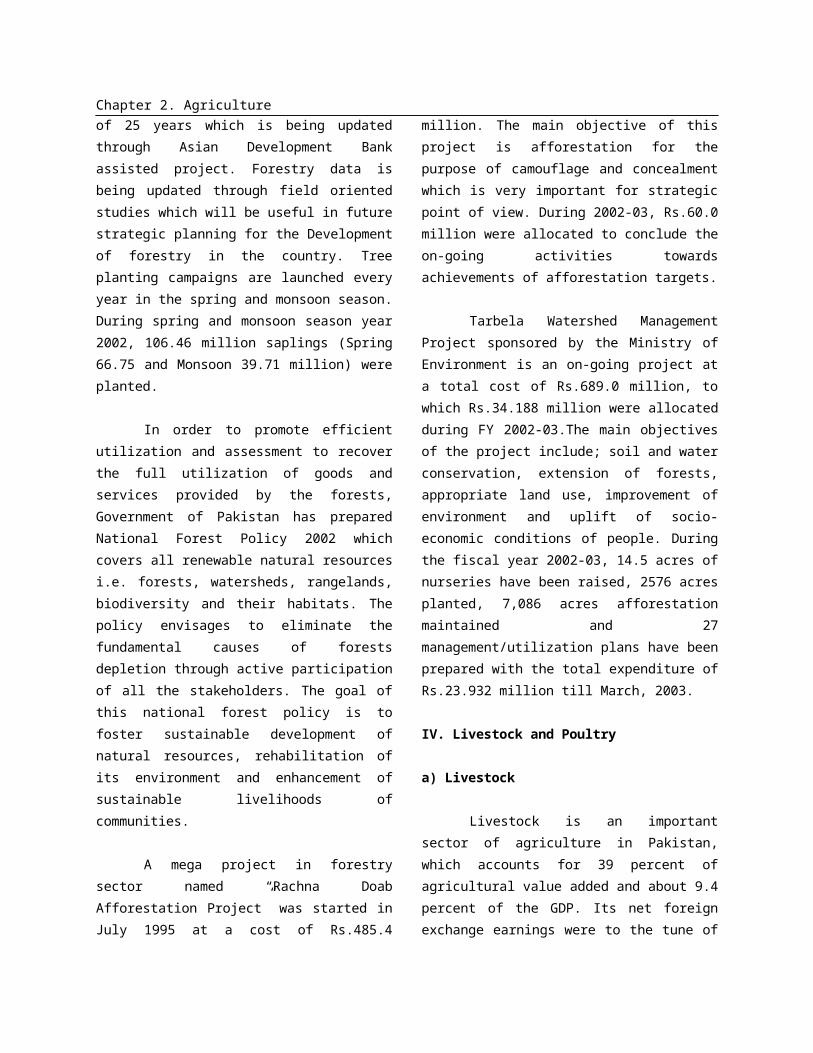
Agricultural loans amounting to Rs.37.6 billion were disbursed during July-March, 2002-03, as against Rs.35.0 billion during the corresponding period last year, thereby registering an increase of 7.5 percent. Supply of agricultural credit by various institutions since 1997-98 to 2002–03 (July-March) is given in Table 2.14
b) Loan to Small Farmers
The Zarai Taraqiate Bank Limited (ZTBL), disbursed Rs.16.2 billion to small farmers having upto 25 acres of land during the first nine months of FY 2002-03. Availability of credit to this category now constitutes 83.8 percent of total agricultural credit provided by the bank.
c) Loans for Newly Identified Priority Items
For the financial year 2002-03, Rs.4075.0 million have been allocated for priority items mainly for enhancement and improvement of irrigation facilities, various varieties of orchards, on farm godowns/storages, production loans for improved seeds, horticulture and Micro Credit etc. During 2002-03 (July-March), loans of Rs.1480.0 million have been disbursed for these priority items to play an effective role in the development of agriculture.
d) Loan Under One Window Operations
Since 1997, ZTBL has launched One
Chapter 2. AgricultureWindow Operation to provide credit facilities, particularly to small farmers, to cater for input requirements at their door step. Thus, during peak sowing season of both Rabi and Kharif Crops, One Window Operation is launched with the collaboration of Provincial Governments, Revenue Officials and Postal Authorities. Agriculture Pass Books are issued at spot to the intending borrowers, their land record is entered and loans are sanctioned at focal points whereas payments are released on the very next day from the concerned branch. During 2002-03 (July-March), loans of Rs.2565.6 million have been disbursed through One Window Operation.
e) Revolving Finance Scheme
Under this scheme, an annual loan limit is sanctioned to a borrower, based on his input credit requirements for both Rabi and Kharif Crops. This limit remains operative for a period of 3 years (six cropping season) without any afresh procedural requirement and documentation. Under this scheme Rs.7386.6 million was disbursed during (July-March) 2002-03. Thus 48% of total production loan i.e Rs.15374.6 million has been disbursed through this scheme.
Table 2.14Supply of Agricultural Credit by Institutions
(Rs. in million)
Year ZTBL*Commer-cial Banks
Coopera-tives
Domestic Private Bank
Total
Rs. Million %Change
1997-98
1998-99
1999-00
2000-01
2001-02
2001-02 (July-March)
2002-03 (July-March)
22353.6
30176.0
24423.9
27610.0
29108.0
20161.8
19346.5
6109.7
7236.0
9312.5
12055.0
17486.1
11298.5
14375.9
4928.9
5440.0
5951.2
5124.2
5273.7
3107.3
3217.8
-
-
-
-
578.5
434.6
679.3
33392.2
42852.0
39687.6
44789.2
52446.3
35002.2
37619.5
-
28.3
-7.4
12.8
17.1
-
7.5
* ZTBL formerly ADBP. Source: Ministry of Food, Agriculture and Livestock.
State Bank of Pakistan. III. Forestry
Forests are the lungs of any country. Forests play an important role in land conservation, regulated flow of water for irrigation and power generation, reduction of sedimentation in water channels and reservoirs and maintenance of ecological balance. Forest cover in Pakistan consists of about 4.8 percent of its total land mass.
Eighty five percent of this is public forests which includes 40 percent coniferous and scrub forests on the northern hills and mountains. The balance is made up of irrigated plantations and Riverain forests along major rivers on the Indus plains, mangrove forests on the Indus delta and trees planted on farmlands. Total forests area of Punjab, NWFP, Sindh, Baluchistan, Azad Kashmir and Northern areas is 0.69,
Chapter 2. Agriculture1.21, 0.92, 0.33, 0.42, and 0.66 million hectares, respectively. Though the forest resource is meager, it plays an important role in Pakistan’s economy by employing half a million people and providing one-third of the nation’s energy needs. Forests and Rangelands support about 30 million herds of livestock, which contributes more than US$ 400 million Pakistan’s annual export earnings. During the year 2002-03, forests have contributed 298.79 thousand cubic meters of timber and 490.50 thousand cubic meters of firewood as compared to 274.53 thousand cubic meters timber and 450.95 thousand cubic meters firewood in 2001-02.
Forestry Sector Master Plan had been prepared in 1992-93 for a period of 25 years which is being updated through Asian Development Bank assisted project. Forestry data is being updated through field oriented studies which will be useful in future strategic planning for the Development of forestry in the country. Tree planting campaigns are launched every year in the spring and monsoon season. During spring and monsoon season year 2002, 106.46 million saplings (Spring 66.75 and Monsoon 39.71 million) were planted.
In order to promote efficient utilization and assessment to recover the full utilization of goods and services provided by the forests, Government of Pakistan has prepared National Forest Policy 2002 which covers all renewable natural resources i.e. forests, watersheds, rangelands, biodiversity and their habitats. The policy envisages to eliminate the fundamental causes of forests depletion through active participation of all the stakeholders. The goal of this national forest policy is to foster sustainable development of natural resources, rehabilitation of its environment and
enhancement of sustainable livelihoods of communities.
A mega project in forestry sector named “Rachna Doab Afforestation Project” was started in July 1995 at a cost of Rs.485.4 million. The main objective of this project is afforestation for the purpose of camouflage and concealment which is very important for strategic point of view. During 2002-03, Rs.60.0 million were allocated to conclude the on-going activities towards achievements of afforestation targets.
Tarbela Watershed Management Project sponsored by the Ministry of Environment is an on-going project at a total cost of Rs.689.0 million, to which Rs.34.188 million were allocated during FY 2002-03.The main objectives of the project include; soil and water conservation, extension of forests, appropriate land use, improvement of environment and uplift of socio-economic conditions of people. During the fiscal year 2002-03, 14.5 acres of nurseries have been raised, 2576 acres planted, 7,086 acres afforestation maintained and 27 management/utilization plans have been prepared with the total expenditure of Rs.23.932 million till March, 2003.
IV. Livestock and Poultry
a) Livestock
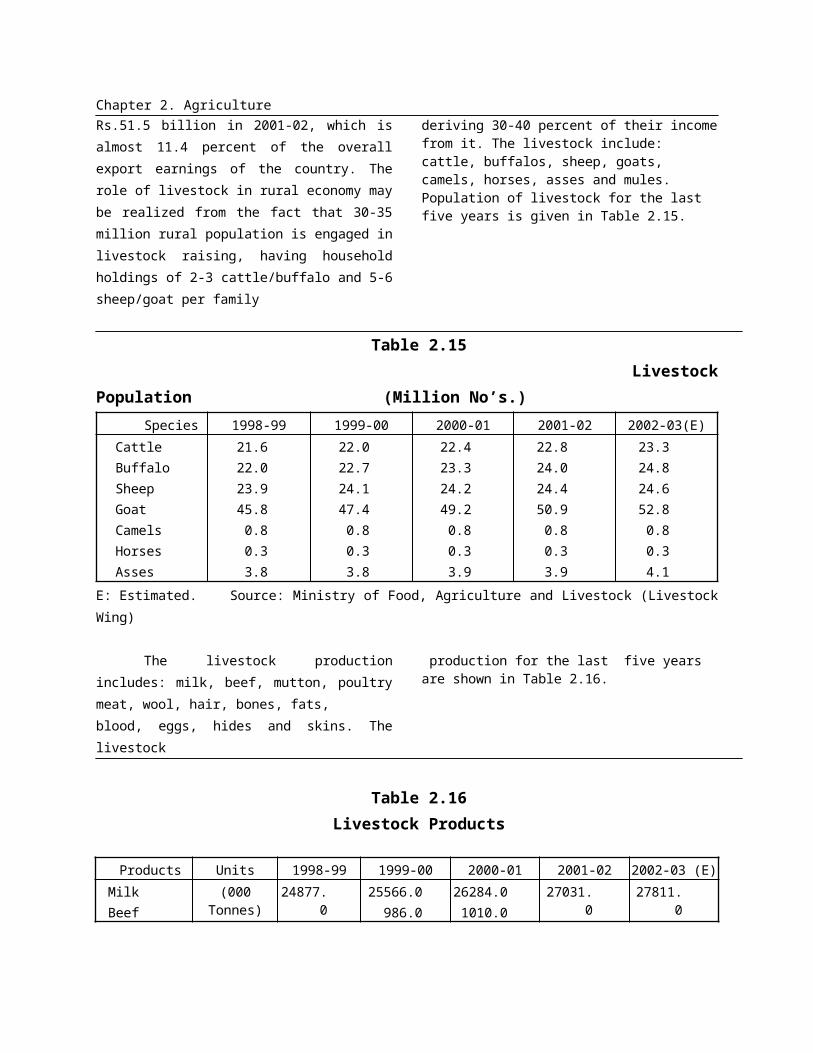
Livestock is an important sector of agriculture in Pakistan, which accounts for 39 percent of agricultural value added and about 9.4 percent of the GDP. Its net foreign exchange earnings were to the tune of Rs.51.5 billion in 2001-02, which is almost 11.4 percent of the overall export earnings of the country. The role of livestock in rural economy may be realized from the fact that
Chapter 2. Agriculture30-35 million rural population is engaged in livestock raising, having household holdings of 2-3 cattle/buffalo and 5-6 sheep/goat per family
deriving 30-40 percent of their income from it. The livestock include: cattle, buffalos, sheep, goats, camels, horses, asses and mules. Population of livestock for the last five years is given in Table 2.15.
Table 2.15 Livestock Population (Million No’s.)
Species 1998-99 1999-00 2000-01 2001-02 2002-03(E)CattleBuffaloSheepGoatCamelsHorsesAsses
21.622.023.945.80.80.33.8
22.022.724.147.40.80.33.8
22.423.324.249.20.80.33.9
22.824.024.450.90.80.33.9
23.324.824.652.80.80.34.1
E: Estimated. Source: Ministry of Food, Agriculture and Livestock (Livestock Wing)
The livestock production includes: milk, beef, mutton, poultry meat, wool, hair, bones, fats,blood, eggs, hides and skins. The livestock
production for the last five years are shown in Table 2.16.
Table 2.16Livestock Products
Products Units 1998-99 1999-00 2000-01 2001-02 2002-03 (E)MilkBeefMuttonPoultry MeatWoolHairBonesFatsBloodEggsHidesSkins
(000 Tonnes)
""""""""
Million No’s.""
24877.0
963.0633.0310.038.717.3
316.3117.834.4.08261.0
7.536.3
25566.0986.0649.0327.138.917.9
324.0120.640.9
7321.07.6
37.2
26284.01010.0666.0339.039.218.6
331.4123.541.8
7505.07.8
38.2
27031.0
1034.0683.0355.039.419.3
339.4126.542.9
7679.07.9
39.2
27811.0
1060.0702.0370.039.719.9
347.6129.744.0
7860.08.2
40.3
E= Estimated Source: Ministry of Food, Agriculture & Livestock (Livestock Wing).
Chapter 2. Agricultureb) Poultry
Poultry production has emerged as a good substitute of beef and mutton. Its importance can be judged from the fact that almost every family in rural areas and every fifth family in urban areas are
associated with poultry production activities in one way or the other. Government is providing all possible incentives to develop it at an accelerated pace. The production of commercial and rural poultry is given in Table 2.17.
Table 2.17Production of Commercial Poultry and Poultry Products
Production Units 2001-02 2002-03 (E)
Day Old Chick
Layers
Broilers
Breeding Stock
Poultry Meat
Eggs
Million No's
"
"
"
(000 Tonnes)
Million No's
334.3
18.4
264.4
6.2
266.8
4423.0
350.5
19.3
227.2
6.5
279.5
4632.0
E: Estimated Source: Ministry of Food, Agriculture & Livestock (Livestock Wing). The production of rural poultry for 2001-02 and 2002-03 are given in Table 2.18.
Table 2.18Rural Poultry
(Million Nos.)
Production 2001-02 2002-03 (E)
Day Old Chick
Cocks & Cockribs
Layers
32.0
9.0
32.0
33.5
9.4
33.6
E: Estimated Source: Ministry of Food, Agricul -ture & Livestock ( Livestock Wing).
For promotion of livestock and poultry, the government has provided the following incentives in the agricultural package:
- Imported plant and equipment not manufactured locally shall be subject
to custom duty of 10 percent, with complete exemption from sales tax.
- Capital structure of projects in agro-food industry will be entitled to debt-equity ratio of 70:30.
- Projects will be entitled for financing by all banks and development finance institutions.
- Expatriate personnel of the Units will be allowed to import food items and other consumable without any duty/taxes, subject to maximum limit of $2,000 per person per year.
- Import of breeding stock will be allowed subject to the import duty of 10 percent.
- Locally manufactured machinery will be provided credit.
- Parts and Components upto 5 percent
Chapter 2. Agricultureof initial C&F value of imported plant and equipment shall be imported at 10 percent duty, if imported together with the plant. The export of livestock & livestock products has been allowed.
- The imported plant and equipment not manufactured locally, shall be subject to custom duty of 10 percent with complete exemption from sales tax.
Following measures have also been taken to meet Sanitary and Phytosanitary (SPS) requirements under WTO for quality assurance and to improve exports of livestock and livestock products:
- Establishment of abattoirs are encouraged in the private sector;
- The National Veterinary Laboratory is under construction for drug residue testing in the livestock products. This will ensure quality in exported products;
- Steps have been taken to improve sanitary and hygiene conditions of animal casing processing units in the country;
- A project titled ‘Strengthening of
Veterinary Services in Pakistan – Rinderpest Eradication
Program” has been launched during the fiscal year 2002-03.
V. Fisheries
Fishery plays an important role in Pakistan's economy and is considered to be an important source of livelihood for the coastal inhabitants. Apart from marine fisheries, inland fisheries (comprising of
rivers, lakes, ponds, dams etc) are also very important source of animal protein. Fisheries' share in GDP, though very little contributes substantially to the national income through export earnings. During the period July-March 2002-03, 58356 m. tonnes valued at Rs.5.2 billion fish and fishery products were estimated to be exported to Japan, USA, UK, Germany, Middle East, Sri Lanka, China etc. During the same period,
Chapter 2. Agriculturethe total fish production is estimated at 665,850 m. tonnes. Of which, share of marine sector is 480,000 m. tonnes and inland contribution is 185,850 m. tonnes.
The Government is taking a number of steps to improve fisheries sector. A number of initiatives are also being taken by the Federal and Provincial Fisheries Departments which, inter-alia, include strengthening of extension services, diversification of fishing efforts, development of value added products, enhancement of per capita consumption and up-gradation of socio-economic condition of the fishermen's community. Marine Fisheries Department is
also executing a project, namely, "Establishment of a Hatchery Complex for Production of Fish/Shrimp Seeds" which will play a vital role for the development of fish/ shrimp farming.
The total number of persons engaged in fisheries sector during 2002-03 is estimated at 365,000. Out of which, 138,000 persons (37.8 percent) were engaged in marine sector and 227,000 persons (62.2 percent) in inland fisheries, whereas the persons engaged in fisheries sector in 2001-02 were 363,000 persons137,000 (37.7 percent) in marine and 226,000 (62.3 percent) in inland fisheries.
_____________________________
Chapter 3. Manufacturing Mining and Investment Policies
3.Manufacturing, Mining and Investment Policies
Manufacturing sector is the second largest individual sector of the economy accounting for 18 percent of the Gross Domestic Product (GDP). The activity in the manufacturing sector is comprised of large-scale and small & medium manufacturing sector. The performance of this very important sector in general and large-scale manufacturing in particular, has been lackluster at best in 1990s owing to host of problems like tariff reforms and escalating utility prices. In the backdrop of higher growth of 8.2 percent in the 1980s, the growth rate of 4.0 percent in 1990s was disappointing. Fiscal year 2002-03 besides 2000-01 has become the best performing year for manufacturing sector since 1987-88. This year has seen manufacturing registering a stellar growth of 7.7 percent with major contribution coming from large-scale manufacturing which recorded 8.7 percent growth. The industry seems to have adjusted itself with the challenges emanated from trade and tariff rationalization of the 1990s and increased input cost due to escalating utility tariff.
The large-scale manufacturing was originally targeted to grow by 6.5 percent in 2002-03 but the target was surpassed by a wide margin. Pakistan’s overall manufacturing sector registered a growth of 7.7 percent and large-scale manufacturing grew by 8.7 percent during the current fiscal year. The improvement in the domestic demand and better macroeconomic environment have caused in significant turnaround in the manufacturing sector.
The turnaround in the large-scale manufacturing which started in 2000-01 continued to exhibit a rising trend barring brief interval in the last fiscal years (October ,November and February 2001-02). The events of September 11 and their aftermath adversely affected the performance of this sector during this period. With the exception of these three months the growth performance depicted smart recovery during the last three years. One of the significant development in the current fiscal year has been that the growth is broad-based and touched almost all industrial groups.
The main contributors to this impressive growth of 8.7 percent in July- March, 2002-2003 over the corresponding period of last year are automobile group (49.8 percent), food, beverage & tobacco group( 8.5 percent) textiles & apparel group (5.2 percent), paper & board (15.7 percent), metal product, machinery & equipment (18.4 percent), and tyres & tubes (16.2 percent). Ten out of eleven groups registered positive growth while leather product is the only group that registered negative growth [See Table 3.1]. Individual items that registered positive growth are cotton cloth (1.5 percent), cotton yarn (8.1 percent) in textiles group; cooking oil (6.8 percent) and sugar (13.6 percent) in food, beverages and tobacco groups; nitrogenous fertilizer (4.2 percent) and soda ash (12.9 percent) in chemical & pharmaceutical group, cement (20.5 percent) in non-metallic mineral products group and Jeeps & Cars (51.6 percent) and LCV’s (57.6 percent) in automobile group. The individual industries which show negative growth include vegetable ghee (7.0 percent), cigarettes (7.1 percent), cotton ginned (4.7 percent), phosphatic fertilizer (27.8 percent) and footwear (6.2 percent). The production performance of selected items is given in Table 3.2.
Table 3.1Group-Wise Growth Performance
(July-March)(Percent)
Group 2001-02 2002-03Food, Beverages & Tobacco 6.1 8.5(Sugar) (9.2) (13.6)Textile and Apparel 4.4 5.2Leather Products -3.5 -6.6Paper & Board 2.8 15.7
Chapter 3. Manufacturing Mining and Investment Policies
Chemicals, Rubber & Plastics 0.1 3.9Petroleum Group 18.7 2.2Tyres & Tubes 5.9 16.2Non-Metallic Mineral Products 1.2 20.0*Basic Metal Industries -4.7 9.1Metal Products, Machinery & Equipment 3.3 18.4Automobile 2.8 49.8Overall Growth 4.0 8.7* Includes cement Source: Economic Adviser Wing, Finance Division
Table 3.2Production of Selected Industrial Items of Large-scale
Item Units2000-
012001-
02
(July-March)
% Change2001-02 2002-03
Cotton Yarn 000 tones 1721.0 1794.0 1344.1 1452.3 8.1
Cotton Cloth Mln.Sq. Mtr 490.2 555.6 416.1 422.4 1.5
Sugar 000 tones 2955.9 3246.6 2905.2 3263.9 13.6
Nitrogenous Fertilizer 000 N. tones 2004.7 2095.9 1561.7 1627.0 4.2
Phosphatic Fertilizer 000 N tones 292.2 140.5 112.8 81.5 -27.8
Vegetable Ghee 000 tones 834.8 774.4 601.0 559.2 -7.0
Cooking Oil 000 tones 106.5 135.3 95.0 101.5 6.8
Cement 000 tones 9674 9935 7071 8518 20.5
Cigarettes Bln. Nos. 58.2 55.3 39.0 36.2 -7.1
Jeep& Cars Nos. 40032 41171 28166 42691 51.6
Tractors Nos. 32553 24331 15339 17870 16.5
L.C.V Nos. 6965 8491 5537 8727 57.6
Motorcycles/Scooters Nos.117858
13333
494108 125625 33.5
Bicycles 000 Nos. 569.6 546.4 393.6 460.2 16.9
Chapter 3. Manufacturing Mining and Investment Policies
Paper & Paper Board 000 tones. 531.1 547.8 240.4 278.2 15.7
T.V Sets 000 Nos. 97.4 77.7 340.0 541.0 59.1
Motor Tyres 000 Nos. 884 911 670 777 16.0
Billets 000 tones 414.7 412.0 275.6 314.2 14.0
Refrigerators 000 Nos. 272.3 313.8 195.0 240.0 23.1
Soda Ash 000 tones 217.9 215.2 187.6 211.8 12.9
Source: Federal Bureau of Statistics
EVALUATION OF SELECTED INDUSTRIES OF
LARGE SCALE MANUFACTURING (LSM).
Textile Industry
Textile products are a basic human
requirement next only to food. Inspite of the
government’s efforts to diversify export as well
as industrial base, the textile remains the
backbone of industrial activity in the country. Its
share in the economy, in terms of GDP, exports,
employment, foreign exchange earnings,
investment and contribution to the value added
in industry; make it the single largest
determinant of the growth in manufacturing
sector with 46 percent share in overall
manufacturing activity. The demand for textiles
in the world is around $18 trillion. Pakistan has
emerged as one of the major cotton textile
product supplier in the world market and its
share in world yarn trade is about 30 percent
while its share in cotton cloth trade is about 8
percent. However, overall share of textile
exports from Pakistan is around one percent. The
share of textile in Pakistan’s exports earnings is
68 percent at its present worth of exports is
around $ 7 billion. The value addition in the
sector account for 9 percent of GDP and it
employ 38 percent of industrial workers. During
the last three years, Pakistan’s textile sector is
preparing itself to face the challenges of the
post-quota regime in 2005.
Investment Trend in Textile Sector
The year under review witnessed
tremendous inflow of investment in value added
expansion and BMR. The textile vision 2005
besides providing a road map to enhance
exports of textile products, also set benchmark
investment requirements for the creation of new
capacity and up-gradation of the existing
production base. The textile vision 2005
maintained that at the initial phase heavy
investment will be needed to create additional
capacity in the apparel industry; however, the
apparel sector only received 36 percent of the
targeted investment during last three years. Bulk
of the investment to the extent of 56 percent
went to the traditional spinning sector which is
three times higher than envisaged in the textile
vision 2005. The textile sector received $ 1.5
billion worth of investment during the last three
years.
The brighter side of the investment in this
sector is the heavy investment in the air jet
Chapter 3. Manufacturing Mining and Investment Policies
weaving segment where actual disbursement
has already surpassed the target with a fair
margin of 55 percent. Such investment would
not only modernize this sector but would likely to
fuel value addition in the coming years.
However, grey area of the whole investment
composition has been below target inflows in the
water jet weaving sector. The tremendous inflow
of investment in the sector is likely to enable
Pakistan textile industry to face formidable
challenge of lifting the remaining vestiges of
quota restrictions as stipulated in the Agreement
on Textiles and Clothing (ATC) after 2005.
Foreign direct investment (FDI) in the textile
sector doubled to US $23.1 million in Jul-March
2002-03 as against US $ 10.5 million in the
corresponding period of last year.
During the current fiscal year the textile
sector showed greater resilience to lower cotton
crop and performed well as far as production is
concerned. After suffering stagnation for 5 year,
textile exports started improving, especially the
value added product performed well in export
markets. The profiles of various components of
textile industry are given in the Table 3.3 below:-
Table 3.3Installed Capacity of Textile Industry
July-March% Change
2001-02 2002-03
Number of Mills 348.0 361.0 3.7
Installed Capacity (000 Number)
- Spindles 8726.0 9173.0 5.1
- Rotors 145.0 144.0 -0.7
- Looms 10.1 10.2 1.0
Working Capacity (000 Numbers)
- Spindles 7113.0 7578.0 6.4
- Rotors 63.0 66.7 5.9
- Looms 4.4 3.4 -22.7
Source: Textile Commissioner OrganizationPerformance of Ancillary Textile Industry
Textile production is comprised of cotton ginning, cotton yarn, cotton fabric, fabric
processing (grey-dyed-printed), home textiles, towels, hosiery & knitwear and readymade garments. The textile industry consists of large-scale organized sector and unorganized cottage /
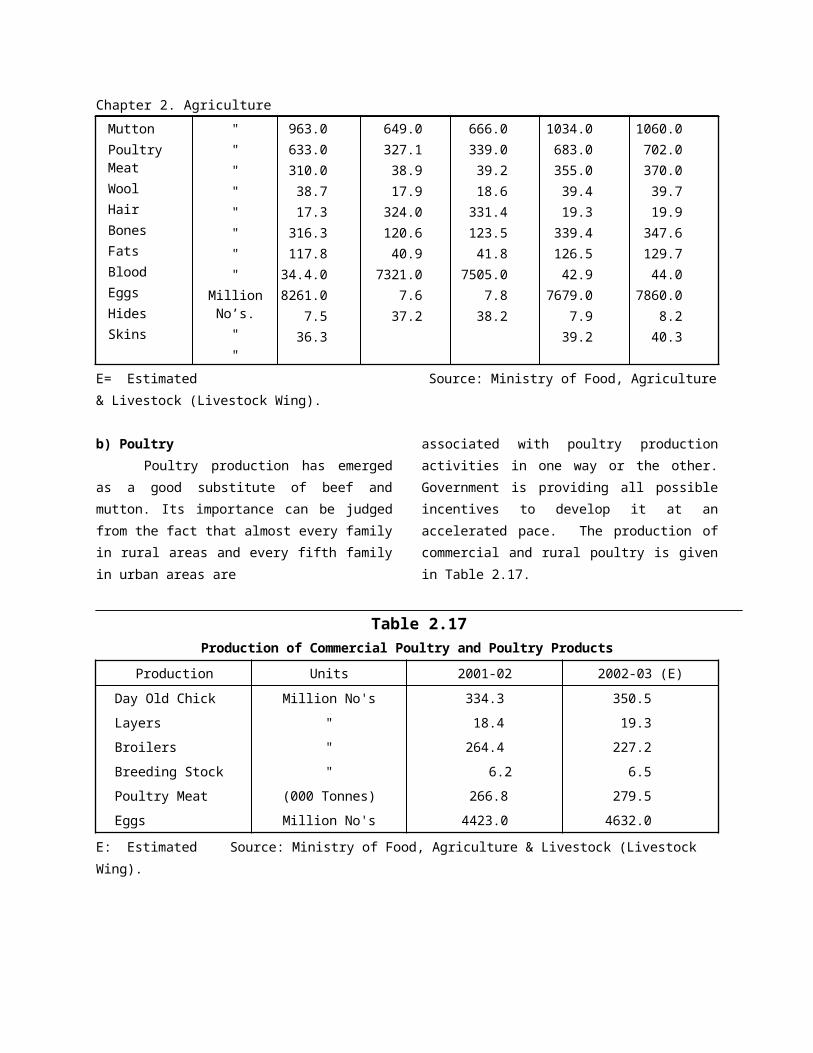
Chapter 3. Manufacturing Mining and Investment Policies
small & medium units. The performance of various ancillary textile industries is evaluated as under:-A. Cotton Spinning Sector.
The spinning sector has emerged torch-bearer of revitalization of textile sector. At present, it is comprised of 453 textile mills (50 composite units and 403 spinning units) with 7.6 Million spindles and 67 thousand rotors in operation with capacity utilization at 83 percent in spindles and 47 percent in rotors, during July- March, 2002-03.
The production of cotton yarn increased to 1452.3 thousand tones in July-March 2002-03 as against 1344.1 thousand tones in the comparable period of last year, thereby, registering a growth of 8.1 percent. The export of cotton yarn witnessed modest improvement both in quantity and value term during July-March 2002-03. The quantity and value of yarn export increased by 3.2 percent and 2.8 percent, respectively. The international price of yarn continued to remain depressed for third consecutive year. This is not a mean achievement, especially when a shift is taking place from lower to higher value added export products. B. Weaving & Made-up Sector.
The patterns in weaving and made-up sector comprised of hosiery, garments, towels, canvas, and bedwear are different from spinning sector. The weaving and made-up sector has three different sub-sectors in weaving viz. integrated, independent weaving units, and power looms units. The installed and effective capacities in the sector are given in the Table 3.4.
Table 3.4
Installed and Capacity Worked in Weaving Sector (Nos.)
Category
Installed
Capacity
Effective/
Capacity
Workeda)Integrated
Textile Units1
02494
947
b)Independent Weaving Units 2
36522
2000c) Power Loom Sector
225258
19000
0Total 2
591592
16947
Source: Textile Commissioner Organization.
The problems of power looms centered on the poor technology, scarcity of quality yarn and lack of institutional financing for its development from the unorganized to an organized sector. The government has realized that textile and clothing sector is one sector that offer good prospects for diversification away from traditional commodity exports, for entry into the area of manufactures, for absorption of large pools of manpower, for crossing the big divide between the rural and urban sectors, for poverty alleviation and for gender empowerment. The government under Textile Vision 2005 has focused more on providing credit and other facilitative support to diversify the products, especially to cater the needs of the high value added sector like garment industry. The textile industry invested substantially in BMR for improving production quality and moving towards more value addition during the last two years. However, the textile industry still need around $ 1.5 billion worth of investment for BMR and expansion over the next two years to meet the challenges which are likely to emerge in the post-quota regime beginning from January 2005.
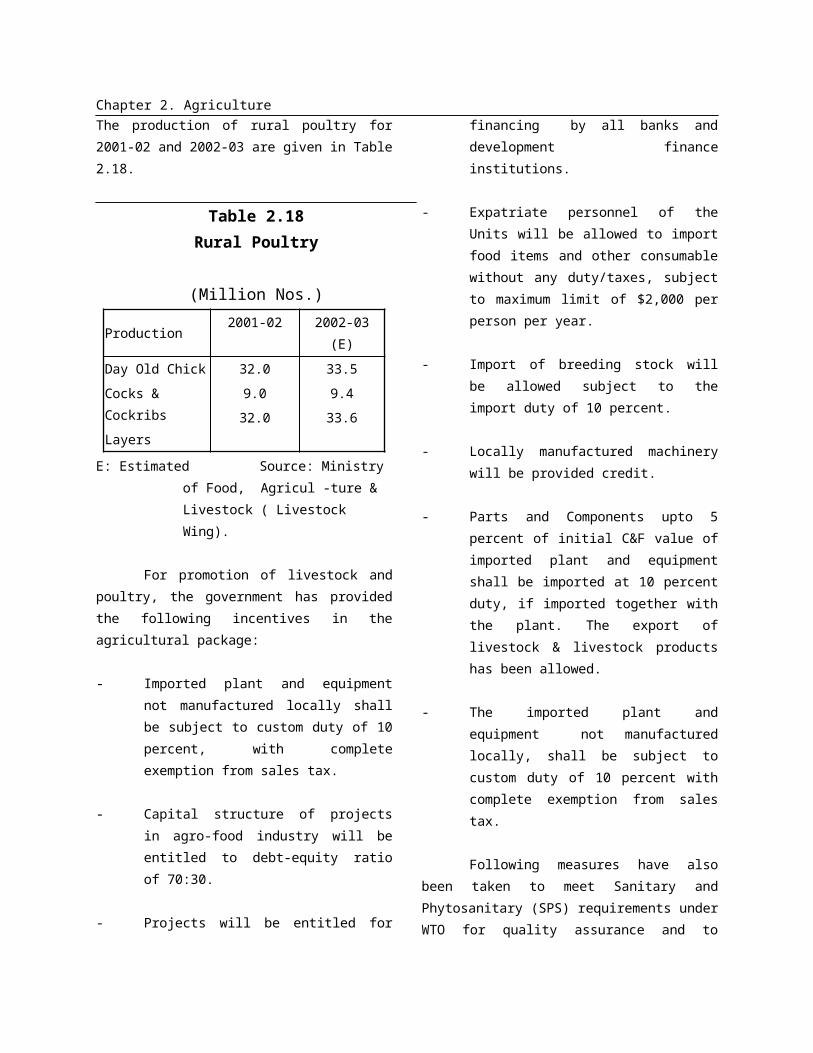
Chapter 3. Manufacturing Mining and Investment Policies
C. Cotton Cloth
The production of cotton cloth in the mill sector has increased marginally by 1.5 percent during July-March 2002-03 while non-mill sector registered a phenomenal growth of 14.6 percent in the same period. The export of cotton cloth witnessed tremendous increase of 18.0 percent during July-March 2002-03 in value terms however, in quantitative terms, the increase was 7.4 percent, which is because of almost 10 percent increase in unit value of cotton fabrics in the international market. The sector served as the main strength for the down stream industry like bedwear, made-ups and garments.
D. Textile Down-Stream Industry
The down-stream industry is the most dynamic segment of the textile industry and a major contributor to export earnings. The major products are hosiery, towel, bedwear, canvas and tents, cotton bags and readymade garments. IMF has acknowledged the importance of the sector in a report and concludes that Pakistan should seek to shift emphasis on textile and clothing to higher value added items. The government has already incorporated this suggestion in Textile Vision 2005. The performance of the down stream sectors is evaluated below:
a) Hosiery Industry. There are about 15,000 knitting machines working in the country to manufacture 5.5 million pieces of knitwear with approximately 60 percent capacity utilization. The sector is not only catering for domestic demand, but also has export potential. There is greater reliance on the development of this industry because of high value addition content in the form of knitwear. The locally manufactured machinery is supplemented with liberal
imports under different modes and export oriented capacity is being developed to earn much needed foreign exchange. Exports from this sector have witnessed tremendous increase of 32 percent in value terms and 44 percent in quantity terms and added $ 793 million to the foreign exchange earnings during July-March 2002-03 as compared to $ 682 million during the same period of last year. The impressive growth in exports of knitwear is achieved despite 8.3 percent decline in the unit value in the international market.
b) Readymade Garments. The garment industry provides highest value addition in the textile sector. This sector is distributed in small, medium and large-scale units, most of them, having 50 machines and below. The sector is comprised of 600 large and 4500 small units. This sector is attracting considerable investment and many new units are coming up in the organized sector every year. This sub-sector is facing multi-dimensional problems like high value addition in competing countries and inelasticity of the sector in shifting the burden of increased prices of yarn, cotton cloth or other inputs to the end user. Against all these odds, the sub-sector has witnessed substantial growth of 25.8 percent in terms of value of exports but in quantity terms, the exports from the sector witnessed a decline of 10.2 percent. The sector received windfall gains due to 40.0 percent increase in the unit value during July-March 2002-03 over the comparable period of last year. The sector contributed $ 800.5 million in this period as against $ 636.2 million in the comparable period of last year.
c) Towel industry. This industry is comprised of about 400 units supported by
Chapter 3. Manufacturing Mining and Investment Policies
6500 towel looms in the country in both organized and unorganized sector. The industry is capable of producing 55 million Kgs towels per annum. It is mainly an export-based industry with lower demand from domestic market. Its growth primarily depends on exploration of export outlets. The year under review is the best performing year for this industry like other segments of textile sector and its exports increased by 18.8 percent in quantity terms and by 26.5 percent in value terms, during July-March 2002-03.
d) Tarpaulin & Canvas. The production capacity of this highest raw cotton-consuming sector is 100 million sq. meters. This is a low value added sub-sector. The sector recorded 6.0 percent increase in value of exports and 4.4 percent increase in quantity terms which imply slight upward adjustment in the unit value of exports. This sector is mainly export based and 90 percent of its production is exported.
E. Filament Yarn Manufacturing Industry
There are 25 units engaged in manufacturing of three kinds of filament yarn, namely acetate rayon yarn (one unit with capacity to manufacture 3 thousand tones), nylon filament yarn (3 units with installed capacity of 2 thousand tones) and polyester filament yarn (21 units with installed capacity of 95 thousand tones). The total installed capacity of all these units is 100 thousand tones, against which it produced approximately 78 thousand tones per annum. In Pakistan, generally blending ratio of cotton yarn and blended yarn is on lower side as compared to the international standards. However, there is a shift is taking place from 100 percent cotton yarn to blended yarn in the spinning sector. Recently, hosiery sector has
started consuming synthetic Yarn for export of knitted garments which are contributing in high value addition as well as diversification in exportable products.
F. Art Silk and Synthetic Weaving Industry
The art silk and synthetic weaving industry is mostly concentrated in the informal sector and generally it is operated as family owned power loom units comprising of 8 to 10 looms. There are approximately 90,000 power looms in operation to prepare synthetic yarn in the country. About 30,000 looms are engaged in production of blended yarn and 60,000 looms are producing filament yarn. The export of synthetic textile increased by 14.9 percent in terms of quantity and 26.6 percent in terms of value during July-March 2002-03 over the comparable period of last year. This industry, like others in textile sector has also experienced decline in unit value of exports by 4.7 percent. The importance accorded to SMEs by the government would go a long way in promoting this sort of industry.
G. The Fertilizer Industry
Fertilizer is one of the key inputs used in agricultural production. There are 10 fertilizer units operating in the country (Five units are in Punjab, three in Sindh and two in NWFP) with an installed capacity of 5.6 million tones, out of which nitrogenous fertilizer has a capacity of 4.9 million tons and phosphatic fertilizer has production capacity of 0.7 million tons. Out of these 10 units, five are in private sector with an installed capacity of 3.7 million tons and five are in public sector with capacity of 1.9 million tons. With revival of agricultural growth, the production of fertilizer has also witnessed an increase of 2.5 percent and stood at 3.9 million tones during July-March 2002-03 as against 3.8 million tones in the corresponding period of last
Chapter 3. Manufacturing Mining and Investment Policies
year. The production of fertilizer like urea and ammonium nitrate increased by 3.5 percent and 4.2 percent respectively while the production of nitro phosphate and super phosphate declined by 1.0 percent and 10.5 percent, respectively, during July March 2002-03 over the corresponding period of last year.
H. Vegetable Ghee
The production activity in ghee and cooking oil production is now entirely concentrated in the private sector after privatization. The industry is comprised of 155 units both in organized and unorganized sectors, and employing 37,700 persons. The overall installed capacity of the ghee and cooking oil industry is estimated at 2.7 million tones. The ghee production is substituted with cooking oil production for quite sometime. Therefore, the ghee production has decline by 7.0 percent while that of cooking oil went up by 6.8 percent in Jul-March 2002-03. The ghee production is estimated at 0.56 million tones during July- March 2002-03 as against 0.60 million tones produced in the comparable period of last year while the production of cooking oil stood at 0.1 million tones as against 0.095 million tones in the same period.
I. Sugar Industry
The sugar industry is comprised of 77 mills with ability to produce 5.5 million tones of refined sugar. Out of these 77 mills, 38 are located in Punjab, 32 in Sindh 6 in NWFP, and one in AJK. The production capacity has almost doubled against the annual sugar requirement for consumption as a result of addition of 25 new mills to the capacity during one decade. The industry is confronted with inefficiency in production, partly contributed by the quality and quantity of sugarcane availability. The sugar season is over in May and the latest estimates
showed production of 3.7 million tones as against 3.2 million tones in the last year, thereby showing an increase of 15.6 percent. The sugar industry is confronted with low recovery rate and inefficient cost structure. There is dire need to improve sugar recovery rate by adopting most modern techniques for cultivation of sugarcane. There was a slight improvement in recovery rate during the year under review but it was because of late beginning of the crushing season.
J. Cement Industry
There are 24 cement units in the country with total installed capacity of 17.7 million tones. Out of these 24 units, 4 units are in the public sector and 20 units are in the private sector. The production capacity has doubled from 8.9 million tones to 17.7 million tones during the last 6 to 7 years. During this period, demand only increased by 27 percent from 7.7 million tons to 9.8 million tons. High prices owing to inefficiencies in production and cartel formation by the manufacturers, substantial decline in PSDP during the 1990s and slowdown of economic activity were the major factors which impeded growth in demand for cement. The total production of cement is recorded at 8.5 million tones during July-March 2002-03 as compared to 7.1 million tones in the same period of last year, showing an increase of 20.5 percent. The boost in cement production is because of the rising construction activity in the country, reconstruction activity in Afghanistan and increasing development expenditure by the government.
K. Automobile Industry
There are 18 automobiles manufacturing
units in assembling business which is supported by
850 units manufacturing auto parts. The auto
industry and down stream vendor industry employs
more than one lac people. The performance of
automobile industry has been the best during the
Chapter 3. Manufacturing Mining and Investment Policies
year under review. The impressive recovery
touched almost every segment of the auto industry.
The auto industry is the fore-runner of the
tremendous growth in large-scale industry. During
the current fiscal year the automobile industry has
registered enormous growth owing to declining
interest rates, persistent inflow of home
remittances, cheaper and easy availability of car
financing and changes in model. The car industry
registered a growth of 51.4 percent during July-
April 2002-03, followed by trucks (103 percent),
buses (32.7 percent), LCV’s (57.9 percent), tractors
(10.5 percent) and motorcycles (48.6 percent). The
installed capacity of the major components of
automobile sector and production is given in Table
3.5.
Table 3.5
Installed and Operational Capacity of Automobile Industry
(Numbers)
Item
Inst. Capacity 2001-02
July-April % Chang
e
2001-02 2002-03
Cars 122000 41071 32552 49280 51.4
Trucks 12500 1141 792 1608 103.0
Buses 1900 1099 894 1186 32.7
LCV’s 28000 8491 6315 9969 57.9
Tractors 33000 24331 18708 20680 10.5
Motorcycles 340000 133334 94108 139851 48.6
Source: Federal Bureau of Statistics.
REVIVAL OF SICK UNITS
The sick units are inimical to
development of financial institutions. The
sick units were responsible for increase in
non-performing loans during the 1990s and
resultantly, the financial sector has reached
on the verge of collapse. The government
has formed Corporate Industrial
Restructuring Corporation (CIRC) with a
mandate to revive or dispose off 868 sick
units through open public. These units in the
private sector were identified by the CIRC in
consultation with the concerned banks as
these units were closed for many years and
owed over Rs. 107 billion to the nationalized
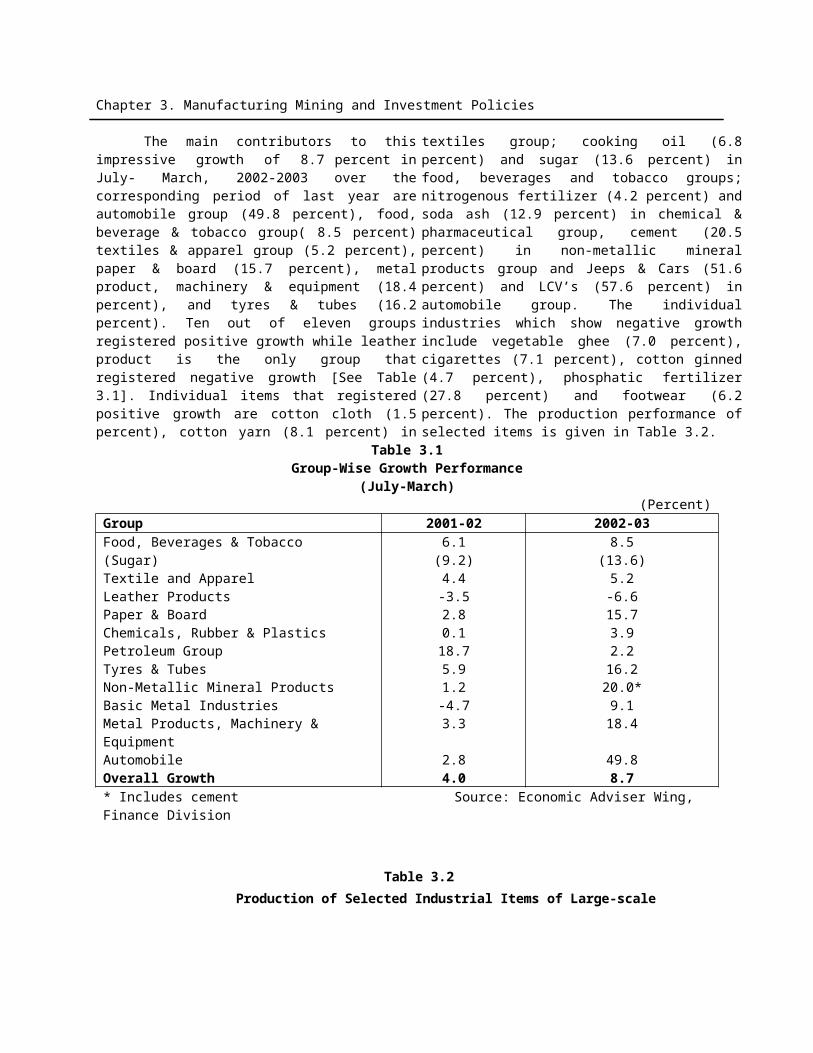
Chapter 3. Manufacturing Mining and Investment Policies
commercial banks (NCB’s) and development
financial institutions (DFI’s). The CIRC has
disposed of 33 cases worth Rs.4.7 billion in
two years of its inception against an
outstanding debt of Rs.60 billion in 339 sick
units. After return/ withdrawal of around 139
cases worth 32.8 billion, a total of 161
accounts worth Rs.21.3 billion were finally
acquired by the CIRC. On the province basis,
161 accounts acquired by the CIRC included
59 in Punjab, 90 in Sindh, 10 in NWFP and
two in Balochistan. Of the total 65 cases
disposed-off by the CIRC, 31 belonged to
NWFP, 32 in Sindh and two in NWFP.
Furthermore, out of the 65 cases disposed off
by the CIRC, 33 cases were auctioned (23
were sold in Punjab and 10 in Sindh).
The strategy to auction the
irretrievable sick industrial units, is the last
ditch attempt by the government to solve
the twin problems of sick industries and
non- performing loans of the NCBs/ DFIs.
The CIRC has so far acquired 161 units, of
which forty-one cases worth Rs.5.2 billion
had no assets at all and120 units involving
Rs.16.1 billion are being prepared for
disposal. CIRC is in the process of acquiring
39 cases worth Rs.5.3 billion.
PUBLIC SECTOR INDUSTRIES.
The size of Public sector industries shrank from twelve holding corporations with 116 manufacturing units before the start of Privatization in 1990-91, to seven corporations with 27 units including two joint ventures under the administrative control of Ministry of Industries in 2003. During the period under review, these public sector industries continued to operate within the general economic policy framework of focusing on optimal utilization of existing capacities and adhering to cost efficiency. Key performance indicators present the following picture of performance during July-June, 2002-03 (8 months actual & 4 months projected) in comparison to the same period last year.
Table 3.6
Performance of Public Sector Industries
(Excluding Pak Steel)
(Rs. In Million)
Item 2001-02 2002-03 ** % Change
Production Value* 6398 6128 -7.1
Net Sales 11358 10817 -5.0
Pre-Tax Profit 110 141 28.2
Taxes and Duties 2762 2519 -8.7
No. of Employees 8793 7580 -13.8
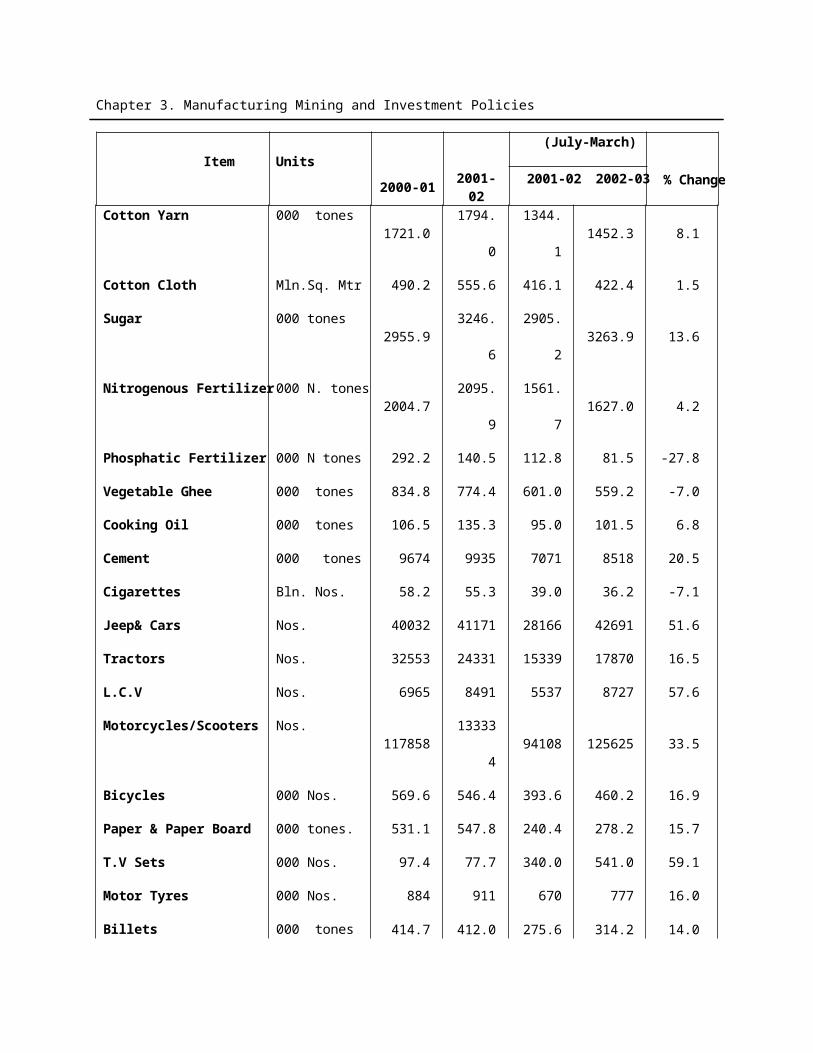
Chapter 3. Manufacturing Mining and Investment Policies
* At constant prices of 1992-93. Source: EAC, Ministry of Industry & Production** Actual for 8 months (July- Feb) and expected for 4 months (Mar- June)
Production Value
Production value (at constant prices of 1992-93) of all operational units (excluding Pakistan Steel) is expected to decline by 7.1 percent over the last year. Production value of National Fertilizer Corporation (NFC) projected to decline by 3.8 percent, followed by the State Cement Corporation (SCCP) (58 percent). Decline in production was mainly due to continual stoppage/ interruption of natural gas supply. The remaining two corporations namely, the State Engineering Corporation (SEC) and the Pakistan Automobile Corporation (PACO) have projected an increase in their production value by 8.4 percent and 40 percent, respectively. Production activity at Sindh Engineering depicted an increase of 40 percent while Heavy Mechanical Complex (HMC) witnessed slight improvement of 0.5 percent.
Net SalesNet sales (excluding Pakistan Steel) of all
operational units are estimated at Rs. 10.8 billion for 2002-2003 as against Rs. 11.4 billion in last year, showing a decline of 5.0 percent. NFC and SCCP have reported a decline in its sales value from Rs.7.5 billion and Rs.1.2 billion to Rs.6.9 billion and Rs.0.7 billion, respectively thereby showing decline of 7.8 percent and 45.0 percent. The net sale value of PACO registered an improvement of 16.0 percent - from Rs. 686.0
million to Rs. 800 million and in the case of SEC, the net sales value increase by 24.7 percent (from Rs.2.0 billion to Rs 2.4 billion) during 2002-03.
Pre- Tax Profit/ (Loss)
During 2002-03, an aggregate profit of Rs.141 million (excluding Pakistan Steel) is expected as against an aggregate profit of Rs.110 million reported last year. Only two corporations namely, NFC & PACO have projected profit during the current year, whereas SEC & SCCP are estimated to have suffered losses in this year. Though NFC has shown profit but its profit has declined from Rs.586 million last year to Rs.325 million this year. The decline in profit is attributed to increase in input costs. The SCCP and SEP have shown losses in their pre-tax profits.
Employment
Total number of employees enrolled with all units (excluding Pak Steel), by end June, 2003 is estimated at 7,580 as compared to 8,793 on end June 2002. The number of employees has dropped in SEC, SCCP, NFC and PACO.
Overall Performance of Public Sector Industries
(Including Pakistan Steel)
Overall performance of public sector industries (including Pakistan Steel) has shown some improvement as summarized in Table 3.7.
Table 3.7
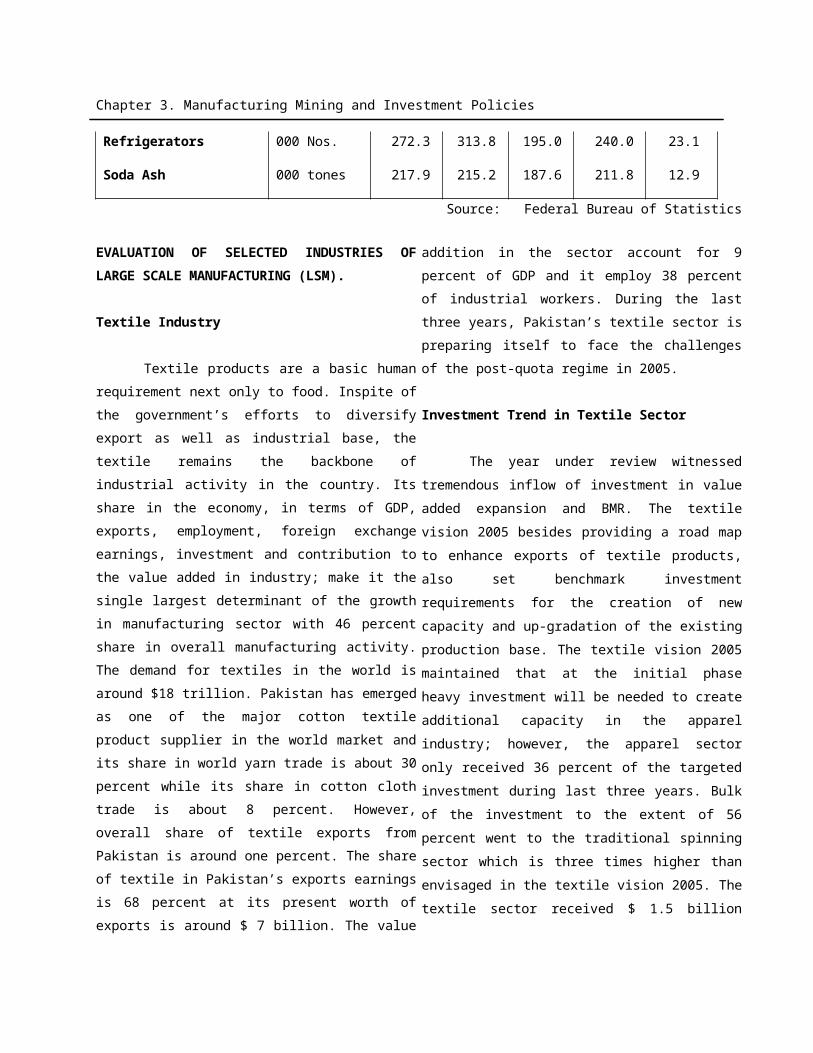
Chapter 3. Manufacturing Mining and Investment Policies
Performance of Public Sector Industries(Overall)
Rs. In Million)Description 2001-02 2002-03** % Change
Production Value* 15693 16111 2.7
Net Sales 25841 31237 20.9
Pre-Tax Profit 212 791 274.0
Taxes and Duties 5412 7059 31.0
No. of Employees 24756 21010 -15.0
* At constant prices of 1992-93. Source: Expert Advisory Cell, ** Actual for 8 months (July- Feb.) and estimated for 4 months (Mar-June)Performance of Pakistan Steel
Pakistan Steel is the first integrated iron & steel works project in Pakistan. It was established with the objective of enhancing domestic availability of basic raw material for engineering and construction industries. It facilitated establishment of downstream steel industries in the country. The production capacity of Pakistan Steel is 1.1 million tons of raw steel per annum with built-in potential to expand its capacity to over 3 million tones per annum. The Steel Mill is producing coke, pig iron, billets, hot rolled coils/sheets, cold rolled coils/sheets, formed sections like channels, angles, galvanized sheets etc.
The year under review is the best performing year in the chequered history of Pak steel. In this year Pak Steel touched several mile-stones like registering highest ever record of net sales at Rs.20 billion, productivity growth improved to 66 per ton per employee as against historical record of
36 per ton per employee and received ISO-9001 certification for quality products. Pakistan Steel’s performance had witnessed many ups and downs during its fifteen years of history. It was characterized with low production, low capacity utilization, low sales and high losses, surplus manpower, increased liabilities, poor work discipline, lack of culture of accountability and bad public image. Inspite of precarious conditions, nothing was done to improve the situation. Pakistan steel has undergone a serious over-hauling to deviate from the past and its current strategy is more focused on increase in profitability with lesser investment. The performance of 2002-03 is an indication of revival of Pakistan Steel. The performance of Pakistan Steel (based on major performance indictors) during the period 2002-03 is summarized in the Table 3.8:
Table 3.8Performance of Pakistan Steel
(Rs. in Million)
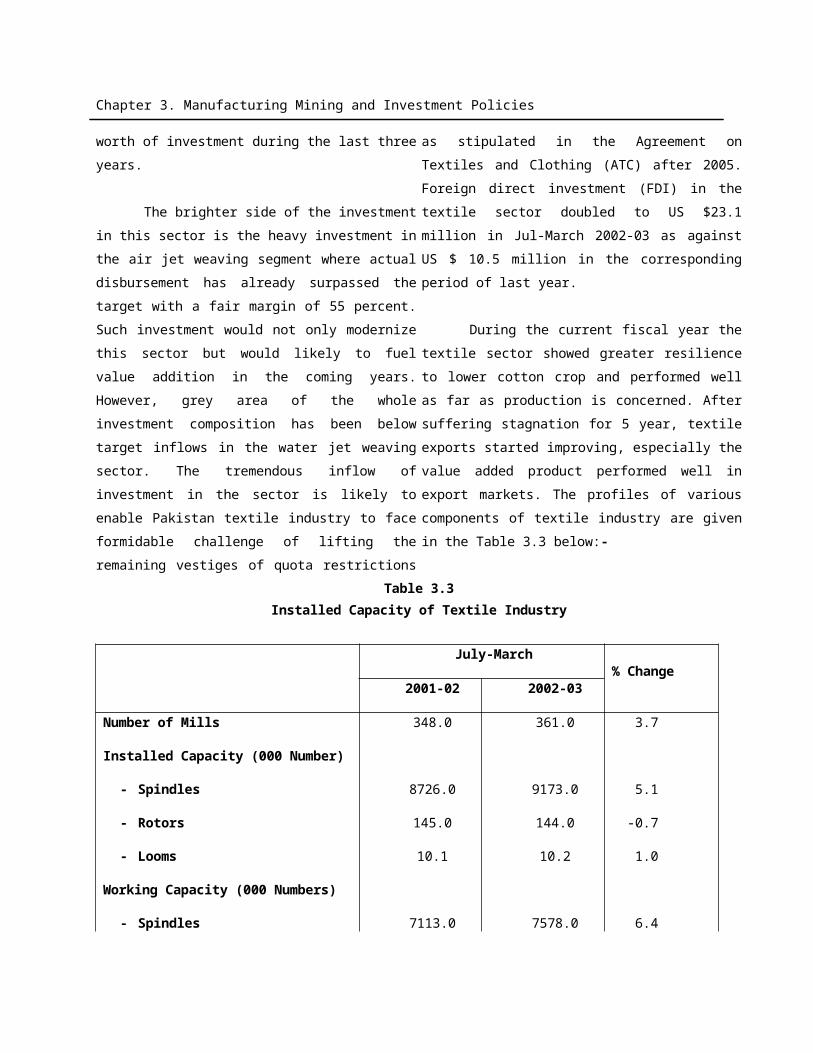
Chapter 3. Manufacturing Mining and Investment Policies
Item 2001-02 2002-03 (Proj.)
% Change
Production Value * 9094 9982 10.0Net Sales 14483 20419 41.0Pre-tax profit 538.0Taxes & duties 2650 4541 71.0No. of employees 15963 13430 -16.0
*At constant prices of 1992-93. Source: Expert Advisory Cell, M/o Ind. & Prod.
Pakistan steel is also catering for the needs of 22 downstream units in Karachi along with 21 located in different parts of the country. The downstream industries are basically producing value added engineering goods such as steel pipes (small, medium and large diameter), seamless pipes, wire rod and baling hoops, small sections, reinforcement bars, slag cement, slag wool, automotive parts etc.
SMALL AND MEDIUM ENTERPRISES (SMEs)
Small and Medium Enterprises (SMEs) constitute 90 percent of businesses in Pakistan. SMEs comprise of heterogeneous activities but its active presence in services and manufacturing is felt prominently because of large-scale manufacturing and corporate sectors’ limitations in catering all national demand for goods and services. SMEs represent a significant component of Pakistan’s economy in terms of value addition and employment generation. SMEs play critical role in manufacturing sector by providing 80 percent of industrial employment, contributing 30 percent to GDP and generating one-fourth of the sector’s export earnings. Its contribution to value added in manufacturing sector has risen from 27 percent in 1980-81 to 35 percent in 1997-98 but its share in employment in the manufacturing sector declined from 85 percent in 1980-81 to 83 percent. This implies productivity improvements in the last two decades. It provides employment
at lesser cost and its capital requirement is also low.
There is growing recognition of the importance of SMEs in economic development, but the policy framework has remained biased against the sector. However, for the last three years the government has brought SMEs on the forefront of the policy making and declared it one of the four drivers of the economy. The growth of small-scale industry is mainly hampered by the non-availability of credit facility in the past. Realizing this constraint, the government has opened two specialized micro-credit banks namely, khushhali bank and SME bank. Small and Medium Enterprises Development Authority (SMEDA) has been reinvigorated and re-organized to provide technical assistance to potential small investors. SMEs still face difficulties in coping with skilled workers requirement, regulation and business environment issues, infrastructural problems like poor electricity supply, poor technology, access to raw material (especially imported) and inadequate marketing. Following organizations are involved in promotion of small and medium industries in the provinces:
i) Punjab Small Industries Corporationii) Sindh Small Industries Corporationiii) NWFP Small Industries Development Board
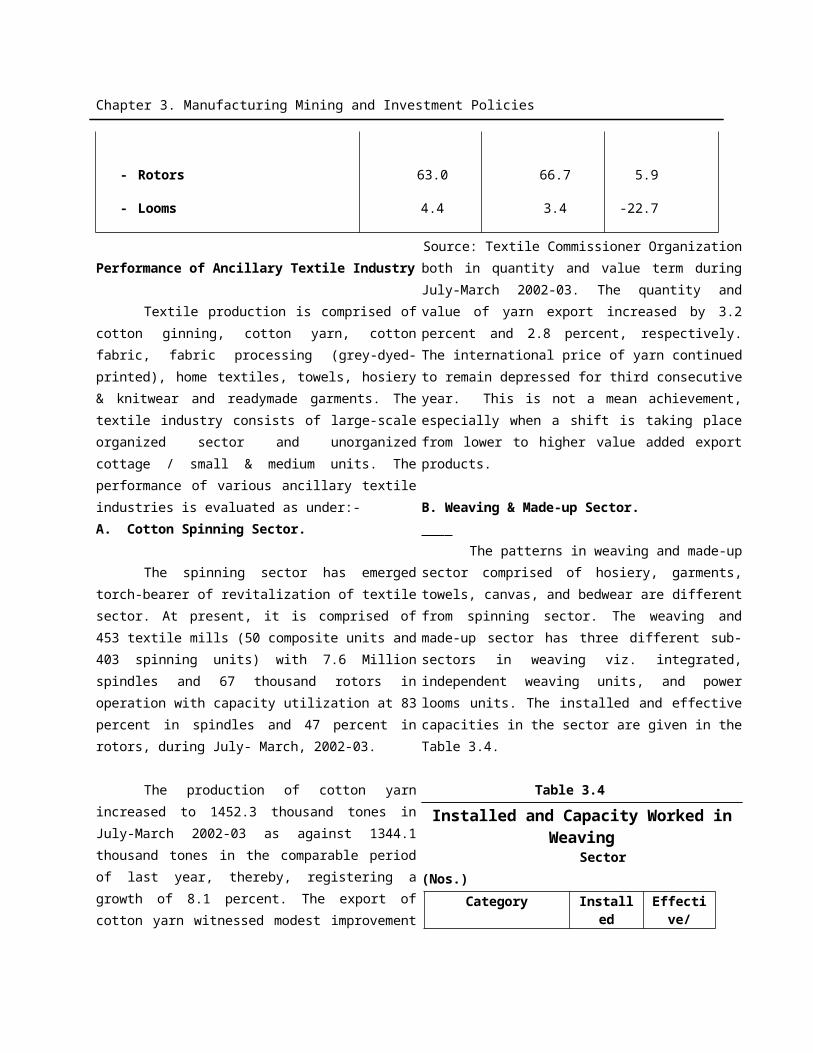
Chapter 3. Manufacturing Mining and Investment Policies
iv) The Directorate of Small Industries Balochistan
These organizations have
infrastructure like industrial estates, vocational
training institutes and funds. But, unfortunately,
these provincial organizations have not made
any dent in promotion of small industries. The
precarious conditions in industrial estates and
vocational institutions are never facilitative in
promotion of small industries. The government
has added a professional body like SMEDA to
revitalize the small and medium industrial
sector. SMEDA is not only working for the uplift
of small and medium enterprises in the country
but also completed studies on various crucial
sectors for Pakistan economy like textile, leather,
agriculture & livestock, fisheries, light
engineering and transport. SMEDA is also
working on issues, which confront SMEs and
preparation of regulatory and fiscal policy
options to facilitate the sector. Although, the
role of SMEDA has in development of the sector
has not yet provided evidence of considerable
improvement but it has prepared pre-feasibility
studies of 8 projects and is working on 38 more
projects. SMEDA is also engaged with
international donors to obtain their cooperation
and expertise in development of SMEs.
FOREIGN INVESTMENT
Policies in the 1990s in developing
countries have emphasized upon greater
encouragement and mobilization of non-debt
creating private capital flows for reducing
reliance on debt flows as the vehicle for
generating external resources. Foreign direct
investment (FDI) being the single largest
component of private capital flows has
contributed to investment and growth in
developing countries, leading to technological
improvements, the reduction in poverty and
improvement in the living standards. The
distribution of these flows has, however,
remained uneven. The countries that have
received the lion share of the surge in FDI flows
during 1990s are the ones that followed open
trade and investment regime, maintained
macroeconomic stability, had large markets, a
predictable institutional environment without
excessive red-tapism has remained firm in place,
and possessed reasonably improved physical and
human infrastructure. The countries that lagged
behind in attracting FDI are the ones that faced
macroeconomic instability, pursued inconsistent
economic policies, had relatively poor physical
and human infrastructure, and bureaucracy not
responding to the initiatives with conviction.
Pakistan has introduced wide-ranging reforms to
attract the inflow of foreign investment.
Where does Pakistan stand today? The
improvement in the country’s macroeconomic
environment and upward revision of the
economy’s international credit ratings are the
distinct advantages which can help in attracting
inflow of foreign investment. Pakistan is
expecting dividends from factors like political
stability, conducive macroeconomic
environment, growing market, greater security of
the investment and profits and continuity of
economic policies.
The inflow of foreign investment in
Pakistan has been declining since 1995-96 for a
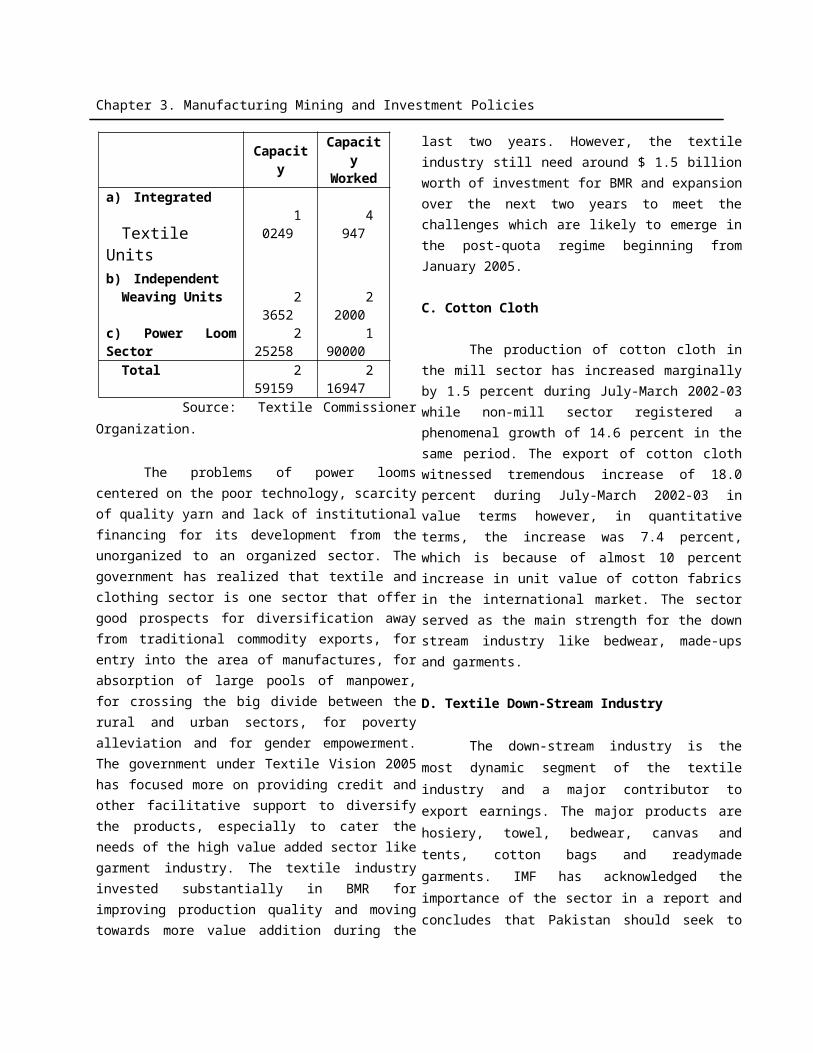
Chapter 3. Manufacturing Mining and Investment Policies
variety of reasons including : the saturation of investment in power sector; the East Asian financial crises of 1997; economic sanctions and freezing of foreign currency accounts of May 1998; the IPP and the HUBCO issues, particularly the way it was handled in the past; low levels of foreign
exchange reserves and threat of default on external payments obligations; and disarrayed relations with the International Financial Institutions(IFIs). Over the last three years the government has succeeded in removing various irritants which affect business and investment climate.
Table 3.9 Inflow of Net Foreign Private Investment (FPI)
(Million US $)
Country 2001-02July–March
2001-02 2002-03
DirectPort folio
Total Direct Portfolio Total Direct Portfolio Total
USA 326.4 -1.7 324.7 164.1 -10.0 154.1 163.5 0.6 164.1UK 30.3 -32.4 -2.1 22.6 -18.3 4.3 202.7 -11.3 191.4UAE 21.5 -4.2 17.3 15.9 1.9 17.8 112.7 1.6 114.3Germany 11.2 - 11.2 8.6 - 8.6 2.8 - 2.8France -6.9 0.3 -6.6 1.5 0.1 1.6 2.2 - 2.2Hong Kong 2.8 20.6 23.4 2.2 14.1 16.3 4.6 -5.2 -0.6Italy 0.1 - 0.1 - - 0.2 - 0.2Japan 6.5 0.2 6.7 4.1 0.2 4.3 11.5 0.3 11.8Saudi Arabia
1.3 0.1 1.4 2.1 0.1 2.2 32.6 -0.4 32.2
Canada 3.5 2.7 6.2 3.0 2.7 5.7 0.4 0.3 0.7Netherland -5.1 -0.8 -5.9 -6.5 -0.8 -7.3 2.7 0.9 3.6Others 92.6 5.2 97.8 69.8 7.1 76.9 122.3 19.7 142.0Total 484.7 -10.0 474.7 287.4 -2.9 284.5 658.2 6.5 664.7
Source: State Bank of Pakistan The emerging trend in the inflow of
foreign investment is encouraging as it has
already started picking-up this year. It is
likely that foreign investment will reach one
billion dollars mark by the end of the
current fiscal year. Foreign direct
investment has more than doubled in the
first nine months (July-March, 2002-03), the
net foreign investment stood at US $ 664.7
million as against US $ 284.5 million,
thereby, showing an increase of 133.6
percent. (see Table 3.10 )
Table 3.10Inflow of (FDI) Foreign Direct Investment
(In Main Economic Group) (Million US $)
Economic Group 1999-2000
2000-01
2001-02
July–March2001-
022002-
03
Chapter 3. Manufacturing Mining and Investment Policies
1. Power 67.4 40.3 36.4 32.6 28.12.Chemical, Pharmaceutical & Fertilizer
119.9 26.3 17.8 11.5 85.6
3. Construction 21.1 12.5 12.8 9.9 11.14. Mining & Quarrying, Oil and Gas
79.7 84.7 274.8 121.7 137.2
5.Food, Beverages & Tobacco 49.9 45.1 -5.1 -8.0 5.66. Textile 4.4 4.6 18.4 10.5 23.17. Trade, Transport, Storage & Comm.
38.6 94.7 68.3 36.6 119.0
8. Machinery other than electrical
4.6 2.5 10.5 - 0.4
9. Electronics 2.3 2.8 15.9 14.8 4.510. Financial Business 29.6 -34.9 3.6 13.3 201.811.Petro-Chemical & Refining 12.0 8.7 5.0 2.4 2.812. Cement 0.1 15.2 0.4 0.4 0.513. Others 40.3 20.0 25.9 41.7 42.1Total 469.9 322.5 484.7 287.4 658.2
Source: State Bank of Pakistan
Foreign Direct Investment (FDI) increased by 129 percent and stood at US $ 658.2 million during July-March, 2002-03 as against US $ 287.4 million for the same period in the previous year. The United Kingdom accounts for 30.8 percent of FDI inflows, followed by U.S (24.8 percent), U.A.E (17.1 percent) and Saudi Arabia (5.0 percent). FDI inflow from UK and UAE is extra-ordinarily high because of purchasing of 15 percent stakes of United Bank by UK based Bestway group and UAE based Abu Dhabi group for $ 208 million. The remaining amount of inflow is unevenly distributed among various countries. The group-wise break-up shows that financial business has accounted for largest slice of the FDI at 30.6 percent while with 20.8 percent of stake was attracted by Mining & Oil and gas exploration. The power sector which has remained apple of the eye of the investors for some year only accounted for 4.3 percent stake in FDI. Trade, transport, storage and communication group get 18.1 percent of the slice while chemical, pharmaceutical & fertilizer group account for 13.0 percent stake. Textile industry
received 3.5 percent of FDI inflow. Group-wise break of FDI inflow is given in Table 3.10.
THE PRIVATIZATION PROGRAMME
Subsequent governments have attached high priority to the privatisation process in the 1990s but the present government recognized it as part of its economic policy for restructuring and revitalization of the economy. Privatization in Pakistan is both attractive and rewarding for potential investors. The program for transfer of the ownership of public assets is unambiguously predicated on the principle of reducing its direct participation in commercial activities. The minimization of government’s role in economic activity reinforces the need for regulation in strategic areas and the design of appropriate policies in order to ensure that the functioning of the economy is not distorted and those benefits are distributed in an equitable manner.
In its early phase, privatization was very abrupt and rapid but the momentum was lost. The reason for slow progress on privatization during the second half of the 1990s
Chapter 3. Manufacturing Mining and Investment Policies
lay in an inhospitable enabling environment, legal challenges to privatisation, public opposition to privatization, and lack of adequate regulatory frameworks for the privatisation of utilities. Recognizing this, government for the last three years focused and made strong progress on:-
Restoring and enhancing investor confidence by improving the macroeconomic climate and resolving investor disputes.
promulgating a Privatisation Commission Ordinance to provide legal cover to tackle issues like investors confidence, transparency and distribution of proceeds
restructuring and strengthening the Privatisation Commission to make it a leaner, more transparent and more effective institution
appointing the Chairman as Minister for Privatisation to enhance the stature of privatisation and facilitate the privatisation process
establishing or strengthening regulatory frameworks.
hiring top class financial advisors.
improving the public's understanding of privatisation rationale and process via seminars, interviews, publications, and a revamped website.
A comprehensive privatisation program for the short and medium terms was prepared while keeping with the economic environment and investment conditions. Privatization Commission Ordinance, 2000 increases the accountability of the PC, and allocates 90 percent of privatisation proceeds towards debt retirement and 10 percent towards
poverty alleviation programs. Pursuant to said Ordinance, various sets of Rules & Regulations have been notified. Pakistan Telecommunication Authority (PTA), National Electric Power Regulatory Authority (NEPRA), Natural Gas Regulatory Authority (NGRA) and Oil & Gas Regulatory Authority (OGRA) has started functioning to build credible expertise within these sectors on urgent basis.
The existing Privatisation Programme is progressing satisfactorily. Till March, 2003, 128 privatisation transactions had been completed and proceeds of Rs.97 billion were realized. This includes 22 transactions for Rs.35 billion from October 1999 to March, 2002. In addition, 15 industrial units were excluded from the Privatization Programme either for liquidation or being non-privatisable. The Cabinet Committee on Privatization (CCOP) and Board of the Privatisation Commission were re-constituted during the last two months. During November, 2002 to March, 2003, government's remaining shares in POL, Attock Refinary Ltd. and DG Khan Cement have been divested through Stock Exchange which fetched Rs. 2.9 billion.
Privatization is a complex and demanding reform and every stage requires utmost transparency and high level of managerial, financial and technical expertise. A number of major privatization transactions including PSO, OGCL, PTCL, Habib Bank, KESC, and Pak-Arab Fertilizer have been brought to a very advance stage. This implies on changing of focus from the privatization of the more straightforward industrial transactions to those involving the transfer of management control in services such as banking, transport and utilities. This requires sensitive decisions on pricing, restructuring and rightsizing. During the last three years the privatisation efforts with the laying of ground work for the successful marketing of these major transactions faced formidable challenges due to some event which delayed few privatisation transactions. The
Chapter 3. Manufacturing Mining and Investment Policies
recent performance of the stock market and the improvement of the fiscal and monetary position of the government auger well for the success of the privatization process. With several major privatisation transactions on the cards, the outlook for 2003-2004 appears bright and positive.
MINING & QUARRYING.
The mining and quarrying sector grew by 9.5 percent during 2002-03 as against 3.7 percent last year. This is because of concerted effort by the government to boost this very important sector which play pivotal role in economic development by providing basic raw material to key industries of the country. Various regional geological surveys, conducted in the recent past, have confirmed the great potential of Pakistan in the metallic minerals like copper,
gold, silver, platinum, chromites, iron, lead and zinc. As regards industrial minerals there is a vast potential of multi-coloured granite, marble and other dimensional stones of high quality for export purpose. But due to resource constraint and non availability of high-tech the mineral development could not grew up to the potential. Its meager share of just 0.5 percent in the GDP does not fully reflect the actual potential of the sector. Presently about 50 minerals are under exploitation. Major mineral products are coal, rock salt, other industrial and construction mineral.
The contribution in the growth of mining & quarrying sector came from coal and natural gas which grew by 4.0 percent and 3.1 percent respectively. The extraction of some important minerals is given in table-3.11:
Table 3.11Extraction of Principal Minerals
July-March
MineralsUnits of the
quantity2000-01 2001-02 2001-02 2002-03 % Change
Coal Million tones 3.3 3.5 2.5 2.6 4.0
Natural Gas 000 MMCFT 24.8 26.2 19.5 20.1 3.1
Crude Oil Mln. Barrels 21.1 23.2 17.2 18.2 5.8
Chromites 000 tones 16 16 10 15 50.0
Dolomite 000 tones 352.7 312.9 251.4 243.8 -3.0
Gypsum 000 tones 364 328 230 308 33.9
Limestone 000 tones 10.9 9.8 6.4 7.7 20.3
Magnetite 000 tones 4.6 4.6 2.7 2.5 -7.4
Rock Salt 000 tones 1394 1359 988 994 0.6
Chapter 3. Manufacturing Mining and Investment Policies
Sulphur 000 tones 17.4 22.6 15.8 14.7 -7.0
Baryte 000 tones 28 21 15 20 33.3
Source: Federal Bureau of Statistics.At present, the value addition is
concentrated in four principal minerals like gypsum, sulpher, crude oil, and natural gas. These minerals account for most of the overall value addition of the mineral sector. The value addition in the sectors of gypsum has notably gone up by 34 percent, while the extraction of sulpher declined by 7 percent. From the table 3.11, it is evident that during the year under review, the overall growth of the mineral sectors depicts positive trend.
In order to accelerate the development of mineral resources in the country, a National Mineral Policy is being implemented in letter and spirit during last three years. The fiscal incentives and regulatory framework is reinvigorated to attract foreign investment. The government has accorded high priority for implementation of National Mineral Policy to attract foreign investment. In difficult environment FDI remains apple of the eye of foreign investors for the last three years. The FDI inflow in Mining and Quarrying Sector is given in the above table 3.12.
Table 3.12FDI Inflow in Mining and Quarrying
Year US $
million
% Share FDI
1997-98
99.1
16.5
1998-99
112.8
23.9
1999-00
79.7
17.0
2000-01
84.7
26.3
2001-02
274.8
54.7
2002-03*
137.2
20.8
* (July - March,) Source: Economic Advisor Wing
The Foreign Direct Investment (FDI) in the Mining and Quarrying sectors was 17.0 percent in 1999-2000, but since then it has started increasing. Its share in total FID inflow however peaked at 54.7 percent in 2001-02, as against 26.3 percent in 2000-01. Nevertheless, it has become the first largest recipient of FDI inflow in 2001-02. During July-March 2002-03, its share declined substantially but it is still one of the major recipients of FDI inflow. Many foreign companies are involved in preparation of feasibilities, oil exploration and development work in the field of mining and quarrying.
__________________
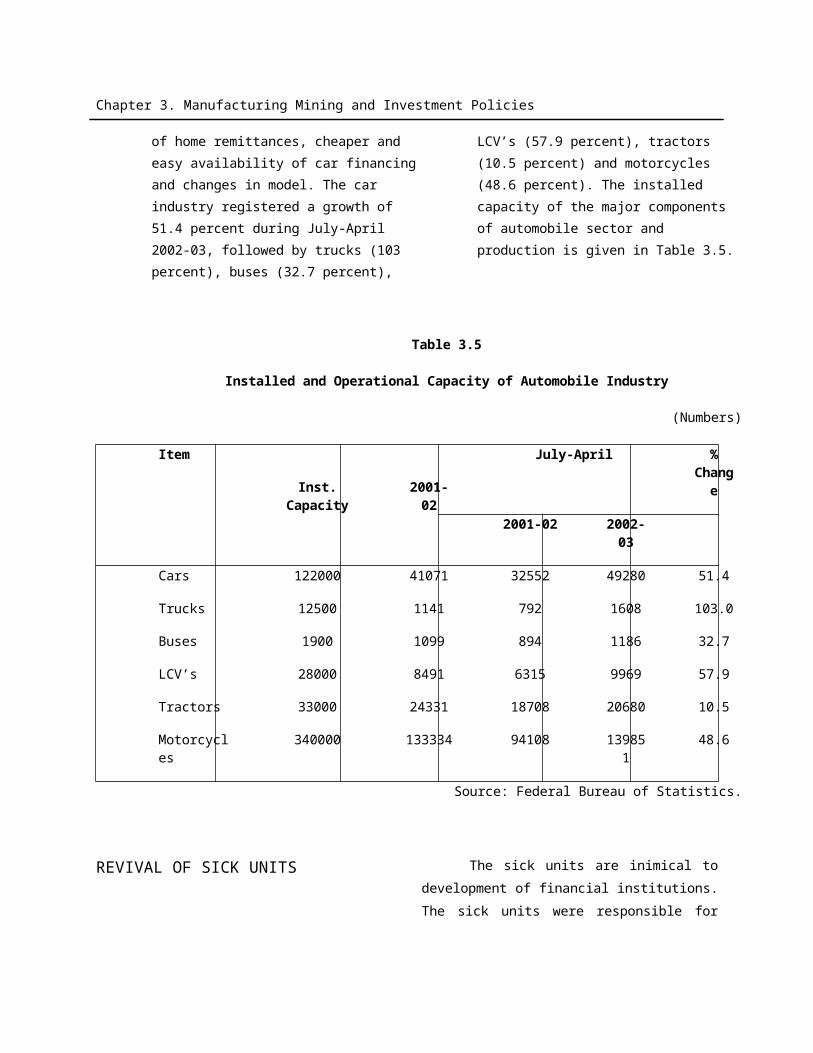
Chapter 4. Income Distribution and Poverty
4. Income Distribution and PovertyI. Poverty – Global Perspective
Poverty is hunger, lack of shelter being sick and not being able to see a doctor, not being able to go to school and not knowing how to read. Poverty is not having a job. Poverty is losing a child to illness brought about by unclean water. Poverty is powerlessness, lack of representation and freedom. Poverty has many faces, changing from place to place and across time, and has been described in many ways. The proportion of the developing world's population living in extreme economic poverty -- defined as living on less than $1 per day (in 1993 dollars, adjusted to account for differences in purchasing power across countries) -- fell from 32 to 25 per cent between 1990 and 1999, according to the latest estimates [World Bank, 2002]. The simple extrapolation of this trend to the year 2015 results in a headcount index of about 16 per cent—indicating that the world is on track for reaching the global goal of halving poverty between 1990 and 2015. Substantial improvements in social indicators have accompanied growth in average incomes. Infant mortality rates have fallen from 107 per 1,000 live births in 1970 to 59 in 1999. On average, life expectancy has risen by four months each year since 1970. Growth in food production has substantially outpaced that of population. Governments report rapid progress in primary school enrollment. Adult literacy has also risen, from 53 percent in 1970 to 74 percent in 1998. And gender disparities have narrowed, with the female-male difference in net enrollment rates decreasing from 11 percent in 1980 to
5 percent in 1997. The developing world today is healthier, wealthier, better fed, and better educated. Living standards have risen dramatically over the last decades. Per capita private consumption growth in developing countries has averaged about 1.4 percent a year between 1980 and 1990 and 2.4 percent between 1990 and 1999. So millions have left behind the yoke of poverty and despair.
Unfortunately, the reality is more complex, and progress is less satisfactory. Population in the developing world has grown rapidly—from 2.9 billion people in 1970 to 5.1 billion in 1999 -- and many have been born into poverty. The number of people below the international poverty line declined by a mere 1 per cent per year between 1990-99; decreasing from 1.3 billion people to 1.1 billion. Furthermore, poverty trends for most regions showed little or no progress. The incidence of income-poverty remained largely unchanged in sub-Saharan Africa (SSA), Latin America and the Caribbean (LAC) and in the Middle East and North Africa (MENA). Actually, the number of income-poor in these three regions combined increased by about 7 million people each year between 1990 and 1999. Regional trends show that the decline in global poverty was driven by East Asia (EA) between 1993-96 and by South Asia (SA) in 1996-99.
At the United Nations Millennium
Summit in September 2000, world leaders
placed development agenda by adopting
the Millennium Development Goals,
commonly known as MDGs, which set clear
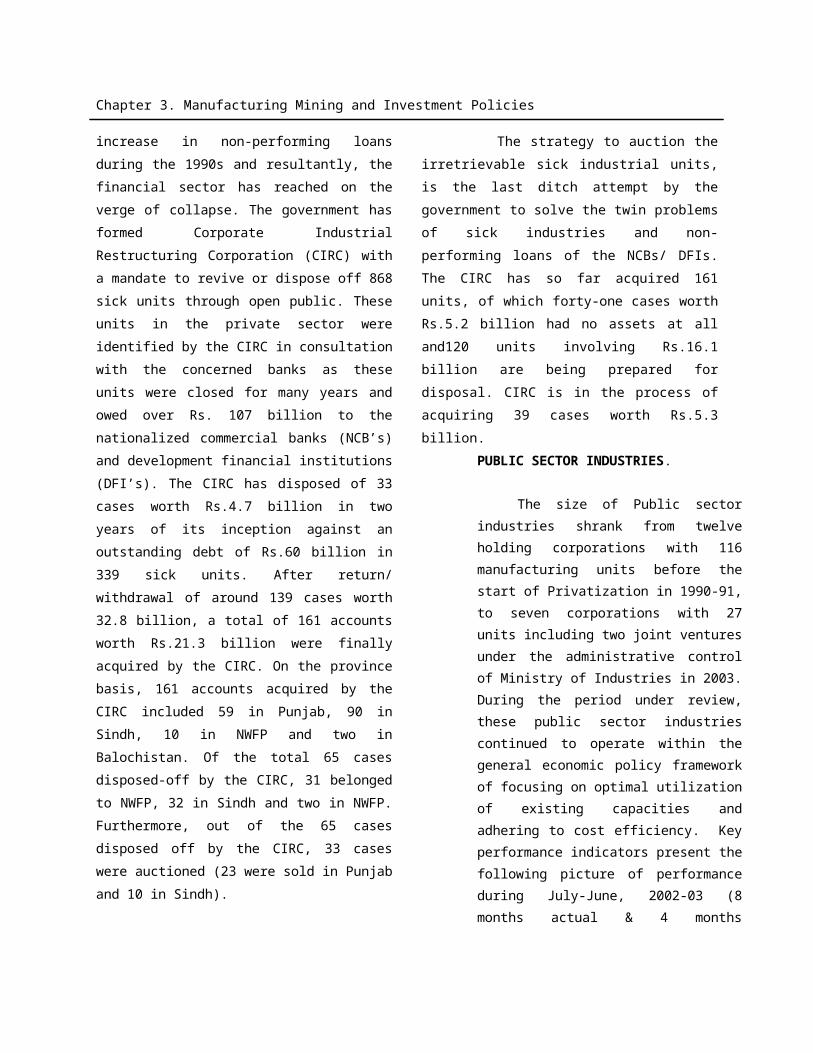
Chapter 4. Income Distribution and Poverty
targets for reducing hunger, disease,
illiteracy, environmental degradation and
discrimination against women by 2015. The
international development community has
adopted halving extreme poverty by 2015
as a central goal. To accelerate progress
toward this goal, both developed and
developing countries will have to join hands
together to generate stronger economic
growth complemented by actions to
enhance the capability of poor people to
participate effectively in growth process.
For developing countries, they need to
improve investment climate in their
countries and maintain macroeconomic
stability, improve governance, and invest
more on their poor people. These efforts of
developing countries must be
complemented by stronger support from
developed countries; in particular through
increased market access for developing
country exports, debt relief, and increase in
the volume, predictability and effectiveness
of aid. Both developed and developing
countries have committed to undertake
their respective responsibilities in
Monterrey and Johannesburg to achieve the
MDGs.
II. Poverty and Inequality in Pakistan
Poverty has many dimensions in
Pakistan. The poor in Pakistan have not only
low incomes but they also lack access to
basic needs such as education, health,
clean drinking water and proper sanitation.
The latter undermines their capabilities,
limits their opportunities to secure
employment, results in their social
exclusion and exposes them to exogenous
shocks. The vicious cycle of poverty is
accentuated when the governance
structures exclude the most vulnerable
from the decision making process.
Pakistan’s Poverty Reduction
Strategy Paper (PRSP) has noted that while
the extent and depth of poverty measured
through different approaches varies
depending upon the indices used and
definition adopted, there was considerable
agreement over the trends in poverty over
recent years. There was broad consensus
that the momentum gained in the fight
against poverty during the 1980’s was lost
during the 1990s when poverty continue to
rise in the 1990s.Yet there was considerable
debate on the consistency, measurement
and methodology of poverty indicators. The
I-PRSP noted that Pakistan did not have an
official and well-accepted poverty line at
the time which contributed to the debate.
In preparation for the PRSP, the
Government of Pakistan has deliberated on
the poverty related data and concurs with
the IPRSP regarding the broad trends in the
incidence of poverty. The Planning Division,
during this period has adopted an official
poverty line based on a caloric norm of
2350 calories per adult equivalent per day1.
The poverty line based on minimum caloric
requirement of 2350 calories per capita per
day approximates per capita expenditure of
Rs. 670 per month in 1998-99 and rising to
Rs. 748 per month in 2000-01. To facilitate
comparisons with existing measures, the
Planning Division has estimated a series of
poverty estimates from 1986-87 to 2000-01
based on the respective HIES data bases.
These estimates are reported in Table 4.1
Table 4.1
1 The caloric norm in urban areas is 2150 calories and 2450 calories in the rural areas.* The Head count ratio is based on the new estimated National Poverty Line of Rs. 748.56 per capita per month at the prices of 2000-01 PIHS Survey
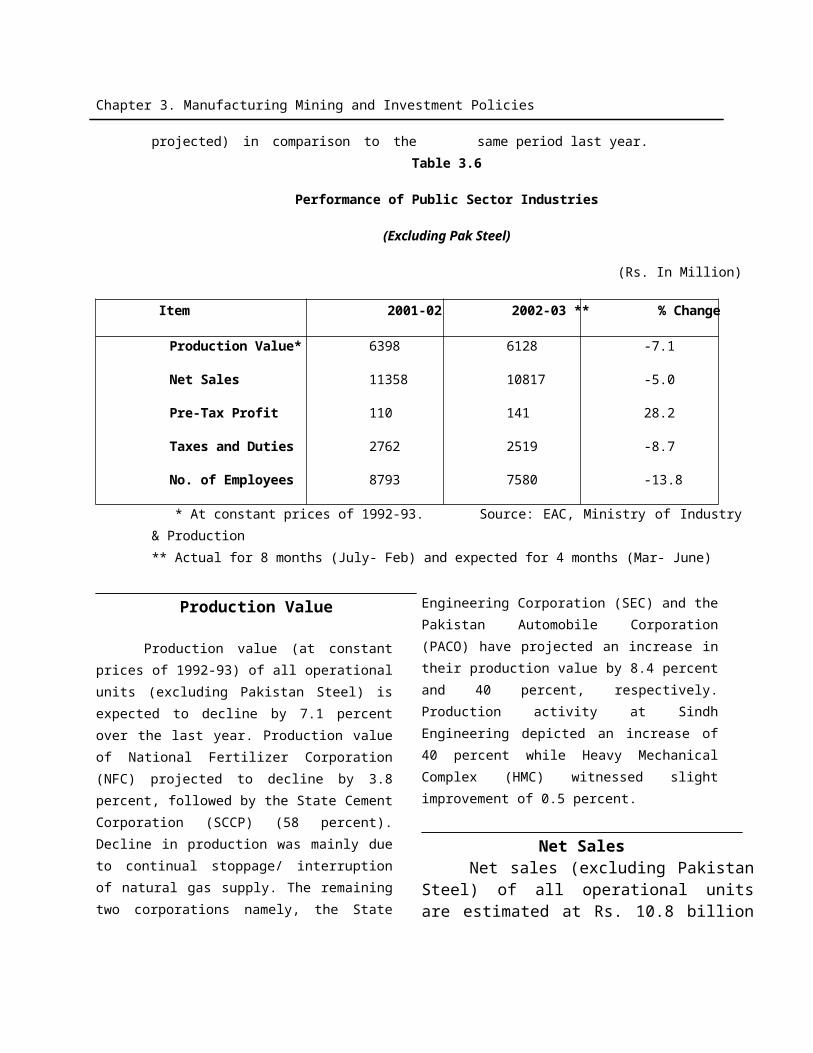
Chapter 4. Income Distribution and Poverty
Trends in Poverty: Head Counts Ratio (Percent)
1986-87
1987-88
1990-91
1992-93
1993-94
1996-97
1998-99 a
2000-01 b
2003 c
Pakistan 29.1 29.2 26.1 26.8 28.7 29.8 30.6 32.1 31.8
Urban 29.8 30.3 26.6 28.3 26.9 22.6 20.91 22.67 22.39
Rural 28.2 29.3 25.2 24.6 25.4 33.1 34.67 38.99 38.65
Source: Planning Commission. a: The Head count ratio is based upon the officially notified national poverty line of Rs. 673.54 per capita per month at the prices of 1998-99 PIHS Survey.b: The Head count ratio is based upon the officially notified national poverty line of Rs. 748.56 per capita per month at the prices of 2000-01 PIHS Survey. c: Head Count ratio based on the post enumeration survey of PIHS 2000-01, with 5% representative sample covering 726 households out of the original sample size of 14536 households, was conducted in February 2003.
According to the new official poverty line, it is inferred that the incidence of poverty has declined between 1986-87 to 1990-91, falling from 29 percent to 26 percent. Subsequently the trend in poverty was reversed. Between 1992-93 and 2000-
01, poverty increased by about 5 percentage points to 32 percent with the biggest jump in poverty taking place in 1993-94. One of the key reasons for the rise in poverty in 2000-01 has been the crippling drought which severely damaged
Pakistan’s agriculture. Overall agriculture instead of growing, in fact shrank by 2.6
percent in 2000-01. Almost 68 percent people of Pakistan live in rural area and
Chapter 4. Income Distribution and Poverty
overwhelming majority of them depend directly or indirectly on agriculture for their livelihood. Recent estimates, based on 5 percent sample (726 households out of the total sample size of 14536) of the PIHS, conducted in February 2003, show a marginal decline in poverty. It appears that the rising trend in poverty has been arrested and the process of decline in poverty has just begun. What is required now is to sustain the growth momentum and enhance spending on social sector to make a credible dent in poverty. Economic growth accompanied by macroeconomic stability remains critical for Pakistan to reduce poverty. At the household level, growth serves to reduce poverty and better enables households to send their children to school and obtain proper nutrition and health care. At the macro level, growth generates greater resources which can finance improved coverage and quality of
education, health, water and other services. Growth itself will depend on many factors including investment climate and increased opportunities for trade access to developed markets but also, a healthy, better educated and more productive labour force.
Income Distribution
Over the years, the pattern of income distribution, measured in terms of Gini Coefficient and household income share of the lowest and the highest 20 percent for rural and urban areas respectively in Pakistan, has been mixed and moderate. The Gini Coefficient of household income had been around 0.35 or below since the 1960s, reaching 0.407 in 1990-91 and 0.410 in 1998-99. The ratio of highest 20 percent to lowest 20 percent of household income gives the income gap. Table presents the trend summary.
Table 4.2Trends in Income Inequality
Year Household Gini
coefficient
Percentage Share of Income Ratio of highest 20% to
lowest 20%
GDP Growth
RateLowest
20%Middle 60%
Highest 20%
1979 0.373 7.4 47.6 45.0 6.1 5.51984-85 0.369 7.3 47.7 45.0 6.2 8.71985-86 0.355 7.6 48.4 44.0 5.8 6.41986-87 0.346 7.9 48.5 43.6 5.5 5.81987-88 0.348 8.0 45.3 43.7 5.5 6.41990-91 0.407 5.7 45.0 49.3 8.6 5.61992-93 0.410 6.2 45.6 48.2 7.8 2.31993-94 0.400 6.5 46.3 47.2 7.3 4.51996-97 0.400 7.0 43.6 49.4 7.1 1.91998-99 0.410 6.2 44.1 49.7 8.0 4.2
Source: Federal Bureau of Statistics, Ministry of FinanceNote: Data beyond 1998-99 are not available.
It can be inferred that during the 1980s, the period of relatively higher growth rate, the percentage share of income of lowest 20 percent increased from 7.3 percent to 8 percent, while the percentage share of middle 60 percent and
highest 20 percent decreased from 47.7 percent to 45.3 percent and from 45 percent to 43.7 percent respectively. On the other hand, during the latter half of the 1990s, a period of sluggish economic growth, the percentage share of lowest 20
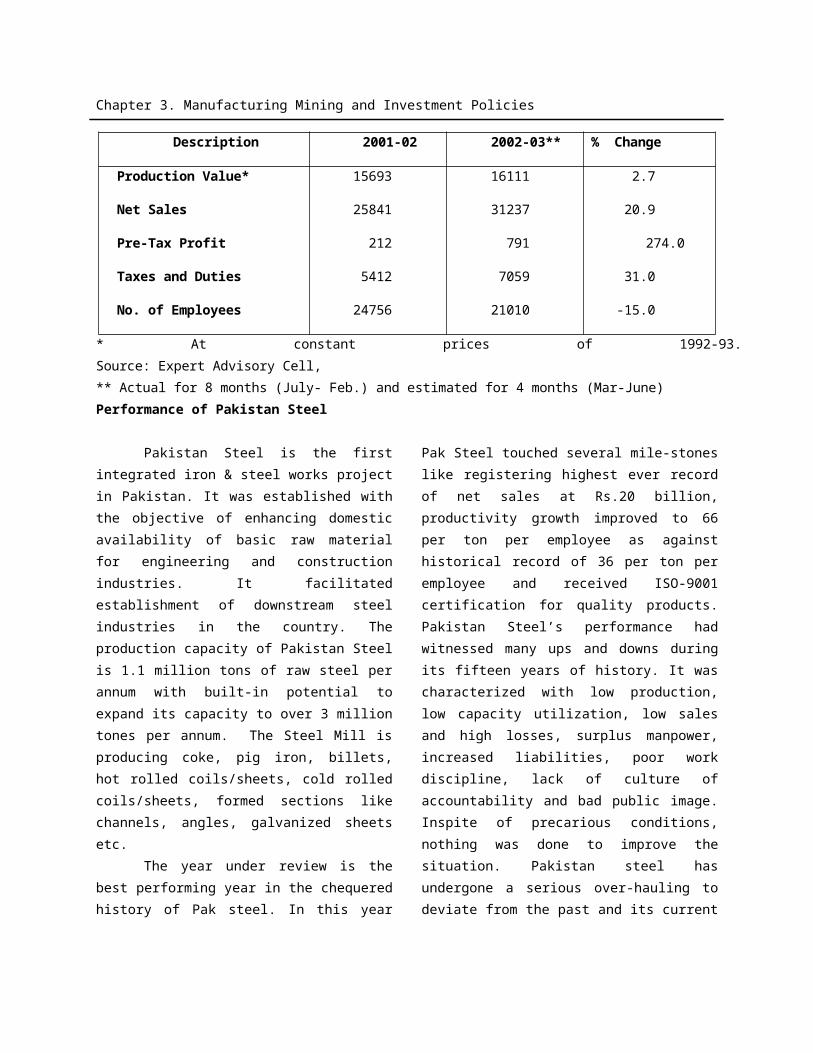
Chapter 4. Income Distribution and Poverty
percent declined from 7.0 percent to 6.2 percent, middle 60 percent from 43.6 percent to 44.1 percent. It is pertinent to note the increase for the highest 20 percent during the same era, from 47.2 percent to 49.7 percent. Consequently the income gap that declined during the 1980s, showed an increasing trend during 1996-97 to 1998-99. The Gini coefficient also projects the same trend-line. This economic disparity during late 1990s had its foundations upon weak macroeconomic management, persistence of huge fiscal and current
account deficits and consequent unsustainable debt burden, deteriorating governance and declining savings and investment, human development and social outcomes.
Further breakdown into urban and rural categories implies that poverty has an accelerating partiality in rural areas while income distribution in the urban areas improved slightly. The Gini coefficient corroborates this trend.
Table 4.3Household Income Distribution (Rural-Urban)
Year Rural Share Gini Coefficien
t
Urban Share Gini CoefficientLowest
20%Highest
20%Lowest
20%Highest 20%
1979 8.3 41.3 0.32 6.9 48.0 0.401984-85 7.9 42.8 0.34 7.0 47.7 0.381985-86 7.9 40.0 0.33 7.5 45.0 0.351986-87 8.0 39.0 0.32 7.9 44.0 0.361987-88 8.8 40.0 0.31 6.4 48.1 0.371990-91 6.0 47.4 0.41 5.7 50.5 0.391992-93 7.0 44.8 0.37 6.1 48.9 0.421993-94 7.4 43.1 0.40 6.7 47.1 0.351996-97 7.3 49.3 0.41 7.6 47.0 0.381998-99 6.9 46.8 0.40 6.0 50.0 0.33
Note: Data beyond 1998-99 are not available. Source: FBS HIES Data, Ministry of Finance
III. Determinants of Poverty
The formulation of the poverty reduction strategy has benefited from the participatory process and effective consultations with diverse range of stakeholders including federal, provincial and district governments, NGOs, and civil society. The participatory process has been further enriched by social mobilization at the grassroots level through the rural support programs spread over 49 districts, in setting priorities and improving implementation. To supplement, the Participatory Poverty Assessment has been
conducted at 54 field sites in very poor areas across all four provinces, FATA, NA and AJK. Key reasons for poverty identified were lack of education and skills, high incidence of health problems, rise in population, lack of access to justice and empowerment, inaccessibility of capital, increase in unemployment, and weak service delivery. Poverty reduction strategic framework factors in the following issues:
For growth to reduce poverty, it must emanate from sectors that have greater potential to generate employment. In this context the strategy called for rapid
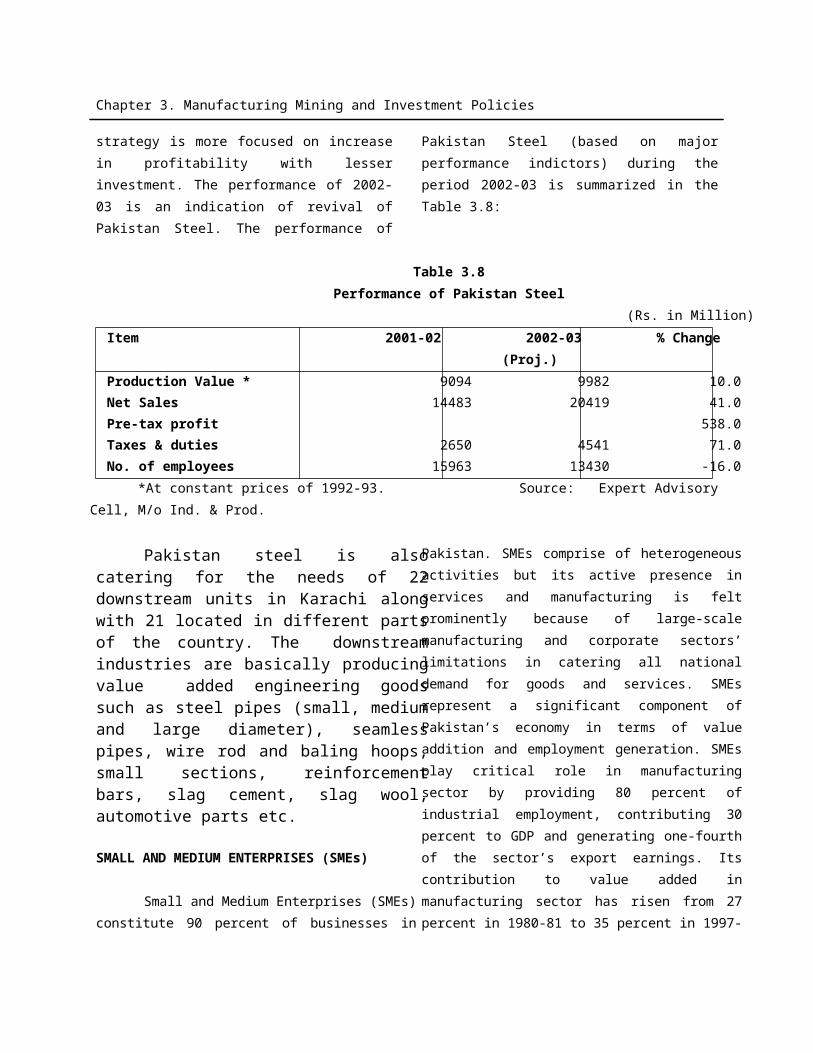
Chapter 4. Income Distribution and Poverty
growth in agriculture, small and medium industries, housing and construction, and the Information Technology sectors.
Since various forms of poverty in Pakistan were acute, these required targeted policy interventions to provide quick relief through short-term employment opportunities, social safety nets and financial assistance.
Additional income alone would not eliminate poverty unless the causes of poverty were addressed. Hence the need to improve access to basic needs such as primary education, preventive health care, population welfare services, in order to win the fight against poverty.
Improvement in public service delivery required resources and improvement in governance.
Involvement of the poor in the formulation of these policies and management of their affairs was critical in attaining the objectives of the strategy, and there was need to forge a broad-based alliance with civil society and the private sector in this regard.
The participatory process must broaden in the formulation of the full PRSP, resulting in consultations at district, provincial and national levels to elicit views, share experiences and understand expectations of the stakeholders.
There was need for a strong program of monitoring and capacity development, as well as impact assessment.
Availability of adequate resources for poverty reduction programs was important in determining the
effectiveness of the strategy. Detailed costing of proposed initiatives would be completed in the preparation of the provincial PRSPs.
IV. Poverty Reduction StrategyAmid growing recognition that the
incidence of poverty was increasing in Pakistan, the Government of Pakistan adopted a comprehensive strategy in November 2001 to reduce poverty, articulated in the Interim Poverty Reduction Strategy Paper (I-PRSP). Poverty reduction has taken center stage of Pakistan’s development policy framework recognizing that poverty alleviation is not merely a by-product of the growth process. The strategy aims to provide an integrated focus on a diverse set of factors that impact poverty, and to meet the twin challenges of reviving broad based equitable growth and reducing poverty. Building upon the poverty reduction strategy in I-PRSP and benefiting from the participatory process, the democratically elected Government of Pakistan has strengthened its efforts to attack poverty. Pakistan’s poverty reduction strategy now articulates a more comprehensive framework including policies for rural development, gender issues, employment and the environment. The rural development program is embedded in the targeted interventions pillar of the strategy. The approach also incorporates a more focused human development strategy that recognizes the central role of the provinces and local governments in achieving human development goals. The Poverty Reduction Strategy of the Government of Pakistan is now based on the following five pillars. (Detailed strategic action plans relating to each sector have been described in relevant chapters of the PRSP document).
Chapter 4. Income Distribution and Poverty
a) Accelerating economic growth and maintaining macroeconomic stability
Reform efforts geared at maintaining fiscal discipline, rule based fiscal policy, tax and tax administration reforms, financial sector reforms, trade liberalization, investment climate and privatization, augmenting regulatory framework, and building supportive infrastructure.
b) Investing in human capital
Major thrust sectors include comprehensive reforms in education including special education, health and population welfare, capacity building for service delivery through National Commission on Human Development, and involvement of private sector through public-private partnerships and NGOs.
c) Augmenting targeted interventions
These include Small & Medium Enterprises, Micro Finance, Public Works Program (Tameer-e Pakistan Program, Khushal Pakistan program, Drought Emergency Relief Fund), Rural Development including agriculture, irrigation, livestock and fisheries and rural electrification, and Housing Finance.
d) Expanding social safety nets
Primary programs are Zakat Program, Food Support Program, Employees Old Age Benefits Institution, Private Sector Pension Fund, and Indigenous Philanthropy.
e) Improving governance
Important reforms are Political and Administrative devolution, Fiscal Decentralization, Access to Justice, Civil Service Reforms, Freedom of Information Act, and Anti Corruption Strategy.
V. Trends in PRSP Expenditures
The following table gives the expenditure details on pro-poverty expenditures. Although the government has institutionalized the Medium Term Budgetary Framework (MTBF) in its fiscal and budgetary regime, adhering to the macroeconomic targets as envisaged in the MTBF, however with regards to poverty outlays, the government is committed to raising its budgetary expenditures atleast by over 0.2 percent of GDP per annum starting FY 2001-02. This reflects a significant shift from past budgetary performance when anti-poverty public expenditures declined by an average of 0.25 percent of GDP per annum, during 1995–2000. Ensuring that these expenditures rise over the medium term while fiscal adjustment also takes place is a significant challenge. The government will be spending Rs. 161 billion on pro-poor expenditures during the current fiscal year.
Table 4.4Pro-Poor budgetary Expenditures (Rs in million)
Chapter 4. Income Distribution and Poverty
SectorsFY 2000-01 FY 2001-02
July-Mar 2002-03
Roads, highways & bridges 8,332 6,340 5,043Water Supply & Sanitation 4,497 4,644 1,988Education 56,536 66,290 51,280Health 17,508 19,211 13,457Population planning 1,588 1,331 1,798Social Security & other Welfare 1,576 3,664 797Natural Calamities & Disasters 912 189 293Irrigation 8,154 10,133 8,179Land Reclamation 1,380 1,838 1,097Rural Development 11,415 12,325 9,982Food Subsidies 9,390 5,513 3,200Food Support Program 1,061 2,017 1,256TOTAL 122,349 133,495 98,370
Source: Monthly Civil Accounts
In addition to the government's anti-poverty expenditures a significant amount of public resources are aimed at providing social protection to the poorest segments of society. Through recent government initiatives such as Food Support Program (FSP), Khushal Pakistan Program (KPP), and land transfers the government has significantly increased assistance to those most in need. Social safety transfers by the government are divided into three broad categories, which include: cash transfers, in-kind transfers, and public-works programs. Government Programs in this regard are Zakat, Food Support Program (FSP), Employees' Old Age Benefits Institutions (EOBI), and micro-credit disbursements by Khushali Bank (KB), Pakistan Poverty Alleviation Fund (PPAF) and the Agricultural Development Bank of Pakistan (ADBP).
.
Table 4.5Pro-Poor Non budgetary Expenditures (Rs in million)
Sectors FY 2000-01 FY 2001-02 July-Dec 2002-03Zakat disbursements 1,829 5,169 2,731EOBI disbursements 1,261 1,366 777Micro-credit disbursements 577 1,215 1,986 TOTAL 3,667 7,750 5,494Land distributed (Acres) 153,197 53,803 2,538SOCIAL SAFETY NETS (Number of beneficiaries)Food support program 1,136,546 2,200,916 1,009,330
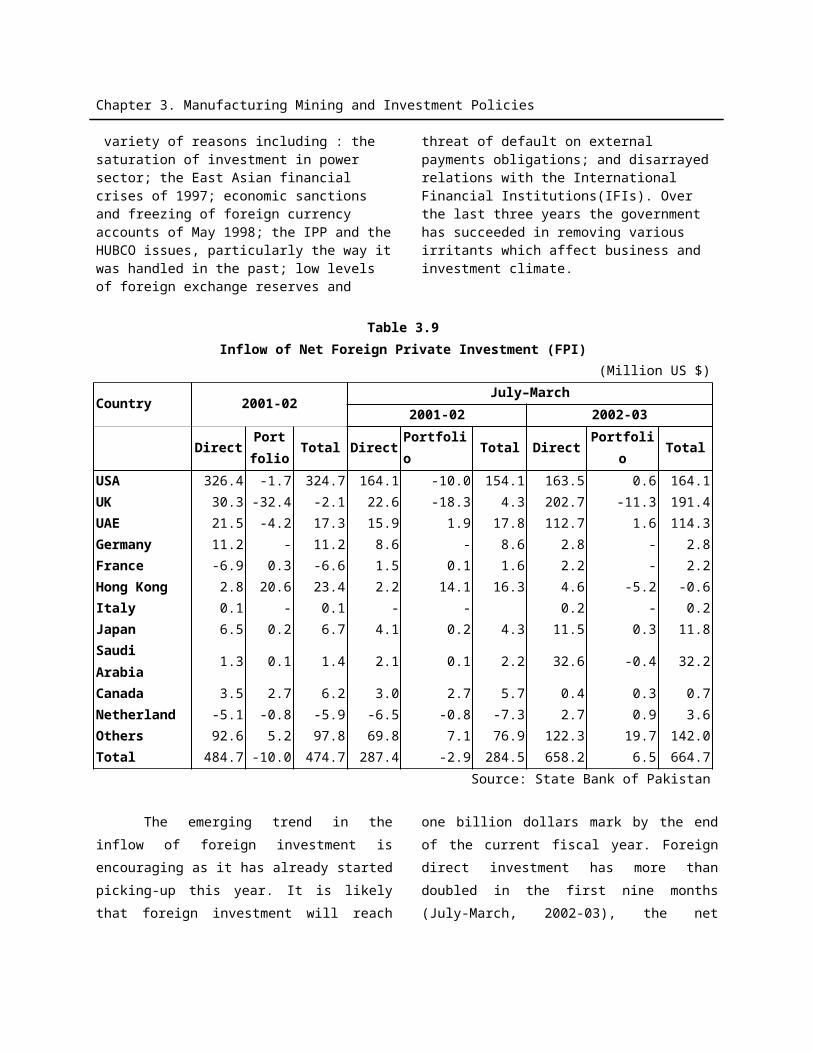
Chapter 4. Income Distribution and Poverty
Zakat 930,223 1,700,189 617,000EOBI 100,384 103,231 132,000Micro-credit 48,252 148,728 225,000Temporary employment (KPP) 400,916 270,333 318,089State land recipients 14,419 3,144 310 Total No. of beneficiaries 2,606,445 4,365,657 1,010,932
Table 4.6Pro-Poor budgetary Expenditures (Past Trends)
Sectors FY 1996-97 FY 1997-98 FY 1998-99 FY 1999-00
Roads, highways & bridges 4,644 5,174 6,043 5,134Water Supply & Sanitation 4,953 6,100 5,294 5,553Education 42,604 49,084 49,406 54,002Health 13,434 14,731 15,547 17,342Population planning 1,858 1,974 2,593 3,439Social Security & other Welfare 2,434 1,947 2,022 2,069Natural Calamities & Disasters 222 214 1,074 1,243Irrigation 9,847 9,722 9,147 8,274Land Reclamation 419 541 815 939Rural Development 3,091 3,552 4,852 6,513Food Subsidies 10,101 7,339 7,097 9,850Food Support Program 0 0 0 0
TOTAL 93,607100,378
103,890114,35
8
Table 4.7
PRSP Non-Budgetary Expenditures (2002-2006)PRSP
EXPENDI-TURES
BASELINE(Actuals)
PROJECTIONS(Based upon FY 2001-02 actual expenditures)
FY 2001-02 FY 2002-03 FY 2003-04 FY 2004-05 FY 2005-06Rs. Mill % GDP Rs. Mill % GDP Rs. Mill % GDP Rs. Mill % GDP Rs. Mill % GDP
Zakat System 5,169 0.13 9,545 0.23 9,650 0.21 9,258 0.19 5,401 0.10Social Security (EOBI)
1,366 0.03 1,489 0.03 1,608 0.03 1,753 0.03 1,894 0.03
Micro credit 1,588 0.04 3,354 0.08 5,823 0.13 9,288 0.19 13,858 0.26TOTAL 8123 0.21 14,389 0.22 17,081 0.42 20,299 0.48 21,153 0.40SOURCE: Zakat: Ministry of Religious Affairs; Social Security: Employees Old Age Benefit
Institution; Housing Finance: State Bank of Pakistan; Micro credit: Khushali Bank, PPAF, ZTBL
The following table presents the recommended allocations for 2006-07 with the base year allocations being for 2000-01,
increasing pro-poor budgetary expenditures at the rate of 0.2 percent of GDP per annum.
Table 4.8Future projections for Pro-Poor Budgetary Expenditures
PRSPEXPENDITU
RES
BASELINE(Actuals)
PROJECTIONS(Based upon FY 2001-02 actual expenditures)
FY 2001-02 FY 2002-03 FY 2003-04 FY 2004-05 FY 2005-06
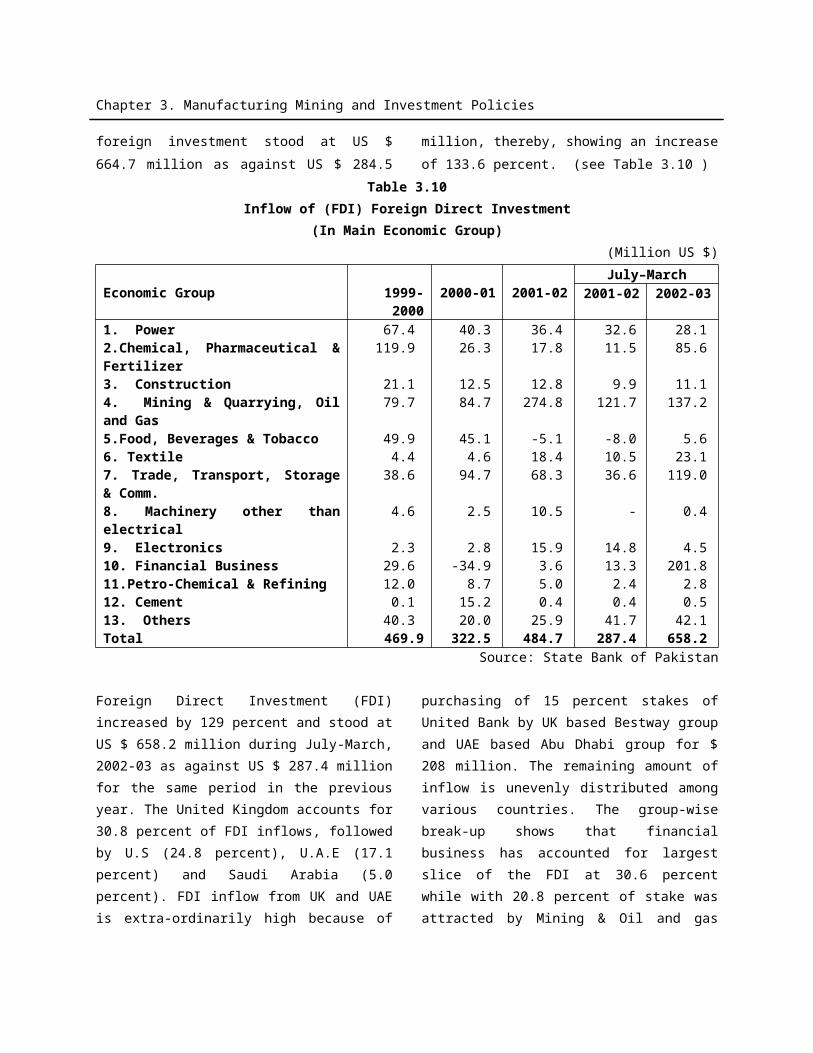
Chapter 4. Income Distribution and Poverty
Rs. in Millio
ns
% GDP
Rs. in Millio
ns
% GDP
Rs. in Million
s
% GDP
Rs. in Millio
ns
% GDP
Rs. in Million
s
% GDP
Development
36,836
0.99 44,573
1.10 53,366 1.20 60,621
1.25 68,965 1.29
Current 96,659
2.59 116,957
2.88 134,267
3.02 154,407
3.18 177,568 3.33
TOTAL 133,495
3.58 161,529
3.98 187,633
4.23 215,028
4.42 246,533 4.62
MARKET ACCESS AND COMMUNITY SERVICESRoads, Highways & Bridges
6,340 0.17 7,671 0.19 8,807 0.20 10,128 0.21 11,647 0.22
Water Supply and Sanitation
4,644 0.12 5,619 0.14 6,451 0.15 7,419 0.15 8,531 0.16
HUMAN DEVELOPMENT INPUTSEducation 66,29
01.78 80,21
11.97 92,082 2.07 105,89
42.18 121,77
92.28
Health 19,211
0.52 23,245
0.57 26,686 0.60 30,688 0.63 35,292 0.66
Population Planning
1,331 0.04 1,611 0.04 1,849 0.04 2,126 0.04 2,445 0.05
Social Security and Welfare
3,664 0.10 4,433 0.11 5,090 0.11 5,853 0.12 6,731 0.13
Natural Calamities & other Disasters
189 0.01 229 0.01 263 0.01 302 0.01 347 0.01
RURAL DEVELOPMENT EXPENDITURESIrrigation 10,133 0.27 12,26
10.30 14,076 0.32 16,187 0.33 18,615 0.35
Land Reclamation
1,838 0.05 2,224 0.05 2,553 0.06 2,936 0.06 3,377 0.06
Rural Development
12,325 0.33 14,913
0.37 17,120 0.39 19,688 0.40 22,642 0.42
Food Subsidies
5,513 0.15 6,671 0.16 7,658 0.17 8,807 0.18 10,128 0.19
Food Support Program
2,017 0.05 2,441 0.06 5,000 0.11 5,000 0.10 5,000 0.09
TOTAL 133,495
3.58 161,529
3.98 187,633
4.23 215,028
4.42 246,533
4.62
Source: Ministry of Finance
VII. Monitoring and Evaluation Mechanisms
Well targeted anti-poverty outlays
and social transfers are essential
ingredients of a comprehensive poverty
reduction strategy. The real test of public
expenditures lies in their impact. One of the
central components of the PRSP is creation
of a system to monitor the implementation
and outcome of poverty reduction policies.
The PRSP monitoring framework includes a
set of indicators that track policy inputs,
their outputs and progress towards
intended policy outcomes. PRSP input
process (pro-poor expenditures) have been
clearly articulated and a system to monitor
these expenditures on a quarterly basis is in
Chapter 4. Income Distribution and Poverty
place. To monitor outcome and impact in
human development, the government has
established in conjunction with the
provinces and line Ministries, a
comprehensive set of intermediate and
impact indicators that can be tracked on a
short/medium term and long term basis,
linking public expenditures with results on
the ground been developed with
participation of provincial governments.
These expenditures are in line with the
government’s macroeconomic framework
and have been protected and tracked over
the medium term. Key measures taken to
strengthen the monitoring and evaluation
system include institutional monitoring
through Education Management Information
System & Health Management Information
System, annual Core Welfare Indicators
Questionnaire survey for third party
validation of 13 intermediate indicators in
social sectors & to monitor improvement in
service delivery, Pakistan Integrated
Household Survey every 3rd Year to
monitor outcomes, establishment of PRSP
secretariats in Provinces, and formation of
National Steering Committee for review and
policy adjustment.
Regular information on intermediate indicators is a valuable guide for evaluating the efficiency of public policies and the use of public funds. Nevertheless, information/ data sources for intermediate indicators in Pakistan are not readily available and reporting systems are not tuned for quick reporting in some cases. However, as part of the government’s anti-poverty efforts, information systems are being developed/strengthened to track intermediate indicators, their measurement methodologies, definitions, and sources for timely and accurate review of policy interventions through a comprehensive consultative process as detailed above. This process is being pushed further as the baseline information/ data on education and health sector intermediate indicators has been
finalized. Core Welfare Indicators questionnaire (CWIQ) survey will be conducted for the first time to capture data at the district level for intermediate indicators in social sectors to determine baselines and it will then be updated on annual basis.
While the monitoring framework can help identify efficiency of the policies, additional work will be needed to understand why policies could not yield the desired output. Making these judgements will typically necessitate more in-depth studies, focused on specific questions and using a different approach (such as detailed analysis at district level particularly when primary health care is now the responsibility of the district governments).
VIII. Risks and Challenges in implementation
It needs to be appreciated that effective implementation of Pakistan’s Poverty Reduction Strategy comes with some risks and challenges. Firstly, the efficacy of reform agenda will require pro-active collaboration among many ministries and agencies in the context of avowed continuation of reform program and policies by the elected governments. Monitoring the performance will be a major undertaking since there are gaps in information available. Developing a reliable and comprehensive database for monitoring and evaluation of PRSP process is a multi year undertaking. Secondly, since the PRSP approach is an innovative initiative in the provincial governments, and the provincial monitoring units are at a nascent stage having capacity constraints, therefore capacity building will need to be addressed quickly. Thirdly, the implementation of programs under the decentralized and autonomous system of district governments may be made consistent with the agreed set of
Chapter 4. Income Distribution and Poverty
preferences of the district government vis-à-vis the provincial and federal priorities. A mechanism should be in place to address any such divergence. Fourth concern is the continued support of Pakistan’s international development partners in development process in Pakistan as waning interest could jeopardize the significant progress made over the last three and a half years. The success of poverty reduction strategy will critically depend on its effective implementation, constant evaluation of its impact and regular feedback to policy makers for appropriate adjustment in the policy and institutional regime.
__________________
5. Fiscal DevelopmentIntroduction
Sound fiscal policy fosters macroeconomic
stability, which in turn, is the cornerstone of any
successful efforts to increase private sector
development and economic growth. Economic
growth on the other hand, is the single most
important factor influencing poverty. Sound fiscal
policy should therefore be regarded as a key
component of any poverty reduction strategy.
Like many other developing
countries, fiscal profligacy has been the
main underlying cause of macroeconomic
instability in Pakistan during the 1990s,
which, in turn, has impeded the medium-to-
long run economic growth prospects.
Persistence of large fiscal deficit (on
average, 7% of GDP) resulted in sharp
accumulation of public debt—rising form Rs
928 billion in 1990-91 to Rs 3231 billion in
1999-2000. As percentage of GDP, public
debt increased from 91.3 percent to 103.0
percent during the same period. As
percentage of total revenue, public debt
rose from 541 percent to 630.4 percent.
The debt servicing liability continued to rise
as a result of unsustainable rise in public
debt. In 1990-91, almost 38 percent of total
revenues were consumed to finance debt
servicing and by 1999-2000 it reached
almost 64 percent, leaving only 36 percent
revenues to be spent on development
program in general and social sector in
particular; defense, civil administration, etc.
It was a difficult task to finance
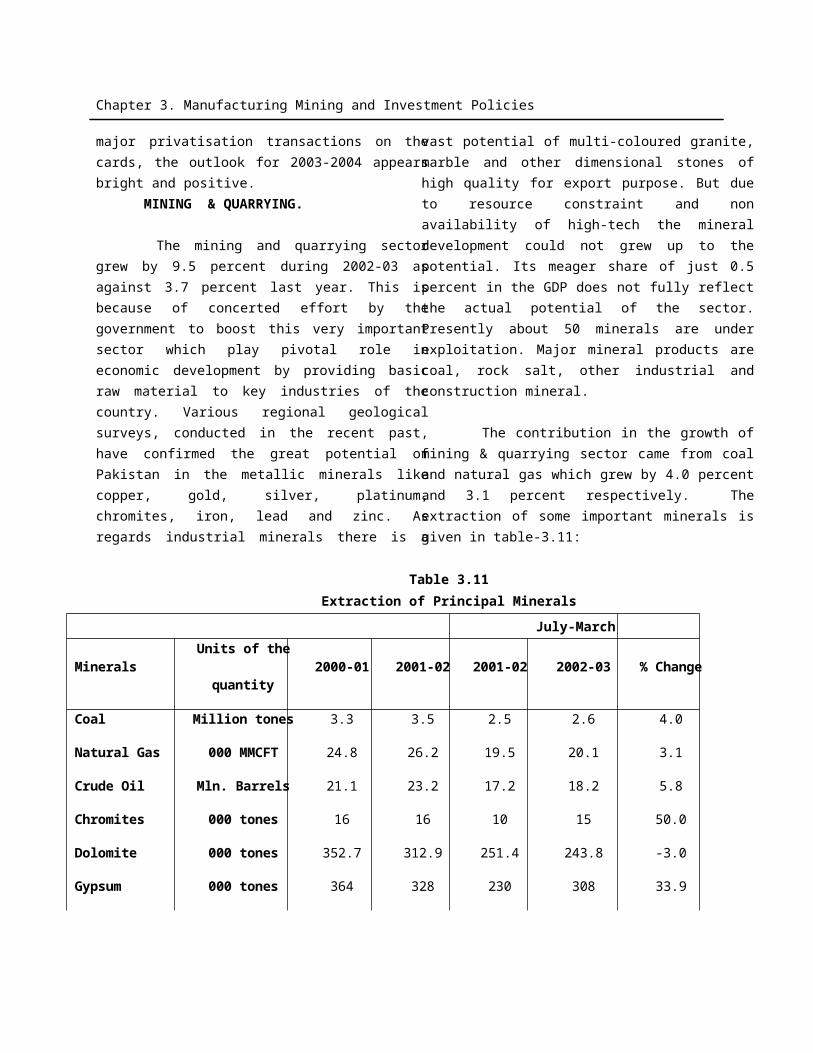
Chapter 4. Income Distribution and Poverty
developmental activities of the Government
with such a meager resources.
No wonder, the development budget
continued to shrink from 6.5 percent of GDP
to 3.0 percent during the same period. Both
physical and human capital deteriorated
sharply over the years, due mainly on
account of declining public sector
investment. Private sector investment also
declined for two reasons. Firstly, as a result
of persistently large fiscal deficits and the
associated rising stock of public debt,
interest rates remained high during the
1990s and crowded out private sector
investment. Being complementary in nature,
a decline in public sector investment caused
private sector investment to decline as well.
Consequently, the overall investment rate
decelerated during the 1990s and ultimately
reduced economic growth relative to
potential. When a country sustains such a
large fiscal deficit for such a long period of
time, it is bound to face serious debt problem
and associated decline in investment and
growth, and consequent rise in poverty. This
underlines the importance of a credible fiscal
policy for achieving higher investment and
growth.
Various attempts were made in the past to
achieve fiscal consolidation. Despite imposition of
new taxes, additional tax measures, and curtailment
of non-essential expenditures, these efforts did not
achieve fiscal consolidation, as Pakistan continued
to sustain large fiscal deficit (on average, 7.0 % of
GDP). Although fiscal consolidation could not be
achieved, structure of taxes did improve over the
years (More on this issue later). Why past attempts
could not achieve desired results? The answer lies
with Pakistan's tax structure.
Like in most developing countries
Pakistan's tax structure has suffered from several
weaknesses. These are:
Complex: difficult to administer and comply with.
Inelastic: unresponsive to growth and discretionary policy measures. In other words, elasticity of taxes was in general, less than unity.
Inefficient: raises little revenue but introduce
serious economic distortions.
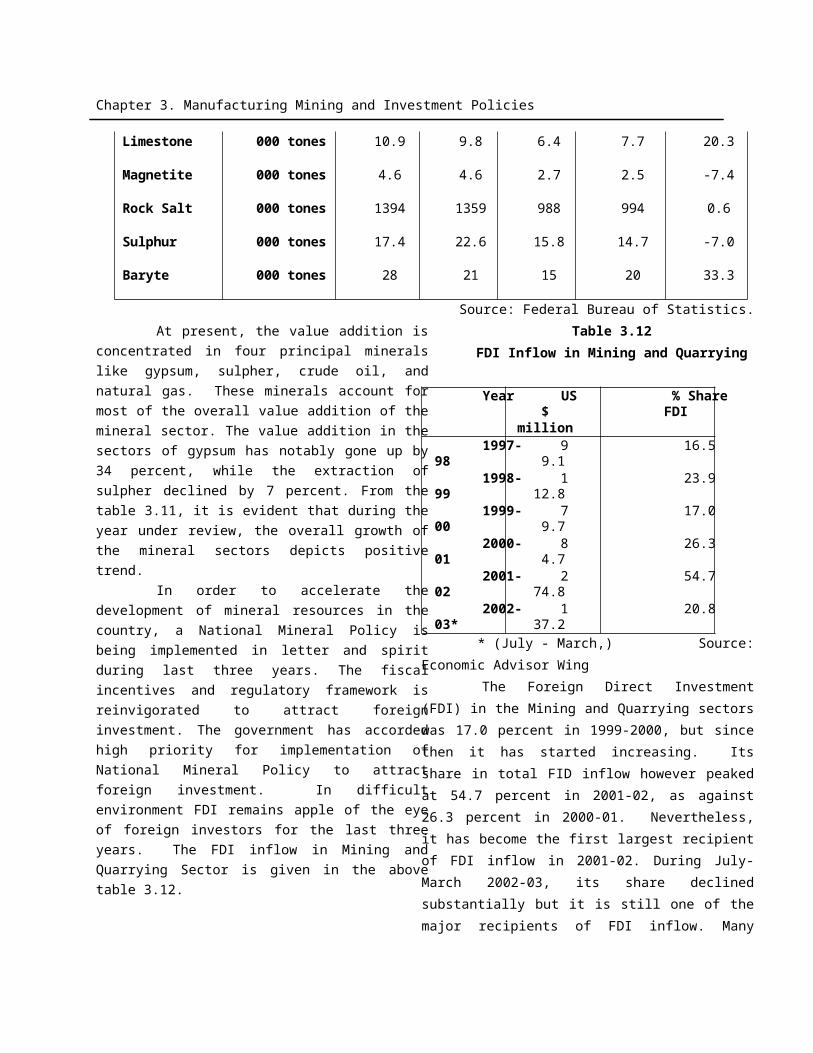
Chapter 4. Income Distribution and Poverty
Inequitable: treat individuals and business in similar circumstances differently.
Unfair: Tax administration and enforcement are selective and skewed in favour of those with the ability to defeat the system.
The combined effects of these weaknesses resulted in low and stagnant tax-to-GDP ratio on the one hand and low tax elasticity and buoyancy on the other. The low and stagnant tax- to-GDP ratio compelled successive governments to generate resources through surcharges and non-tax revenues [see table 5.1].
Table 5.1
Fiscal Indicators as Percent of GDP (MP)
Year
Overall
Fiscal Deficit
Expenditure Revenue
GDP Real
Growth
Total
CurrentDevelop-
ment* Total Rev.
TaxNon-Tax
1990-911991-921992-931993-941994-951995-961996-971997-981998-991999-00**2000-01**
5.47.62.14.45.16.61.73.54.23.92.23.45.1
8.87.58.15.95.66.56.47.76.16.65.2
25.726.726.223.422.924.422.323.722.022.521.0
19.319.120.518.818.520.018.819.818.620.318.9
6.47.65.74.64.44.43.53.93.43.22.1
16.919.218.117.517.317.915.816.015.916.316.2
12.713.713.413.413.814.413.413.213.212.912.9
4.25.54.74.13.53.52.42.82.73.43.3
2001-02**2002-03 (BE)
5.24.6
22.822.2
19.318.1
3.54.1
17.217.6
13.213.8
4.03.8
* Public Sector Development Program plus surplus/ Source: Finance Division, (Budget Wing) deficit of autonomous bodies.B.E: Budget Estimates.** Fiscal deficit figure for these years is after adjustment of statistical discrepancy.

Chapter 4. Income Distribution and Poverty
On the expenditure side, it is a fact that over the years the structure of current expenditure has become inflexible. Large resources were pre-empted by expenditure of essential and obligatory character, such as debt servicing. Almost 64 percent of total revenues were devoted to debt servicing alone, leaving little room for economizing expenditure. Although, the total expenditure-to-GDP ratio exhibited a declining trend in the 1990s, this decline has occurred primarily at the cost of development expenditure. Decline in development spending has not only caused deterioration in human and physical infrastructure but has also constrained the future growth potential of the country.
Persistently large fiscal imbalances therefore raised two major concerns. First, the rising trend in the interest burden on public debt threatened the sustainability of the macroeconomic stance. Second, servicing the country's public debt puts large claims on government resources, which
reduced the Government's capacity to spend on key development activities. In addition, it also created a need for higher taxation which undermined efficiency.
FISCAL REFORM
Realizing the weaknesses of Pakistan’s tax structure a concerted effort was launched some three and a half years ago. The government began to launch a wide-ranging tax and tariff reform on the one hand and fiscal transparency on the other, with a view to reducing tax rates, broadening the tax bases to hitherto untaxed or under taxed sectors, and shifting the incidence of taxes from imports and investment to consumption and incomes. The reduction in tax rates was intended to stimulate investment
Chapter 4. Income Distribution and Poverty
and production on the one hand and promote voluntary tax compliance on the other. Broadening of tax bases was intended to ensure fair distribution of tax burden among various sectors of
the economy. Without going into the details as well as to conserve space, all these reforms are documented in Box-I.
Chapter 4. Income Distribution and Poverty
Box-IFISCAL REFORMS INTRODUCED DURING LAST THREE YEARS
TAX REFORMS
All tax whitener schemes eliminated.
Tax survey and documentation exercise undertaken.
This exercise added 234,189 new income tax payers and 34000 sales tax payers to the tax base.
Wealth tax abolished.
To give an end to multiplicity of taxes, number of taxes at the federal and provincial level has reduced.
Grass roots reforms in tax administration started.
A two-tier agricultural income tax introduced.
GST broadened and streamlined.
In order to ensure expeditious Sales Tax refund payments, while ensuring no inadmissible payments, the
Sales Tax Automated Refund Repository (STARR) has been set up. This will help in development of
paper less (Electronic) receipt, processing and sanction of refund claims.
To create taxpayer friendly environment a new income tax ordinance on universal self assessment basis
with system selected audits, minimal exemptions, and more equitable rates have been introduced.
For effective dispute resolution mechanism, tax ombudsman’s office established.
Developing an automated assessment and valuation system
Large taxpayer unit has been established in Karachi
Medium taxpayer unit established in Lahore
A model medium taxpayer unit has started working in Lahore to test the re-engineered income tax system
TARIFF REFORMS
Public announcement of tariff rationalization, spread over 2001-03:
Maximum tariff brought down to 25 percent in 2002-03 from 92 percent a decade ago.
Number of tariff slabs reduced from 13 to 4 in the same period.
Minimizing the use of excise duties in tariffs.
Promulgation of anti-dumping law consistent with WTO.
Import liberalization measures adopted for agricultural and petroleum products.
Restrictions on agriculture exports removed.
A Pilot Customs Administration Reform Project would be established by November 2003.
FISCAL TRANSPARENCY
The government is already on road to Accountable Fiscal Management Framework (AFMF) that specifies
assurances of accountability and transparency of fiscal management.
Fiscal responsibility law is expected to be put before the parliament by end-June 2003.
Separation of audit and accounts: legislative measures adopted.
Formation of ad-hoc public accounts committees at federal and provincial level.
Establishment of “new system of financial controls and budgeting.”
Publication of fiscal reports verified by the AGPR.
Fiscal reform unit established. Greater public access to fiscal data has been ensured through publication of
quarterly fiscal reports.
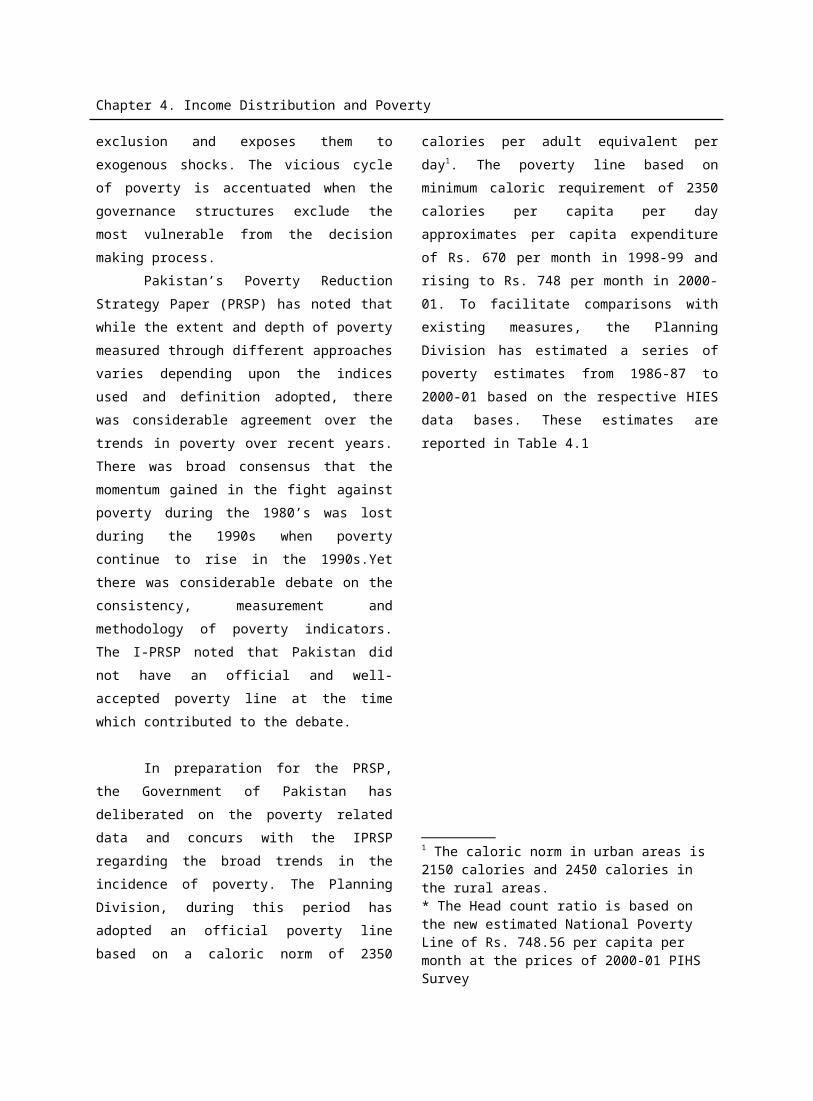
Chapter 4. Income Distribution and Poverty
TAX ADMINISTRATION REFORM
Tax administration plays a vital role in the success or failure of any attempt to reform taxation. Corruption and tax evasion are widespread, especially in developing countries. Tax collection system designed to eradicate corruption and evasion has mostly failed, indicating that these problems are structural in nature. The main reason for this failure is that most tax administrations systems have been influenced by the structure of tax systems in developing countries. In fact, tax structure and tax administration are interdependent and should be considered as such.
Tax administration plays a crucial role in determining the real (or effective) tax system, as opposed to the statutory tax system. Indeed, there is a growing conviction among tax policy specialists in developing countries that policy change without administrative change is nothing, and that, it is critical to ensure that changes in tax policy are compatible with administrative capacity. It is therefore, generally argued that tax administration is tax policy in developing countries.
There are many lessons that can be learnt from other countries’ experiences where they have tried to improve tax administration. First, an essential pre-condition for the reform of the tax administration is the simplification of the tax system to ensure that it can be applied effectively in the generally low compliance contexts of developing countries. Second, there is a need for a strategy for the successful reforms of the tax administration. Strategy in this context simply means a comprehensive plan that assigns clear priorities to the tasks that must be performed, tailored to the available
resources. Third ingredient for successful reform of tax administration is a strong commitment to reform at both policy-making and managerial levels, as well as a certain degree of technical competence. The best reform strategy applied to the most simplified system will fail if there is a lack of political will to implement it. While some crucial initial technical support can sometimes be obtained from foreign experts, a critical core of local expertise is needed to take full advantage of such assistance. Even more important is the presence of a managerial team fully committed to taking the steps necessary to improve the quality of tax administration, with full political support of the highest authorities.
Successful tax administration reforms must have these three main ingredients, that is, simplification, strategy, and commitment. There is, however, no single set of prescriptions—no secret recipe—that once introduced, will ensure improved tax administration in any country. Developing countries exhibit a wide variety of tax compliance levels, reflecting not only the effectiveness of their tax administrations but also taxpayers attitude towards taxation and towards government in general. It should be emphasized that gimmicks or quick fixes are not of much use in resolving tax administration problems. It is time consuming and requires patience.
The goal of tax administration is to foster voluntary tax compliance. Tax compliance will increase if there is an effective tax administration. Taxpayers will comply better if they believe that failure to pay due taxes entails substantial risk of being penalized in a relatively severe fashion. In a country where the degree of compliance is low, the ability of the tax administration to impose effective penalties
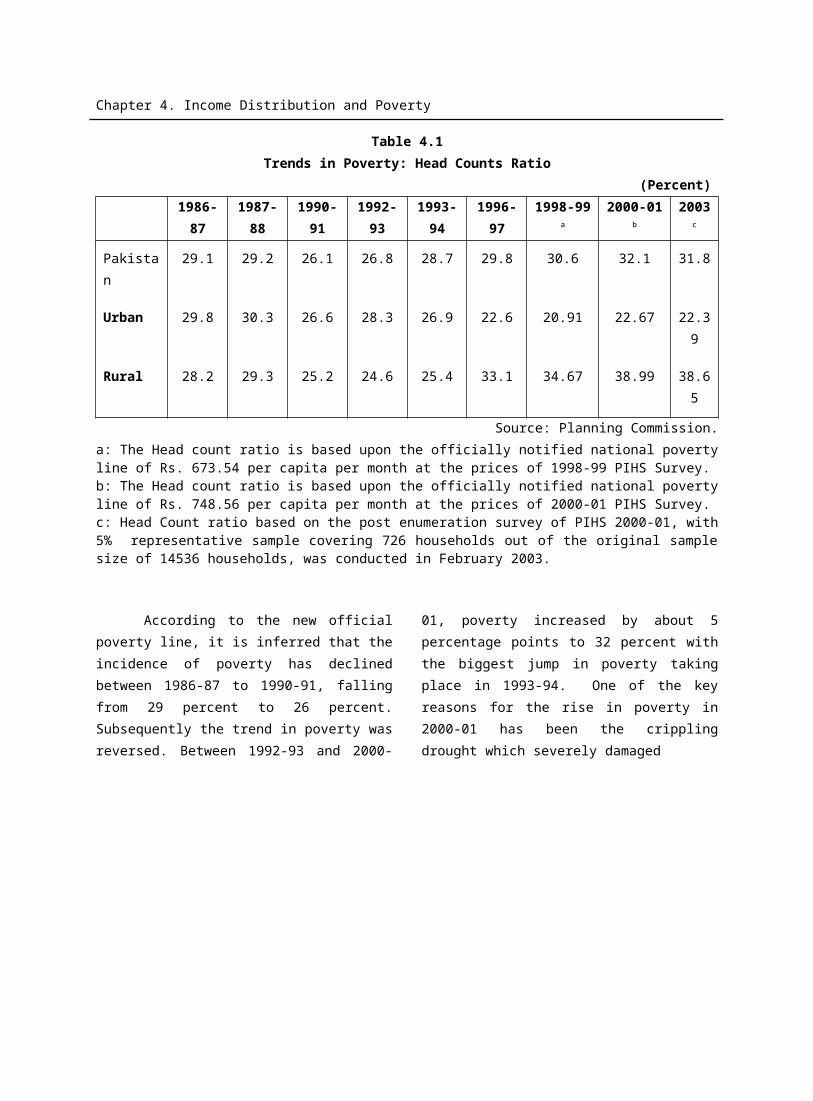
Chapter 4. Income Distribution and Poverty
is perhaps the best way to shape the behaviour of taxpayers. The crucial test of an effective tax administration is that how effectively it deals with unregistered, stop filing, tax evaders, and delinquent taxpayers. If tax compliance is to improve, the tax administration must have effective action to deal with these shortfalls.
Fully cognizant of the fact that the success of tax reform would depend on the effectiveness/efficiency of tax administration, the Government of Pakistan approved a medium-term program for reforming tax administration in November 2001. Since then, major efforts have been made to improve tax administration. Some of the milestones already achieved under tax administration reform are summarized below:
i) Re-organization of CBR Headquarters on functional lines CBR was administrated on cylindrical basis in the past where policy and operational functions were performed by the same Member. Five new Members from private sector have been recruited to look after the specialized skills like taxpayer education, audit, information technology, fiscal policy, and human resource management.
ii) Establishment of Large Taxpayer Unit
Large Taxpayer Unit (LTU) has been established from July 1, 2002 at Karachi, encompassing all the three domestic taxes i.e. sales tax, central excise duty, and income tax. The unit has 300 Karachi based large taxpayers and covers 50% of the revenue of the country's largest city. Its performance has so far been impressive and has encouraged the government to set up another LTU in Lahore in February 2004.
iii) Medium Taxpayer UnitA model Medium Taxpayers Unit (MTU) has started working in Lahore w.e.f. October, 1, 2002 to facilitate taxpayers. Five such MTU will be set up in Karachi, Rawalpindi Peshawar, Quetta and Islamabad by July 2004.
iv) Universal Self Assessment SystemUniversal Self-Assessment System (USAS) is the corner stone of the reform strategy of CBR. While sales tax is already on self assessment basis, income tax has also been brought under the USAS through the Income Tax Ordinance 2001. The government is currently examining the process to bring custom collection also under self assessment coupled with audit based on risk assessment for various classes of taxpayers.
v) Customs Administration Reform (CARE)The existing cumbersome manual system is highly personalized, involving 34 verifications and 62 steps. There is a face to face contact between taxpayer and tax collector and the taxpayer have to bear extra cost on account of inefficiency of the system. CBR has developed a Custom Administration Reform Plan (CARE) and has decided to start a pilot project to test the new approach for imports and exports. The Karachi International Container Terminal (KICT) which clears 25% of imports through Karachi sea port has been selected as the pilot site.
vi) Sales Tax Automated Refund Repository (STARR) ProjectThe reengineering and automation of sales tax refund system has been identified as essential component of the reform of sales tax. The software has been developed and central data
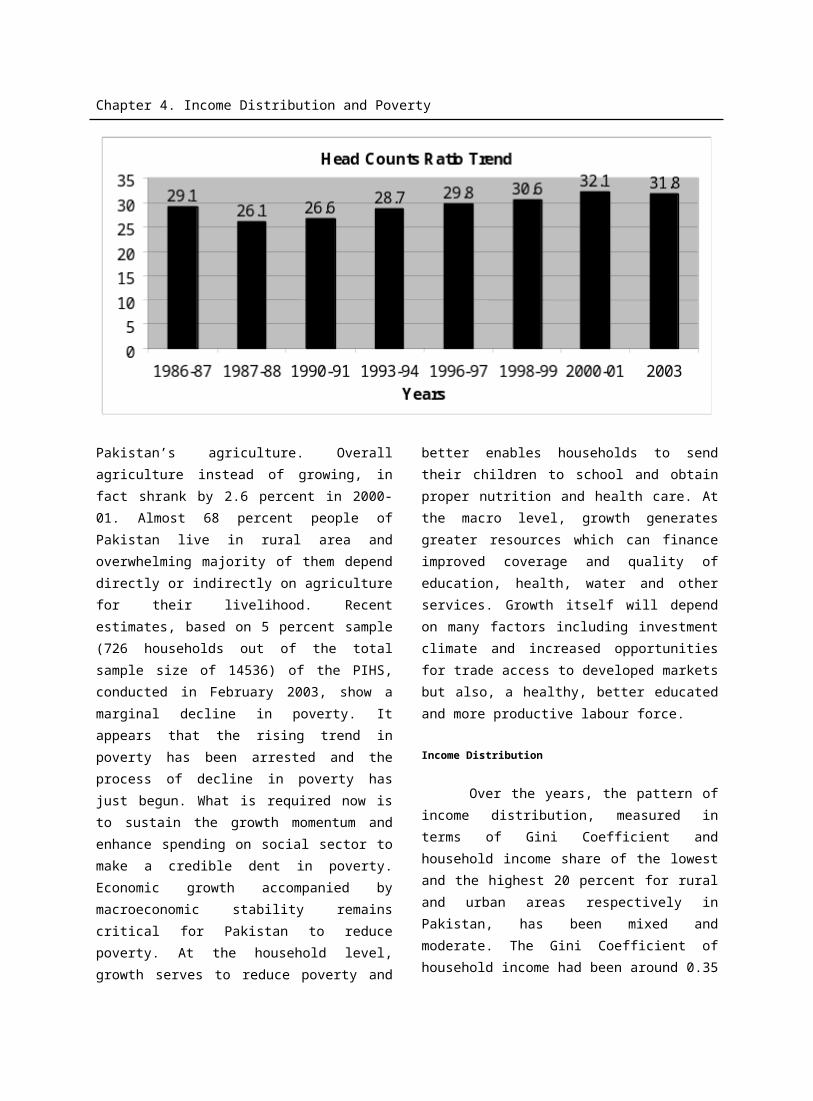
Chapter 4. Income Distribution and Poverty
base office has been established. The implementation of the first phase has been completed and the system is being evaluated and reviewed for the development and implementation of the second phase of the project. The second phase will be implemented by July, 2003 and on its completion the sales tax refund system will be transformed into a simpler, fully automated, risk based system, enabling quick refund and identifying high risk cases for scrutiny and audit.
vii) Taxpayers Facilitation CentersWith a view to promote voluntary compliance in a self assessment system of tax administration, taxpayer education and facilitation has been given a priority. All the laws, rules, circulars have been placed on website. Taxpayer facilitation centers are being established. By July 2004, 5 to 7 taxpayers’ facilitation centers at the various stations of the country will be established.
viii) Income Tax Organization StructureThe existing structure of income tax, which is circle based where all administrative, judicial, legal and enforcement powers are exercised by one person is being replaced by a functional system. A new income tax organizational structure containing functions of taxpayer service, information processing, audit, enforcement, collection, legal, information technology, HRM and internal control has been developed and is being presently tested at MTU in Lahore. A home grown automated reengineered Tax Management System has also been developed which will drastically reduce the locations as well the personnel in the income tax organization.
The strategy revolves around information technology based processes. The implementation of IT software and hardware, and efficient use of technology is aimed at achieving the objective of minimum taxpayer interface and to allow the tax administration to be taxpayer friendly while reducing compliance costs. The reform of tax administration is not only focusing on a change in skills but major efforts are underway to transform the organizational culture. Significant improvements in human resource management function are in hand. These include (i) HR audit, (ii) Implementing new and effective decision making processes, (iii) Competency /Skill enhancing training programs, (iv) Improved compensation package, and (v) Redundancy planning and sequencing.
OUTCOMES OF REFORMS
The wide-ranging tax and tariff reform as well as reform in tax administration have started paying dividends. Tax collection by the Central Board of Revenue (CBR) has picked up, overall budget deficit as percentage of GDP has declined, revenue deficit has been narrowed, and primary surplus has increased. Consequently, public debt, both in absolute term as well as in percentage of GDP has declined. Pakistan is now moving towards fiscal consolidation but much more efforts will be needed to achieve consolidation on a sustained basis
During the last four years, the CBR has collected Rs. 152 billion more revenue or tax collection has increased by 49.3 percent. The overall fiscal deficit which averaged almost 7.0 percent of GDP during the 1990s, has been reduced to 4.6 percent in 2002-03. Revenue deficit (the difference between total
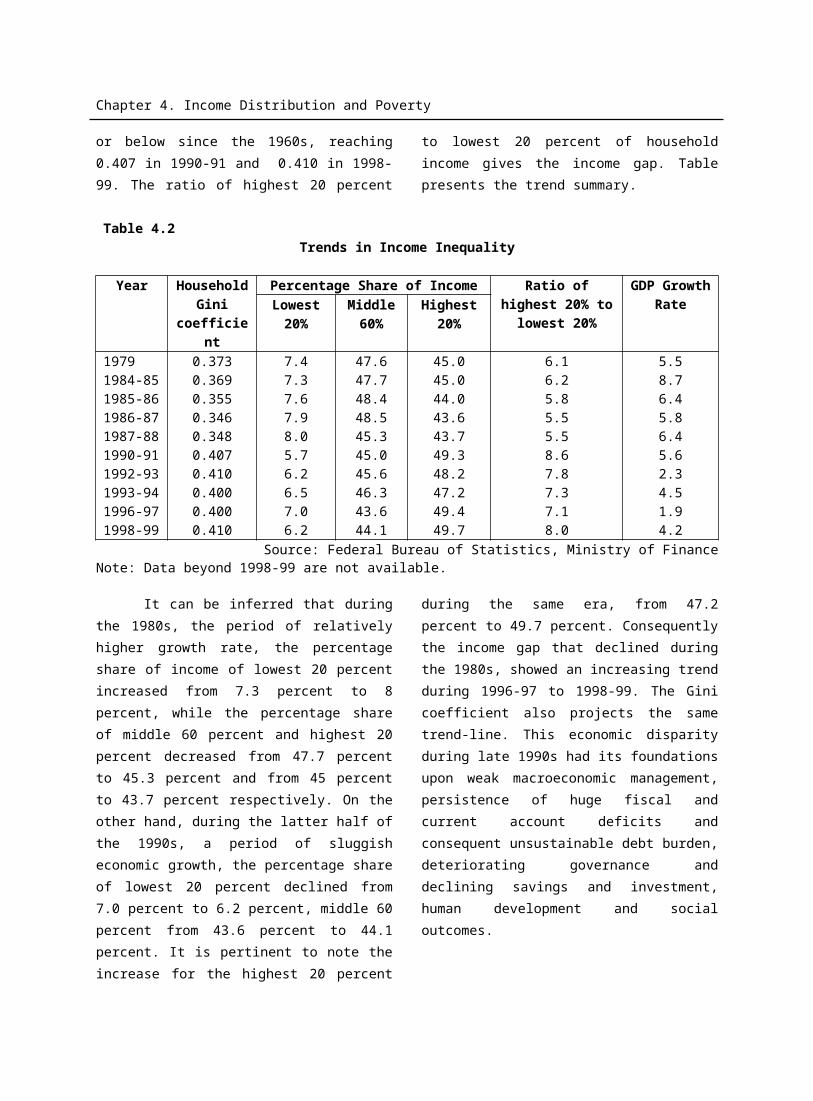
Chapter 4. Income Distribution and Poverty
revenue and total current expenditure), a measure of government dis-saving, has been narrowed from 3.0 percent of GDP to 1.0 percent. Improvement in revenue deficit would increase national savings which, in turn, would reduce the country's dependence on foreign savings to finance domestic investment. Primary balance (total revenue minus non-interest total expenditure) remained in surplus to the extent of 1.5 percent of GDP.
Revenue efforts should be assessed in terms of the objective of improving the underlying structure of the tax system, to place the public finances on a permanently sound basis. An improved tax structure would reduce the dead weight loss associated with raising a given amount of revenue. Reduction in relative share of trade taxes and increases in the relative shares of taxes on income and consumption could be taken as evidence of an improvement in the tax system.
Notwithstanding improvements in various fiscal indicators, Pakistan has also witnessed significant changes in its tax structure. As a result of reforms, the structure of taxes has undergone
considerable changes since the beginning of the 1990s. Firstly, the share of direct taxes in total taxes (collected by the CBR) increased from 18 percent to 32 percent—almost doubled in 13 years (See table 5.2). Accordingly, the share of indirect taxes declined from 82 percent to 68 percent during the same period. Even within the indirect taxes, dramatic changes have taken place. Collection from custom duty used to account 45 percent of total tax collection and 55 percent of indirect taxes in 1990-91. Its share has now been reduced to 13 percent and 19 percent, respectively. This is the result of the tariff reform implemented by the successive governments since 1990-91. The share of sales tax on the other hand increased dramatically from 14.4 percent to 45 percent in total taxes and from 17.6 percent to 66 percent in indirect taxes during the same period. Central excise as a tax is loosing its importance and gradually being faded out. Its shares in total taxes and indirect taxes were 22.5 percent and 27.5 percent, respectively in 1990-91. These have now been reduced to 10.3 percent and 15.2 percent, respectively during the same period (See Table 5.2).
Table 5.2Structure of Federal Tax Revenue
(Rs. Billion)
YearTax Revenue Break-up of Indirect Taxes
Total(CBR)
As % of GDP
Direct Taxes
Indirect Taxes
Custom Sales Central Excise
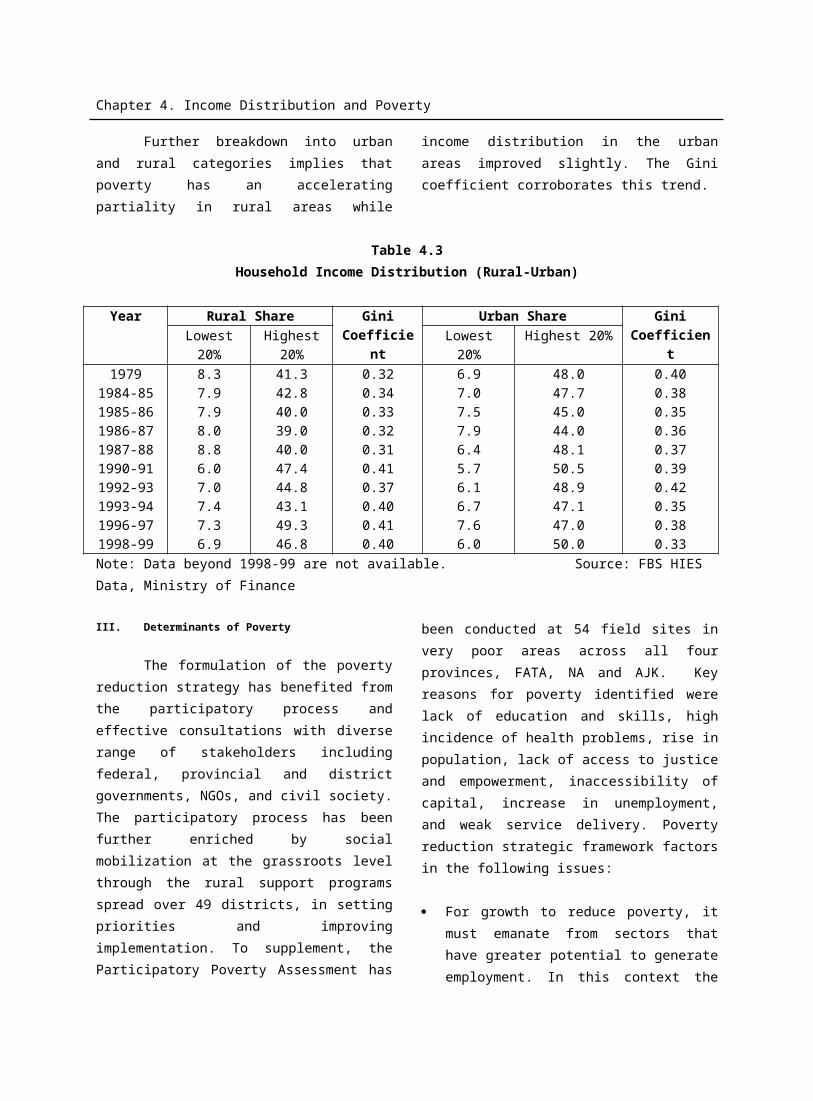
Fig-2: Federal Tax Collection (1990-91 & 2002-03)(% Share)
1990-91
C.Excise
22.0%
Direct
Tax
18.0%
Custom
45.0% Sales Tax
15.0%
2002-03
C.Excise
10.1%
Direct Tax
31.1%
Custom
15.0%
Sales Tax
43.8%
Chapter 4. Income Distribution and Poverty
1990-91
1991-92
1992-93
1993-94
1994-95
1995-96
1996-97
1997-98
1998-99
1999-2000
2000-01
2001-02
2002-03(B.E)
111.0
142.0
153.2
172.5
226.0
268.0
282.0
293.7
308.5
346.6
392.3
403.9
460.6
11.0
12.0
11.0
11.0
12.0
13.0
12.0
11.0
10.0
11.0
11.3
11.1
11.5
20.0[18.0]
29.0[20.4]
36.7[24.0]
43.4[25.1]
62.0[27.4]
78.0[29.1]
85.0[30.1]103.3[35.0]110.4[35.8]112.6[32.5]124.6[31.8]142.5
[35.3 ]148.5[32.2]
91.0[82.0]113.0[79.6]116.5[76.0]129.1[74.9]164.0[72.6]190.0[70.9]197.0[69.9]190.4[65.0]198.1[64.2]234.0[67.5]267.7[68.2]261.6[64.7]312.2[67.8]
50.0(54.9)
62.0(54.9)
61.5(52.7)
64.2(49.7)
77.0(47.0)
89.0(46.8)
86.0(43.7)
74.5(39.1)
65.3(33.0)
61.6(26.4)
65.0(24.3)
47.8(18.3)
59.0(18.9)
16.0(17.6)
21.0(18.6)
23.5(20.2)
30.4(23.5)
43.0(26.2)
50.0(26.3)
56.0(28.4)
53.9(28.3)
72.0(36.3)116.7(49.9)153.6(57.4)166.6(63.7)205.7(65.9)
25.0(27.5)
30.0(26.5)
31.5(27.1)
34.5(26.9)
44.0(26.8)
51.0(26.9)
55.0(27.9)
62.0(32.6)
60.8(30.7)
55.6(23.7)
49.1(18.3)
47.2(18.0)
47.5(15.2)
.Source: Central Board of Revenue Note: Figures in square brackets [ ] are shares in total taxes while the figures in
parentheses ( ) are shares of the individual taxes in indirect taxes.
The pace of changes in tax
structure, particularly in indirect taxes,
gained considerable momentum over
the last four years. The share of
custom collection declined from 33
percent to 19 percent while the share
of central excise declined from 31
percent to 15 percent since 1998-99.
Chapter 4. Income Distribution and Poverty
On the other hand, the share of sales
tax increased from 36 percent to 66
percent. The basic philosophy of tax
and tariff reform has been to move
away from investment and production
based taxes to income (direct taxes)
and consumption (sales tax) based
taxes. Pakistan has succeeded to a
considerable extent in changing the
composition of its taxes but much
more effort will be needed to enhance
the share of direct taxes in total taxes.
Although tax reform and reforms
in tax administration have started
paying dividends in terms of higher tax
collection, fiscal consolidation requires
prolonged commitment to fiscal
discipline. Prolonged commitment to
fiscal discipline can only come from a
rule-based fiscal policy. The rule
basically represents the constraints
and prevents government taking
fiscally irresponsible route. For a
country like Pakistan which remained
fiscally irresponsible for a very long
period of time, a rule-based fiscal
policy is absolutely necessary for
achieving long-run fiscal sustainability.
Pakistan has already drafted a rule-
based fiscal policy, enshrined in a
Fiscal Responsibility Law, and will be
presented to the Parliament before the
end of the current fiscal year for
legislation.
CONSOLIDATED BUDGETS (FEDERAL &
PROVINCIAL) IN 2002-03
As stated earlier, persistence of large
fiscal deficit has been the major source of
macroeconomic instability in Pakistan during the
1990s. On average, Pakistan sustained a budget
deficit of 7.0 percent of GDP. As a result of
sustained efforts, fiscal deficit has been on
declining trend since 1999-2000. Fiscal deficit
declined to 5.2 percent in 2000-01 and remained
stable at this point in 2001-02. Further fiscal
consolidation was envisaged for 2002-03 with a
fiscal deficit target of 4.6 percent of GDP. As a
result of prudent fiscal management and better
tax enforcement, Pakistan succeeded in
achieving the fiscal deficit target of 4.6 percent
of GDP in 2002-03 [See Table 5.3 for details].
Table 5.3Consolidated Budget (Federal and Provincial)
(Rs. Billion)2000-01
(P.A.)2001-02
(R.E)2002-03 (M.B.E)
% Change
A. Total Revenue 553.0 624.1 706.1 13.1 a) Tax Revenue 441.5 478.1 553.3 15.7 i) Federal 422.5 459.3 530.2 15.4 - CBR 392.3 403.9 458.9 13.6 - Surcharges 30.2 54.3 66.8 23.0 - Other 0.0 1.1 4.5 ii) Provincial 19.0 18.8 23.1 22.9 b) Non-Tax Revenue 111.4 146.0 152.8 4.7B. Total Expenditure 717.9 826.2* 892.5 8.0 a) Current Expenditure 645.7 700.2 728.8 4.1 i) Federal 479.0 524.6 543.7 3.6 - Interest 234.5 245.3 212.3 -13.5 - Defense 131.2 149.0 158.0 6.0
Chapter 4. Income Distribution and Poverty
- Civil Govt. 70.7 56.3 57.9 2.8 - All Others 42.6 74.0 115.5 56.1 ii) Provincial 166.7 175.6 185.1 5.4 b) Development Expenditure
72.2 125.9 163.7 30.0
PSDP** 89.8 126.2 134.0 6.3 c. Statistical Discrepancy
14.8 -13.0 - -
C. Overall Fiscal Deficit -179.7 -189.1* -186.4 - Financing 179.7 189.1 186.4 - i) External 120.7 82.8 102.5 - ii) Domestic 59.0 97.9 71.9 - - Bank -33.0 12.9 -29.2 - - Non-Bank 92.0 85.0 101.1 - - Privatization Proceeds
0.0 8.4 12.0 -
As % of GDP (mp) Total Revenue 16.2 17.2 17.6 - - Tax Revenue 12.9 13.2 13.8 - - Non-Tax Revenue 3.3 4.0 3.8 - Total Expenditure 21.0 22.8 22.2 - Current Expenditure 18.9 19.3 18.1 - - Interest Payment 6.9 6.8 5.3 - - Defense 3.8 4.1 3.9 - PSDP 2.6 3.5 3.3 -C. Overall Fiscal Deficit 5.2 5.2 4.6 -GDP at Market Price (Rs Bln)
3423 3629 4018 10.7
P.A: Provisional Actual Source: Finance Division, (Budget Wing)
M.B.E: Modified Budget Estimates* One off expenditure of Rs.52 billion (Rs.32 billion for KESC recapitalization and Rs.20 billion
for CBR bonds) is not being included. A statistical discrepancy of Rs. 13 billion is adjusted for OFD calculation.
** The difference between development expenditure and Public Sector Development Program (PSDP) is the net lending to PSEs.
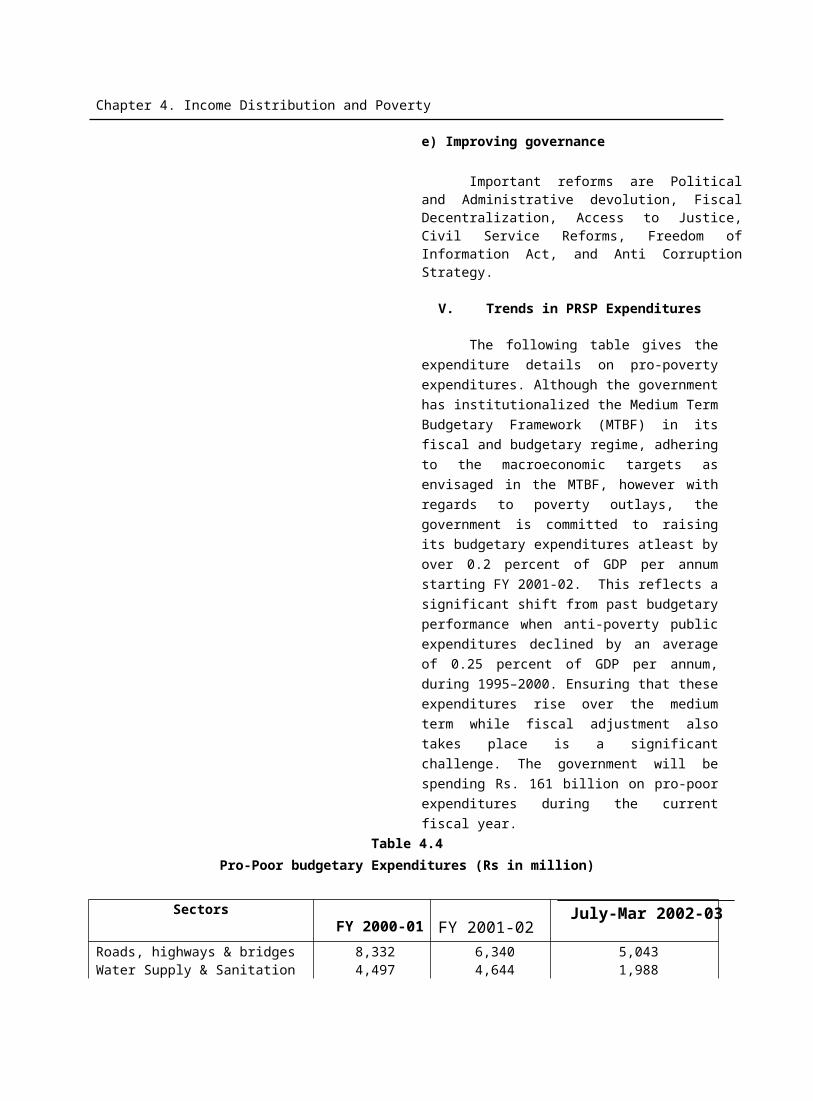
Chapter 5. Fiscal Development
Total revenue is estimated at Rs.706.1
billion in 2002-03 as against Rs.624.1 billion last
year, thereby, registering an increase of 13.1
percent. This increase mainly emanates from
substantial increase in federal and provincial tax
revenues which grew by 15.4 percent and 22.9
percent, respectively. The consolidated tax
receipts grew by 15.7 percent while non-tax
revenue grew by modest 4.7 percent. The slower
growth of non-tax revenue is because of decline
in the profits of State Bank of Pakistan. The
profits of SBP declined because it actively
pursued the sterilization policy to neutralize the
monetary impact of massive inflow of foreign
exchange. The consolidated (federal and
provincial) tax revenue constitutes 78.9 percent
of the total revenues and 21.1 per cent of non-
tax revenues. The federal tax receipts consist of
revenue collected by the Central Board of
Revenue (CBR), surcharges (gas and petroleum),
and some other minor collections.
CBR Revenue
The CBR sustained the momentum of tax
collection generated in the last quarter (April-June)
of 2001-02 and the first quarter (July-September)
of the current fiscal year (2002-03) when it grew
by 16.1 percent and 16.6 percent, respectively.
Net tax collection during the first ten months (July-
April) of the current fiscal year (2002-03) stood at
Rs 352.1 billion against the target of Rs 351.0
billion, thus surpassing the target by a small
margin (See Table 5.4). As against the target
growth of 14.0 percent, tax revenue grew by 15.0
percent in the first ten months of the current fiscal
year. The overall refund stood at Rs. 68.3 billion
which is 1.6 percent lower than unusually higher
refund of last year (Rs.69.4 billion) in the same
period.
The analysis of individual taxes
reveals interesting developments. While
overall tax collection increased by 15.0
percent, this increase has largely come from
sales tax and custom duty. Direct taxes on
net basis stood at Rs. 109.5 billion which is
only 1.0 percent higher than last year. The
overall sales tax on net basis stood at
Rs.154.1 billion which is 19.9 percent higher
than last year in the same period. More
importantly, sales tax collected from
domestic economic activity grew by 29
percent, showing an increased level of
economic activity in the country. The higher
level of economic activity is also reflected by
increased demand for imported goods,
including raw materials for consumer and
capital goods. Sales tax collection at import
stage shows an increase of 18.0 percent. The
total refund/rebate on sales tax was 16.3
percent higher than last year. It may be
pointed out that last year's refund /rebate
was extra-ordinary high as government had
decided to clear backlog. The 16.3 percent
higher refund/rebate on sales tax over the
last year’s extra-ordinary refund/rebate is a
matter of serious concern. This is also true
for direct taxes where the refund is higher by
35.8 percent over the last year’s extra-
ordinary high refund. There is a need to
examine the higher refund/rebate during the
current fiscal year.
The net collection of central excise stood at
Rs.35.5 billion—almost same as of last year.
Stagnation in growth in central excise is mainly
due to the transfer of several major revenue
spinners (e.g. POL product) to custom duty. Six
major revenue spinners (cigarettes, cement,
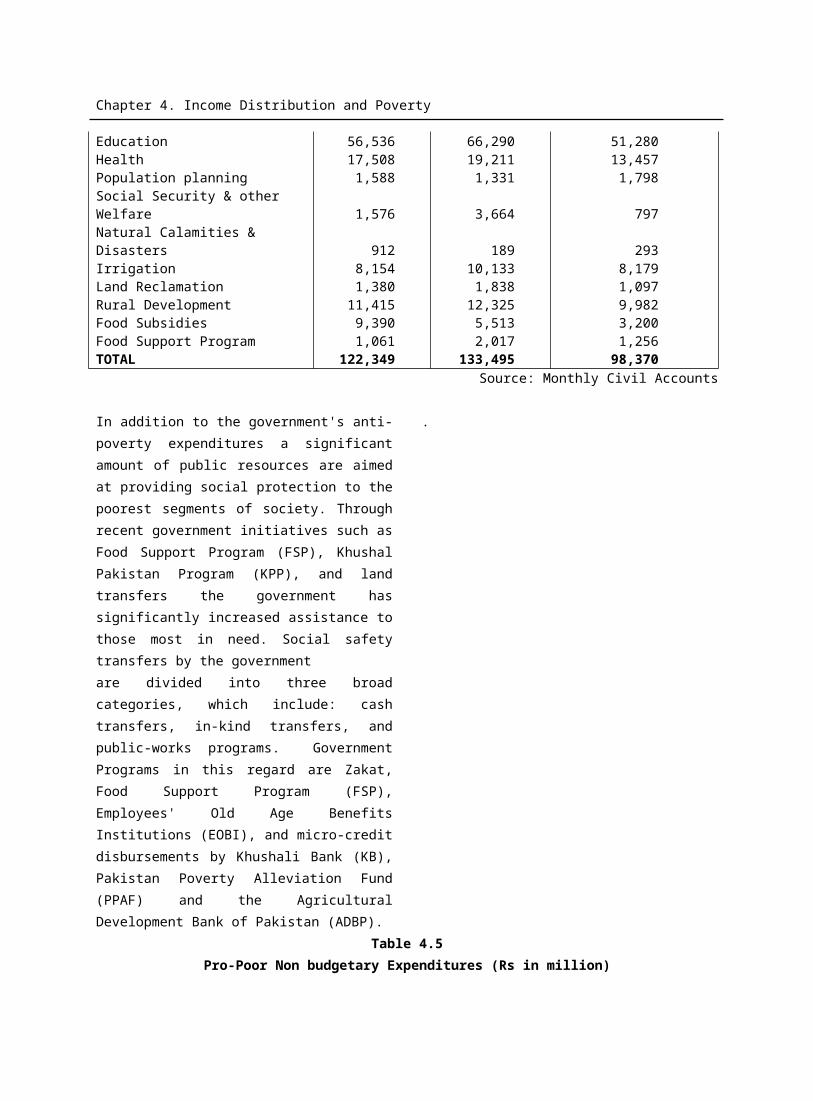
Chapter 5. Fiscal Development
natural gas, POL products, beverages and
beverages concentrates) have contributed around
88 percent to the total central excise collection
during July-April, 2002-03. The collection on
account of custom duty stood at Rs 53.0 billion on
net basis, registering an increase of 59.4 percent.
This impressive growth in custom collection is
realized even when the maximum duty rate was
slashed from 30 percent to 25 percent, duty rates
on over 2500 tariff lines were reduced, and
Pakistani rupee was appreciated by 3.8 percent
during the first ten months of the current fiscal
year. It is important to point out that as a result of
tariff reforms, the average custom duty rates on
total imports as well as dutiable imports have
fallen to as low as 9.1 percent and 15.6 percent,
respectively.
Table 5.4Federal Tax Revenue Collection
During July-April, 2002-03 (Rs. Billion)
July-April2001-02
July-April2002-03 % Change
A. Direct Tax
Gross 118.47 123.09 3.89
Refund/Rebate 9.99 13.57 35.76
Net 108.48 109.52 0.95
B. Indirect Tax
Gross 257.05 297.34 15.67
Refund/Rebate 59.40 54.75 -7.83
Net 197.65 242.59 22.74
B.1 Sales Tax
Gross 162.02 193.11 19.18
Refund/Rebate 33.51 38.98 16.32
Net 128.51 154.12 19.93
B.2 Central Excise
Gross 35.91 35.63 -0.76
Refund/Rebate 0.01 0.18 888.89
Net 35.89 35.46 -1.21
B.3 Customs
Gross 59.12 68.60 16.03
Refund/Rebate 25.87 15.59 -39.75
Net 33.25 53.01 59.44
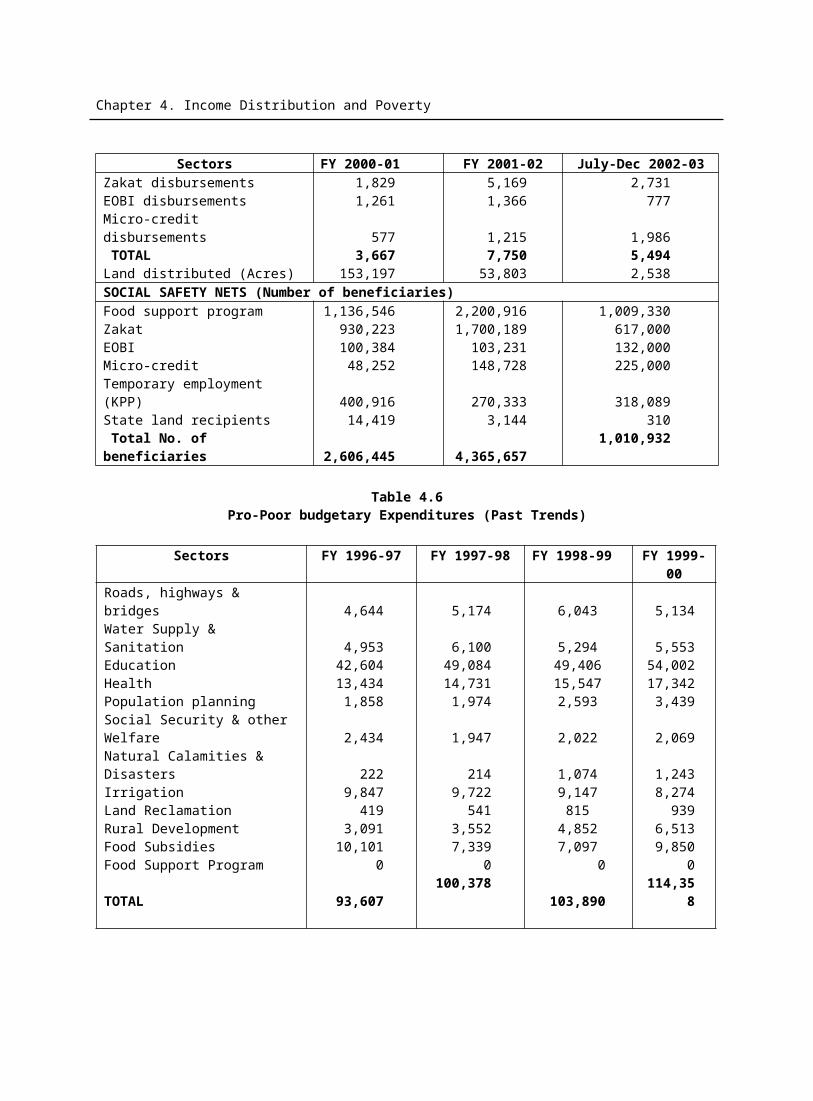
Chapter 5. Fiscal Development
Total Tax Collection
Gross 375.53 420.42 11.95
Refund/Rebate 69.40 68.32 -1.56
Net 306.13 352.10 15.02
Source: Central Board of Revenue
Table 5.5Month-Wise Tax Collection, 2002-03
(Rs. Billion)
Months Direct Tax
Indirect Taxes Total Tax Collection
% Change
Over Last YearSale
s
Central Excise Custo
mTotal 2001-
022002-
03JulyAugSep.Oct.NovDec.Jan.Feb.MarchAprilJuly-April
4.87.011.811.57.918.710.810.611.514.9109.5
12.314.516.915.016.217.316.613.616.615.0154.1
2.63.53.63.43.43.43.83.64.14.135.5
3.94.64.94.74.35.36.05.36.37.853.0
18.822.625.423.123.926.026.422.527.127.0242.6
19.726.831.033.224.939.032.827.634.936.3306.1
23.629.637.234.631.844.737.233.138.641.8352.1
19.810.719.64.212.927.714.613.419.614.915.0
Source: Central Board of Revenue
The overall performance of tax collection during the first ten months of the current fiscal year has been quite encouraging. This is the first time in many years that the CBR has over performed and this performance was not achieved by holding refunds or over reporting the revenue figures (the revenue collection numbers are now reconciled regularly with the offices of AGPR and SBP before their publication). The improved revenue collection, especially in the areas of domestic sales tax and custom duties, is a clear indication of the pick up in domestic economic activity. The on-going reform in tax administration is also responsible for better performance of revenue collection. If the
performance of the first ten months is of any indication it is highly probable that the CBR is going to achieve the target of Rs 460 billion in the current fiscal year.
Total Expenditure
Expenditure on the other hand was prudently managed. Total expenditure is estimated at Rs.892.5 billion which is 8.0 percent higher than last year. Out of the consolidated expenditure of Rs.892.5 billion for 2002-03, the current expenditure is estimated at Rs.728.8 billion (81.7 percent of total expenditure) while development expenditure (PSDP) amounted to Rs.134.0
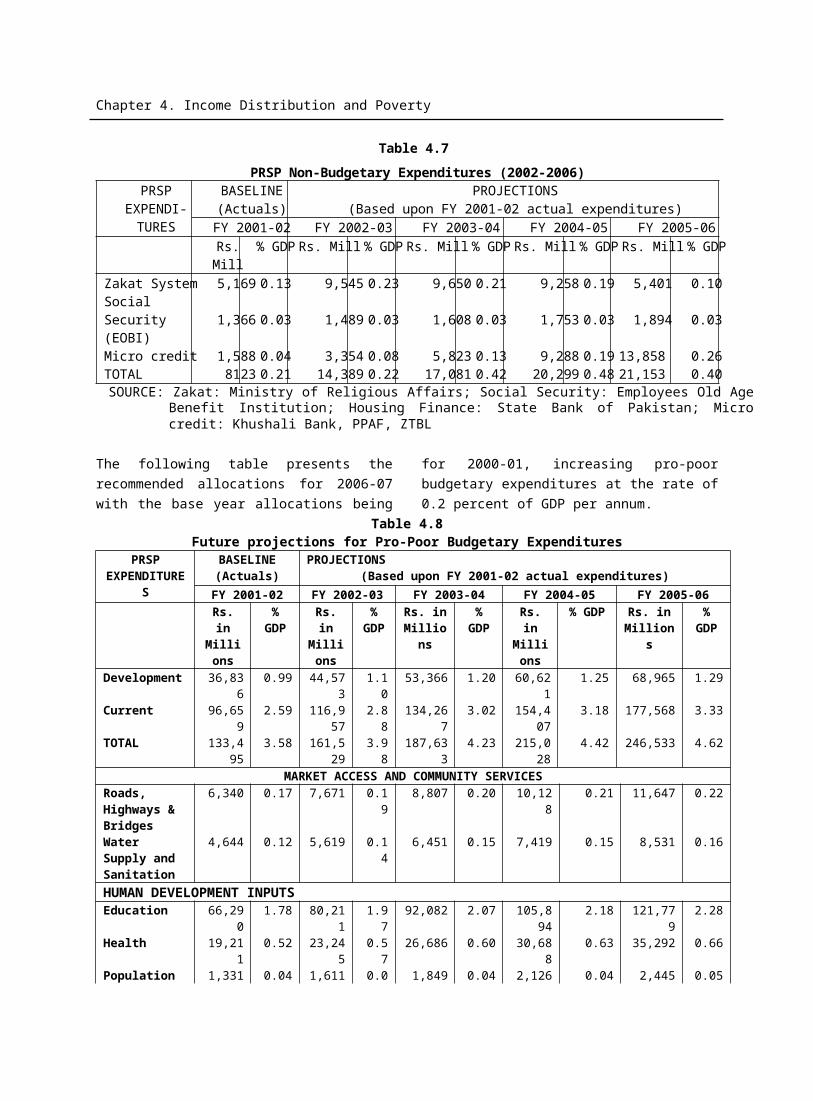
Chapter 5. Fiscal Development
billion (15 percent of total outlay). As shown in Table-5.3, the current expenditure which was 19.3 percent of GDP last year has declined to 18.1percent in the current year. There are three major components of current expenditure, namely, interest payments, defense, and expenditure on civil administration.
a) Interest Payments
Interest payments is the single largest item of total as well as current expenditures. Its share in total expenditure declined from 34.7 percent in 2000-01 to 31.6 percent in 2001-02 and further to 27.1 per cent in 2002-03. Its share in current expenditure, however, dropped from 38.6 percent in 2000-01 to 37.3 per cent in 2001-02 and further to 33.2 per cent in 2002-2003. In absolute term, interest payment which was of Rs.261.0 billion in 2001-02 declined to Rs. 241.8 billion — a reduction of 13.5 percent.[See Table 5.3]. This decrease is attributed to the proper debt management and sharp decline in interest rates. This decrease should be seen in the context of an average increase of almost 15 percent per annum during the second half of the 1990s.
b) Defense expenditure
Defense expenditure in 2002-03 was budgeted at Rs.158.0 billion against the last year figure of Rs. 149.0 billion thus showing an increase of 6.0 per cent over last year. It was budgeted to decline marginally in terms of percentage of GDP from 4.1 percent to 3.9 percent. It may be pointed out that defense spending has been continuously declining over the last one decade. Defense expenditure was 6.3 percent of GDP in 1990-91 and was targeted to decline to 3.9 percent in 2002-03. Similarly, defense
expenditure was 25 percent and 32 percent of total and current expenditures, respectively in the beginning of the 1990s but was targeted to decline to 16.4 percent and 20.0 percent of total and current expenditures, respectively in 2002-03.
c) General Administration
The third major component of current expenditure is expenditure on General Administration. Expenditure under this item stands at Rs.57.9 billion which is 2.8 percent higher than last year. It has accounted for 7.9 percent of current expenditure and 1.4 percent of GDP during 2002-03 as against 8.0 percent of current expenditure and 1.6 percent of GDP last year.
d) Provincial current expenditure
Provincial current expenditure grew by 5.4 percent in 2002-03—increasing from Rs.175.6 billion to Rs.185.1 billion. However, provincial current expenditure as percentage of total expenditure has been declining during the last three years—declining from 23.2 percent in 2000-01 to 21.3 percent in 2001-02, and further to 20.7 per cent during 2002-03. As percentage of GDP, provincial current expenditure has declined from 4.9 percent in 2000-01 to 4.8 percent in 2001-02 and further to 4.6 per cent in 2002-03.
Public Sector Development Programme (PSDP)
The size of the Public Sector Development Programme (PSDP) during the current fiscal year is projected to increase by 6.3 percent over the last year. The approved overall size of the current year’s PSDP is projected at Rs.134 billion as against Rs. 126.2 billion of last year's. Of this, Rs. 90
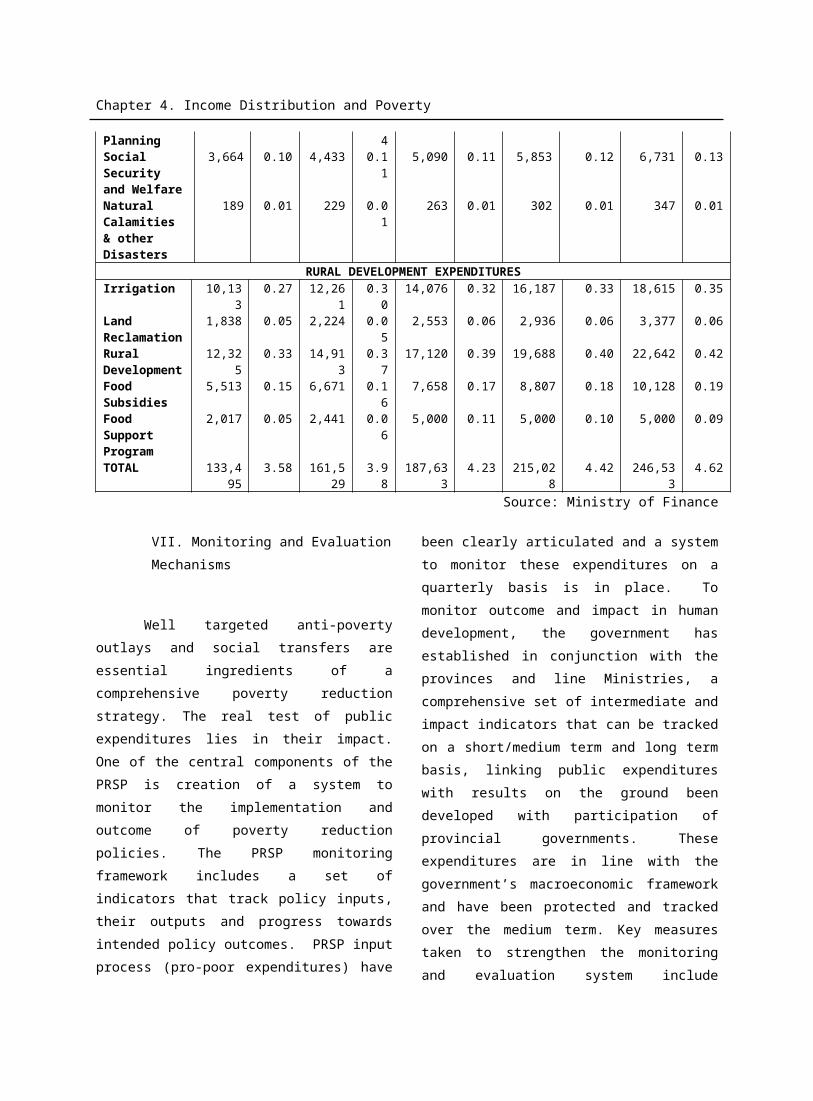
Chapter 5. Fiscal Development
billion are for Federal and Rs. 44 billion for provinces. At least 40 per cent of the resources have been provided for social sectors. PSDP also supports the government reforms intended to improve public expenditure management in the social sectors and movement from good to effective governance.
The developments in revenue and expenditure sides, as described above, led to an overall fiscal deficit of Rs.186.4 billion or 4.6 percent of GDP. This revenue- expenditure gap is financed through external and domestic sources. Out of the gap of Rs.186.4 billion, financing from external sources amounted to Rs.102.5 billion or 55 percent. The remaining gap of Rs.83.9 billion or 45 percent is financed from domestic sources. Within domestic sources, financing from non-bank sources amounted to Rs.101.1 billion while Rs.29.2 billion are allocated for retirement of debt to banking system, and Rs.12.0 billion would be amassed through privatization proceeds.
FEDERAL BUDGET, 2002-03
As shown in table 5.6, the budgeted federal gross revenue receipts of Rs.660.3 billion for 2002-03 are 13.1 percent higher than revised estimates of Rs.584.0 billion in 2001-02. These revenue receipts comprise tax revenues (Rs.530.2 billion) and non-tax revenue (Rs.130.1 billion). The tax revenue is to increase by 15.4 percent mainly because of better tax administration and reforms in the CBR (Central Board of Revenue). The CBR revenue is estimated to grow by 13.6 percent on net basis. The share of provinces is Rs. 193.5 billion which is 10.6 per cent higher than revised estimates for 2001-02. The net federal tax revenue receipts are estimated at Rs.452.5 billion. Total expenditure of Rs.707.4 billion is estimated to be higher by 13.6 percent than last year. Total development expenditure is estimated at Rs. 119.7 billion which are 21.9 per cent higher than that of the previous year. The notable thing about the federal budget is that revenue is made to grow at a faster pace than expenditure and interest payments have come down substantially [See Table 5.6].
Table 5.6
Federal Government Budget 2001-02 and 2002-03
Item
2001-02 (R.E) 2002-03 (M.B.E) % Change2002-
03/2001-02
Rs. Billion
% Share Rs. Billion
% Share
A. Tax Revenue 459.3 78.6 530.2 80.3 15.4 - CBR Revenue 403.9 69.2 458.9 69.5 13.6
- Surcharges 54.3 9.3 66.8 10.1 23.0
B. Non-Tax Revenue 124.7 21.4 130.1 19.7 4.3
Total Revenue (A+B) 584.0 100.0 660.3 100.0 13.1
DD. Current Expenditure 524.6 84.2 543.7 76.9 3.6
Chapter 5. Fiscal Development
- - Interest Payments 245.3 39.4 212.3 30.0 -13.5
- - Defence 149.0 23.9 158.0 22.3 6.0
- - Civil Administration 56.3 9.0 57.9 8.2 2.8
E.E. Development Expenditure
98.2 15.8 119.7 16.9 21.9
- - PSDP 98.4 15.8 90.0 12.7 -8.5
- - Net Lending -0.2 0.0 29.7 4.2 -F. F. Total Expenditure (D+E) 622.8 100.0 707.4 100.0 13.6
R.E: Revised Estimates Source: Finance Division, (Budget Wing)M.B.E: Modified Budget Estimates.
PROVINCIAL BUDGETS
The total outlay of four provincial budgets for 2002-03 stood at Rs. 325.1 billion, which is 15.4 percent higher than the outlay of last year (Rs. 281.8 billion). The N.W.F.P witnessed highest increase of 46.7 percent in budget outlay over last year (Rs. 40.7 billion), followed by Sindh (11.9 percent) and Punjab (10.5 percent). However, budget outlay of Baluchistan increased marginally by 1.4 percent. The overall provincial revenue receipts for 2002-03 are estimated at Rs. 294.1 billion, which are 21.8 percent higher than last year. Tax revenue accounted for 88.9
percent of overall revenue receipts and amounted to Rs.261.6 billion which is higher by 19.4 percent and non-tax revenue is estimated at Rs.32.5 billion which is 45 percent higher than last year. Out of total budget outlay of Rs. 325.1 billion, 82.4 percent went to current expenditure and 17.6 percent to development expenditure. In spite of declining share of development expenditure in total expenditure, the allocations for development expenditure are higher by 12.3 percent over last year while current expenditure is to grow by 16.0 percent. The main components of the Provincial budgets, 2001-02 and 2002-03 are presented in Table-5.7.
Table.5.7
Provincial Budgets At a Glance(Rs. billion)
Item
Punjab Sindh N.W.F.P Baluchistan Total
2001-02(R.E
)
2002-03(B.E
)
2001-02(R.E
)
2002-03(B.E
)
2001-02(R.E
)
2002-03(B.E
)
2001-02(R.E
)
2002-03(B.E
)
2001-02(R.E
)
2002-03(B.E
)
Chapter 5. Fiscal Development
Provincial TaxesShare in Federal TaxesAll OthersTotal Tax RevenuesNon-Tax Revenues Total Revenuesa) Current Exp.b) Development Exp. i) Dev.Rev.Account ii) Dev.Cap.AccountTotal Exp. (a+b)
11.687.9
3.3102.8
9.4112.2101.523.217.9
5.3124.7
12.097.419.0.128.
49.2
137.6
117.1
20.712.9
7.8137.
8
7.450.7
7.865.9
4.470.377.711.0
1.69.4
88.7
8.556.516.081.0
4.485.484.814.5
1.513.099.3
2.019.8
3.925.7
7.933.632.0
8.74.54.2
40.7
2.022.1
3.928.017.945.946.113.6
3.110.559.7
0.516.7
7.524.7
0.725.419.8
8.10.18.0
27.9
0.517.5
6.224.2
1.025.219.8
8.50.18.4
28.3
21.5175.
122.5219.
122.4241.
5230.
851.024.126.9281.
8
23.0193.
545.1261.
632.5294.1267
.857.317.639.7325.
1
Source: Finance Division, (PF Wing)
SLIPPAGES ON REVENUE AND EXPENDITURE DURING LAST THREE YEARS
Slippages on targets are quite normal through-out the world. The interdependence and global integration has made the job of forecasting even more difficult. The achievement of targets is subject to prevalence of normalcy in many tangible and intangible variables. There are inherent problems in the structure of the economy also but many external and internal developments do affect projections in both ways. During the last three years some slippages from the original budgeted figures have taken place. The course of events did influence the actual outcome. The first year of the period under review (1999-2000) witnessed massive swing in expenditure and relatively lower slippage on the revenue side. The year’s target was fixed on the assumption of considerable increase in the tax revenue as a result of tax survey and documentation drive. On the expenditure side the government has retired its debt with
the financial institution to strengthen them. The fiscal deficit target was over-ambitious at 3.6 percent of GDP. This was a Herculean task to reduce deficit this magnitude. The reform needed due time to pay dividend.
In the year 2000-01, catastrophic drought badly affected agriculture as well as overall economic growth. The economy grew by 2.2 percent — almost equal to population growth rate. The revenue stream from external trade badly affected and shortfall in revenue demanded prudence to prevail on expenditure side. Policy makers were extra cautious about the target of fiscal deficit in the backdrop of last year’s experience and consequently, expenditure was sliced considerably to meet the fiscal deficit target. The fiscal deficit just finished near the target.
The fiscal year 2001-02 was an extra-
ordinary year. Pakistan economy in general and
world economy in particular faced formidable
challenges in post 9/11 developments and war on
Chapter 5. Fiscal Development
terrorism. Pakistan was forced to divert extra
amount on defense spending due to tension on its
eastern borders. Even in the face of extra-ordinary
developments, fiscal prudence prevailed and slight
slippages have taken place on both revenue-
expenditure sides. However, the outcome of fiscal
deficit was close to the target [See Table 5.8]. In
general, over ambitious revenue target and
exogenous shocks (both external and internal) have
been responsible for the slippages in revenue-
expenditure accounts.
Table 5.8Slippages in Revenue-Expenditure
(Rs. Billion)
Items
1999-2000 2000-01 2001-02 Budg
et Estimates
Actual
Outcome
% age Variation
Budget
Estimates
Actual
Outcome
% age Variation
Budget
Estimates
Actual
Outcome
% age Variation
A. Total Revenue Receipts (Net)
570.9 536.8 -5.97 608.6 553.0 -9.97 657.9 624.1 -5.1
Total Expenditure
683.7 743.6 8.76 770.7 717.9 -5.75 844.8 826.2 -2.2
Overall Deficit Fiscal Deficit As % of
GDP
112.83.3
206.86.4
162.14.6
179.15.2
186.94.9
-189.15.2
PUBLIC DEBT
The persistence of large fiscal and
current account deficit for extended period
of time covering two consecutive decades
(1980s and 1990s) has had its
manifestation through the unprecedented
rise in public debt. By the end of the decade
of the 1990s, Pakistan’s domestic as well as
external debt reached alarming proportions
and posed great danger to the economic
future of the country. While the debt
problems were in the making for decades,
no serious efforts were made to slow down
the pace of rapid accumulation of both
Chapter 5. Fiscal Development
domestic and external debt. By late 1990s,
Pakistan already entered in a debt trap
situation. The causes of rapid growth in
domestic and external debt are
multifaceted. They included: (i) persistence
of large fiscal (7% of GDP) and current
account (almost 5% of GDP) deficits; (ii)
imprudent use of borrowed resources such
as wasteful government spending,
undertaking of low priority development
projects, and poor implementation of
foreign aided projects; rising real cost of
government borrowing (both domestic and
foreign); stagnant exports; and declining
real government revenues. Another source
of rising debt has been the changing nature
of composition of debt—that is, from grant
and soft term assistance to hard term loans.
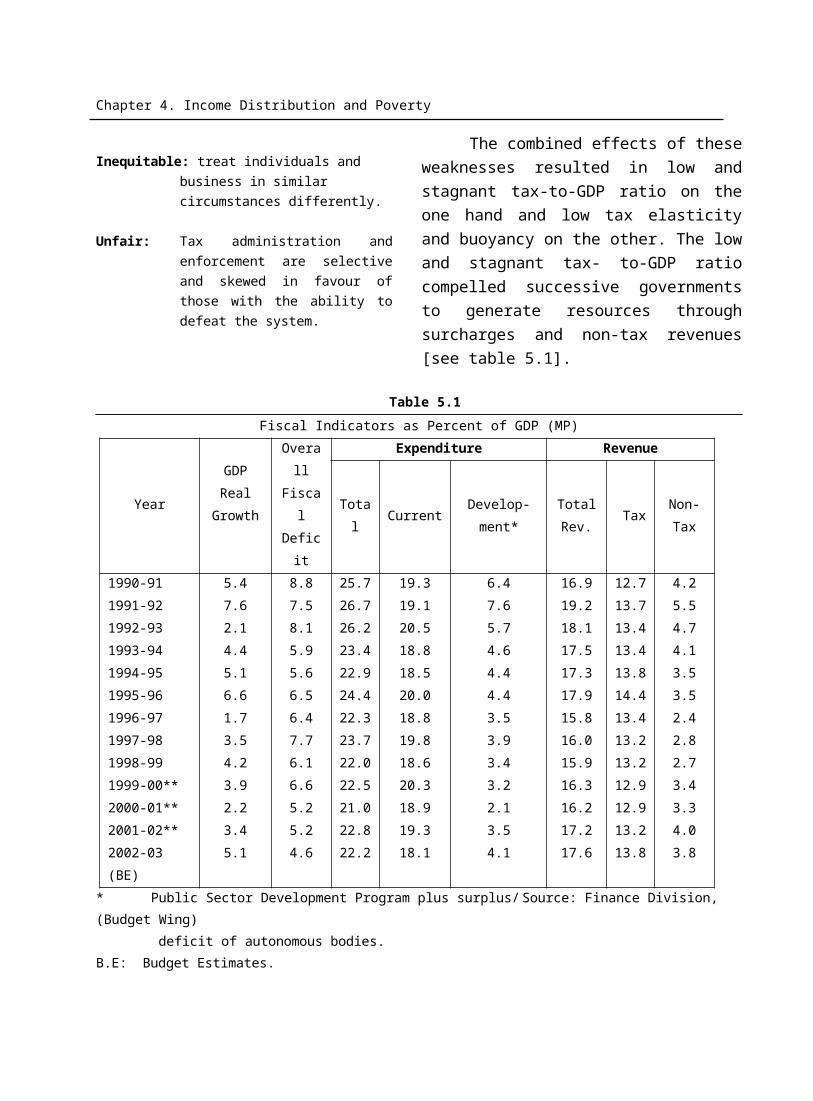
Chapter 5. Fiscal Development
Pakistan public debt grew by an average rate of 18 percent and 15 percent per annum in the 1980s and 1990s. Resultantly in terms of as percentage of the GDP, public debt was 55.9 percent in 1980, increased to 92 percent in 1990, and crossed 100 percent by mid-2000. By any standard, Pakistan public debt became unsustainable and the growing debt servicing liability made fiscal adjustment more difficult. Public debt consists of debt payable in rupee and debt payable in foreign exchange. Over the last two decades, the share of public debt in rupee increased from 38.5 percent to almost 49 percent by mid-2000. On the other hand, public debt payable in foreign exchange declined from 61.5 percent to 51.2 percent during the same period. [See Table 5.9].
Public debt payable in rupee has increased in absolute term from Rs 1.71 trillion last year to Rs 1.74 trillion during the outgoing fiscal year, however, as percentage of the GDP, it has declined from 47.2 percent to 43.5 percent—a decline of almost 4 percentage points in one year is simply remarkable.
Debt payable in foreign exchange stood at Rs 96 billion in 1980, increased to Rs 428 billion in 1990 and shoot-up to almost Rs 1.7 trillion by mid-200. As percentage of the GDP, debt payable in foreign exchange stood at 34 percent in 1980, increased to 49 percent in 1990, and further to 52.6 percent by mid-2000. As a result of sharp depreciation of exchange rate (17%) in 2000-01, debt payable in foreign exchange in rupee term jumped from Rs 1.7 trillion or 52.6 percent of the GDP to Rs. 2 trillion or almost 59.2 percent of GDP by end June, 2001. During the outgoing fiscal year 2002-03, the government has not only succeeded in arresting the rising trend in external debt but exchange rate appreciation has also helped in reducing debt payable in foreign exchange by more than Rs 85 billion. It stood at Rs 1.9 trillion or 47.2 percent of GDP in 2002-03, thus registering a decline of more than 7 percentage point of the GDP in one year.
The rising stock of public debt has had serious implications for debt service obligations. Since public debt is to be serviced in rupee, its relation with
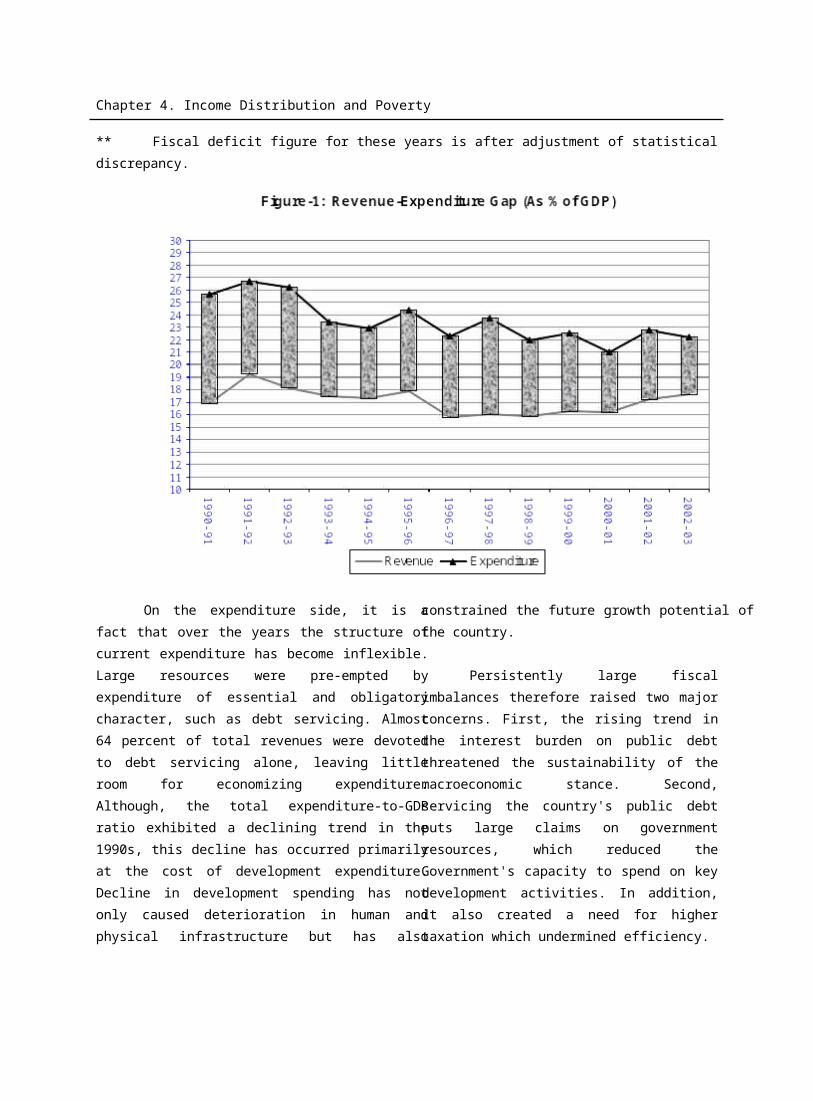
Chapter 5. Fiscal Development
government revenues is an important indicator of debt burden. Public debt was 317 percent of total revenues in 1980 increased to 505 percent by 1990, and was 679 percent in 2001. It has now been reduced to 515.9 percent in 2002-03 [See Table 5.9].
It was the realization that some two years ago, a formal debt reduction strategy was launched by the government for the first time in the country’s history. The main features of the strategy included among others; the reduction in fiscal and current account deficits, reduction in cost of borrowing, and strong financing supporton concessional terms from the IFIs. Considerable progress has been made towards addressing Pakistan’s debt problem during the last two years. Fiscal deficit has been reduced to 5.2 percent of GDP in 2001-02 from an average of almost 7 per
cent in the 1990s and further to 4.6 percent in 2002-03. Current account balance has turned sur-plus in 2001-02 and projected to remain in sur-plus in 2002-03, against an average deficit of al-most 5 percent of GDP in the 1990s. As a result of the overall decline in the term structure of in-terest rate, the cost of borrowing from both the domestic and external sources has declined. The Paris club debt rescheduling has not only provided substantial debt relief to Pakistan but has also opened avenue for it to achieve debt sub-stantially. The government has also set up a Debt Office in the Ministry of Finance to institutional-ize its debt management capability. The progress towards stabilizing the country’s debt situation during the last two and half years in general and during the first nine months of the current fiscal year in particular, is presented below in Table 5.9.
Table 5.9
Public Debt (Rs billion)
End June1980 1990 2000 2001 2002 2003*
Debt Payable in Rupees@As % of i) Public Debt ii) GDP
59.8(38.5)[21.5]
373.6(46.6)[42.8]
1575.9
(48.8)[50.0]
1728.0 (46.0)[50.5]
1711.3(46.3)[47.2]
1744.3(47.9)[43.5]
Debt Payable in Foreign Exchange As % of i) Public Debt ii) GDP
95.6
(61.5)[34.4]
427.6
(53.4)[48.9]
1655.1
(51.2)[52.6]
2025.8
(54.0)[59.2]
1983.5
(53.7)[54.7]
1898.2
(52.1)[47.2]
Total Public Debt 155.4 801.2 3231.0
3753.8 3694.8 3642.5
GDP (MP) 278.2 873.8 3147.2
3423.1 3628.7 4018.1
Total Revenue 49.0 158.8 512.5 553.0 624.1 706.1Public Debt As % of (i) GDP (MP) 55.9 91.7 102.7 109.7 101.8 90.7 (ii) Total Revenue 317.1 504.6 630.4 678.8 592.0 515.9
Source: Debt Reduction and Management Committee Report and D.M Wing Finance Division.
Chapter 5. Fiscal Development
* End March @ Excluding FEBC, FCBC, US dollar bearer certificates and Special US dollar bonds.
DOMESTIC DEBT
The nomenclature of domestic debt in
Pakistan consists of permanent debt (medium and
long-term), floating debt (short-term) and un-
funded debt (mostly national saving scheme-
related). Persistence of large fiscal deficit in the
1990s has caused domestic debt to grow at an
astronomical rate. During the decade of the
1990s, domestic debt grew at a rate of more than
16 percent per annum. Considerable improvement
on fiscal side during the last three years has
succeeded in not only arresting the rising trend in
domestic debt but it has actually declined in
absolute term. As shown in Table 5.10, domestic
debt stood at Rs 1799 billion in 2001-02, it
declined to Rs 1757.6 billion in 2000-01 (a
reduction of Rs 41.7 billion or 2.3%), and at the
end of March 2003, it stood at Rs 1770.6 billion.
In other words, during the first nine months (July-
March) of the current fiscal year, domestic debt in
absolute term rose only by Rs 13.0 billion or by
0.7 percent. As percentage of GDP, domestic debt
has declined from 52.6 percent in 2000-01 to 48.4
percent in 2001-02 and is projected to decline
further to 44.1 percent in 2002-03. It may be seen
from the table that the pace of accumulation of
domestic debt has been brought to a naught.
Maintenance of fiscal discipline on the one hand
and declining cost of financing fiscal deficit on
the other, will help Pakistan achieve a sustainable
level of domestic debt during the next five years.
The trend in domestic debt over the last six years is summarized in Table-5.10
Table 5.10Domestic Debt
(Rs billion)
1997-98
1998-99
1999-00
2000-01 2001-02
2002-03(End
Chapter 5. Fiscal Development
March)
Total Domestic Debt
1199.7 1452.9 1641.4 1799.2 1757.6 1770.6
- Permanent @ 286.6(23.9)
317.4 (21.8)
324.6(19.8)
349.4 (19.4)
407.6(23.2)
417.1(23.5)
- Floating 473.9(39.5)
561.6 (38.7)
647.4(39.4)
737.8 (41.0)
557.8(31.7)
504.6(28.6)
- Unfunded 439.2(36.6)
573.9 (39.5)
669.4(40.7)
712.0 (39.5)
792.145.1)
848.9(47.9)
Total Debt as % of GDP
44.8 49.4 52.2 52.6 48.4 44.1
- Figures in parentheses ( ) are percent shares in total debt. Source: Finance Division, (D.M Section)@ Including FEBC, FCBC, US dollar bearer certificates and Special US dollar bonds.
The composition of domestic debt has
undergone considerable changes in the last
five years. There is a rapid increase in
unfunded debt, as its share in total domestic
debt has increased from 36.6 percent in
1997-98 to 45.1 percent in 2001-02. By end
March 2003, its share has further risen to
47.9 percent of the domestic public debt. The
attractiveness of the returns on the NSS is
mainly responsible for tremendous increase
in unfunded debt.
During the 1990s, the share of permanent
debt in total domestic debt remained stagnant at 23-
24 percent while a shift has taken place between
floating and unfunded debt. A decline by 11
percentage points in the share of floating debt has
been compensated by almost similar increase in
unfunded debt’s share. The attractive real rates of
return on the various instruments of the National
Saving Schemes (NSS) were responsible for the
rapid increase in unfunded debt as compared with
permanent debt which grew at a much slower pace
(4.7 percent per annum). The unfunded nature of
this debt and its untapped manner of mobilization
has severely complicated the management of
Pakistan’s domestic debt. There is a need to re-
examine this issue.
Table 5.11Domestic Debt & Interest Payment
YearDomesticOutstanding Debt
Interest
Payment
Interest Payment (As % of)
(Rs.bln) (Rs.bln)
Tax Rev.
Total Rev.
Total Exp.
Current Exp.
GDP (mp)
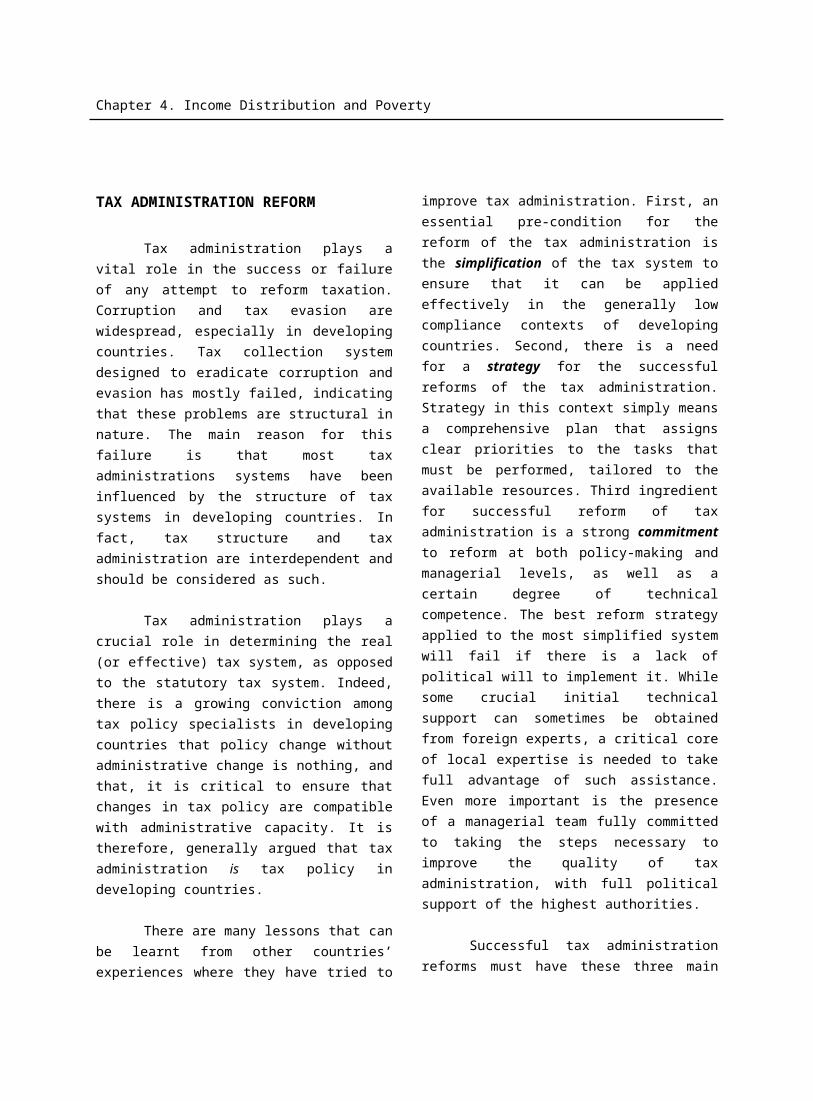
Chapter 5. Fiscal Development
1990-911991-921992-931993-941994-951995-961996-971997-981998-991999-002000-012001-02*2002-03**
448.2531.5615.3711.0807.7920.31056.11199.71452.91642.41799.21757.61812.2
35.750.362.777.577.9104.5126.5167.5175.3210.2188.5189.5172.0
27.530.635.237.230.234.239.047.244.951.842.739.631.1
20.821.726.028.424.127.532.939.037.441.034.130.424.4
13.715.618.021.318.220.223.426.427.129.626.322.919.3
18.221.923.026.422.524.727.331.632.033.529.227.123.6
3.54.24.75.04.24.95.26.36.06.75.55.24.3
* Provisional Actual Source: Finance Division (Budget wing)** Budget Estimates.
The growing burden of domestic debt is shown in Table 5.11. Interest payment on domestic debt continued to increase during the 1990s at an average rate of 20.0 percent per annum. As percentage of GDP, interest payment on domestic debt has increased from 3.5 percent in 1990-91 to 6.7 percent in 1999-2000. But interest payments subsequently declined to 5.2 percent of GDP in 2001-02 and it is further projected to decline to 4.3 per cent of GDP by the end of 2002-03. It is now consuming 24.4 percent of total revenue and accounting for 23.6 percent of current and 19.3 percent of total expenditure during 2002-03.
______________________
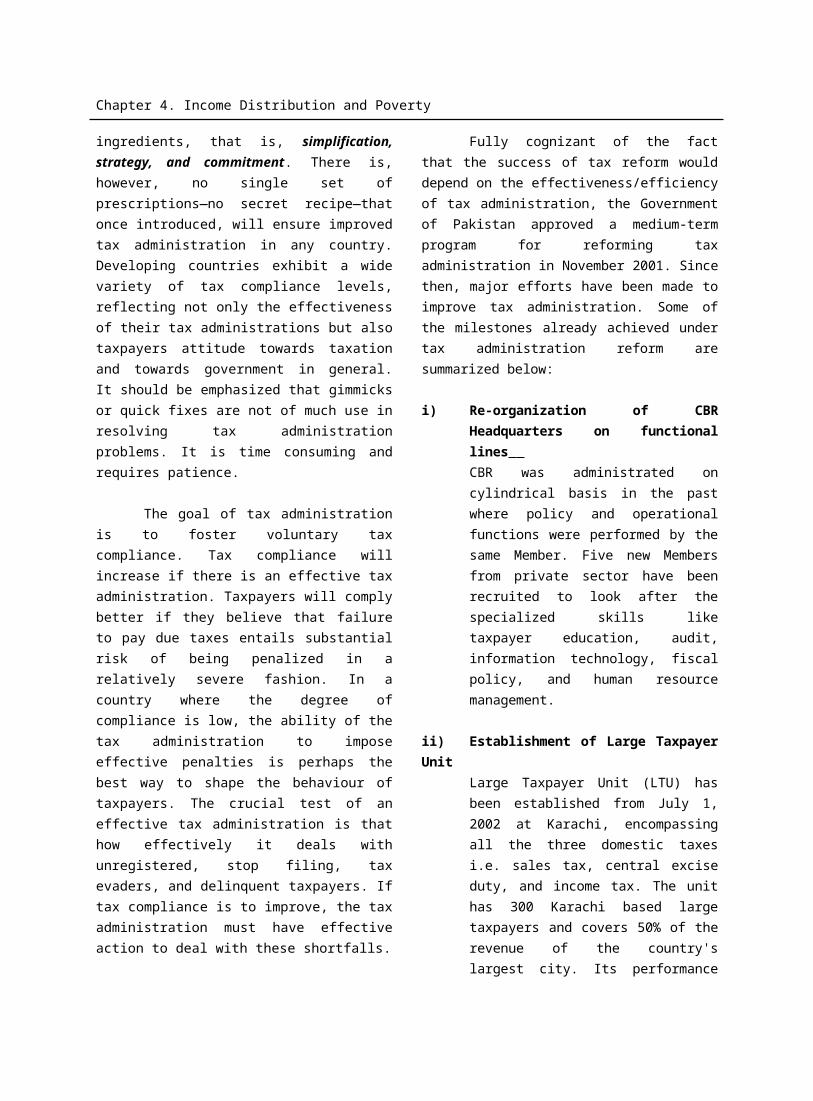
Chapter 6. Money and Credit
6. Money and Credit
A judicious use of monetary instruments
such as discount rate, liquidity ratio, open market
operations and credit plan allocations can help
achieve some of the basic macroeconomic
objectives such as price and exchange rate
stability and sustained growth of the real GDP.
Keeping these objectives in view, the monetary
policy pursued by the State Bank of Pakistan in
recent years has undergone a major
transformation. This transformation is reflected
in its expansionary and accommodative stance
brought about by the continuous reduction in the
interest rates and government securities. Over the
last three years, the monetary policy stance has
been flexible as per ground realities. For
example, monetary policy stance remained tight
during the fiscal year 1999-2000 and 2000-01 to
keep inflation under control, and bring stability in
exchange rate. This policy stance has been eased
since 2001-02 to promote investment and growth
and has continued during the current financial
year as well. The monetary policy has been more
receptive with the acceleration of foreign
exchange inflows of Overseas Pakistani Workers.
This has massively improved the net foreign
assets of the entire banking system and foreign
exchange reserves position, which, in turn
initiated the process of rupee appreciation for the
first time in the economic history of Pakistan.
The emphasis of the monetary policy has been on avoiding any abrupt appreciation of Pak rupee, market driven exchange rate and interest rate policies. The underlying rational for this policy was to stimulate non-inflationary environment for investment, moderate rupee appreciation and preserve
export competitiveness. This strategy has worked well and therefore, rupee-dollar parity, which had appreciated by 6.7 percent during July-March 2001-02, showed a subdued appreciation of 3.8 percent during July-March 2002-03. The SBP also took a number of policy measures to fine tune monetary policy, boost exports, ensure availability of adequate and timely credit to growers/farmers, promote consumer financing, and improve governance of the financial system. The SBP has also continued with its policy of sterilization to contain growth of reserve money.
As a major step of easy monetary policy, the State Bank has reduced the discount rate five times since July 2001, leading to a cumulative cut of 650 basis points. As a result, the weighted average lending rates of commercial banks have declined from 13.12 percent in June 2002 to 8.26 percent in March 2003. The State Bank has recently reduced interest rate under the export finance scheme by 0.5 percent and now the rate is 3.5 percent per annum. The excess liquidity in the banking system resulted in all time low (1.65%) T. Bill rate -- lower than inflation and deposit rates. This may have a negative impact on the balance sheets of banks.
Credit Plan, 2002-03
The SBP has continued with its flexible monetary policy stance during 2002-03. The Original Credit Plan was
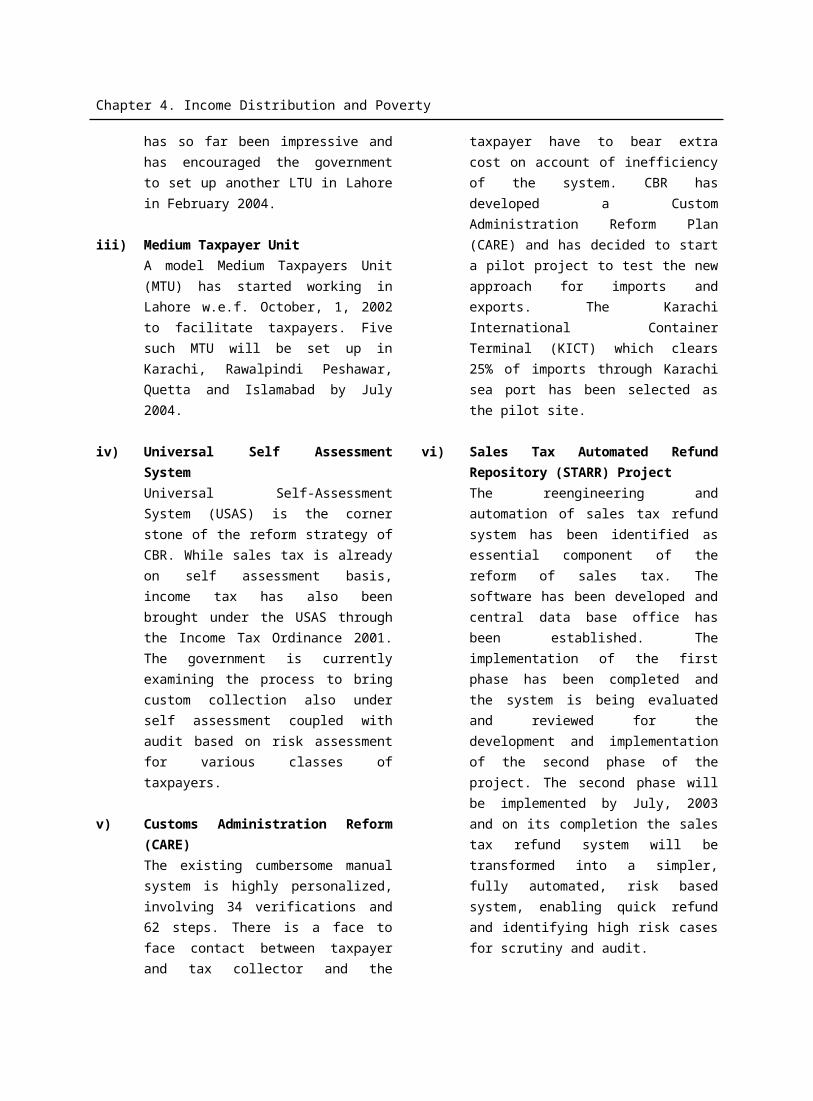
Chapter 6. Money and Credit
targeted the money supply (M2) to grow by 10.8 percent which was consistent with the projected economic growth target of 4.5 percent and inflation target of 4.0 percent. Net foreign assets (NFA) for the banking system (which primarily capture the external sector developments), were projected to contribute Rs 91.5 billion or 48.2 percent to overall monetary expansion by the end of the fiscal year in anticipation of massive foreign exchange inflows.
The net domestic assets (NDA) of the banking system were expected to increase by Rs 98.5 billion, or to contribute 51.8 percent to overall monetary expansion. Private sector credit was projected to expand by Rs 94.7 billion, while all major and minor public sector enterprises (PSEs) were allocated Rs 20 billion. Government sector was anticipated to demonstrate improved fiscal discipline, as it was to retire Rs 14.2 billion on account of budgetary support and Rs 3.0 billion in respect of commodity operations.
In view of the massive inflow of foreign exchange earnings and more than projected retirement by the government sector, Original Credit Plan 2002-03 was revised in February 2003. In the Revised Credit Plan, monetary expansion target was increased from 10.8 percent to 16.0 percent, mainly to accommodate the ever highest build up of NFA, which increased from the original target of Rs 91.5 billion to Rs 271.0 billion. Domestic credit target on the other hand was slashed from Rs 98.5 billion to only Rs 10.5 billion, wherein credit to government sector was targeted to retire Rs 44.2 billion and non-government was projected to receive a credit of Rs 70.2 billion.
Monetary and Credit Development
Against the revised Credit Plan for the fiscal year 2002-03, money supply (M2) grew by 12.5 percent (or Rs 219.9 billion) during the first nine months of the current fiscal year as against 9.3 percent (or Rs 142.5 billion) in the same period last year. Monetary expansion during the first nine months of the fiscal year was 78.1 percent of the full year revised target. This is mainly due to massive inflow of foreign exchange in the country. The NFA of the banking system amounted to Rs 278.6 billion in the first nine months of the current fiscal year as against Rs 110.7 billion in the same period last year. The NFA has already surpassed the full year revised target of Rs 271.0 billion by 2.8 percent. Massive foreign exchange inflows in the shape of home remittances, speedy repatriation of export proceeds, increased flow of FDI and financial assistance from the IFIs are responsible for the phenomenal growth of the NFA during the period under review.
Unlike previous years trend, the NDA of the banking system depicted an unusual decline of Rs 58.7 billion during the first three quarter of the outgoing fiscal year. This massive decline was witnessed despite a significant flow of Rs 107.2 billion in the commercial bank’s credit to the private sector. Decline in NDA was mainly shared by a massive contraction of credit of Rs 154.0 billion both by government sector (Rs –89.4 billion) and other items (Rs –64.7 billion) as against a very meager contraction of Rs 7.7 billion by these two sectors in the same period last year.
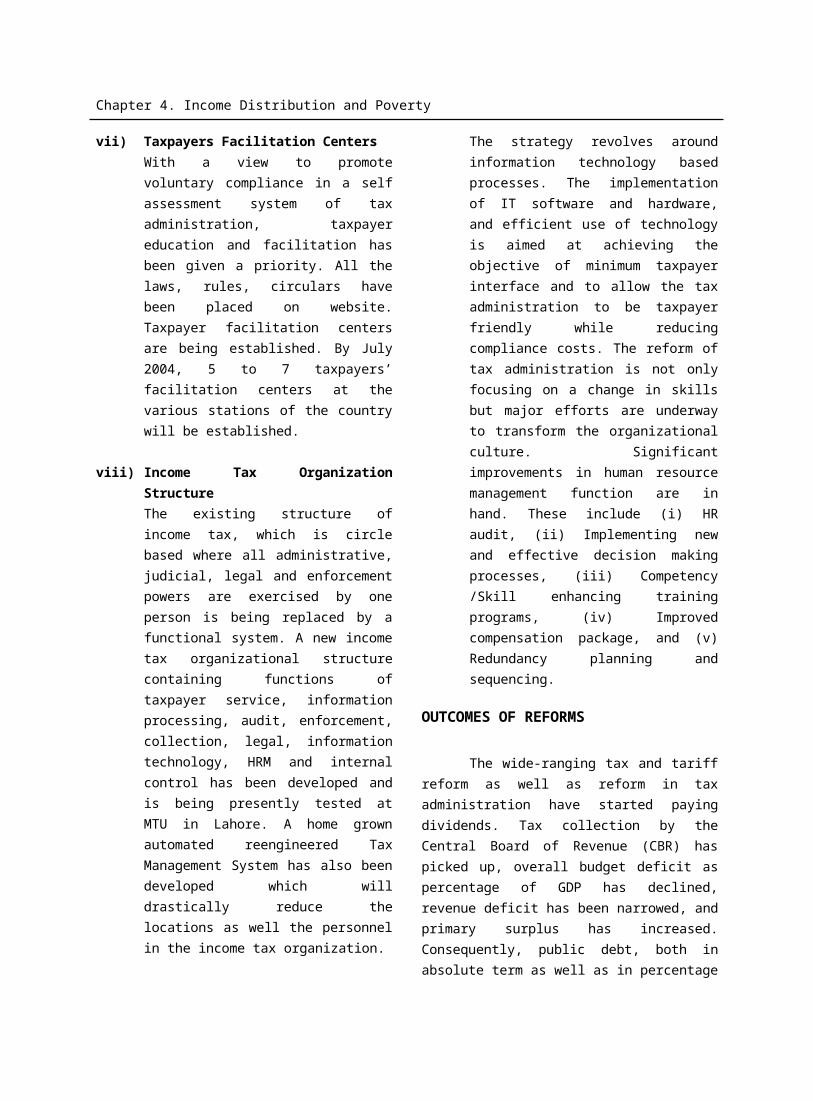
Chapter 6. Money and Credit
Net government borrowing however, remained on track mainly on account of improved performance of tax collection and maintenance of fiscal discipline. Government borrows from the banking system to finance its budget deficit and commodity procurement operations (e.g. wheat, rice etc.). During July-March 2002-03 total government borrowings showed a retirement of Rs 89.4 billion, compared to a retirement of Rs 23.4 billion in the same period last year. Of the total, government retired Rs 52.5 billion on account of budgetary support as against a marginal retirement of Rs 1.0 billion during the comparable period last year. Availability of more than budgeted external financing, improved tax collection as a result of better tax administration and dwindling of debt servicing burden due to debt re-scheduling were some of the factors that caused improvement in budgetary borrowings. There was also a marked shift in the composition of budgetary borrowing from the banking system. In fact, State Bank’s monetary management prompted government to take full advantage of low interest rates. As a result, the government borrowing for budgetary support shifted from SBP to scheduled banks. The government retired Rs 220.1 billion to SBP and borrowed Rs 175.0 billion from scheduled banks during July-March 2002-03. In the corresponding period last year, the Government had retired only Rs 71.5 billion to State Bank and borrowed Rs 70.5 billion from scheduled banks. Government also retired a larger amount of Rs 40.0 billion to schedule banks (borrowed to support commodity operations), compared with a retirement of Rs 22.6 billion in the corresponding period last year. The larger retirement was made against wheat (Rs 37.9 billion) followed by rice (Rs 1.1 billion). Advances for sugar, seeds and edible oils also showed marginal retirement of Rs 0.2 billion, Rs 0.3 billion and Rs 0.6 billion respectively.
Bank credit to non-government sector comprises credit extended by commercial banks to PSEs (i.e. WAPDA,
KESC, OGDC, PTCL, PIA, Pak Steel etc.) and private sector. Total credit to PSEs showed a retirement of Rs 4.8 billion during the first nine months of the current fiscal year compared with a nominal retirement of Rs 0.05 billion in the same period last year. Break-up of credit to PSEs shows that autonomous bodies availed Rs 5.8 billion from the commercial banks during the period under review as compared with Rs 3.3 billion during the same period last year. Within these autonomous bodies, the KESC was the largest borrower (Rs 6.7 billion) followed by the PIA (Rs 6.0 billion). Other autonomous bodies retired in net terms with a heavy retirement of Rs 4.5 billion by WAPDA and Rs 1.2 billion by Pakistan Steels. Smaller PSEs, on the other hand, showed a retirement of Rs 8.6 billion during July-March 2002-03 compared with a retirement of Rs 1.9 billion in the corresponding period last year.
Credit utilization by the private sector
almost doubled during the period under review,
compared to the corresponding period of last
year. The easy monetary policy stance followed
by cuts in discount rate and decline in the
average lending rates along with improvements
in the fundamentals of the economy resulted in
the escalation of credit to private sector. Bank
credit to private sector expanded by Rs 107.2
billion during July-March 2002-03 compared to
an expansion of Rs 54.0 billion in the
corresponding period last year. Commercial
banks extended credit to the extent of Rs 98.0
billion, which was more than 100 percent than
the amount disbursed by commercial banks in the
corresponding period last year. Specialized
banks, on the other hand, disbursed less credit i.e.
Rs 4.0 billion compared with Rs 6.2 billion
disbursed last year. The SBP credit to other
financial institutions also showed a retirement of
Rs 5.3 billion, as against a larger retirement of Rs
14.4 billion in the same period last year. Banks
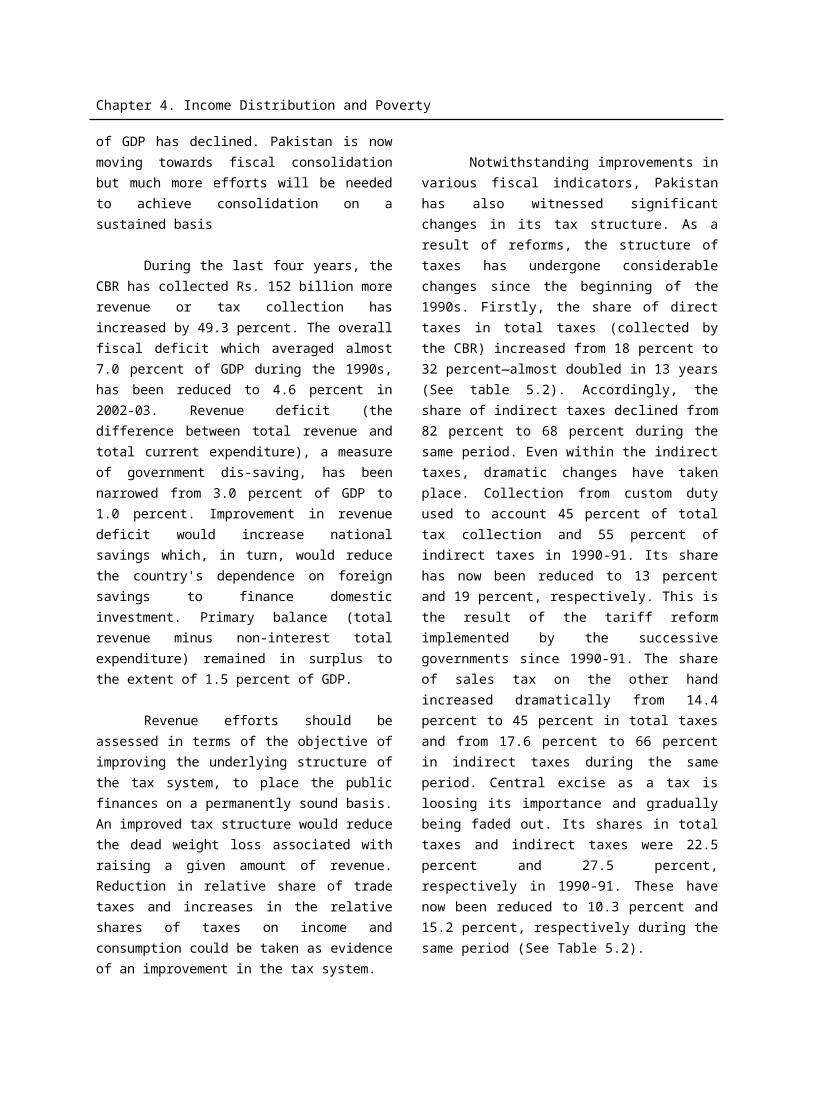
Chapter 6. Money and Credit
continued to finance important segments of the
private sector. The Cotton financing excluding
Cotton Export Corporation (CEC) amounted to
Rs 36.4 billion up to March 22, 2003, compared
with Rs 30.5 billion last year. Disbursement of
agricultural credit for production and
development purposes by Zeri Taraqiati Bank
(former ADBP), Punjab Provincial Cooperative
Bank (PPCB) and commercial banks amounted to
Rs 34.1 billion during July-February 2002-03,
compared with Rs 32.0 billion in the same period
last year. Credit for export finance declined
although the magnitude of retirement was less
than last year. The retirement under Export
Financed Scheme amounted to Rs 8.9 billion
compared with Rs 14.9 billion during the same
period last year. Despite significant reduction in
the export finance rate, retirement of credit under
the scheme could be attributable to self-financing
by the exporters or other cheaper sources.
In view of rising inflows of foreign exchange, money supply is projected to increase by 16 percent during the current fiscal year (ending June 2003), compared to 15.4 percent in last year. However, the inflation is projected to remain stable and not to deviate from the annual target of 4.0 percent because of strong rupee. The main factors causing changes in monetary assets are given in Table-6.1.
Table 6.1Factors Causing Changes in Monetary Assets
(Rs billion)Sector/Factor Credit Plan Target
2002-03 Actual
Original Revised2002-03
(July-March) 2001-02(July-March)
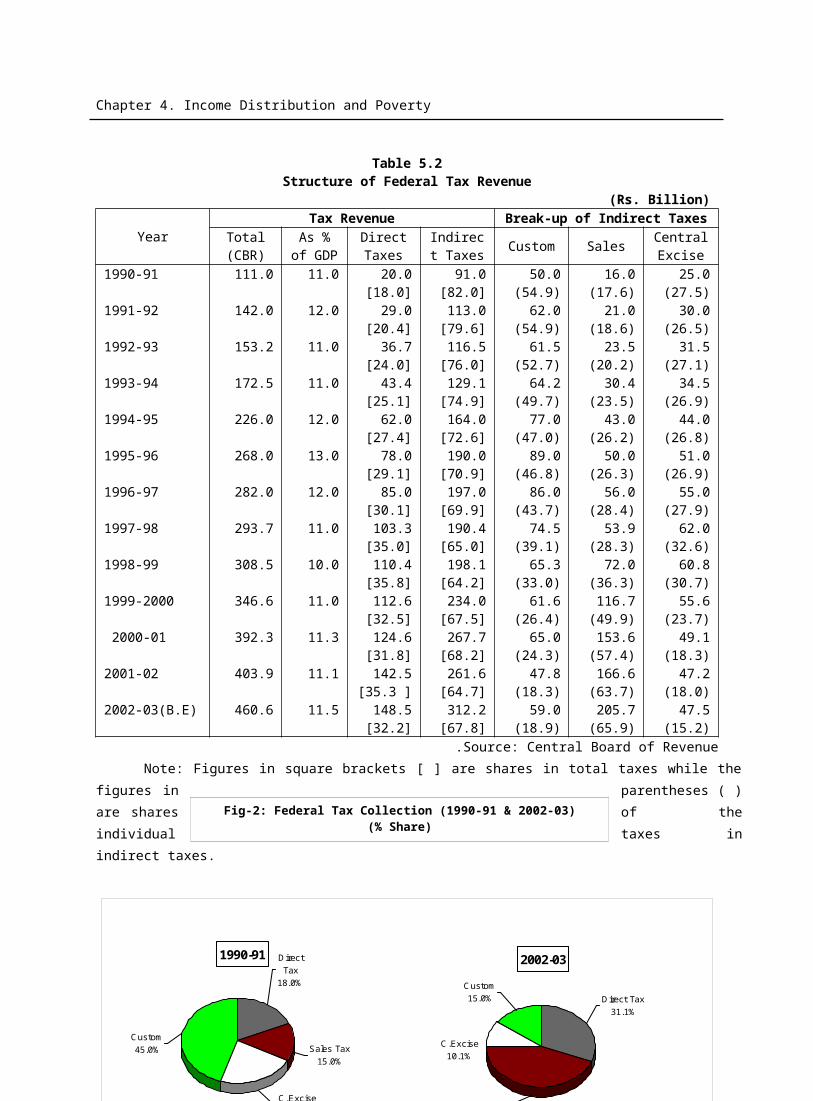
Chapter 6. Money and Credit
Domestic Credit
i) Government Sector Borrowing(Net)
- Net Budgetary Support- Commodity Operations- Effect of Zakat Fund
ii) Non-Government Sector
- Autonomous Bodies- Net credit to Private Sector
& PSCEs a) Private Sectorb) PSCEsc) PSEs SP. A/C debt repayment
with SBPd) Other financial institutions
iii) Other Items (net)
Foreign Assets (net)
Total Monetary Expansion (M2) - (A+B)
(Growth Rate %)
98.5
-16.2-14.2-3.01.0
114.70.0
114.7
94.720.00.0
0.0
0.0
91.5
190.0
(10.8)
10.5
-44.2-29.2-16.01.0
70.20.0
70.2
50.220.00.0
0.0
-15.5
271.0
281.5
(16.0)
-58.7
-89.4-52.5-39.42.5
95.45.8
89.6
107.2-9.1-3.2
-5.3
-64.7
278.6
219.9
(12.5)
31.8
-23.4-1.0-22.60.2
39.53.3
36.2
54.0-1.9-1.5
-14.4
15.7
110.7
142.5
(9.3)
Source: State Bank of Pakistan.
Impact of Sterilization on Money Supply & Prices
In the post-September 11 scenario, Pakistan enjoyed a substantial improvement in foreign exchange inflows especially sharp rise in remittances leading to appreciation of Pak rupee. However, in order to avoid any abrupt appreciation of Pak rupee, SBP had to intervene to mop up excess forex supply from the inter-bank forex market. The SBP made net purchases of $7.9 billion during the period from September 2001 to March 2003 and as a result, it injected Rs 474 billion into the banking system. The SBP used the sterilization instrument for neutralizing the monetary impact of forex purchases on money supply, price expectations and
exchange rate. The liquidity injections due to forex purchases were however, largely mopped up through Treasury Bills (TBs) auctions and retirement of SBP holdings of government papers.
The sterilization has a direct impact on Reserve Money (RM) and money supply, as it has caused reduction in NDA of the SBP through offloading government papers held by it to the scheduled banks. Therefore, increase in NFA was offset by corresponding reduction in NDA so that reserve money remained on target. During the first nine months of the current fiscal year, the SBP has injected Rs 257 billion (against net purchases of $4.4 billion) into the banking system but 70.4 percent of that injection (Rs 181 billion) has been sterilized
Chapter 6. Money and Credit
primarily through auctioning of the government papers. As a result, the stock of reserve money (RM) with ongoing sterilization has grown only by 13.0 percent; which otherwise would have risen by 44.0 percent. Similarly the money supply (M2) expanded by 12.5 percent during this period. If the reserve money had not been curtailed through sterilization, the M2 would have grown by 43.5 percent having sever implications for the economy in terms of higher inflation and erosion in Pakistan’s export competitiveness.
The sterilization has helped in containing inflation by checking the unusual growth of money supply. During the first three-quarters of 2002-03, consumer price inflation remained low at 3.4 percent against the annual target of 4.0 percent. However, appreciation of Pak rupee has also contributed towards lower inflation through cheaper imports. The SBP intervention to sterilize has also arrested the abrupt appreciation of Pak rupee from 6.7 percent in July–March 2001-02 to 3.8 percent in July–March 2002-03. Other wise, it would have eroded the Pakistan’s export competitiveness in the international markets and also have damaged the export – oriented industries.
The sterilization also involved some cost, which was to be borne by the SBP. It is the difference between higher earnings foregone on offloaded T – bills and lower returns on SBP investment of foreign exchange. Moreover, SBP has also to bear the loss due to increase in the revaluation cost resulting from appreciation of Pak rupee against US dollar. Resultantly, it had reduced the profit of SBP, which is also a loss to the government, as it is transferable to the government. However, government
will gain on account of lower borrowing cost and lower domestic debt servicing due to lower interest rates. The principal benefits of the SBP purchases from the inter-bank foreign exchange market coupled with on-going sterilization include the containment of monetary expansion, low inflation, maintenance of export competitiveness and lower cost of bank borrowing by the government.
Components of Monetary Assets (M2)
The components of monetary assets (M2) include: (i) currency in circulation, (ii) demand deposits, (iii) time deposits, (iv) other deposits (excluding IMF A/C, counterpart), and (v) residents’ foreign currency deposits. The developments in these components during the first nine months of the current fiscal year are presented below (Table-6.2)..
Currency in Circulation: Currency in circulation, is the most liquid form of money supply. In the first nine months of the current fiscal year, currency in circulation increased by 13.4 percent (Rs 58.0 billion), as against 15.6 percent (Rs 58.6 billion) in the same period last year. As on 31st March 2003, currency in circulation constituted 24.8 percent of money supply (M2), compared to its share of 26.0 percent in the comparable period of last year (Table-6.2). The currency in circulation follows a seasonal pattern determined jointly with the interaction of calendar and Islamic Hijra months. It starts to grow with the seasonal disbursement of credit to private sector (from September) and peaks usually in November or during the month in which Eid falls.
Table 6.2Stock of Components of Monetary Assets (M2)
(Rs billion)
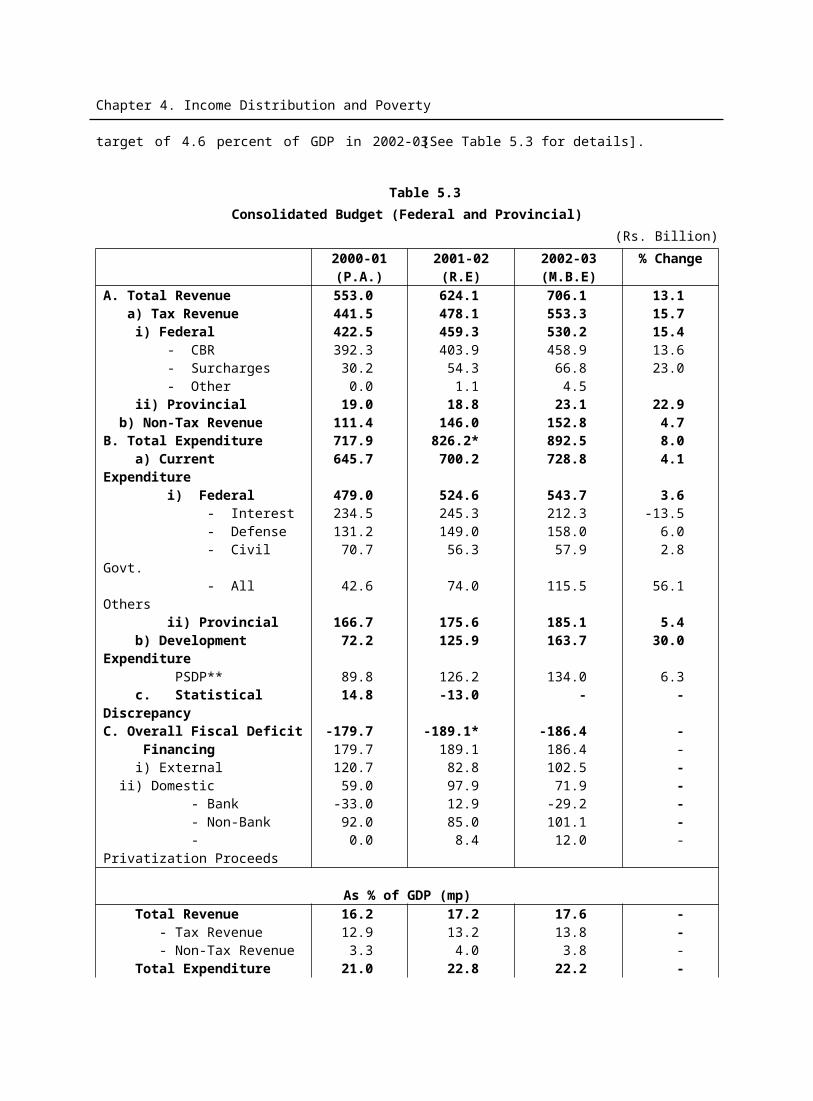
Chapter 6. Money and Credit
ItemsEnd June End March
Average (90s)
2001 2002 2002 2003
Currency in Circulation
Demand Deposits with banks(a)
Other Deposits(b) with SBP
Time Deposits with banks(a)
Residents Foreign Currency Deposit
Money Supply (M2)
As Percent of M2 Currency in Circulation
Demand Deposits
Other Deposits
Time Deposits
Residents Foreign Currency Accounts (RFCD)
M2/GNP (MP)
225.1(12.1)
212.5(13.5)
5.6(15.2)
328.6(18.6)
119.2(57.0)
890.9(15.3)
26.3
24.7
0.7
36.9
12.4
43.9
375.5(5.6)
374.7(-0.2)
11.3(41.9)
610.5(11.2)
154.2(37.1)
1526.0(9.0)
24.6
24.6
0.7
40.0
10.1
45.3
433.8(15.5)
429.2(14.5)
13.8(22.6)
727.1(19.1)
157.4(2.1)
1761.4(15.4)
24.6
24.4
0.8
41.3
8.9
48.1
434.1(15.6)
401.9(7.3)
11.3(-0.2)
670.7(9.9)
150.7(-2.2)
1668.6(9.3)
26.0
24.1
0.7
40.2
9.0
45.6
491.8(13.4)
548.4(27.8)
3.5(-74.6)
813.7(11.9)
123.8(-21.4)
1981.2(12.5)
24.8
27.7
0.2
41.1
6.2
47.2
Source: State Bank of Pakistan.Note: Figures in parentheses represent growth in percent.a) Excluding inter-bank deposits, deposits of government and foreign constituents.b) Excluding IMF A/C No. 1 & 2 and SAF Loan Account, Counterpart Funds and Deposit of
foreign governments, central banks, international organizations and deposits of money bank.
Demand Deposits with Scheduled Banks: Scheduled banks’ demand deposits increased by 27.8 percent (Rs 119.2 billion) during July-March 2002-03, as compared to their growth of 7.3 percent (Rs 27.2 billion) only in the comparable period last year. Main factor responsible for the sharp increase in demand deposits as well as currency in circulation is the rise in the reserve money during the first nine months of the current fiscal year. Reserve money
(RM) increased by 13.0 percent during the first three-quarters of the outgoing fiscal year. This increase in reserve money is due to the extra-ordinary increase in the net foreign assets. Had there been no sterilization through auctioning of the government papers, RM would have risen by 44.0 percent, thus further increasing the level of CC and DD. The outstanding stock of demand deposits was Rs 548.4 billion as on end March 2003, representing 27.7
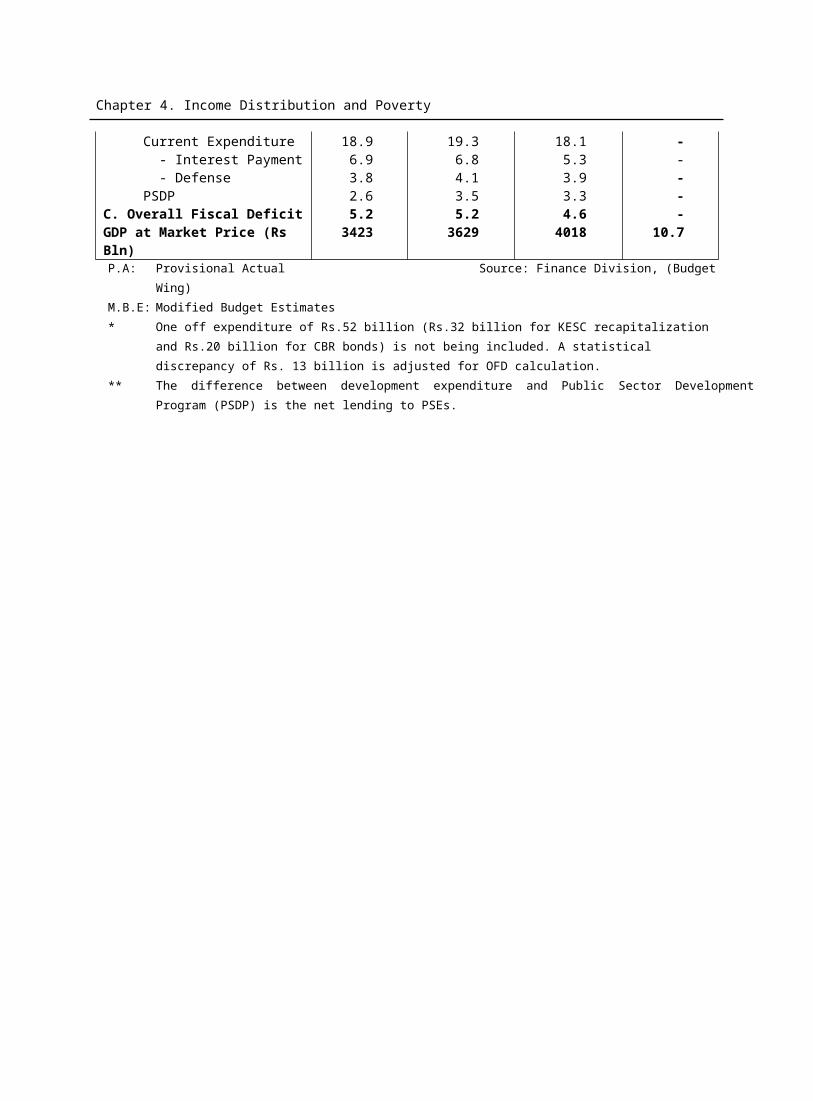
Chapter 6. Money and Credit
percent of the M2 stock. On the corresponding date of last year, the demand deposits constituted 24.1 percent of M2. Time Deposits: Time deposits of scheduled banks increased by 19.1 percent in 2001-02 as against 11.2 percent in 2000-01. In the first nine months of 2002-03, time deposits increased by 11.9 percent (Rs 86.6 billion), as against 9.9 percent (Rs 60.2 billion) in the comparable period of last year. As on end March 2003, time deposits constituted 41.1 percent of M2, as compared to 40.2 percent on the corresponding date of last year. It may be noted that despite continuous decline in the weighted average (W.A.) deposit rate time deposits have been increasing in the current fiscal year. This indicates that despite negative real return the depositors still put their trust in the commercial banks for safety of their money.
Currency Deposits Ratio (CDR): The currency deposit ratio (CDR) has been rising
steadily after reaching as low as 29 percent in fiscal year 1997-98 reflecting the dis-intermediary role of the freeze on foreign currency deposits. Since June 2001, CDR [CC/(DD+TD+RDFC)] has risen from 32.96 percent in June 2001 to 33.02 percent in June 2002 and further to 33.10 percent in March 2003. The upward trends in CDR appear to support the view that the jump in remittances in the country in the recent months has captured at least part of the normal (informal or formal) forex flows in to Pakistan. Another interesting observation stems from the liquid reserves to money supply (LRM) ratio. This ratio is a measure of monetary stability and is used to assess the vulnerability of domestic interest rates to fluctuations in the country’s external account. The LRM has been increasing since June 2000, which may be an indication of stable financial sector in the country. The LRM, which was only 5 percent in June 2000, increased to 16.8 percent in June 2002 and further to an all time high of 28.2 percent in March 2003 (Table: 6.3).
Table 6.3Key Indicators of Pakistan’s Financial Development
(Percent) Years M2/GDP M1/M2 DD+TD/M2 TD/M2 LRM
Chapter 6. Money and Credit
1980-811981-821982-831983-841984-851985-861986-871987-881988-891989-901990-911991-921992-931993-941994-951995-961996-971997-981998-991999-002000-012001-02
July-March2001-022002-03
37.635.940.138.939.041.041.933.737.739.939.241.744.444.743.843.343.845.143.644.544.648.5
46.049.3
70.369.566.163.464.763.966.568.772.670.070.466.259.955.151.051.342.139.850.252.849.949.8
50.852.7
66.267.268.367.768.969.668.467.065.365.665.169.371.273.073.374.376.877.477.574.675.475.4
74.075.2
29.730.533.936.635.336.133.531.329.029.631.531.634.635.936.036.736.737.140.339.240.041.3
40.241.1
9.57.115.112.64.66.65.73.02.63.33.35.01.89.910.27.44.53.36.35.07.916.8
14.628.2
Source: State Bank of Pakistan. While there is no standard method to measure financial deepening, the most widely used indicator is the ratio of M2 to GDP. This ratio indicates how monetized an economy is and how important are its banks. The M2/GDP ratio has increased significantly over the last 23 years – rising from 37.6 percent in 1980-81 to 39.2 percent in 1990-91. With the introduction of financial sector reform since early 1990s, the ratio has been increasing every year. During the decade of 1990s, average M2/GDP was 43.4 percent, which increased to 44.6 percent in 2000-01, and 48.5 percent in 2001-02. As on 31March 2003, the M2/GDP ratio was recorded at
49.3 percent, which is the highest in the last two decades of the 1980s and the 1990s. This clearly indicates that Pakistan’s economy is more monetized and the banking sector is more important today than two decades ago. Other indicators of financial deepening, such as, the ratio of total deposits to M2, and time deposits to M2, have also improved.
Measures of Money Supply and their Behaviour
The annual trends of M1, M2 and M3 since
June 1991 to June 2002 and up to March 2003 are
given in Table-6.4.
Table 6.4
Stocks of Monetary Aggregates (Rs billion)
End PeriodStock Money Supply & Monetary Assets (Percentage Change)
(M1) (M2) (M3) (M1) (M2) (M3)
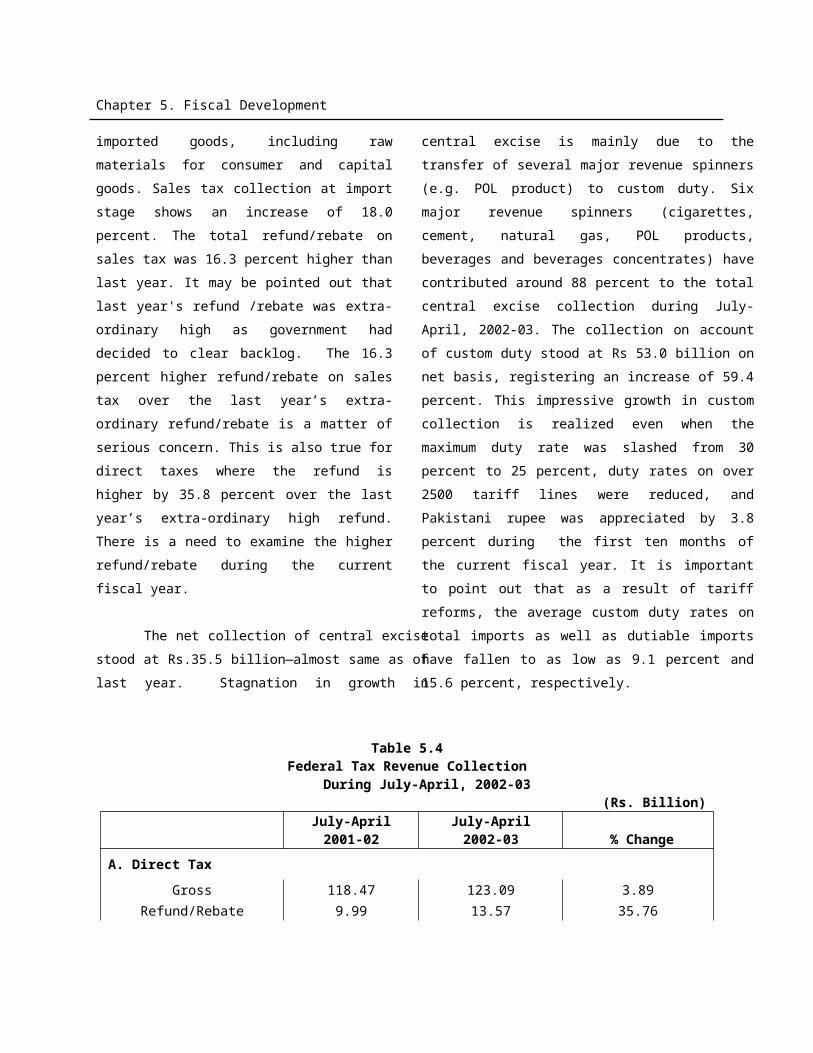
Chapter 6. Money and Credit
June 1991June 1992June 1993June 1994June 1995June 1996June 1997June 1998June 1999June 2000Average 1990s 2000-012001-02
End March20022003
265.1302.9327.8358.8423.1448.0443.6480.3643.0739.0
-761.4876.8
847.21043.8
400.6505.6595.4703.4824.7938.7
1053.21206.31280.51400.6
-1526.01761.4
1668.61981.2
569.40679.2777.3923.41083.61246.31430.11696.81913.42137.2
-2313.92640.9
2506.92934.7
10.414.28.29.417.95.9-1.08.333.914.912.23.015.2
11.319.0
17.426.217.818.117.213.812.214.56.29.4
15.39.015.4
9.312.5
12.919.314.418.817.315.014.818.612.811.715.68.314.1
8.311.1
Source: State Bank of Pakistan & E.A. Wing, Finance Division.
Monetary aggregate of M1 consists of the outstanding stock of currency in circulation, demand deposits of scheduled banks and other deposits with the State Bank of Pakistan. Money supply of M2 definition consists of M1 plus outstanding stock of time deposits of scheduled banks and outstanding stock of RFCDs. The main components of M3 include: outstanding stock of M2, outstanding deposits of national saving schemes (NSS), and outstanding deposits of Federal Banks for Cooperatives.
During the first nine months of the current fiscal year, while M1 has increased by 19.0 percent (Rs 166.9 billion), as against an increase of 11.3 percent (Rs 85.8 billion) in the comparable period last year, M2 has recorded
a growth of 12.5 percent during the period under review, compared to 9.3 percent in the same period last year. The broadest monetary aggregate, M3, has increased by 11.1 percent during the first 3 quarters of 2002-03, as compared to 8.3 percent in the comparable period last year. Higher growth in M3 is attributable both to higher growth of M2 and net accrual of National Saving Schemes (NSS). The M3 is dominated primarily by M2 and NSS deposits. Since 1994-95, the share of NSS in absolute term has been rising, fuelling M3 growth. In June 1995, the shares of M2, NSS, and two organizations (NDFC and Co-operative Bank) in M3 were 76.1 percent, 23.6 percent, and 0.3 percent respectively. In June 2001, M2/M3 declined sharply to 65.9 percent while NSS/M3 increased to 33.9 percent. In June 2002, M2/M3 increased to 66.7 percent while NSS/M3 declined to 33.2 percent. In March 2003, M2/M3 again increased to 67.5 percent while NSS/M3 came down to 32.4 percent. Higher growth in M2 in the first nine months of the current fiscal year was attributed mainly to the huge forex inflows in the country.
BOX-1
Monetary Policy
Monetary and Credit Control Measures, 2002-03
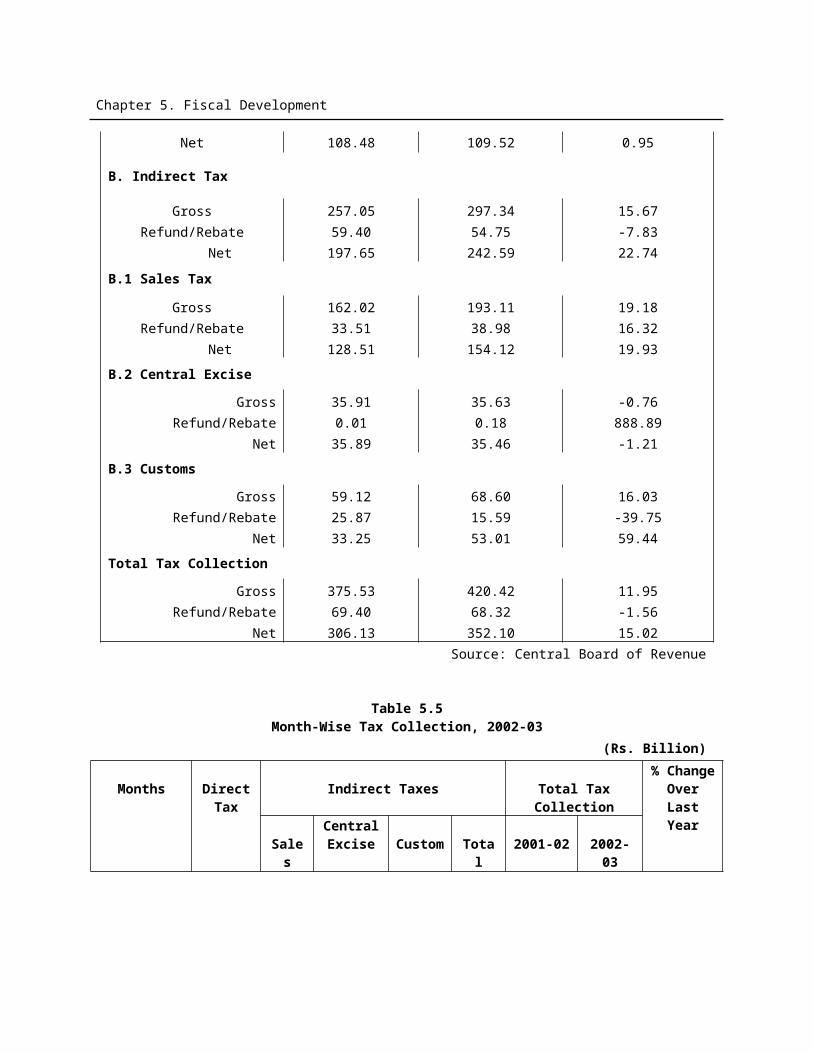
Chapter 6. Money and Credit
I. In July 2002, SBP appointed some banks as Primary Dealers for the financial year 2002-03 including; Habib Bank Limited, National Bank of Pakistan, Union Bank Limited, Citi Bank, ABN-Amro Bank, American Express Bank, and Standard Chartered Bank.
II. On July 9, 2002 the State Bank amended Prudential Regulations XXVIII and made banks/NBFIs free to decide the rate of return on deposits mobilized under FE 25.
III. To promote consumer financing in Pakistan, banks were allowed in July 2002 to provide financing facilities to general public for purchase of consumer durable provided their consolidated borrowings for this purpose from the bank does not exceed Rs 100,000/-.
IV. To promote E-Commerce and to facilitate the consumers by providing them access to their funds through the existing two ATM Switch Networks operated and managed by Muslim Commercial Bank (M-Net) and ABN-AMRO Bank (Shared ATM Switch Network), it was decided in August 2002, that all scheduled banks, which are not currently connected to either of the two Switches should join or come to an agreement with any of the two Switch system latest by December 31, 2002.
V. In August 2002, the State Bank advised banks to further enhance the scope of Agricultural Loan Scheme and ensure availability of adequate & timely credit to growers/farmers.
VI. In order to streamline processing of the cases involving refund of fines recovered under EFS and make the system more transparent, the State bank prescribed a procedure on 31st August, 2002 and advised all banks to properly circulate the same amongst their branches dealing with the Export Finance Scheme/cases.
VII. The State Bank, on 4th September 2002 set up a permanent desk for dollar/rupee swap to use as a new tool of monterey management. On September 9, 2002, the State Bank sent the copy of Master Swap Agreement to all banks for signature and advised them to return the same to the SBP latest by end of September 2002.
VIII. Having received representations regarding imposition of fines from exporters for non-fulfillment of their export orders as per respective schedules due to adverse global effects and other abnormal situations with specific reference to Pakistan, the State Bank, in September 2002, made certain relaxations in Export Finance Scheme.
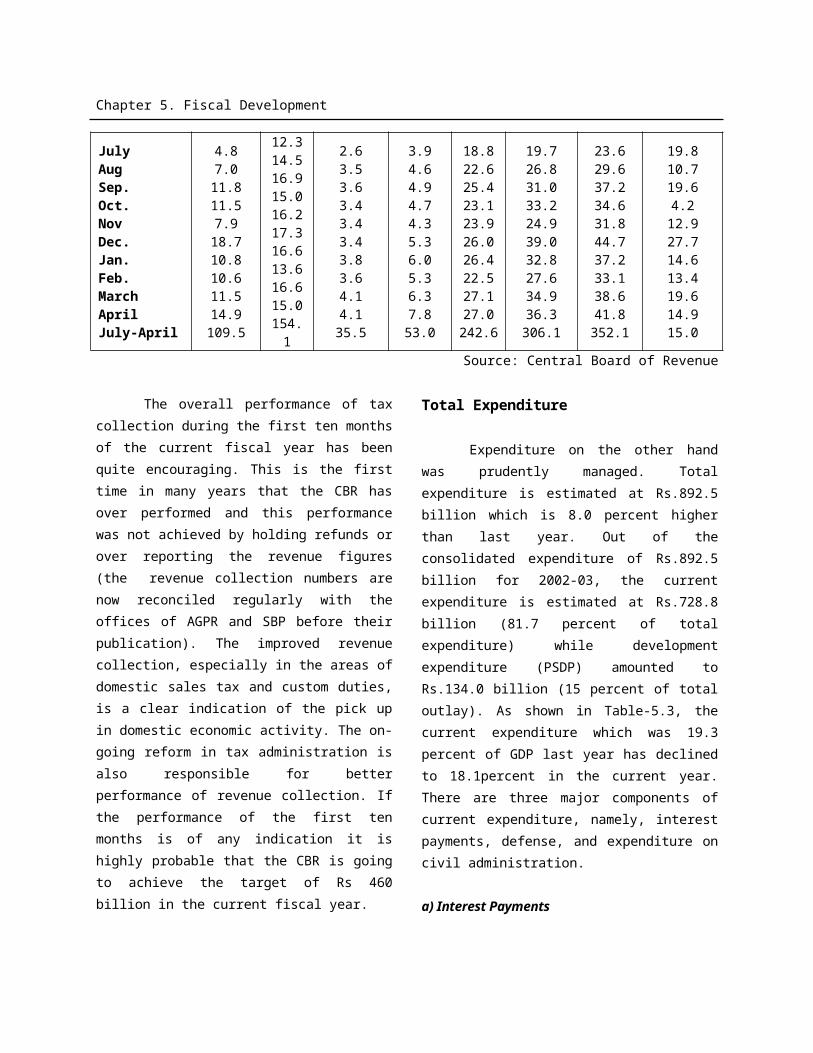
Chapter 6. Money and Credit
IX. Effective from 16th September 2002, the maximum profit to be earned by a financial institution on financial assistance to be extended under part-A (Local Sales) of the Scheme for financing Locally Manufactured Machinery was reduced from 11% to 10% p.a. and SBP refinance rate from 9% to 8%.
X. In October 2002, the State Bank advised banks that the auction of Government of Pakistan Market Treasury Bills (MTBs) would continue to be conducted on alternative Wednesdays. However, 6-months MTBs would be offered in One Auction and remaining Maturities MTBs in the Other Auction.
XI. Effective 14th October, 2002, the State Bank also allowed certain relaxations to the exporters of Hosiery/Knitwears, Rice and Hand Knotted Carpets under Part-II of the Export Finance Scheme.
XII. On 14th October 2002 the State Bank of Pakistan issued Prudential regulations for Microfinance Institutions/Banks replacing the existing Microfinance Bank Rules, 2000 with the objective to ensure that the MFIs/MFBs operate in a safe and prudent manner. These Regulations would be applicable on operations of Micro-finance Banks/Institutions, including Khushhali Bank.
XIII. To facilitate banks to deal with loans in loss category, which were outstanding on the books of banks since long and for which the probability of recovery was almost negligible, the State Bank of Pakistan advised banks on October 15, 2002 a new set of guidelines developed in consultation with the banks and Federation of Pakistan Chambers of Commerce and Industry (FPCCI).
XIV. Effective from 18th November 2002, the minimum rate of return to be paid by recipients of financing facilities from State Bank for meeting temporary liquidity shortages and SBP 3-day Repo facility against Government of Pakistan Market Treasury Bills and Federal/Pakistan Investment Bonds was reduced from 9 percent to 7.5 percent on annual basis.
XV. On December 3, 2002, the State Bank issued an updated Branch Licensing Policy to the banks for implementation and consolidating all the instructions previously issued relating to Branching Licensing Policy and Automated Teller Machines (ATM).
XVI. In order to promote Islamic Banking in Pakistan, on 1st January, 2003, State Bank advised banks which are interested in establishing scheduled Islamic Commercial Banks in the private sector subsidiaries or stand alone branches
Chapter 6. Money and Credit
for Islamic banking to apply to Director, Banking Policy Department within the policies prescribed by SBP.
XVII. On 17th January 2003, State Bank of Pakistan issued a consolidated and updated version of the instructions to be followed by banks with regard to margin restrictions.
XVIII. Effective from 1st February 2003, the State Bank reduced the rate of mark up for commodity operations of the Government and other agencies from 12% to 9.5% per annum. As regards the rate of mark up on wheat procurement by the private sector, it was advised that banks might provide financing facility to the private sector on a market-based rate of mark up linked with T. bill rate.
XIX. Under the legal framework for micro-finance institutions, the Microfinance Banks/institutions can undertake mobile banking operations. The guidelines, interalia, provided for opening of Service Centers within a specified radius of the licensed branch, with prior permission from SBP.
XX. The State Bank, on February 24, 2003, clarified to banks that export refinance facility may be allowed against export of ‘Henna Powder’ under the Export Finance Scheme.
XXI. In order to improve efficiency in the credit appraisal process of banks/DFIs, on February 25, 2003, State Bank of Pakistan informed banks of making Credit Information Bureau (CIB) facilities online in collaboration with Pakistan Banks Association (PBA).
XXII. In the wake of significant changes in the financial sector, the State Bank on February 25, 2003 advised all banks/DFIs for an updated list of financial institutions regulated by the State Bank.
XXIII. In order to resolve the disputes that may arise between the borrowers and the banks/DFIs, the State Bank formed a Committee on 10th March 2003 to extend their fullest support to the said Committee to ensure early resolution of dispute.
XXIV. With the consolidation and strengthening of financial sector in the country, the State bank on March 12, 2003 issued minimum guidelines to be followed by banks/DFIs uniformly to structure and discipline the process of merger/amalgamation or local incorporation of banks.
XXV. Effective from 15th March 2003 the maximum profit to be earned by a financial institution on financial assistance to be extended under part-A (Local Sales) of
Chapter 6. Money and Credit
the Scheme for financing Locally Manufactured Machinery (LMM Scheme) was reduced from 10 percent to 7 percent and refinance rate from 8 percent to 5 percent.
Auction of Pakistan Investment Bonds (PIB)
Since the introduction of market oriented monetary policy in the late 1980s, the SBP has been pursuing open market operations (OMOs) in order to manage government debts and reserve money. In June 1998, the SBP introduced Market Treasury Bills (T. Bills) of 3 months, 6 months and 12 months maturity. The T. Bills are now the main instruments of OMOs. The fixed schedule of fortnightly OMOs was dismantled in July 2001 to give the SBP more flexibility in managing market liquidity. The move underlined the OMOs primary role as a liquidity management tool rather than an indicator of the SBP’s monetary stance. During the previous two fiscal years, the SBP often moved to inject liquidity into the market through OMOs in order to facilitate the commercial banks in their lending activities to the private sector. However, this support was not required during the outgoing fiscal year, as more than sufficient liquidity was available with the banking system even after credit to the private sector, picked-up from mid-November 2002. It may be noted that while the SBP was transacting forex swap, in net terms, this transaction did not mop-up any rupee liquidity from the market during 2002-03. On the other hand, foreign exchange purchases by the SBP remained a major source of rupee injection (about Rs 76 billion after sterilization).
The weighted average (W.A.) rates of return on 6 months and 12 months T.
Bills were as high as 15.41 percent and 16.00 percent, respectively on July 15, 1998 (Table-6.5). Thereafter, these rates witnessed mixed trends of movement. They came down as low as 7.23 percent and 7.78 percent on July 27, 2000 but again went up as high as 12.88 percent and 12.93 percent, respectively on June 28, 2001. To improve the investment environment in a tangible manner and attract foreign investors, the government decided to gradually and effectively reduce the T. Bills rates during 2001-02 alongwith rationalization of the rate of returns on the national savings schemes. Accordingly, the T. Bills rates of 6 months and 12 months maturity started coming down sharply since the beginning of the 2001-02. The rate of 6-months T. Bills witnessed a reduction of 645 basis points and 12 months, a reduction of 596 basis points respectively in 2001-02. During the first three-quarters of the outgoing fiscal year, they witnessed further cut by 476 basis points and 436 basis points respectively. As a result of sharp decline in 6 months T. Bill rate, the export refinance rate has also declined by 950 basis points to 3.5 percent since July 2001. Sharp reductions in T. Bills rate and discount rate are expected to spur investment activities in the economy.
Table 6.5
Auction of Market Treasury Bills (W.A.
Yield) 1998-03 (Percent)Date 6 Months 12 Months15-07-1998 15.41 16.00
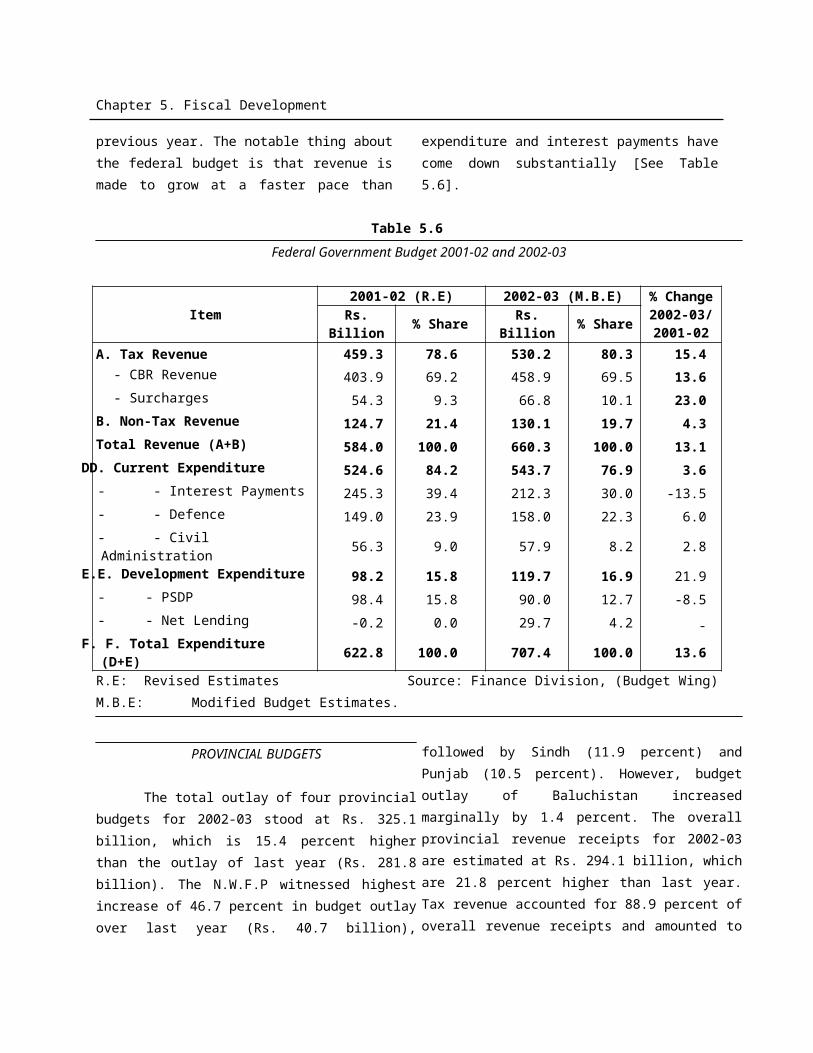
Chapter 6. Money and Credit
30-06-199901-12-199919-04-200027-07-200005-10-200012-12-200022-03-200130-05-200128-06-200126-07-200122-08-200131-10-200128-11-200127-12-200123-01-200206-02-200230-05-200211-07-2002August 2002October 2002December 2002February 2003March 2003April 2003
13.1710.167.137.23
10.4710.9611.5511.6012.8811.5810.478.508.267.936.355.646.436.276.406.344.323.192.091.65
13.0810.897.597.78
10.9111.4911.9511.9912.9311.9810.829.008.748.406.826.386.976.826.946.874.363.602.662.61
Source: State Bank of Pakistan
During 2001-02, the usual pressures on the forex
market were absent which provided sufficient
space to the SBP to improve the conduct of
OMOs. As a result, strong demand for T. Bills
was seen in 2001-02. The strong demand for T.
Bills continued unabated during the current fiscal
year also. This enabled the SBP to mobilize Rs
508.2 billion from the primary market of T. Bills
during the first nine months of the current fiscal
year as compared to Rs 211.8 billion in the same
period last year. During July-March 2002-03,
42.2 percent of the bid amount (Rs 1204.1
billion) was accepted by the SBP, as compared to
47.6 percent in the same period last year. A total
of Rs 1326.4 billion was offered including Rs
1204.1 billion under T. Bills of 3 months, 6
months and 12 months maturity and Rs 122.3
billion under Pakistan Investment Bonds (PIBs).
Out of this, an amount of Rs 551.9 billion was
accepted including Rs 508.2 billion under T.
Bills and Rs 43.6 billion under PIBs. Both
offered and accepted amounts were higher by
109.1 percent and 94.7 percent in the first nine
months of the current fiscal year as compared to
the amount offered and accepted in the same
period last year. (Table-6.6).
Table 6.6
Purchase and Sale of T.Bills
(Rs billion)
1. Market Treasury Bills (MTBs)2001-02 (July-March) 2002-03 (July-March)
Offered Accepted
W.A. Rate
Offered Accepted
W.A. Rate
a) 3 Months 104.6 61.5 8.8 69.7 28.7 3.9 b) 6 Months 197.6 98.2 9.1 624.3 307.5 4.2 c) 12 Months 144.4 52.1 9.2 510.1 172.1 4.8 Total MTBs 446.6 211.8 1204.1 508.22. Pakistan Investment Bonds(PIBs) a) 3 Years Maturity 36.5 16.2 10.4 20.1 7.7 5.4 b) 5 Years Maturity 37.3 15.7 11.2 37.7 11.2 6.0 c) 10 Years Maturity 114.0 39.7 12.2 64.6 24.7 6.8
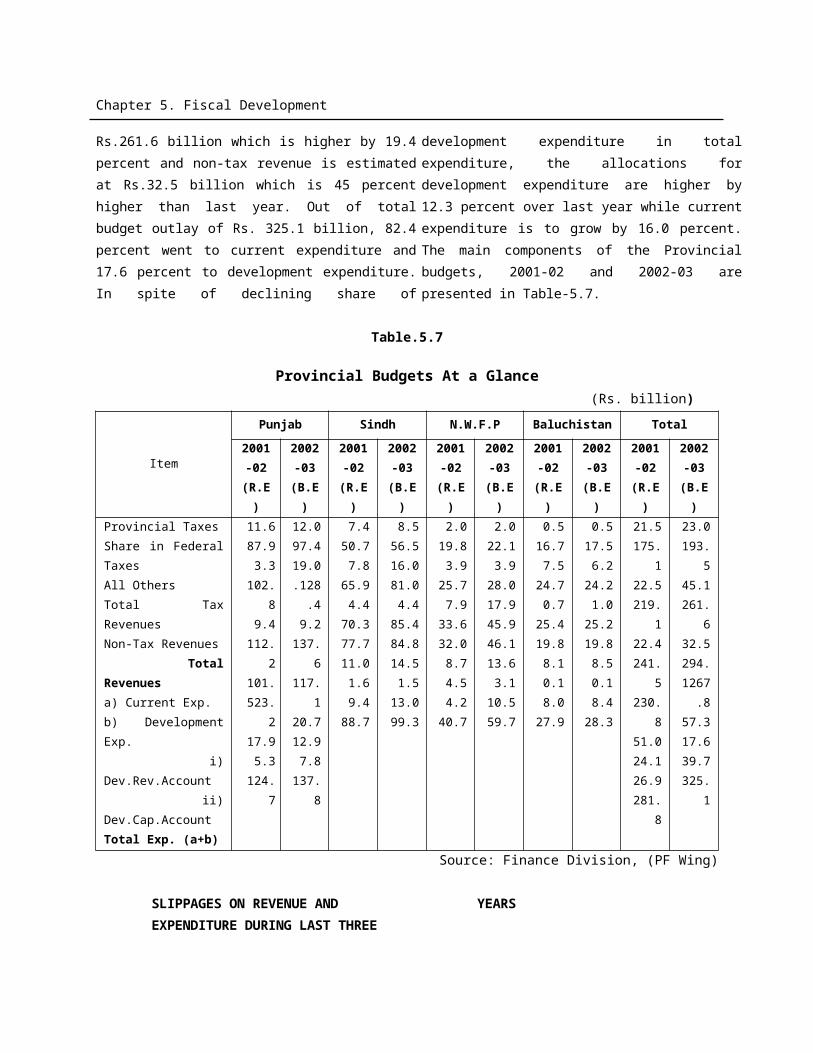
Chapter 6. Money and Credit
Total (PIBs) 187.8 71.6 122.3 43.6 Grand Total (Growth)
634.4 283.4 1326.4(109.1
%)
551.9(94.7%)
Source: State Bank of Pakistan
Interest Rate Environment
After pursuing a tight monetary policy in the previous years, the State Bank of Pakistan introduced a liberal monetary policy since the beginning of 2001-02 with a view to bolster investment activities in the country. This was done with the introduction of a two pronged strategy i.e. gradually lowering down the T. Bills rates and rationalising the deposits rates of the National Savings Schemes (NSS). This duel approach also continued in the current fiscal year. However, despite reduction in the T. Bills rates and NSS rates credit flow to the private sector was not forthcoming till November 2002. The sharp increase in credit off-take actually started after 150 basis points reduction in the discount rate on November 18, 2002.
The weighted average lending rates of
commercial banks have declined from 13.7
percent in June 2001 to 8.26 percent in March
2003 as a result of the successive cut in SBP
discount rate of 650 basis points since 2001-02 to
7.5 percent. At the same time, the weighted
average deposit rate has also declined from 5.0
percent to 2.81 percent during the same period
(see Tables-6.7, 6.8 & Fig:2). Thus, 5.48
percentage point cut in lending rate was made
possible by cutting down deposit rate by 2.19
percentage points by commercial banks. The
discount rate cuts to the extent of 650 basis
points have yet to produce desirable result in
bringing the spread (the difference between the
average lending and deposit rates) down to an
acceptable level of 3.0 percent. The spread
between the lending rates and the deposit rates is
one of the best yardsticks to measure the
efficiency of the banking sector. This spread has,
in fact, increased in Pakistan from 5.5 percent in
1994-95 to 8.4 percent in 2001-02. It is,
nevertheless, encouraging to note that banking
spread has considerably declined in the first nine
months of 2002-03, from 8.4 percent in June
7/15/1
998
11/17/1
9982/1
5/1999
4/21/1
9996/3
0/1999
12/1/1
9994/1
9/2000
7/27/2
00010/5
/2000
12/12/2
0003/2
2/2001
5/30/2
0016/2
8/2001
7/26/2
0018/2
2/2001
10/31/2
001
11/28/2
001
12/27/2
0011/2
3/2002
2/6/2
0023/2
1/2002
4/18/2
002 3
0/05/0
27/1
1/2002
Aug-0
2O
ct-02
Dec-0
2 F
eb 03
Mar-
03Apr-
03
1
3
5
7
9
11
13
15
17
Fig 1: Rate of Return on T.Bills (1998-03)
6 Months12 Months
Chapter 6. Money and Credit
2002 to 5.45 percent by March 2003 (Table-6.7
and Fig.3). The spread is expected to come down
further in the remaining months of the current
fiscal year.
Table 6.7Interest Rate Structure in the Country (Percent)
(July 2000 to March, 2003)(Weighted Average Rate)
Lending Rate Deposit Rate Spread Libor T. BillsJuly 2000 13.30 6.80 6.50 6.887 7.23August 2000 12.66 6.63 6.03 6.831 7.38September 2000 13.22 6.58 6.64 6.761 8.14October 2000 13.97 6.57 7.40 6.721 11.00November 2000 13.95 6.65 7.30 6.678 10.92December 2000 13.88 6.52 7.36 6.208 10.96January 2001 14.23 6.37 7.86 5.361 10.96June 2001 13.74 5.00 8.74 3.827 12.88December 2001 13.45 5.62 7.83 1.983 7.93March 2002 11.97 5.30 6.67 2.332 6.44June 2002 13.12 4.73 8.39 1.948 6.44July 2002 12.17 4.02 8.15 1.863 6.40August 2002 11.56 4.31 7.15 1.815 6.40September 2002 11.96 3.93 8.03 1.751 6.37October 2002 11.48 3.97 7.51 1.618 6.34November 2002 10.66 3.87 6.79 1.471 4.76December 2002 10.31 3.60 6.71 1.383 3.84January 2003 9.95 3.21 6.74 1.383 3.19February 2003 9.36 3.04 6.32 1.270 2.09March 2003 8.26 2.81 5.45 1.262 1.65*
Source: State Bank of Pakistan* April 2003.
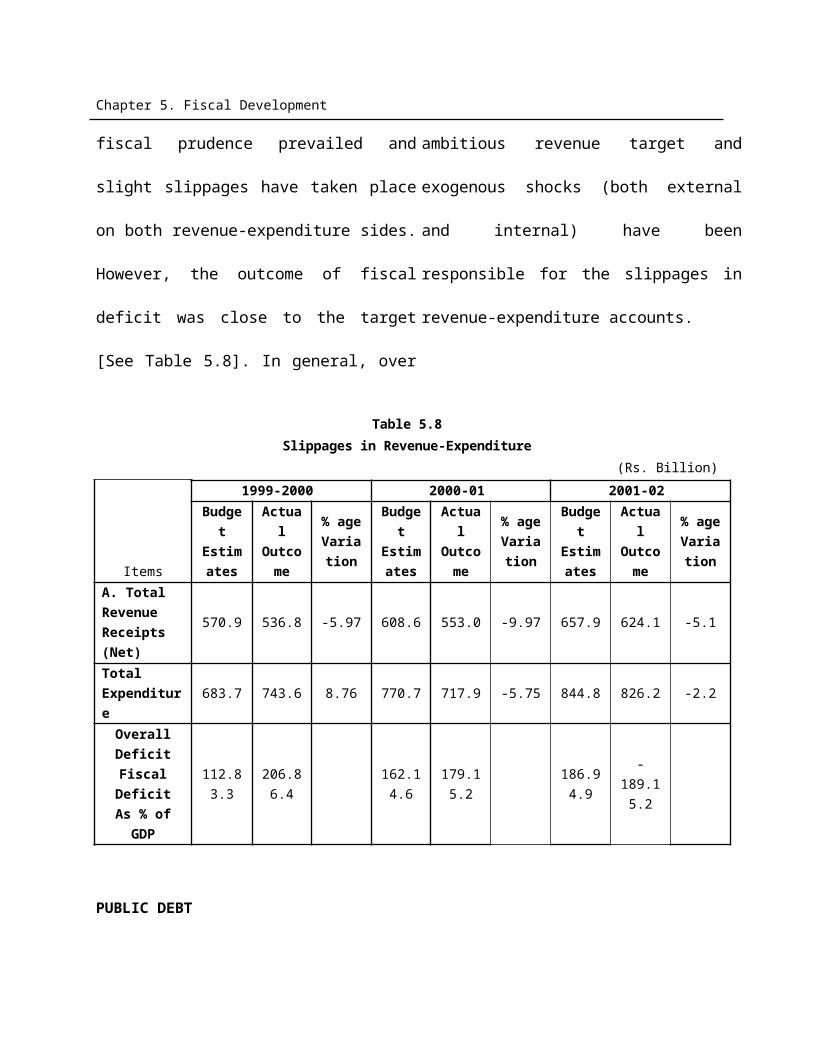
Chapter 6. Money and Credit
The reduction in lending rate was more pronounced in the case of foreign banks, which reduced their rates by 290 basis points since July 2002 to 7.86 percent by end February 2003. Pakistani banks reduced their lending rate by 283 basis points to 9.79 percent. Among Pakistani banks, the NCBs reduced their lending rate from 12.67 percent to 9.97 percent, privatized banks from 13.01 percent to 9.89 percent and private banks from 12.41 percent to 9.54 percent. However, the lending rate of specialized banks showed only marginal reduction during the period, which stood at 14.02 percent at end February 2003, compared with 14.14 percent in July 2002. In order to boost exports, the State
Bank also reduced rates under Export Finance Scheme and for export sales under scheme for Locally Manufacture Machinery (LMM). These rates are linked with the yield on 6 months TBs and SBP fix refinance rate on monthly basis. These rates also showed significant reduction. The SBP refinance rate, which was 6.5 percent in July 2002, reduced to 3.5 percent only in March 2003, reflecting a reduction of 300 basis points since July 2002. The decline in overall interest rate structure in Pakistan is consistent with the global decline in interest rate. The LIBOR was as high as 6.887 percent in July 2000. It has declined sharply to as low as 1.26 percent in March 2003.
Table 6.8
Lending and Deposit Rates (Percentage)
Chapter 6. Money and Credit
Weighted average lending rate
Weighted average deposit rate
Difference between lending & deposit rate
Nominal Real Nominal Real Nominal RealJune 1995June 1996June 1997June 1998June 1999June 2000June 2001
June 2002March 2003
13.714.414.615.614.614.013.713.18.3
0.73.62.87.88.910.49.39.64.9
8.28.28.58.48.05.95.04.72.8
-4.8-2.6-3.30.62.32.30.61.2-0.6
5.56.26.17.26.68.18.78.45.5
5.56.26.17.26.68.18.78.45.5
The nominal deposit rates after increasing marginally from 8.2 percent in June 1995 to 8.5 percent in June 1997, gradually declined to 4.7 percent in June 2002 and further to 2.8 percent in March 2003. The weighted average lending rate on the other hand increased from 13.7 percent in 1994-95 to 14.0 percent in 1999-00. However, since July 2001, the W.A. lending rate started coming down which stood at 13.1 percent in June 2002 and 8.3 percent in March 2003. Real deposit rates were negative during 1995-97, as real lending rates did not move with the movement in inflation rate. The main factors responsible for stagnancy in deposit rates were: increased administrative cost of financial institutions, overstaffing and increasing volume of non-performing loans and defaults. After showing positive trend during 1998-2002, the real deposit rate was negative in the current fiscal year, although the spread between lending and deposit rate has come down from 8.39 percent in June 2002 to 5.45 percent in March 2003. This indicates that depositors are not getting genuine returns on their savings with banks.
Performance of Banks
As a corollary of reforms in the banking sector, the number of loss making domestic bank branches continued to decline in the current fiscal. The number of domestic banks branches which were 7280 in June 2002, reduced to 7150 in March 2003. The number of foreign bank branches also came down from 78 in June 2002, to 75 in March 2003 (Table-6.9 and Fig: 3).
During the first nine months of the outgoing fiscal year, total assets of all the scheduled banks have increased by Rs 215.6 billion -- from Rs 1848.8 billion in June 2002 to Rs 2064.5 billion in March 2003 or by 11.7 percent. During the first nine months of 2002-03, there was an increase of Rs 29.7 billion in the net advances of the scheduled banks, which increased from Rs 810.1 billion in June 2002 to Rs 839.8 billion in March 2003 or by 3.7 percent. In the comparable period last year, net advances of the scheduled banks actually declined by Rs 15.2 billion. Net advances of the scheduled banks showed increase during the current fiscal year, except in the case of
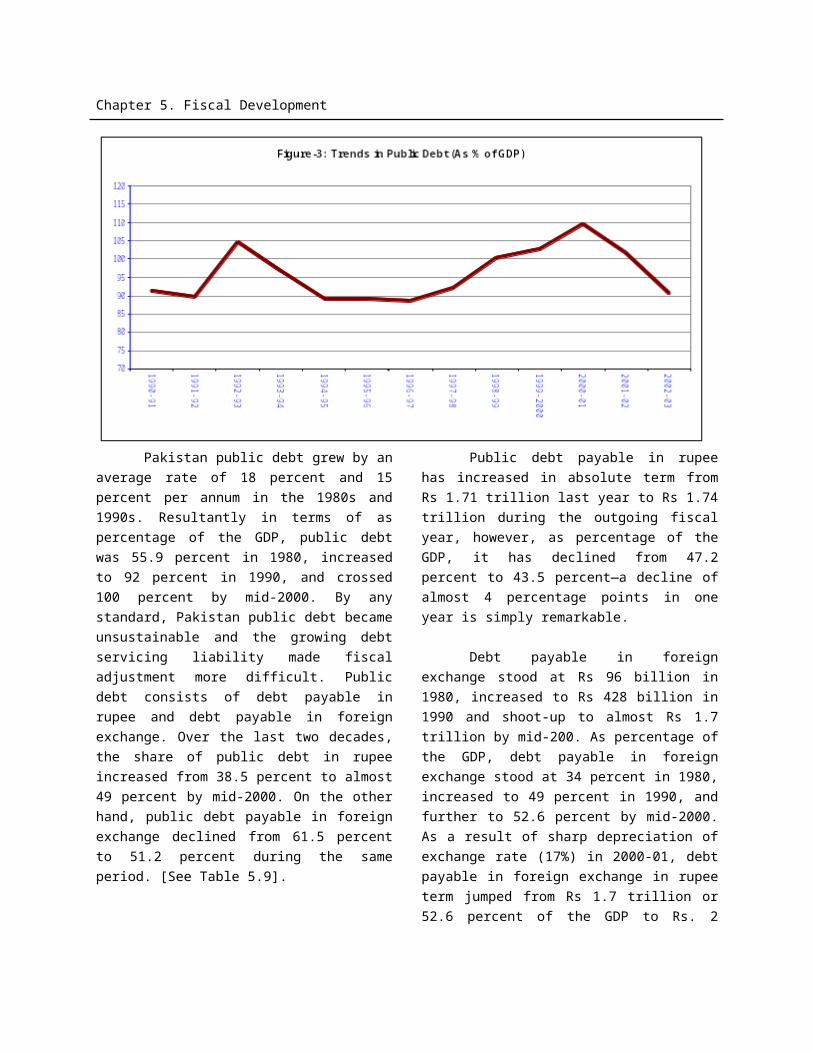
Chapter 6. Money and Credit
NCBs and specialized banks. The strong growth in net credit was a very welcome development for the banking industry, which had been forced by the continuing decline in interest rates (particularly on government securities), amidst increased market liquidity. Scheduled bank’s deposits have increased by Rs 192.7 billion in the same period, i.e., from Rs 1412.9 to Rs 1605.6 billion or by 13.6 percent. Higher deposits of the scheduled banks in the current fiscal year resulted partly due to extraordinary foreign exchange inflows in the country. Low premium between the kerb and inter bank exchange market has induced the overseas Pakistanis to use the official means for remitting foreign exchange. Total investment of all scheduled banks have also increased from Rs 471.3 billion in June 2002 to Rs 723.5 billion in
March 2003, showing an unprecedented increase of Rs 252.3 billion or by 53.5 percent. Highest increase in net investment was recorded in the case of denationalized commercial banks (Rs 127.4 billion) followed by nationalized commercial banks (Rs 68.1 billion) and Private banks (Rs 55.1 billion). Gross NPLs of the scheduled banks have increased from Rs 234.7 billion in June 2002 to Rs 242.2 billion in March 2003. Gross NPLs of NCBs and foriegn banks have declined during the period under review, while gross NPLs of DNCBs, private banks and specialized banks have increased. The SBP/Government have continued to encourage privatization of NCBs and merger of the weak financial institution with the large and sound financial institutions in the current fiscal year. It is worth mentioning that UBL was privatized in December 2002.
Table 6.9
Branches of Domestic & Foreign Banks (Numbers)
June 98 June 99 June 2000
June 2001 June 2002 March 2003
i) Domestic Banks
ii) Foreign Banks
iii) Total
8049
81
8,130
7973
85
8,058
7871
78
7,949
7272
80
7352
7280
78
7358
7150
75
7225
Source: State Bank of Pakistan.
Chapter 6. Money and Credit
Jun_98Jun_99
Jun_00Jun_01 Jun-02
Mar-036600
6800
7000
7200
7400
7600
7800
8000
8200
80497973
8185
78
Fig-3: Branches of domestic & foreign banks
Domestic Banks Foreign Banks
Num
bers
Recovery of Defaults and Non-Performing Loans
Loan defaults continuous to be one of the major problems of our banking system in general and Nationalized Commercial Banks and DFIs in particular, adversely affecting their growth and profitability. Net non-performing loans (NPLs) of all commercial banks, specialized banks, and DFIs have however, declined marginally during the ongoing fiscal year and stood at Rs 106.13 billion in December 2002, as against Rs 106.86 billion in June 2002. Net NPLs of all commercial banks have declined by 9.5 percent, from Rs 76.78 billion in June 2002 to Rs 69.45 billion in December 2002. Among the domestic banks, net NPLs of Nationalized Commercial Banks has markedly declined by 24 percent, from Rs 44.23 billion in June 2002 to Rs 33.62 billion in December 2002. Similarly net NPLs of private banks have come down from Rs 13.47 billion in June 2002 to Rs 11.73 billion in December 2002. Net NPLs of privatized banks have however, increased by 29 percent, from Rs 17.48 billion in June 2002 to Rs 22.54 billion in December 2002. Net NPLs of foreign banks which were very negligible, have declined by 2.7 percent
during July-December 2002-03. During the first half of 2002-03, the NPLs of specialized banks have increased by Rs 6.1 billion or 24.5 percent. Similarly net NPLs of DFIs have also registered an increase of 9.4 percent during the same period.
Micro Finance (MF) and Khushali Bank
The Government of Pakistan has launched a Micro Finance Sector Development Programme (MSDP) to reduce poverty in the country. The main objective of the programme is to provide a stable sectoral environment and creating institutional capacity to retail micro finance services to the poor. The Asian Development Bank is sponsoring the programme with soft lending of US $ 150 million. Khushhali Bank (KB) is the first micro finance bank established under the MSDP umbrella. It is a joint venture between public and private sector financial institutions. The share capital of the bank is Rs 5 billion. Its paid up capital of Rs 1.7 billion has been subscribed by 16 commercial banks, 14 private, including 2 foreign, and 2 public sector banks. The KB is designed to bridge the significant demand and supply gap in the micro finance market and increase the presently negligible outreach (5%) to the potential client base comprising over 6 million poor households in Pakistan. Within a period of just over 2 years of its commercial launch, the KB has established a network of 31 branches and 57 service centers in 35 districts across the country.
The bank’s service delivery design combines global industry standards and indigenous practices. The KB lending is
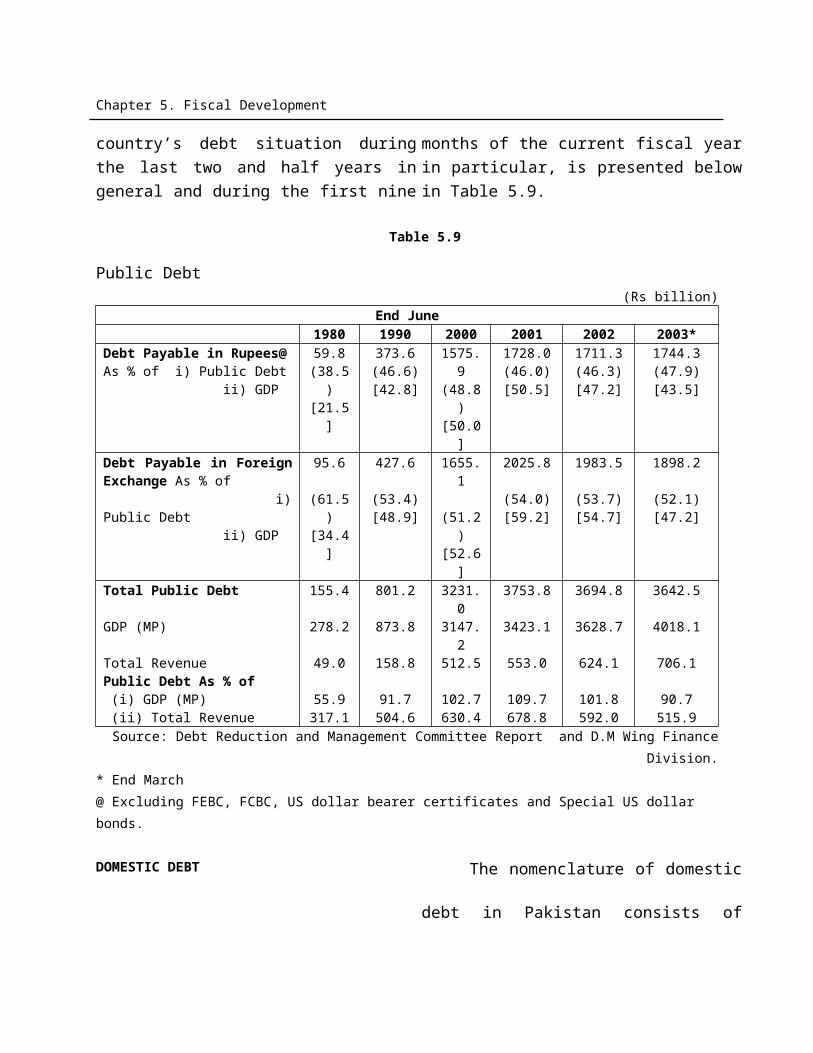
Chapter 6. Money and Credit
group/community-based through strengthening of the social collateral and peer pressure. Services are delivered at clients' ’doorsteps. The bank has serviced over 100,000 loans and disbursed Rs 1.2 billion across 75,000 poor households. Women constitute 35 percent of Bank’s clientele. The 70 percent of portfolio is spread against small sized farming and 30 percent against micro enterprise development. The KB has also mobilized nearly Rs 100 million in community savings. Nearly 80 percent on the lending activity remains in the rural areas and 20 percent in the urban areas with loans for agricultural inputs and live stocks, forming the major part. Currently, the KB generates savings at community level. In terms of credit and saving operations, the bank projects to access to over 560,000 households i.e. nearly 10 percent market by 2006. By the year 2006, net outstanding loans are projected at Rs 7.430 billion and deposits at Rs 1.74 billion. The bank’s social sector services package includes women development, capacity building services for skills development and provision of basic infrastructure services as health, education, drinking water, sanitation, communication etc. In order to fund social sector interventions, the bank has access to two endowment funds, namely, Microfinance Social Development Fund (MSDF) and Community Investment Fund (CIF), established at the State Bank of Pakistan. The CIF resources are used to provide grants up to Rs 150,000 for community level infrastructure development schemes.
Under the social sector services package, the bank has so far mobilized 90,793 households into 10,707 Community Organizations (COs) of which 3,889 COs are female. All COs were provided with basic training in various skills. Community based
infrastructure development operations were recently launched across network, projecting completion of over 1000 small development schemes in 2003. A Risk Mitigation Fund of $ 5 million has been set up to provide support to borrowers for replacement of income generating assets lost due to natural calamities as floods, droughts etc. As a part of safety net mechanism, a Deposit Protection Fund of $ 5 has also been established to provide insurance cover to small savers of Khushhali Bank.
First Micro Finance Bank Limited The First Micro Finance Bank (MFB)
Limited was granted license in January 2002 to operate as a country wide MFB in the private sector, under the MFIs Ordinance 2001. The bank has a paid-up capital of Rs 660 million. The bank has so far established a network of 10 branches, 7 in Northern Area and 1 each in Karachi, Islamabad and Rawalpindi. It has mobilized deposits/savings of more than Rs 112.95 million and extended loans of Rs 75 million to 2387 clients.
SME Bank
SME Bank Ltd was established in January 2002 by the Government of Pakistan to exclusively cater to the needs of the SME sector. The bank was created to address the needs of the niche market with specialized financial products and services that will help stimulate SME development in the country. The Government of Pakistan is the major shareholder. The bank is actively engaged to serve the SME sector by providing credit facilities and business support services all over the country. The bank provides financial assistance in the shape of working capital, medium long term
Chapter 6. Money and Credit
financing, leasing, program lending etc. It also provides technical assistance and support in areas of management, product innovation and development, quality control, acquisition of new technology, product positioning and marketing and development of bankable business proposals.
The bank has introduced specialized financial products and programme lending schemes under the brand name of ‘Hunarmand Pakistani’ that cater to a variety of credit needs for the SMEs. A large number of SMEs will now be financed under programme lending approach including fan manufacturing cutlery manufacturing surgical instruments doctors & dentists clinics women entrepreneurs CNG stations; auto looms (upgradation of power looms) and furniture manufacturing. Another four Hunarmand Pakistani Schemes for motorcycle rickshaw fruits and vegetables fisheries (boats & processing) OEM (original equipment manufacturers) will be introduced shortly.
With the above stated initiatives, the bank envisages financing of over 4000 SMEs involving financial assistance of Rs 2.00 billion during the year 2003. It is expected that the business planand lending activities initiated by the bank will go a long way in promoting the SME sector so as to enable it to significantly contribute toward achieving GDP growth target of 4.5 percent and supplement the recent initiatives of the Government to reduce unemployment and level of poverty in the country.
_____________________________
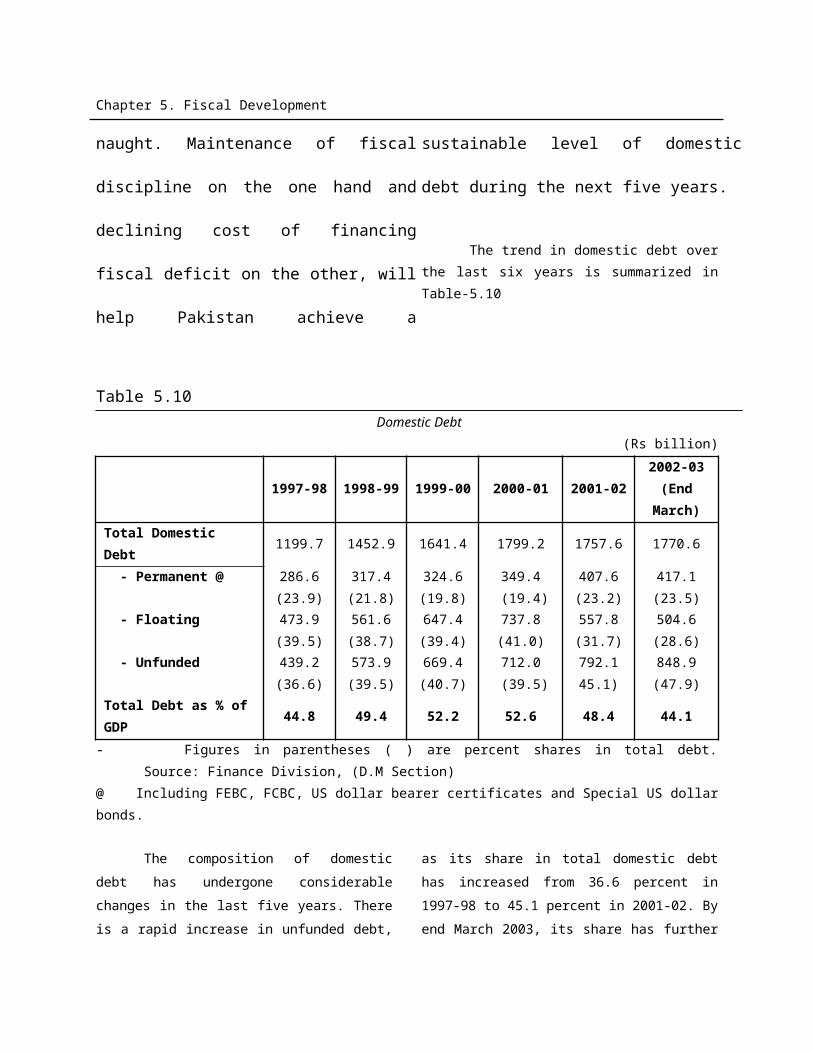
Chapter 7. Capital Market
7. Capital Market
Capital market is the heart and soul of the
financial sector. It is a vehicle whereby capital is
deployed from sources where it is in excess to
the sources where it is in short supply. The
capital market facilitates; (i) mobilization and
intermediation of private savings, and (ii)
allocation of medium and long-term financial
resources for investment through a variety of
debt and equity instruments of both private and
public sectors. It plays a crucial role in mobilizing
domestic resources and in channeling them
efficiently to the most productive investments.
The level of capital market development is thus
an important determinant of a country’s level of
savings, efficiency of investment, and ultimately
of its rate of economic growth. An efficient
capital market can also provide a wide range of
attractive opportunities for both the domestic
and foreign investors.
Pakistan has now a capital market with high degree
of integrity and transparency in terms of price discovery and
trade settlement. The observance of enhanced accounting
standards, reliable audits, institutional strengthening and
capacity building of the Securities and Exchange Commission
of Pakistan (SEC) have been the hallmark of the capital
market reform program. Pakistan is today largely compliant
with International Organization of Securities Commission’s
(IOSCO) 30 principles of securities regulation. The market
friendly measures introduced during the last three and half
years had a significant impact on investor confidence and the
stock market is no longer viewed as having any resemblance
with a casino, attracting only die-hard speculators. The
structural changes brought about by the government have
been quite successful in restoring investors’ confidence in the
equity market. The market has clearly attracted genuine
investment as is evidenced by the fact that actual settlement
has risen from about 1 to 2 percent of trades in the early part
of year 2000 to around 10 to 15 percent now. Although equity
issues have not picked up, there has been a significant
increase in debt capital issues, the aggregate amount of new
capital listed in the last two years being as much as Rs 30
billion etc. In Pakistan, the Karachi Stock Exchange is
playing a central and critical role in shaping the savings and
investment climate as it is the main window to ensure that the
market continues to grow and generate interest of investors
both within the country and abroad.
Pakistan’s stock markets have remained buoyant during the outgoing fiscal year 2002-03. The Karachi Stock Exchange, KSE-100, has witnessed a phenomenal growth in the first ten and half months of the current fiscal year, rising from 1770.1 points in June 2002 to 2902.4 points in April 2003 and thereafter to an all time magic high figure of 3003.4 points on May 16, 2003, registering an increase of 69.7 percent during the period under review as compared to a rise of 33.0 percent in the same period last year. The milestone was achieved because of the government’s macroeconomic policies, strengthened macroeconomic indicators, and the confidence of both local and foreign investors’ on the country’s economic policy and on the KSE. The aggregate market capitalization of the KSE has also surged 62.5 percent, rising from Rs 407.6 billion to Rs 662.5 billion during this period. In terms of US dollar, the market capitalization has increased by 73.0 percent, rising from $ 6.63 billion to $ 11.47 billion during the current fiscal year until May 16, 2003. In
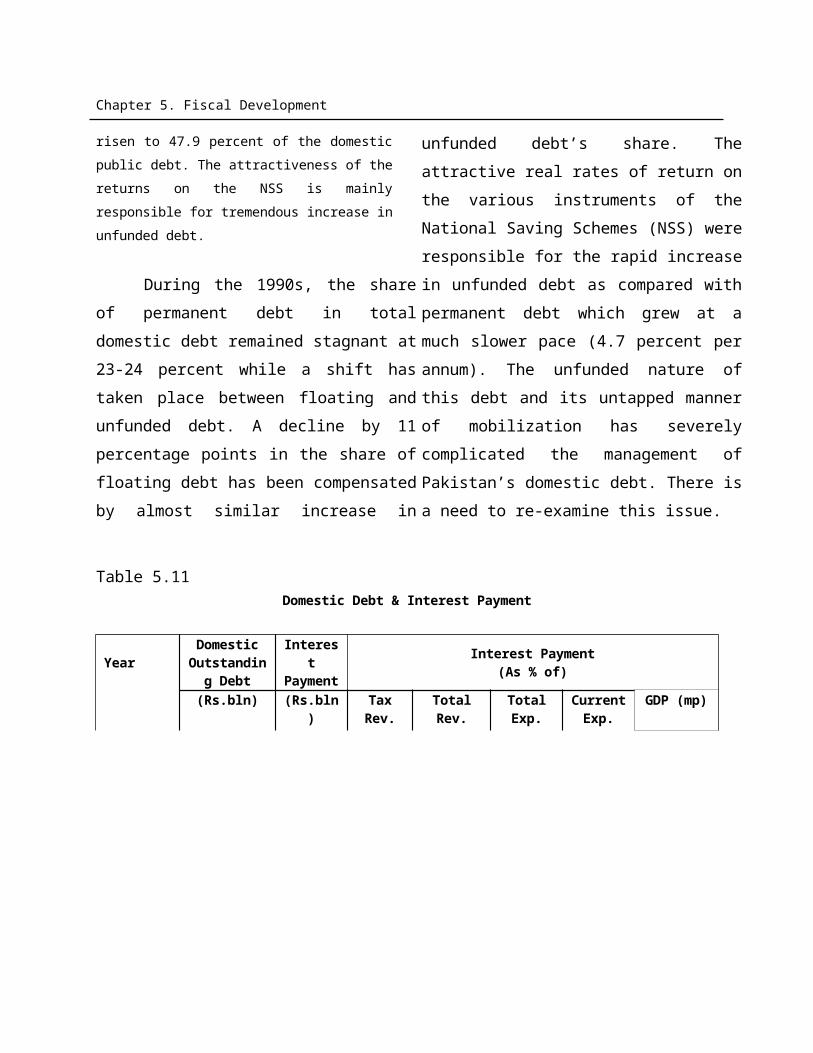
Chapter 7. Capital Market
terms of GDP (MP), the aggregate market capitalization has jumped from 11.2 percent to 16.5 percent during the same period. Yet another indicator of impressive performance of the Karachi Stock Exchange has been an extraordinary surge in monthly turnover of shares from 2.4 billion in 2001-02 to 4.0 billion during July-April of 2002-03. It may be noted that the average daily turnover of shares has increased from 74.3 million in 2001-02 to 104.7 million in the first two quarters of 2002-03 and further to 243.1 million shares in the third quarter of 2002-03.
After recording impressive performance in 2001-02 the KSE-100 index resumed its upward movement by second week of August 2002 amids rumors of strong corporate earnings by some index heavy weights (Lever Brothers, Shell Pakistan, PSO, Adamjee Insurance, HUBCO and PTCL). The KSE index increased by 14.0 percent or 249 points in the first quarter, 33.8 percent or 683 points in the second quarter and by 0.5 percent or 14 points in the third quarter of 2002-03. During April-May 16, 2003, KSE Index has further increased by 10.6 percent or 288 points.
The spectacular performance in the stock market during the outgoing year is attributable to a number of factors: (i) investment friendly policies being pursued by the government for revival of the national economy and restoring the confidence of the investors, (ii) substantial improvements in economic fundamentals, (iii) relatively cheap market valuations and the declining returns on alternative investments, (iv) huge forex reserves, rescheduling/write-off of debts by some big donor countries, especially the USA, (v) huge build-up of rupee liquidity driven in large by continuing forex inflows into Pakistan, that also pulled down interest
rates, (vi) strong presence of energy stocks in the market as energy sector enjoys about 30 percent weight in the KSE-100 share index and serves as one of the key drivers of the market, (vii) expectations of early privatization of some state enterprises and banks, (viii) policies on privatization, liberalization and deregulation have encouraged private investments having a profound effect on the activity of the stock market and (ix) the increased interest of foreign investors in the stock market. The upward movement has also been accelerated because of a democratically elected pro-reform government firmly in place since mid-December 2002. Moreover an emerging stable and improved bilateral relations between Pakistan and India has created a renewed bullish fervour in the month of May 2003.
The Central Depository Company of Pakistan (CDC) is now an integral part of the stock market in Pakistan and has completed five and half years of its operations. Over the years, the depository has been providing state-of-the-art settlement system. This has tremendously helped in promoting efficiency and transparency in the capital market. The National Clearing and Settlement System (NCSS) was launched on December 24, 2001 and the number of securities trades at NCSS is being gradually increased. The CDC also has a comprehensive arrangement with NCSS. The CDC continues to diversify its operations by adding more features and functionalities, which are synergetic to its core activity. During the year 2001, the CDC handled the first electronic de-merger of ICI Pakistan into two entities. Currently CDC is the trustee of three open-end mutual funds. These are: Pakistan Stock Market Fund, Pakistan Income Fund and United Money Market Fund. Currently, CDC has about 7,000 investor accounts, having more than
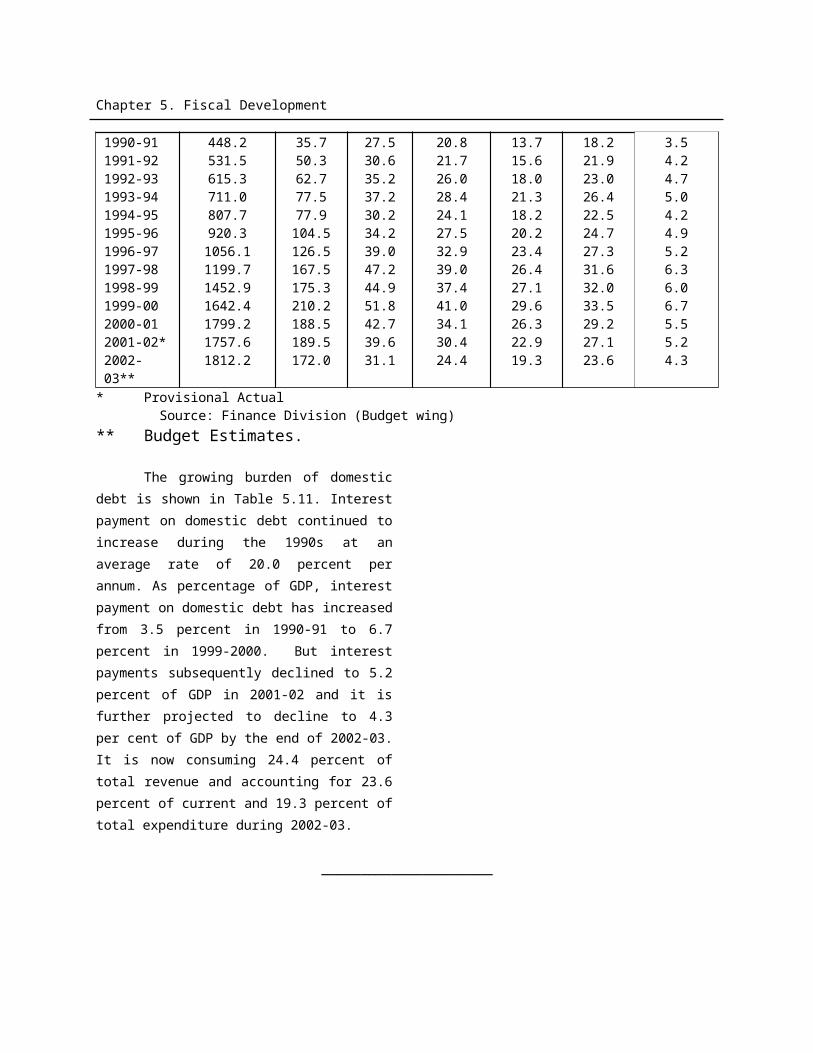
Chapter 7. Capital Market
1.2 billion securities. The implementation of T+3 settlement system has resulted in increased settlement volume, despite a 20
percent reduction in transaction fee effective from November 2001.
The monthly trends of the leading stock market
indicators are given in Table 7.1 and Fig: 1 (a) and (b)..
Table 7.1
Leading Stock Market Indicators on KSE(KSE Share Index: November 1991=1000)
Months2001-02 2002-03
(July-May)KSE Index
(end month)
Market Capitalization (Rs billion)(end month)
Turnover of Shares
(bn)
KSE Index(end
month)
Market Capitalization (Rs billion)(end month)
Turn-over of
Share (bn)
July 1228.9 311.3 1.2 1787.6 412.5 1.6August 1258.4 314.9 1.5 1974.6 450.8 3.1September 1133.4 282.8 0.7 2018.8 458.3 2.7October 1406.1 340.2 3.6 2278.5 535.4 4.3November 1358.2 326.2 1.8 2285.9 513.6 3.9December 1273.1 292.9 0.9 2701.4 588.4 6.8January 1620.2 345.0 3.7 2545.1 554.8 9.1February 1766.0 390.0 4.1 2509.4 542.2 2.1March 1868.1 427.9 3.9 2715.7 603.0 2.7April 1899.0 424.7 3.0 2902.4 637.0 4.4May 1663.3 383.3 2.6 3003.4* 662.5* 1.9*June 1770.1 407.6 2.0 - - -Average 1520.4 353.9 2.4 - - -
* May 16, 2003 Source: Karachi Stock Exchange
Chapter 7. Capital Market
Ju
l(01
-02
)
Au
g
Se
pt
Oc
t
No
v
De
c
Ja
n
Fe
b
Ma
r
Ap
r
Ma
y
Ju
n
Ju
l(02
-03
)
Au
g
Se
pt
Oc
t
No
v
De
c
Ja
n
Fe
b
Ma
r
Ap
r
Ma
y 1
6, 0
3
250
300
350
400
450
500
550
600
650
700
Fig 1. (b) Market Capitalization in KSE
Market Capitalization
Rs
. B
illi
on
It would not be out of place to mention that as a result of the unprecedented boom in Karachi Stock Exchange during the calendar year 2002, it was declared as the best performing market in the world. The surge in Pakistan’s equity markets during 2002 is undoubtedly the results of a significant turnaround in the economy in general and
external accounts in particular. During July-May 12, 2002-03 the Karachi Stock Exchange has also remained the best performing market among the leading stock markets in the world. As documented in Table 7.2 and Fig:2, out of 13 leading stock markets in the world, the KSE share index increased by 74.6 percent in terms of US dollar during July-May 12, 2002-03. The
Jul(01-02)
Aug
Sept
Oct
Nov
Dec
Jan
Feb
Mar
Apr
May
Jun
Jul(02-03)
Aug
Sept
Oct
Nov
Dec
Jan
Feb
Mar
Apr
May 16, 03
1000
1200
1400
1600
1800
2000
2200
2400
2600
2800
3000
3200
Fig 1. (a) Monthly KSE Share Index
KSE Share Index
Chapter 7. Capital Market
stock market of Sri Lanka posted a gorwth of 17.3 percent. The other 11 leading world stock markets recorded negative growth ranging from 1.9 percent (Malaysia) to 20.7 percent (Japan). With profitability in US dollar, standing
at 74.6 percent, Pakistan has been the most profitable market in the region followed by Sri Lanka (17.3%) during the period under review. All other markets of Asia Pacific Region registered significant losses.
Table 7.2Regional Markets Index Change in USD during July-May 12, 2002-03
(Index level in USD)Index Level in Respective Currencies % Change in USD
12 May 2003 30 June 2002Pakistan 2973.31 1770.12 74.60Sri Lanka 844.29 711.36 17.32Malaysia 633.95 646.32 -1.91Indonesia 473.93 505.01 -2.67Thailand 383.49 389.10 -3.33India 2942.78 3244.70 -5.96Philippine 1061.40 1156.35 -11.06China 1531.87 1732.76 -11.59Singapore 1327.42 1552.98 -12.55Hong Kong 9155.57 10598.55 -13.61Korea 631.04 742.72 -14.15Taiwan 4261.02 5153.71 -20.14Japan 8221.12 10621.84 -20.72
Source: Elixir Securities Pakistan
Pakistan
Srilanka
Malaysia
Indonesia
Thailand
India
Philippine
China
Singapore
Hong K
ong
Korea
Taiwan
Japan
-25-20-15-10-505
101520253035404550556065707580
Fig-2: Regional Markets Index ( % Change) during Jul-May 12, 2002-03
% C
han
ge
in U
S $
Over the past three and half
BOXPolicy Measures and Progress
a) Improvements in Governance
In March 2002, the Security and Exchange Commission of Pakistan (SEC) has introduced the first Code of Corporate Governance for Pakistan, which was subsequently made part of the listing regulations of the three stock exchanges (Karachi, Lahore & Islamabad).
Chapter 7. Capital Market
years, the Securities & Exchange Commission of Pakistan (SEC) has been taking measures to restore confidence of the investors – both foreign and domestic in the capital market of Pakistan. The SEC ensures that the market functions in a smooth and transparent manner and is also vigilantly observing the market. Its regulatory mechanisms aim to minimize elements of systemic risk and other possible defaults on the one hand and promotes institutional strengthening/capacity building of various segments of the capital market on the other. The SEC has been actively pursuing a reform agenda since 2001 for the capital market. In this connection, several
initiatives were taken to further enhance market efficiency and investors confidence. The SEC carried out some amendments in the Article of Association of the stock exchanges to address sensitive issues, such as, conflict of interest in the management of bourses an “Undisclosed Trading System” where the identity of the buyer and seller are not disclosed. This is aimed at discouraging a “herd” culture where small investors try to mirror the activities of larger players in the hope of speculative gains rather than investing on the basis of stock fundamentals. Some important policy initiatives introduced by the SEC during 2002-03 are given in the box below;
In order to further improve the governance of the stock exchanges, the SEC has directed the stock exchanges to reconstitute their Boards such that five directors are elected from amongst the members by the general body of the exchange, four non-member directors to be appointed by the SEC and the Chairman to be elected by the Board from amongst the non-member directors.
For the expeditious resolution of investor complaints, the SEC has approved a two-tier arbitration procedure for the Karachi Stock Exchange (KSE), under which all claims and disputes exceeding Rs 0.5 million, which are not amicably settled otherwise, should be referred to the Advisory and Arbitration Committee (AAC).b) Risk Management Measures
In order to minimize market manipulation and ensuring a healthier and more transparent capital market, the SEC, in February 2002, approved the Regulations for Short Selling under Ready Market, 2002.
In order to further strengthen risk management at the exchanges, the Commission directed the stock exchanges to make some changes in the carry
Chapter 7. Capital Market
over transactions.
SEC ordered some amendments in the Article of Association of the stock exchanges to address the sensitive issues, such as, conflict of interest in the management of bourses.
Another important development in the stock market is the implementation of “Undisclosed Trading System”. On October 7, 2002, the KSE launched this trading system where the identity of the buyers and sellers is not disclosed.
All Carry Over Transactions (COT) are to be for a period of 10 days in order to mitigate the potential risk of the sudden withdrawal of massive funds from badla operations.
The SEC introduced an amendment in the Companies Ordinance 1984, under which the companies are now required to present their quarterly accounts to shareholders within one month of the respective quarter-end. Moreover, the penalty for the non-compliance of the provisions relating to auditing was increased from Rs 2,000 to Rs 100,000.
A “take over law” proposed by the SEC was promulgated on November 1, 2002.
Another significant reform was introduced in the Badla market. Badla providers were required to commit their funds to the market for 10 days. This is aimed at preventing an artificial liquidity crunch due to an abrupt withdrawal of financing from the market.
The Commission has directed the stock exchanges to ensure that the Investor Protection Fund and the Clearing House Protection Fund are fully funded by June 30, 2007.
The Market Monitoring & Surveillance Wing (MSW) has been set up within the Commission to facilitate initiatives in risk management. The MSW has two specific functions - monitoring the systematic risk at exchanges, and surveillance to detect general or specific instances of market abuse.
c) New Products/Developments
In order to regulate futures trading in the provisionally listed securities, in February 2002, the Commission approved the Regulations for Futures Trading in provisionally Listed Companies, 2002, for the KSE.
In May 2002, the Commission approved, in principle, the concept of an Over-
Chapter 7. Capital Market
the-Counter (OTC) market and the stock exchanges are currently in the process of drafting necessary regulations.
The Commission has approved the establishment of National Commodities Exchange Limited (NCEL), for trading in future contract in commodities. The NCEL is the first demutualized exchange and will be sponsored by the three stock exchanges of Pakistan.
The Commission has established a Vigilance Cell, which serves as a forum for protection of the small investors. The Cell’s priority is to eliminate basic anomalies in the stock exchanges’ business systems, procedures and relevant laws. During July-March 2002-03, 348 complaints were received out of which 177 have been resolved.
The Commission has published a series of “Investor Guides” to educate existing and potential investors about investment risks and rewards, importance of financial planning, and the rights and responsibilities of investors, as well as the recourse available to them.
Sectoral Performance
During the first nine months of the outgoing fiscal year, the KSE price index and aggregate market capitalization have increased by 53.4 percent and 47.9 percent respectively, as against their increase of 36.7 percent and 26.1 percent in the same period last year. Total turnover of shares on KSE was 36.2 billion in the first nine months of 2002-2003 as compared to 21.5 billion in the same period last year. Funds mobilized by the KSE during this period amounted to Rs 23.1 billion as compared to Rs 13.3 billion in the same period last year. All the 12 major trading groups on the KSE (cotton and other textiles, pharmaceuticals &
chemicals, engineering, auto & allied, cables and electric goods, sugar and allied, paper and board, cement, fuel and energy, transport and communication, banks and other financial institutions, and miscellaneous) recorded positive growth in their share indices, ranging from 1.7 percent (cement) to 79.8 percent (auto & allied). During the calendar year 2002, total profit before taxation of the 12 trading groups amounted to Rs 90.9 billion as compared to their before taxation profit of Rs 62.6 billion in 2001. Performance of leading trading groups and companies for the first nine months of the outgoing fiscal year is discussed below (Tables 7.3 to 7.5).
Table 7.3
Sectoral Performance on Karachi Stock Exchange (Percent)
Sector General Index Market Capitalization
AMC (Rs billion)*
July-March (Growth%)
July-March(Growth %)
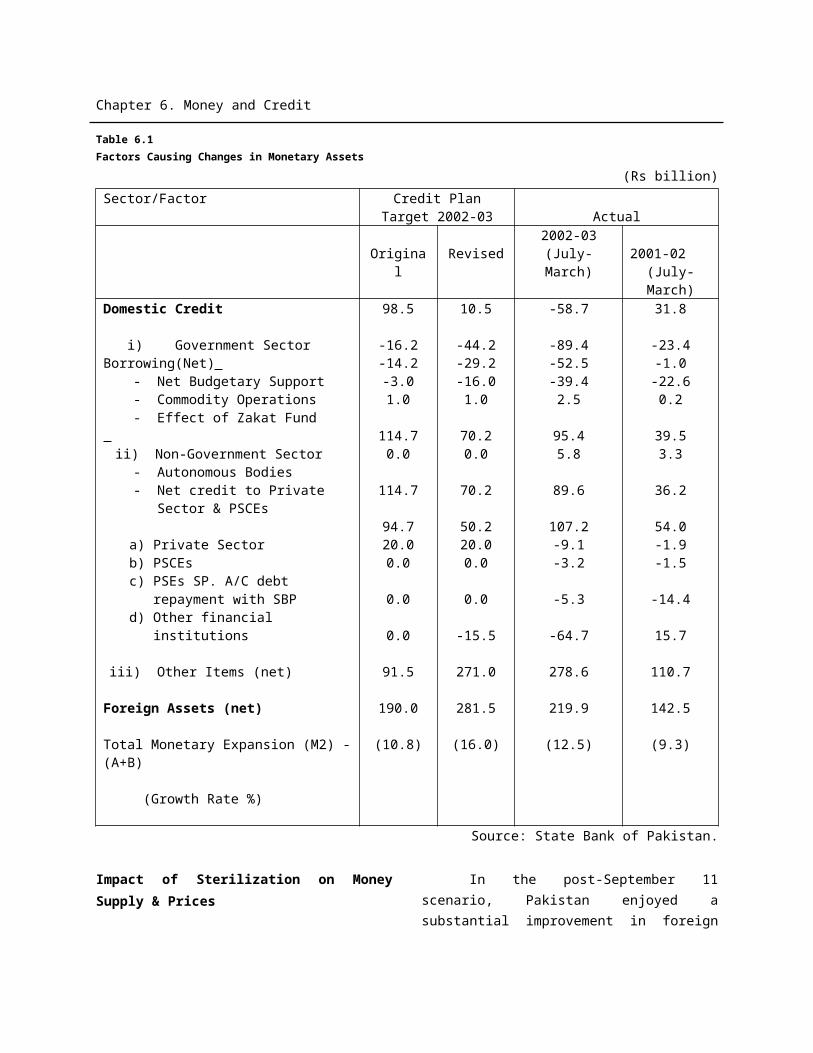
Chapter 7. Capital Market
2001-02
2002-03
2001-02
2002-03 2002*
2003*
1. Cotton and other Textiles 5.0 8.0 15.2 41.5 47.3
2. Chemicals & Pharmaceuticals
21.1 26.6 19.7 73.0 57.4 87.8
3. Engineering 34.0 32.6 30.5 45.9 2.0 3.04. Auto & Allied 14.3 79.8 23.7 107.1 9.8 21.15. Cables and Electrical
Goods32.1 19.2 2.2 30.8 2.2 3.1
6. Sugar & Allied 3.1 24.3 -3.0 12.5 4.4 5.17. Paper & Board 15.7 32.9 25.0 25.7 5.7 8.28. Cement 26.0 1.7 53.4 15.9 15.7 18.39. Fuel & Energy 20.6 44.0 44.1 54.7 114.8 161.610. Transport &
Communication21.5 57.7 12.7 74.1 79.8 122.0
11. Banks other Financial Institutions
11.7 28.6 41.5 33.1 54.3 73.2
12. Miscellaneous 8.2 22.2 21.9 16.6 40.5 52.213. Overall/Total 18.3 32.8 26.1 47.9 427.9 603.014. KSE Index 36.7 53.4 0 0 0 0
* End March 2002 and 2003. Source: State Bank of Pakistan
Cotton and Other Textiles: In this group, there are three sub-groups: (a) textile spinning, (b) textile weaving & composite, and (c) other textiles. There were 231 companies listed with KSE under this group. The share index of cotton and other textile recorded a growth of 5.0 percent during the first nine months of the current fiscal year as compared to a growth of 2.7 percent in the same period last year. Its market capitalization increased by 15.2 percent or by Rs 6.2 billion during July-March 2002-03 as compared to a rise of 8.0 percent (Rs 3.1 billion) in the same period last year.
Chemicals & Pharmaceuticals: A total of 37 companies were listed with KSE under this group at end December 2002. During the first nine months of the current fiscal
year, its share index increased by 26.6 percent as compared to an increase of 21.1 percent in the comparable period of last year. Its market capitalization stood at Rs 87.8 billion on 31st March 2003, showing a marked increase of 73.0 percent over June 2002 and 53.0 percent over March 2002.
Auto and Allied: A total of 25 companies were listed with the KSE under this group at the end of December 2002. During the outgoing fiscal year, auto and allied group showed the best performance so far among the 12 leading groups listed with the KSE. Its share index increased by 79.8 percent, while its market capitalization increased from Rs 10.2 billion in June 2002 to Rs 21.1 billion in March 2003, recording a spectacular growth of 107.1 percent. The group ranked top both
Chapter 7. Capital Market
in the growth of share index and market capitalization on KSE.
Sugar and Allied: Under this group, a total of 38 companies were listed with the KSE with a market capitalization of Rs 5.1 billion. Sugar and allied group is a minor player in the stock market although it has a weight of 8.6 percent in the production index of major industries. During the first three quarters of the current fiscal year, the share index of sugar and allied posted a growth of 24.3 percent as compared to a rise of 3.1 percent in the comparable period last year. Its market capitalization, however, increased by 12.5 percent.
Cement: At the end of 2002, there were 22 cement companies listed with the KSE. Its market capitalization stood at Rs 18.3 billion on March 31, 2003. Unlike the previous year performance of this group remained sluggish in the current fiscal year. Its share index has posted a growth of 1.7 percent only as compared to a growth of 26.0 percent in the same period last year. Its market capitalization has increased by 15.9 percent, as against a growth of 53.4 percent in the same period last year.
Fuel & Energy: A total of 25 companies were listed with the KSE with a market capitalization of Rs 161.6 billion as of 31st March 2003 constituting 26.8 percent of aggregate market capitalization (AMC). During the first nine months of the current fiscal year, its share index increased by 44.0 percent and market capitalization increased by 54.7 percent, as compared to their
growth of 20.6 percent and 44.1 percent respectively, in the same period last year. The group is one of the major players on the KSE. Energy sector has been identified as the engine of growth along with 3 other sectors, (agriculture, small and medium enterprises, and information technology) by the government. Hence its unprecedented growth is expected to promote more investment activities in the economy.
Transport & Communication: At the end of 2002, there were 9 companies of this group listed with the KSE. Its market capitalization increased to Rs 122.0 billion on March 31, 2003, from Rs 70.1 billion in June 2002, recording a growth of 74.1 percent during the first three quarters of 2002-03. Its market capitalization constituted 20.2 percent of the aggregate market capitalization (AMC) in March 2003 putting it as a major player on the KSE. Its share index increased by 57.7 percent in the period under review. The combined market capitalization of fuel and energy, and transport & communication was Rs 283.6 billion on March 31, 2003, which constituted 47.0 percent of AMC as compared to 45.5 percent on the corresponding date of last year.
Banks & Other Financial Institutions: This is the second largest group in respect of companies listed with the KSE. In December 2002, a total of 187 companies were listed with the KSE. There are 4 sub groups in this group: banks & investment companies, modarabas, leasing companies, and
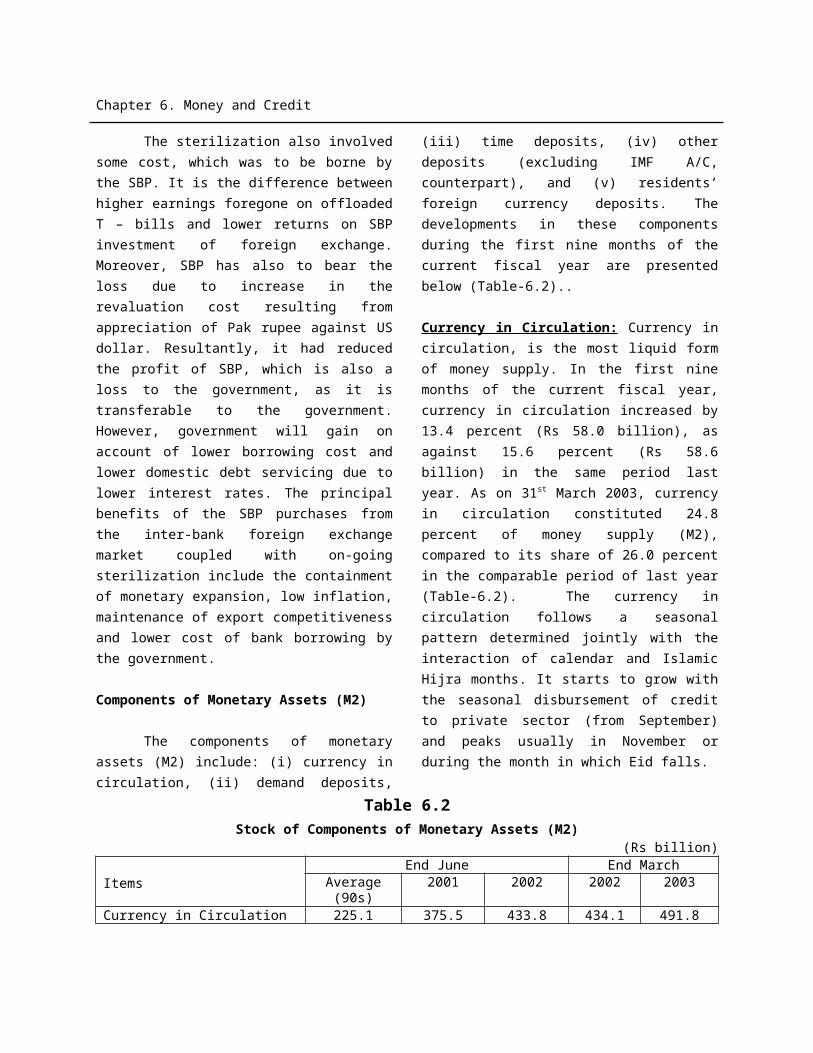
Chapter 7. Capital Market
insurance. During the current fiscal year, the share index and market capitalization of this group has increased by 28.6 percent and 33.1 percent respectively. Its market capitalization increased from Rs 55.0 billion in June 2002 to Rs 73.2 billion in March 2003.
Miscellaneous: The miscellaneous group includes five sub-groups: jute, food & allied, glass & ceramics, vanaspati & allied, and others. In December 2002, a total of 98 companies were listed with the KSE. Its share index and market capitalization posted growth of 22.2 percent and 16.6 percent respectively in the first nine months of the current fiscal year, as compared to their growth of 8.2 percent and 22.0 percent respectively in the same period last year.
In December 2002, 711 companies were listed on Karachi Stock Exchange, including 231 companies in cotton and other textile, 187 in banks and financial institutions, 98 in miscellaneous group etc. In the calendar year 2002, number of dividend paying companies was 306, as compared to 314 in 2001. 422 companies were making profit, listed with the KSE in 2002 as
compared to 423 in 2001. However during 2002 only 187 companies were shown as loss-making as compared to 226 in 2001. In 2002, the total before taxation profit of 12 trading groups, listed with KSE, amounted to Rs 90.9 billion as compared to a total pre-taxation profit of Rs 62.6 billion in 2001, thus showing a growth of 45 percent. Transport and communication earned a pre-taxation profit of Rs 33.9 billion in 2002 compared to its pre-taxation profit of Rs 27.1 billion in 2001. Banking and other financial institutions recorded a pre-taxation profit of Rs 20.1 billion in 2002 as compared to Rs 7.0 billion in 2001 recording a jump of 187 percent. Similarly pre-taxation profit of chemicals & pharmaceuticals witnessed an unprecedented increase of 268 percent, which rose from Rs 2.5 billion in 2001 to Rs 9.2 billion in 2002. Pre-taxation profit of cotton and other textiles slashed down from Rs 9.0 billion in 2001 to Rs 6.9 billion in 2002. Similarly pre-taxation profit of fuel and energy also come down from Rs 9.7 billion in 2001 to Rs 7.4 billion in 2002. In 2001, three groups incurred pre-taxation losses including engineering, sugar and allied, and cement. However, during 2002 only one group (sugar & allied) incurred a pre-taxation losses of Rs 0.5 billion. Infact, sugar and allied was the only group, which incurred pre-taxation loss both in 2001 and 2002. The group-wise number of companies and their performance is given in Table-7.4.
Table 7.4Companies Listed on KSE and their Before Taxation Profits
S. No
Name of Sector No. of Companie
s 2001 2002
Before Tax-ation Profit(Rs billion)
2001 2002
Dividend Paying
Companies2001 2002
Profit Making
Companies2001 2002
Loss making Companies
2001 2002
1. Cotton & other Textile
250
231 9.0 6.9 97 82 142 126 67 68
2. Chemical & Pharmaceutical
39 37 2.5 9.2 22 23 25 26 10 09
3. Engineering 16 13 -0.05
0.01 04 05 06 08 05 03
4. Auto & Allied 25 25 2.7 4.6 10 13 15 15 08 065, Cables & 14 12 0.4 0.6 04 04 06 05 03 03
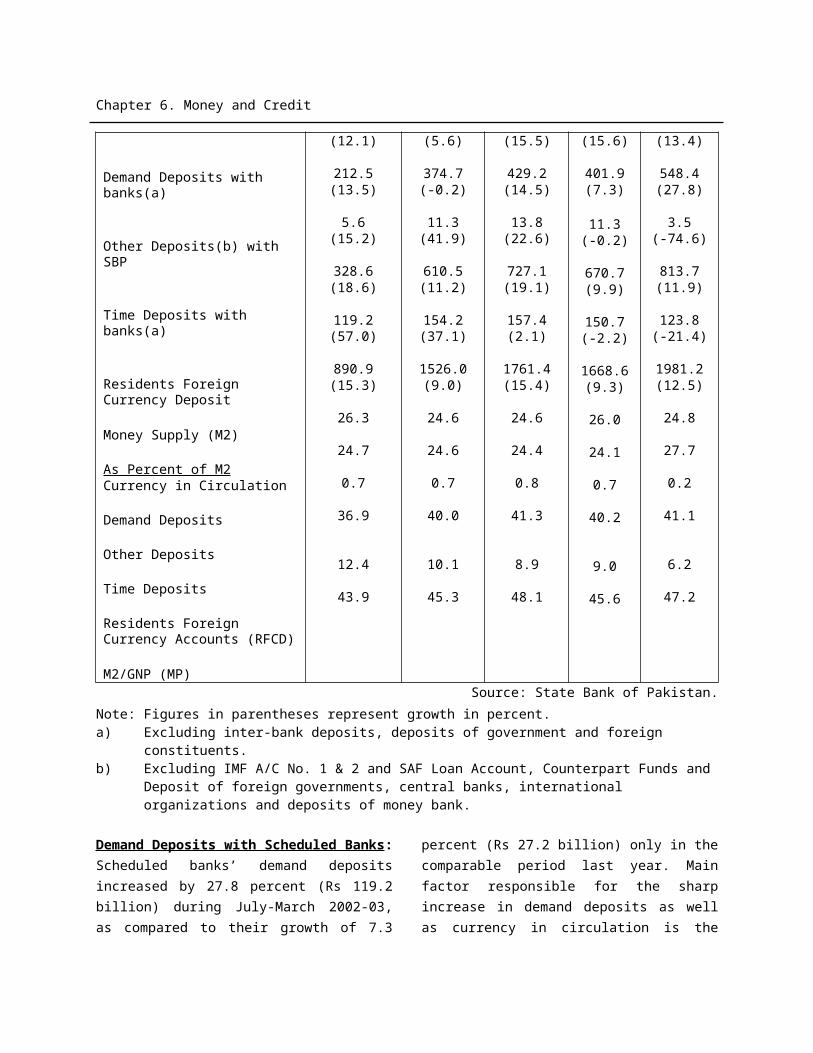
Chapter 7. Capital Market
Electric Goods6. Sugar & Allied 38 38 -0.7 -0.5 13 14 15 17 22 207. Paper & Board 14 14 1.2 1.7 07 07 11 10 02 028. Cement 21 22 -1.7 0.4 05 09 07 12 12 089. Fuel & Energy 26 25 9.7 7.4 17 16 19 18 05 0510.
Transport & Communication
08 09 27.1 33.9 04 03 04 06 03 01
11.
Bank & Financial Institutions
195
187 7.0 20.1 95 93 127 130 54 34
12.
Miscellaneous 101
98 5.5 6.6 36 37 46 49 35 28
Total 747
711 62.6 90.9 314 306 423 422 226 187
Source: Karachi Stock ExchangeThe business on KSE is primarily
influenced by some selected big companies including; Hub Power, PTCL, Pakistan State Oil etc. During the first three quarters of the current fiscal year, combined turnover of shares of seven big companies (Hub Power, PTCL, PSO, Sui Northern, FFC Jordan, and National Bank) was 6.78 billion, which constituted 18.7 percent of the total turnover of shares on KSE. These seven companies earned profit after taxation of Rs 34.5 billion in the current fiscal year up to March 2003 as compared to their after taxation profit of Rs 29.6 billion in the same period last year. Out of
Rs 34.5 billion after taxation profit, the PTCL’s share was Rs 19.8 billion representing 57.5 percent of the seven big companies. In the first nine months of 2001-02, the PTCL’s after taxation profit (Rs 18.15 billion) represented 61.3 percent of the seven companies. The average price-earning ratio of the seven big companies has increased from 6.67 percent in 2001-02 to 7.35 percent in the current fiscal year. This is indicative of the fact that business environment in the current fiscal year has improved over the last year. (Details in Table 7.5 while a profile of the KSE is given in Table 7.6).
Table 7.5Performance of Some Selected Blue Chips on KSE
Name of Company
Billion of Shares (July-March)
Profit after Tax (July-March) Rs billion
P/E Ratio (July-March)
2001-02 2002-03 2001-02 2002-03 2001-02 2002-03Hub Power 1.16 1.16 10.86 7.29 2.66 5.52PTCL 3.77 3.77 18.15 19.81 4.06 4.61PSO 0.14 0.17 2.25 3.19 9.98 10.92Sui Northern 0.50 0.50 1.34 1.89 5.23 6.46
FFC Jordan 0.33 0.81 -3.43 1.13 -0.66 7.99National Bank 0.37 0.37 0.46 1.15 18.76 8.59Total/Average 6.27 6.78 29.63 34.46 6.67 7.35
Source: Karachi Stock Exchange
Table 7.6
Profile of Karachi Stock Exchange1999-2000 2000-01 2001-02 2002-03
(July-March)
Chapter 7. Capital Market
a) ew Companies Listed
b) Fund Mobilized(Rs Billion)
c) Listed Capital(Rs Billion)
d) Turnover of Share( Billion Nos)
e) Average daily Turnover of Share (in million)
f) Aggregate Market Capitalisation (Rs Bilion)
1
8.9
236.4
48.1
202.1
392
4
3.6
235.7
29.2
122.5
339.2
4
15.2
291.2
29.1
158.6
407.6
1
23.1
299.3*
36.2
243.4
637.0*
* April 2003. Source: Karachi Stock Exchange.
Bullish business trends have also been witnessed during the outgoing fiscal year at the other two stock exchanges namely, the Lahore and Islamabad Stock Exchanges. The turnover of shares on Lahore Stock Exchange (LSE) during July-March 2002-03 was 19.5 billion compared to 11.7 billion shares in the same period last year. Total paid up capital with the LSE increased from Rs 246.3 billion in June 2002 to Rs 282.7 billion in March 2003. The LSE index, which was 297.5 points in June 2002,
increased to 496.6 points in March 2003. Market capitalization in LSE has increased from Rs 393.3 billion in June 2002 to Rs 595.8 billion in March 2003. Two new companies were listed during July-March 2002-03, as compared to four in the same period last year. The amount of fund mobilized at LSE by way of subscription was Rs 1.7 million in the first nine months of the outgoing fiscal year. A profile of LSE is given in Table-7.7.
Table 7.7
Profile of Lahore Stock Exchange 1999-2000 2000-01 2001-02 2002-03
(July-March)a) New Companies Listedb) Fund Mobilized
(Rs Billion)c) Listed Capital
(Rs Billion)d) Turnover of Share
(Billion Nos)e) LSE Indexf) Market capitalization (Rs bln)
20.4
207.7
16.4
372.0365.9
32.5
226.2
7.8
273.5325.7
314.2
246.3
18.3
297.5393.3
21.7
282.7
19.5
496.6595.8
Source: Lahore Stock Exchange
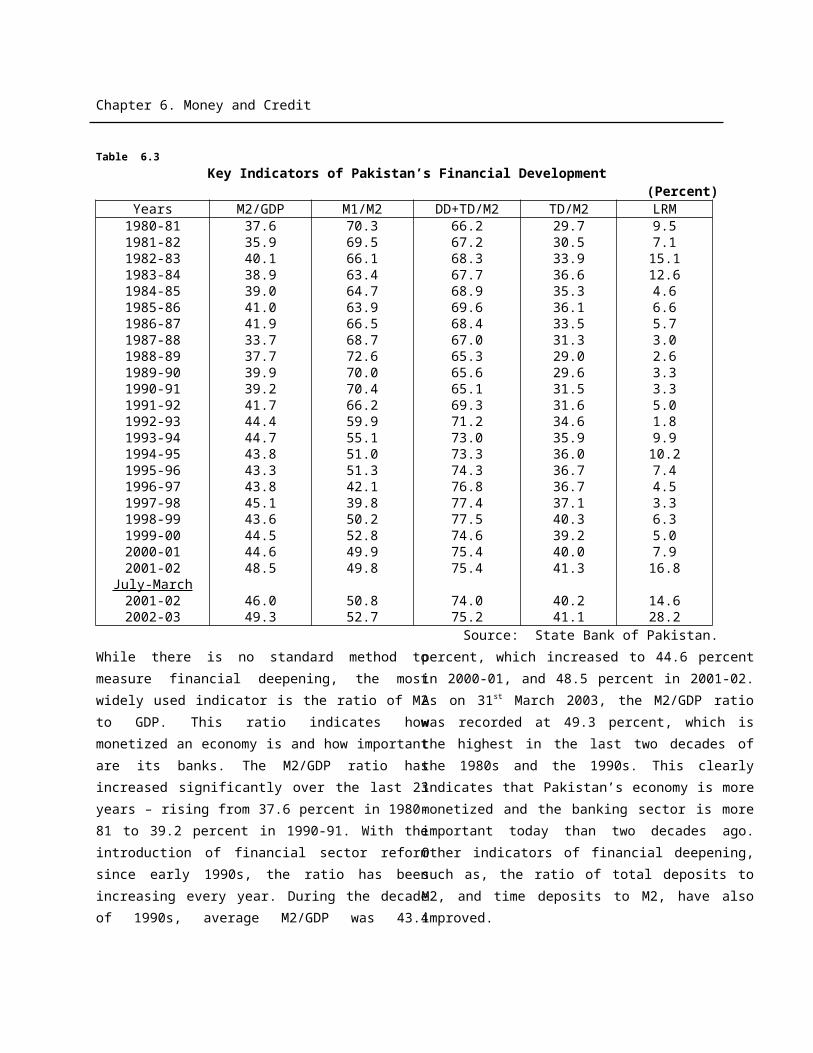
Chapter 7. Capital Market
The turnover of shares on the Islamabad Stock Exchange (ISE) was 1.30 billion during July-March 2002-03 as compared to 1.32 billion during the same period last year. The ISE price index has increased from 4684.0 points in June 2002 to 5924.5 points in March 2003, recording a growth of 26.5 percent. No new companies were listed and no fund was mobilized in ISE during the first nine months of the current fiscal year. The ISE started functioning in
August 1992 and within ten years, it has developed into a vibrant, efficient and stable market. Today, the ISE is one of the premiers Stock Exchanges of the country known for the highest standard for transparency in its operations, excellent risk management, dynamic market technology and lowest overall costs of listing. A profile of ISE is given in Table 7.8.
Table 7.8Profile of Islamabad Stock Exchange
1999-2000 2000-01 2001-02 2002-03(July-March)
a) New Companies Listedb) Fund Mobilized
(Rs billion)c) Listed Capital
(Rs billion)d) Turnover of Share
(In Billion Nos) e) ISE Index
00
-
3.1
5327.2
50.8
183.3
1.4
4374.2
13.7
183.4
1.70
4684.0
00
228.2
1.3
5924.5
Source: Islamabad Stock ExchangeTotal funds mobilized during July-March 2002-03 in the two stock exchanges (KSE & LSE) amounted to Rs 24.8 billion, as compared to Rs 17.7 billion in the same period last year. Total turnover of shares in the three stock exchanges during the first three-quarters of the current fiscal year was 56.9 billion, compared to 34.5 billion in the same period last year, recording an increase of 64.9 percent.
During the period under review, 17 companies offered Term Finance Certificates (TFCs) to the public in aggregate amounting to Rs 9.831 billion; whereas one company with paid-up capital of Rs 1.377 billion and 2 companies with paid up capital of Rs 0.100 billion were listed on the Karachi and Lahore Stock Exchanges, respectively. Furthermore, during the period under review, GOP disinvested additional shares of NBP amounting to Rs 0.373 billion. The
increasing number of TFC issues shows the interest of the investors in debt instruments as compared to equity issues. TFCs are gaining popularity among investors due to a number of factors viz. (i) attractive and guaranteed return and safety of principal amount invested; (ii) substantial fall in returns under various National Saving Schemes; and (iii) restrictions imposed on institutional investors for investing in NSS.
Development Finance Institutions (DFIs)
During 2001-02, the DFIs sanctioned total loans of Rs 4.6 billion against which they disbursed Rs 2.9 billion. In the first nine months of the current fiscal year (2002-03), sanctions and disbursements of loans by the DFIs for fixed investment finance to the private industrial sector were Rs 3.8 billion and Rs 1.9 billion respectively.
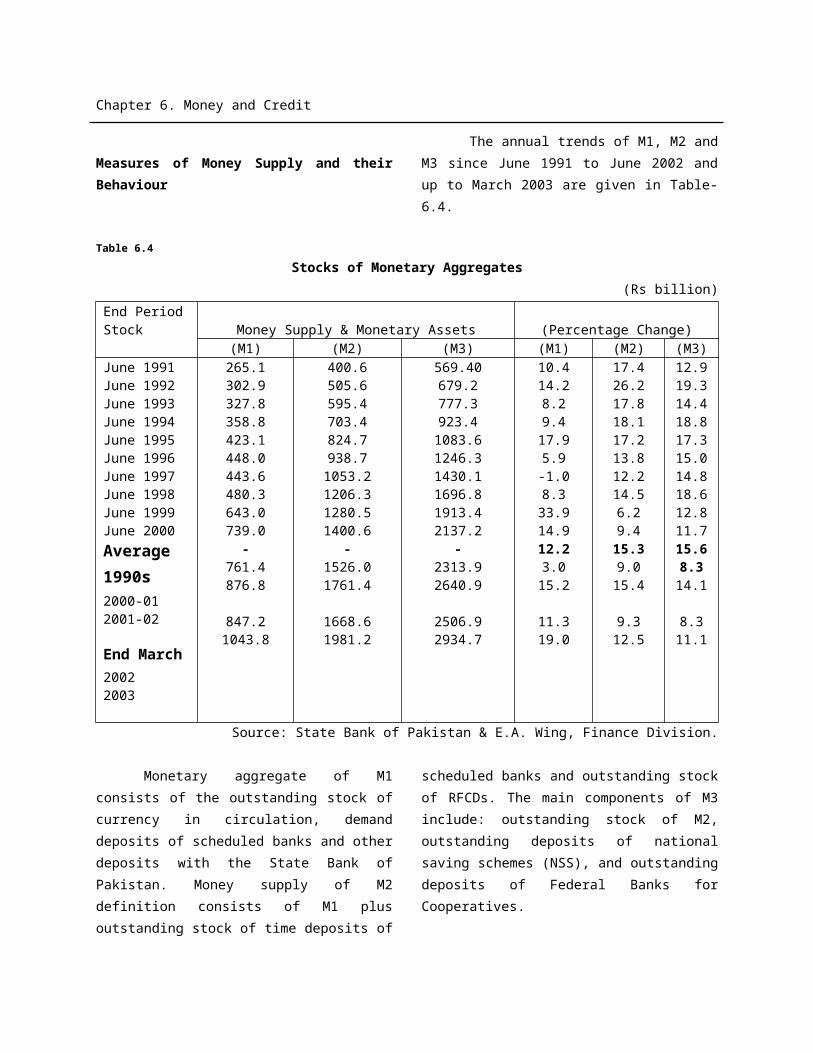
Chapter 7. Capital Market
The loans sanctioned and disbursed by the special banks during 2001-02 amounted to Rs 11.4 billion and Rs 11.3 billion, while, during the first nine months of the current fiscal year, their sanctions and disbursements amounted to Rs 8.2 billion and Rs 8.1 billion, respectively. In 2001-02, investment banks’ total sanctions and disbursements were Rs 4.8 billion and Rs 4.4 billion. In the first nine months of the current financial year, their sanctions and disbursements were recorded at Rs 4.3 billion and Rs 3.8 billion. Islamic banks sanctioned and disbursed Rs 4.0 billion and Rs 2.5 billion during 2001-02 while these were Rs 0.94 billion and Rs 2.21 billion during the first nine months of 2002-03. Total sanctions and disbursements of housing finance companies (HFCs) amounted to Rs 0.2 billion and Rs 0.10 billion respectively in 2001-02. During the first nine months of 2002-03, these were Rs 0.8 billion and Rs 0.5 billion respectively. The leasing companies sanctioned an amount of Rs 13.7 billion out of which they disbursed Rs 13.6 billion while modarabas sanctioned Rs 5.0 billion and disbursed Rs 4.9 billion, respectively during July-March 2002-03.
National Savings Schemes (NSS)
The Central Directorate of National Savings (CDNS) is an attached department of the Finance Division and performs
deposit bank functions by selling government securities through a network of 366 savings centers, spread all over the country. Till 1971, the activities of National Savings Department were merely promotional in nature where, post offices and commercial banks’ were operative agents for investment purposes. From 1972 onward NSS is engaged in the operations of various savings schemes through its own branches network. As of March 31, 2003, there were about 4.3 million investors with National Saving Schemes (NSS). The on-going savings schemes currently in operation are Defence Savings Certificates, Special Savings Certificates/ Accounts, National Deposit Certificates, Savings Account, Regular Income Certificates, Mahana Amdani Accounts, and Prize Bonds. A new saving scheme entitled “Pensioners’ Benefit Account” was launched during the current fiscal year.
During the fiscal year 2001-02, net deposits with National Saving Schemes increased to Rs 91.4 billion from Rs 51.1 billion in 2000-01. Out of Rs 91.4 billion, Rs 36.4 billion, (39.8%) were mobilized by Special Saving Certificates (Registered), Rs 22.0 billion, (24.1%) by Defence Saving Certificates, Rs 11.0 billion, (12.0%) by Regular Income Certificates, and Rs 11.6 billion, (12.7%) by Prize Bonds (Table 7.9 & Fig:3).
Table 7.9Net Accruals by National Savings Schemes
(Rs Billion)
1999-00
2000-01 2001-02July-March %
Change2001-02 2002-03
1. Defence Saving Certificates
41.2(43.1)
16.6(32.5)
22.0(24.1)
13.2(26.0)
14.7(19.9)
5.1
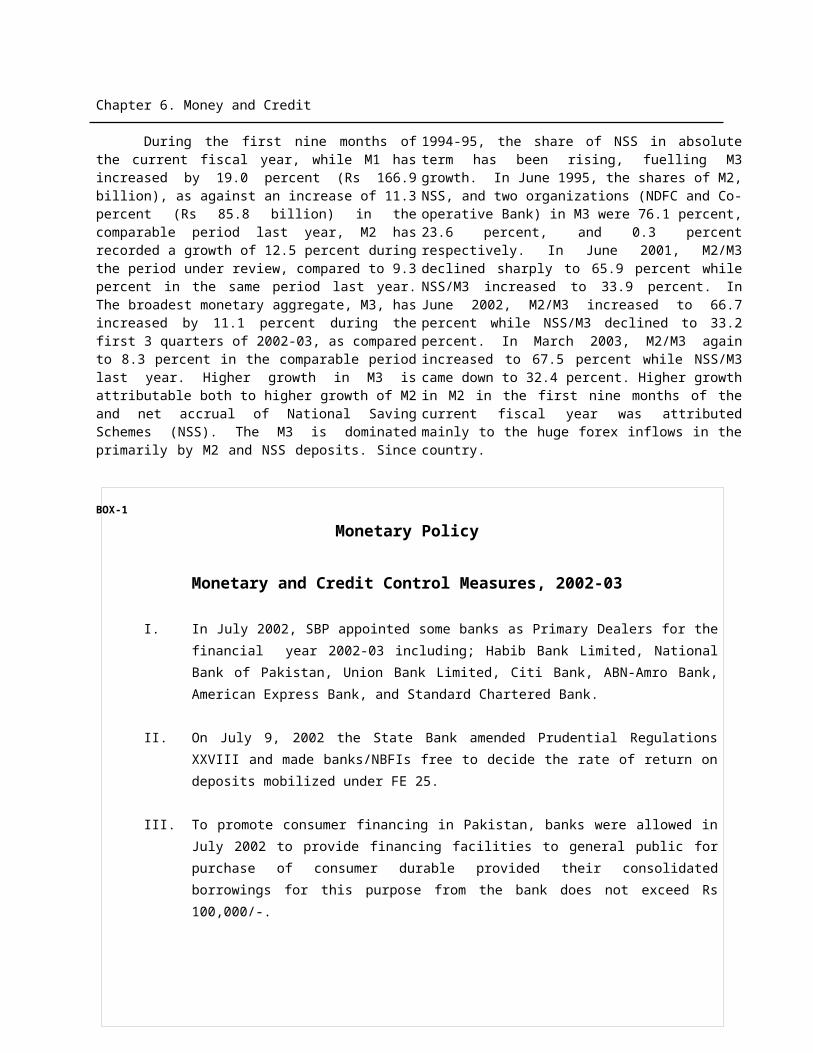
Chapter 7. Capital Market
2. Special SavingCertificates Registered
3. Regular IncomeCertificates
4. Special SavingAccounts
5. National Prize Bonds
6. Others
Grand Total
19.4(20.3)
26.1(27.3)
5.5(5.8)
-0.03(-0.03)
3.4(3.6)
95.5(100)
9.4(18.4)
8.6(16.8)
3.6(7.0)
10.4(20.3)
2.5(4.9)
51.1(100)
36.4(39.8)
11.0(12.0)
4.3(4.7)
11.6(12.7)
6.1(6.7)
91.4(100)
21.5(42.4)
7.8(15.4)
-0.2(-0.4)
6.9(13.6)
1.5(3.0)
50.7(100)
41.3(55.8)
-11.9(-16.1)
2.9(3.9)
18.0(24.3)
9.0(12.2)
74.0(100)
19.8
-6.3
6.1
17.5
50.7
8.4
Note: Figures within brackets represent share to total. Source: Directorate of
National Savings.
During the first nine months of the current fiscal year, total net accruals under NSS amounted to Rs 74.0 billion, as against the net receipts of Rs 50.7 billion in the same period last year. Special Savings Certificates (Registered) with Rs 41.3 billion and 55.8 percent share in the total net NSS accruals, gave the best performance during the first nine months of the current fiscal
year, followed by National Prize Bonds (24.3%) and Defence Saving Certificates (19.9%). However, unlike previous year, there was an actual decline of 6.3 percent (Rs 11.9 billion) in the case of Regular Income Certificates. The decline in Regular Income Certificates was due to huge withdrawal from this scheme. Huge withdrawal from the Regular Income
2000-01 2001-02 2002-03 July-March
-20
-10
0
10
20
30
40
50
16.6
22
9.4
36.4
8.6
10.4
Fig-3: Net Accruals of NSS
Def.Sav.Cert. Spl.Saving Certificates Regular Income Certificates National Prize Bonds
(Rs
Bil
lio
n)
Chapter 7. Capital Market
Certificates may be due to some comparatively better package available with other schemes including the newly launched Pensioners Benefit Account. It may be noted that deposits with Regular Income Certificates are taxable while in the case of some other schemes such as; Defence Saving Certificates, Special Saving Certificates and Pensioners Benefit Account (which mobilized bulk of the net deposits in 2002-03) accruals exceeding Rs 150,000 are taxable only.
The newly launched Pensioners’ Benefit Account specifically meant for the retired employees with ten years maturity. Profit on the scheme is payable on monthly basis reckoned from the date of deposit. The account can only be opened by a pensioner. The account can be opened with a minimum deposit of Rs 10,000/-and maximum deposit of Rs 1.0 million. Monthly profit of Rs 920/- is payable on a deposit of Rs 100,000/-, which works to 11.04 percent rate of return p.a. This rate is applicable on the accounts opened during the period from 1st January 2003 to 30th June 2003. The investment is exempt from compulsory collection of Zakat at source. These accounts can be opened only at the National Savings Centres.
The Government of Pakistan has reviewed the rate of return on National Savings Schemes in July 2002 and in January 2003. The return on Defence Savings Certificates has been fixed at 10.03 percent per annum (on maturity). The nominal deposit rates for saving schemes, which are presently in operation with NSS ranged between 5.0 percent (Savings Account) to 13.4 percent (Khas Deposit Schemes) with a weighted average rate of 8.8 percent. With an inflation rate of only
3.4 percent, the real deposit rates during July-March 2002-03 ranged between 1.6 percent (Saving Accounts) to 7.64 percent (Pensioners Benefit Account) with a weighted average real rate of 5.4 percent.
In the current year, the real rates of return under the NSS were still attractive as compared to other deposit schemes. Since the weighted average real deposit rates of the schedule banks remained low (around 2.8%), the NSS still offers the most attractive rate of returns to the depositors. This is the main reason why net accruals under the NSS have increased by 46.0 percent in the first nine months of 2002-03, over the same period of last year.
Returns on National Savings schemes,
which are linked with respective maturity yields
on PIBs, have declined significantly since July
2001. For example, yield on Defence Savings
Certificates declined by 497 basis points to 10.03
percent while return on 3 years Special Saving
Certificates has shrunk by 403 basis points to
8.67 percent. More importantly, the weighted
average return on National Savings Schemes has
declined from the average of 15.8 percent in
1995-2000 to 12.3 percent by end June 2002 and
further to 8.8 percent by end March 2003---a
decline of 700 basis points in about three years
(Table 7.10). The 6-month Treasury Bills rate has
also declined significantly since June 2001,
indicating the easing of monetary stance by the
SBP. The 6 months T. Bills rate was as high as
12.88 percent in June 2001 but declined to as low
as 1.65 percent in April 2003---a decline of 1123
basis points in just 21 months. As a result of
sharp decline in months T. Bills rate, the export
refinance rate has also declined by 950 basis
points from 13.0 percent in July 2001 to 3.5
percent in March 2003.
Chapter 7. Capital Market
Table 7.10Nominal and Real Deposit Rates on Savings Schemes During 1995-2003
Scheme (Maturity) 1995-2000 2000-01 2001-02 2002-03Nominal Rate(p.a.
)
Real Rate
NominalRate (p.a.)
RealRate
NominalRate(p.a
.)
Real
Rate
NominalRate (p.a.)
RealRate
1. Defence Saving Certificates(10 Years)
2. National DepositScheme (7 Years)
3. Special SavingsCertificate, Registered (3 Years)
4. Special SavingsCertificate, Bearer (3 Years)
5. Regular IncomeCertificates (5 Years)
6. Khas DepositScheme (3 Years)
7. Mahana AmdaniAccounts (7 Years)
8. Saving Accounts (Running Accounts)
9. Pensioners’ Benefit Account (10 Years)
10. Prize Bonds (Running Account)
Weighted Average
16.6
13.0
16.6
14.0
16.1
13.4
14.9
11.4
-
10.8
15.8
8.7
5.1
8.7
6.1
8.2
5.5
7.0
3.5
-
2.9
7.9
15.0
13.0
12.7
12.4
12.5
13.4
12.3
7.8
-
6.0
12.6
10.6
8.6
8.3
8.0
8.1
9.0
7.9
3.4
-
1.6
8.2
14.1
13.0
12.7
12.4
12.5
13.4
12.3
7.8
-
6.0
12.3
10.6
9.5
9.2
8.9
9.0
9.9
8.8
4.3
-
2.5
8.8
10.03
13.00
8.67
12.36
9.12
13.42
10.41
5.00
11.04
6.00
8.8
6.63
9.60
5.27
8.96
5.72
10.02
7.01
1.60
7.64
2.60
5.4
Source: Directorate of National Savings, Finance Division.Average inflation was 7.9% during 1995-2000, 4.4% during 2000-2001; 3.5% during 2001-02 and 3.4% during July-March 2002-03.
Reforms of the NSS
In an attempt to restructure the National Savings Organization on modern
lines, computerization process is underway. Procedure of maintenance of record at National Savings Centres has been revised threadbare to ensure proper maintenance
Chapter 7. Capital Market
of record and to make it computer friendly. In this regard, National Savings Hand Book Vol-II has also been reviewed besides revision of national savings Hand Book Vol-I. About 150 National Savings Centres have been shifted to new buildings in proper localities with commodious accommodation. Pensioners’ Benefit Account has been introduced to facilitate the retired officials. The Special Savings Certificates and Defence Savings Certificates have been launched in the United Arab Emirates for the benefit of the Overseas Pakistanis and
to strengthen the reserves position of the Government of Pakistan. Training Institute of National Savings has been reactivated by establishing therein a computer lab and arranging computer-training courses for the officials of National Savings Organization. Due attention and importance is being given to the job of automation of National Savings accounts and the work is expected to be completed in line with the commitment of the Federal Government with the International agencies.
______________________
Chapter 8. Inflation
88. . Inflation
Introduction
It has often been suggested that a stable macroeconomic environment promotes growth by providing a more conducive environment for private investment. Being the key component of a stable macroeconomic environment low and stable inflation assumes greater importance. It is, therefore, essential that inflation rate be kept stable even when it is low.
Prices on the average can be rising, falling, or stable. Inflation is a process of rising prices. Inflation rate is measured as the percentage change in the average level of prices. Inflation rate rises and falls over the years but it rarely becomes negative. If the inflation rate is negative, it means the average price level is falling which is not good for the economy. A recent study suggests that some level of inflation is essential for promoting growth and investment. In other words, there exists a threshold beyond which inflation exerts a negative effect on growth. The threshold is lower for industrial than for developing countries. Notwithstanding the
existence of a threshold the goal of the macroeconomic policy should be to bring inflation down to single digit and keep it there.
Several costs of high and variable inflation have been identified. These costs typically arise from distortions in economic decision-making arising from high or variable inflation rates and result in lower levels of output than would otherwise be the case. High inflation is also a regressive and arbitrary tax, the burden of which is typically borne disproportionately by those in fixed income group and poor. Maintaining low and stable inflation should be seen as a necessary part of the poverty alleviation strategy. The key point is that price stability is not an end in itself; it is essential for sustaining higher economic growth - the single most important factor influencing poverty.
Price Indices
Four different price indices are published in Pakistan: the consumer price index (CPI), the wholesale price index (WPI), the sensitive price index
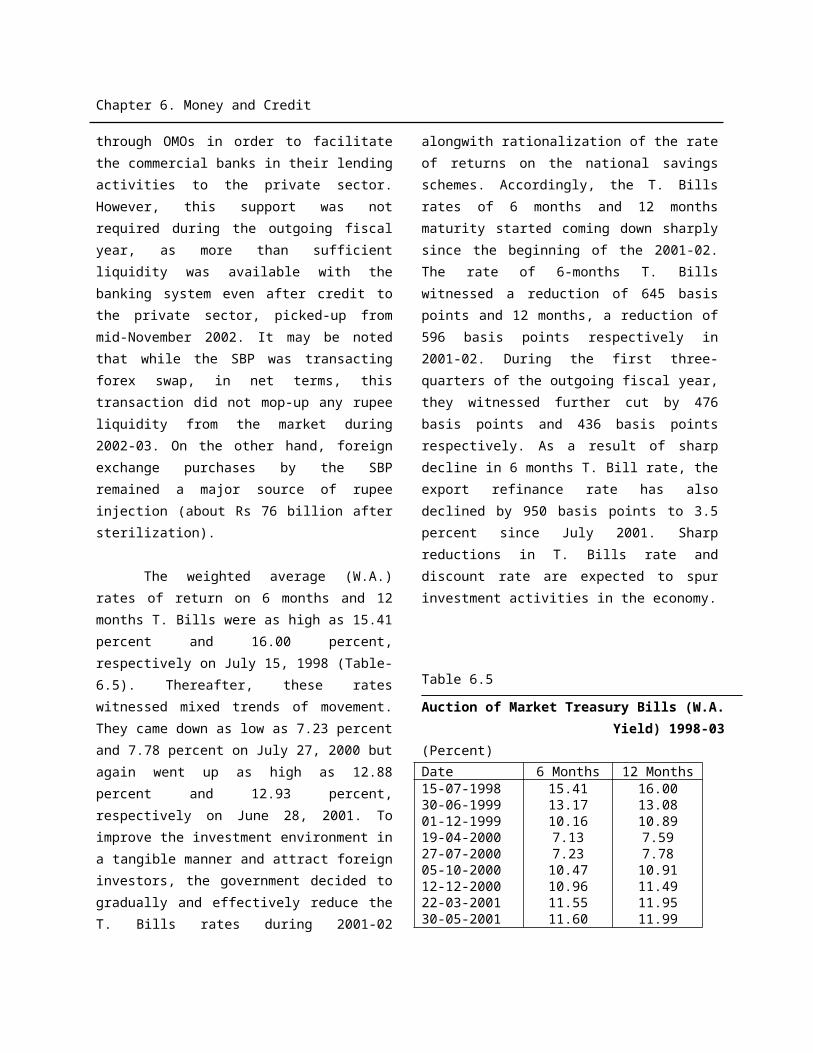
Chapter 8. Inflation
(SPI) and the GDP deflator. The CPI covers the retail prices of 375 items in 35 major cities and reflects roughly the cost of living in the urban areas. The WPI covers the wholesale price of 97 major items prevailing in the city of origin of commodities. The SPI covers prices of 53 essential items accounting for 51.6 percent of the expenditure of those households whose monthly income ranges from Rs.3000 to
Rs.12000 per month. In most countries, the main focus for assessing inflationary trends is placed on the CPI, because as stated above, it most closely represents the cost of living. In Pakistan, the main focus is placed on CPI as a measure of inflation because it is more representative with wider coverage of 375 items in 71 markets of 35 cities of the country. The details are documented in Table-8.1.
Table 8.1
Price Indices in Pakistan
Features
Base Year 2000-01=100 Base Year 1990-91= 100
CPI SPI WPI
Cities covered
Markets covered
Items covered
Number of Commodity Groups
Number of Quotations
Income Groups
Occupational Groups
Reporting Frequency
35
71
375
10
106,500
Four
All Categories combined
Monthly
17
51
53
-
10,404
Rs.3000/Month
3(Urban)
Weekly
16
16
97
5
1210
-
-
Monthly
Source: Federal Bureau of Statistics
Inflation During the 1990s.
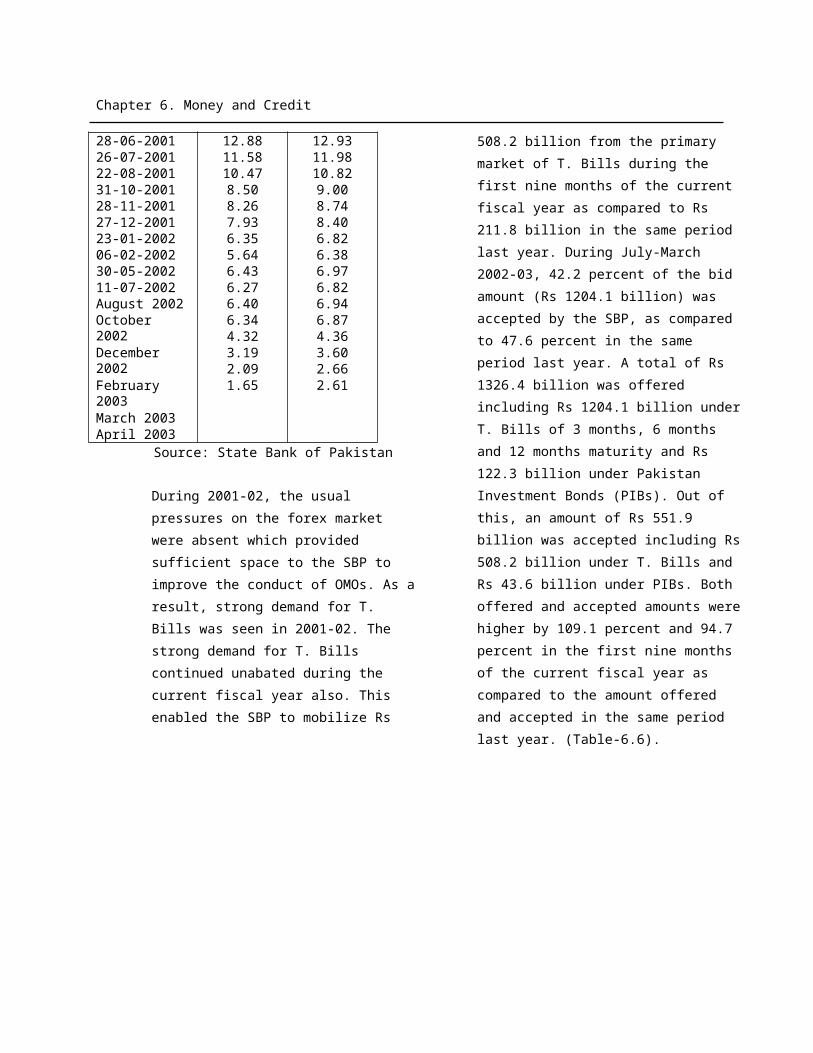
Chapter 8. Inflation
Pakistan has sustained a
double-digit inflation between 9.8 to
13.0 percent during the first seven
years of the 1990s. Not surprisingly,
one of the critical macroeconomic
issues in Pakistan’s policy arena during
those periods has been as to how to
put inflation under effective control.
The persistence of a double-digit
inflation along with large fiscal deficit
(7.0% of GDP) has been the major
source of macroeconomic imbalances
in the 1990s. There has been a general
agreement that lax fiscal management
resulting in the excessive growth in
money supply, the supply side
bottlenecks, the adjustment in
government – administered prices, the
imported inflation (pass through of
exchange rate adjustment), escalations
in indirect taxes, and inflationary
expectations have the major factors
responsible for the persistence of a
double-digit inflation during most
period of the 1990s.
Both food and non-food inflation
contributed to the persistence of the
double-digit inflation. Food and non-
food inflation averaged 12.2 percent
and 10.7 percent, respectively during
the seven years of the 1990s [Table
8.2]. Inflation slowed to an average of
5.7 percent in the remaining three
years of the 1990s, mainly on account
of 5.3 percent food inflation and 6.1
percent non-food inflation. Non-food
inflation was mainly driven by the
prices of POL products and the
associated rise in transport charges.
Inflationary pressures have
continued to diminish over the last
three years mainly on account of tight
monetary policy, prudent fiscal
management, and improved supply of
food items in the country. Although the
exchange rate adjustments and the
rise in international price of POL
products have put upward pressures
on inflation but these pressures were
countered by the tight monetary policy
fully supported by fiscal stance and
improvement in the supply situation in
the country. During the last three years
(2000-01 – 2002/03) overall inflation
averaged 3.7 percent as against
double-digit inflation during most
period of the 1990s. As stated earlier,
the decline in overall inflation owe
heavily to a low (3.1%) food inflation,
as non-food inflation averaged 4.3
percent during the last three years.
Table 8.2
Inflationary Trends*
(% Change)
CPI
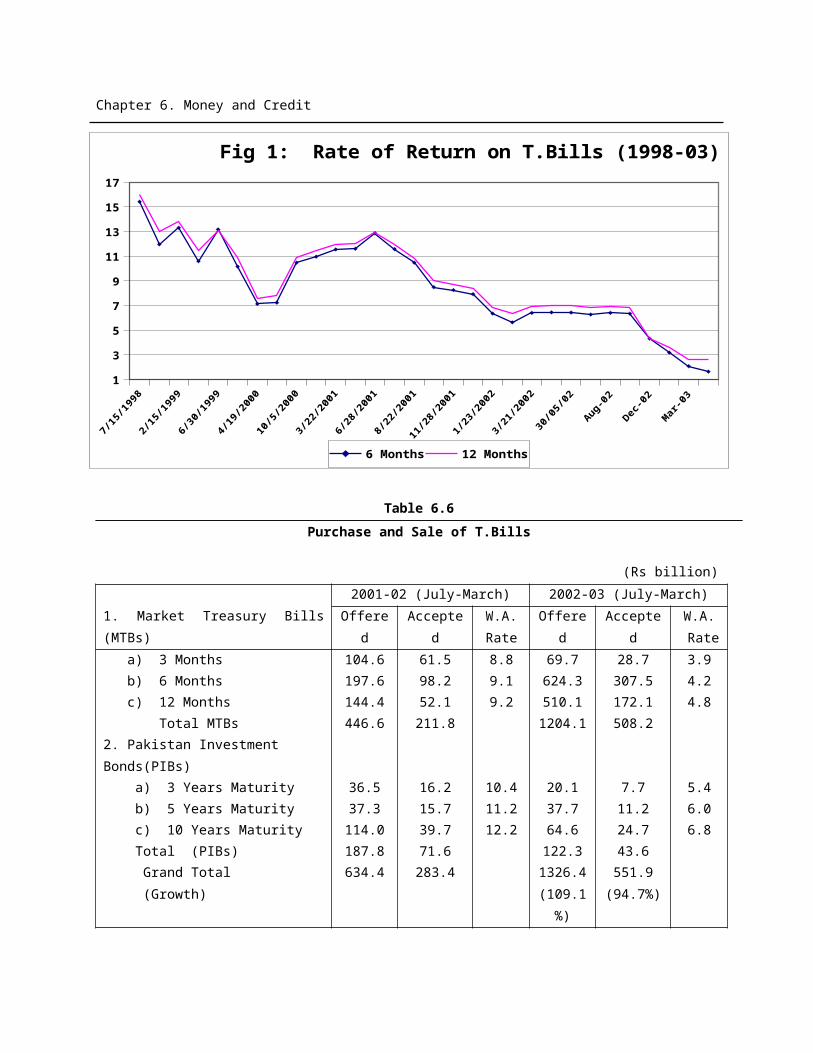
Chapter 8. Inflation
Year WPI SPI
Overall
Inflation
Food
Inflation
Non-Food
Inflation
Chapter 8. Inflation
1990-91
1991-92
1992-93
1993-94
1994-95
1995-96
1996-97
1997-98
1998-99
1999-00
2000-01
2001-02
2002-03 (July-April)
Average of 1990s
Average of 1990-97
Average of 1998-2000
Average of 2000-01 – 2002/03
12.7
10.6
9.8
11.3
13.0
10.8
11.8
7.8
5.7
3.6
4.4
3.5
3
12.9
10.6
11.7
11.3
16.7
10.1
11.9
7.7
5.9
2.2
3.6
2.5
12.4
10.5
7.8
11.2
9.3
11.5
11.7
8.0
5.6
5.0
5.3
4.5
3
11.7
9.8
7.4
16.4
16.0
11.1
13.0
6.6
6.4
1.8
6.2
2.1
6
12.6
10.5
10.7
11.8
15.0
10.7
12.5
7.4
6.4
1.8
4.8
3.4
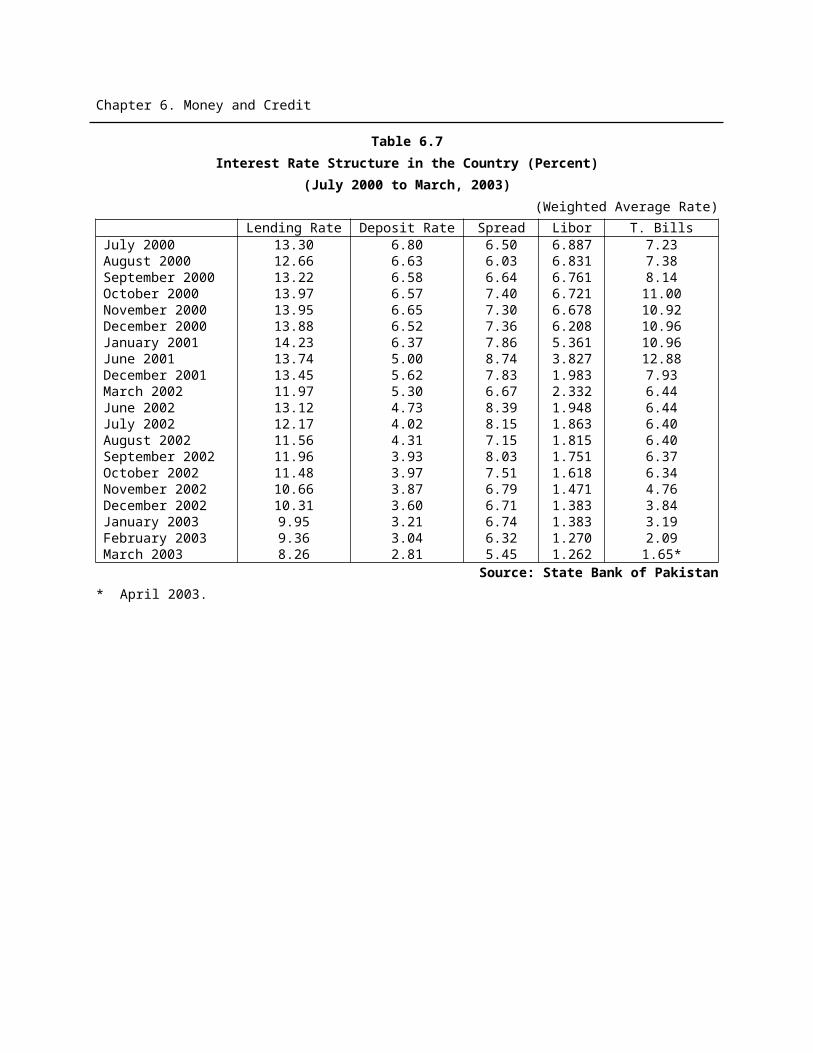
Chapter 8. Inflation
* Inflation based on CPI and SPI are at Source: Federal Bureau of Statistics
2000-01 base.
1990
-91
91-9
2
92-9
3
93-9
4
94-9
5
95-9
6
96-9
7
97-9
8
98-9
9
99-0
0
00-0
1
'01-
02
02-0
3(Ju
l-Apr
)
0
2
4
6
8
10
12
14
16
18
Fig - 1: 1nflationary Trend
CPI FOOD NON-FOOD
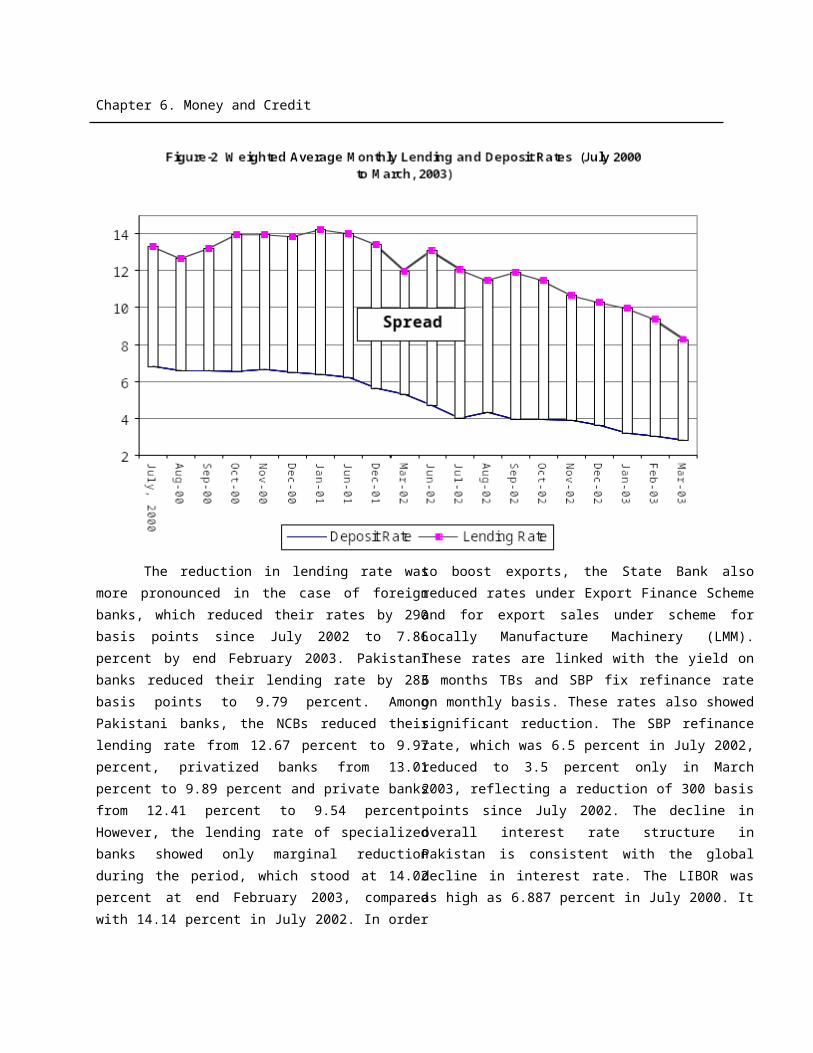
Chapter 8. Inflation
Inflation During 2002-03
Inflation averaged at 3.3 percent
during July-April 2002-03. The low level
of inflation in the midst of 12.5 percent
increase in money supply is the result of
better supply situation of essential
commodities, appreciation of exchange
rate, prudent fiscal management and
continued sterilization of monetary
impact of massive foreign exchange
inflows. Food and non-food inflation have
been estimated at 3.1 percent and 3.4
percent, respectively as against 2.1
percent and 4.4 percent respectively in
the corresponding period of last year
[See Table-8.3]. The higher increase in
food inflation over the comparable
period of last year is attributable to
increase in prices of wheat, wheat flour,
rice basmati, meat, tea, vegetable ghee
and cooking oil. The increase in
vegetable ghee and cooking oil is the
result of increase in international price of
palm oil and imposition of GST on the
local manufacturing of ghee in the
Federal Budget 2002-03. As shown in
Table 8.4, out of 19 widely consumed
daily items the prices of 9 items have
declined in the range of 3.8 percent
(Chicken Farm) to 51.5 percent (potato).
At the same time, the prices of 10 items
have increased in the range of 2.7
percent (Fresh Milk) to 15.8 percent
(tea). It may be noted that prices of all
the four types of pulses (Masur, Moong,
Mash and Gram) have declined because
of increase in their production.
Accordingly, the contribution of food
inflation in overall inflation is estimated
at 38.1 percent in 2002-03 as against
25.1 percent last year.
Slower increase in non-food
inflation as compared with last year
resulted mainly on account of lesser
increase in fuel and lighting group
(8.5% as against 9.6% of last year) and
transport & communication group
(5.5% as against 7.1% last year). It is
important to note that during July 1-
May 15, 2002-03, 22 adjustments in
prices of petrol have taken place - 13
times the prices were raised and 8
times reduced while one time it remain
unchanged. On July 1, 2002 the price of
petrol was Rs.33.71/Litre and on May
16, 2003 it stood at Rs.28.88/Litre - a
decline of 14.3 percent. The prices of
petroleum product and its various
grades including kerosene oil
fluctuated moderately during the fiscal
year 2002-03. The prices of the various
components of petroleum products
generally witnessed a rising trend but
reached at all time high on March 16,
2003 as a result of the continuous
escalation of POL prices in the
international market. During the last
four adjustments the prices of POL
products declined sharply across the
board. Most importantly, the price of
petrol which stood at Rs.37.11/Litre on
March 16, 2003 declined to
Rs.28.88/Litre on May 16, 2003 – a
decline of Rs.8.23/Litre or 22.2 percent.
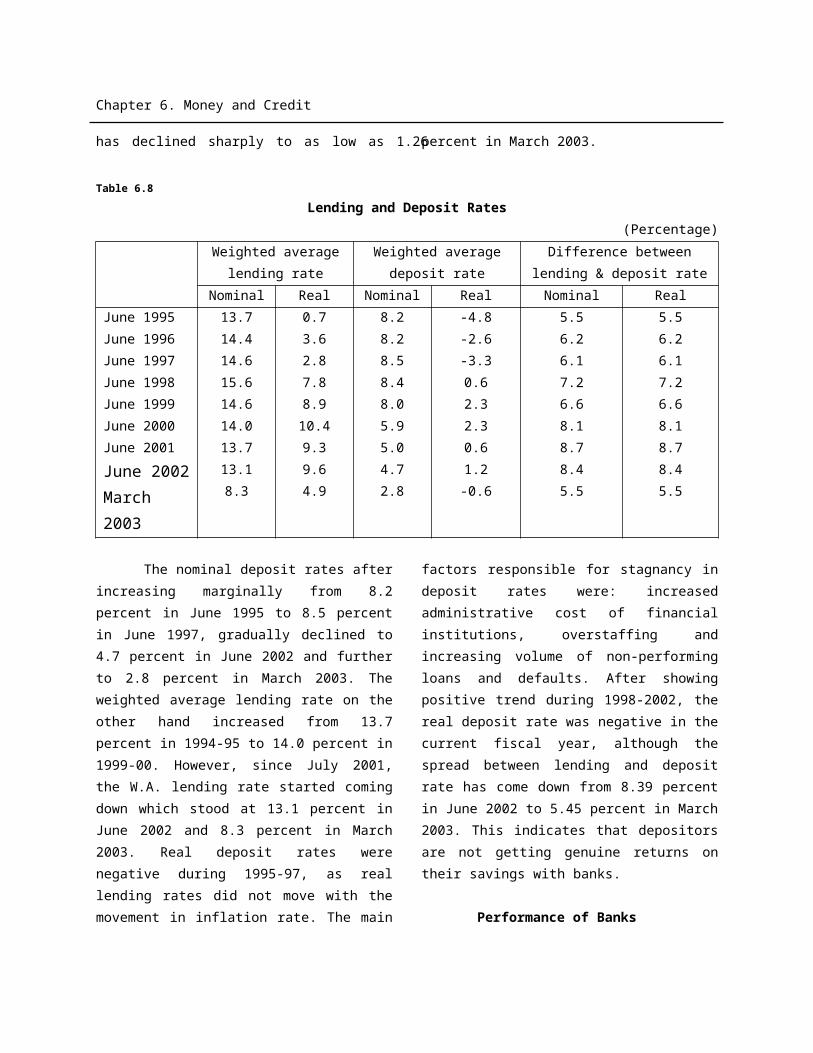
Chapter 8. Inflation
Similarly, the price of diesel (HSD)
declined from Rs.25.93/Litre to
Rs.19.91/Litre – a decline of
Rs.6.02/Litre or 23.2 percent during the
same period. The price of Kerosene
declined from Rs.24.62 to Rs.18.53 – a
decline of Rs.6.09/Litre or 24.7 percent.
Contrary to the general perception, the
government has judiciously passed on
the benefit of lower international prices
of POL products to the people by
lowering the domestic price of these
products [See Table-8.5 and Fig-2]. The
contribution of non-food inflation is
estimated at 61.3 percent which is
lower than last year (77.5%). Within
non-food inflation, almost one-half
contribution has come from fuel &
lighting and transport and
communication.
Table 8.3 Changes in CPI According to Commodity Group
(% Change)Commodity Groups Weight
July-April %age Point Contribution (July-April)
2001-02 2002-03 2001-02 2002-03CPI 100.0 3.4 3.3 3.4 3.3Food 40.3 2.1 3.1 25.1 38.1Non-FoodApparel, TextileHouse RentFuel & LightingHouseholdTransportRecreationEducationCleaningMedicare
59.76.1
23.47.33.37.30.83.55.92.1
4.43.22.99.63.77.17.2N.A2.01.8
3.43.30.78.53.15.50.44.74.93.8
77.55.7
20.220.6
3.515.3
1.80.03.81.1
61.36.04.6
18.73.1
12.10.14.98.62.4
Source: Federal Bureau of Statistics
Table 8.4Prices of Essential Commodities
(Rs.)Items Unit 2000-01 2001-02 July
2002April2003
% ChangeApr 03/Jul 02
Chapter 8. Inflation
WheatWheat FlourRice BasmatiMasur PulseMoong PulseMash PulseGram PulseBeefMuttonSugarMilk FreshVeg. GheeVeg. Ghee (Loose)Cooking OilTeaChicken (Farm)Red ChiliesOnionPotatoes
KgKgKgKgKgKgKgKgKgKgLtr
2.5KgKg
2.5Ltr250Gm
KgKgKgKg
8.29.8
15.137.029.946.529.354.8
106.627.217.6
154.944.9
156.553.851.666.510.5
9.5
8.39.7
15.538.434.444.334.955.2
111.522.917.9
169.249.2
171.057.052.078.3
9.611.4
8.29.7
16.936.232.341.834.456.9
116.222.318.1
183.353.3
183.657.060.283.611.012.8
8.810.318.434.929.935.827.664.7
132.219.818.6
198.755.9
202.966.057.971.0
6.66.2
7.85.89.2
-3.9-7.3
-14.4-19.713.713.8
-11.02.78.44.9
10.515.8-3.8
-15.1-40.0-51.5
Source: Federal Bureau of StatisticsTable 8 5
Prices of Various POL Products (Rs./Litre)Effective from
FortnightMS RON 87 HOBC Kerosene HSD * LDO
1-Jul-02 33.71 38.19 17.08 19.41 16.1816-Jul-02 33.59 38.07 17.22 19.35 16.251-Aug-02 33.84 38.33 17.64 19.08 16.1616-Aug-02 33.94 38.40 17.60 19.08 15.971-Sep-02 34.32 38.79 18.41 19.48 16.65
20-Sep-02 34.66 39.13 18.61 19.76 16.932-Oct-02 34.66 39.13 18.61 19.76 16.9316-Oct-02 35.64 40.11 19.27 20.98 17.831-Nov-02 35.21 39.70 19.23 21.98 17.88
16-Nov-02 32.18 36.65 18.95 21.38 16.641-Dec-02 30.25 34.35 18.95 20.01 16.1616-Dec-02 31.02 35.02 19.26 20.22 16.241-Jan-03 32.50 36.41 20.70 21.14 17.60
16-Jan-03 32.64 36.55 20.62 21.72 17.531-Feb-03 32.96 36.83 21.32 21.72 18.30
16-Feb-03 34.51 38.41 22.90 22.82 19.581-Mar-03 35.74 39.65 23.81 25.05 20.4716-Mar-03 37.11 41.11 24.62 25.93 20.951-Apr-03 33.27 37.32 21.06 24.53 18.6416-Apr-03 30.58 34.60 19.02 21.28 16.691-May-03 30.13 34.17 19.25 20.23 16.3816-May-03 28.88 32.40 18.53 19.91 16.09
Source: Oil Companies Advisory Committee
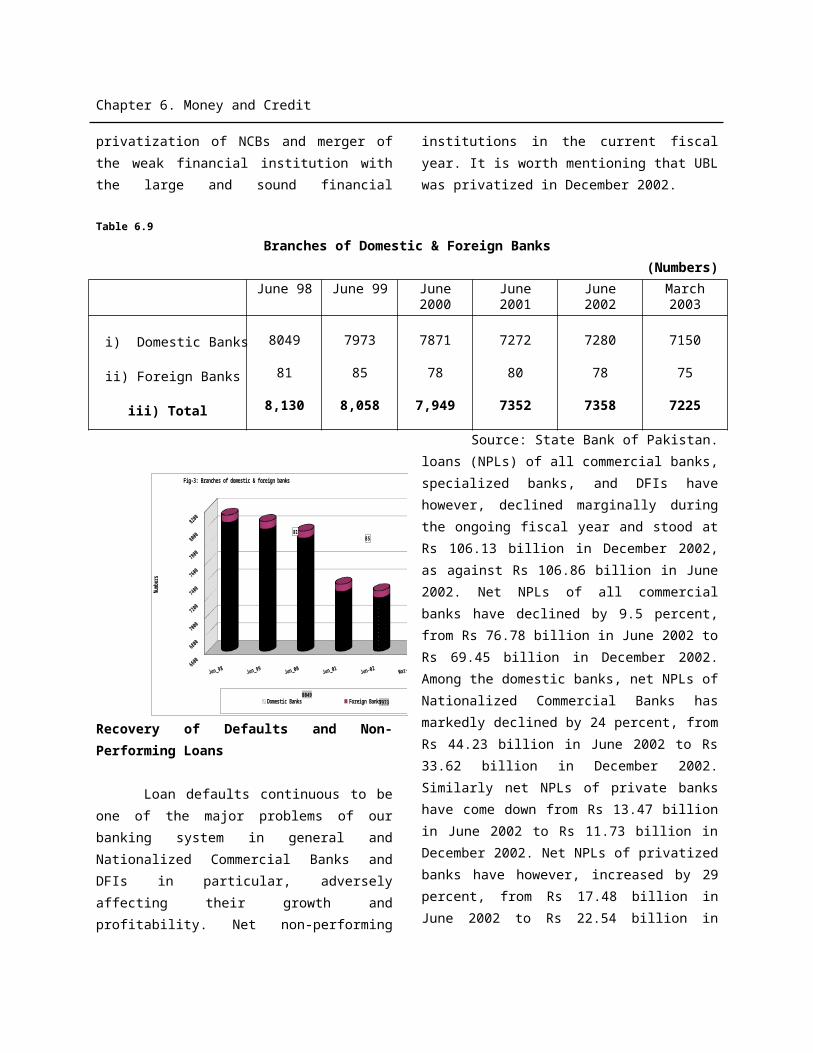
Chapter 8. Inflation
* Hydrocarbon Development Institute of Pakistan
7/1/
2001
8/1/
2001
9/1/
2001
10/1
/200
111
/1/2
001
12/1
/200
11/
1/20
022/
1/20
023/
1/20
024/
1/20
025/
1/20
026/
1/20
027/
1/20
028/
1/20
029/
1/20
0210
/1/2
002
11/1
/200
212
/1/2
002
1/1/
2003
2/1/
2003
3/1/
2003
4/1/
2003
5/1/
2003
10
14
18
22
26
30
34
38
42
Fig-2: Prices of Petroleum Products
MS Ron 87 HOBC Kerosene HSD LDO
Rs.
/Lit
re
Chapter 8. Inflation
The month-wise analysis of inflationary trend as documented in Table-8.6 suggests that overall inflation continued to exhibit a broadly declining trend since July 2002. On year-on-year basis the overall inflation stood at 4.0 percent in July 2002 but declined to 2.2
percent in April 2003. Food inflation decelerated from 5.8 percent to 0.5 percent by March 2003. Non-food inflation on the other hand continued to rise because of the rising trend in oil prices. It has started declining since March 2003.
Table 8.6
Monthly Inflation Rate
(% Change)
Period2000-01 2001-02 2002-03
CPI Food Non Food CPI Food Non Food CPI Food Non FoodJulAugSepOctNovDecJanFebMarAprMayJun
5.04.45.14.65.45.14.74.64.24.03.62.5
4.23.03.94.25.84.94.24.23.83.32.1-0.6
5.65.66.04.95.15.25.14.94.54.54.85.0
3.54.23.33.32.62.62.93.34.24.23.94.4
0.52.41.31.91.41.31.82.53.84.23.44.8
5.95.64.94.33.63.73.73.94.54.14.34.2
4.03.73.73.53.13.33.43.52.22.2--
5.84.74.73.62.62.62.62.60.51.2--
2.62.82.83.43.54.04.04.13.53.1--
Source: Federal Bureau of Statistics
Inflation by Income Groups
Jul-00.
Aug.
Sep.
Oct.
Nov.
Dec.
Jan.
Feb.
Mar.
Apr.
May
Jun
Jul-01
Aug
Sep
Oct
Nov
Dec
Jan
Feb
Mar
Apr
May
Jun
'Jul-02
Aug
Sep
Oct
Nov
Dec
Jan
Feb
Mar
Apr
-0.8
0.2
1.2
2.2
3.2
4.2
5.2
6.2
7.2
Fig-3: Monthwise Inflation Rate (CPI)
Inflation Food Non-Food
...
Chapter 8. Inflation
It is always interesting to know the various inflation rates faced by different income groups. To assess the impact of inflation on consumers belonging to different income groups, the CPI is constructed for four income groups, namely Rs.3000, Rs.5000, Rs.12000 and above Rs.12000 per month. Data for the first ten months (July-April) of the current fiscal year show that as against overall inflation of 3.3 percent, the lowest income group
experienced 3.1 percent inflation while all other groups faced more or less the same overall inflation (3.3%). The people in low-income groups spend a major portion of their incomes on food items. Since food inflation has remained low as compared with non-food inflation, therefore, the lowest income group faced relatively lower inflation as compared with those in higher income groups [See Table-8.7 and Fig 4].
Table 8.7 Inflation Rate by Income Groups
Period OverallCPI
UptoRs.3000
UptoRs.3001-5000
UptoRs.5001-12000
Above12000
1995-96 10.8 10.6 10.7 10.8 11.31996-97 11.8 11.7 11.9 11.8 11.61997-98 7.8 7.9 7.8 7.9 8.01998-99 5.7 5.6 5.6 5.9 6.21999-00 3.6 3.2 3.4 3.8 4.52000-01 4.4 4.5 4.3 4.5 4.72001-022002-03(Jul-Apr)
3.53.3
3.03.1
4.93.4
3.43.3
3.63.3
Source: Federal Bureau of Statistics
95-96 96-97 97-98 98-99 99-00 00-01 '01-02 02-03 (Jul-Apr)
0
2
4
6
8
10
12
14
Fig-4: Inflation by Income Groups
3000 3001-5000 5001-12000 above 12000
..
Wholesale Price Index (WPI)
The WPI, on average basis, increased by 6.1 percent during July-April, 2002-03. This
increase in WPI is significantly higher than the increase of 2.1 percent last year. To this increase, maximum contribution was made by the fuel & lighting group (15.7 percent), followed
Chapter 8. Inflation
by raw material (9.4 percent), and manufacturing group (2.6 percent). The larger increase in the index of fuel & lubricant at 15.7 percent against 3.5 percent last year is mainly attributable to increase in prices of POL products. The increase
in the prices of raw material has mainly been due to the fact that price indices of certain important items like cotton, cotton yarn, vegetable ghee etc. have increased at higher rate during the current fiscal year than last year[See Table-8.8].
Table 8.8 Components of WPI
(% Change)Commodity Groups Weight
July-April %age Point Contribution (July-April)
2001-02 2002-03 2001-02 2002-03WPI 100.0 2.1 6.1 2.1 6.1Food 45.8 1.8 3.0 39.9 22.7Non-Food 54.2 2.3 8.7 60.9 77.3Raw Material 8.8 0.5 9.4 2.2 13.5Fuel & Lubricants
15.3 3.5 15.7 25.8 39.6
Manufacturers 25.5 2.2 2.6 27.6 11.0Building Materials
4.6 0.5 1.2 1.1 0.9
Source: Federal Bureau of Statistics
Sensitive Price Indicator (SPI)
The SPI is used to capture the movement in prices of 53 essential items, consumed by the urban households with income of Rs.3000-Rs.12000 per month. The increase in SPI during the first ten months of the current fiscal year (July-April) 2002-03 is estimated at 3.7 percent against 3.2 percent last year mainly due to the increase in prices of some basic food items such as wheat (7.8%), wheat flour (5.8%), rice basmati (9.2%), mutton (13.8%), beef (13.7%), vegetable ghee (8.4%), cooking oil (10.5%) and tea (15.8%). Much of the increase in prices of wheat is attributable to its lower production (-4.2%) in 2001-02. The increase in Meat prices is due to increasing demand and vegetable ghee is due to imposition of GST on local manufacturing of ghee as well as substantial increase in the international price of palm oil. However, prices of some basic food items like sugar, pulses, red chillies, chicken (Farms), onion and potatoes have shown significant decline upto the range of 52% on account of improved supply position of these items [See Table-8.4 for details].
Price Stabilization Measures
Price stabilization measures are important when there are unusual variations in the prices. Presently, the government in commensurate with its policy of decontrol, deregulation and liberalization, believes in tackling the inflationary pressures through economic measures rather than formal price control. However, close vigilance is kept on unusual rise in prices through weekly meetings of the Kitchen Items Committee, now called the Sensitive Items Price Committee (SIPC) and through the weekly meetings of the ECC of the Cabinet. Other measures in the realm of supply augmentation, reduction in import duty to facilitate larger imports, improved marketing practices, timely distribution, coordination with private sector and persuading traders/ manufacturers to refrain from unfair practices are undertaken to ensure price stability in the country.
The above analysis clearly suggests that the Government has succeeded in keeping inflation not only low but it is much lower than the target (4.0%) for this fiscal year. The increase in prices of daily consumable items have also remained low. In many cases the

Chapter 8. Inflation
prices of some essential items have fallen when compared with last year. In some cases the price have increased as well. This is the normal practice in any economy. The whole idea of the country’s monetary and fiscal policy is not to maintain negative inflation (decline in general price level) but to keep inflation at low level. The
government has succeeded in keeping inflation low (3.3%) during the current fiscal year. Even in future, inflation rate should remain within the range of 3 to 4 percent. Keeping inflation at low level should be regarded as protecting the poor from inflation tax.
_____________
Chapter 9. Trade and Payments
9. Trade and PaymentsNotwithstanding difficult external
environment characterized by subdued
global economic activity, sluggish world
trade, rising international price of oil and
geopolitical uncertainty, Pakistan’s external
balance of payments improved significantly
during the outgoing fiscal year 2002-03.
Both exports and imports picked up,
workers remittances touched new heights,
surplus in current account further
increased, rupee gained strength and
appreciated by almost 4 percent, and
foreign exchange reserves crossed $ 10
billion and provided much needed stability
in the exchange rate. With the
strengthening of external balance of
payments, Pakistan’s macroeconomic
environment has improved considerably. It
has often been suggested that a stable
macroeconomic environment promotes
growth by providing a more conducive
environment for private sector investment.
There is no reason as to why an improved
macroeconomic environment created by
external balance of payments should not
deliver strong growth this year and even
more stronger over the medium-term.
Trends in Exports
Exports were targeted at $ 10.347
billion for the fiscal year 2002-03 – 13.3
percent higher than last year ($ 9.135
billion). Exports during July-April, 2002-03
grew by 20.8 percent and stood at $ 8849.7
million as against $ 7324.1 million of the
same period last year, thereby achieving
85.5 percent of export target for the year.
In other words, the country was able to earn
$ 1525.6 million more in exports, of which
main share goes to textile manufactures ($
983.0 million or 64.4%).
Further analysis reveals that during this
period (July-April) primary commodities exports
grew by 26.0 percent. Within primary
commodities, export of rice increased by 22.9
percent. Pakistan was also able to export raw
cotton and wheat worth of $ 46.5 million and $
106.1 million, respectively. Exports of textile
manufactures stood at $ 5644.8 million (almost
64% of total exports), as compared with $ 4661.9
million in the same period last year, thereby
registering an increase of 21.1 percent. Within
textile manufactures, exports of cotton cloth,
knitwear, bedwear, towels and readymade
garments were up in the range of 16.3 percent
(cotton cloth) to 37.2 percent (bedwear). More
importantly, the exports of cotton cloth, knitwear,
bedwear and towels also grew in quantity term in
the range of 6.7 percent (cotton cloth) to 41.9
percent (knitwear) with bedwear and towels
growing by 25.7 percent and 19.9 percent,
respectively. Exports of other manufactures
registered a growth of 10.4 percent with
engineering goods, chemicals & pharmaceutical
products, petroleum products and sports goods
showing tremendous potential of exports. Exports
of carpets & rugs and leather & leather
Chapter 9. Trade and Payments
manufactures continue to show a declining trend
[See Table 9.1].
Chapter 9. Trade and Payments
Table 9.1Structure of Exports
($ Million)
Particulars
JULY-APRIL %
2002-03* 2001-02 ChangeA. Primary Commodities Rice Raw Cotton Fish & Fish Preparation Fruits Wheat
825.1450.7
46.5110.6
69.0106.1
654.6366.7
16.1106.8
70.548.3
26.022.9
188.83.6
-2.1119.7
B. Textile ManufacturesCotton YarnCotton ClothKnitwearBedwearTowelsReadymade Garments
5644.8791.9
1057.0875.3
1010.9279.3880.2
4661.9
767.4908.9672.1736.9214.8708.9
21.13.2
16.330.237.230.024.2
C. Other ManufacturesCarpets, Rugs & MatsPetroleum ProductsSports GoodsLeather TannedLeather ManufacturesSurgical Goods & Medical InstrumentsChemicals & Pharmaceutical ProductsEngineering Goods
1667.4183.5153.3254.5189.0309.7116.8208.3
54.0
1509.7
192.193.5
234.4189.4318.2118.9114.7
38.6
10.4-4.563.9
8.6-0.2-2.7-1.881.639.9
D. Others 712.4 497.9 43.1
Total 8849.77324.
120.8
* Provisional Source: Federal Bureau of Statistics.
A variety of reasons contributed towards healthy growth in exports, prominent among those are substantial expansion in volume terms resulting from increased textile quota/grater market access in the European Union, sharp reduction in the refinance rate under Export Finance Scheme and value addition in textile manufactures. Given the trends in
exports during July-April 2002-03, the current year’s export target ($10.347 billion) is likely to be surpassed.
Exports during the first ten months (July-
April) of the current fiscal year have increased by $
1525.6 million in absolute term over the
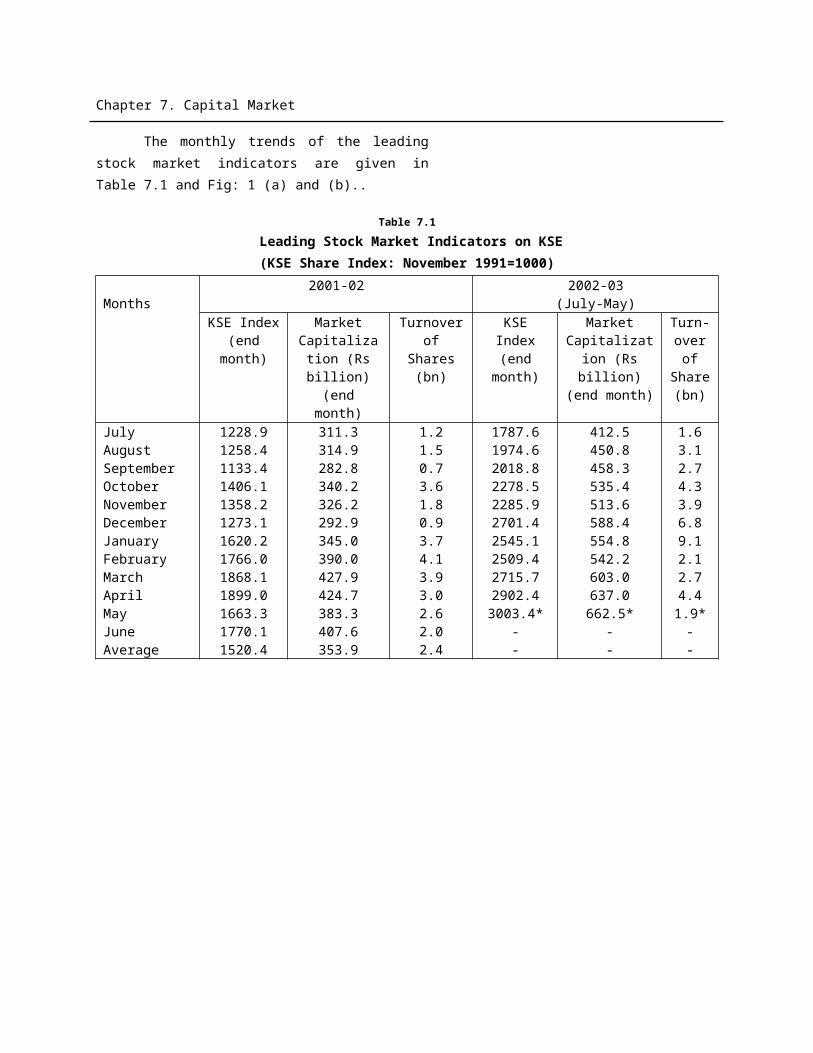
Chapter 9. Trade and Payments
corresponding period of last year. The major
contributors to this additional export earnings have
been textile manufactures ($ 983.0 million or
64.4%), followed by other exports ($ 214.5 million
or
14.1%), primary commodities ($ 170.5 million or
11.2%) and other manufactures ($ 157.6 million or
10.3%) [See Table 9.2 and fig.1].
Table 9.2Major Contributors to Additional
Export Earnings(July-April, 2002-2003 *)
ExportsNet Increase
$ Million%
Contribution
Additional Export Earnings
-Primary Commodities
- Textile Manufactures
- Other Manufactures
- Others
1525.6
170.5
983.0
157.6
214.5
100.0
11.2
64.4
10.3
14.1* Provisional Source: FBS & E.A.Wing, Finance Division
Primary commodities11.2%
Other Manufactures10.3%
Others14.1%
Fig-1: Major Contributors to Additional Export Earnings(July-April, 2002-03)
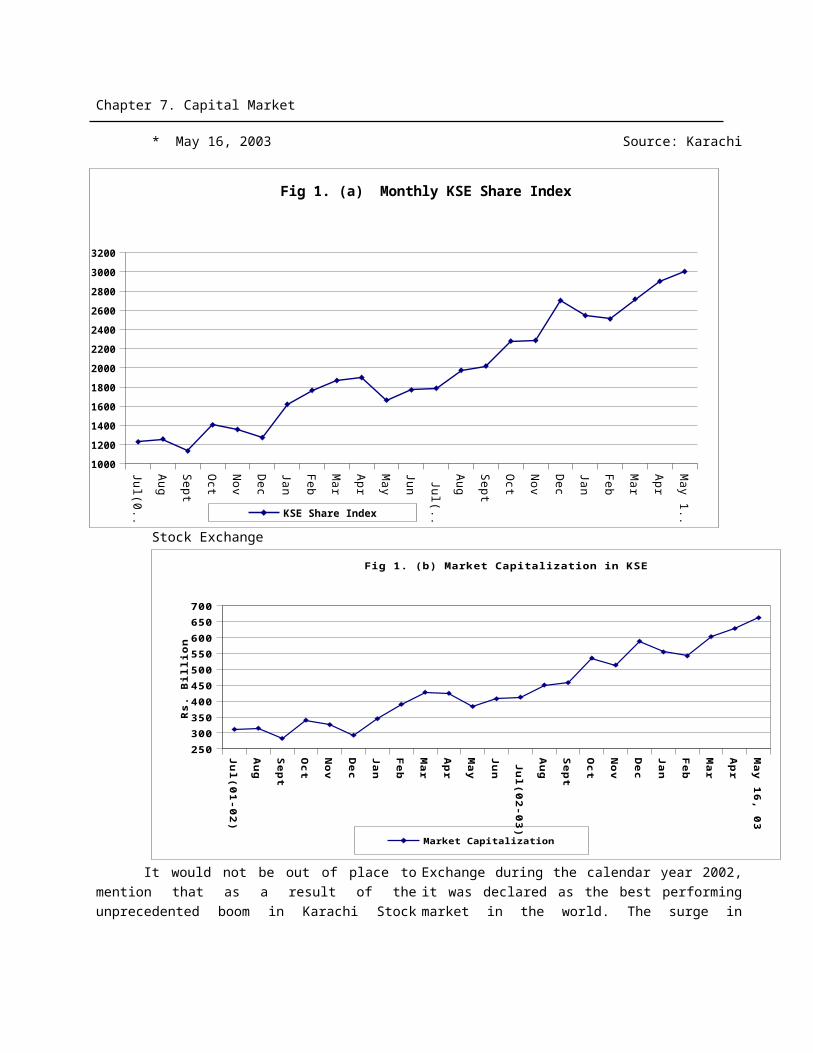
Chapter 9. Trade and Payments
Month-Wise Exports
The month-wise exports during July-
April, 2002-03 (first ten months) remained
consistently higher than the corresponding
months of last year. Exports averaged $
885.0 million per month during this period
as against $ 732.4 million of the
comparable period last year. In other words,
on average, exports have been higher by $
152.6 million per month during this period
[See Table 9.3 and fig.2].
Table 9.3Month-Wise Exports
($ Million)
Month 2001-02 2002-03
JulyAugustSeptemberOctoberNovemberDecemberJanuaryFebruaryMarchApril *
683.9780.5800.2759.9711.1722.2699.6654.9725.8786.0
816.7902.8869.0891.7854.1863.2946.5776.4935.6993.7
Monthly Average
732.4 885.0
* Provisional Source: Federal Bureau of StatisticsConcentration of Exports
Pakistan's exports are highly concentrated in few items/groups namely, cotton, leather, rice, synthetic textiles and sports goods. These five categories of exports accounted for about 79 percent of total exports during 2001-02. Among these categories, cotton group alone contributed 59.4 percent, followed by leather (6.8%), rice (4.9%), and synthetic textiles (4.5%). These four items together accounted for 75.6 percent of total export earnings. The degree of concentration of these items/groups during 2001-02 remained
close to the last year’s level except that of synthetic textiles whose share declined by 1.4 percentage points due to decline in its quantity and unit price. Furthermore, almost all the export earnings of cotton group have originated from textile and clothing. Such a high degree of concentration of exports in few items is a major source of instability in export earnings. A poor cotton crop seriously affects total export proceeds, as it has been observed several times in the past. The annual percentage shares of major export commodities are given in Table 9.4.
Table 9.4Pakistan's Major Exports
(Percentage Share)
Jul Aug Sep Oct Nov Dec Jan Feb Mar Apr
500
600
700
800
900
1000
1100
Fig-2: Month Wise Exports
2001-02 2002-03
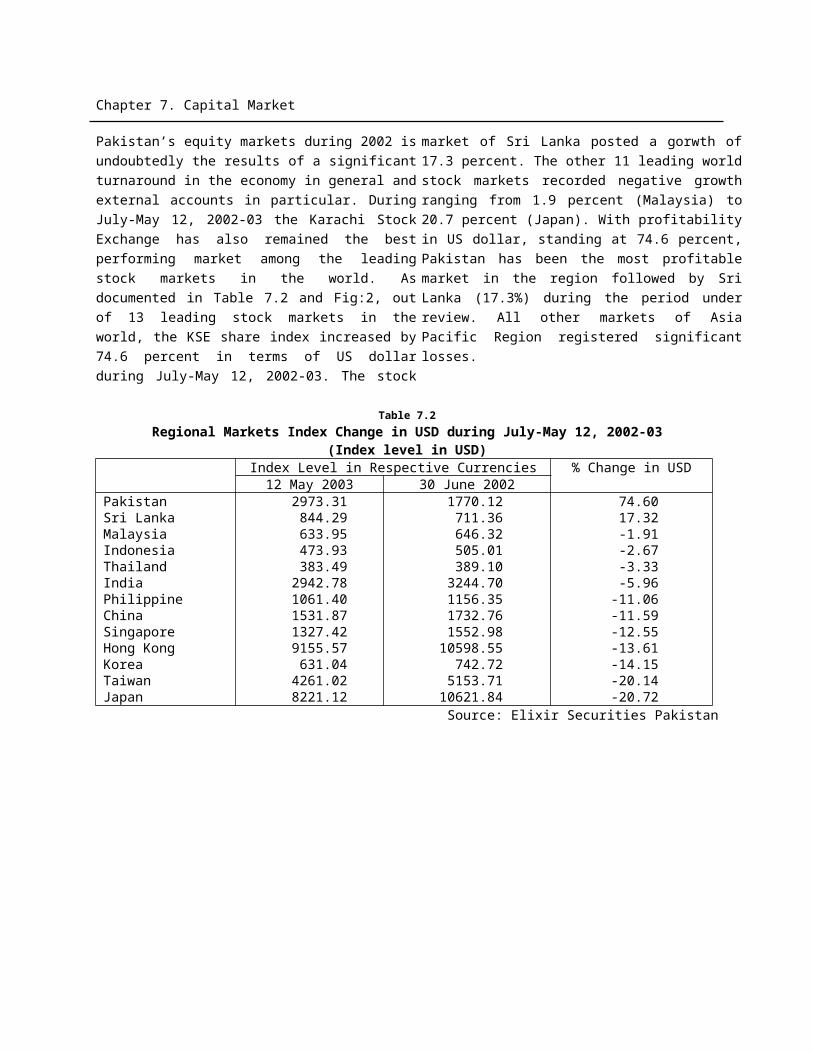
Chapter 9. Trade and Payments
Comm 90- 91- 92- 93- 94- 95- 96- 97- 98- 99- 00- 01-Cotton 61.0 61.3 59.8 57.9 58.7 64.1 61.3 58.7 59.1 61.0 58.9 59.4Leather 9.1 8.6 9.3 9.2 8.0 7.2 7.7 6.7 6.9 6.3 7.5 6.8
Rice 5.6 6.0 4.7 3.6 5.6 5.8 5.6 6.5 6.9 6.3 5.7 4.9Synthetic Textiles 5.7 6.1 7.4 9.5 7.1 5.2 6.1 7.2 5.1 5.3 5.9 4.5Sports Goods 2.2 2.0 1.9 2.9 3.2 2.8 3.7 4.4 3.3 3.3 2.9 3.3Sub-Total
83.6
84.0
83.1
83.1
82.6
85.1
84.4
83.5
81.3
82.2
80.9
78.9
Others 16.4 16.0 16.9 16.9 17.4 14.9 15.6 16.5 18.7 17.8 19.1 21.1
Total 100.0
100.0
100.0
100.0
100.0
100.0
100.0
100.0
100.0
100.0
100.0
100.0
Source: Ministry of Commerce.
Composition of Exports
The composition of Pakistan’s exports has changed significantly over the years. The principal changes have been the steep fall in the shares of primary & semi-manufactured exports and equally sharp increase in the share of manufactured exports. The share of primary commodities, semi-manufactures and manufactured goods in the year 2001-02 depicted
the same trend and remained at 11 percent, 14 percent and 75 percent, respectively. During July-March of the current fiscal year (2002-03), the share of primary commodities increased by one percentage point to 12 percent, semi-manufactures slipped by three percentage points and settled at 11 percent and the share of manufactured goods moved upward from 75 percent to 77 percent over the same period last year [See Table 9.5].
Table 9.5Composition of Exports
( Rs. Million)
YearTotal
Exports
Primary
CommoditiesSemi-Manufactures Manufactured
GoodsValue % Share Value % Share Value % Share
1990-91 138,28 25,820 19 33,799 24 78,663 571991-92 171,72 32,645 19 36,731 21 102,352 601992-93 177,02 26,133 15 36,507 21 114,388 641993-94 205,49 21,321 10 48,748 24 135,430 661994-95 251,17 28,113 11 62,624 25 160,436 641995-96 294,74 47,852 16 63,802 22 183,087 621996-97 325,31 36,452 11 66,889 21 221,972 681997-98 373,16 47,357 13 64,683 17 261,120 701998-99 390,34 45,143 12 70,288 18 274,911 7099-2000 443,67 53,833 12 68,208 15 321,637 732000-01 539,07 67,783 13 81,288 15 389,999 722001-02 560,94 60,346 11 80,438 14 420,163 75July-March2001-02 404,84 44,289 11 58,702 14 301,855 752002-03 * 461,47
9
52,703 12 52,528 11 356,248 77
* Provisional Source: Federal Bureau of Statistics
If semi-manufactures and manufactured goods are taken together, 88 percent of export earnings during July-March, 2002-03 originated from manufactured exports and only 12 percent from primary commodities. The changing composition of exports suggests that Pakistan is no longer a country that relies heavily on the primary commodities exports for foreign exchange earnings. However, Pakistan still relies heavily on the labour intensive and low value added exports.
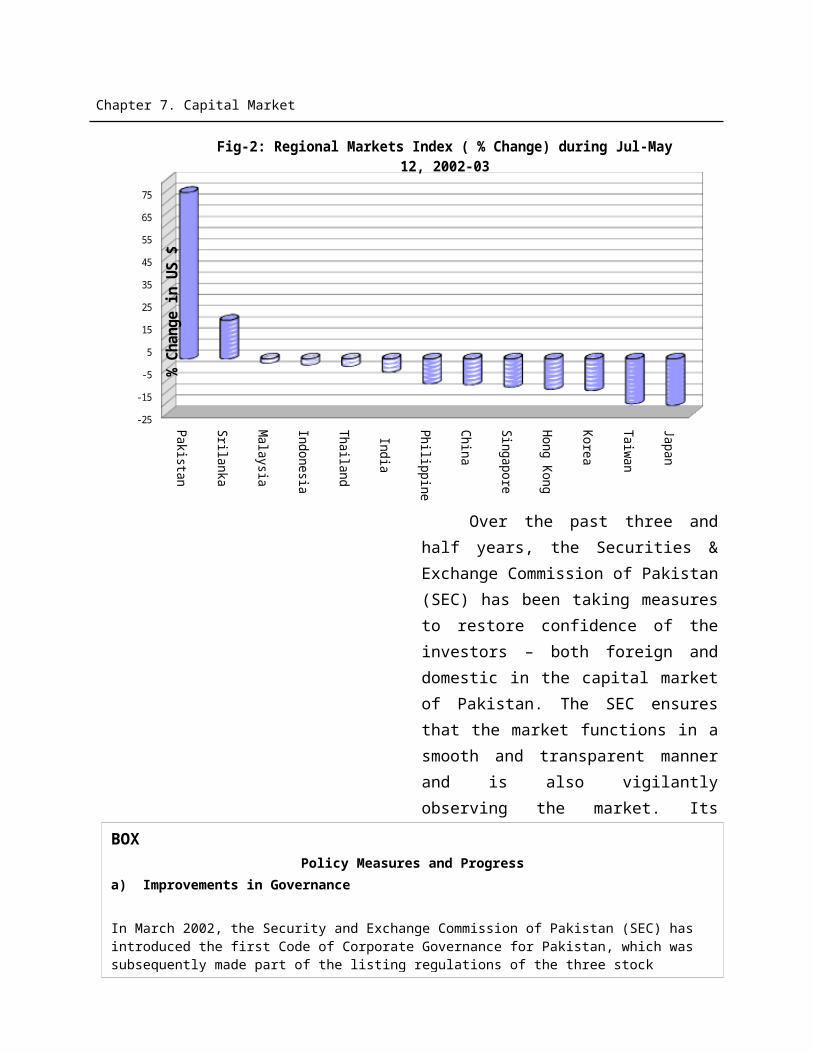
Chapter 9. Trade and Payments
Direction of Exports
Pakistan is trading with large number of countries but its exports are highly concentrated in few countries. Slightly above one-half of Pakistan's exports went to seven countries namely, USA, Germany, Japan, UK, Hong Kong, Dubai and Saudi Arabia. Among these countries, the share of Pakistan's exports to
USA has been rising while that of Japan has exhibited a continuous decline, mainly on account of a protracted recession in the Japanese economy. The share of exports to Germany, UK, Hong Kong and Saudi Arabia remained almost stagnant with some fluctuations over the years. By and large, the same trend continued during 2001-02 with the exception of export share to Dubai. The share of exports to Dubai has increased by 2.6 percentage points because of higher exports of textile manufactures. [See Table 9.6].
Table 9.6Major Export Markets of Pakistan
(Percentage Share)
Country90-
91
91-
92
92-
93
93-
94
94-
95
95-
96
96-
97
97-
98
98-
99
99-
00
00-
01
01-
02
USA 10.
8
12.
8
13.
9
14.
4
16.
2
15.
5
17.
7
20.
5
21.
8
24.
8
24.
4
24.
7
Germany 8.9 7.1 7.8 8.0 7.0 6.8 7.5 6.3 6.6 6.0 5.3 4.9
Japan 8.3 8.3 6.8 8.0 6.7 6.6 5.7 4.2 3.5 3.1 2.1 1.8
UK 7.3 6.6 7.1 7.8 7.1 6.4 7.2 6.9 6.6 6.8 6.3 7.2
Hong Kong 6.0 7.3 6.6 7.3 6.6 9.1 9.4 7.1 7.1 6.1 5.5 4.8
Dubai 2.8 4.4 5.9 6.3 4.0 4.7 4.6 5.0 5.4 5.7 5.3 7.9
Saudi
Arabia 3.6 4.3 4.7 3.5 2.7 2.4 2.6 2.5 2.4 2.5 2.9 3.6
Sub-Total 47.
7
50.
8
52.
8
55.
3
50.
3
51.
5
54.
7
52.
5
53.
4
55.
0
51.
8
54.
9
Other
Countries52.
3
49.
2
47.
2
44.
7
49.
7
48.
5
45.
3
47.
5
46.
6
45.
0
48.
2
45.
1
Total 100
.0
100
.0
100
.0
100
.0
100
.0
100
.0
100
.0
100
.0
100
.0
100
.0
100
.0
100
.0
Source: Ministry of Commerce
Trends in Imports
Imports were targeted at $ 11.1 billion for the fiscal year 2002-03 – 7.4 percent higher than last year ($ 10.340 billion). Imports grew by 22.5 percent and
stood at $ 10099.5 million during July-April 2002-03 as against $ 8244.9 million of the corresponding period last year, thereby achieving 91.0 percent of the target set for the year. The overall import bills of the country was higher by $ 1854.5 million to
Chapter 9. Trade and Payments
meet the domestic requirements which were mainly the outcome of additional imports spending on machinery ($ 594.7 million) and POL products ($ 457.7 million).
Further analysis reveals that food group accounting for only 8.1 percent of total imports, grew by 21.1 percent, primarily on account of substantial increase (48.4%) in imports of palm oil (mainly due to 39.2 percent increase in its import price) and soyabean oil to meet its domestic consumption requirement. Import of
machinery was up by 35.6 percent, showing the signs of pick up in domestic economic activity. Almost one-fourth of imports are petroleum group which were up by 20.6 percent – the rise was attributed to the higher import price of both the petroleum crude and petroleum products. All other groups of imports have also registered significant growth during July-April 2002-03 [See Table 9.7]. Non-oil imports as well as non-oil non-food imports were up by almost 23 percent. This is yet another indicator of the pick up in domestic economic activity.
Table 9.7Structure of Imports
($ Million)
JULY-APRIL %
Particulars 2002-2003* 2001-2002 Change
A. Food Group 813.0 671.1 21.1Wheat Unmilled 28.7 43.7 -34.3
Soyabean Oil 41.9 9.9 323.2
Palm Oil 441.2 297.3 48.4
Sugar 1.7 23.0 -92.6
Pulses 98.6 108.0 -8.7
B. Machinery Group 2266.8 1672.1 35.6
Power Generating Machinery 215.7 165.2 30.6
Textile Machinery 405.5 336.1 20.6
Const. & Mining Machinery 76.9 91.1 -15.6
Electrical Mach. & Apparatus 168.4 99.6 69.1
Agricultural Machinery 27.6 11.8 133.9
C. Petroleum Group 2683.4 2225.7 20.6
Petroleum Products 1473.3 1222.1 20.6
Petroleum Crude 1210.1 1003.7 20.6
D. Textile Group 183.5 154.7 18.6
Synthetic Fibre 76.5 60.9 25.6
E. Agri/Other Chemicals Group 1744.8 1496.0 16.6
Fertilizer 212.1 157.1 35.0
F. Metal Group 402.2 367.0 9.6
Iron & Steel 325.3 285.3 14.0
G. Miscellaneous & Others 2005.8 1658.3 21.0
Chapter 9. Trade and Payments
JULY-APRIL %
Particulars 2002-2003* 2001-2002 Change
Total 10099.5 8244.9 22.5
Excluding Petroleum Group 7416.1 6019.2 23.2
Excluding Petroleum & Food Groups 6603.1 5348.1 23.5
* Provisional Source: Federal Bureau of Statistics
Imports during the first ten months (July-
April) of the current fiscal year increased in
absolute terms by $ 1854.5 million over the
corresponding period last year. The major
contributors to this additional import bill have
been machinery group ($ 594.7 million or 32.1%)
followed by petroleum group ($ 457.7 million or
24.7%), agricultural/chemicals group ($ 248.8
million or 13.4%) and food group ($ 141.9
million or 7.7%). The details are given in Table
9.8 and fig-3.
Table 9.8Major Contributors to Additional
Import Bill(July-April, 2002-2003 *)
ImportsNet Increase
$ Million%
Contribution
Additional Import Bill
- Food
- Machinery
- Petroleum
- Textile
- Agricultural/Chemicals
- Metal
- Miscellaneous & Others
1854.5
141.9
594.7
457.7
28.7
248.8
35.1
347.6
100.0
7.7
32.1
24.7
1.5
13.4
1.9
18.7* Provisional Source: FBS & E.A.Wing, Finance Division
Chapter 9. Trade and Payments
Food7.7%
Petroleum24.7%
Textile1.5%
Agri/Chemicals13.4%
Metal1.9%
Misc.& Others18.7%
Fig-3: Major Contributors to Additional Import Bill(July-April, 2002-03)
Month – Wise Imports
The month-wise imports during July-April, 2002-03 remained consistently higher than the corresponding months of last year. Imports averaged $ 1009.9 million per
month during this period as against $ 824.5 million of the comparable period last year. In other words, on average, imports have been higher by $ 185.4 million per month during this period. The monthly imports are tabulated in Table 9.9 and fig-4.
Table 9.9Month-Wise Imports
($ Million)
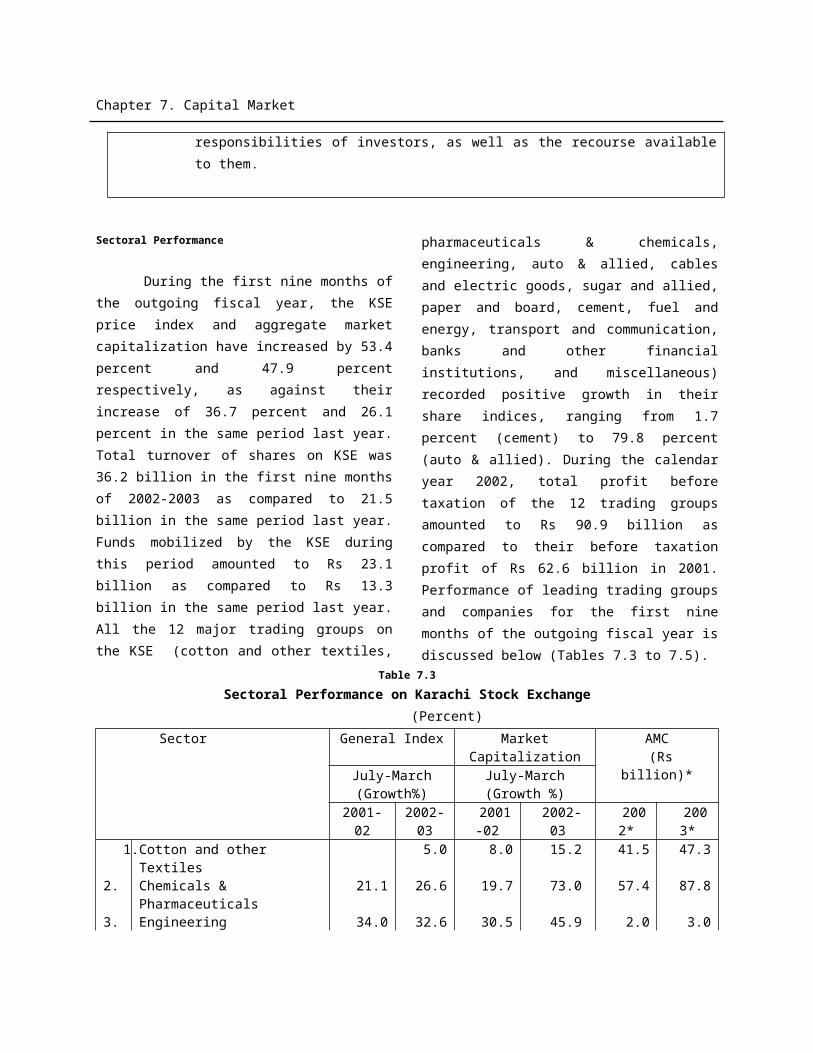
Chapter 9. Trade and Payments
Mont2001-02
2002-
Jul Aug Sep Oct Nov Dec Jan Feb Mar Apr
650
750
850
950
1050
1150
1250
1350
Fig-4: Month Wise Imports
2001-02 2002-03
($ M
illion
)
JulyAugustSeptemberOctoberNovemberDecemberJanuaryFebruaryMarch April *
791.6937.9774.5838.3825.3707.7854.8738.1886.6890.1
927.2969.3880.31018.
0960.21032.
61053.
1918.71270.
51069.
6Monthly Average
824.5
1009.9
* Provisional Source: Federal Bureau of Statistics
Pakistan had to spent $ 730.9 million
more over last year on the import of major items
during July-April, 2002-03 due to higher import
prices prevailing in the international market [See
Table 9.10]. Had the unit values of these import
items remained at the last year’s level, the
imports would have been lower at $ 9368.6
million, as against $ 10099.5 million, and the
import growth would have been 13.6 percent
instead of 22.5 percent as achieved during the
first ten months of the current fiscal year.
Table 9.10Additional Import Bill as a Result of the Rise in Import Prices
July-April 2002-03 *($ Million)
Commodity Actual ImportsImports at LastYear’s Prices
AdditionalBill
Soyabean OilPalm OilPetroleum ProductsPetroleum CrudeFertilizerPlastic MaterialMedicinal ProductsIron & Steel
41.9441.2
1473.31210.1
212.1342.0170.8325.3
26.5317.0
1215.11009.5
168.5324.0158.6266.6
15.4124.2258.2200.6
43.618.012.258.7
Total 4216.7 3485.8 730.9
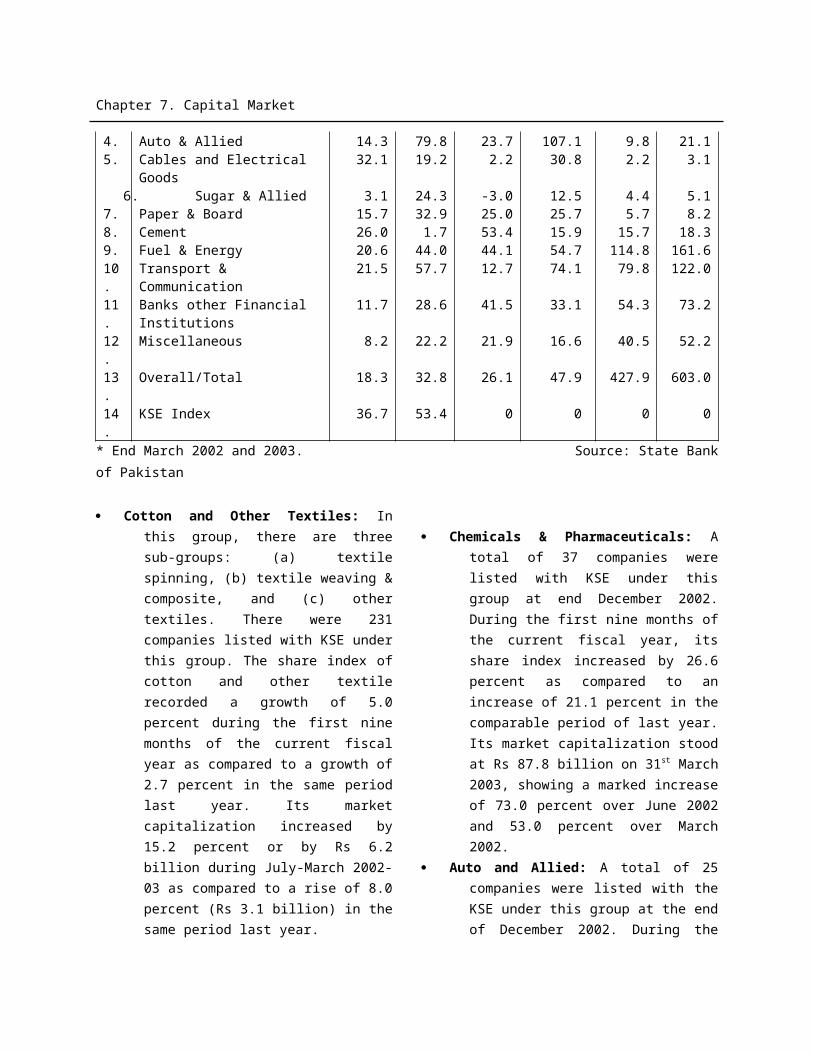
Chapter 9. Trade and Payments
* Provisional Source: FBS & E.A.Wing, Finance Division
Concentration of Imports
Pakistan's imports are highly concentrated in few items namely, machinery, petroleum & petroleum products, chemicals, transport equipments, edible oil, iron & steel, fertilizer and tea. These eight categories of imports accounted for 75.2 percent of total imports during 2001-02. Among these categories, machinery, petroleum & petroleum products and chemicals accounted for
almost 60.1 percent of total imports. Considerable structural changes have taken place in some categories of imports over the years. The share of machinery has declined on account of sliding investment but during 2000-01 and 2001-02 its share has increased due to higher imports of power generating machinery, electrical & textile machinery and construction & mining machinery. The share of chemicals depicted a gradual rising trend, while that of petroleum and petroleum products picked up – mainly on account of rising domestic demand and higher international prices [See Table 9.11].
Table 9.11Pakistan's Major Imports
(Percentage Share)
Commodities
90-91
91-92
92-93
93-94
94-95
95-96
96-97
97-98
98-99
99-00
00-01
01-02
Machinery *
20.5 27.0 24.3 22.0 22.8 21.6 23.1 18.9 17.9 13.9 19.3 17.1
Petroleum & Products
22.2 15.0 15.5 16.1 15.3 16.8 19.0 15.5 15.5 27.2 31.3 27.1
Chemicals @
12.8 13.1 12.5 14.4 14.0 15.6 13.4 15.7 16.6 17.5 20.0 15.9
Transport Equipments
6.7 9.0 12.5 9.7 5.9 4.7 4.7 4.8 5.7 5.5 4.0 4.8
Edible Oil 5.3 4.4 5.9 5.7 9.6 7.3 5.1 7.6 8.7 4.0 3.1 3.8
Iron & Steel
3.3 3.5 3.2 3.8 3.6 4.1 3.9 3.2 3.1 3.0 2.6 3.3
Fertilizer 3.5 2.8 2.5 3.1 1.2 2.9 3.2 2.1 2.8 1.9 1.6 1.7
Tea 2.2 1.9 2.1 2.2 1.8 1.4 1.1 2.2 2.4 2.0 1.9 1.5
Sub-Total 76.5
76.7
78.5
77.0
74.2
74.4
73.5
70.0
72.7
75.0
83.8
75.2
Others 23.5 23.3 21.5 23.0 25.8 25.6 26.5 30.0 27.3 25.0 16.2 24.8
Total 100.0
100.0
100.0
100.0
100.0
100.0
100.0
100.0
100.0
100.0
100.0
100.0
Chapter 9. Trade and Payments
* excluding transport equipments Source: Ministry of Commerce
@ Excluding fertilizer
Composition of ImportsThe composition of Pakistan’s imports
has not witnessed any appreciable change over the years. The share of raw material for consumer goods in the total imports continued to be higher. On the other hand, the share of raw material for capital goods was minimum. The share of capital goods exhibited a declining trend — mainly because of slow down of investment in the country. The share of consumer goods over the time remained flat.
During the current fiscal year (July-March, 2002-03), the share of consumer goods declined by two percentage points and came to 10 percent while the share of raw material for consumer goods remained flat at 55 percent. However, due to higher imports of machinery, the share of capital goods increased from 27 percent to 29 percent, whereas the share of raw material for capital goods did not show any change during this period and remained at 6 percent. The details are given in Table 9.12.
Table 9.12Composition of Imports
(Rs. Million)
YearTotal
Imports
Capital GoodsRaw Material For
Consumer GoodsCapital Goods
Consumer Goods
Value%
Share
Value%
Share
Value%
ShareValue
%Share
1990-91 171,11456,30
333
11,621
776,29
044 26,900 16
1991-92 229,88996,45
342
15,167
788,79
138 29,478 13
1992-93 258,643108,9
9342
14,304
699,29
038 36,056 14
1993-94 258,25097,30
138
15,692
6110,2
9143 34,966 13
1994-95 320,892112,3
0535
16,754
5148,4
1946 43,414 14
1995-96 397,575140,4
0535
22,541
6180,5
3945 54,090 14
1996-97 465,001169,7
7437
22,259
5202,3
7943 70,589 15
1997-98 436,338139,6
1832
23,344
5195,5
2845 77,848 18
1998-99 465,964146,4
5031
25,646
6220,5
6347 73,305 16
Chapter 9. Trade and Payments
99-2000 533,792140,0
45
2630,71
2
6287,8
01
54 75,234 14
2000-01 627,000157,0
9125
34,371
6345,7
7055 89,768 14
2001-02 634,630176,7
0228
39,038
6346,8
6555 72,025 11
Jul-Mar
2001-02 455,177123,4
2427
28,779
6249,3
7655 53,598 12
2002-03 *
530,125155,7
2529
30,269
6290,5
5455 53,550 10
* Provisional Source: Federal Bureau of StatisticsDirection of Imports
Pakistan’s major imports are coming from few countries. Slightly below one-half of Pakistan’s imports continue to originate from seven countries namely, USA, Japan, Kuwait, Saudi Arabia, Germany, UK and Malaysia. By and large, the relative shares of imports originating from these countries have remained almost the
same during 2001-02. The share of Japan exhibited a declining trend because of the shift in the import of machinery/capital goods from other sources. On the other hand, the shares of Pakistan’s imports from Kuwait and Saudi Arabia have been rising with some fluctuations because of the growing share of POL products in total imports. Import share of Malaysia has been fluctuating over the years mainly on account of fluctuations in palm oil prices [See Table 9.13].
Table 9.13Major Sources of Imports
(Percentage Share)
Country90-91
91-92
92-93
93-94
94-95
95-96
96-97
97-98
98-99
99-00
00-01
01-02
U.S.A. 11.8
10.5
9.4 10.6
9.4 8.9 12.0
11.2
7.7 6.3 5.3 6.7
Japan 13.0
14.3
15.9
11.8
9.6 10.7
8.6 7.8 8.3 6.3 5.3 5.0
Kuwait 0.7 0.9 3.3 5.3 5.8 6.4 6.9 5.6 5.9 12.0
8.9 7.1
Saudi Arabia
6.2 5.2 5.4 5.4 4.9 5.9 6.0 6.1 6.8 9.0 11.7
11.6
Germany 7.3 8.0 7.4 7.7 6.8 5.8 5.6 5.2 4.1 4.1 3.5 4.3U.K. 4.9 5.5 5.2 4.9 5.1 4.4 5.0 4.1 4.3 3.4 3.2 3.4Malaysia 4.0 4.2 5.1 5.5 8.8 7.2 4.7 7.1 6.7 4.3 3.9 4.4Sub-Total 47.
948.
651.
751.
250.
449.
348.
847.
143.
845.
441.
842.
5Other Countries
52.1
51.4
48.3
48.8
49.6
50.7
51.2
52.9
56.2
54.6
58.2
57.5
Total 100.0
100.0
100.0
100.0
100.0
100.0
100.0
100.0
100.0
100.0
100.0
100.0
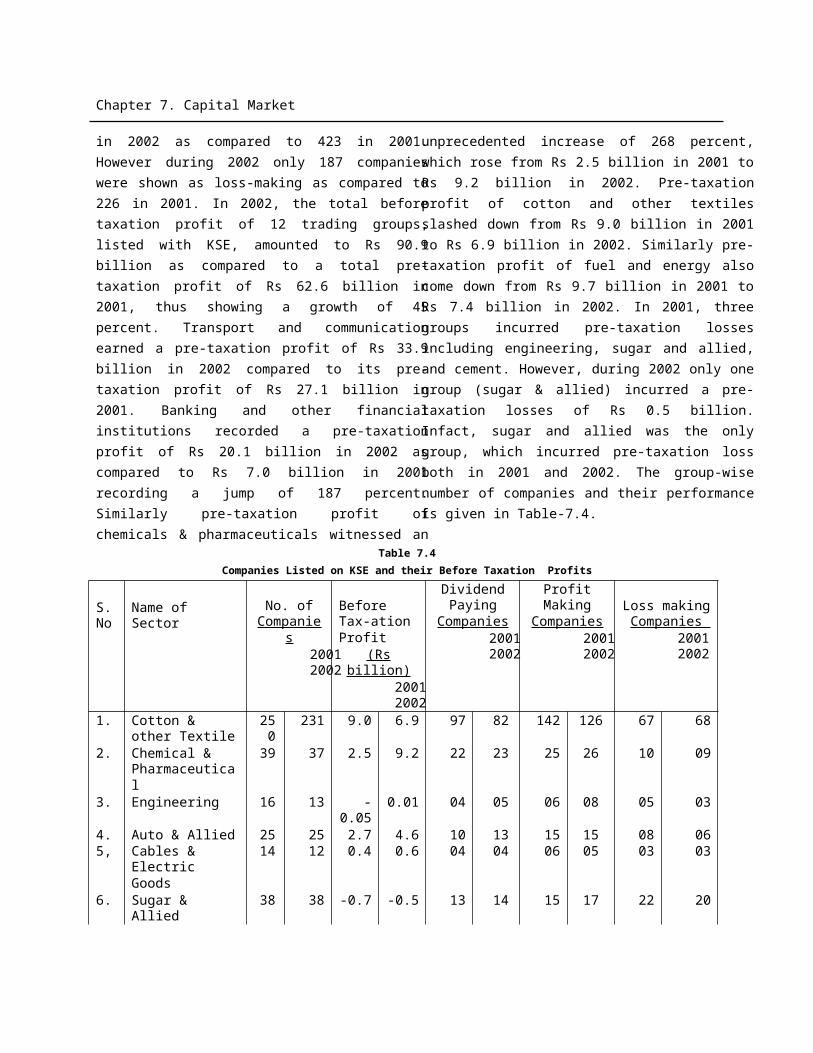
Chapter 9. Trade and Payments
Source: Ministry of Commerce
Trade BalanceThe deficit in trade balance during
2001-02 narrowed significantly by 21.1 percent – declining from $ 1527 million or 2.6 percent of GDP (2000-01) to $ 1205 million or 2.0 percent of GDP. The improvement was attributed to lower imports of petroleum group ($ 554 million) and sugar ($ 228 million) which caused total
imports to decline by 3.6 percent in the previous year (2001-02). However, for the current fiscal year 2002-03, trade deficit was targeted at $ 753 million. During the first ten months of 2002-03, trade deficit stood at $ 1249.8 million, as against $ 920.8 million in the comparable period last year, showing a deterioration of 35.7 percent [See fig.5].
The deterioration of $ 329 million during July-April, 2002-03 was mainly on account of sharp increase in the import price of petroleum products & crude which increased by 21.2 percent and 19.9 percent, respectively due to build-up in oil reserves, necessitated by the fear of Iraq war. Excluding petroleum group’s increase, the trade deficit posted an improvement of 14.0 percent or $ 128.8 million. Given the buoyant nature of domestic economic activity, higher than targeted increase in trade deficit is quite natural.
Terms of Trade
The terms of trade with base year 1990-91
(equal to 100) remained flat at 90.8 during 2001-02 as compared to 91.0 of 2000-01. However, the terms of trade during July-March, 2002-03 has worsened by 12.1 percent and stood at 80.7 over the level of 91.8 recorded in the same period last year. The deterioration in terms of trade is the obvious result of sharp increase in unit prices of petroleum products and crude in the international market. The export unit value index during this period reflected a decline of 8.6 percent while import unit value index showed a buoyancy of 3.9
90-9
1
91-9
2
92-9
3
93-9
4
94-9
5
95-9
6
96-9
7
97-9
8
98-9
9
99-0
0
00-0
1
01-0
2
01-0
2 (
Jul-A
pr)
02-0
3 (
Jul-A
pr)0
500
1000
1500
2000
2500
3000
3500
0
1
2
3
4
5
6
7
8
1488
2348
3128
1761
2257
3098
3574
1490
1653
1740
1527
1205
921
1250
3.3
4.8
6.1
3.4
3.7
4.9
5.7
2.6
2.0
Fig-5: Trends in Trade Deficit
Trade Deficit As % of GDP
US
$ M
illio
n
As
% o
f G
DP

Chapter 9. Trade and Payments
percent. [See Table 9.14]. The trend depicted by the terms of trade is also shown in fig.6.
Table 9.14Unit Value Indices and Terms of Trade
(Base year 1990-91 = 100)
YearUnit Value Indices
Terms of Trade Exports Imports
1991-92 119.9 131.9 90.9
1992-93 123.5 133.5 92.5
1993-94 142.9 141.2 101.2
1994-95 168.6 164.2 102.7
1995-96 185.4 185.5 99.9
1996-97 204.8 201.7 101.6
1997-98 245.6 198.9 123.5
1998-99 258.4 223.3 115.7
99-2000 253.8 259.0 98.0
2000-01 271.5 298.4 91.0
2001-02 271.2 298.6 90.8
July-March
2001-02 272.7 297.0 91.8
2002-03 * 249.1 308.7 80.7
* Provisional. Source: Federal Bureau of Statistics
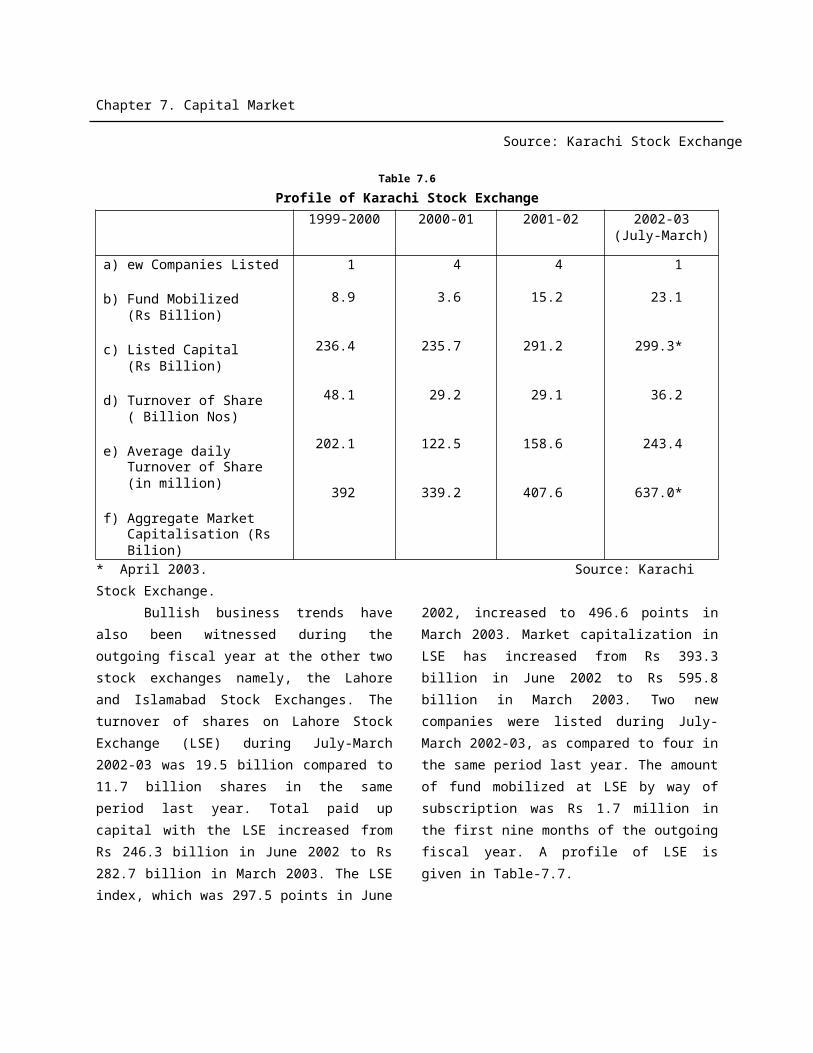
Chapter 9. Trade and Payments
1991
-92
1992
-93
1993
-94
1994
-95
1995
-96
1996
-97
1997
-98
1998
-99
99-2
000
2000
-01
2001
-02
2001
-02
(Jul
-...
2002
-03
(Jul
-...
70
80
90
100
110
120
130
Fig-6: Terms of Trade (base year 90-91=100)
Trade PolicyThe trade policy for the current fiscal year
(2002-03) was premised on the principle of maximum participation of all the stakeholders for the promotion of trade and industrial growth. Its framework has ensured consistency of policies with minimum government intervention. The trade policy is guided by market driven forces and also aimed at to further liberalize & deregulate the economy and provide incentives for reducing the cost of doing business in Pakistan. The focus has been placed on macro-economic stability, especially in terms of inflation, interest rates and exchange rate, with a view to expand and diversify the country’s export base – both market-wise and product-wise. The salient features of the policy, 2002-03 are summarized below:
Freight subsidy up to 25 percent for new products and new markets.
Registration requirement for exporters and importers has been waived and monetary limits on exports of samples enhanced from $ 5,000 to $ 10,000.
Export of wheat and its milling products has been allowed.
Export of petroleum products allowed to private sector.
Import duty of 15 percent on import of finished leather has been abolished to facilitate leather exports.
To make export of gems and jewellery easier, the condition of purchase up to $ 10,000 and provision of encashment certificate has been removed, as well as value addition requirement of export of bangles reduced to 5 percent.
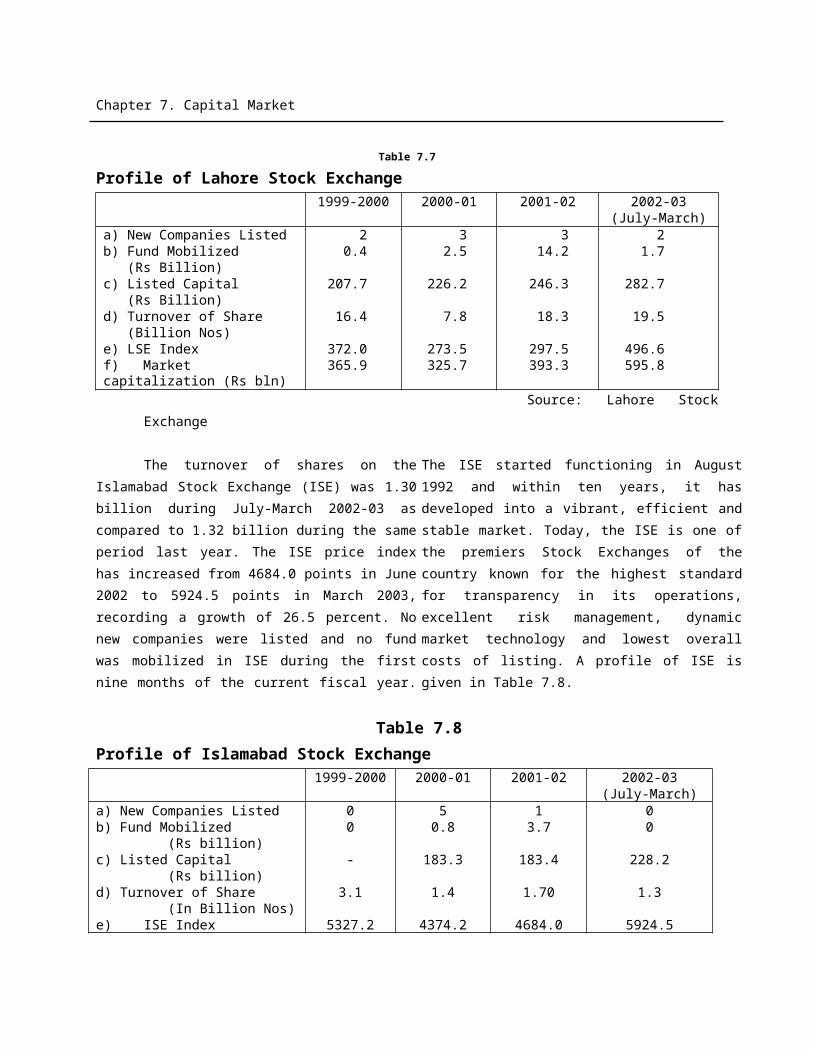
Chapter 9. Trade and Payments
Export of old machinery allowed subject to no refund of import levies or duty drawback.
Export of carpets in baggage allowed without production of foreign exchange encashment certificate.
Amount of security deposit with Export Promotion Bureau for export of cotton reduced from 3 percent to 2 percent.
Duty draw back made permissible on all exports made in foreign exchange to Afghanistan via land route except items on negative list.
Pakistan Export Finance Guarantee Agency has been set up in the private sector to facilitate SMEs to access financing for working capital.
Agricultural Produce Cess at the rate of 0.5 percent on agricultural exports withdrawn.
The maximum tariff rate has been brought down to 25 percent and the number of tariff slabs have been reduced from 5 to 4.
Ban on the import of machinery more than five years old has been lifted.
Import of second-hand or used surgical equipments like dialysis machines, reverse osmosis equipments and other electro-medical equipments not more
than five years old has been allowed.
Condition of continuous stay abroad of last six months for importing vehicle by overseas Pakistanis under Transfer of Residence Scheme has been relaxed by allowing 30 days break in Pakistan.
The condition of registration in the name of the importer to import vehicle under Transfer of Residence Scheme has been reduced from two years to one year prior to his/her departure to Pakistan. A motor cycle or scooter has been allowed to be imported upon transfer of residence provided that there shall be no entitlement to import a vehicle.
Import of gold and silver in bulk has been allowed to all subject to importer’s own foreign exchange.
Import of mobile phones has been allowed.
Industrial consumers have been allowed to import machinery and parts up to value of $ 30,000 against bank draft without opening of letter of credit.
Balance of Payments
A sustained improvement was witnessed in the balance of payments position of Pakistan during 2001-02 when the deficit in current account amounting to $ 513 million (2000-01) turned into surplus
Chapter 9. Trade and Payments
by $ 1338 million or 2.3 percent of GDP (excluding official transfers) - with official transfers, the surplus was much higher at $ 2744 million. The substantial improvement, that is, reversal from deficit to surplus was attributed to a combination of factors. A marked reduction of 76.8 percent in trade deficit (f.ob.) was witnessed, which was attributed to negative growth in imports caused by lower POL and sugar imports. Buoyancy was observed in the inflow under private transfers which depicted an increase of 9.0 percent and aggregated at $ 4249 million. Buoyant trend in private transfers was largely attributed to 119.8 percent increase in workers remittances. Moreover, deficit on account of services (net) narrowed by 16.7 percent or $ 525 million – due mainly on account of 38.5 percent increase in aggregate receipts. The long term capital (net) improved markedly by $ 1109 million. Consequently the year ended with a sound build up of $ 2792 million in foreign exchange reserves.
The current account balance during July-March, 2002-03 continues to remain in surplus. Notwithstanding, the deterioration in trade balance, the improvement in services account on the one hand and significant improvement in private transfers including workers remittances on the other, the current account balance (without official transfers) registered a surplus of $ 2562 million (or 3.7% of projected GDP) in the first nine months of the current fiscal year as against a surplus of $ 1014 million in the same period last year – an increase of 152.7 percent. With official transfers, the surplus in current account jumps to $ 4375 million as against a surplus of $ 2227 million in the same period last year – an increase of 96.4 percent. The deficit under services account posted a significant contraction of $ 745 million or 41.7 percent, exclusively on account of 52.7 percent rise in aggregate receipts. The trade balance deteriorated because of higher imports of machinery and rise in unit prices of POL & edible oil. The higher imports of machinery were essential for pick up in domestic economic activity. The private transfers in this period were significantly up by 40.1 percent to $ 4215 million – resulting from impressive increase of 98.6 percent in workers remittances. The flow under long term capital (net) increased significantly by 73.0 percent and aggregated at $ 751 million. Thus, the first three quarters (July-March) of the current fiscal year 2002-03 ended with a strong build up of $ 4038 million in foreign exchange reserves [See Table 9.15].
Table 9.15Balance of Payments
($ Million)
Components 2000-01 2001-02July-March
2001-02 2002-03 (P)Trade balance -1269 -294 -206 -610 Exports (fob) 8933 9140 6658 7761 Imports(fob) -10202 -9434 -6864 -8371Services (net) -3142 -2617 -1788 -1043Private transfers (net) Workers remittances
38981087
42492389
30081627
42153230
Current account balance Excluding official transfers -513 1338 1014 2562 Including official transfers 326 2744 2227 4375Long term capital (net) 171 1280 434 751Changes in reserves (- = Increase)
-1001 -2792-1749
-4038
P: Provisional Source: State Bank of Pakistan.
Chapter 9. Trade and Payments
Workers Remittances
Workers remittances during 2001-02 ended up with impressive growth of 119.8 percent and aggregated at $ 2.389 billion, as against $ 1.087 billion recorded during 2000-01. For the current fiscal year (2002-03), the workers remittances were targeted at $ 2.873 billion – 20.3 percent higher than last year. During the first nine months (July-March), the target for the whole year was already achieved. Remittances during this period amounted to $ 3.230 billion, as
against $ 1.627 billion in the same period last year – thus registering an increase of 98.6 percent. Remittances have averaged $ 358.9 million during the first nine months and if this trend continues, total remittances for the fiscal year 2002-03 are likely to be $ 4.3 billion—highest ever in the country’s history [See Table 9.16]. Monthly remittances which used to hover in the range of $ 75 – 85 million during 2000-01 now averaging $ 359 million in the current fiscal year, showing a quantum jump, never experienced before [See fig-7].
2000
-Jul
Aug
Sep Oct
Nov
Dec Ja
n
Feb
Mar
Apr
May Ju
n
2001
-Jul
Aug
Sep Oct
Nov
Dec Ja
n
Feb
Mar
Apr
May Ju
n
2002
-Jul
Aug
Sep Oct
Nov
Dec Ja
n
Feb
2003
-Mar
0
50
100
150
200
250
300
350
400
450
Fig-7: Month-Wise Workers Remittances(July,2000 to March,2003)
($ M
illio
n)
Table-9.16Workers Remittances
($ million)Months 2002-03 2001-02 % Change
July 305.44 84.74 260.44August 286.07 87.91 225.41September 335.09 91.19 267.46October 377.18 185.35 103.50
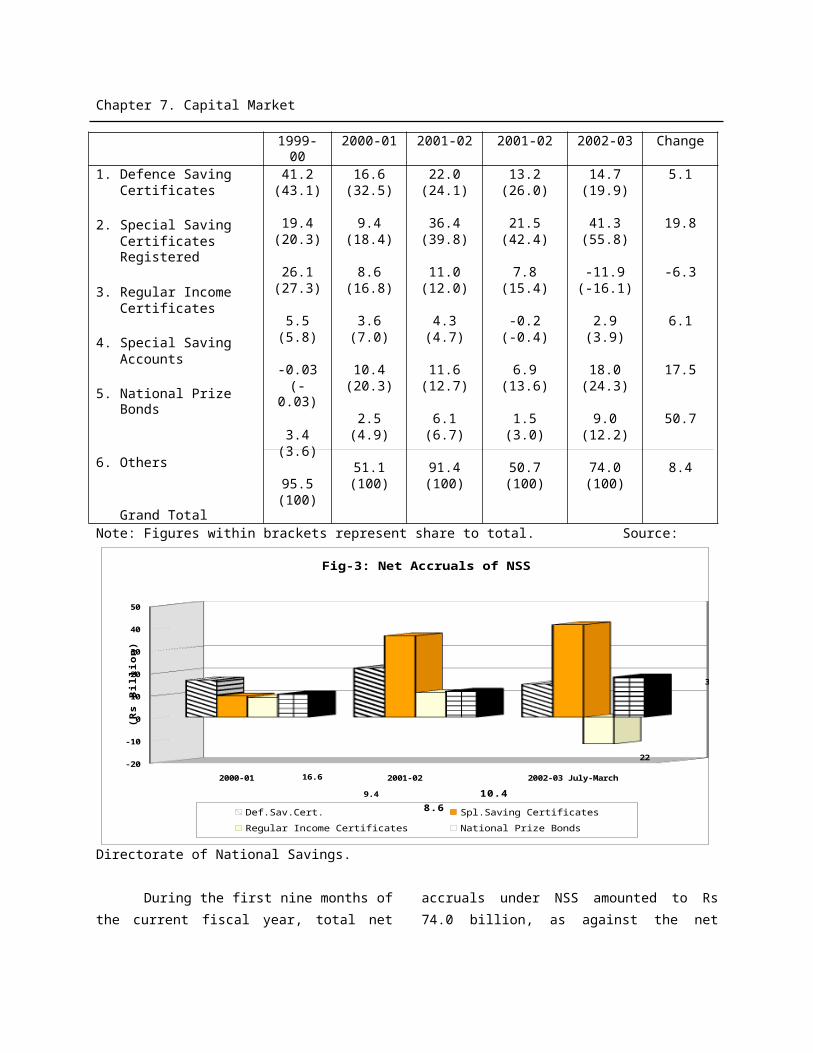
Chapter 9. Trade and Payments
November 351.74 259.87 35.35December 363.19 189.49 91.67January 383.22 180.52 112.29February 342.77 233.85 46.58March 356.41 227.17 56.89July-March 3101.11 1540.09 101.36Total Remittances including Hajj and War Compensation (July-March) 3230.08 1626.62 98.58
Source: State Bank of PakistanWith 29.2 percent share in total
remittances, the United States has emerged as the single largest source of cash remittances. Remittances from the US amount to $ 943.2 million or up by 95.0 percent over the corresponding period of last year. Remittances from the UAE are next in line with $ 665.9 million or 20.6
percent of the total remittances. Remittances from the UAE are also up by 91.4 percent against the corresponding period of last year. Remittances from Saudi Arabia are at $ 422.8 million or 13.1 percent of the total and are higher by 63.2 percent [See Table 9.17].
Table 9.17Country-Wise Workers Remittances
($ Million)
CountryJuly-March
2002-03 % Share 2001-02 % ShareI. Cash 3200.63 - 1586.68 -
Bahrain 53.30 1.65 27.37 1.68Canada 11.17 0.35 17.26 1.06Germany 17.97 0.56 8.15 0.50Japan 6.35 0.20 3.70 0.23Kuwait 184.43 5.71 60.31 3.71Norway 6.54 0.20 4.83 0.30Qatar 66.79 2.07 22.30 1.37Saudi Arabia 422.75 13.09 258.96 15.92Sultanat-e-Oman 69.21 2.14 44.69 2.75U.A.E.(Abu Dhabi, Dubai, Sharjah,
Others)
665.88 20.61 347.87 21.39
U.K. 197.45 6.11 103.51 6.36U.S.A. 943.21 29.20 483.80 29.74Other Countries 555.58 17.20 203.93 12.54
II. Encashment and Profit * 29.45 0.91 39.94 2.45Total (I + II) 3230.08 100.00 1626.62 100.00
* Encashment and Profit in Pak. Rs. of Foreign Exchange Source: State Bank of Pakistan
Chapter 9. Trade and Payments
Bearer Certificates & Foreign Currency Bearer Certificates.
Main factors contributed to the sharp increase in the inflow of remittances include; significant improvements in economic fundamentals, confidence of the expatriate Pakistanis on the economic management of the country, better exchange rate offered in the inter-bank market as against the open market, aggressive marketing of Pakistani banks in foreign countries and motivating the people to send their remittances through banking channel, and crackdown on hundi/hawala system in the Middle East and other parts of the world.
Foreign Exchange Reserves
The foreign exchange reserves have crossed the $ 10 billion mark, for the first
time in the history of Pakistan on 7th March, 2003. The government’s macroeconomic policies that have been pursued over the last three years have paid dividend. The rising trend continued and foreign exchange reserves stood at $ 10.377 billion on end April, 2003 – sufficient to finance around 11 months of imports. Since July 31, 2002 and until April 30, 2003, Pakistan has added $ 3.352 billion in its foreign exchange reserves. By the end of the fiscal year 2002-03, Pakistan’s gross reserves are likely to be around $ 11 billion. Pakistan has added $ 7.109 billion (till end April, 2003) in its reserves since July 31, 2001 [See Table 9.18 and fig.8]. With the impressive build up in reserves, Pakistan is in a position to meet any abnormal shock on external front.
Table 9.18Foreign Exchange Reserves – End Period
($ Million)
Month ReservesJuly, 01 3268.3August 3373.4September 3304.2October 3594.7November 4399.9December 4814.2January, 02 4907.3February 5111.9March 5235.1April 5292.3May 5566.0June 6259.5July 7025.3August 7543.6September 8200.8October 8547.2November 9016.6December 9335.4January, 03 9503.9
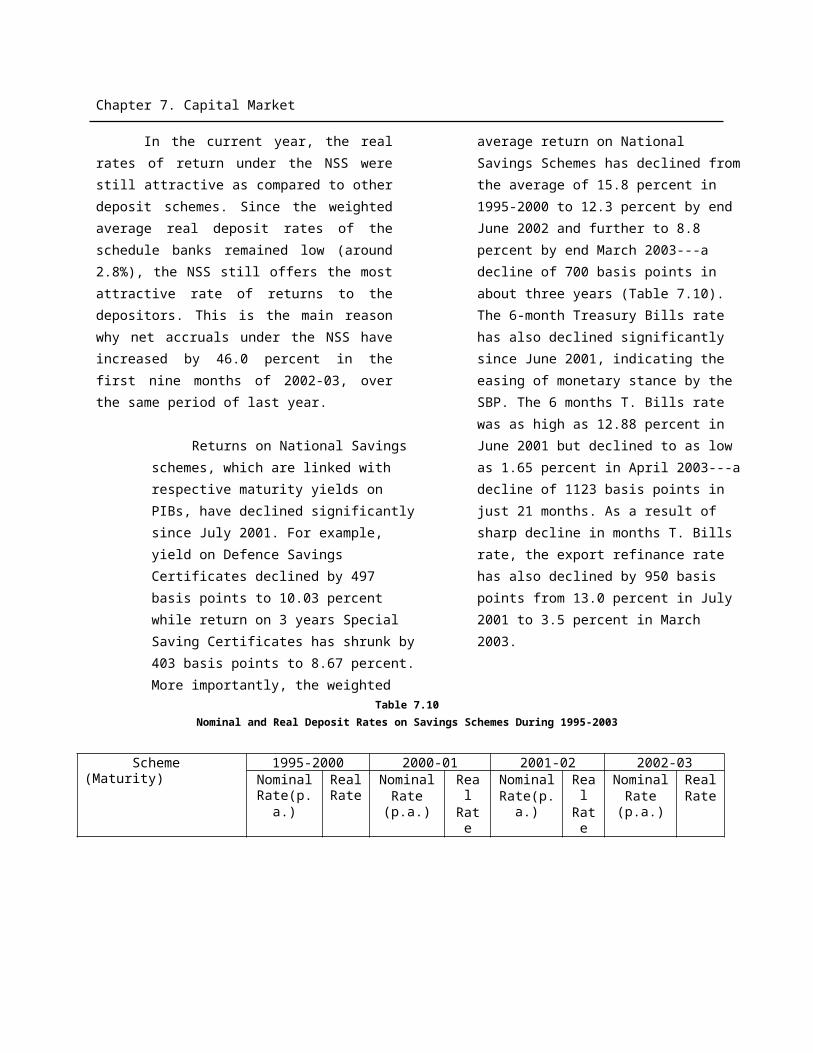
Chapter 9. Trade and Payments
Jul, 0
1 Aug
Sep
Oct
Nov
Dec
Jan,
02 Feb
Mar
Apr
May Jun Jul
Aug
Sep
Oct
Nov
Dec
Jan,
03 Feb
Mar
Apr
0
2000
4000
6000
8000
10000
12000
Fig-8: Reserves - End Period
($ Mi
llion)
February 9625.4March 10307.0
April 10377.2Source: State Bank of Pakistan
Exchange Rate
The free-floating exchange rate system, which was adopted from July 21, 2000, remained operative during the current fiscal year 2002-03. The continued build up in foreign exchange reserves, surplus in current account balance and increased inflow of remittances through banking channel has strengthened Pakistani rupee viz. US dollar both in inter-bank foreign exchange market and in open market. The inter-bank exchange rate per US dollar averaged Rs. 57.7757 during April 2003, as against Rs. 59.7907 averaged during July 2002 [See Table 9.19 & fig.9], thereby showing an appreciation of 3.49 percent. In the open market, Pak rupee also gained strength during this period and appreciated by 3.25 percent.
The exchange rate of Euro against Rupee has gradually gained strength. Pak-rupee exchange rate in terms of one unit of Euro during January, 2002 averaged at Rs. 53.2444 which picked to an average of Rs. 59.3382 in July, 2002. In the month of April, 2003, the average parity rate of Euro was further up at Rs. 62.7277. Thus, Pak-rupee depreciated viz. Euro since the beginning of the current fiscal year and untill April, 2003 by 5.40 percent – mainly because the Euro zone currency (Euro) has emerged as a single preferred currency for the local as well as for the global investors. The movement of Pak-rupee exchange rate versus one unit of US dollar and Euro is given in Table 9.19 and fig.9.
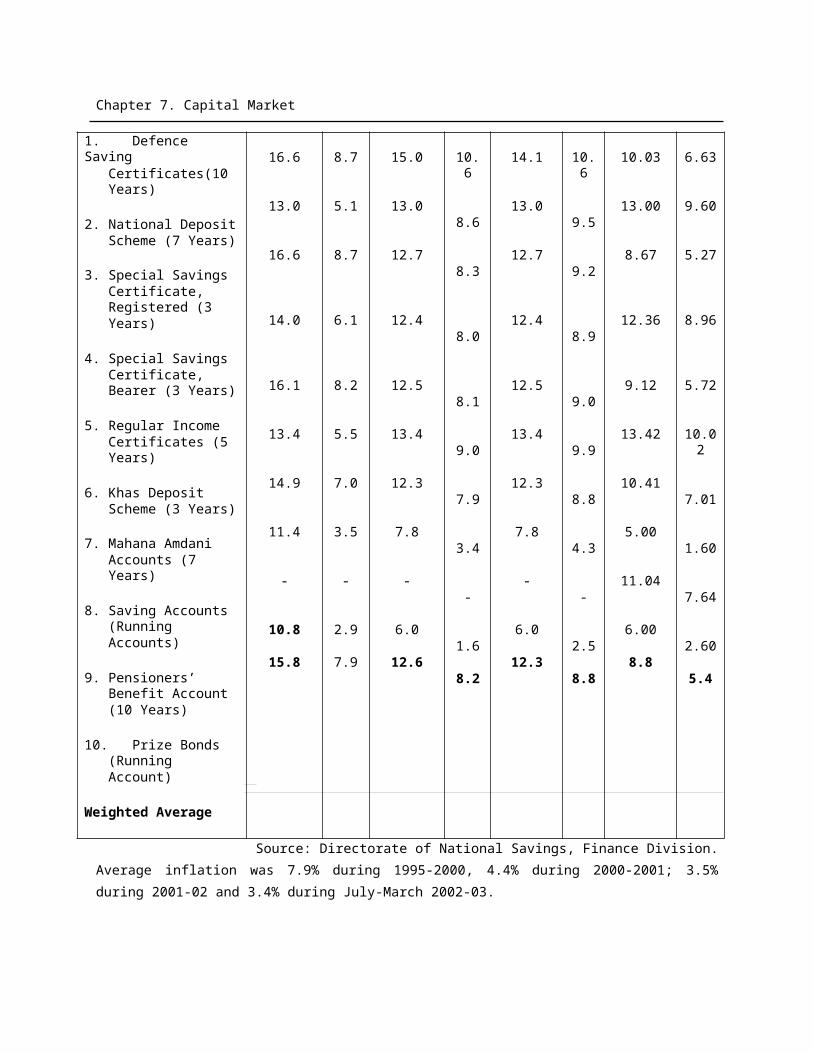
Chapter 9. Trade and Payments
Table 9.19Average Exchange Rate
($/Rs and Euro/Rs)
Month $/Rs Euro/Rs
Jan,
02 Fe
b
Mar
Apr
May
Jun Jul
Aug
Sep
Oct
Nov
Dec
Jan,
03 Fe
b
Mar
Apr
50
51
52
53
54
55
56
57
58
59
60
61
62
63
64
65
Fig-9: Average Exchange Rate($/Rs and Euro/Rs)
Dollar Euro
(Rup
ees)
January, 02FebruaryMarchAprilMayJuneJulyAugustSeptemberOctoberNovemberDecemberJanuary, 03FebruaryMarchApril
60.2011
60.1611
60.1020
60.1232
60.1253
60.1246
59.7907
59.5102
59.2578
59.0530
58.5852
58.4162
58.1828
58.0811
57.8675
57.7757
53.244452.324052.626253.215755.110857.380759.338258.188158.105157.920358.646559.690861.815462.579162.455462.7277
Source: State Bank of Pakistan
______________________
Chapter 10. Foreign Economic Assistance
10. Foreign Economic Assistance
Pakistan’s external debt, by the end of the
1990s, has reached alarming proportions and
posted great danger to the economic future of the
country. The debt crisis was essentially triggered
by the unsustainability of the level of current
account deficits and pattern of their financing in the
1990s. During 1990-99, Pakistan ran current
account deficits [despite accruals of Resident
Foreign Currency Deposits (RFCDs) of $ 6.8
billion] totaling $ 24.4 billion or at an average rate
of 4.8 percent of GDP. If accruals to RFCDs are
treated as borrowing rather than earnings, the
cumulative current account deficit during 1990-99
was $ 31.2 billion or over 6 percent of GDP. This
means that about one-third of total investment was
financed from external borrowing as against a little
over 20 percent in the 1980s. The level of current
account deficit that Pakistan ran in the 1990s was
not sustainable even with a rapid expansion in the
exports. Thus, the debt service payments were not
possible without exceptional assistance from the
International Financial Institutions (IFIs) as well as
debt rescheduling.
Considerable progress has been made
towards addressing Pakistan’s debt problem
during the last three years. Current account
balance has turned surplus in 2001-02 and is
also projected to remain in surplus in 2002-03,
against an average deficit of almost 5 percent
of GDP in the 1990s. As a result of the overall
decline in the term structure of interest rates,
the cost of borrowing from external sources
have declined. The Paris Club debt
rescheduling has provided substantial debt
relief to Pakistan and also opened an avenue to
achieve debt sustainability. The government
has also set up a Debt Office in the Ministry of
Finance to institutionalize its debt management
capability. The progress towards stabilizing the
country’s debt situation for the last three years
in general and during the current fiscal year
(2002-03) in particular, is presented below:
Total Stock of External Debt
And Foreign Exchange Liabilities
Pakistan’s total stock of external debt and
foreign exchange liabilities stood at $ 21.9 billion
in 1990 and reached almost $ 38 billion by end-
June 1999, thus registering a growth of 6.5 percent
per annum. Following a credible strategy of debt
reduction over the last three years, Pakistan has not
only succeeded in arresting the rising trend in
external debt and foreign exchange liabilities but
also succeeded in reducing them. External debt and
foreign exchange liabilities have been reduced by $
1.386 billion in two years, ending June 2002.
During the first nine months (July-March) of the
current fiscal year 2002-03, Pakistan has also
Chapter 10. Foreign Economic Assistance
succeeded in reducing another $ 0.949 billion worth of debt and liabilities [See Table-10.1 and
fig-1].
Table 10.1External Debt and Foreign Exchange Liabilities
($ Billion)End June End March
Item 1990
1999
2000 2001 2002 2003 **
1.Public & Publicly Guaranteed Debt
18.2 28.3 27.862
28.145
29.235 29.381
A. Medium & long term (Paris Club, Multilateral & other Bilateral) 14.7 25.4
25.359
25.586
27.276 28.133
B. Other medium & long term (Bonds, Military & Commercial)
2.7 1.62.373 2.302 1.776 0.991
C. Short term (IDB) 0.8 1.3 0.130 0.257 0.183 0.2572. Private Non-guaranteed Debt 0.3 3.4 2.842 2.450 2.226 2.0293. IMF 0.7 1.8 1.550 1.529 1.939 2.069Total External Debt (1 through 3) 19.2 33.5 32.25
432.12
433.40
0 33.4794. Foreign Exchange Liabilities * 2.7 4.1 5.664 5.015 3.132 2.104
- Foreign Currency Accounts (2.1) (1.4) (1.7) (1.1) (0.4) (0.0)5.Total Debt and Liabilities (1 through 4)
21.9 37.6 37.918
37.139
36.532 35.583
Official Liquid Reserves - - 0.989 1.679 4.329 9.0856. Net Debt and Liabilities - - 36.92
935.46
032.20
3 26.498Source: Debt Management Committee Report (1990 and 1999) & State Bank of Pakistan (from 2000 onward) * Foreign Exchange Liabilities from 2000 onward are inclusive of National Debt Retirement Program & SWAP** Provisional
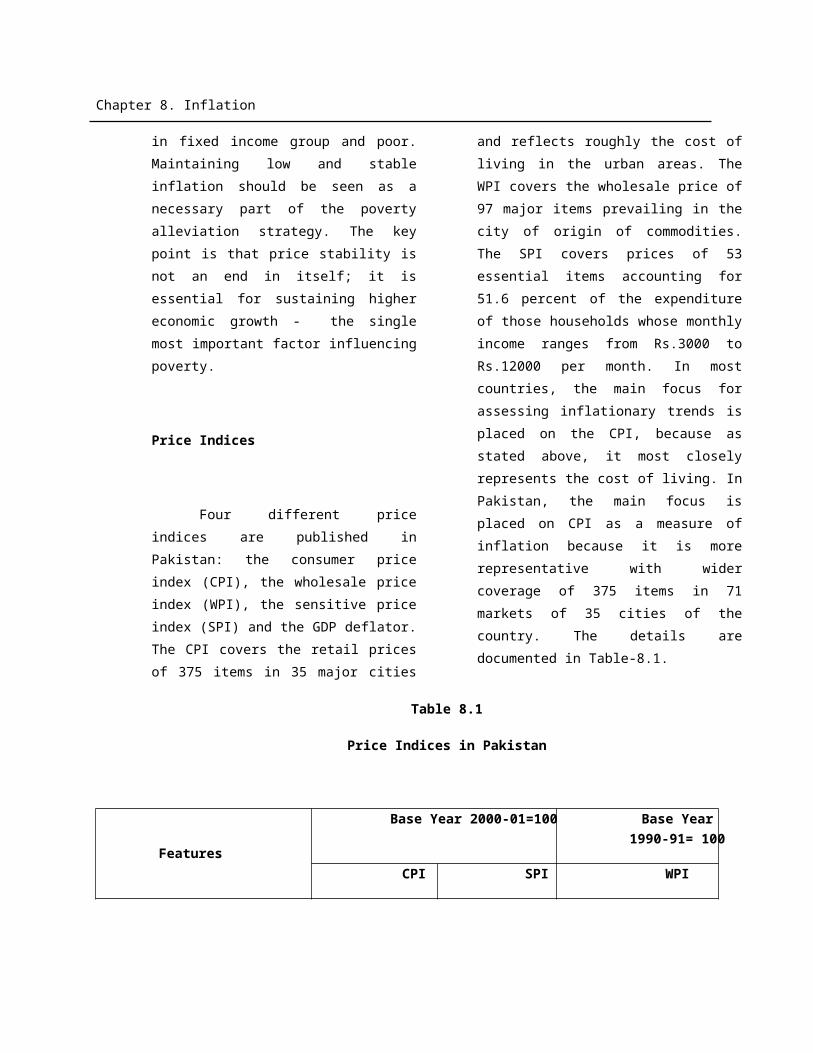
Chapter 10. Foreign Economic Assistance
2000 2001 2002 2003 (Jul-Mar)0
5
10
15
20
25
30
35
40
Fig-1: External Debt and Foreign Exchange Liabilities (End-June)
Total Debt and Liabilities Net Debt and Liabilities
($ b
illio
n)
It is important to note that Pakistan has not only succeeded in reducing external debt but at the same time built-up substantial foreign exchange reserves. In other words, total external debt and foreign exchange liabilities when adjusted for SBP liquid reserves stood at $ 36.929 billion by end June 2000. The net debt and liabilities have further been reduced to $ 26.498 billion by end March 2003—a reduction of $ 10.431 billion in less than three years [See Table-10.1 and fig-1]. As percentage of GDP, external debt and liabilities stood at 64 percent in end June 1999; declined to 60.2 percent in end June 2002; and projected to decline to 50.4 percent by end June 2003. More importantly, the net external debt and liabilities have declined from 60.8 percent of GDP in end June 2000 to 53.1 percent in end June 2002 and is projected to decline to 37.9 percent by end June 2003.
In order to achieve sustainability of external
debt, the government is contemplating to pre-pay
some of the expensive debts. The Debt Office of
the Ministry of Finance is currently engaged in
identifying expensive debts and examining their
terms and conditions associated with pre-mature
payments. Beginning from the next fiscal year, the
government would like to start pre-paying the
expensive debts.
Medium and Long TermStock of External Debt
The medium and long term external debt has accumulated annually by almost one billion US dollar in the 1990s – because of large current account deficits and heavy external borrowing. It, however, remained flat at around $ 25 billion per annum during 1998-99 to 2000-01 – it did not show any
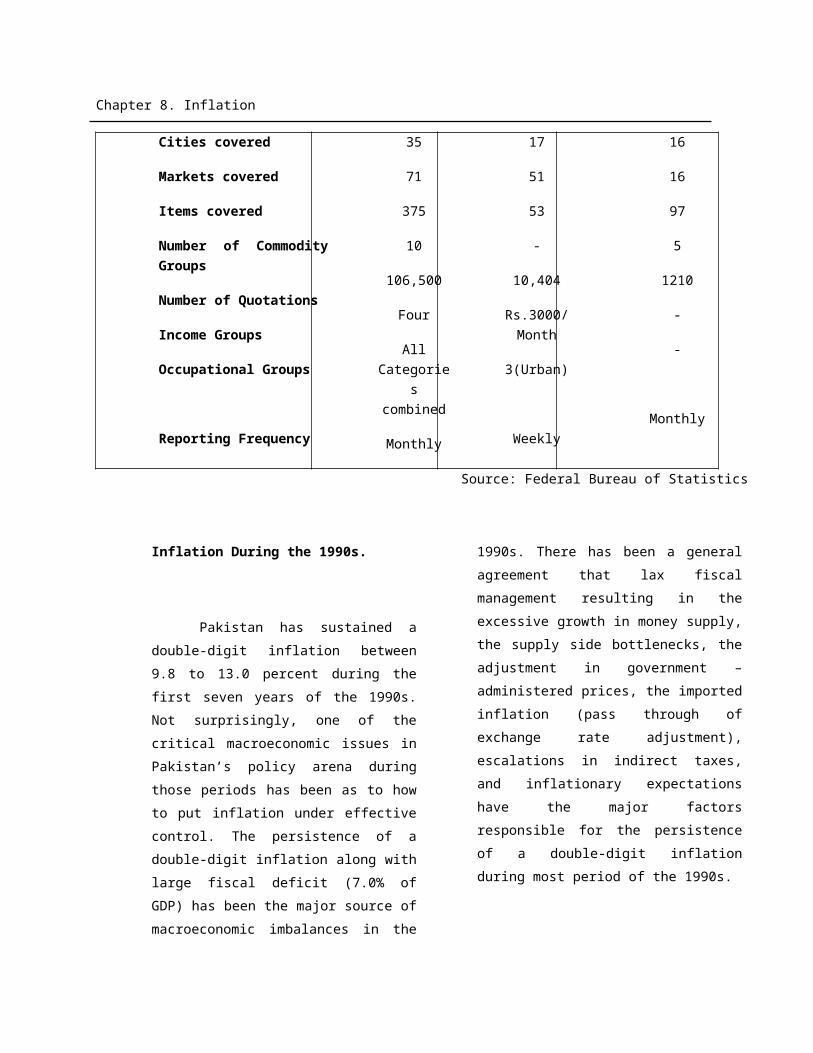
Chapter 10. Foreign Economic Assistance
appreciable increase due to reliance on short term borrowings. For the current fiscal year (July-March, 2002-03), the disbursed and out standing external debt (medium & long term) has provisionally been estimated at $ 28.4 billion, as compared to $ 27.2 billion of last year (2001-02), thereby showing a growth of 4.4 percent during the first three quarters of the current fiscal year. Medium and long term debt as percent of GDP during 2001-02 was 46.1 percent, as against 43.7 percent of the preceding year (2000-01). The increase in
debt to GDP ratio is attributed to addition of capitalized interest in debt stock as a result of first two debt rescheduling agreements concluded with the donors [See fig-2]. The debt as percentage of export earnings during 2001-02 was 297.9 percent as compared to 278.3 percent of 2000-01, which is significantly higher than the sustainable limit of 225 – 250 percent. The debt as percentage of GDP and export earnings during 2002-03 is expected to be about 42 percent and 274 percent, respectively.
The debt service payments in the current
fiscal year, 2002-03 are projected to increase by
18.0 percent to $ 1416 million, as against the
payment of $ 1200 million of last year (2001-02)
due to higher cost and lower maturity of the
previous loans. However, due to the debt relief
(resulting from rescheduling of debt) from the Paris
Club and Non-Paris Club donors/countries, the
debt servicing has significantly dropped. [See fig-
3]. Debt servicing as a percent of GDP has declined
from 3.3 percent in 2000-01 to 2.0 percent during
2001-02. As percentage of export earnings, debt
servicing also declined from 21.3 percent in 2000-
01 to 13.1 percent in 2001-02, which is within the
sustainable limit of 20 – 25 percent. The debt
servicing as percentage of GDP and export
90-9
1
91-9
2
92-9
3
93-9
4
94-9
5
95-9
6
96-9
7
97-9
8
98-9
9
99-2
000
2000-0
1
2001-0
2
2002-0
3 (
Jul-M
ar)
10000
15000
20000
25000
30000
25.0
30.0
35.0
40.0
45.0
50.0
55.0
60.0
1547
1 1736
1 1904
4 2032
2 2211
7
2229
2
2250
9
2284
4
2542
3
2535
9
2560
8 2721
5
2836
5
37.1
39.3
36.6
Fig-2: Debt Outstanding (Medium & Long Term)
Debt Outstanding As % of GDP
($ M
illio
n)
(As
% o
f G
DP
)
Chapter 10. Foreign Economic Assistance
earnings during 2002-03 is expected to be about
2.1 percent and 13.7 percent, respectively.
90-91
91-92
92-93
93-94
94-95
95-96
96-97
97-98
98-99
99-20
00
2000
-01
2001
-02
2002
-03
0
500
1000
1500
2000
2500
3000
1316
1513
1648
1746
2042
2136
Fig-3: Debt Service Payments($ Million)
Debt Service Payments
Rescheduling of Debt
Pakistan approached Paris Club
thrice for seeking debt relief/debt
rescheduling on its external bilateral debt.
The first debt rescheduling agreement was
reached in January, 1999 for $ 2.4 billion,
covering debt service maturities due during
January 1, 1999 to 29th February, 2000
(including debt service payments arrears
from July, 1998). The second debt
rescheduling agreement was signed in
January, 2001 for debt service payments
falling due during the period from March 1,
2000 to September 30, 2001. The amount
of debt relief under this agreement was $
1.7 billion. These two reschedulings were
‘flow’ rescheduling which limit rescheduling
to the debt servicing (principal plus
interest) falling due within a specified
period (consolidation period) which usually
coincides with a country’s programme with
the IMF. The flow rescheduling provides
temporary relief, as after the consolidation
period, the magnitude of debt servicing
reverts to the former high level. The issue
of debt overhang is only deferred and not
resolved.
The third rescheduling agreement
was negotiated with the Paris Club in
December, 2001. Unlike the previous two
reschedulings, the third one received ‘stock’
treatment which takes into account the
entire outstanding stock (principal plus
accumulated arrears) and reprofiles it to
over an extended period of time. The stock
treatment is rare as it is restricted by the
Paris Club to only Highly Indebted Poor
Countries (HIPC). Pakistan has been the
fourth Non-HIPC country to get stock
treatment of its debt beside Egypt, Poland
and Yugoslavia. It is important to note that
Pakistan did not seek standard Paris Club
terms such as Houston, Naples or Cologne,
rather it negotiated special terms which
were Pakistan specific. It is also important
to note that multilateral debts are not
reschedulable and that only the bilateral
Paris Club debt received stock treatment
during the third rescheduling.
The third rescheduling agreement
provides rescheduling of Pakistan’s total
bilateral public and publicly guaranteed
debt of over one year maturity, outstanding
as on November 30, 2001. The total stock
of bilateral debt, eligible for debt
rescheduling, was estimated at $ 12.5
billion, outstanding as on November 30,
2001 (including the debt service payments
in arrears and the amount of previously
rescheduled debt). The Paris Club also
agreed to defer 100 percent of the amount
Chapter 10. Foreign Economic Assistance
of principal and interest due and not paid as
on November 30, 2001 and those falling
due during December 1, 2001 to June 30,
2002 in respect of loans, signed after
September 30, 1997 (post cut-off date
loans) including deferment of 100 percent
of the amount of moratorium interest on
rescheduled debt due during November 30,
2001 to June 30, 2002 as well as 20 percent
of the amount of moratorium interest due
during July 1, 2002 to June 30, 2003 and
July 1, 2003 to June 30, 2004.
Out of the total debt of $ 12.5 billion,
the Official Development Assistance (ODA)
debt consists of $ 8.5 billion (68%) and Non-
Official Development Assistance (non-ODA)
debt of $ 4.0 billion or 32 percent
(approximately). The ODA debt is owed
directly by the governments or their public
sector agencies while the Non-ODA debt is
advanced by financial institutions,
suppliers/exporters and the private sector
and is guaranteed either directly by their
governments or their appropriate
institutions. The ODA rescheduled debt will
be repayable over a period of 38 years
including 15 years of grace period and
carries an interest rate as favourable as per
under the original contracts whereas Non-
ODA rescheduled debt is to be repaid over a
period of 23 years including 5 years of
grace period at an appropriate market rate.
The deferred debt in respect of post cut off
date loans will be repaid in 4 consecutive
equal semi-annual instalments starting from
May 31, 2005 and ending on November 30,
2006.
As a result of the third debt
rescheduling, an estimated relief of $ 1.2
billion to $ 1.5 billion will accrue annually in
payments of debt servicing on external debt
in the medium term during the years 2001-
02 to 2004-05. This would have favourable
effect on the balance of payments as well
as on external/financial position of the
economy. This coupled with fresh
disbursements from multilateral (IMF, ADB
and World Bank) and bilateral creditors
(USA, U.K, Japan & Saudi Arabia, etc) , not
only the balance of payments but also the
reserve position and credit rating of the
country has improved.
The Paris Club creditors, Denmark and
Commonwealth Development Corporation of U.K.
have waived off their entire outstanding debt of $
18.4 million and $ 29.5 million respectively, while
Netherlands has given remission in debt service
payments falling due during October 2001 to
December 2002, equivalent to $ 14.3 million and
USA has cancelled an amount of $ 1.0 billion of
their debt. Thus, total cancellation of debt comes to
$ 1.062 billion. Total amount of $ 11.550 billion
has been rescheduled (all the bilateral agreements
have been signed except that of Republic of Korea
and Russian Federation which are under
finalization) and $ 0.071 billion have been deferred
in respect of post cut-off date loans. These amounts
also include Non-Paris Club creditors. The
country-wise detail is given in table 10.2.
Table 10.2
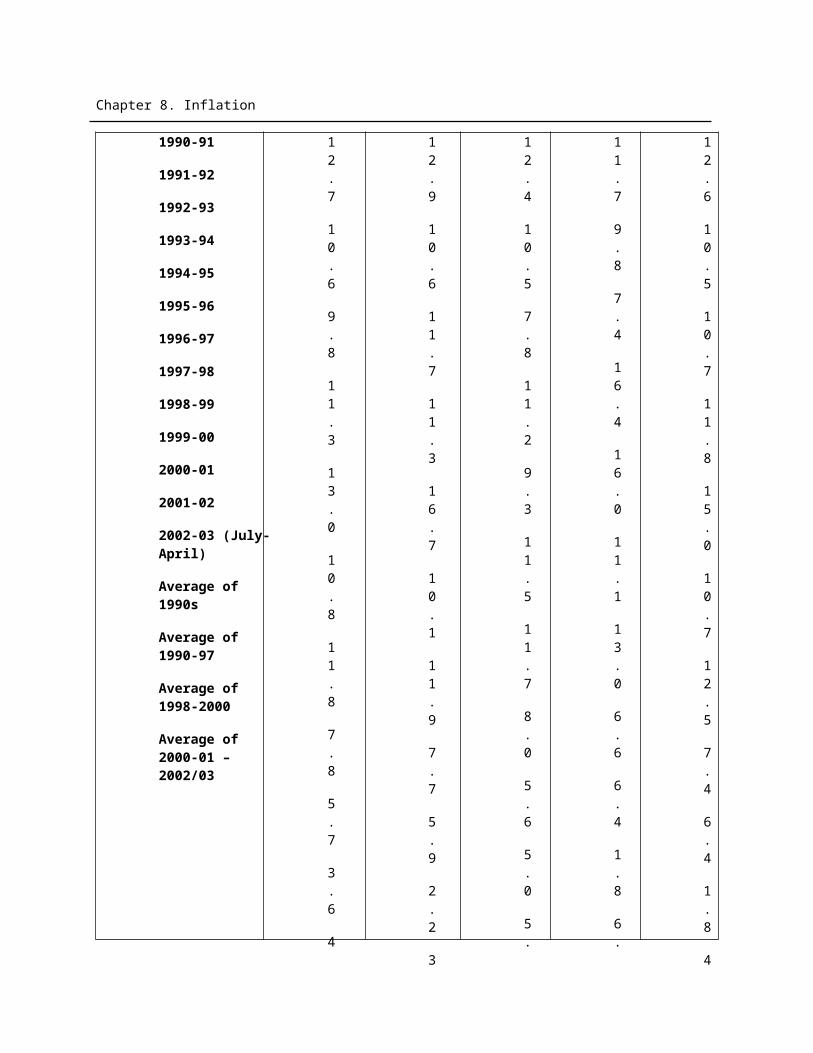
Chapter 10. Foreign Economic Assistance
Country-Wise Rescheduling / Restructuring of External Debt($ Million)
S.No
Country Amount Reschedule
d
Amount Cancelled
Amount deferred for 5
years
Total
A. Paris Club123456789101112131415161718
AustriaBelgiumCanadaDenmarkFinlandFranceGermanyItalyJapanNetherlandsNorwaySpainSwedenSwitzerlandU.S.A.U.K.Russian FederationRepublic of Korea
35.01953.634
392.913-
6.1221544.1411171.207
180.6494561.119
81.10132.54780.006
160.06172.839
1994.68610.525
143.254812.336
---
18.438-----
14.354----
1000.00029.481
--
-----
0.0642.745
-3.0070.5793.427
---
6.0673.621
--
35.01953.634
392.91318.438
6.1221544.2051173.952
180.6494564.126
96.03435.97480.006
160.06172.839
3000.75343.627
143.254812.336
A. Total 11332.159 1062.273 19.510 12413.942
ODA 7524.233 1062.273 2.510 8589.016Non-ODA 3807.926 - 17.000 3824.926Total: ODA + Non-ODA 11332.159 1062.273 19.510 12413.942
B. Non-Paris Club12345
Saudi FundChinaKuwaitCZECHTurkish Eximbank
53.346119.009
41.0244.018
-
-----
----
51.602
53.346119.009
41.0244.018
51.602B. Total 217.397 - 51.602 268.999
ODA 124.575 - - 124.575Non-ODA 92.822 - 51.602 144.424Total: ODA + Non-ODA 217.397 - 51.602 268.999
ODA (A + B) 7648.808 1062.273 2.510 8713.591Non-ODA (A + B) 3900.748 - 68.602 3969.350G. Total 11549.556 1062.273 71.112 12682.941
Source: Economic Affairs DivisionNote: All the bilateral agreements have been signed except that of Republic of Korea and Russian Federation which are under finalization.
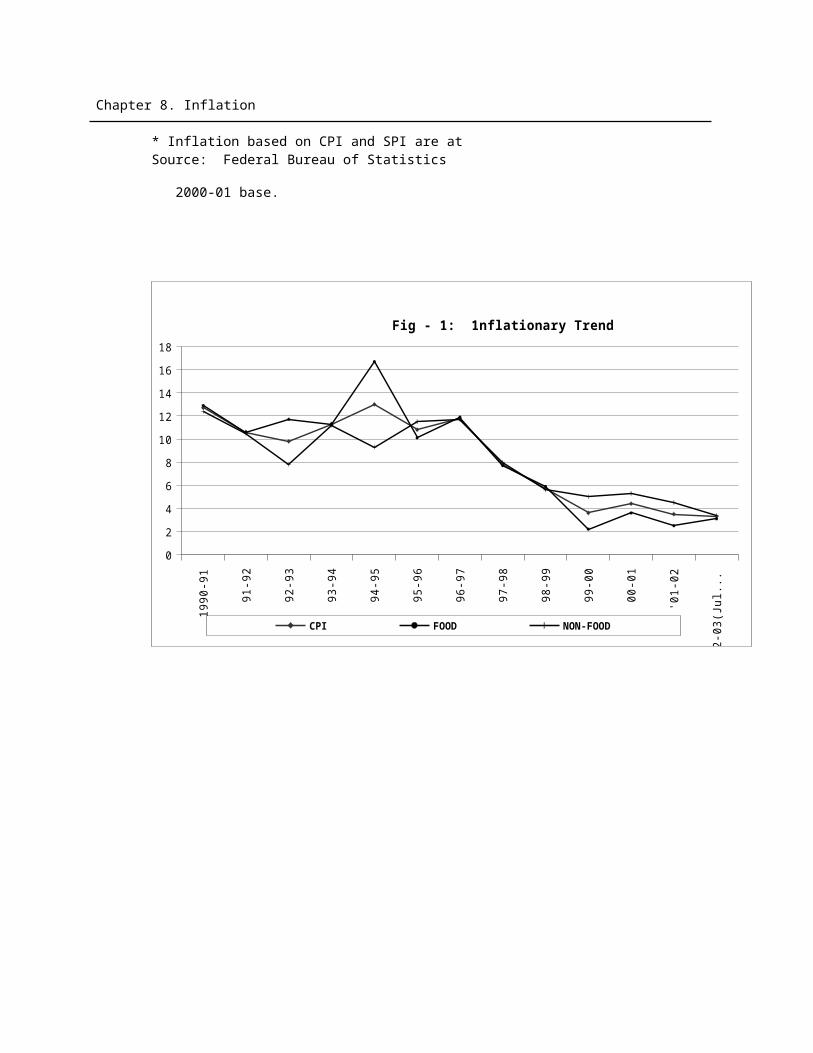
Chapter 10. Foreign Economic Assistance
Foreign Aid-Commitments
The commitments of foreign aid has exhibited a declining trend over time, especially in the second half of the 1990s, - declining from $ 3025 million in 1994-95 to $ 1759 million in 1996-97 because of decline in the global saving and subsequent poor international aid environment. Economic sanctions further clouded the aid commitments which declined to as low as $ 665 million in 1999-2000. Nevertheless, the restoration of relationships with the International Financial Institutions (IFIs) improved the environment for the aid commitments. During the current fiscal year (2002-03), these are expected to be $ 2299 million [See Table 10.3].
Table 10.3Commitments of Aid by Use
($ Million)
1994-95
1995-96
1996-97
1997-98
1998-99
1999-00
2000-01
2001-02
2002-03 (E)
I. Project Aid 2714
2219
1351
77 1382
26 19 1138
1202
II.Non-Project Aid
31 46 40 1330
83 40 91 2350
1097
a) Non-Food57 75 65 91 22
881090
b) Food Aid 27 39 40 57 18 40 41
c) Relief Assistance
for Afghan Refugees
29 10 21
Total (I + II) 3025
2681
1759
2106
2219
66 1109
3488
2299
E: Estimated Source: Economic Affairs Division
Chapter 10. Foreign Economic Assistance
Foreign Aid-Disbursements
Like commitments, the disbursements of foreign aid with some fluctuations have also continued to decline over the years as a result of poor international aid environment. The disbursements have declined from $ 2565 million in 1995-96 to $ 1428
million in 1999-2000. However, with the restoration of relationships with the International Financial Institutions, the aid disbursements (programme loans) have improved. During the current fiscal year (2002-03), a sum of $ 1851 million is expected to be disbursed. The position of disbursements by type and use is summarized in table 10.4.
Table 10.4
Disbursements of Aid by Use($ million)
1995-96
1996-97
1997-98
1998-99
99-2000
2000-01
2001-02
2002-03 (E)
I. Project Aid 2151
1821
1552
1620
1110
919
640
807
II. Non-Project Aid
414
412
1249
822
318
680
1676
1044
a) Non-Food 21
1 626
550
125
678
1624
1027
b) Food Aid 383
409
622
270
191
0 31
10
c) Relief Assistance
For Afghan
Refugees10 2 1 2 2 2
21 7
Total (I+II) 2565
2233
2801
2442
1428
1599
2316
1851
E: Estimated Source: Economic Affairs DivisionDebt Service Payments and Net Transfers
The increased liability of debt service payments has squeezed the net inflow of foreign resources. The net
Chapter 10. Foreign Economic Assistance
transfers of aid in the 1990s averaged at $ 534 million per annum. They were as high as $ 853 million or 36 percent of gross disbursements in 1991-92 but turned negative by $ 34 million in 1996-97 due to lesser disbursements and relatively more growth in debt service payments. However, the net transfers improved to $ 910 million (37% of gross disbursements) during 1998-99 due to lower debt servicing, resulting from debt rescheduling but turned negative
again to the extent of $ 364 million in 2000-01 due to economic sanctions and lower disbursements. However, the net transfers once again improved substantially to $ 1095 million (48% of gross disbursements) in 2001-02 due to exceptional support from USA and G-8 countries after 11 September. The projection of net transfers for current fiscal year 2002-03 is $ 428 million or 23 percent of gross disbursements. The annual details are given in table 10.5 and fig-4.
Table 10.5Debt Servicing and Net Transfers
($ million)
Year Gross Disbursements*
Debt Servicing **
Net Transfers (N.T)
NT as % of Gross
Disbursements1990-91 2045 1316 729 361991-92 2366 1513 853 361992-93 2436 1648 788 321993-94 2530 1746 784 311994-95 2571 2042 529 211995-96 2555 2136 419 161996-97 2231 2265 (-) 34 (-) 11997-98 2800 2353 447 161998-99 2440 1530 910 3799-2000 1426 1512 (-) 86 (-) 62000-01 1597 1961 (-)364 (-)232001-02 2295 1200 1095 482002-03 (E) 1844 1416 428 23
* Excluding relief assistance for Afghan refugees Source: Economic Affairs Division.** Excluding interest on short-term borrowings, IMF charges and Euro Bonds. Data since 1999-2000 onward is inclusive of IMF & bonds.E. Estimated.
90-9
1
91-9
2
92-9
3
93-9
4
94-9
5
95-9
6
96-9
7
97-9
8
98-9
9
99-2
000
2000
-01
2001
-02
2002
-03
-30
-20
-10
0
10
20
30
40
50
60
Fig-4 : Net Transfers as Percent of Gross Disbursements
NT as % of Gross Disbursements
Sources of Aid
The major sources of foreign economic assistance to Pakistan have been the Consortium, Non-Consortium and Islamic Countries. Among these, the Aid-to-Pakistan Consortium, that is, 'Pakistan Development Forum' (including assistance from Consortium sources under outside Consortium arrangements) is the largest source of economic assistance to Pakistan. The share of Consortium sources in total commitments during 2002-03 is likely to be 85.1 percent. Likewise the share of Consortium sources in the total disbursements during the
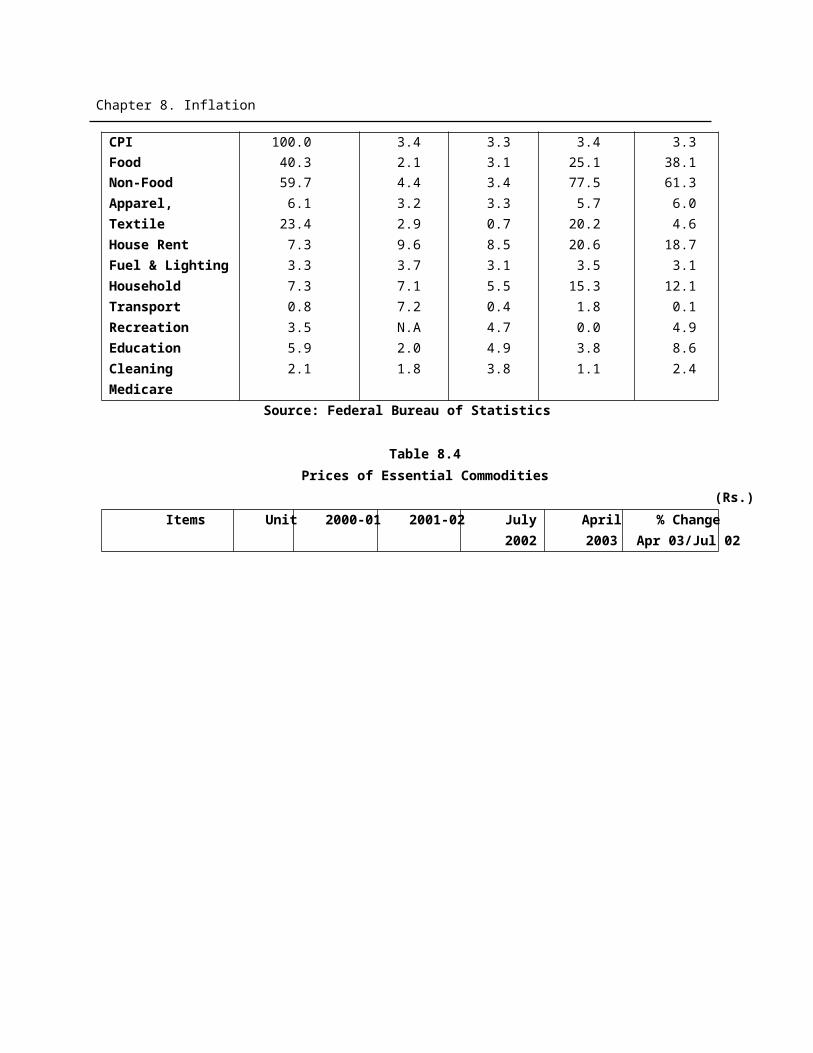
Chapter 10. Foreign Economic Assistance
current fiscal year (2002-03) is expected to be 80.4 percent. The source-wise commitments and disbursements are summarized in table 10.6.
Table 10.6Sources of Foreign Aid *
($ million)Commitments Disbursements
2001-02
% Share
2002-03 (E)
% Share
2001-02
% Share
2002-03 (E)
% Share
Consortium 2751
78.9 1957
85.1 2184
94.3 1488
80.4
Non-Consortium 369 10.6 210 9.1 43 1.9 199 10.7Islamic Countries 347 9.9 126 5.5 68 2.9 157 8.5 Sub Total 346
799.4 229
399.7 229
599.1 184
499.6
Relief AssistanceFor Afghan Refugees 21 0.6 6 0.3 21 0.9 7 0.4Total 348
8100.
0229
9100.
0231
6100.
0185
1100.
0Source: Economic Affairs Division
* Excluding short-term credits of one and less than one year maturity. E: EstimatedProject Vs Non-Project Aid
The share of project aid in the 1990s averaged 73 percent per annum or $ 1736 million with annual fluctuation in the range of 55-84 percent. The share of non-project aid during the same period fluctuated even more widely (16-45 percent) and averaged at 27 percent per annum ($ 637 million). The share of project aid during 2000-01 was 57.5 percent, which declined to 27.6 percent in
2001-02 due to difficulties in counterpart financing. The share of non-project aid on the other hand increased from 42.5 percent in 2000-01 to 72.4 percent during 2001-02 due mainly to higher disbursements of the programme loans of World Bank and Asian Development Bank. The project aid and non-project aid during the current fiscal year (2002-03) has been estimated at $ 808 million (43.7%) and $ 1043 million (56.3%) respectively [See Table 10.7 and fig-5].
Table 10.7Disbursement of Project and Non-Project Aid
($ Million)
Year ProjectAid
%Share
Non-Project Aid
%Share Total
1990-91 1,408 65.3 748 34.7 2,1561991-92 1,766 71.5 705 28.5 2,4711992-93 1,895 76.0 598 24.0 2,4931993-94 1,961 76.9 588 23.1 2,5491994-95 2,079 80.0 521 20.0 2,6001995-96 2,151 83.9 414 16.1 2,5651996-97 1,821 81.5 412 18.5 2,2331997-98 1,552 55.4 1249 44.6 2,8011998-99 1,620 66.3 822 33.7 2,442
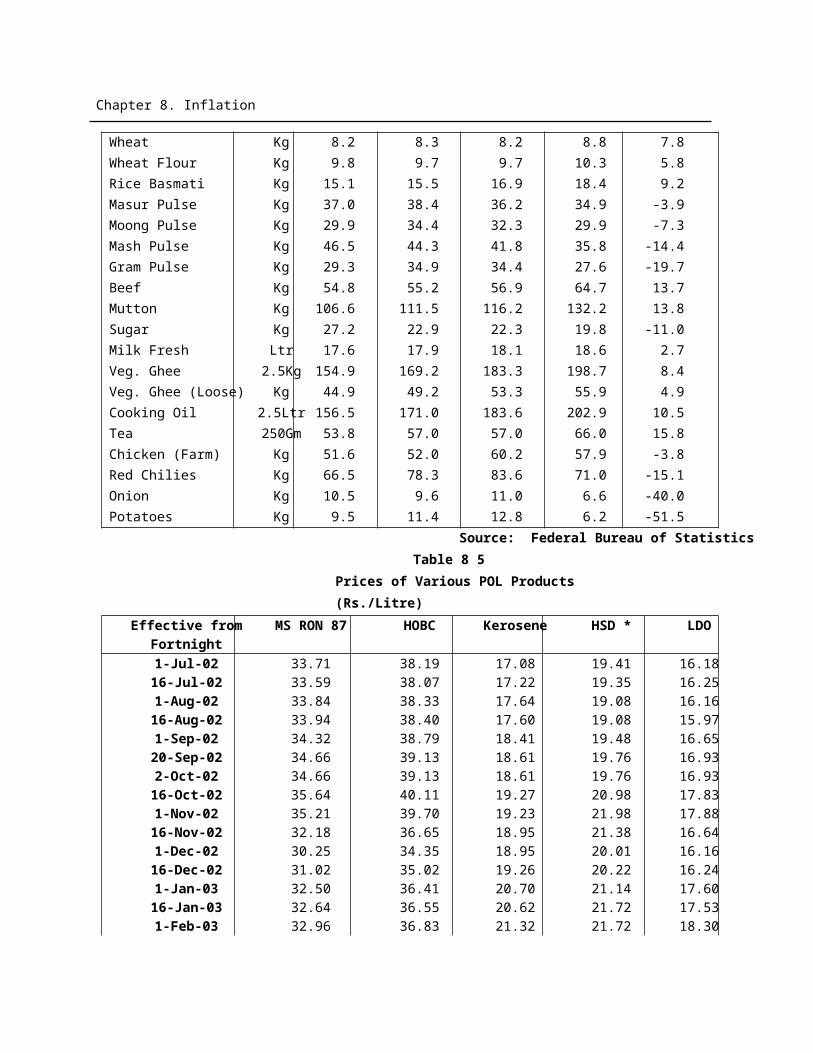
Chapter 10. Foreign Economic Assistance
Year ProjectAid
%Share
Non-Project Aid
%Share Total
99-2000 1,110 77.7 318 22.3 1,4282000-01 919 57.5 680 42.5 1,5992001-02 640 27.6 1676 72.4 2,3162002-03 * 808 43.7 1043 56.3 1,851
* Estimated Source: Economic Affairs Division
Composition of Aid
The composition of aid over the years has considerably changed from grants and grant type assistance to hard term loans. The share of grant and grant type foreign assistance in total commitments was 80 percent during the First Five Year Plan (1955-60) but dropped to 46 percent during the Second Plan (1960-65) and continued to decline thereafter, averaging 32 percent during the Third Plan (1965-70) and 10 percent during the Fourth Plan (1970-75). However, due to the relief assistance for Afghan Refugees, its share increased to about 22 percent during the Fifth Plan (1978-83) and remained almost the same during the Sixth Plan (1983-88). The share of grants and grant type assistance continued to exhibit a declining trend thereafter and averaged at 16 percent during the Seventh Plan (1988-93). It was only 9 percent during Eighth Plan (1993-98). It however, increased to 13 percent in
1998-99 and further to 18 percent during 1999-2000 but declined again to 4 percent during 2000-01 due to economic sanctions and poor aid environment. However in 2001-02, it again increased to 31 percent of total commitments due to higher inflow of assistance from donor agencies and during the current fiscal year (2002-03), it is expected to be only 15 percent.
Terms of Loans and Credits
The terms of bilateral foreign loans andcredits have significantly become harder over the years. The terms and conditions of the loans and credits were soft during the 1960s and 1970s, as compared to the terms of the 1950s. During the 1980s and 1990s, these terms have been made somewhat more harder. The rate of interest, which averaged at about 4.6 percent during the 1950s, declined to 3.3 percent during the 1960s and 3.6 percent during the 1970s, but increased to 4.8 percent and 4.4 percent during the 1980s and
90-9
1
91-9
2
92-9
3
93-9
4
94-9
5
95-9
6
96-9
7
97-9
8
98-9
9
99-2
000
2000-0
1
2001-0
2
2002-0
30
500
1000
1500
2000
2500
3000
Fig-5: Disbursements of Project & Non-Project Aid
Total Project Aid Non-Project Aid
($ M
illio
n)
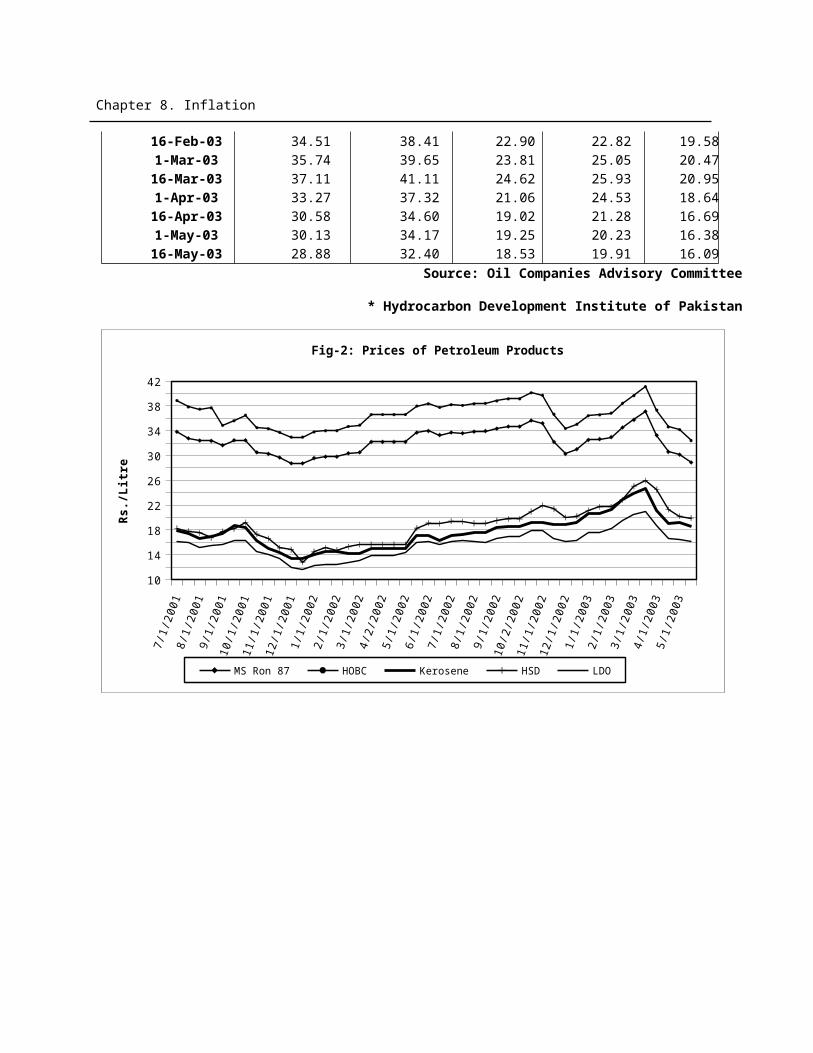
Chapter 10. Foreign Economic Assistance
1990s, respectively. The payment period of the loans/credits during the 1950s was 21 years with a grace period of 2 years, which improved to 30 years with a grace period of 7 years during the 1960s, but reduced to around 25 years with a grace period of 6 years during the 1970s. Repayment period, however, improved to 28 years including a grace period of 7 years in the 1980s but declined to 21 years including a grace period of 6 years during the 1990s. During 2000-01, the repayment period was 24 years including a grace period of 6 years. The terms of loans and credits became harder as not only the grant element has become quite insignificant but the aid also became donors driven i.e. on the pre-specified terms and conditions of the donors. Furthermore, the commercial loans were available only on higher interest rates. By and large, the hardening of terms identified by higher average interest rates and lower average maturity periods of the loans have adversely affected Pakistan's external debt servicing.
________________________
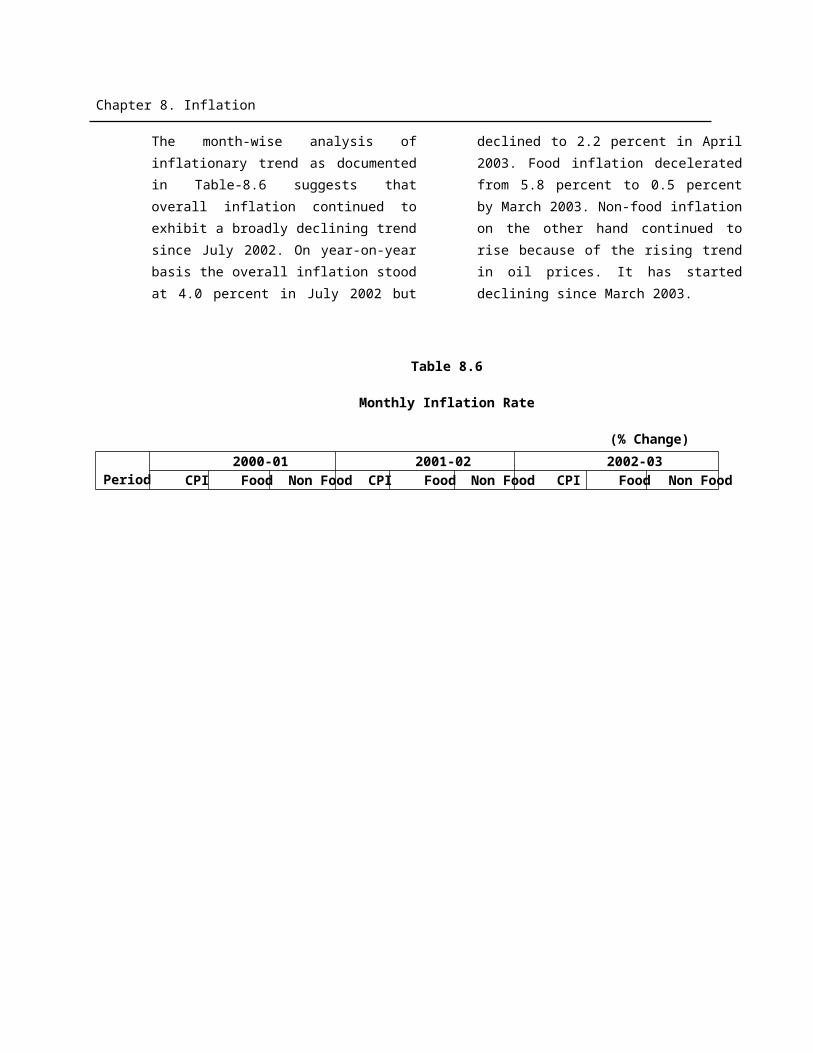
Chapter 11. Education
11. EducationIntroduction
Education is an essential tool for Human Resource Development and a necessary ingredient for sustainable socio-economic growth. Pakistan started with a very low education profile but today a lot has been achieved. Literacy rate, counted by number of people 'who could read only' in 1951, was 16% has now been calculated on the basis of those 'who are able to read with understanding and can write a short statement' is 51.6% in 2003. The number of primary schools increased from about 8000 in 1947 to around 170000 in 2003. Gross enrolment at this level increased from 0.77 million to about 20 million. The number of elementary/secondary schools, colleges and universities has correspondingly increased. However, there is still a lot to be done in order to make Pakistan a prosperous country. The challenges of the 21st Century could be faced through identifying issues, developing strategies and operational programmes in Education sector. Ten Year Perspective Development Plan 2001-11 and Three Year Development Programme 2001-04 have been prepared in this context. Expansion of education is dependent on fiscal resources. During the last decade of the outgoing millennium however, adverse macroeconomic conditions and keen inter-sectoral competition for public funds seriously impaired the government's ability to continue expanding education. At the highest policy level within the government, it is readily conceded that investment in education contributes to the accumulation of human capital, which is essential for higher incomes and sustained economic growth. Education, especially basic (primary and lower-secondary) education helps
reduce poverty by increasing the productivity of the poor, by reducing fertility and improving health, and by equipping people with the skills they need to participate fully in the society. More generally, education helps strengthen civil institutions and build national capacity and good governance in the implementation of sound economic and social policies.
Despite this awareness, major challenges remain to increase access to education, to improve equity, to improve quality, and to commit resources for educational reform. Delays in reforming the education system to keep pace with economic structure will most likely hinder Pakistan's economic prosperity. Conversely, timely reforms can pay off in terms of economic growth and poverty reduction, as is evident from the experience of East Asian countries who have generally invested heavily in basic human capital, both male and female.
Education has a positive impact on individual earnings and also yields substantial externalities: parents education and mother's literacy and education are associated with low infant mortality rates, higher enrollment and achievement rates of children and less gender differences in enrollment of children. Pakistan is facing the challenges of coverage and quality in education. The gender-gap has narrowed slightly due partly to decline in male enrollment at secondary level in public sector schools who have shifted into private options. There are also significant differences across provinces with decline in
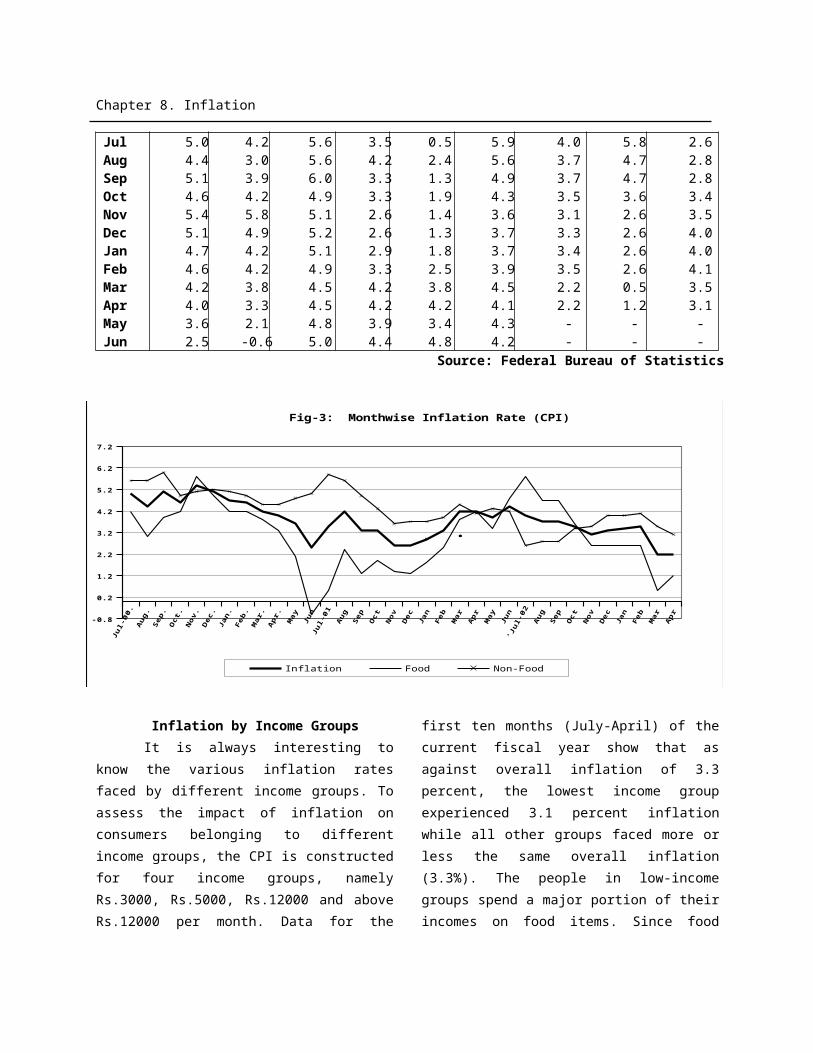
Chapter 11. Education
enrollment in Sindh and Baluchistan in public sector education.
Problems to ensure quality education are widespread. These are acknowledged at all levels and encompass teacher shortage and absenteeism, minimal supervision, poor infrastructure and shortage of teaching materials. While Social Action Programme (SAP) succeeded in increasing the number of schools, inadequate attention was given to quality education including teacher's availability and teacher's accountability. This rendered many schools non-functional. The growth in private schooling estimated at 30% of total provision, especially in rural areas, suggests that there is considerable demand for quality education. Literacy Rate, Population and GDP Growth
Literacy rate is estimated to be 51.6% in 2002-03. Under the Education Sector Reforms,National Literacy Campaign (Integrated approach to comprehensive Literacy and Poverty Reduction) has been launched through out the country. The campaign envisages making 13.5 million people literate to enhance the literacy rate to 60% by 2005. Around 270,000 adult literacy centers would be open for this purpose.
The table and figures showing literacy rate, change by percentage point, population growth and GDP growth from 1991 to 2003 are given below Table-11.1 and figure-I).
Table 11.1Literacy Rate - Population and GDP Growth
Year Literacy Rate Change by Percentage Point
Population Growth
GDP growth
1991 34.9 - 2.63 5.41992 36.0 1.1 2.60 7.61993 37.2 1.2 2.56 2.11994 38.4 1.2 2.51 4.41995 39.6 1.2 2.47 5.11996 40.9 1.3 2.43 6.61997 42.2 1.3 2.38 1.71998 43.6 1.4 2.34 3.51999 45.0 1.4 2.29 4.22000 47.1 2.1 2.24 3.92001 49.0 1.9 2.22 2.42002 50.5 1.5 2.16 3.6
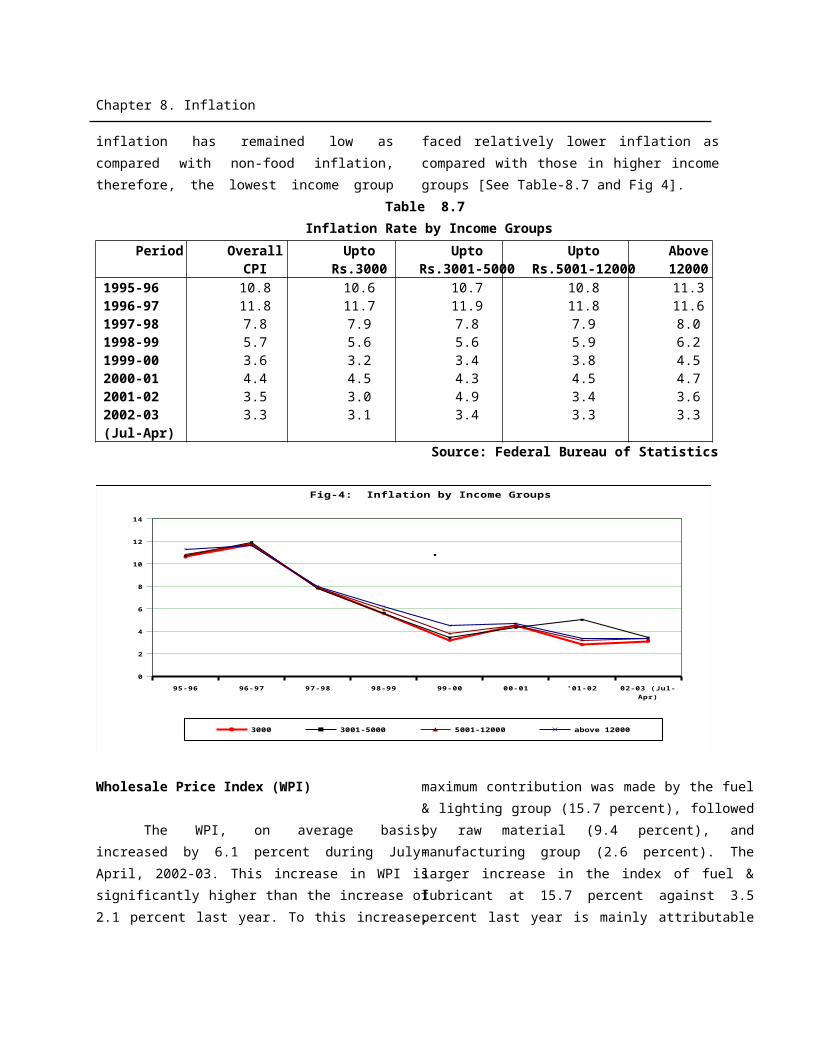
Chapter 11. Education
2003 51.6 1.1 2.10 5.1Source: Federal Bureau of Statistics
Ministry of Education.
19
91
19
92
19
93
19
94
19
95
19
96
19
97
19
98
19
99
20
00
20
01
20
02
20
03
0
5
10
15
20
25
30
35
40
45
50
55
Fig-1: Literacy Rate
Gender Education
Gender disparity in primary and secondary education exists in low income countries. The gender gap, on average, stood at 11 percentage points at the primary level and 19 percentage points at the secondary level. The gap is widest in several Asian countries as well as in several Africa and the Middle Eastern countries. Eliminating gender gaps in basic education/literacy is the cornerstone of Government of Pakistan Policy for social development in general and in education in particular. Ministry of Education has a policy framework in place to advance gender equality in education. Each target is gender disaggregated in Education Sector Reforms(ESR) and Education For All (EFA) Programs. Diverse programs and strategies have been developed, ranging from compensatory programs such as stipends at middle and secondary levels, free textbooks and school nutrition support to girls schools. Initiatives in Public Private Partnerships such as school up-gradation program in the afternoons has resulted in a higher coverage for girls at middle, secondary and higher secondary levels. Of the 6240 schools upgraded in Punjab and NWFP, 3787 or 60.76%
are girls schools, and 18% are mixed schools. This program is an outstanding example of addressing gender equity in Pakistan for non-elite groups. In NWFP, of the total 93 upgraded institutions, 80% are girls and mixed schools. Furthermore all 50% development allocations are being provided to girls schools. Ministry of Education has a special desk for Gender in the Education For All (EFA) Wing for facilitating:
- Gender sensitization and training.
- Development of research, survey and data tools/systems to analyze gender issues and ensure the application of pertinent sex-disaggregated data.
- Gender-responsiveness in planning, implementing, monitoring & evaluating, and gathering of lessons learned.
- Communication, information -sharing and problem-solving on gender and education issues.
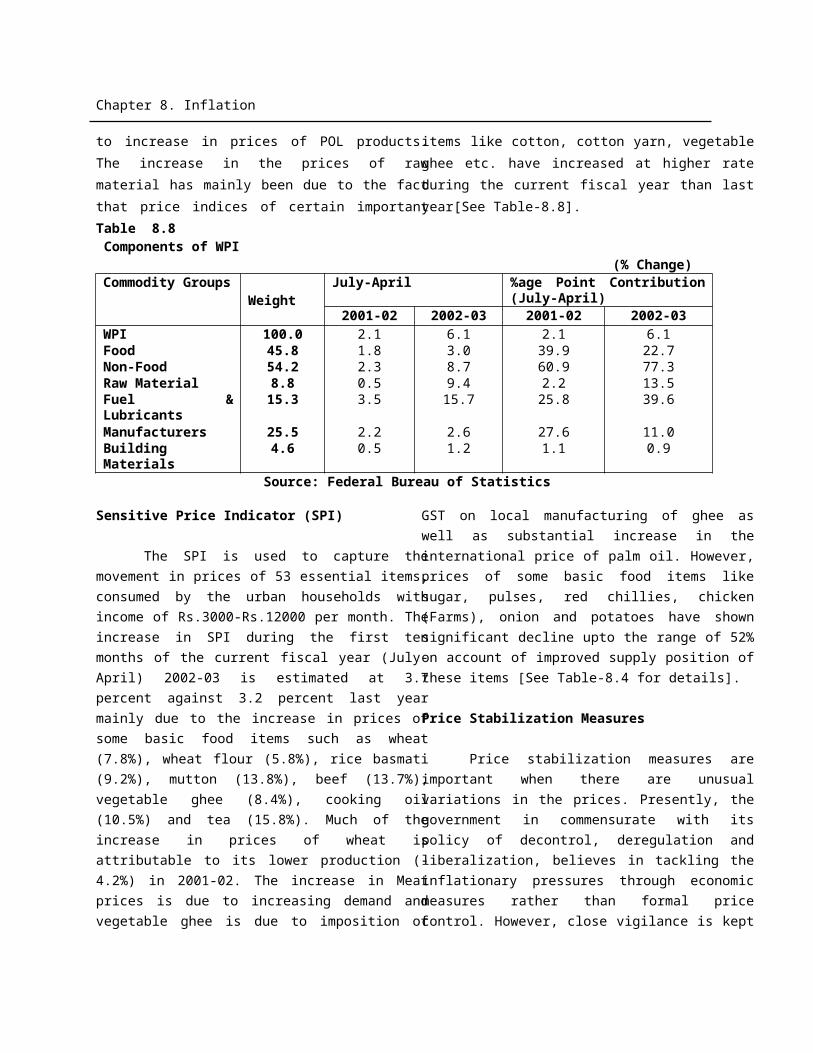
Chapter 11. Education
- Experience sharing between government and non-government stakeholders in education.
National Education Policy 1998-2010.
Gross enrolment ratio at primary level will be increased to 105% by year 2020 and Compulsory Primary Education Act will be promulgated and enforced in a phased manner. Full utilization of existing capacity at the basic level has been ensured by providing for introduction of double shift in existing school of basics education. One model secondary school will be set up at each district level. A definite vocation or a career will be introduced at secondary level. It would be ensured that all the boys and girls, desirous of entering secondary education, are enrolled in secondary schools. Curriculum for secondary and higher secondary will be revised and multiple textbooks will be introduced. The participation rate will be increased from 31% to 48% by 2002-03. Both formal and non-formal means shall be used to provide increased opportunities for in-service training to the working teachers, preferably at least once in five years. To evolve an integrated system of national education by bringing Deeni Madaris and modern schools closer to each stream in curriculum and the contents of education Nazira Qur'an will be introduced as a compulsory component from grade I-VIII while at secondary level translation of the selected verses from the Holy Qur'an will be offered.
Ten Year Development Plan
Ten Year Perspective Plan 2001-11 and Three Year Development Programme 2002-05 have been prepared on the basis of National Education Policy 1998-2010 to address the issues of low literacy and
participation rates at various levels of education, quality of education, limited options for technical/vocational education and low participation of private sector. The Plan proposes new initiatives for achieving accelerated literacy rate, opening/upgrading of primary/secondary schools, Teachers training projects, Establishment of National Education Assessment System, revamping of Science Education facilities, establishing technical institutions, improving quality of education at all levels. Total size of the Plan is estimated at Rs.192 billion including federal provision of Rs.54 billion. The Ten Year Perspective Plan 2001-11 and Three Year Programme 2002-05 propose to increase the literacy rate to 59% (69% for male & 47% for female) by 2005. It is estimated that during 2002-03, about 3.2 million additional population of age 10+ will become literate through primary education. To equip the teachers and students of Madaris with latest knowledge of Science and Information Technology, it is intended to introduce formal subjects in willing Madaris. The Federal Government will provide financial assistance to these Madaris for salaries of teachers, books, computers and teachers training etc.
It is estimated that during 2002-03 gross participation rate at Primary level will increase from 85% to 88% (Male from 97% to 99% and Female from 72% to 76%). At Middle level gross participation rate is estimated to increase from 57% to 59% (Male from 57% to 60% and Female from 46% to 49%). At Secondary level the participation rate is estimated to increase from 38% to 40% (Male from 45% to 47% and Female from 31% to 34%). Technical Education is being introduced at district level. Technical stream at Secondary level is also under implementation. A virtual university has been established. Model
Chapter 11. Education
university ordinance has been approved. Information Technology (IT) facilities have been provided to universities. In order to improve access and quality of Higher Education, Higher Education Commission has been set up to formulate policies, guiding principles and priorities for higher education institutions for promotion of socio-economic development of the country.
Private Sector Educational Institutions
There shall be regulatory bodies at the national and provincial levels to regulate activities and smooth functioning of privately-managed schools and institutions of higher education through proper rules and regulations. A reasonable tax rebate shall be granted on the expenditure incurred on the setting-up of educational facilities by the private sector. Matching grants shall be provided for establishing educational institutions by the private sector in the rural areas or poor urban areas through Education Foundations. Existing institutions of higher learning shall be allowed to negotiate for financial assistance with donor agencies in collaboration with the Ministry of Education. Educational institutions to be set up in the private sector shall be provided (a) plots in residential schemes on reserve prices, and (b) rebate on income tax, like industry. Schools running on non-profit basis shall be exempted from all taxes. Curricula of private institutions must conform to the principles laid down in the Federal Supervision of curricula, Textbooks and Maintenance of Standards of Education Act, 1976. The fee structure of the privately managed educational institutions shall be developed in consultation with the government.
Higher Education
The development of strong institutions of higher education and quality research are crucial for sustained education and economic development. Pakistan's public and private universities except a few are confronted with lack of resources, ineffective governance and institutional weaknesses. The Government has dissolved university grants commission and has established a Higher Education Commission (HEC) under an Ordinance in 2002 to strengthen higher education with a focus on science and technology and research in Pakistan. The plan aims at increasing access to higher education from 2.6 percent to 5 percent with substantial contribution from the private sector, establishing Endowment Funds in engineering universities in the public sector, shifting emphasis from humanities to science and technology, and introducing IT education in all public universities. To bring institutional improvement, a model University Ordinance is under consideration that regulates university structures. The government has also established a Virtual University with affiliate campuses. There are 96 universities/degree awarding institutions in the country as against 48 in 1999. The Government has begun additional funding and performance-based incentives to universities to implement their modernization program. Priority will be given to investments in the areas of (a) institutional capacity building to strengthen administration and management capacity at the national, provincial and university levels, (b) upgrading of professional and academic skills of faculty relevant to teaching and learning; (c) quality inputs to make the teaching and learning environment more effective; and
Chapter 11. Education
developing linkages with industry in Pakistan. Access to higher education shall be expanded to at least 5% of the age group 17-23 by the year 2010. Merit shall be the criterion for entry into higher education. Access to higher education, therefore, shall be based on entrance tests, reputed degree colleges shall be given autonomy and degree awarding status. Split Ph.D programs shall be launched in collaboration with reputed foreign universities and at the minimum, 100 scholars shall be annually trained under this arrangement. All quota/reserve seats shall be eliminated. Students from backward areas, who clear entry tests, would compete amongst themselves.
A major development in higher education is the establishment of the Higher Education Commission which was established on 14th August, 2002. The Commission has replaced the University Grants Commission which will pursue the following broad objectives:
- increasing access to higher education from 2.6% to 5% by 2005.
- Increasing enrolment from 100,000 to 200,000 students by 2005.
- Private sector to raise its share of enrolment to 40% of the total by 2005.
- Increasing allocation to higher education from 0.39% to 1% of GDP by 2005.
- Increasing allocation for research through an Endowment Fund.
- Shift from Humanities to Science & Technology from current 70:30 ratio to 50:50 by 2005.
- Up gradation of social sciences programs and staff development accordingly.
- Introducing IT Education in all public universities.
- Introducing a one year honors course after Bachelor's Degree and/or a three years Master's Program.
Achievements
- Expansion from 48 Universities in 1999 to 77 in 2002, includes 35 public sector universities.
- Rs.1 billion spent on shift from Humanities to S&T in higher education.
- Rs.1 billion Endowment Fund for promotion of research, for Engineering Universities.
- IT Education facilities provided to 27 universities.
- An Ordinance on Higher Education Commission (HEC) has been promulgated and HEC established.
- Model University Ordinance approved for better governance and management of Public Sector Universities.
- Virtual University established.
Information Technology
Information technology has been extended to over 4000 educational institutions including schools in collaboration with private sector and programs in large-scale teacher training. Provincial Skill Development Centers and |Institutes of Technical Education are providing training to students and youth in different computer courses to meet the
Chapter 11. Education
market demand. A program is underway to train federal ad provincial government employees in IT skills.
Computers shall be introduced in secondary schools in a phased manner. School curriculum shall be revised to include recent developments in information technology.
Education Sector Reforms (ESR).
Education Sector Reforms (ESR) program is designed in the long term perspective of National Education Policy (1998-2010) and Ten Year Perspective Development Plan (2001-2011). ESR is strategically positioned in the objective conditions prevailing in the country. Education planning and management has been devolved from the Federal and Provincial Governments to the District Governments. Much of the action concerning education lies in the communities, tehsils and districts. Educational planning and decision-making will now take place where the action is. Centralized systems and distanced planning will be replaced by governance which is people and learner-centered. Not only will this make the system more objective and rational but also more efficient.
ESR is a comprehensive sector-wide program for increased access, enhanced equity and improved quality at all levels of education. The quality aspects of education are addressed through modernization of curricula, up gradation of teacher training and reforms of examinations. A National Education Assessment System within the school system is being established to carry out assessment of students' achievement to be used as a basis for improvement of
policy and planning, and teacher training. A comprehensive package of education sector reforms (ESR) with medium term targets (2001-05) has been finalized through a consultative process with over six hundred partners. ESR has linked with four concurrent macro level initiatives, which include Devolution, the Interim Poverty Reduction Strategy Paper, SAP II restructuring and the National Commission on Human Development (NCHD).
The major thrust areas of ESR are:
i) National Literacy Campaign-Integrated approach to Poverty Reduction;
ii) Mainstreaming Madrassahas;
iii) Universal Primary/Elementary Education (EFA);
iv) Improving the quality of Education: Curriculum Reforms, Teacher Education and Training Examination Reform and Assessment;
v) Technical Stream at Secondary level/Technical Education;
vi) Higher Education Sector; and
vii) Public Private Partnership.
The six thrust areas have been enhanced to seven including mainstreaming of Madaris. The ESR targets for each Sub-Sector are given in Table-11.2.
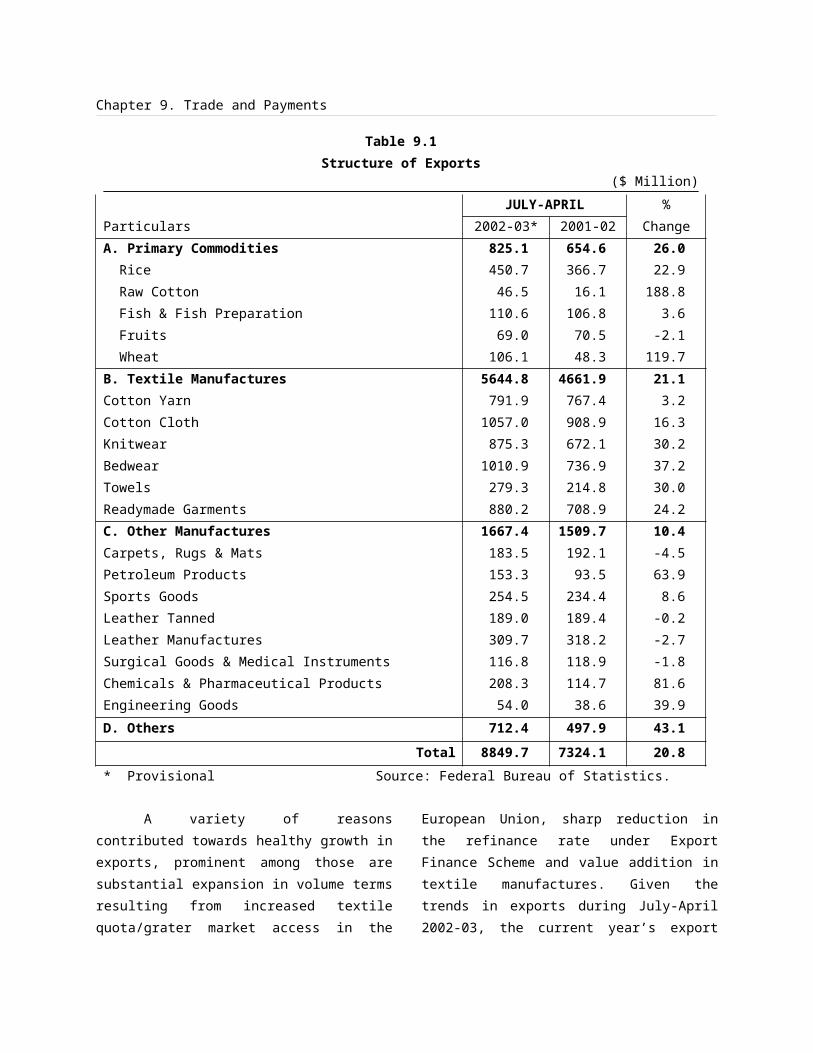
Chapter 11. Education
Table-11.2Education Sector Reform Targets (2001-2005)
Sub-Sector 2001 Target 2005Literacy(Percentage)Gross Primary Enrolment (percentage)Net Primary Enrolment (Percentage)Middle School Enrolment (percentage)Secondary School Enrollment (Percentage)Higher Education Enrolment (percentage)Technical Stream Schools (Nos)Polytechnics/Mono-technics (Nos)Madaris Mainstreaming (Nos)Public-Private Partnerships (Nos)
49%83%66%
47.5%29.5%2.6%10077
148200
60% 100% 76% 55% 40% 05% 1100 160 8000 26000
ESR Programmes have been launched in all Provinces and Federal Areas under Devolution Plan. The Education Sector Reforms (ESR) Action Plan (2001-2005) is a blend of home grown initiative. Changing technology and economic reforms are creating dramatic shifts in the structure of the country's economy. The rapid increase in knowledge and the pace of changing technology raise the possibility of sustained economic growth with prospects of increased human resource demand. These developments have created two key priorities for education, it must meet the country's growing demand for adaptable workers who can readily acquire new skills, and it must support the continued expansion of knowledge.
The ESR is linked to Education For All (EFA) goals up to 2001-15. The Reforms seek to enhance education entitlement for povertyalleviation and promote public private partnerships. The Reforms focus on improvement of planning procedure, resource mobilization and utilization through a sector wide approach to develop all sub-sectors within the macro level framework including institutional reforms at all levels of governments engaged in planning and service delivery for quality education. A vocational technical education stream is being introduced at secondary education level.
ESR Financial Requirements for 2001-05
The original ESR package was of Rs.55.5 billion for the years 2001-04. The duration of this package has been extended to 2001-05 to accommodate President's Programs viz Mainstreaming Madaris and setting up Mono-technics/Polytechnics at Tehsil level. Therefore, the cost estimates have increased to Rs.100 billion (Table 11.3).
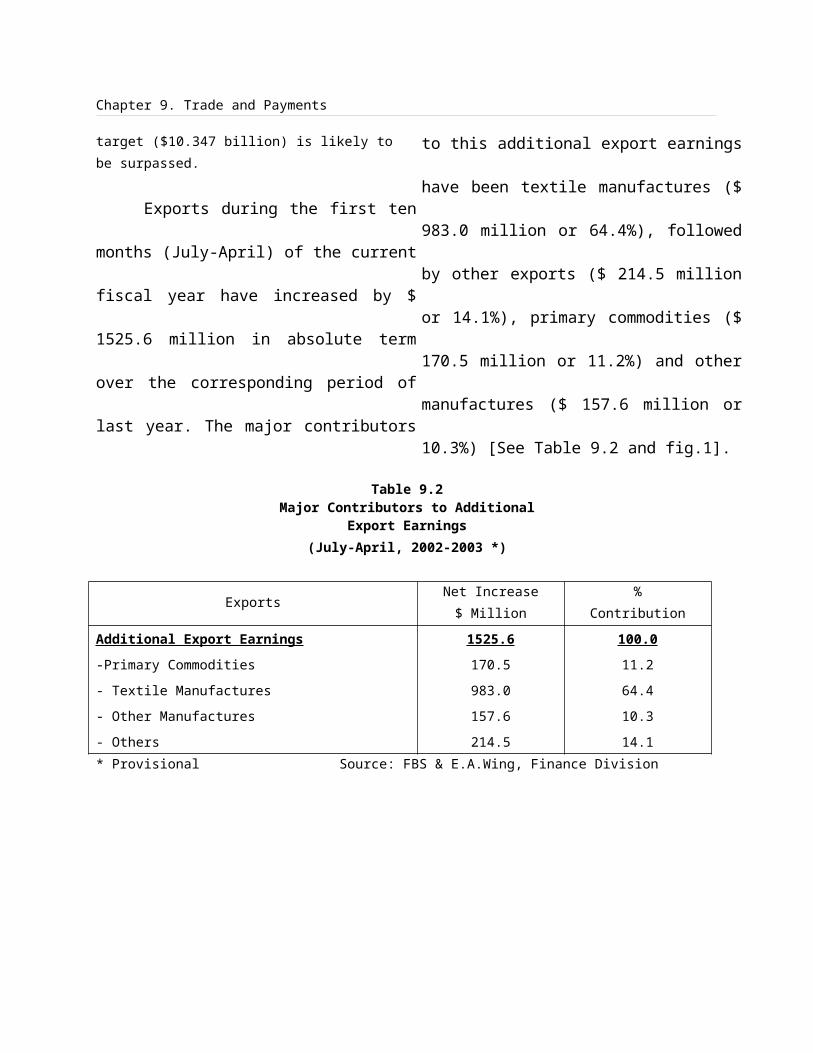
Chapter 11. Education
Table 11.3Financial Requirements for Education Sector Reforms
Action Plan 2001-05*(Rs. In Billion)
Programs 2001-02 2002-03 2003-04 2004-05 Total %Literacy Campaign 0.8 2.0 2.5 3.0 8.3 8.3Elementary Education 4.0 9.0 10.0 11.0 34.0 34Secondary Education 1.0 3.0 3.0 3.0 10.0 10Technical education 0 3.0 5.0 7.0 15.0 15College/Higher education 1.0 3.0 3.0 3.0 10.0 10Mainstreaming Madaris 0 5.0 5.0 4.0 14.0 14Public-private partnership 0.1 0.2 0.2 0.2 0.7 0.7Quality Assurance 1.0 2.0 2.0 3.0 8.0 8Total 7.9 27.2 30.7 34.2 100 100
Source: Ministry of Education*: Education Sector Reforms, Action Plan 2001-05.Education For All (EFA)
Education For All refers to the global commitment to ensure that by 2015 all children would complete primary education of good quality (Universal Primary Completion), and that gender disparity would be eliminated in primary and secondary education preferably by 2005 and no later than 2015. This commitment was made at the World Education Forum in Dakar, Senegal in April 2000 and reaffirmed in the Millennium Declaration in New York in September 2000. The Government of Pakistan is attaching top priority of EFA. The country has ten year Perspective Development Plan (2001-11) to visualize the long term macro-economic and sectoral growth strategies, Poverty Reduction and Human Development is the priority area of the Plan. Sector-wide development approach covering all the sectors of education has been adopted under the Perspective Plan. In order to address the EFA implications linkage plan focusing on development of other sectors of Education has also been prepared.
Nearly 80% of the ESR covers different goals of Education for All by 2015, reducing illiteracy by 50 percent with a focus on reducing the gender gap by 2015, life skills and learning opportunities for youth and adults; and early childhood education. The targeted groups for EFA
goals belong to disadvantaged communities with minimal opportunities. These groups are highly vulnerable, without access to learning facilities, or public sector facilities, which are functioning at sub-optimal levels.
Each sub sector of EFA targets the socially excluded groups through.
- Integrated non-formal education provision to different age groups where there is no education provision: sensitive to gender and development approaches for disadvantaged girls and boys, women and men (including child labour).
- Non-formal programs to target nomads, reverine communities and women and children in prison and darul amans.
- Early childhood provision in targeted schools for improved "Katchi" programs.
- Shelterless schools given buildings at elementary level.
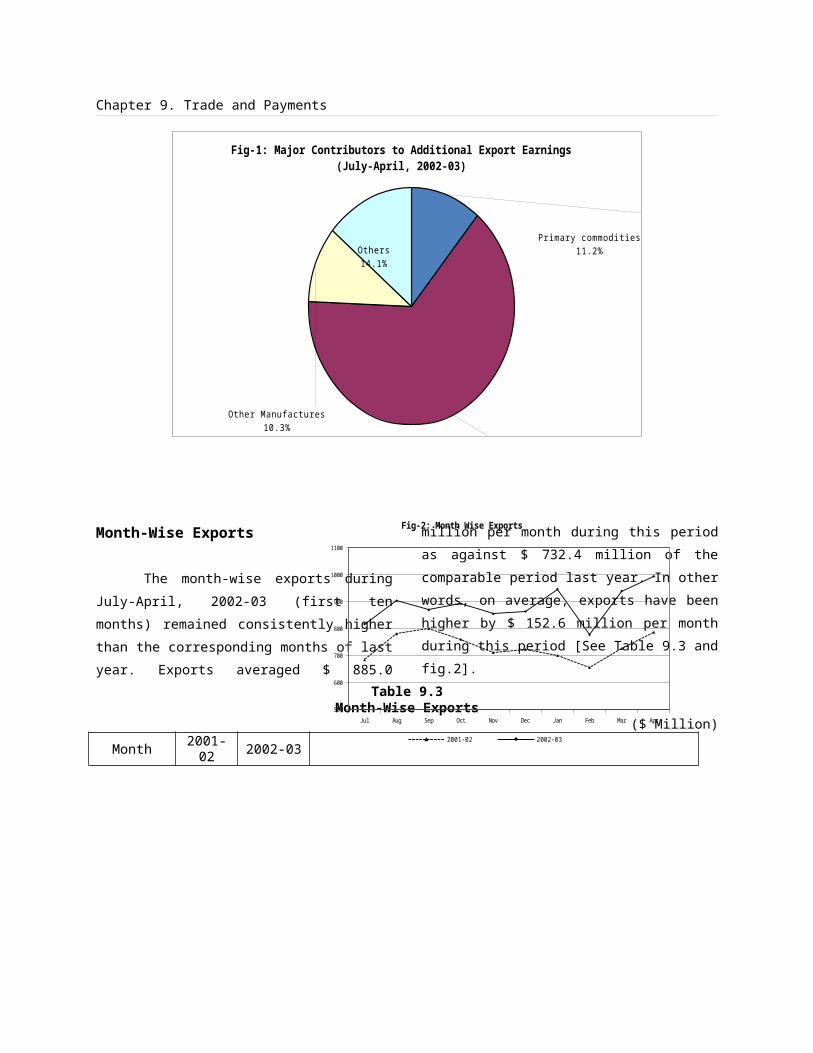
Chapter 11. Education
- Primary schools upgraded to elementary level especially for girls in far-flung areas and under-developed districts.
- Incentives to be provided such as free textbooks, school nutrition, scholarships and loans to students in both government and NGO institutions.
- Skill training of out of school youth in the evening.
- Linkages of technical stream and model technical high schools to micro-credit and poverty alleviation programs.
- Linkages of women's literacy programs and technical high schools to micro-credit and poverty alleviation programs.
- Grant of charter to private universities to incorporate provision for scholarship to meritorious needy students.
- Public sector higher institutions to become equitable in their fee schedules.
- Free meal and nutrition to girls under Tawana Pakistan Program.
Funds required for the EFA Sectors under primary education, adult literacy and early childhood education are given in the table-11.4.
Table 11.4(Rs. In million)
EFA Sectors Phase-1(2001-02 to 2005-
06)
Phase-II(2006-07 to 2010-
11)
Phase-III(2011-12 to 2015-
16)a) Primary EducationDevelopment 37,870 10,202 14,966Recurring 21,640 52,690 64,810Total 59,510 62,892 79,776b) Adult LiteracyDevelopment 16,582 16,775 17,811Recurring 36,857 41,246 50,705Total 53,439 58,021 68,516c) Early Childhood EducationDevelopment 2,450 3,075 6,375Recurring 4,345 10,500 21,000Total 6,795 13,575 27,375
Source: National Plan of Action, Ministry of Education, Islamabad.
Given the existing level of financing through the PSDP (Rs.2604 million for 2002-
03), it is unlikely that the resources required for achieving the above targets
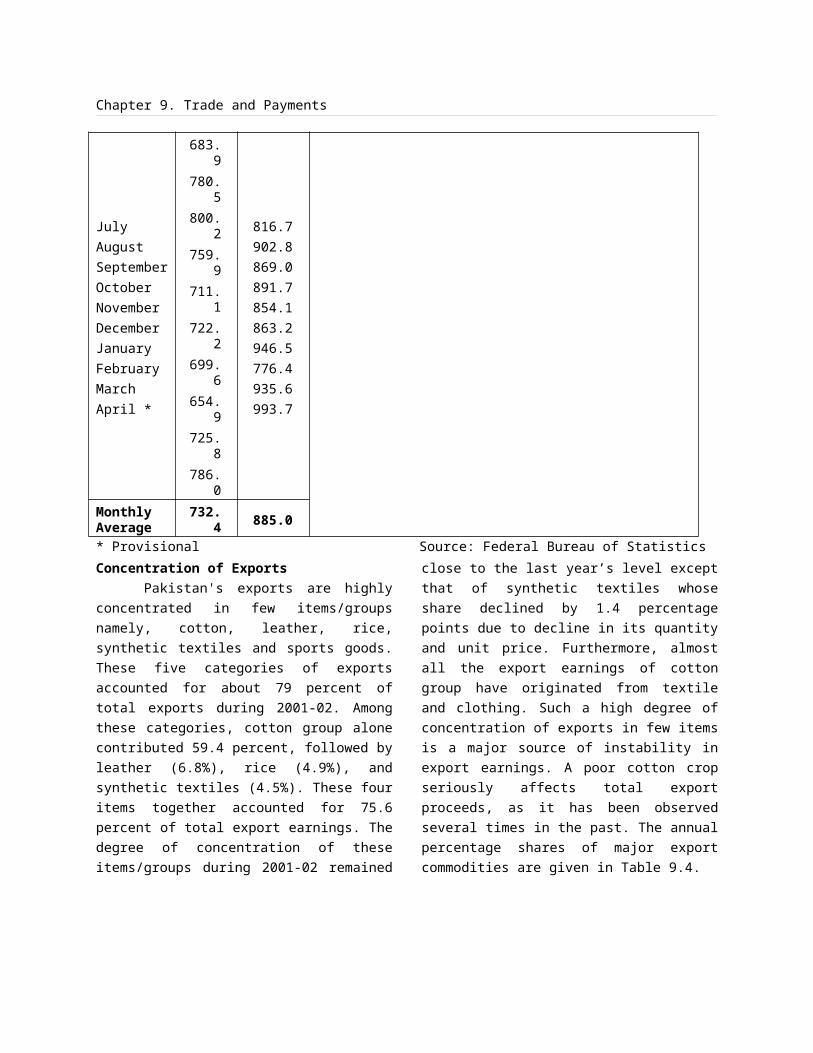
Chapter 11. Education
would become available. The pattern of national education budget for the years
1995-96 to 2002-03 is given in the Table-11.5.
Table 11.5National Education Budget During (1995-96 to 2002-03)
(Rs. In billion)Year Recurring Budget Development
BudgetTotal Education
Budget% of GDP
1995-961996-971997-981998-991999-002000-012001-022002-03
39.61040.53646.10046.97951.57254.39664.97567.270
2.5851.9682.9842.4272.4301.9662.5002.604
42.19542.50449.08449.40654.00256.36267.47569.874
2.002.622.342.401.71.61.91.7
Source: Ministry of Education
__________________________
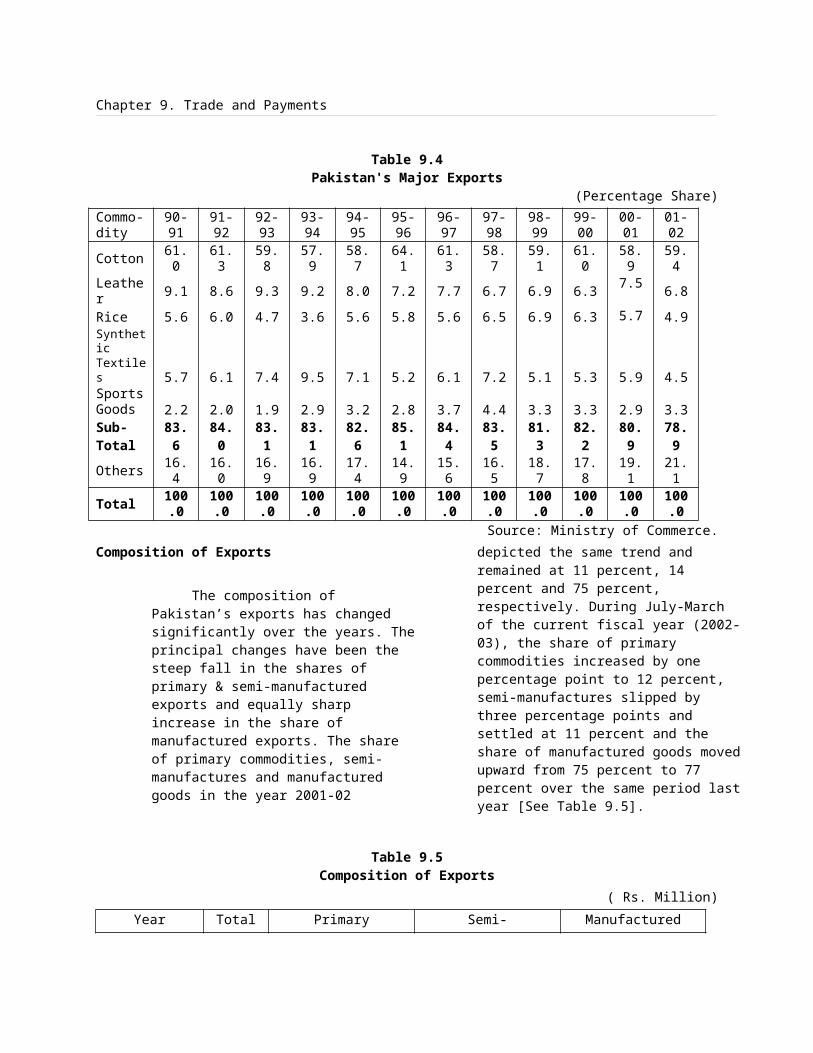
Chapter 12. Health and Nutrition
12. 12. Health & NutritionHeath is a priority area of Government
activities. The high correlation between the expenditures on health and productivity in developing countries like Pakistan is enough to emphasize the importance of increasing health services as an aid to growth. Hence in the health sector, poverty and ill health needed to be brought into sharp focus. Provision of better health facilities to improve the standard of living of the people in the country has been the paramount aim of the efforts in this sector. In Pakistan, health infrastructure has developed significantly over the years. However, the improvement so far made is far from impressive. A number of inadequacies such as unhygienic living conditions, spread of health facilities, scarcity of potable water, paucity of capital
resources to meet the recurring expenditure, malnutrition particularly among the children and women of reproductive age and suffering from the worse effects of Malaria, Tuberculoses, AIDS and Drug Abuse are the major areas of serious concern. The low level of life expectancy (63 years), high child mortality rate (110/1000) and high population growth rate at 2.1 percent provides the basis for rethinking of our national health priorities and points out to the need for better health care and preventive services. The government in recent years has started giving due priority to health planning by increasing the health allocation and trying out prioritized programmes with special focus on particular diseases.
Table 12.1Social Indicators
Country Life ExpectancyYear 2000
Infant Mortality Rate per
1000
Mortality Rate under 5 per
1000Year 2000
PopulationAvg. Annual (%)
Growth 1990-2001
Pakistan 63.0 83.3 110.0 2.5*India 63.0 69.2 88.0 1.8Sri Lanka 73.0 15.0 18.0 1.3Bangladesh 61.0 60.0 83.0 1.8Nepal 59.0 73.6 105.0 2.4China 70.0 32.0 39.0 1.0Bhutan 62.0 57.6 - 2.9Thailand 69.0 27.9 33.0 0.9Philippines 69.0 30.7 39.0 2.1Malaysia 73.0 7.9 11.0 2.4Indonesia 66.0 40.9 51.0 1.6
Source: World Development Report 2003*: Population growth rate for 2002-03 is estimated at 2.1%.
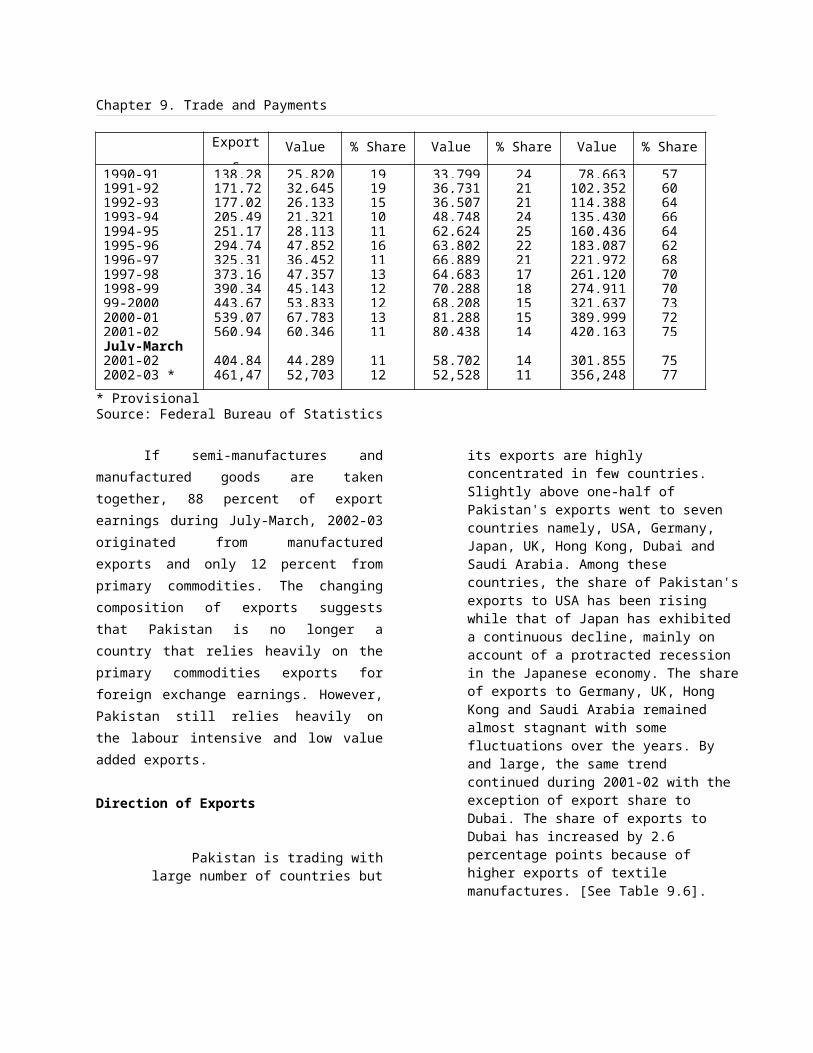
Chapter 12. Health and Nutrition
Comparative selected indicators (Table 12.1) on the quality of life in Pakistan reflects that the quality of life in Pakistan is not up to the mark in relation to other regional countries and emphasize to the need of taking all necessary measures to ensure better health services and improvement in quality of life by spending more on health.
Health facilities
Both the pubic and private sectors are providing medical facilities in the country. Medical facilities are constantly increasing in the country. The present national infrastructure of health facilities with 906 hospitals, 4590 dispensaries, 550 Rural Health Centres, 5308 Basic Health Units and 98264 hospital beds (see Table 12.2) compare well with other developing countries. However, the availability of one Doctor for 1466 persons, one Dentist for 29405 people, one Nurse for 3347 and one Hospital bed for 1517 persons reflect poorly on the health status of the country. The benchmarks of various physical facilities and health manpower are as under:
Table 12.2Health Facilities
Health Manpower Upto 2000-01 Upto 2001-02 Upto 2002-03
Registered doctors 91,
823
96,2
48
101,6
35
Registered dentists 4,1
75
4,62
2
5,068
Registered nurses 37,
528
40,0
19
44,52
0
Population per Doctor 1,5
29
1516 1,466
Population per Dentist 33, 3157 29,40
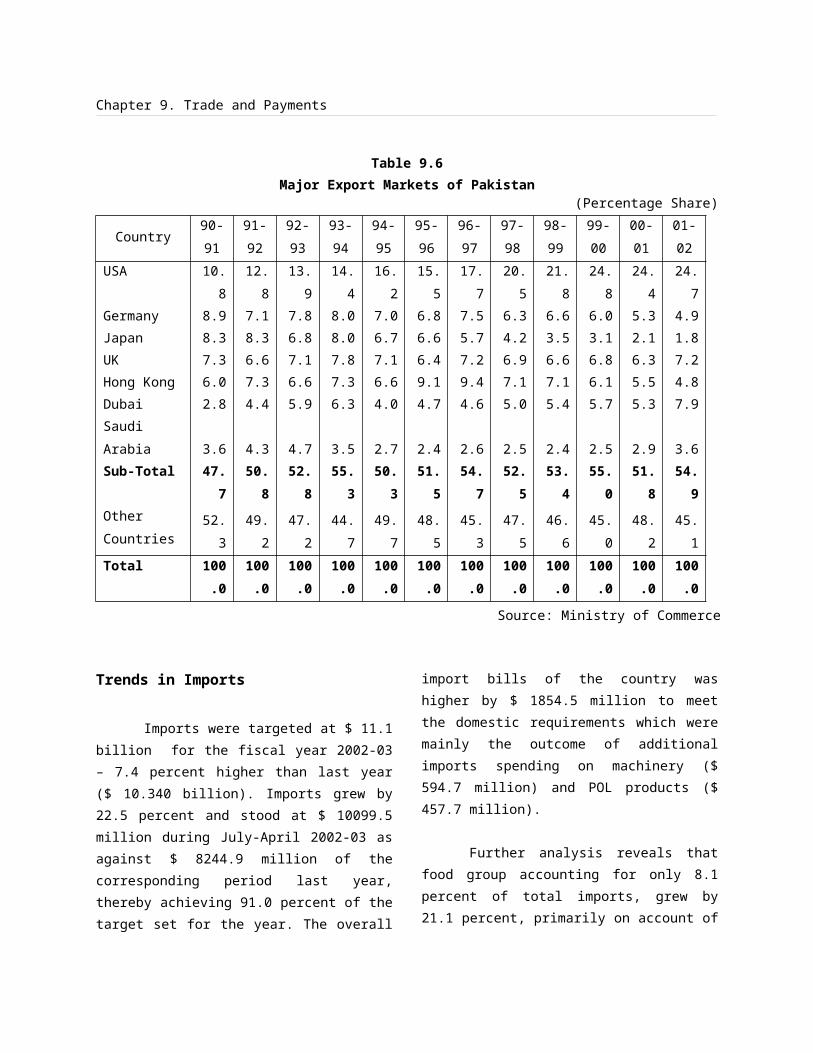
Chapter 12. Health and Nutrition
629 9 5
Population per Nurse 3,7
32
3639 3,347
Source: Ministry of Health
Physical Targets and Achievements
During 2002-03
The health sector performances in term of
physical infrastructure i.e. rural health centres,
basic health units and hospital beds has been
encouraging. The targets for health sector during
2002-03 include the establishment of 40 Basic
Health Units (BHUs), 8 Rural Health Centres
(RHCs), Upgradation of 20 existing Rural Health
Centres (RHCs), 30 Basic Health Units (BHUs) and
addition of 1600 hospital beds. The manpower
development targets covers the output of 3700
Doctors, 250 Dentists, 2300 Nurses, 5000
Paramedics and 500 Traditional Birth Attendants
(TBAs). Under the preventive programme, 8
million children were to be immunized and 19
million packets of Oral Rehydration Salt (ORS)
were to be distributed during 2002-03. The
achievements have been largely in the vicinity of
the targets .The health programmes during the
year has realized 63-96 percent of its physical
targets. Physical targets and achievements in the
health sector during 2002-03 are given in Table
12.3.
Table 12.3
Physical Targets and Achievements During 2002-03
Sub-Sector
Targets
(Nos)
Estimated
Achievements
(Nos)
Achievements
(%)
A. Rural Health Programmei. New Basic Health Units (BHUs)
ii. New Rural Health Centres (RHCs)
iii. Upgradation of existing RHCs
iv. Upgradation of existing BHUs
B. Beds in Hospitals/RHCs/BHUs
40
8
20
30
25
5
15
25
63
63
75
83
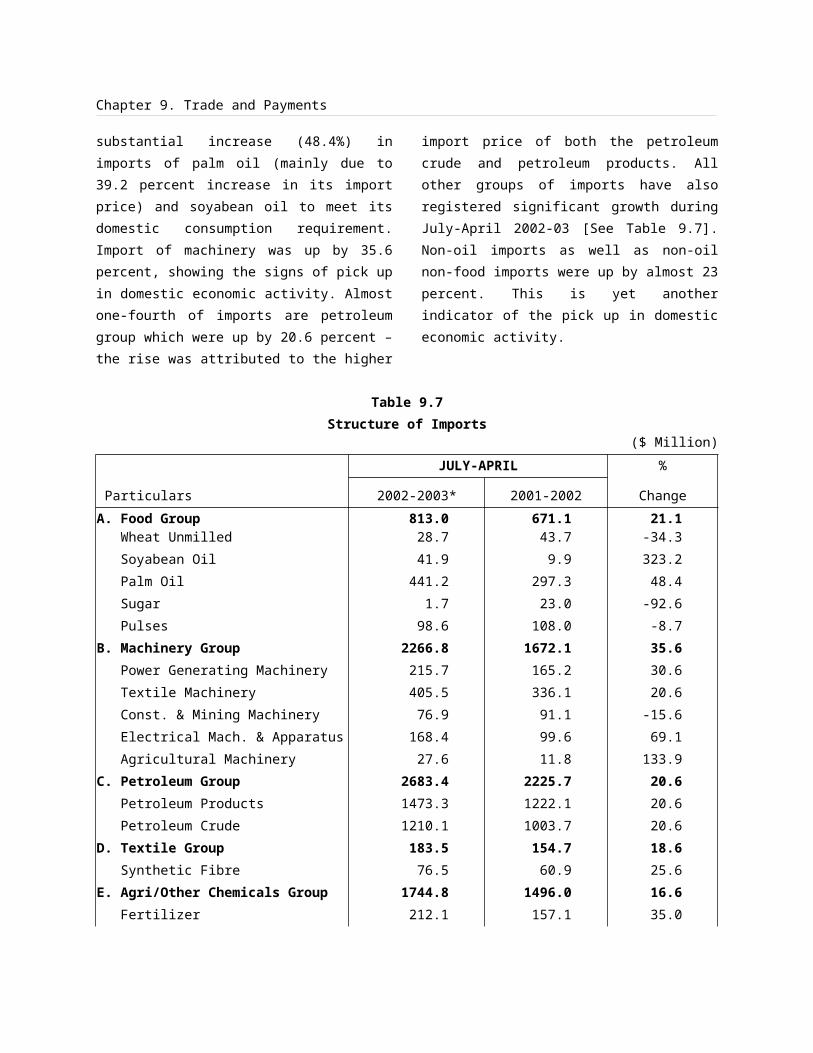
Chapter 12. Health and Nutrition
C. Health Manpower Developmenti. Doctorsii. Dentistsiii. Nursesiv. Paramedicsv. Training of TBAsvi. Training of LHWs
D. Preventive Programme
i. Immunization (Million Nos)ii. Oral Rehyderation Salt (ORS) (Million Packets)
1600
3700
250
2300
5000
500
17000
8.0
19.00
1400
3500
200
2000
4500
480
17000
7.5
18.00
88
95
80
89
90
96
100
93
95
Source: Planning & Development Division
Health Expenditure
In Pakistan both the public and private spending on health is very low. However, over the years they have steadily been increased. During the years under review (2002-03), the
total expenditure on health is estimated at Rs.28.814 billion (Rs.6.609 billion development and Rs.22.205 billion as recurring) showing an increase of 13.4 percent over last year and works out to be 0.7 percent of GNP [See Table 12.4].
Table 12.4
Health and Nutrition Expenditure(Million Rs.)
FiscalYear
Public Sector Expenditure
(Federal Plus Provincial)
Change( % )
As % ofGNP
Development Expenditure
CurrentExpenditure
TotalExpenditure
1995-961996-971997-981998-991999-002000-012001-022002-03
57416485607754925887594466886609
1061411857135871531616190183371871722205
1635518342196642080822077242812540528814
35.312.27.25.86.19.94.713.4
0.80.80.70.70.70.70.70.7
Source: Planning & Development Division
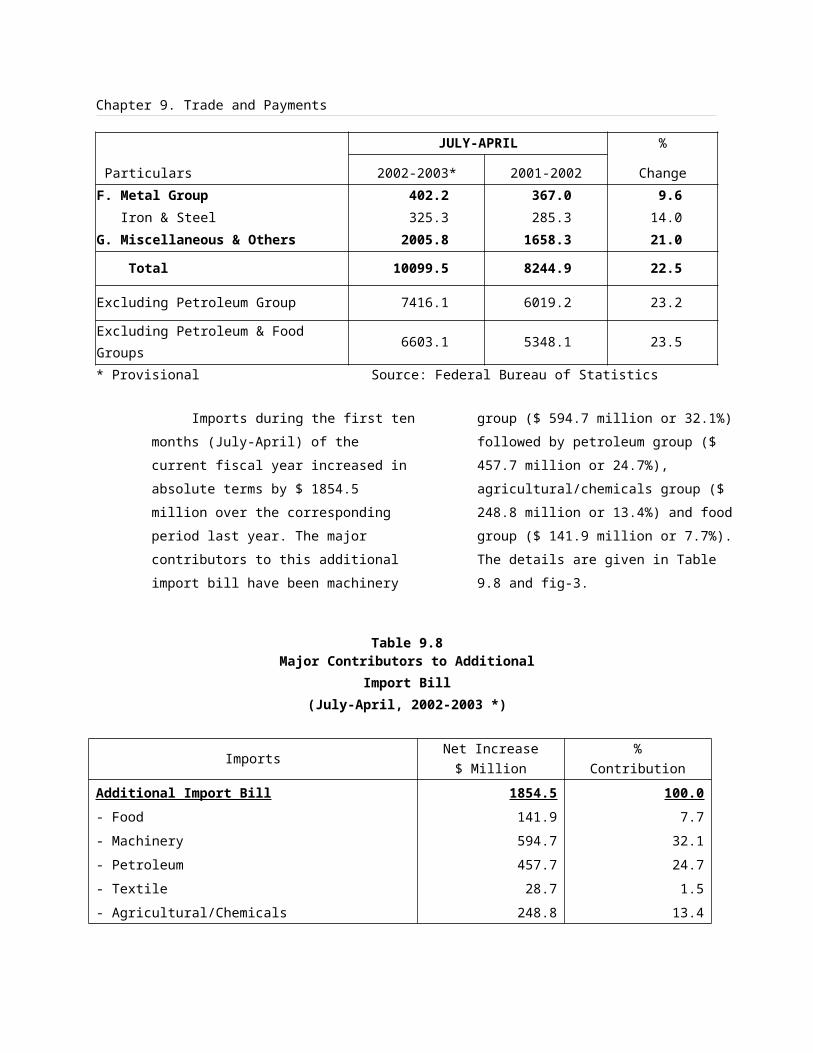
Chapter 12. Health and Nutrition
Health Programme
To maintain the expansion of health facilities, a number of health programmes have been undertaken. These programmes address to the various health problems such as Malaria, Tuberculoses (T.B), AIDS, Drug Abuse and Malnutrition and have made good progress. Work for expanded programme of immunization is in progress. The number of reported polio cases have been reduced. The TB DOTS programme has been expanded to 46 Districts and the annual parasite incidence (API) of Malaria has been reduced to 0.69/1000 population in 2002.
1. National Programme for Family Planning & Primary Health Care The programme aims at delivering basic health services at the door steps of the un-privileged segment of the society through deployment of Lady Health Workers (LHWs) living in their own localities. The programme is currently being implemented with strength of 70,000 LHWs and 3,000 Lady supervisors nationwide mainly in rural areas and urban slums of the country. These workers are providing services to their communities in the field of child health, nutrition, family planning and treatment of minor ailments. The scope of LHWs has been enlarged to include the wider concept of Reproductive Health. LHWs will be involved in vaccination of women and children under the EPI. This will augment the activities of the Expanded Programme of Immunization. In view of effectiveness of the LHWs at the grass root level, the government has decided to utilize their services in many other public health
programmes. At present, the National Programme is covering 50% population. This programme is expanding in a phased manner and by the year 2005, the target of 100,000 LHWs in the field will be achieved. With this strength, LHWs will be covering 90% of the target population.
2. Expanded Programme of Immunization The programme with total cost of Rs.5,367 million for the period 1999-04 mainly aims at reducing mortality by immunizing children of 0-11 months and women of child bearing age and with this end in view providing vaccination against six vaccine preventable diseases to 5 million children annually with immunization coverage at 77% for children and 50% for expected mothers. Almost all the Lady Health Workers (LHWs) in 57 districts have been trained as vaccinators. The polio eradication efforts have been intensified through the surveillance for disease detection and improved quality campaigns, and as a result, there has been a significant progress. During the current year upto April 2003, the number of reported cases throughout the country has been reduced to only 18 against 76 in 1999, and 32 in 2002. Hepatitis B has been introduced in the EPI regime with the help of grant assistance from Global Alliance for Vaccination and Immunization (GAVI). Apart from Hepatitis B, the GAVI is also providing grant assistance of US$ 33 million for the improvement of EPI infrastructure in
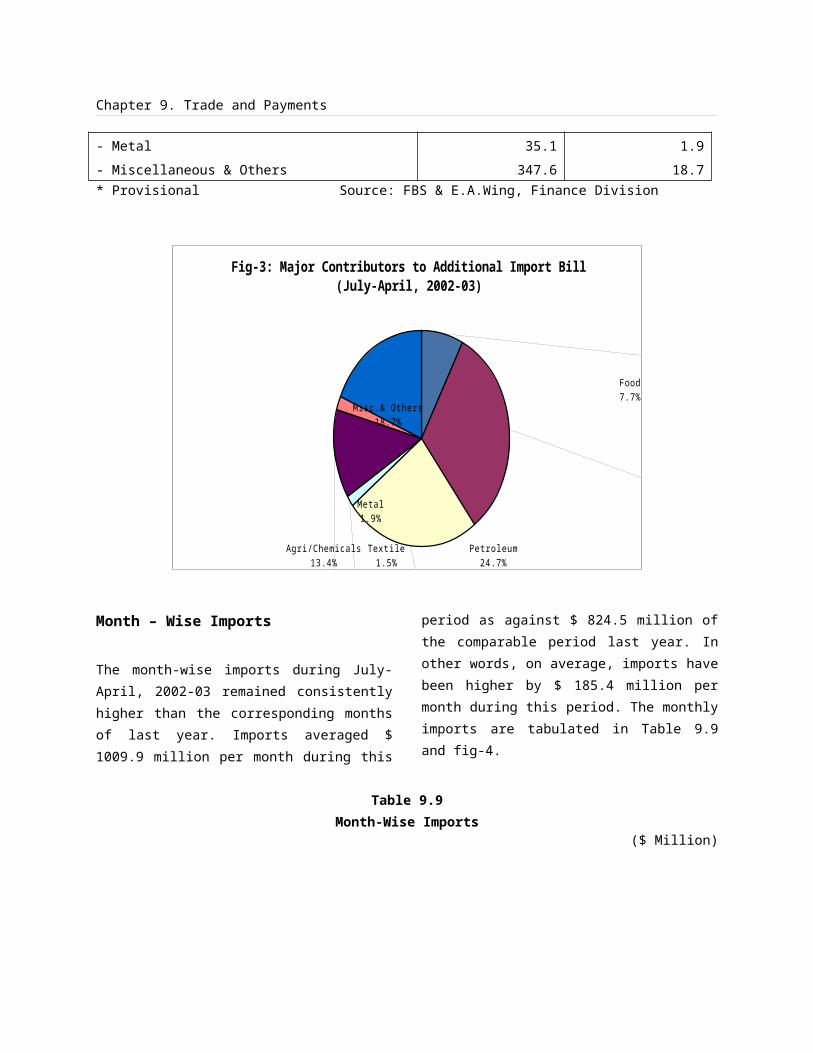
Chapter 12. Health and Nutrition
the provinces and another US$ 11 million for injection safety.
3. National AIDS Control ProgrammeHIV/AIDS as epidemic has now been understood not as a health issue but as a major threat to human security. The disease continues to spread everywhere including Pakistan. The objectives of the AIDS/HIV prevention programme are to prevent HIV transmission, reduce morbidity associated HIV/AIDS, promote safe blood transfusion and establish surveillance system. The programme strategies include creating awareness among the public through information, education and ensuring safe blood transfusion. The Government has prepared an enhanced National AIDS Control Programme costing Rs.2.8 billion, including assistance from the World Bank. A provision of Rs.250.0 million (Rs.100.0 million for ongoing National AIDS Prevention Programme and Rs.150.0 million for the Enhanced Programme) has been made during the current financial year 2002-03. This constitutes a 100% increase in the budget for combating HIV/AIDS in the country. 47 Surveillance Centres have been established where 3.3 million test for HIV/AIDS have been performed. During the year, 1741 infected and 231 AIDS cases reported to National AIDS Control Programme against 3.526 million tests carried out uptill 30th September, 2002 and more than 5722 spots (TV & Radio) have been shown till February 2003. Posters,
leaflets, guidelines and brochures have been printed and distributed.
4. Malaria Control Programme The efforts aimed at preventing and treating malaria by the Government has resulted in low level of malaria. A project, costing Rs.253.0 million, based on roll back malaria strategy is in progress. The Annual Parasite Incidence (API) has been reduced to 0.69/1000 in 2002 as against 0.74/1000 in the year 2001. Districts implementation plans for roll back malaria have been finalized in 19 high risk districts.
5. T.B. Control ProgrammePakistan has the 8th highest T.B. burden globally. The government has included T.B. Control Programme in the priority list of the health programmes and has reaffirmed its pledge to reduce the burden of tuberculoses in the country. The estimated prevalence is around 1.5 million patients and every year 250,000 new persons are infected with T.B. The incidence of sputum positive Tuberculoses in the country is 81/100,000. The programme aims to control T.B. through DOTS strategy with the objectives of achieving 85% cure rate, and 70% detection rate, and reducing T.B. cases by providing technical assistance, and development of health education. The programme was approved at Rs.66.733 million for 2000-01 to 2003-04. However, it was revised at Rs.159 million after receiving an additional allocation of Rs.121 million. During the year 2002-03 a total allocation of
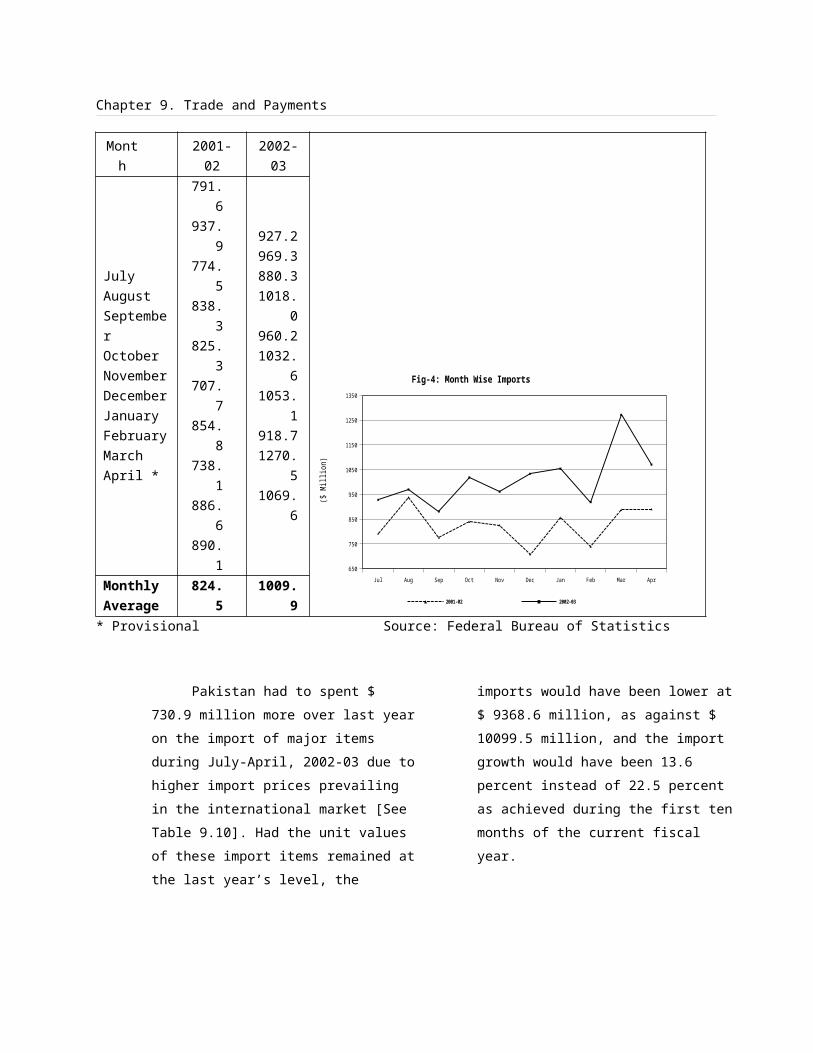
Chapter 12. Health and Nutrition
Rs.63.000 million has been made for T.B. Control Programme. Main achievements of the programme includes coverage of 47 districts under DOTS strategy, DOTS coverage is being expanded and has increased to 50% and under the Global Drug Facility (GDF) the first tranche of drugs for 150,000 T.B patients has been received.
6. Women Health ProjectThe project aims at improving the health, nutrition and social status of women and girls by developing Women-Friendly Health Systems in 20 districts of Pakistan. The project has been launched throughout the country with total outlay of Rs.3750 million and support from the Asian Development Bank. Its specific objectives are to:
i) Expand basic women’s health interventions to under-served population.
ii) Develop women friendly district health systems providing quality women’s health care from the community to first referral level including emergency obstetric care.
iii) Strengthen the capacity of health institutions and develop human resources to improve women’s health in the long-term.
Cancer Treatment Programme
At present 13 nuclear medical centres are providing diagnosis and treatment facilities to the 80% population of the cancer patients with most modern facilities available at these centres. The major disciplines available in these nuclear medical centres are (a) nuclear medicines and radioimmunoassay and (b) oncology and radiotherapy. The nuclear medicine deal with the diagnosis and treatment of various diseases while oncology and radiotherapy deals with the treatment of cancer. More than 320,000 patients were attended during the year 2002-03 and about 133,592 patient were provided proper treatment as well as follow-up.
Drug Abuse
The drug abuse addiction has emerged as a major health hazard, affecting the socio-economic life of the nation. Thousands of productive youth have been rendered un-functional by narcotic drug abuse. In view of the sharply upward trend in prevalence of drug abuse, it is considered a matter of high priority to educate the nation on the adverse effects of drug abuse.
Effective steps have been initiated by the government for prevention of drug trafficking and drug abuse. A five years Drug Abuse Control Master Plan is under implementation. A mass awareness programme has been launched through the use of radio, newspapers and pamphlets to inform and alert the general public of the necessity for community awareness and action. A community participation project for drug demand reduction has also been initiated. Cooperation between Pakistan and Iran on the prevention of drug trafficking and drug abuse has helped in reducing drug trafficking across borders. A similar understanding has also been reached between Pakistan, Saudi Arabia, Egypt, China, Poland, Russian Federation and the
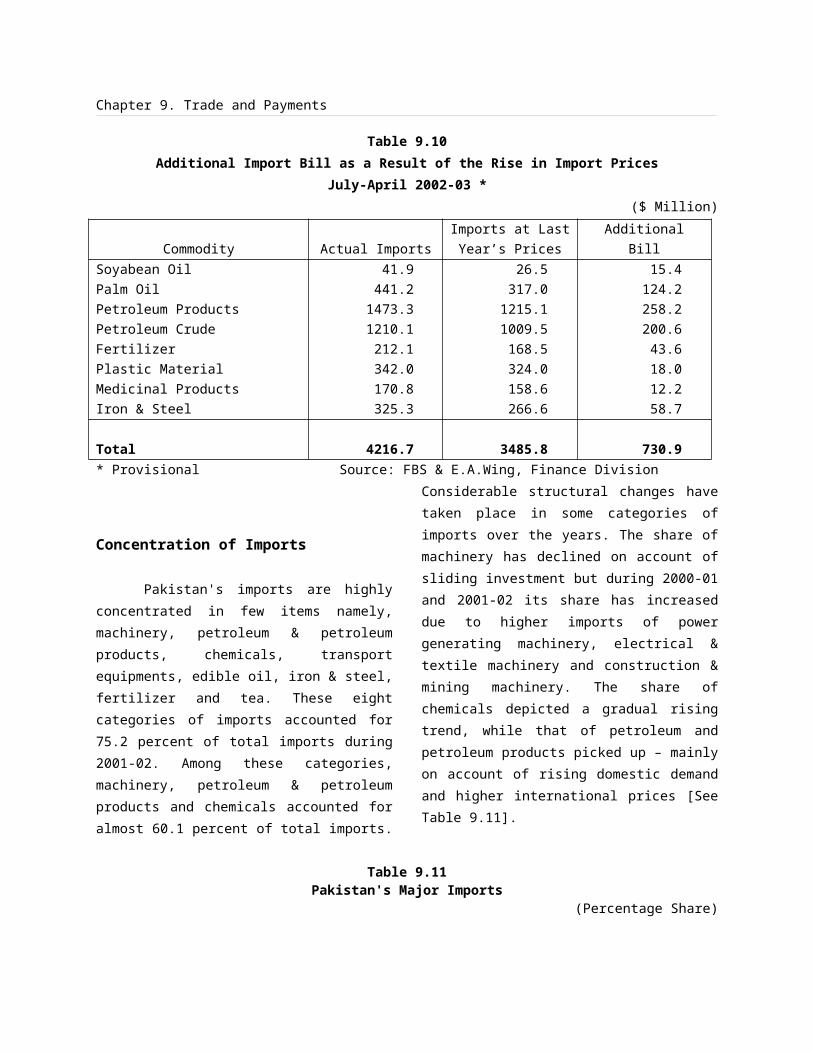
Chapter 12. Health and Nutrition
Central Asian States. A strict ban on poppy cultivation has maintained during the year and the poppy crop wherever cultivated is being destroyed with the help of Law Enforcement Agencies.
Area development projects in Bajaur, Mohmand and Khyber Agencies are under implementation. These projects aim at eradication of poppy cultivation by providing alternative means of income to the poppy
growers in those agencies. Besides, under the Border Security Project, an amount of US$ 4.5 million was allocated to enhance mobility, surveillance and communication capacities of the Anti Narcotics Force.
The statistics regarding seizure of narcotics by the Law Enforcement Agencies during the period from July 2002 to March 2003 are given as follows:-
Table 12.5Cases of Narcotics
Items Opium Heroin Charas
1. No. of Cases 540 5167 26536
2. No. of Defendants 551 5210 26647
3. Drug Seized (Kgs.) 1644 11608 4784
Source: Narcotics Control Division
Food and Nutrition
Nutritional adequacy is one of the key determinants of the quality of human resources. Despite the rapid progress made in food production [See Table 12.6] and processing, mal-nutrition continues to be a major area of concern for public health. The problem of mal-nutrition in developing countries including Pakistan encompasses a spectrum of deficiencies for which the most devastating are the deficiencies of iron, iodine and vitamin A. Together they contribute to a great deal of morbidity and ill health and as such leads to health consequences, adding burden to an individual’s resource in capabilities and lack of one’s full participation in the social and economic activities. Programme aims at reduction of infant mortality and low birth weight babies; better child and maternal health care; promotion of breast feeding; and prevention of night blindness, and iodine deficiency diseases.
Micronutrient Deficiency Control Programmes
The major component of nutrition is micronutrients deficiencies e.g. Iodine, Iron, Vitamin A. Various programmes remained under implementation during the year are summarised as under:-
a. Control of Iodine Deficiency DisorderThe project aims to eliminate Iodine Deficiency Disorders (IDD) through universalising Iodized Salt by promoting its use among population and households.
b. Control of Iron Deficiency through Flour Fortification
To overcome the iron deficiency anemia, a feasibility study for wheat flour fortification with iron for the roller mills is under way. The study has four trials viz. production, stability and acceptability,
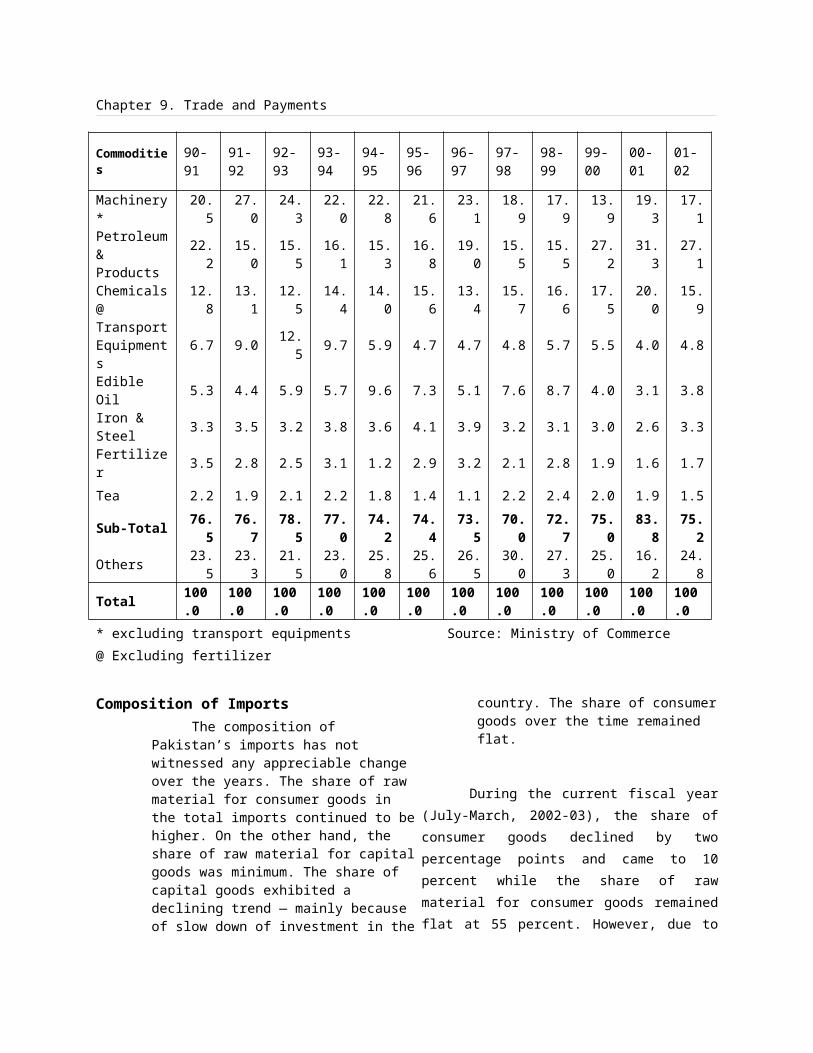
Chapter 12. Health and Nutrition
bio-availability and community-based efficacy trials.
Vitamin A
i. Fortification of edible oil/gheeThe quality aspects for Vitamin A fortification of ghee/oil are going to be adopted to ensure necessary vitaminisation in ghee/oil by the producers.
ii. Vitamin A SupplementationVitamin A supplementation of children from 6 months to five years of age is being implemented as regular part of National Immunization Days (NIDS and Sub-NIDS) to protect them from infections.
Nutrition in Primary Health Care (PHC)
The objective of improvement of nutrition through Primary Health Care is to improve in qualitative terms the nutritional status of women, girls and infants by providing and expanding more PHC nutritional services. More than 70,000 Lady health Workers working at village level provided services for micronutrient supplementation and counseling on growth promotion, maternal and child nutrition, breast feeding and complementary feeding on regular basis. As part of the PHC component of nutrition, nutrition information, education and communication activities have been started. Training
of health professionals regarding health/nutrition education focussing on nutrition problems of women and children and their remedies has started.
Community Nutrition Programme
a. Breast Feeding Promotion and ProtectionThe aim of this programme is to create awareness among the masses, particularly mothers, about the importance of exclusive breast feeding of infant for first six months and appropriate supplementary feeding along with breast feeding subsequently upto 2 years to reduce malnutrition in infants and children. As part of the early child hood protection, breast-feeding, promotion and protection remained in progress. More hospitals have been declared Baby Friendly Hospitals, Lactation Management Curriculum was revised/upgraded incorporating recent advances in the technical knowledge and needs of the target groups which would be used in future training programmes.
b) Tawana Pakistan Project, School
Nutrition Package for Girls
This programme addresses widespread malnutrition in girls co-instituting almost 45% of population which will pay dividends in short and long term.
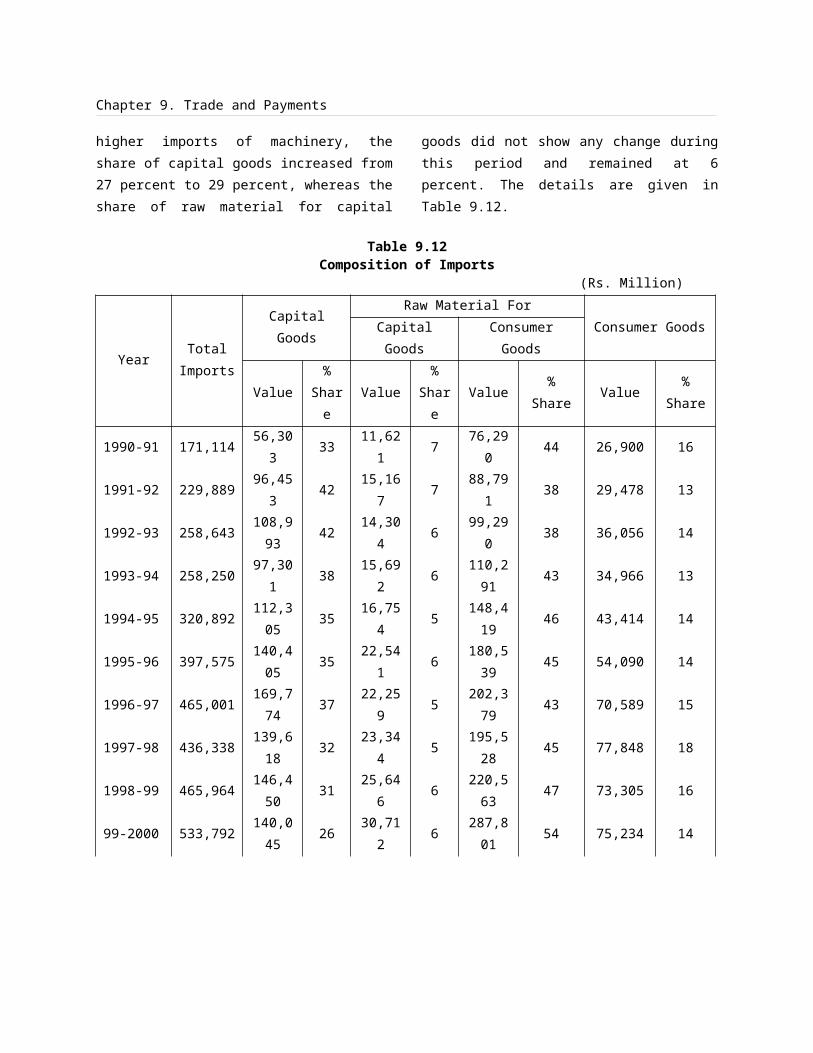
Chapter 12. Health and Nutrition
Awareness would be created within communities about the need for balanced nutrition at critical periods of life such as pregnancy and early child hood. 26 poor districts in 4 provinces
have been selected with 5000 girls’ schools to cover 500000 school girls (5-12 years). The programme has been initiated.
Table 12. 6 Food Availability Per Capita
Items Year/ Units
49-50 79-80 89-90 95-96 97-98 98-99 99-2000 2000-01 (E)
2001-02 (T)
Cereals Kg 139.3 147.1 164.7 156.9 159.7 171.0 163.5 164.9 149.3 Pulses Kg 13.9 6.3 5.4 6.2 5.9 6.8 7.2 7.0 6.1 Sugar Kg 17.1 28.7 27.0 26.4 32.8 31.2 26.4 30.8 26.1 Milk Ltr 107.0 94.8 107.6 121.1 147.3 148.0 148.8 149.6 150.8 Meat Kg 9.8 13.7 17.3 21.4 17.9 18.2 18.7 18.8 18.9 Eggs Dozen 0.2 1.2 2.1 2.2 2.2 5.1 5.1 5.2 5.2 Edible Oil
Ltr 2.3 6.3 10.3 11.4 11.6 12.3 11.1 11.2 11.3
Caloric & Protein Availability (Per Capita)
Calories per day (Number)
2078 2301 2534 2522 2655 2728 2625 2706 2306
Protein per day (Gms)
62.8 61.5 65.47 67.38 68.37 71.85 70.00 71.74 67.00
E. Estimated Source: Planning & Development Division
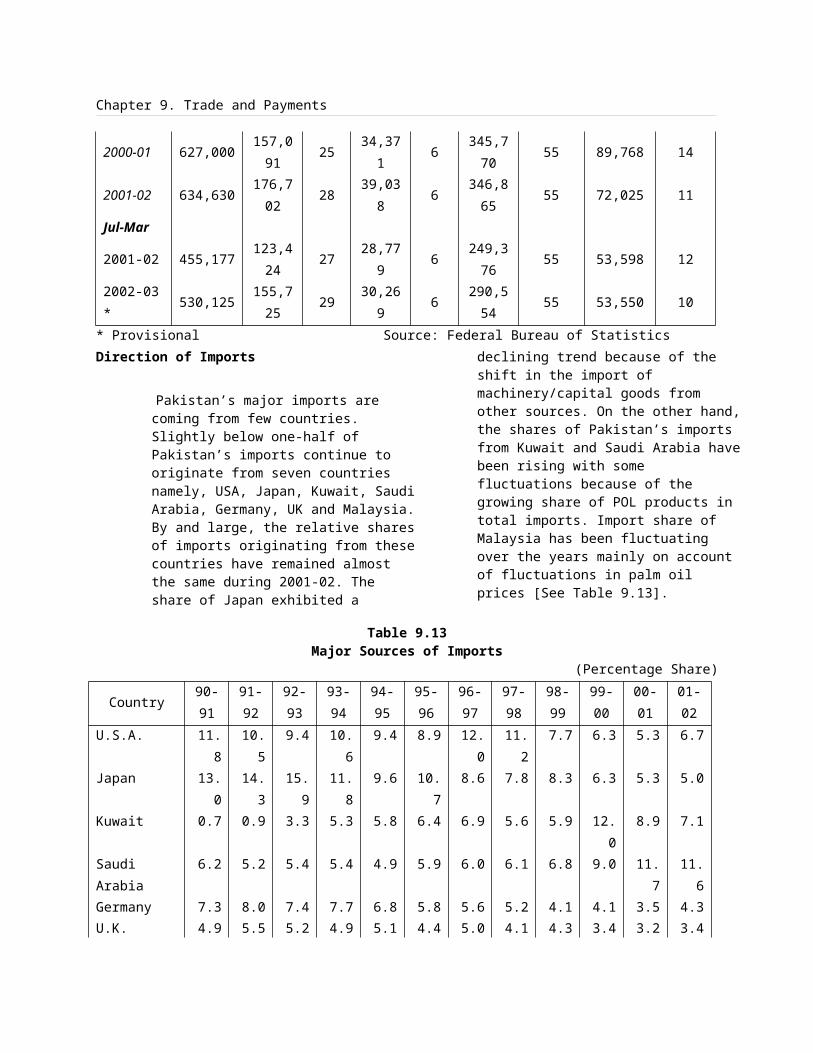
Chapter 13. Population, Labour Force, and Employment
13.Population, Labour Force, and EmploymentWith population growing at
2.1percent per annum and addition of 3.1
million persons every year, Pakistan faces a
formidable challenge of tackling the issue of
economic development and poverty
reduction. Such sizeable addition to the
population, not only dilutes the results of
the development efforts but also creates
unsustainable level of demand on already
scarce resources to cater for the needs of
the population. This also imposes restraints
on efforts for improving the living conditions
of the population. In the past, high
population growth has significantly pushed
the population below poverty line. If current
trend persists, Pakistan's population will
reach 217 million by the year 2020. Based
on present growth patterns and trends, the
economy would not be able to sustain the
growing pressure of population and
resultant deterioration in quality of life will
foil government's recent efforts for social
uplift. The high population growth is,
therefore, a matter of national concern.
Hence, the thrust for improvement in
quality of life, social uplift and economic
development can be augmented by
improving the effectiveness of population
welfare program.
Pakistan has been facing the ever-
largest adolescent population, because of
its high level of fertility over the last few
decades, (decline in fertility is a very recent
phenomenon). The adolescent population,
in the age group of 15-24, as it enters into
its reproductive phase embodies potential
population growth for several decades. It
constitutes population momentum with
serious implications for provision of
schooling, healthcare and other basic
amenities of life for the coming decades.
Almost one third of Pakistanis are living
below poverty line. The impact of
population growth on poverty is obvious,
since poorer families, especially women and
marginalized groups bear the burden of a
large number of children with relatively
fewer resources, further adding to the spiral
of poverty and deterioration in the status of
women. Thus, large part of the population is
constrained to live in poor housing and
sanitation conditions, with lack of access to
safe drinking water. In particular, the
income poverty leads to pressure on food
consumption and adversely affects caloric
intakes. This adds to malnutrition in poorer
families and contributes to high levels of
child and maternal morbidity and mortality.
Furthermore, the rapid population growth
also contributes to environmental
degradation and depletion of natural
resources, data shows that during last three
decades, developing countries with lower
fertility and slower population growth have
seen higher productivity, more savings and
more investments. Investments in
population welfare programme, education
and health sectors have contributed
substantially to fertility declines. Therefore,
addressing high population growth should
undoubtedly be magna cartae of the overall
planning perspective. The need to pursue
an effective population program at all levels
can neither be ignored nor exaggerated.
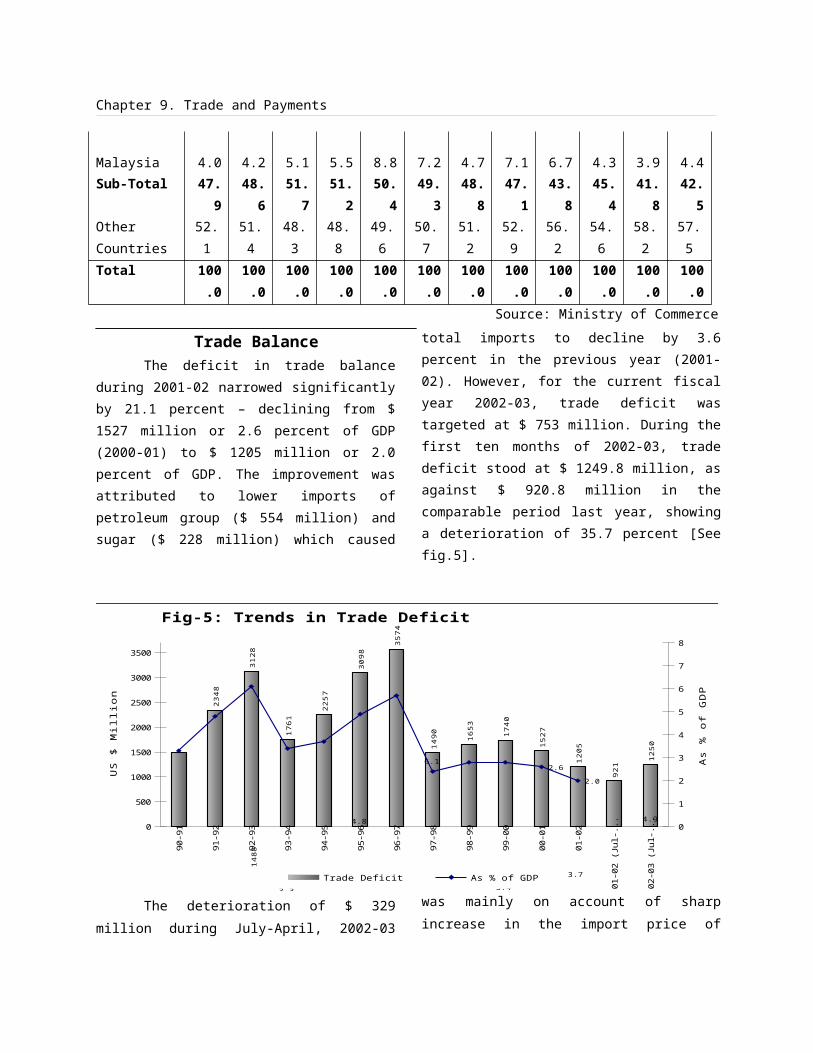
Chapter 13. Population, Labour Force, and Employment
With population of 149 million
(2003), Pakistan ranks at 7th position in
terms of World's population size. It is
encouraging to note that the demographic
transition has started and the growth rate is
estimated to decline to 1.8 percent by mid
2004. The country has to amass additional
resources to feed, cloth and provide various
services to population The population of the
country has marked with considerably high
proportion of young age, high dependency
ratio and big size. The increasing number of
population has resulted in low level of
human development, low savings &
investment ratios, low labour force
participation rate and low per capita
income. Hence, Pakistan is classified among
the low-income countries.
Family planning programs have been
pursued in the country since 1950s. The
frequent changes in program strategies and
inconsistent political support remained
main impediments in the way of its
successful implementation. Ministry of
Population Welfare have formulated an
Interim Population Sector Perspective Plan
2012.
Due to demographic transition, the
share of old age population has declined by
1.5 percentage points. This change in
demographic structure owes heavily to a
steady decline in population growth since
1981. With further slow down in population
growth, Pakistan may see its shares of
working-age population to rise while that of
young age population decline. Demographic
transition provides an opportunity for
raising economic growth and increasing
prosperity. Pakistan may succeed in
mobilizing sufficient capital (investment)
and use it efficiently with the rising working-
age population but this will depend largely
on government's socio-economic policies. If
the workforce is better educated, it will be
better placed to contribute to economic
growth. If government's macro-economic
policies are such that lead to job creation,
the country will more likely to realize the
potential benefits of demographic transition
in terms of higher economic growth.
Population Size and Literacy Rate
Pakistan has experienced an
accelerated population growth rate. It's
population has increased from 32.5 million
(1947) to an estimated 149 million in 2003.
In 1951 the population of the country was
33.7 million, which has increased to 85.1
million by 1981 and further to about 149
million by 2003. In other words, it has
quard-ruppled in the last 52 years. The
population is increasing but at a sliding
scales i.e. from 3.06 percent to 2.1 percent
per annum. However during the last 25
years, the adult literacy has increased from
26.2 percent in 1981 to 51.6 percent in
2003. The population growth and literacy
rates since 1981 to 2003 are comparatively
given in Table 13.1.
The current population growth is still
high (2.1percent) and the government is making
every effort to reduce it to 1.8 percent by 2003-
04 as per country's Interim Poverty Reduction
Strategy Paper (IPRSP). The various population
planning programmes launched by the
Government have effectively contributed in
slowing the population growth rate. Realizing the
importance of improving the country's social
Chapter 13. Population, Labour Force, and Employment
indicators in general and education in particular
the government has prepared a medium-to-long
run program with a view to educating its citizen
under the Education for All Program.
Table 13.1Population Growth and Literacy Rates (1981 to 2003)
Mid Year Total Population (Million)
Growth Rate (%) Literacy Rate (%)Rate % Change
19811982198319841985198619871988198919901991199219931994199519961997199819992000200120022003
85.1087.6790.3092.9695.6798.41101.18103.99106.84109.71112.61115.54118.50121.48124.49127.51130.56133.61136.64139.76142.86145.96
149.03(E)
3.063.632.992.952.902.862.822.772.732.692.632.602.562.512.472.432.382.342.292.242.222.162.10
26.226.227.127.928.829.830.731.732.733.834.936.037.238.439.640.942.243.645.047.149.050.551.6
-0
3.43.03.23.53.03.33.23.43.33.23.33.23.13.33.23.33.24.74.03.12.2
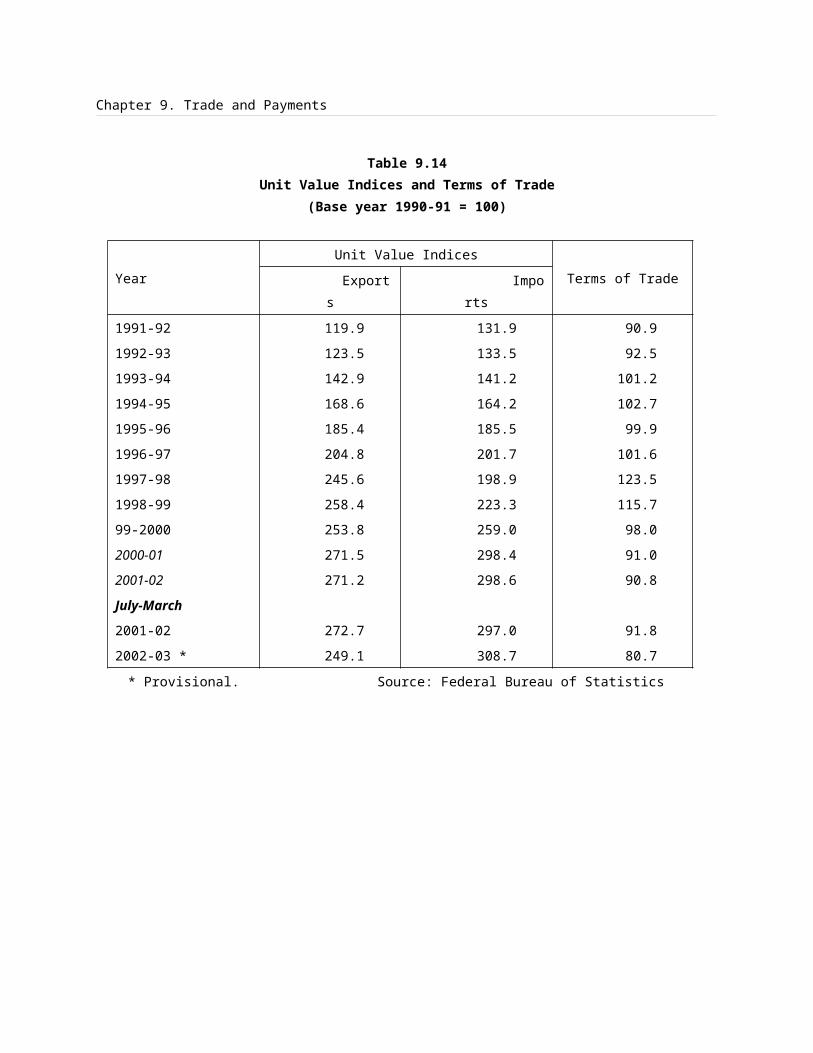
Chapter 13. Population, Labour Force, and Employment
E: Estimated Source: Population Census Organization & Ministry of Planning & Dev. Division .
19
81
19
82
19
83
19
84
19
85
19
86
19
87
19
88
19
89
19
90
19
91
19
92
19
93
19
94
19
95
19
96
19
97
19
98
19
99
20
00
20
01
20
02
20
03
0
0.4
0.8
1.2
1.6
2
2.4
2.8
3.2
3.6
4
Fig-1: Trends in Population Growth
% G
row
th
Fertility, Mortality and Infant Mortality rates.
The high rate of population is also due to decline in mortality rate, owing to elimination of epidemic diseases. The decline in mortality rates can also be attributed to improved water supply, drainage and other social services. However the fertility has shown a modest decline over the recent years. The crude death rate (CDR) of Pakistan is estimated at 8 (per hundred thousand live births), consequently every year about seventeen thousand of new born babies become motherless. The life expectancy in Pakistan is 63 years. The major reasons for the slow decline of mortality rate in Pakistan include complications of pregnancies, repeated pregnancies and births. The other major killers are accidents in adults, cardiovascular diseases and cancer in the elders.
Despite considerable decline in total
mortality in Pakistan, the infant mortality has
been quite high. It is estimated at 83 per thousand
live births in 2003. The major reasons for high
rate of infant and child mortality are diarrhea and
neumonia. Table -13.2 reflects the demographic
indicators i.e. Total Fertility Rate (TFR), Crude
Birth Rate (CBR), Crude Death Rate (CDR),
Infant Mortality Rate (IMR) and Maternal
Mortality Rate (MMR) and life expectancy in the
country.
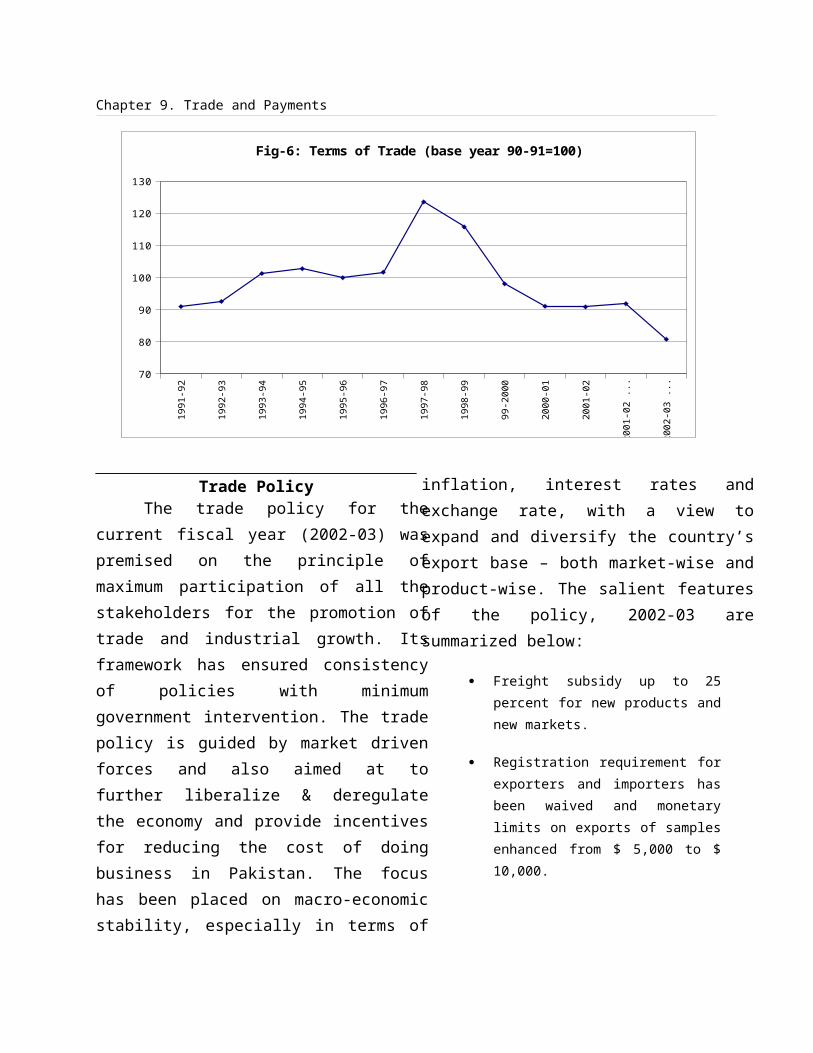
Chapter 13. Population, Labour Force, and Employment
Table No.13.2Selected Demographic Indicators.
Indicators Year (2003)Total Fertility Rate (TFR) 4.3Crude Birth Rate (CBR) 27.3Crude Death Rate 8Infant Mortality Rate (IMR) 83Maternal Mortality Rate (MMR)(per 100 thousand live birth)
350-435
Life Expectancy Male} Female}
63
Source: Population Census Organization &
Ministry of Planning & Dev. Division.
Population Distribution:
The population of Pakistan is unevenly distributed over it's four provinces (Punjab, Sindh. NWFP AND Baluchistan) and Federally Administered Tribal Areas (FATA) and Federal Capital Islamabad. Table-13.3 reflects province and area wise population.
Table No13.3Province-wise Population, Land Area and Percent Distribution
1951, 1981, 1998 and 2003(Population in Thousand)
Province Area Sq.Kms
Year1951
Year1981
Year1998
Year(2003)
A PAKISTAN 796096(100)
33816(100)
84453(100)
130,600(100)
149,030(E)(100)
i) PUNJAB 205344(25.8)
20557(60.8)
47292(56.1)
72,585(55.59)
82,710(E)(55.5)
ii) SINDH 140914(17.7)
6054(17.9)
19229(22.6)
29.991(22.97)
34,240(E)(22.97)
iii) NWFP 74521(9.1)
4587(13.6)
11061(13.1)
17,577(13,3)
20,170(E)(13.54)
iv) BALUCHISTAN 347190(43.6)
1187(3.5)
4332(5.1)
6,510(4.99)
7,450(E)(5)
v) FATA 27220(3.4)
1337(3.9)
2199(2.6)
3,138(2.4)
3,420(E)(2.3)
vi) Islamabad 906(0.1)
94(0.3)
340(0.4)
799(0.61)
1,040(E)(0.7)
E: Estimated Source: Population Census Reports & Planning Commission.Population Density
Table 13.4 reflects that population density has increased from 43 (1951) to 185 (2003) persons per sq.km. During the year 2003, the population density ranges between 1137 persons per sq.km in
Islamabad (capital) to 21 persons in Baluchistan province. The most populous province is Punjab having a population density of 398 persons per sq.km followed by NWFP (267), Sindh (240), FATA (125) and Baluchistan (21).
Table No13.4Province Wise Population Density
Province 1951 1981 1999 2003
Chapter 13. Population, Labour Force, and Employment
(Area Kms) (Density) (Density) (Density) (Density)
A Pakistan (43) (106) (164) (185)i) Punjab (100) (230) (353) (398)ii) Sindh (43) (135) (213) (240)iii) N.W.F.P (62) (148) (235) (267)iv) Baluchistan (3) (12) (19) (21)v) FATA (81) (115) (125) (125)vi) Islamabad (104) (376) (881) (1137)
Source: Population Census Reports and Planning Commission estimates.
Urban-Rural Distribution:
The migration from Rural areas to Urban cities in the country is on rise. The urban population at the time of independence (1947) was 5 million (15.4%) which had increased to 23.84 million (28%) in 1981 and further to 42.445 million (32.5%) in 1998. During 1981 to 1998, the total population increased by 55 percent whereas the urban and rural population increased by 60 percent and 40 percent, respectively. However during 2003, the urban and rural population distribution is estimated to be 89.7 million (61 %) and 53.3 million (39%) respectively.
Population Size and Growth
The population of Pakistan recorded an increase of 57.02 percent over the last 17 years i.e. 1981-98. If we go back further, the intercensal increase was 29.01,52.31 and 27.09 percent during 1972-81, 1961-72 and 1951-61, respectively. Overall the population of Pakistan has increased four times since the first population census of Pakistan in 1951.
According to the 1998 Population Census, the population below 15 years is 43.4 percent of the total population, a little less than in 1981 when it was 44.5 percent.
Out of these, 14.8 percent are below 5 years of age including 2.3 percent infants. The population of persons of 65 years and above is 3.5 percent. The population of working age group, i.e. 15 to 64 years thus comes to 53.1 percent, a little higher than half of the total population.
Household Size
The average household size for Pakistan as a whole is 6.8 persons in 1998. The household size varies among all administrative units of Pakistan. The highest household size in 9.3 in FATA followed by 8.0 in NWFP and 6.9 in Punjab province. The household size of Balochistan and Sindh provinces is 6.7 and 6.0 respectively. The household size of rural and urban areas in Pakistan is 6.5 and 7.4 respectively .
Population Distribution by Administrative Unit
The population of Pakistan is unevenly distributed among its administrative units. The Punjab province has the largest population share of 55.62 percent while Islamabad Capital Territory has the smallest population share, i.e. 0.61 percent. The population share of Sindh, NWFP and Balochistan is 22.99, 13.41 and 4.96 percent respectively (Table-13.5).
Table 13.5
Chapter 13. Population, Labour Force, and Employment
Area, Density and Household Size ByAdministrative Units, 1998.
Admn. Unit Area(Sq.Km.) Population(Percent)
PopulationDensity
HouseholdSize
PakistanNWFPFATAPUNJABSINDHBALOCHISTANISLAMABAD
7960964752127220
205345140914374190
906
10013.41
2.4055.6222.99
4.960.61
166238117358216
19889
6.88.09.36.96.06.76.2
Source: Ministry of Population Census Organization
Population Welfare Programme
Pakistan still has an unacceptably high rate of growth compared to other developing countries. The Government of Pakistan is therefore, attaching the highest priority to lower the population growth rate (PGR) from its current level (2.1%) to 1.8 percent per annum by the year 2004.The Population Policy is specifically designed to achieve social and economic revival by curbing rapid population growth and thereby reducing its adverse consequences for development. It is intended to achieve a reduction in dependency ratios, to alleviate pressures on dwindling resources and help in poverty reduction. The Population Policy has several wide-ranging consequences for the economy, human rights and the long-term prosperity of Pakistan. The young population, under 15 years of age, will be focused. The youth will be informed about the consequences of rapid growth of population. Concerted efforts would be made for behavioural change of the males and to put more responsibility on this segment of the society.
An important hallmark of an Interim Population Sector Perspective Plan, 2012 is the seriousness of government to ensure responsibility for family planning services delivery through all infrastructure outlets of the health departments and other provincial line departments. The Plan focuses its attention on leading a nation-wide effort to contain population growth through a comprehensive multi-sectoral program with the requisite political commitment and administrative priority. The overall vision of the Plan/ Population Policy is to address various dimensions of population issues in an informed, voluntary and coordinated manner by Government, NGOs, Private Sector and Civil Society. In nutshell, the Population Policy sets out a broad framework and provides futuristic vision to achieve the ultimate aim of reducing poverty and raising the quality of life of the common man and woman. As a follow up of International Conference on Population and Development (ICPD) decisions, a package of reproductive health has already been introduced to target population. A comprehensive reproductive health (including family planning) approach has been adopted. A holistic approach for
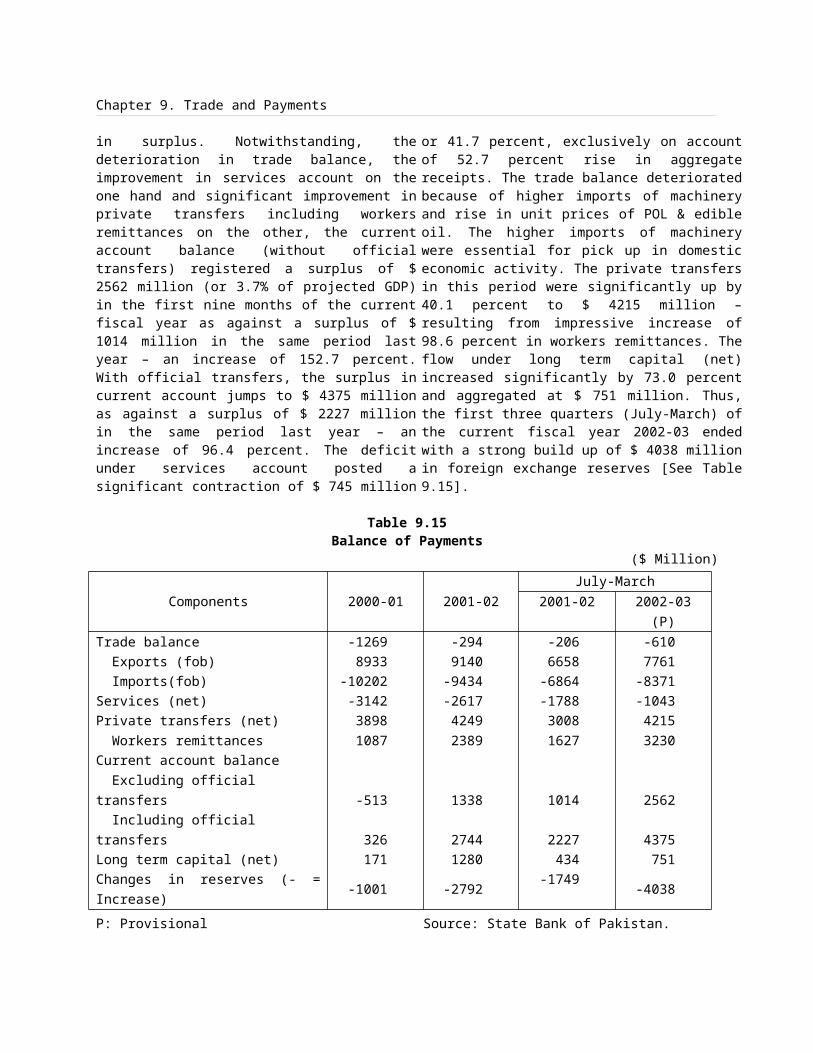
Chapter 13. Population, Labour Force, and Employment
population welfare program will be focused to ensure community participation.
Major Objectives of Population Welfare
Programme
The main objectives of the Population Welfare Program, envisaged in Interim Population Sector Perspective Plan (2012) are the following:-
i) Decrease the population growth rate to 1.82% in 2004 and 1.6% by the 2012.
ii) Achieve a replacement level of fertility (2.1) by the year 2020.
iii) Increase contraceptive prevalence rate (CPR) to 43% in 2004 and to 57% in 2012.
iv) Increase Program coverage to 76% in 2004 and 100% by the 2010.
v) Sustain increase in "age at marriage" of girls and ensure a reduction in population momentum through delay in marriage, fertility decline and changes in birth spacing patterns which should reduce proportion of under 15 population from 40% to 30%.
Major Activities Pursued During 2002-03
(a) Service Delivery Infrastructure:
The envisaged service delivery during 2002-03 comprises programme outlets and service units of Provincial Line Department (PLDs), target group institutions, private sector undertaking civil society initiative. The entire network consists of 1,911 family welfare centers (FWCs), 106 Reproductive Health Services
(RHS) 'A' Centres, 151 Mobile Service Units (MSUs), 500 outlets of Target Group Institutions (TGIs), 7584 outlets of Provincial Line Departments (PLDs) including those Provincial Health Departments. Through these service delivery outlets, population welfare program offers wide range of family planning services including motivation, counseling, full choice of contraceptives and contraceptives surgery. To augment the family planning component of National Project for Primary Health Care & Family Planning 11000 Village Based Family Planning Workers (Female) working under Ministry of Population Welfare have been transferred to Ministry of Health to form a unified cadre of Family Health Workers. The responsibility to involve males in family planning at the grass root level is being envisaged to be handled by male workers. With the existing work of about 1343 male workers, there is need to expand the male village based family planning workers to 7000 covering every union council.
(b) Social Marketing of Contraceptives.
Social marketing activities are complementing the efforts of Population Welfare Program in providing conventional and hormonal contraceptives at subsidized rates to the low and middle income groups of population in the urban and peri-urban areas of the country. The interim results are encouraging and continued donor support for the program is expected.
(c) Advocacy and Information Education and Communication.
According to various surveys, awareness about Family Planning is almost universal (around 97%)but the
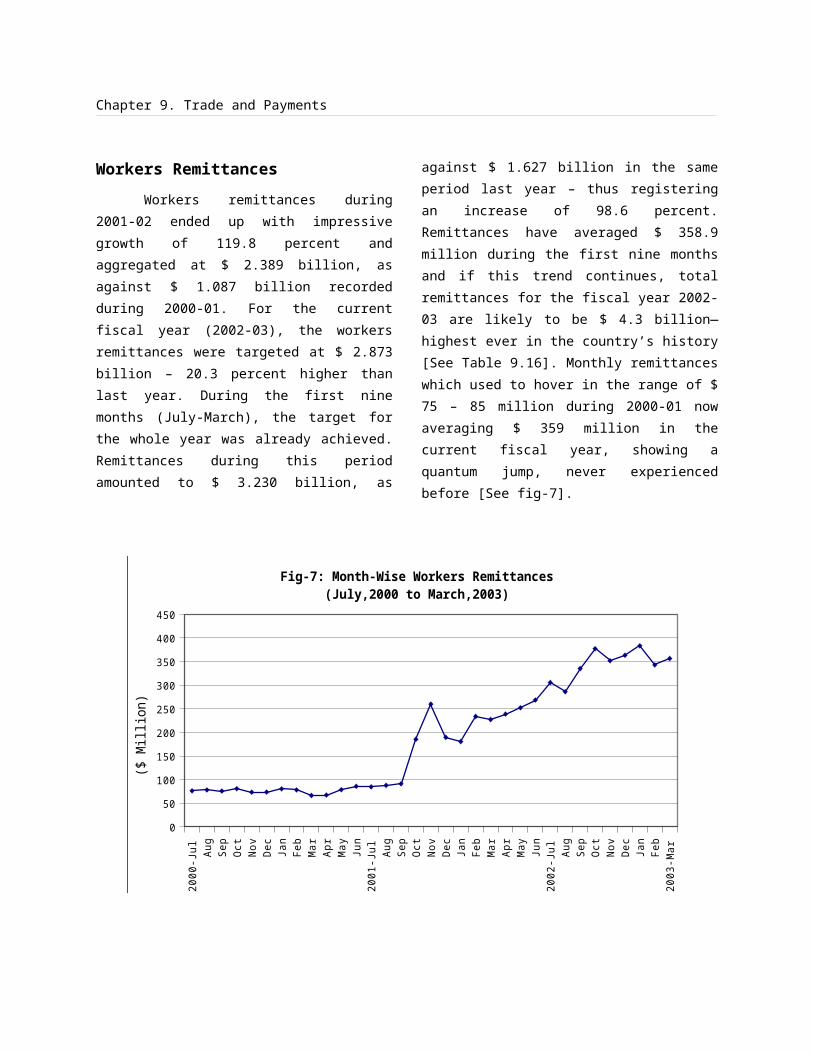
Chapter 13. Population, Labour Force, and Employment
contraceptives use rate is only 33%. There is still a wide gap between knowledge and practice and the unmet need for family planning is 33%. The challenge is to reach couples with unmet need and convert them into service users. Focus is on regional and local programs for presenting messages in local context. Messages and media are being developed for specific groups and potential new users.
(d) Capacity Building
Capacity building activities cover clinical and non-clinical training at various levels. These include 18 month basic training of 700 Family Welfare Workers/ Counsellors, 3-month training of 75 Field Officers, Short-term training of 700 Medical Personnel of Provincial Line Departments and Target Group Institutions and others, advance-on-the job training of around 1200 Paramedics of the programme and 265 paramedics of NGOs. In addition, 65 faculty members of Training Institutes will also be imparted training by June, 2003. Similarly Non-Clinical training activities are geared to update knowledge, understanding and skills of the programme personnel working in the field. At the same time, social mobilization is undertaken through orientation workshops, for elected representatives, functionaries of other departments and community based groups. A cadre of male mobilizers is being introduced at union councils level to enhance male involvement.
(e) Monitoring and Evaluation
Monitoring of the programme activities being a regular process is undertaken under management information system (MIS) through field monitoring and
by holding review sessions. This has further been intensified through surprise visits by Officers from the Ministry of Population Welfare and by team of provincial monitoring and evaluation cells to various categories of service delivery outlets.
The emphasis of the programme is to reach the desirous couples for meeting their service needs. In this context, a mapping exercise has been completed to systematically extend coverage, improve access in order to avoid duplication and fill the gaps. National standards for family planning have been formulated and disseminated to service providers to improve quality of care. Trainings/orientations have been accelerated to ensure application of the prescribed standard for improving quality of services.
(f) Research Programme
Research Programme is executed by National Institute of Population Studies (NIPS), based at Islamabad, is an autonomous body assigned the responsibility of undertaking interdisciplinary research, impact studies of the population welfare programme, dissemination of information, training special surveys and action oriented research focus is on population and development, reproductive health and family planning.
(g) Financial Utilization
The ADP allocation in respect of Population Welfare Program during 2002-2003 is Rs. 2200.0 million against which an expenditure of Rs.516.0 million has been
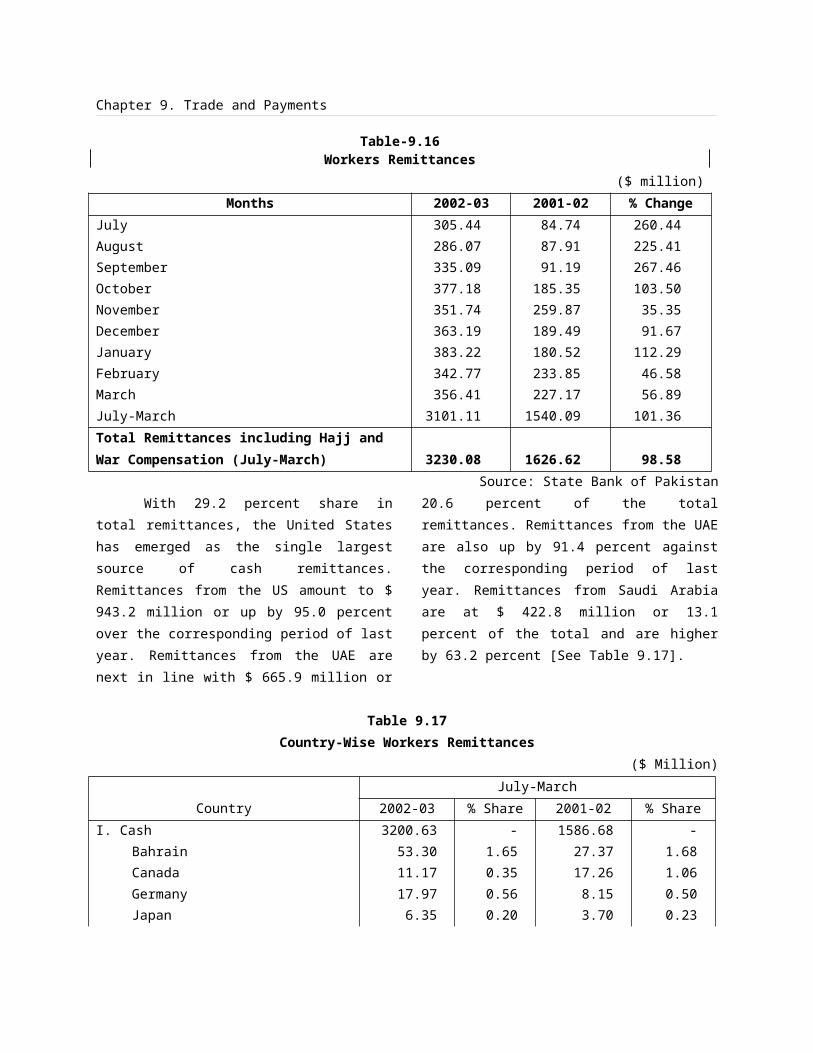
Chapter 13. Population, Labour Force, and Employment
incurred up to December 2002 and fund utilization shall gear up in the 3rd and 4th
quarter as per past trend.
LABOUR FORCE AND EMPLOYMENT
On the basis of estimated population of 149 million for mid-year 2003 and the
participation rate of 28.97 percent, the total labour force comes to 42.75 million. Of this 29.69 million or 69.45 percent is in the rural areas and 13.06 million or 30.55 percent in the urban areas. Distribution of labour force from 1995 to 2003 is given in Table-13.6.
Table13.6Rural-Urban Labour Force
Year Labour Force Rural UrbanMillion Annual
GrowthMillion % Share Million % Share
199519961997199819992000
2001(E)2002(E)2003(E)
33.6034.4336.8438.8839.8040.1341.0041.8442.75
-2.57.05.52.40.82.22.02.2
23.3723.8325.5627.3127.9527.8828.4829.0729.69
69.5569.2169.3870.2470.2369.4769.4669.5069.45
10.2310.6011.2811.5711.8512.2512.5212.7713.06
30.4530.7930.6229.7629.7730.5330.5430.5030.55
E:Estimated. Source: Labour Force Surveys of respective years.
Labour Force Participation Rate
In Pakistan, labour force participation is estimated on the basis of Crude Activity Rate (CAR) and Refined Activity Rate (RAR). The CAR is percentage of labour force in total population and the PAR is the percentage of labor force in population of persons 10 years of age and above. According to the Labour Force Survey, 1999-2000, the labour force participation rate (CAR) is almost 30 percent (29.8) percent in rural areas and 27.1 percent in urban areas). CAR was 27.5 percent in 1994-95. It increased to 28.7 percent in 1996-97 and to 29.4 percent in 1997-98 but has slightly declined to 29 percent in 1999-2000. Similarly RAR was 41.2 percent in 1994-95 and increased to 43 percent in 1996-97. It slightly increased to 43.3 percent in 1997-98 but has declined to 42.8 percent in 1999-2000.
Inter-comparison of rural and urban participation rates reveal that labour force participation rates are higher in rural areas as compared to urban areas because Pakistan's economy is mainly agrarian and that the agriculture is a family profession in rural areas. The female labuor force participation rate is far less as compared to male participation rate and as such their participation in economic activities is also low. The crude and refined labuor force participation rates by area and sex for 1994-95, 1996-97, 1997-98 and 1999-2000 are given in Table-13.7.
Table 13.7 Labour Force Participation Rates By Area and Sex (percent)
Year Crude Activity Rate(CAR) Refined Activity Rate(RAR)
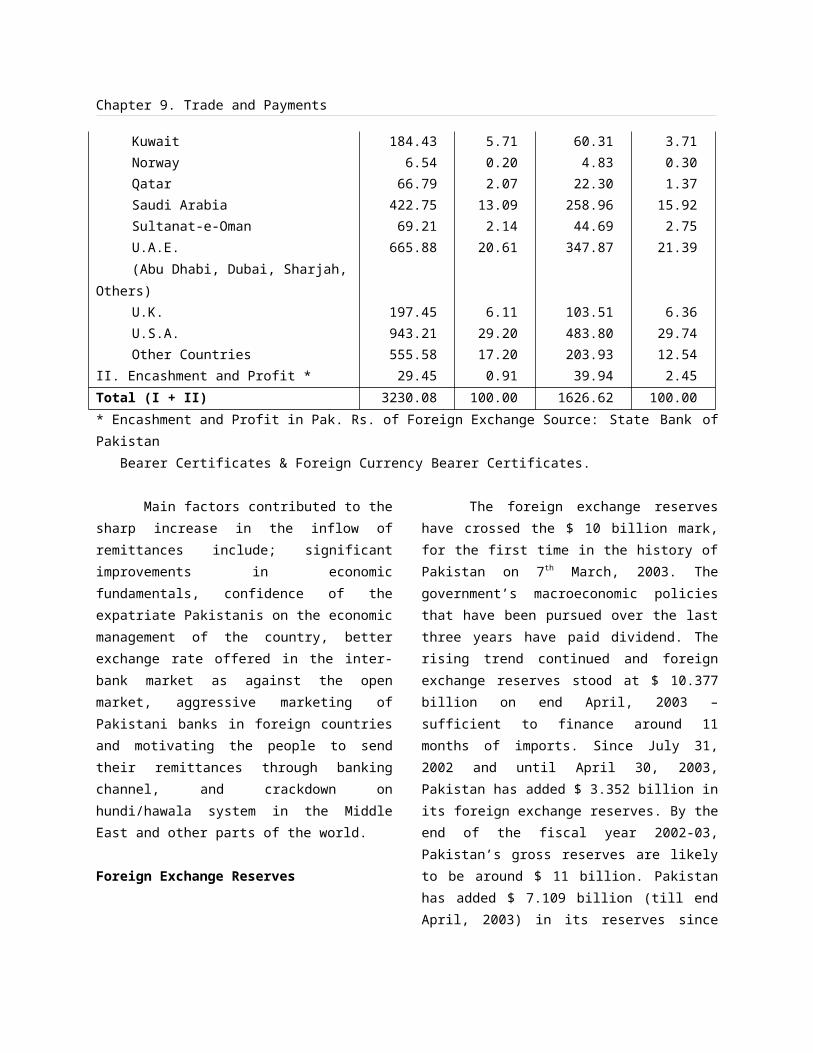
Chapter 13. Population, Labour Force, and Employment
Pakistan Rural Urban Pakistan Rural Urban1999-2000Both SexesMaleFemale1997-98Both SexesMaleFemale1996-97Both SexesMaleFemale1994-95Both SexesMaleFemale
29.047.6
9.3
29.448.0
9.4
28.747.0
9.0
27.545.9
7.6
29.848.210.7
30.648.411.5
29.447.210.5
28.046.0
8.7
27.146.5
6.3
27.047.1
5.3
27.146.5
5.9
26.145.7
4.9
42.870.413.7
43.370.513.9
43.070.013.6
41.269.111.4
54.173.116.1
46.473.417.4
45.171.816.3
43.171.313.2
38.165.0
8.8
37.765.2
7.4
38.966.5
8.4
37.064.3
7.0
Source: Labour Force Surveys of respective years.Employment Situation
Employed labour force is defined as all persons of ten years of age and more who worked at least one hour during the reference period and were either "paid employees" or "self employed". Based on this definition, the total number of employed labour force in 2003 is estimated at 39.41 million compared to 38.57 million in 2002. The total number of employed
persons in urban areas has increased from 11.52 million in 2002 to 11.78 million in 2003. Similarly rural employment increased from 27.05 million in 2002 to 27.63 million in 2003. Employment increased at a rate of 2.2 percent in 2003 compared to 2.1 percent in 2002.
Distribution of employed labour force by urban/rural areas from 1995 to 2003 is given in table-13.8.
Table 13.8Employed Labour Force by Area
Year Employed Labour Force
Annual Growth
(%)
Rural Urban
No.(M) % Share No.(M) % Share1995199619971998199920002001
31.8032.5834.5936.5937.4636.9937.79
-2.56.25.82.4-1.32.2
22.2522.6924.1225.9526.5625.9526.50
69.9769.6469.7370.9270.8870.1570.15
9.559.8910.4710.6410.9011.0411.29
30.0330.3630.2729.0829.1229.8529.85
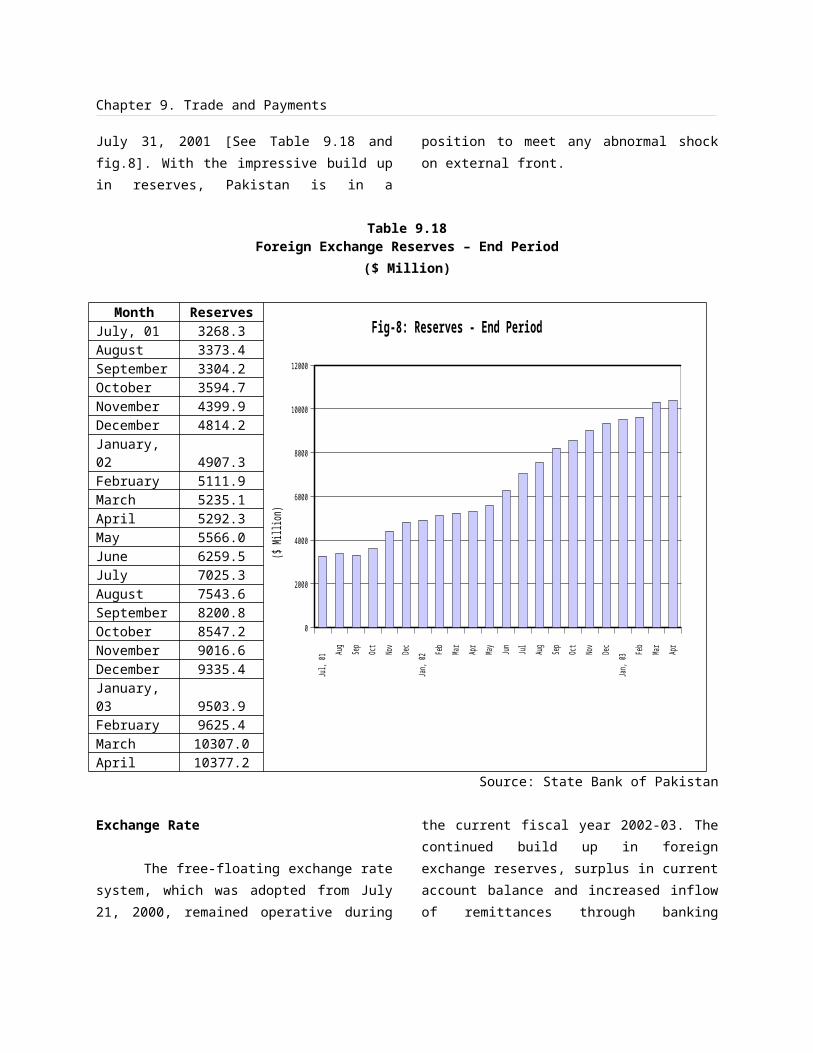
Chapter 13. Population, Labour Force, and Employment
20022003
38.5739.41
2.12.2
27.0527.63
70.1370.11
11.5211.78
29.8729.89
Source: Calculations of Employed Labor Force and its Rural Urban break-up is based on the Labour Force Surveys of the respective years.
Employed Labour Force by Sectors.
Agriculture Sector is the largest
employer and employs 19.08 million or
48.42 percent of total employed in 2003.
This sector employed 17.29 million persons
in 1998 and its relative share was 47.25
percent. Similarly the relative share of
manufacturing & Mining had increased from
10.15 percent in 1998 to 11.55 percent
2003. In contrast i.e. the share of
agriculture has increased by
1.17percentage point in the last 5 years.
The relative share of employed labour force
in the finance, insurance and social services
sector which was 16.23 in 1998 has
declined to 15.02 percent in 2003. The
share of trade sector has also decreased
from 13.87 percent in 1998 to 13.50
percent in 2003. However the share of
manufacturing sector has increased from
10.15 percent in 1998 to 11.55 percent in
2003. The construction sector, and
transport sector absorbed 6.26 percent and
5.48 percent, respectively in 1998.
Compared to it, their relative share in 2003
declined to 5.78 percent and 5.03 percent,
respectively.
Employed labour Force by sectors for
1998 and 2003 along with its sectoral share is
presented in Table-13.9.
Table 13.9Employed Labour Force By Sectors
(No. in million)Sector 1998 2003
No. % Share No. % ShareAgricultureManufacturing & MiningConstructionWholesale & Retail TradeTransportFinance, Insurance, Community & Social ServicesOthers
17.293.712.295.082.015.940.27
47.2510.15
6.2613.87
5.4816.23
0.76
19.084.552.285.321.985.920.28
48.4211.55
5.7813.50
5.0315.02
0.70
Total 36.59 100.00 39.41 100.00Source: Labor Force Survey 1999-2000.
Employment by occupation Looking at employment by major
occupational groups, agriculture sector's role is
again conspicuous. The data given in Table-13.10
for 1998 and 2003 reveals that major portion of
the employed persons consists of skilled
agricultural and fisheries workers. The share of
this occupational group was about 40 percent in
1998 and has slightly increased to 40.03 percent
in 2003. The next occupational group consists of
elementary unskilled occupations. Its share was
Chapter 13. Population, Labour Force, and Employment
20.13 percent in 1998 but has declined to 18.13
percent in 2003. The share of craft and related
trades workers group was 12.71 percent in 1998
but has increased to 15.05 percent in 2003. The
plant and machine operators group comprised
3.68 percent of employment in 1998 but its share
in total employed persons have gone down to
3.29 percent in 2003. The shares of service and
sales workers group, and professionals group
have gone down from 6.02 percent in 1998 to
4.58 percent in 2003 and from 3.03 percent in
1998 to 2.21 percent in 2003, respectively.
However, the share of legislators and managers
group has increased from 9.76 percent in 1998 to
11 percent in 2003. Similarly the share of
technicians group has also increased from 2.92
percent in 1998 to 4.17 percent in 2003.
Table 13.10Employed Persons by Major Occupational Groups
Major Occupational Groups 1998 2003 No. % Share No. % Share
Legislators, senior officers & managersProfessional,Technicians & associate professionalsClerksService workers and shop & market sales workers.Skilled agricultural and fishery workers.Craft and related trades workersPlant & machine operators & assemblers.Elementary (unskilled occupations)
3.571.111.070.672.20
14.604.651.357.37
9.763.032.921.846.02
39.9112.71
3.6820.13
4.330.871.650.611.80
15.785.931.297.15
11.002.214.171.554.58
40.0315.05
3.2818.13
Total: 36.59 100.00 39.41 100.00Source: Labour Force Surveys 1997-98 & 2003 on Labour Force Survey, 1999-2000
Unemployment
Unemployment is defined as all persons
ten years of age and above who during the period
under reference were (a) without work i.e. were
not in paid employment or self-employed, (b)
currently available for work i.e. were available
for paid employment or self-employment and (c)
seeking work i.e. had taken specific steps in a
specified period to seek paid employment or self-
employment. According to this definition, about
3.34 million persons in the labour force are
estimated as unemployed in 2003 compared to
3.27 million in 2002. Unemployed labour force
by urban/rural areas from 1995 to 2003 is given
in Table 13.11.
Table 13.11Unemployed Labour Force by Rural/Urban Area
Year Unemployed Labour Force Unemployment Rate(%)Total Rural Urban Total Rural Urban
199519961997199819992000
1.801.852.252.292.343.14
1.121.141.441.361.391.93
0.680.710.810.930.951.21
5.375.376.125.895.897.82
4.804.805.654.984.986.94
6.906.907.177.957.959.92
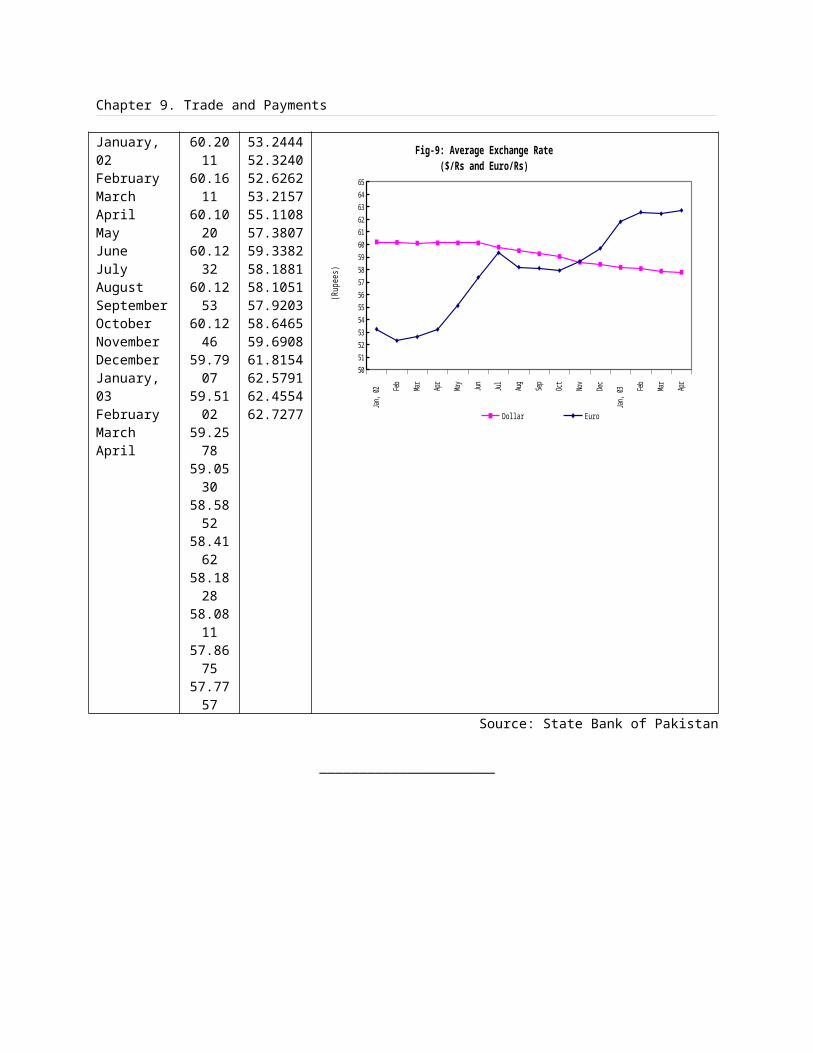
Chapter 13. Population, Labour Force, and Employment
200120022003
3.213.273.34
1.982.022.06
1.231.251.28
7.827.827.82
6.946.946.94
9.929.929.92
Source: Labour Force Surveys of the respective years.
The above table reveals that unemployment has increased from 5.89 percent in 1998 to 7.82 percent in 2003. Similarly unemployment in rural areas which was 4.98 percent in 1998 has risen to 6.94 percent in 2003 and urban unemployment has enhanced from 7.95 percent in 1999 to 9.92 percent in 2003.
EMPLOYMENT PROMOTION POLICES
The government has fully acknowledged prospective repercussions of growing unemployment in the country and has taken several steps to create job opportunities. Some of the important employment promotion measures are given below:
Realizing that a sound base of economic development and its faster growth has a direct bearing on the growth of employment, the Government has taken various steps for reviving the economy and accelerating the pace of economic growth. These include, Revitalization of Agriculture Sector, Development of Small and Medium Enterprises Sector, Oil and Gas, and Information Technology and Construction Sector. An allocation of Rs.134 billion has been made for the year 2002-03 in the Public Sector Development Programme which is higher by Rs.7 billion or 5.2 percent, compared to Rs127 billion in the previous year, 2001-2002. As a result of implementation of the annual development programme/schemes, a large number of job opportunities would be created in the country.
The SMEs are labour intensive and encompass a wide range of activities, size, structure, productivity and input use. The SME development is a critical target of the Government for generating jobs on a large scale. In order to promote SME sector, the Government has established a Small and Medium Enterprise Development Authority (SMEDA) in 1999 to meet the needs of SMEs and work for the growth of this sector. The focus of these initiatives is on four areas namely availability of credit reduction in the cost of doing business, up-gradation of technology and marketing of products in the international markets. It is hoped that this will have a positive impact on the job creation capacity of the SME sector.
SME Bank was established on 1st
January 2002 with a mission to support and develop SME Sector in Pakistan by providing financial assistance and business support. It also provides financial assistance to women for self-employment and also extends its cooperation in the areas of management, product innovation and development, quality control, acquisition of new technology and product positioning and marketing. As a result of its activities, around 2000 job opportunities were created in the SME Sector.
Self-employment is an important vehicle for arresting the rising trend in unemployment. Emphasis is being placed on income generation activities for promotion of self-employment at the grass root level. Khushhali Bank has been
Chapter 13. Population, Labour Force, and Employment
established to provide loans up to Rs.30,000/- to poor people to set up their own business. The operation of the Bank would be spread in every district and loans given by it will generate employment for the unemployed. By the end of December, 2002, the Bank had its branches in 26 districts and had disbursed loans amounting to Rs.883.77 million in 52,766 cases. As a result 316,596 persons had benefited.
Khushhall Pakistan Programme is the Government's principal social intervention aimed at generating employment through undertaking public works in the country. The programme includes (a) building farm to market roads, (b)undertaking water supply schemes (c) lining of water channels and de-silting of canals (d) provision and renovation of civic amenities in rural and urban areas and village electrification etc. The schemes under the programme are identified and selected at the district level through active community participation. During the period 2000-02, temporary jobs were provided to about 6,70,000 individuals.
Technical/vocational training enhances employability of the work force. At present training capacity of 68024 trainee places for men and 54638 places for women are available in the country. Based on the changing trends in the labour market domestically and internationally and the demand for industry-wise and sector-wise skilled labour, the existing technical training curricula are being revised. Under the new training policy, women are being encouraged to participate in the training programme of the country to bring them in the mainstream through the formal and informal apprenticeship training. Further initiatives are being undertaken to involve
the private sector more actively in expanding technical/vocational training in line with labour market needs.
During the current financial year 2002-03 (up to February, 2003), as many as 1,26,418 persons have proceeded abroad for employment through the Bureau of Emigration & Overseas Employment and Overseas Employment Corporation. Compared to the financial year 2001-02, the persons who went abroad for employment were 1,16,067. Keeping in view the increasing trend in manpower export, the target for the year 2003-04 has been fixed at 1,50,000 workers, provided there is no big setback in the geo-political situation in the region. During the fiscal years 2003-04, the Bureau of Emigration & Overseas Employment plans to open two new offices of Protectorates of Emigrants in Multan and Malakand Divisions to facilitate intending emigrants of these less developed areas in seeking employment abroad.
The Overseas Employment Corporation (OEC) will explore new opportunities and avenues for employment of Pakistani manpower in South Korea for employment of general workers, USA for employment of nurses and Europe for employment of doctors and nurses. OEC has appointed a consultancy firm for promotion of manpower export in the public sector. It is expected that with the implementation of the consultants report the export of manpower from OEC would increase to between 4000-6000 workers in the years ahead. With a view to facilitate Pakistanis in seeking employment abroad in professional/highly skilled areas, the Overseas Employment Corporation has established a data bank for the interested emigrants and has launched the "CV-on-
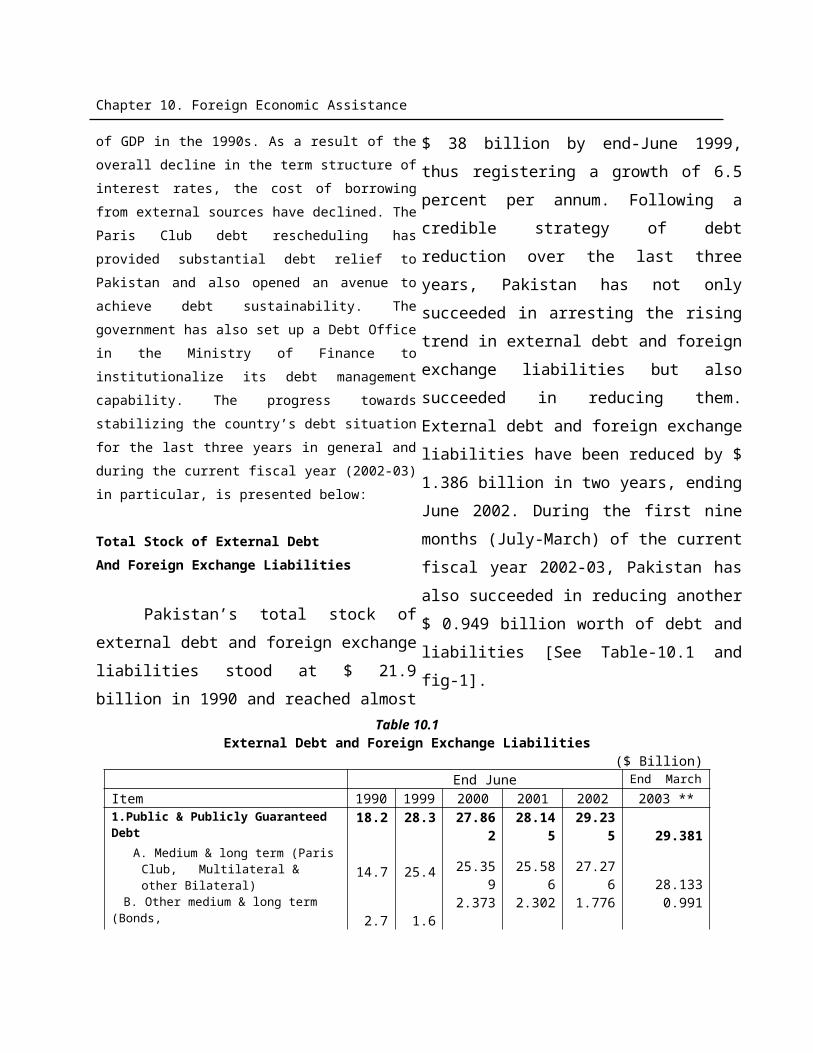
Chapter 13. Population, Labour Force, and Employment
Line Scheme for Overseas Employment Promotion".
Information Technology (IT) has been included as one of the four priority sectors selected for unleashing the growth process in the country. An IT policy has been announced under which four areas have been identified which include human resource development, telecommunication, legal framework for IT Sector and marketing support for IT sector. The Ministry of Science and Technology has prepared a programme to meet high level manpower needs in science and technology. In this connection, vocational training programme to produce over100,000 professionals in Information Technology has been launched.
With a view to lessening the suffering of poorest segments of the population, Pakistan Poverty Alleviation Fund (PPAF) was set-up in April, 2000. Up to 31st December,2002, the PPAF has made disbursement of Rs.2590 million to 739,416 beneficiaries in 75 districts through
34 partner organizations in the country. Disbursement has been made towards credit and enterprise development, community physical infrastructure and human/institutional development. So far 2735 such projects have been initiated which were community identified, locally managed and locally run. Implementation of these programmes and projects helped in reducing poverty and creating job opportunities in the country.
___________________
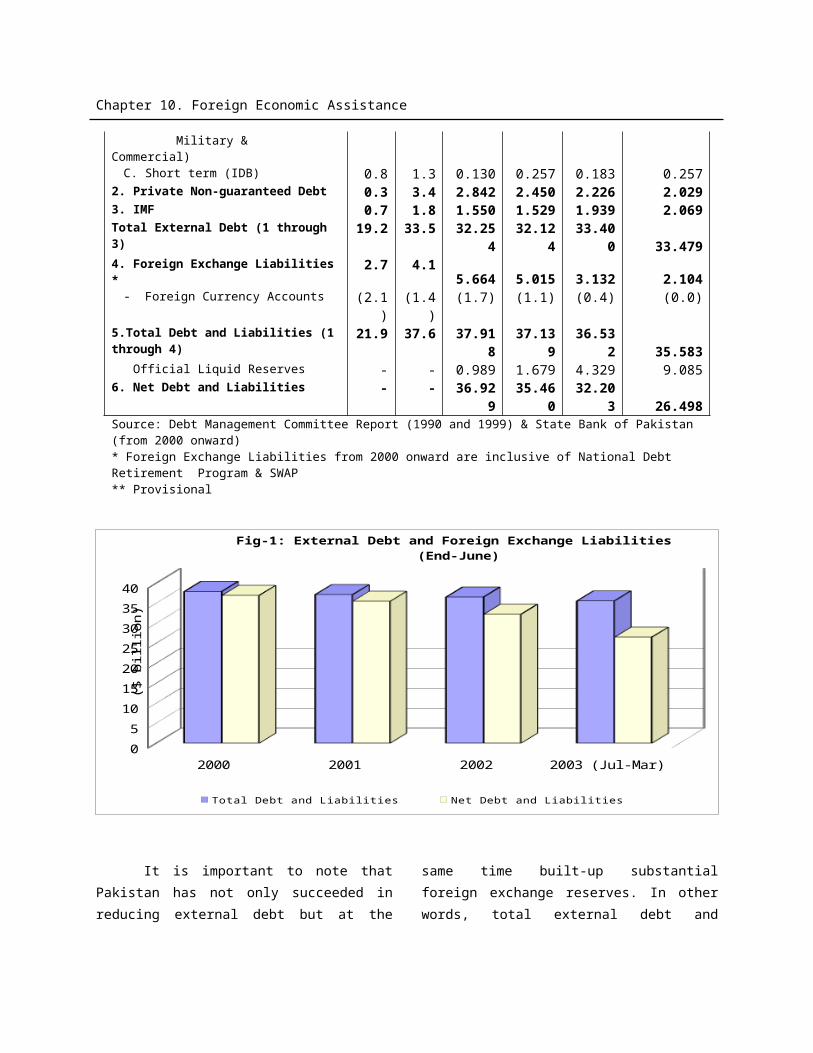
Chapter 14. Transport and Communications
14. Transport and CommunicationsTransport and communications and
the services that flow from it are prerequisite to attaining economic growth and improving country’s productive capacity. An efficient transport and communications network contributes to productivity improvement and reduction in production costs, whereas inefficient network hinders economic growth and social development. It has been widely recognized that economies with better road and communications network are positioned more advantageously in terms of overall competitiveness, compared to economies having poor network. Because performance indicators vary significantly by transport mode, roads, highways, railways, airlines, ports and shipping have been identified for analysis. A. ROAD NETWORK
A marked and nearly universal trend has developed towards road transport for at least three reasons. Firstly, the economy and reliability of road transport has increased very rapidly inrecent years as better roads and improved vehicles performance have revolutionized overland transport. Secondly, on many routes with high traffic, this is the only feasible method of mechanized transport. Finally, as the pace of economic development quickens, the importance of transport costs declines, and there is greater concern for improved services.
Pakistan has a road network covering 251,845 kilometers including 151,028 high types and 100,817 low types of roads. The total roads which were 170,823 KM in 1990-91, increased to 251,661 in 2001-02 and further to 251,845 KM in 2002-03 or by 47.4 percent. During the out going fiscal year, the length of high typed roads have increased by 1.5 percent over the last year but the length of low type roads has declined by 1.9 percent. In other words, the low type roads have been converted into high type roads. This has been made possible under the Khushal Pakistan Program. The annual growth of roads in Pakistan since 1990-91 to 2002-03 is given in Table 14.1 and Fig-1.
Table 14.1Length of Roads
(Kilometers)Fiscal Year
High Type Low Type TotalLength %Change Length %Change Length % Change
1990-91 86,839 - 83,984 - 170,823
-
1991-92 95,374 9.8 87,335 4.0 182,709
7.0
1992-93 99,083 3.9 90,238 3.3 189,321
3.6
1993-94 104,001
5.0 92,816 2.9 196,817
4.0
1994-95 111,30 7.0 96,338 3.8 207,64 5.5
Chapter 14. Transport and Communications
7 51995-96 118,42
86.4 99,917 3.7 218,34
55.2
1996-97 126,117
6.5 103,478
3.6 229,595
5.2
1997-98 133,462
5.8 107,423
3.8 240,885
4.9
1998-99 137,352
2.9 110,132
2.5 247,484
2.7
1999-00 138,200
0.6 110,140
0 248,340
0.3
2000-012001-02*2002-03*
144,652
148,877
151,028
4.72.91.5
105,320
102,784
100,817
-4.4-2.4-1.9
249,972
251,661
251,845
0.70.70.1
* Estimated Source: Ministry of Communications
National Highway Authority (NHA)
The NHA is Pakistan’s premier road management and regulatory agency. It is thecustodian of 17 National Highways, Motorways and Strategic Roads. Road transport is the dominant mode of transport for the people and for the goods in Pakistan. The large segment of the society prefer to take journey through road networks. The National Highways Network consisting of 8,845 Km is 3.5 percent of the total road length in Pakistan. The government has decided to increase the present National Average Road Density from 0.23 km/sq. km areas to 0.3 km/sq. km areas.
90-9
1
91-9
2
92-9
3
93-9
4
94-9
5
95-9
6
96-9
7
97-9
8
98-9
9
99-0
0
00-0
1
2001
-02
2002
-0350
000
7000
0
9000
0
1100
00
1300
00
1500
00
1700
00
Fig-1: Length of Roads
Hight Type Road Low Type Road
Kilo
met
ers
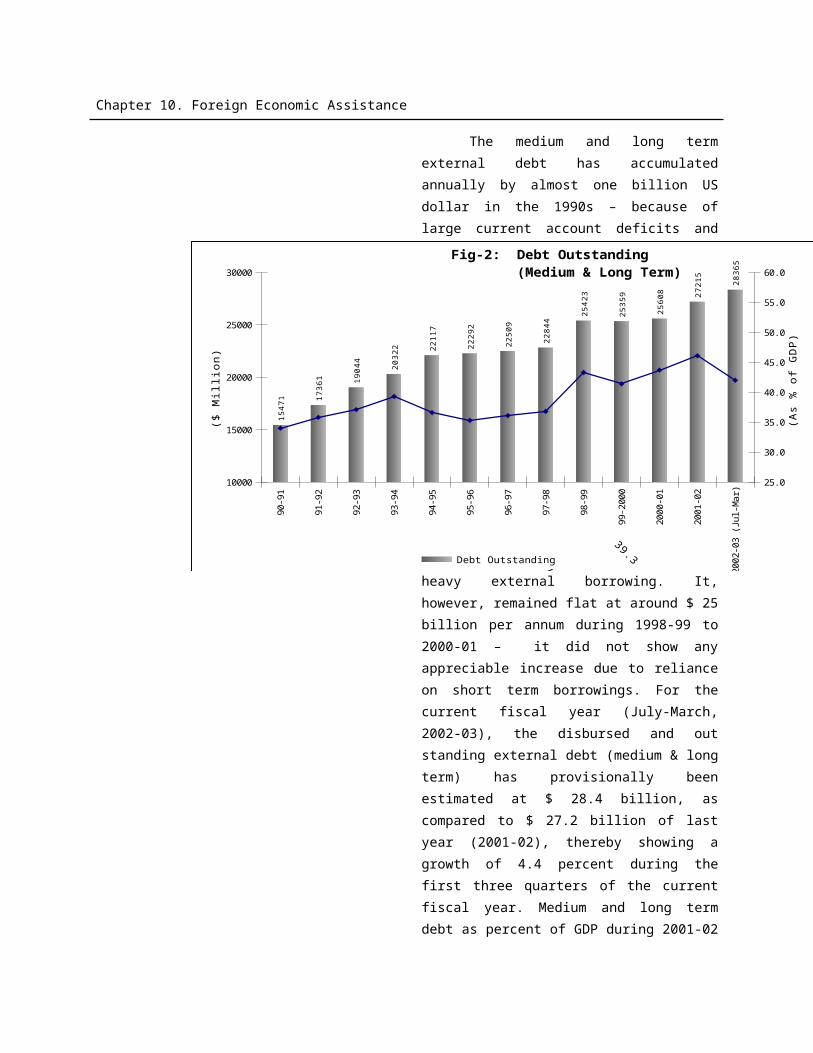
Chapter 14. Transport and Communications
The present status of the main road
projects is given in the Box-1
N-40 Lakpass-Dalbandin-Nokundi-Taftan (610 Km)The improvements work on Dalbadin-Nokundi (200 Km) section have been completed
N-45 Nowshera-Dir-Chitral Highway (309 Km)Improvements have been planned and rehabilitation will be taken up soon.
N-50 Quetta (Kuchlac)-Muslim Bagh-Zhob-D.I.Khan Highway (528 Km)About 67 percent civil work of D.I.Khan Mughal Kot section has been completed. Expected completion date is March 2004.
N-55 Indus Highway (1265 Km).Work on up gradation of Phase-I & II from Kotri-Manjhad (58 Km), Manjhad Sehwan (70 Km), Karappa Chowk-Badabher (51 Km), Ratodero-Ghauspur (98 Km), Ghauspur-Shorinullah (76 Km), Shorinullah-Rajanpur (96 Km), D.G.Khan-Retra Jn. (113 Km), Retra Jn.- Malana Jn. (85 Km), Serai Gambila-Karak (60 Km) and Karak-Karapa Chowk (36 Km) have been completed.
Box-1Road Projects
A) National Highway ProjectsN-5 Karachi-Lahore-Peshawar-Torkhum Highway
The whole N-5 has been dualized except Hala-Moro (114 Km) and Rahim Yar Khan - Trinda Muhammad Pinnah (80 Km). Hala-Moro section has almost been completed whereas progress on Rahim Yar Khan-Trinda Muhammad Pinnah section is 85 percent.
N-10 Makran Coastal Road (653 Km).The project is 653 km in length is to be completed within a period of 3 years instead of 6 years originally planned. The period of construction is reduced to synchronized with deep-sea port.
N-15 Kaghan Valley Road (175 Km)The construction work on 175-Km is in progress and near to completion.
N-25 Karachi-Khuzdar-Quetta-Chaman Highway (816 Km).The highway is being widened and improved to international standards. Wad-Khuzdar-Sorab (160 Km), Uthal-Bela (69 Km), Sorab-Kalat (74 Km) sections have been completed.
N-35 Hassanabdal-Gilgit-Khunjrab (803 Km)The Work on Thakot-Chillas-Khunjrab has been completed.
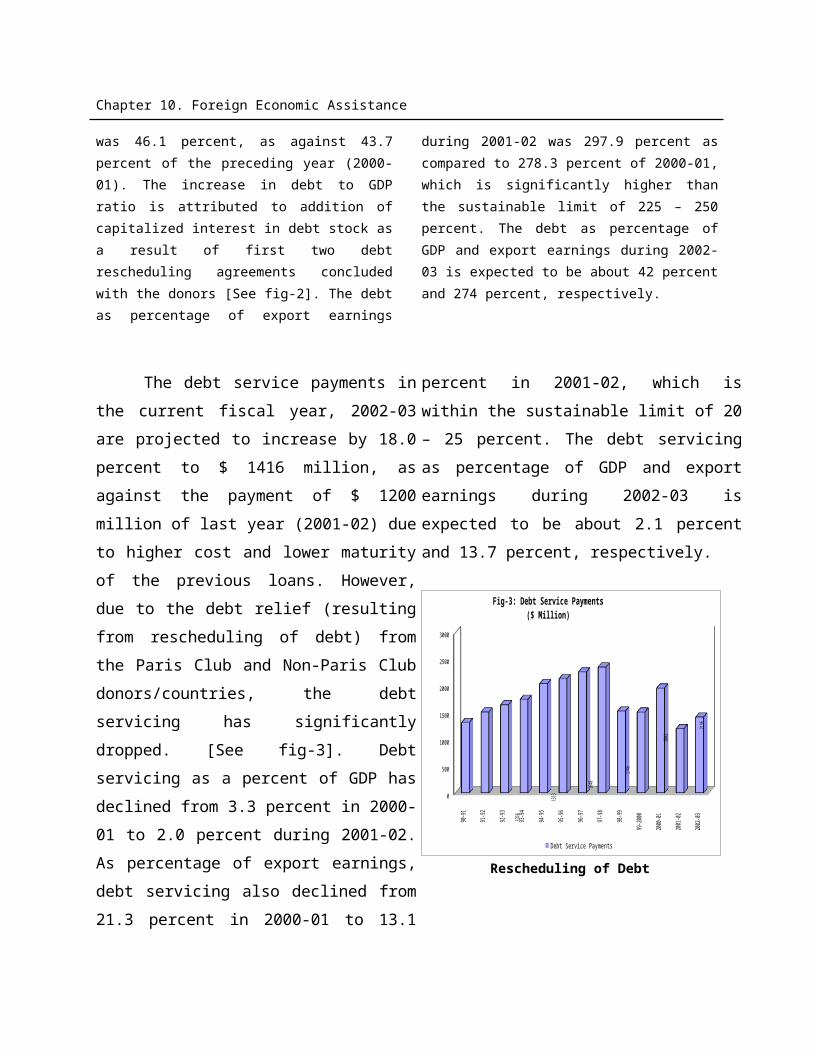
Chapter 14. Transport and Communications
Construction work on 30 Km Kohat Tunnel Project (1.88 Km tunnel and 28 Km access roads) is in advance stage of completion and 92 percent progress is achieved. The project is expected to be completed by July 2003.
N-65 Sukkur-Sibi-Quetta Highway (385 Km)The civil work is in progress. The construction/replacement of existing steel bridges of N-65 have been completed
N-75 Islamabad-Muzaffarabad Road (90 Km)Additional Carriageway from Barakahu to Satra Mile (5 Km) completed Work on Satra Mile to Lower Topa dual carriageway (43 Km) is in progress, 42 percent work completed. Expected completion date is December 2003.
B) Motorway ProjectsM-I Islamabad-Peshawar Motorway (154 Km)Civil work about 27 percent has been completed.M-2 Lahore-Islamabad Motorway (367 Km)M-2 is operational since 1997. M-3 Pindi Bhattian-Faisalabad Motorway (52 Km)The construction work on Pindi Bhattian-Faisalabad Motorway (M-3) is in full swing. The project more than half is completed. Expected completion date is July 2003.
C. Miscellaneous ProjectsKarachi Northern Bypass (56.8 Km)The project includes widening & improvement of 18-Km existing road, construction of 38.8 Km new 2-lane bypass road, construction of three flyovers, construction of 90m bridge over Lyari River and construction of two interchanges. Project will be completed by April 2004.Layri Express way (16.5 Km)The project includes construction of 2-lane 16.5 Km long carriageway. 8+8 flyovers and four interchanges. Construction work is in full swing. The project will be completed by October 2004.Bund Road LahoreThe project is substantially complete. The project is being financed by NHA from its own resources through toll revenue.Kohat Tunnal Link RoadThe project includes construction of 2-lane 7.5 Km link road between Kohat Tunnel Road & Kohat Dara Adam Khail Road. Work has been started. Ghazi Ghat BridgeRehabilitation work on Ghazi Ghat Bridge has been completed Sukkar Bypass including 1.6 Km long bridge on River Indus (11.5 Km)Completed Chiniot Bridge ProjectCompleted. Tall-Parachinar (75 Km) Completed. Khuzdar to KhoriCompleted.
Chapter 14. Transport and Communications
Ratodero-Shahdadkot-Quba Saeed KhanCompleted. Abbottabad-Nathiagali-Barian-Murree RoadCompleted. Rawalpindi Urban Area ProjectThe Work completed on Qasim Market- Golra More, Golra More- M-2 interchange and Pir Wadhai Round about.Installation of Tool PlazaA fee-for-use culture in the country has been introduced. Toll Plazas at 47 points all over the country have been established.
B. PAKISTAN RAILWAYS
The network of Pakistan Railways
comprises 7,791 route kilometers, 577
locomotives, 1,901 passenger coaches and
23,939 freight wagons up to end of March
2003. The Pakistan railways have
introduced non stop express trains in
different routes including comfortable
passenger coaches. The Karakoram
Express, Karachi Express and Shalimar
Express Rails are operating between
Lahore-Karachi sections as non stop trains,
while another new train namely Jaffar-Jamali
(Rawalpindi-Quetta) Express has also been
started. In addition to structural and
management changes introduced by the
Government, an investment of Rs. 44 billion
for five years (2000-05) was approved for
Railway Sector. However this was included
in an over-all plan for 10 years for which Rs.
109.00 billion was visualized. The
Perspective Plan includes rehabilitation of
infrastructure, rolling stock, communication
system as well as modernization of three
main constituents of Railways Operation viz
infrastructure, rolling stock and
communication, through transfer of
technology from China. It is also planned to
increase the speed of passenger & freight
trains, once infrastructure over the system
is improved.
An amount of Rs.6,922 million has
been provided for development programme
for the year 2002-03. The major activities
include: rail renewal of 128 Kms and
sleeper renewal of 217 Kms, procurement
of 15 locomotives, procurement of 40
passenger coaches, rehabilitation of 22
locomotives, procurement of material for
fitment of roller bearings to 1,340 freight
wagons, rehabilitation of 38 passenger
coaches under the scheme of rehabilitation
of 240 passenger coaches (scheme
completed) and rehabilitation of 100
passenger coaches under another project of
rehabilitation of 450 passenger coaches,
rehabilitation of 40 bridges on main and
branch lines and doubling of 16 Kms of
track from Lodhran- Khanewal via Multan.
The performance of Pakistan Railways can
be seen from Table- 14.2
Table 14.2Performance of Pakistan Railways
Fiscal Year Route Kilometers
Number of passengers
carried (Million)
Freight carried (Million tones)
Freight Tones Km(Million)
Locomotives (No.)
Freight wagons
(No)
Chapter 14. Transport and Communications
1990-91 8,775 84.9 7.7 5,709 753 34,8511991-92 8,775 73.3 7.6 5,962 752 30,3691992-93 8,775 59.0 7.8 6,180 703 29,4511993-94 8,775 61.7 8.0 5,938 676 29,2281994-95 8,775 67.7 8.1 6,711 678 30,1171995-96 8,775 73.6 6.8 5,077 622 26,7551996-97 8,775 68.8 6.4 4,607 633 25,2131997-98 8,775 64.9 6.0 4,447 611 24,2751998-99 7,791 64.9 5.4 4,330 596 24,4561999-002000-01
7,7917,791
68.068.8
4.85.9
3,6124,520
597610
23,90623,893
2001-02July-March
7,971 69.0 5.9 4,688 577 23,893
2001-02 7,791 49.2 4.0 3,341 610 22,1922002-03* 7,791 52.0 4.4 3,397 577 23,939
*Provisional Source: Ministry of Railways
The Pakistan Railways have
improved its services both for passengers
and luggage handling. A sign of
improvement is visible from the continuous
increase in the earnings which have
increased by 43.3 percent during 1998-99
and 2001-02. During July- March 2002-03,
the gross earnings increased by 12.7
percent over the same period last year. The
details of earnings are given in Table- 14.3
and Fig-2.
Table-14. 3Earnings of Pakistan Railways.
(Rs. Million)Year Earning
s%
change
1998-99 9,310 -
1999-00 9,889 6.2
2000-01 11,938 20.1
2001-02 13,340 11.7
July-March
2001-02
2002-03
9,572
10,783
-
12.7
Source: Ministry of Railways.
1998-99
1999-2000
2000-01
2001-02
2002-03 (Jul-Mar)
0
2
4
6
8
10
12
14
16
Fig-2: Earning of Pakistan Railway
Rs. B
illion
Chapter 14. Transport and Communications
During the last 12 years (1990-
2002), the share of Railways, both in
respect of passenger traffic and freight
traffic has declined from 13.5 percent
to 9 percent and from 14 percent to
4.1 percent, respectively. However, the
Pakistan Railways has registered an
impressive recovery in 2000-01 when
its freight traffic has grown by 25
percent, as against an average decline
of 4.8 percent per annum in the 1990s.
A positive growth of 3.7 percent has
also been maintained in 2001-02.
Furthermore, as against an average
decline in passenger traffic by 0.7
percent per annum during the 1990s,
the passenger traffic of Pakistan
Railways has increased by 5.9 percent
in 2000-01 and further by 6.3 percent
in 2001-02. A positive trend has also
been recorded during July-March 2002-
03 in both the passenger traffic and
freight traffic by registering an
increase of 1.4 percent and 1.7
percent, respectively over the same
period of last year. Maintaining a
positive growth for three successive
years can be attributed to the wide
range of improvements made by the
Pakistan Railways in the quality of
services, timeliness, and cleaniless.
This trend is reported in Table 14.4 and
Fig-3 & Fig-4.
Table 14.4
Trend of Passengers Traffic and Freight Traffic(Road vs Rail)
Fiscal Year
Passenger Traffic(Million passenger Km)
Freight(Million Ton KM)
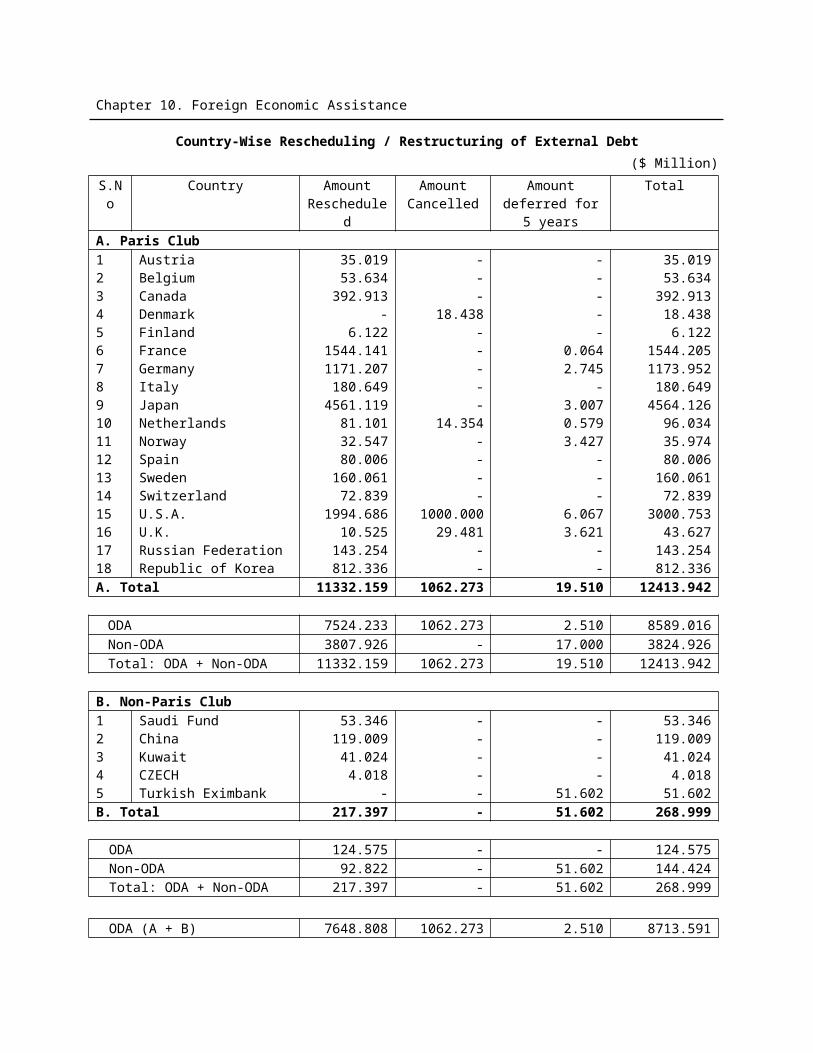
Chapter 14. Transport and Communications
Road %Change
Rail %Change
Road % Change
Rail %Change
1990-911991-921992-931993-941994-951995-961996-971997-981998-991999-002000-012001-02(Jul-Mar)2001-02*2002-03*
128,000131,352135,000137,037146,132154,566163,751173,857185,236196,692208,370209,381
157,037161,919
-2.62.81.56.65.85.96.26.56.25.90.5
-3.1
19,96418,15817,08216,38517,54518,90519,11418,77418,98018,49519,59020,820
14,86715,071
--9.0-5.9-4.17.17.81.1-1.81.1-2.65.9
6.3
-1.4
35,21141,53653,71971,59675,77079,90084,34589,52795,246101,26
1107,08
5108,81
8
81,61381,843
-18.029.333.35.85.55.66.16.46.35.7
0.2
-0.3
5,709
5,962
6,180
5,938
5,661
5,077
4,607
4,447
3,967
3,612
4,520
4,688
3,341
3,397
-4.43.7-3.9-4.7
-10.3-9.3-3.5
-10.8-8.925.03.7
-1.7
*Provisional Source: Ministry of Railways & Ministry of Communications
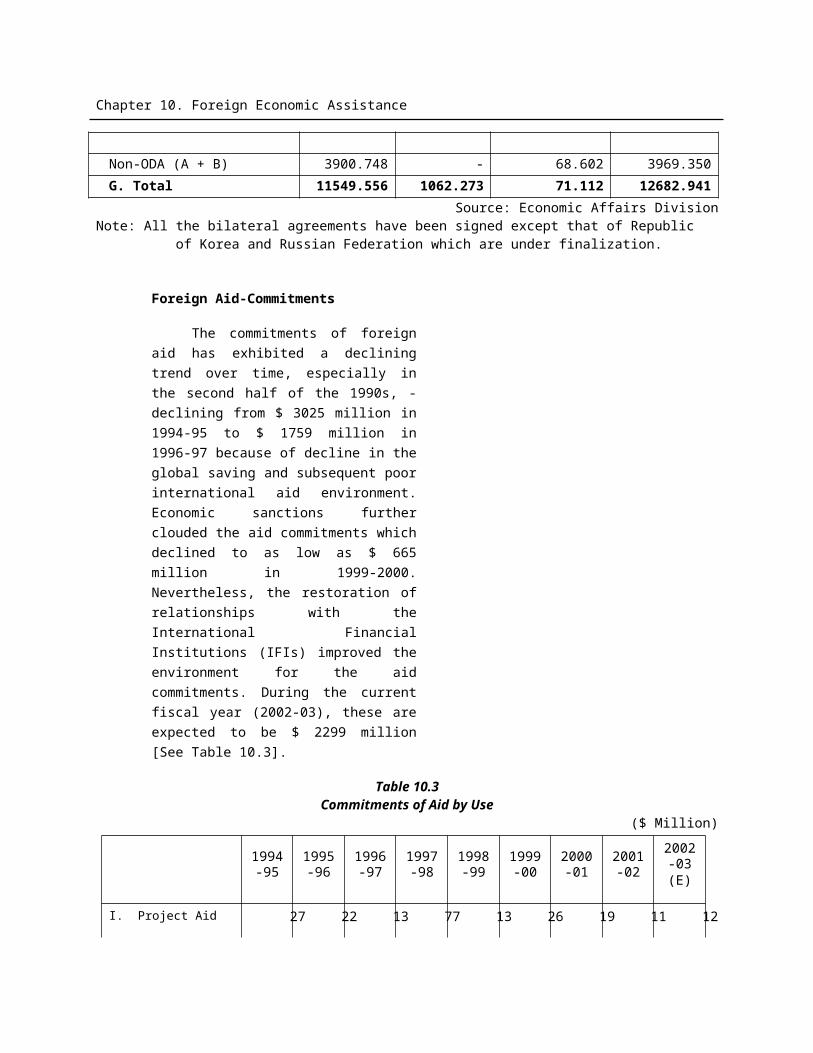
Chapter 14. Transport and Communications
19
90
-91
91
-92
92
-93
93
-94
94
-95
95
-96
96
-97
97
-98
98
-99
99
-00
00
-01
20
01
-02
01
-02
(Ju
l-M
ar)
02
-03
(Ju
ly-M
ar)
0
50
100
150
200
250
0
5
10
15
20
25
30
35
40
Fig-3: Trend of Passenger Traffic
Road
Rail
(Bil
lio
n P
as
se
ng
er
Km
)
19
90
-91
91
-92
92
-93
93
-94
94
-95
95
-96
96
-97
97
-98
98
-99
99
-00
00
-01
20
01
-02
01
-02
(Ju
l-M
ar)
20
02
-03
(J
uly
-Ma
r)_0
20
40
60
80
100
120
0
1
2
3
4
5
6
7
8
9
10
Fig-4: Trend of Freight
Road
Rail
(Bill
ion
To
n K
m)
C. CIVIL AVIATION AUTHORITY (CAA)
In spite of the adverse effects of September 11, 2001 events on the global and national air traffic and the attendant decline in revenues, the CAA has continued to undertake developmental work and also completed a number of projects. The construction of a New Terminal Complex, Lahore has been completed at the cost of Rs. 10.3 billion. This terminal can handle
6.5 million passengers per annum. Rahim Yar Khan and Bahawalpur airports have been upgraded for operation of B-747 and B-737 aircrafts, respectively. The up-gradation of Gwadar and Turbat airports is in progress. Construction of New Islamabad International Airport on Build, Operate and Transfer (BOT) basis is being processed. The construction of Sialkot International Airport in the private sector is also in progress. A new Automatic Flight Inspection
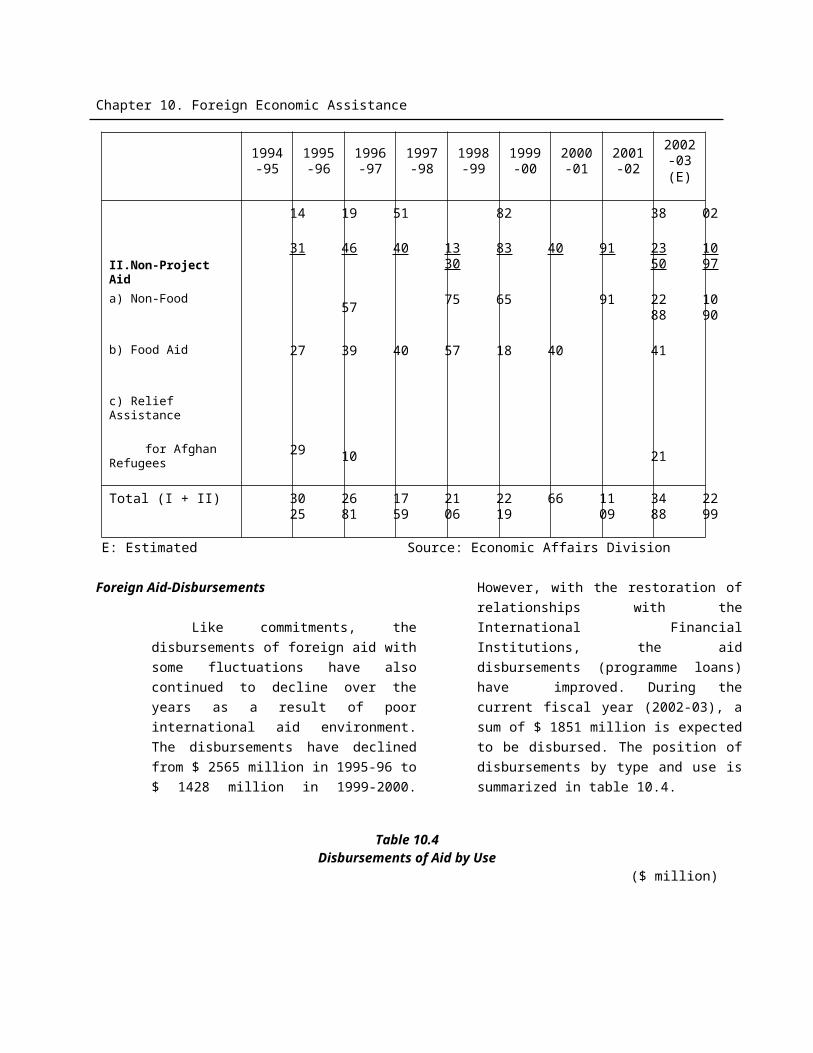
Chapter 14. Transport and Communications
System is in the final stage of completion. According to the CAA, the number of aircrafts movements and passenger traffic from all the country’s airports were 0.091 and 5.2 million, respectively.
Pakistan International Airline (PIA)
During the first nine months (July- March 2002-03) of the current fiscal year, the PIA’s network covered 23 domestic and 28 international stations. The capacity of both the passenger and traffic has increased by 1.8 percent and 1.5 percent, respectively as compared to the same period of last year. The airline has earned Rs. 8,764 million per kilometers (RPKs), against Rs. 8,633 million/ RPKs in the corresponding period of last year. Domestic traffic in terms of RPKs has increased by 3.2 percent over last year. Overall traffic is up by 1.5 percent. A total of 3.387 million passengers have been carried as compared to 3.385 million passengers in the preceding year. During July- March 2002-03, freight traffic has improved by 6.5 percent over the same period of last year. Freight load factor is up by 59.0 percent, as compared to 57.1 percent in the previous year. The improvement is significantly evidenced on the domestic routes where freight traffic has increased by 17 percent over the same period of last year. Closure of Indian airspace since January 1, 2002 has resulted in suspension of PIA flights to Delhi, Mumbai, Khatmandu, Dhaka and Colombo. While flights to Bangkok, Hong Kong, Singapore, Manila and Tokyo have also become highly uneconomical. The PIA’s aircraft fleet as on 31st March, 2003
consisted of 4 Boeing 747-200s, 6 Boeing 747-300s, 8 Airbus A300B4s. 6 Airbus A 310s, 7 Boeing 737-300s, 11 Fokker F-27s and 1 Twin Otter.
During the first three quarters of the current financial year, the airline has exercised its purchase option on five Boeing 747—300 aircrafts already on lease from Cathay Pacific Airways. A sixth Boeing 747—300 aircraft from Cathay Pacific Airways was also inducted in 2002. Syndicated Murabaha financing of US was arranged $ 70 million through Pakistani Bankers Consortium for the purchase of six Boeing 747—300 aircraft. The airline is pursing a long term fleet modernization plan which envisages induction of eight Boeing 777 family aircraft over the next 5 years. PIA continues to focus on technological innovation to improve its operation and customer service, particularly the Ticketing & Reservation System in order to restrict the possible misuse/malpractices by the agents.
The financial result for the year 2002 (January-December) presents a significant turn around in the airlines fortune. There is a pre-tax profit of Rs. 2,111 million, as against a loss of Rs. 1,882 million in the 2001. This improvement has been achieved as a result of various measures initiated after June-2001, despite the fact that the global economy in general and the Airline industry in particular, has been passing through a turmoil period. The financial performance of the PIA is reported in Table 14.5 and Fig-5.
Table 14.5
Financial Performance of PIA
( Rs. Million)
Year 2002 2001
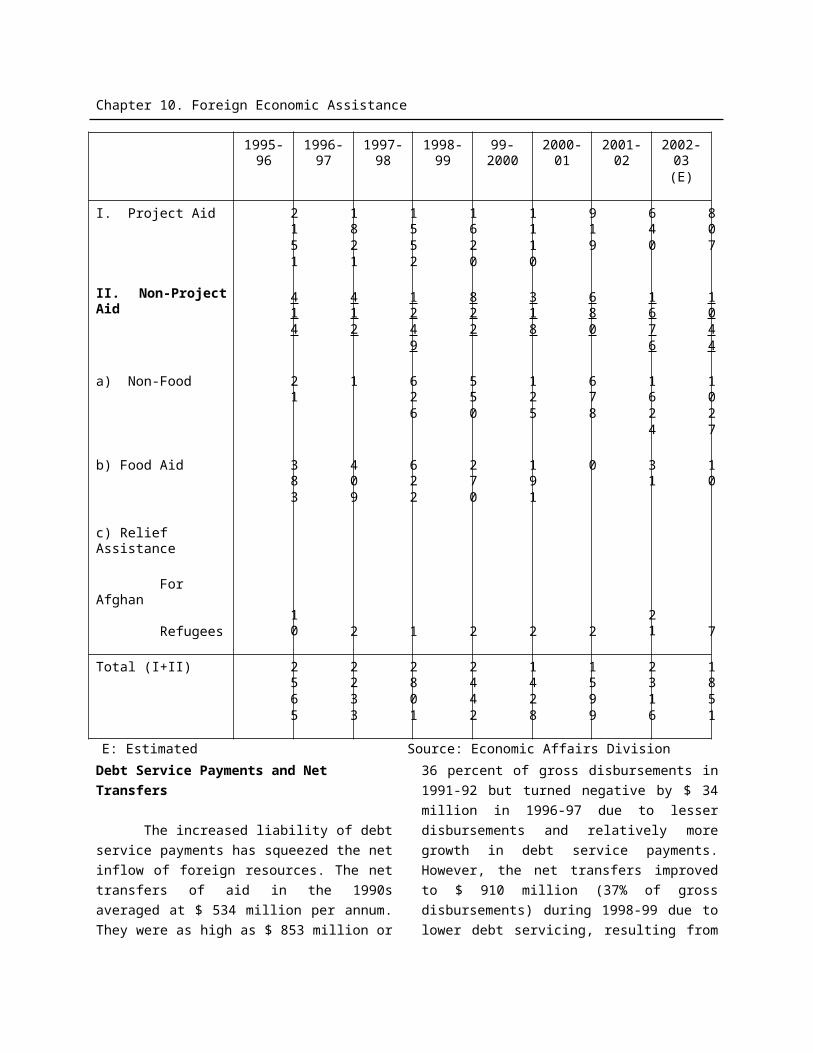
Chapter 14. Transport and Communications
Items
Revenue 43,674 43,608
Cost & Expenditure 41,563 45,490
Profit/Loss Before Tax 2,111 (1,882)
Source: PIA
Revenue Cost & Expenditure Profit/Loss Before Tax-3,000
2,000
7,000
12,000
17,000
22,000
27,000
32,000
37,000
42,000
47,000
Fig-5: Financial Performance of PIA
2002 2001
(Rs M
illio
n)
D.PORTS & SHIPPING
(a) Karachi Port Trust
Karachi Port has made a steady and continuous progress in its various sectors to boost the national economy. It has established an annual cargo
handling record of over 26.692 million with zero waiting time of vessels in 2001-02. During the first nine months of current financial year (July- March 2002-03), port has handled 20.011 million tons of cargo which is slightly less by 0.2 percent against the corresponding period of last year (20.057 million tons). The traffic handled at Karachi Port during last twelve years is as under:-
Table 14.6Cargo Handled at Karachi Port
(000 Tonnes)Year Imports %Change Exports %Chang
eTotal % Change
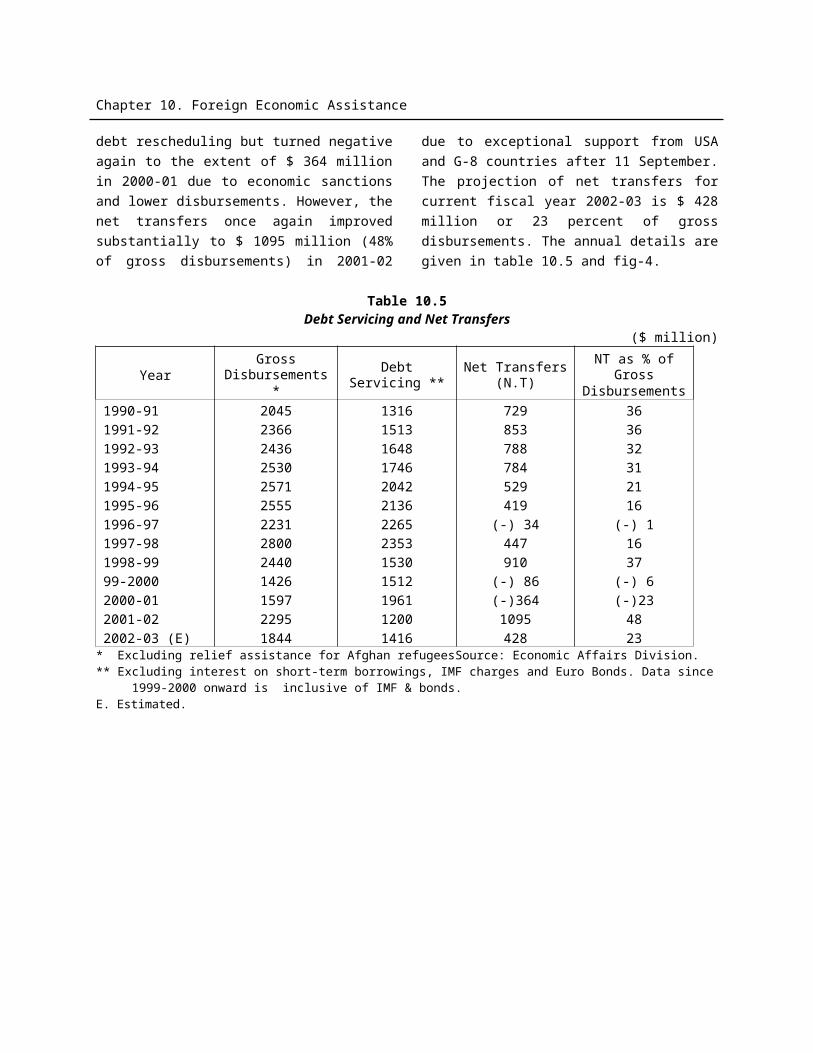
Chapter 14. Transport and Communications
1990-911991-921992-931993-941994-951995-961996-971997-981998-991999-002000-012001-02July-March2001-022002-03
14,71415,26617,25617,61017,52618,71918,36217,11418,31818,14920,06420,330
15,26515,380
-3.8
13.02.1
-0.56.8
-1.9-6.87.0
-0.910.5
1.3
-0.8
3,9955,1864,9144,9595,5724,8625,1135,5705,7355,6135,9186,362
4,7924,631
-29.8-5.20.9
12.4-12.7
5.28.93.0
-2.15.47.5
--3.4
18,70920,45322,17022,56623,09823,58123,47522,68424,05323,76225,98126,692
20,05720,011
-9.38.41.82.32.1
-0.4-3.46.0
-1.29.32.7
--0.2
Source: Karachi Port Trust
The KPT is committed to provide facilities at par with the modern age requirement, for which a number of projects have been formulated for phased implementation, financed through its own resources. The execution of the projects together with improvement in cargo and ship handling operations would enable the port to effectively meet the future requirement of shipping and cargo handling traffic. These projects include deepening of channel, refurbishment of oil Pier-II, procurement of new floating crafts, and expansion of Keamari Groyne Complex. The ground breaking ceremony for refurbishment of oil Pier-II has been held on 29th April 2003. The terminal will have a capacity to handle 8 to 12 million tons per annum of POL and non POL products. With the reconstruction of Oil Pier-II, the annual handling capacity of Karachi Port has increased from 24 to 28 million tonnes. Apart from the above development schemes, the KPT has offered a number of projects to private sector.
90-9
1
91-9
2
92-9
3
93-9
4
94-9
5
95-9
6
96-9
7
97-9
8
98-9
9
99-0
0
2000
-01
'200
1-02
2001
-02(
Jul-M
ar)
'200
2-03
(Jul-M
ar)
0
5000
1000
0
1500
0
2000
0
2500
0
Fig-6: Cargo Handled at Karachi Port
Import Export
000
Tonn
es
b) Port Qasim
The performance of Port Qasim Authority has been impressive during July- March 2002-03. A cargo volume of 12.32 million tones was handled during the period under review, as against 9.44 million tones during the corresponding period of last year, showing an increase of 30.5 percent. A congenial atmosphere has been developed to boost box trade at the port. Consequently, box trade surpassed all the pervious handling targets and registered an increase of more than 75 percent during the
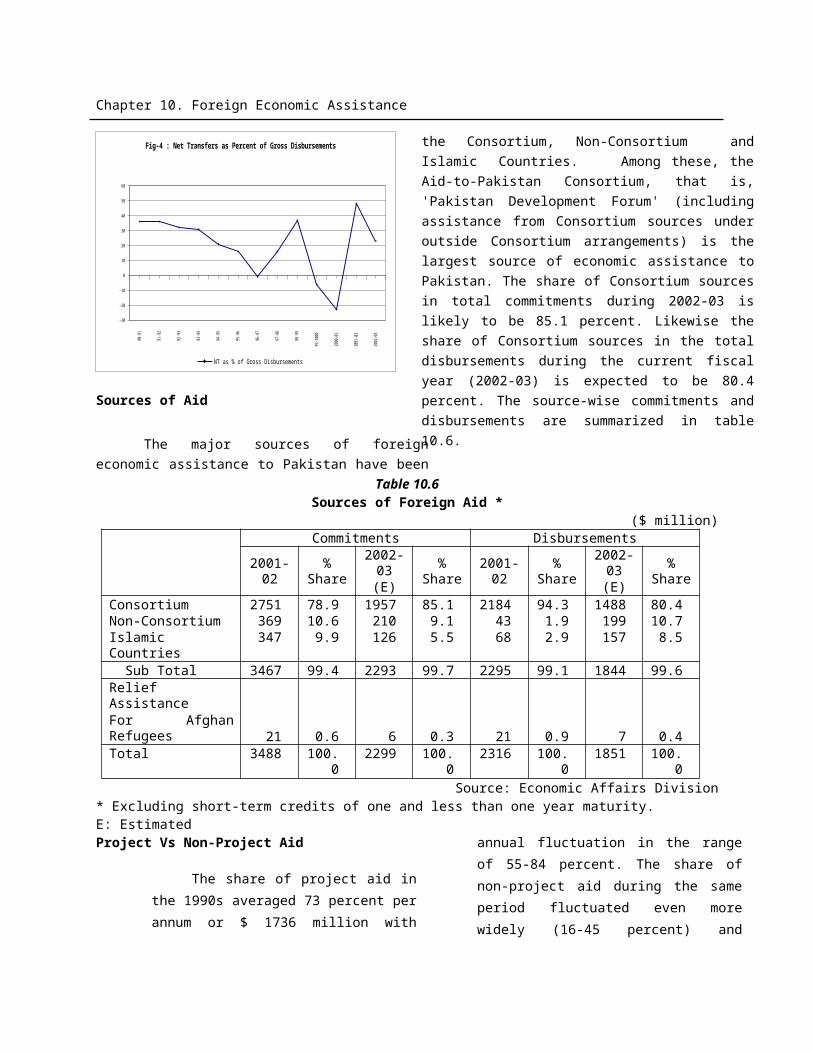
Chapter 14. Transport and Communications
first nine months of the current financial year 2002-03 over the same period last year. The ship callings have also registered an increase of 25 percent and stood at 520 during July-March-2002-03, as compared to 415 during corresponding period of last year. On financial account, the accomplishments are equally parallel. The Authority has earned a net profit of Rs. 830.74 million during July.-March 2002-03, showing an increase of around 133 percent when compared with Rs. 356.62 million in the corresponding period last year. Evenly important is the fact that the net surplus of Rs. 830.74 million is 149 percent higher than the target set for the current financial year 2002-03.
c) Gwadar Port
The port is geographically located at Gwadar East Bay, about 460 k.m. from Karachi and has immense strategic and political significance. The port will play a vital role in making Pakistan economically sound, it would serve as a link between the East and the West. The project would give a welcome fillip to economic activity and help to improve the quality of the local people. The port would step up trade and development activities, generate employment, and help attract investment. It will be developed in two phases. The port would be capable of handling ships of 30,000 DWT Bulk carriers and 25,000 DWT container vessels. The port is being built with Chinese assistance and will be completed in three years, ending March, 2005. The Phase-II will be implemented under BOT basis. It will comprise 10 additional berths, including 3 dedicated container terminals that includes one bulk grain terminals with capacity handling vessel upto 100,000 DWT and two oil berths for vessels upto 200,000 DWT.
d) Pakistan National Shipping Corporation (PNSC)
The PNSC is the National Flag Carrier of Pakistan. Its main objective is to maintain a commercially viable sea link between Pakistan and its major trading partners. It also helps in maintaining and stabilizing freight rates charged by the other carriers and provides a strategic link in the case of emergencies.
The fleet strength of the PNSC during July-March 2002-03 was 13 vessels with a deadweight capacity of 229,579 tons. Estimated revenue was approximately Rs. 3,826.00 million. The corporation has handled all kinds of cargoes including Rice, Fertilizer, Iron Ore, Coal and Wheat. During the first nine months of the current fiscal year, the PNSC has transported a total of 5.6 million tons of cargo including 4.6 million tons of Crude Oil and 0.23 tons of Rock Phosphate. The long term prospects for the company appear to be reasonably good. The PNSC is actively in the market for purchase of 2/3 Aframax tankers which will boost the gross tonnage under Pakistan flag.
e) Dryports
Beside the seaports and airports, eight dryports have been established all over Pakistan. The basic idea behind dryports proceeds from the premise that trade and industry located far away from sea ports/border posts, should be provided import and export facilities at the doorsteps of the business community in order to enable it to participate in the country’s international trade more actively and conveniently. Dryports infrastructure also makes it possible to organize an uninterrupted flow of imports and exports from the door of the consignor to the door
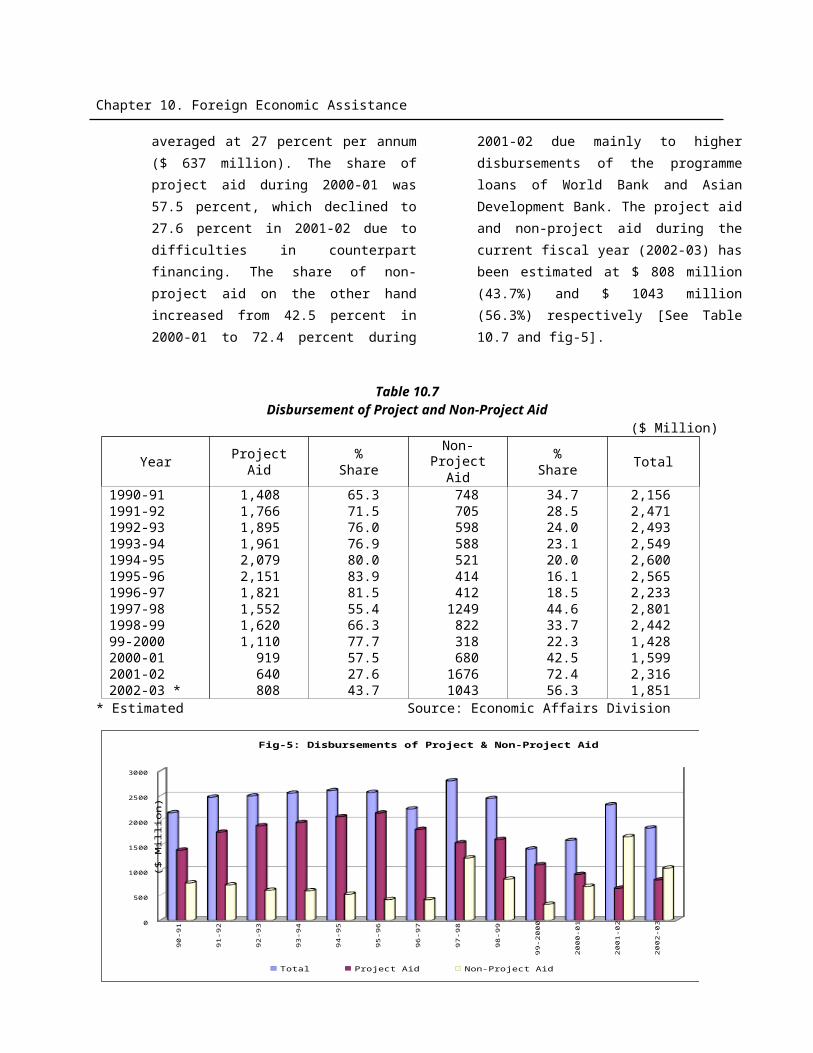
Chapter 14. Transport and Communications
of the consignee which is very essential for facilitation of the country’s international trade in the globalized world. It also places much emphasis on supply chain management. Besides, operation of inland container depots (ICDs) also gets facilitated in the vicinity of dryports which makes it possible to reduce the cost of import and exports.
The proposal for dryports in Pakistan was first mooted by the Federal Ministry of Industries in 1967. The Ministry had proposed to establish inland dryports at a number of up-country destinations. In 1968, the Lahore Chamber of Commerce and Industry demanded assignment of priority to Lahore for establishment of the first dryport in the country. The Lahore dryport was accordingly established in 1973. The decade of the Seventies was spent in watching the progress of Lahore dryport project which left much to be desired in its operational success. The basic problem was inefficient transport of dryport cargo from Karachi to Lahore. With the introduction of National Logistic Cell (NLC) in the transport sector in the early Eighties, the Lahore dryport started functioning well. Thus the demand for dryport facilities increased exponentially from almost all the
potential cities which had a sizable workload of import and export business. As a result, the National Logistic Cell (NLC) established the second dryport of the country at Hyderabad in 1984. In 1985, the enlightened exporters of Sialkot established the first-ever dryport facility at Sambrial in the private sector on self help basis. This dryport was established at the central city of Sambrial to effectively serve the entire triangular region comprising Gujranwala, Gujrat and Sialkot - a region which is also known as the Export Triangle of Pakistan. Afterwards, Pakistan Railways established dryports at Multan and Peshawar in 1986; at Quetta in 1987 and at Chaklala (Rawalpindi) in 1990. Faisalabad dryport was established in the private sector in 1994.
The performance of dry ports shows that the custom duty collected at the dry ports has increased by 6 percent and 5 percent during 1998-99 and 1999-2000, respectively. However, the collection of custom duty has declined by 9 percent and 16 percent during the 2000-01 and 2001-02 respectively. On the other side, the total value of imports has registered a mix trend. Table – 14.7 indicates the performance of dry ports.
Table 14.7Performance of Dryports
(Rs. Million)Fiscal Year Imports Custom duty Exports
Total value % change
collectedvalue
% change
Total value % change
1997-98 85,574 - 16,343 99,975 -1998-99 80,315 -6.1 17,323 6.0 100,781 0.81999-00 71,344 -11.2 18,147 4.8 113,603 12.72000-01 73,917 3.6 16,551 -8.8 130,785 15.12001-02 78,562 6.3 13,868 -16.2 146,257 11.8July-March2002-03 65,115 - 9,483 - 115,809 -
Source: Central Board of Revenue
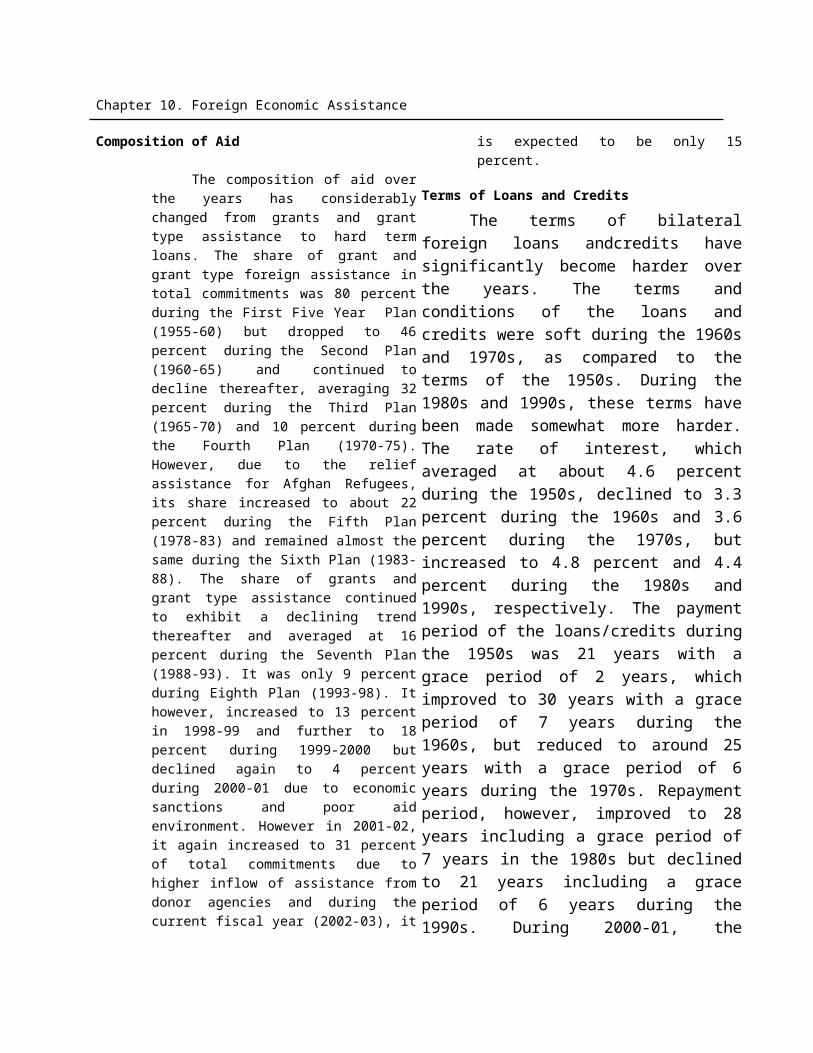
Chapter 14. Transport and Communications
E) INFORMATION TECHNOLOGY (IT)
Information technology (IT) has assumed unprecedented importance in the global economic arena. In Pakistan, Government is according a high priority to this sector. One of the prerequisites for ensuring sustained growth of the industry is the provision of a definite framework consisting of policy, legislative, financial, and operational guidelines, which can provide a stable umbrella for growth. Thus, the government is the main facilitator, enabler, and promoter of the IT sector. The
vision of the Policy is to harness the potential of Information technology as a key contributor to development of Pakistan. A broad-based involvement of the key stakeholders is a must for its sustainable development. Core IT Policy strategies have been proposed under several focused areas: (i) E-Government, (ii) IT Industry Development, (iii) IT Education at Schools/College Level and (iv) Targeted IT HRD Development as per Market Request. The new developments in the IT sector are given in Box-2
BOX-2E-Governance:
The first ever Citizens Portal of the Government of Pakistan has been launched on test/trail basis. Web sites of 34 Ministries/Divisions and 3 special purpose web sites have been developed and connected with the portal.
ATM network has been provided to facilitate low income federal government employees.
Seven Ministries are to be connected on Local Area Network (LAN). A project has been initiated by E-Government Directorate to train
probationary officers in the field of IT. This would enable officers to make use of the tools of IT to increase efficiency.
Projects like computerization of arms licenses, computerization of registration, crime control and FIR online are under implementation.
Pakistan Computer Bureau is being strengthened to provide technical assistance and bring uniformity in the architecture of nation wide applications.
IT Industry Development Program: Pakistan Softwear Export Board (PSEB) has organized exhibitions in
collaboration with ITCN to promote software industry of Pakistan. PSEB has implemented a pilot project for industrial automation. The main
outcomes of the project are demand for IT Industry, better productivity tools for conventional industry and employment opportunities for IT professionals.
PSEB has implemented ISO 9001 certification project to improve the product quality of IT Industry.
An internship project has been implemented to enhance the skill of young graduates and establish a better linkage between IT Industry and Educational Sector.
4 IT parks have been established in the public sector. In these IT Parks, high-speed bandwidth is brought to the premises, data network within the
Chapter 14. Transport and Communications
building is set up and managed and space is rented out at affordable rates. Human Resource Development:
Infrastructure Support for Degree and Post Degree Level IT Education Educational Intranet: Developed to provide high speed connectivity to 56
UGC recognized universities. Multimedia Platform: The project will set up a Multimedia Asset
Management system capable of storing, compiling and content over digital satellite broadcast television, internet and cable television channels.
IT Education at School & College Level Computer laboratories have been set up in 25 Federal Government Schools
and Collages, 25 PAF Schools and Colleges, 23 F.G Colleges and 20 Cantt Garrison Schools through a project.
Computers labs and other resources have been provided to Government college Lahore and Lahore College for Women.
Computer labs have also been established in two colleges for men and two colleges for women in Northern Areas.
Cadet College Sanghar and Military College Jhelum have been facilitated with the computer labs and other resources.
Targeted IT HRD Training Professional training will be provided to 1400 Inter-Networking (Cisco)
engineers. PGD program will be arranged for students from Baluchistan. 760 students trained in Legal Transcription. 1104 students trained in Medical Transcription. 536 students trained in Quality Control.
i) Electronic Government Directorate:
The IT action plan is an integral part of the IT Policy. It aims at promotion of information and communications technologies (ICT) through development in the following areas:
(i) Provision of ICT infrastructure in the country.
a) Provision of sound physical infrastructure like telephone and internet system.
b) Provision of legal infrastructure viz. necessary law to encourage
and protect electronic transaction.
c) Improve quality and quantity of IT students at university level.
d) Encouraging local IT Industry by providing incentives and job opportunities.
(ii) Introducing ICT in government organizations so that quality of public services is enhanced through efficiency and speed of delivery of services and bringing in transparency in government operations.
(iii) Encouraging e-Commerce.
The government has set up an Electronic Government Directorate (EGD) under the Ministry of IT &
Chapter 14. Transport and Communications
Telecommunications. EGD will prepare and implement all e-government projects at federal level, prepare standards for IT sector activities and provide technical support to different provincial and federal organizations. Financial year 2002-03 is a milestone in the history of E-government in Pakistan. The first ever Information and Services web portal called “PAKISTAN GOV” (www.pakistan.gov.pk) was launched in October 2002. By the end of February 2003, more than 1.3 million viewers had visited the portal.
ii) Pakistan Computer Bureau:
Pakistan Computer Bureau completed the training of 6000 Federal Govt. Employees at Islamabad/ Rawalpindi and 6800 Provincial Govt. employees at their Provincial Headquarters. Training of Govt. officials is a regular activity of Pakistan Computer Bureau which also extends advisory services to government department for selection of hardware/software and related matters. Pakistan Computer Bureau is undertaking a number of projects: (i) “Provision of 2000 I.T. Teachers in computer science and establishment of 1500 Computer Laboratories in High Schools, Higher Secondary Schools and Intermediate Colleges in all the Provinces including AJ & K”. (ii) The introduction of I.T. in district administration which will initially include the computerization of Land Records and Vehicle Registration etc. A few selected Districts will be taken up as pilot project.
iii) Pakistan Software Export Board (PSEB):
Pakistan Software Export Board (PSEB) is undertaking various initiatives for the development of IT industry capability in Pakistan. In the domestic market, the PSEB has launched a program, namely “Automation of Domestic Manufacturing Industy” to automate 100 manufacturing units from various industries sectors. It is working on the standardization and quality improvement programs. The Project “Standardization of Pakistani Software Industry-ISO” has been launched for the certification of 80 software companies. The PSEB is managing Software Technology Parks (STPs) in major cities of Pakistan. The STPs are equipped with the top class Internet bandwidth facilities. The company can have the facility within 48 hours. In addition to this, 24 hours technical support is also available for the smooth execution of the IT business. The International Software Market is continuously expanding and taking on new dimensions. New areas of Information technology are being discovered and software companies are diversifying their businesses. On the other hand, the talent in Pakistan is looking for assistance, support and resources to implement their ideas in the IT field. The PSEB has also set up a one-window operation “Business Response Unit (BRU)”. It is a one stop information source to the foreign and local investors in the IT sector. According to IT Division, the export of Software stood at $ 18.2 million in fiscal year 1999-2000 has reached $ 20.1 million in 2001-02, showing an increase of 10 percent. During July-February of the current financial year
Chapter 14. Transport and Communications
2002-03, the export of software has reached $ 14.6 million.
iv) Pakistan Telecommunication Company Limited (PTCL)
The PTCL network consists of 99 percent digital switching system exchanges, Optical Fiber Cable Backbone, subsidiaries routes, long distance media, digital radio systems, satellite communications and alternate arrangements. It has international Gateway exchanges at Karachi and Islamabad. International communication revenue is an appreciable source of PTCL earnings. The PTCL is provider of infrastructure for connectivity for internet system providers (ISPs), data network operators, software exporters, educational institutions, universities, corporate customers and other users. Its tariffs have been reduced by 25 percent on international calls during 2001-02 and are expected to be reduced further in 2002-03. Tariff has been reduced by 60 percent on international IP bandwidth, 10 to 68 percent on Lower than one MB, and 70 percent on domestic lease circuits. For promotion of Information Technology, 1,350 cities/towns/ villages have been provided Internet facility, upto March, 2003, compared to 850 cities/towns/villages in June 2002 showing an increase of 58.8 percent. Promotional traffic has been introduced for ISPs, Software exporters and educational institution/universities working in the country. The PTCL has launched its domestic and International Pre-Paid Calling Card Service (Intelligent Network) in the country during 2000-01, since its commissioning, the intelligent network
system at Islamabad, Lahore and Karachi has met tremendous success. So far 9.73 million cards have been floated in the market. Pakistan Telecommunication network is expending each year, thus providing telephone access to rural and urban communities in record time. Total telephone lines installed by March 2003 were 4.6 million as against 3.6 million up to June 2002 last year, showing an increase of one million telephone connections or 27.8 percent.
A system with a capacity of 110,000 Mail Boxes has been installed at 10 major cities i.e Faisalabad, Gujranwala, Hyderabad, Islamabad, Karachi, Lahore, Multan, Peshawar, Quetta and Sialkot. The Mobile Phone Service (Ufone) has been launched in 60 cities/ towns and highways. Its customer base is 425,978 which is expected to increase further even in future.
Paknet, an Internet Service provider (ISP), is a subsidiary of the PTCL. The PTCL has installed Internet Exchanges (PIE) at Rawalpindi, Lahore and Karachi, comprising of high-end routers, multi-services switches, firewalls and proxy services etc. The details of bandwidth with capacity and total numbers of ISPs are given in Table 14.8:
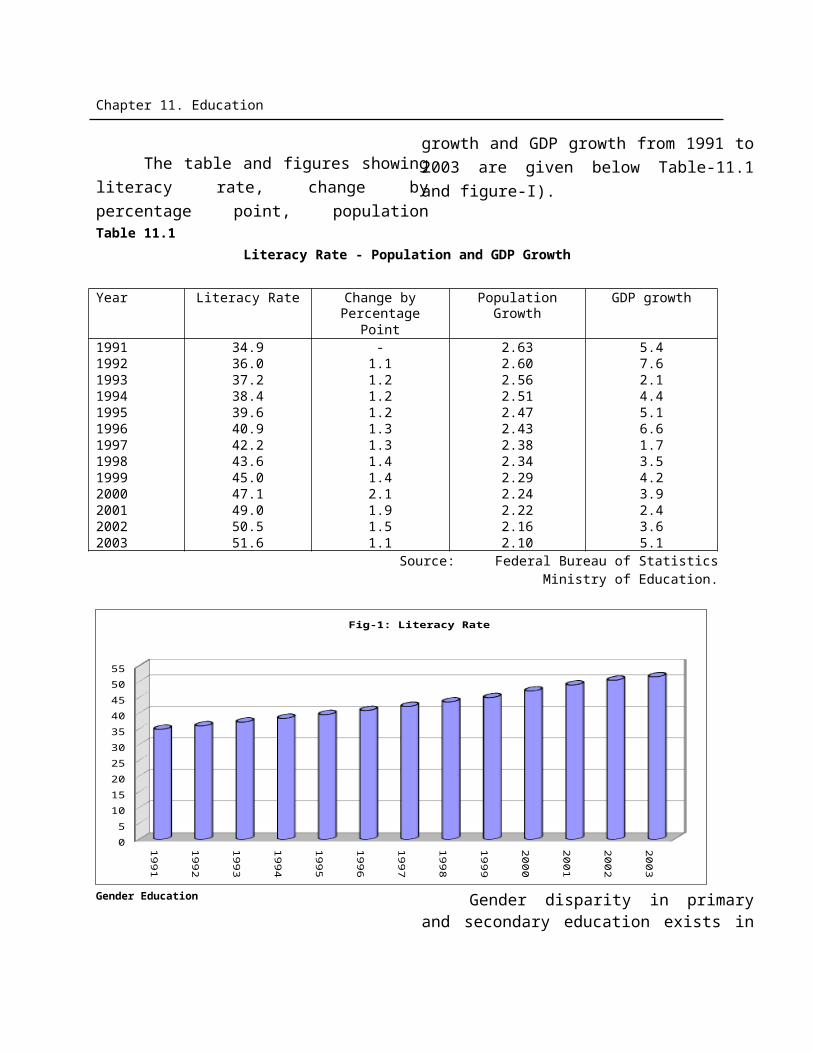
Chapter 14. Transport and Communications
Table 14.8Bandwidth Capacity
Name of station Bandwidth capacityMega Byte
Total number of ISPs
Karachi 94.65 81Lahore 70.62 60Rawalpindi 63.29 66Total 228.56 207
Source: PTCL
v)Pakistan Telecommunication Authority
(PTA)
Pakistan
Telecommunication Authority is
promoting the telecom sector since
1996. The Authority is responsible
for regulating the establishment,
operation and maintenance of
telecommunication system and
provision of telecom services. It
promotes and protects the interest
of users of telecommunication
services. Pakistan under World
Trade Organization (WTO)
commitment is now ready to
deregulate the whole of Telecom
sector. Deregulation policy is in
final stages and to be announced
shortly .In the Year 2002-03, the
PTA has moved forward to
encourage the telecom operators
and transfer of technology. In this
regard, reduction in royalty of
Internet services provider (ISP)
from 4 to 0.7 percent of the gross
revenue, for card payphone service
and cellular mobile service it was
from 4 to 2 percent and 4 to 1.5
percent respectively. Similarly with
the launching of prepaid connection
of U-Fone, the mobile phones have
reached 2 million by end of March
2003, as against 1.2 million upto
June, 2002, showing a growth of
66.7 percent. The introduction of
new services in terms of
technology advancement in the
sector including the broadband
Internet services and General
Packet Radio Services (GPRS)
facility, which also include Internet
connectivity on the mobile phone .
The PTA has issued 2,861 licenses
for telecom services up till March
2003, 153 licenses for card
payphone service, 125 for Internet
services provider, for non-voice and
vice data communication network
services 20 and 25 licenses were
issued respectively. The PTA has
also issued 8 Audio tax licenses, 6
satellite license, 12 trunk radio
licenses and 9 store & forward fax
service license, video conference 1,
electronic information service 125
and 25 data communication
network services.
vi) National Telecommunication Corporation
(NTC)
Chapter 14. Transport and Communications
National Telecommunication
Corporation has an installed
capacity of 78,000 lines with 60,000
working connections. The
Corporation plans to expand the
network to 100,000 installed lines
during 2003-04 which will provide a
total number of 80,000 working
connections. All NTC exchanges are
digital, which are linked to each
other through Optical fiber (OFC)
media and digital radio system
(DRS). The Corporation is also in
process for establishment of Optical
Fiber back bone on Makran Coast to
bring the people of the area to the
National mainstream of
development. The Corporation will
set in own gateway exchanges to
provide international connectivity
to its designated customers during
2003-04 and will introduce/provide
calling cards for exclusive use by its
customers. It will also set up pay
card phones at the premises of its
designated customer. NTC’s state-
of-the-art Data Communication
Network has started to provide
infrastructure support for e-
governance initiatives of the
Government during 2002-03 which
is in the process of expansion and
provision of Internet facilities to
federal ministers and their regional
offices. In December 2002,
allocated spatial slot of 380, the
PAKSAT has been placed at the
telecom services of the country
through satellite. During the year
2003-04, an estimated 1000
designated subscribers of NTC have
also been planned to be covered
through wireless Local loop.
Network management system is
responsible for the management,
on real time basis, of the exchanges
and the surrounding network.
Network manager reduces the
negative effectives of over load &
faults in the network, through
efficient utilization of network
resources and capacity. It provides
an efficient and reliable solution for
the management of EWSD nodes.F) ELECTRONIC MEDIA
a) Pakistan Television Corporation Limited (PTV)
PTV is providing quality entertainment, education and information to inform and educate the people through wholesome entertainment and to inculcate in them a greater awareness of their own history, heritage, current problems and development as well as knowledge of the world at large. The PTV is operating with three Channels in the country. The Re-broadcast Centers are extending TV Signal to remote areas of the country. The Government has desired to extend the TV signal by setting up Re-broadcast Centers in Baluchistan at Noushki (Chaghai), Wadh, Qilla Saifullah and Ziarat, in Sindh at Umerkot and in AJ&K. A TV Station at Muzaffarabad and 7 RBC’s at Kotli, Rawala-Kot, Bagh, Plandri, Bhimber, Neela Butt and Mirpur.
Chapter 14. Transport and Communications
The PTV has started 24 hours transmission on PTV-1 with effect from 11th February 2003. This is in addition to news on the hour every hour and views and current affairs available round the clock on PTV-World.
b)Pakistan Broadcasting Corporation (PBC)
Pakistan Broadcasting Corporation (PBC) has been playing a very important role in promoting national integration, projecting Government policies at home & abroad, providing information, education & entertainment to the people. The PBC has a total 25 broadcasting stations in all parts of Pakistan. Radio Pakistan broadcasts programmes for its listeners at home and abroad round the clock in national, regional and other languages of Pakistan as well as 15 foreign languages in its Home, World and External Services with the availability of its programmes in 56 countries of Asia, Africa and Europe. Radio Pakistan has launched an exclusive entertainment channel FM-101 since 1998. All big cities of the country are linked in the network. FM services are also available on Motorway.
The Central News Organization (CNO) puts 142 News Bulletins of the different durations in 33 languages daily keeping the listeners informed for latest happenings in the country and around the world.
G. PAKISTAN POST OFFICE
Pakistan Post Office is a state enterprise dedicated to providing wide range of postal products and public services. It is the premier national postal communication service holding together a vast country with a large population. As a true emblem of federation, it is committed to serving every one, every day and every where. It provides postal facilities through a net work of 12, 267 post offices across the country. The department is providing various traditional postal services to the consumers at a reasonable price. Its vast network of post offices in every nook and corner of the country is of crucial importance. To meet the modern requirements of rapid communication the Pakistan Post Office has Planned to modernize all services functions by providing integrated computing facilities at all GPO’s/ HO’s.
________________________
Chapter 15. Energy
15. Energy
At present, over a billion people
in the industrialized countries use
some 60 percent of the world’s
commercial energy supply, while 5
billion people living in the developing
countries consume the remaining.
Many of these people live in the
developing countries and a large
number of them are poor. The poor, in
particular, need to be provided with a
minimum amount of energy at an
affordable price. To achieve this goal,
the energy needs to be produced and
supplied at least cost. In fact, efficient
energy use plays an important role in
the social and economic development.
It contributes, for example, to slow
down population growth, and reduce
pollution and environmental pressures.
Energy sector in Pakistan
comprises power, gas, petroleum and
coal. Total primary energy supplies
measured in terms of tones of oil
equivalent (TOE) in 2001-02 were 45.2
million. The oil, natural gas, electricity
and coal provide 41.3 percent, 42.9
percent, 11.2 percent and 4.6 percent,
respectively of the total primary
energy supplies. The power and gas
sector accounts for 3.6 percent of GDP
in 2001-02.
Energy Consumption
During the last twelve years
(1990-91 to 2001-02), average
consumption of the petroleum products
showed upward trends. On average,
the energy consumption has increased
by 4.6 percent per annum. As regards
the consumption of gas, it increased by
3.5 percent per annum. Similarly, the
consumption of electricity increased by
4.9 percent. However the consumption
of coal, which showed wide fluctuation
in its annual consumption, has
recorded an annual growth of 1.2
percent only. The annual trend of
energy consumption since 1990-91 to
2001-02 is given in Table 15.1. The
consumption of gas and coal during the
first nine months (July-March) of the
current fiscal year have increased by
7.8 percent and 5.2 percent,
respectively over the corresponding
period of last year.
A. PETROLEUM PRODUCTS
During the first three quarters of the
current fiscal year, the household,
agriculture, and other Govt. Sector showed
declines in the use of petroleum products to
the extent of 12.3 percent, 16.8 percent
and 43.0 percent respectively, for a variety
of reasons including the availability of
alternative and relatively cheaper fuels in
Chapter 15. Energy
the form of natural gas and LPG; and
declined in demand of aviation fuels (JP-4 &
JP-1) as airline industry faced decline in
traffic. However, the industry and power
sectors have recorded substantial increase
in the consumption of diesel, LDO and fuel
oil. The annual growth in the consumption
of petroleum products by major sectors and
their relative shares since 1990-91 to 2002-
03 are given in Table 15.2 and Table 15.3,
respectively.
Table 15.1
Annual Energy ConsumptionPetroleum Products Gas Electricity Coal
Fiscal Year
(000 tones)
% Chang
e
(mmcft)
% Chang
e
(Gwh) % Chang
e
(000 M.T)
% Chang
e 1990-911991-921992-931993-941994-951995-961996-971997-981998-991999-002000-012001-02Avg.(12 years)Jul-Mar2001-022002-03
9,961
10,983
12,012
13,225
13,960
15,601
15,606
16,624
16,647
17,768
17,648
16,960
12,333
12,665
-0.1
10.3
9.4
10.1
5.6
11.8
0.0
6.5
0.1
6.7
-0.7
-3.9
4.6
-2
.7
465,338
486,631
511,526
550,769
546,788
582,868
597,799
607,890
635,832
714,744
777,610
824,604
624,058
673,034
-17.64.65.17.7
-0.76.62.61.74.6
12.48.86.03.5
-7.8
31,534
33,878
36,493
37,381
39,619
41,924
42,914
44,572
43,296
45,586
48,584
50,622
40,010
40,472
9.67.47.72.46.05.83.43.9
-2.95.36.64.24.9
-1.2
3,054
3,099
3,267
3,534
3,043
3,638
3,553
3,159
3,461
3,168
3,095
3,328
2,328
2,450
1.55.48.2
-13.919.6-2.3
-11.19.6
-8.5-2.37.51.2
-5.2
Source: Hydrocarbon Development Institute of Pakistan.
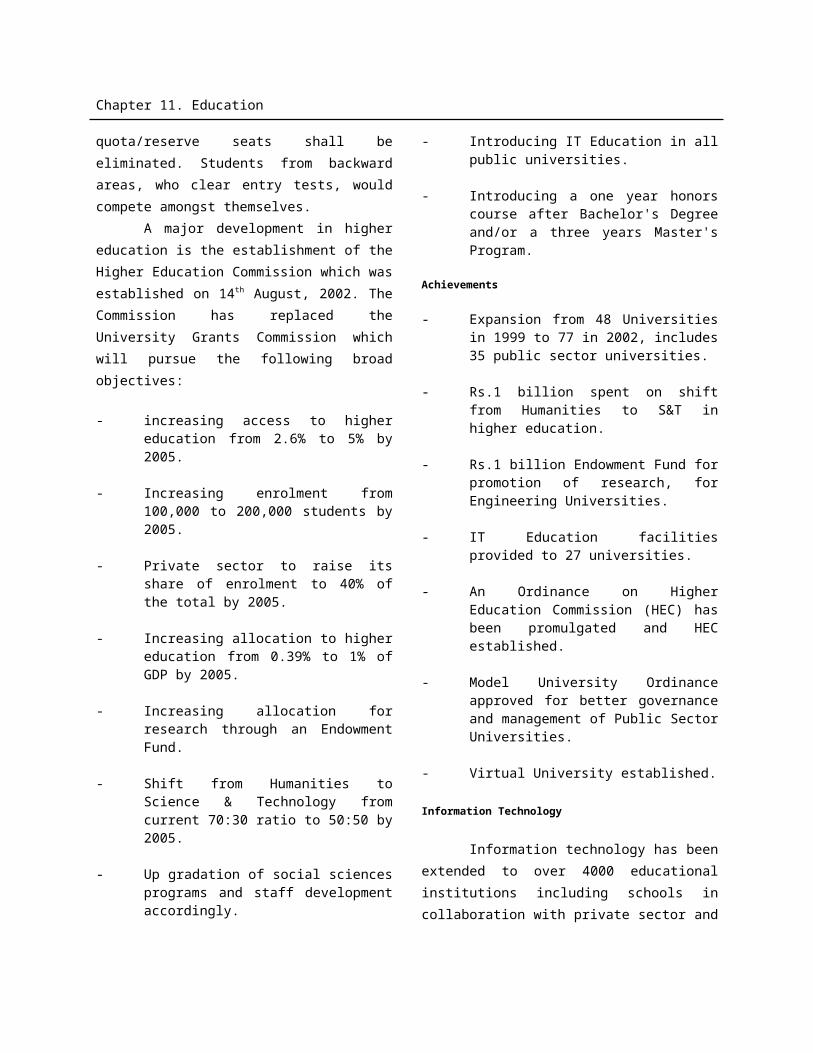
Chapter 15. Energy
Table 15.2Consumption of Petroleum Products
(000 tones)Year
House
holds
% Chan
ge
Industry
% Chan
ge
Agri.
% Chan
ge
Trans.
% Chan
ge
Power
% Chan
ge
Other Govt.
% Chan
ge
90-9191-9292-9393-9494-9595-9696-9797-9898-9999-002000-01
2001-02
Jul-Mar
2001-02
2002-03
944
614
622
590
585
596
510
499
493
477
451
335
260
228
-15.
4-
35.01
.3-
5.1-
0.81
.9-
14.4-
2.2-
1.2-
3.2-
5.5-
25.7
--
12.3
1,14
81
,3691
,4801
,6531
,8892
,4162
,1412
,0812
,1402
,1161
,9241
,61
-11.
51
9.38
.11
1.71
4.32
7.9-
11.4-
2.82
.8-
1.1-
9.1-
16.2
-1
7.4
265
281
287
308
269
250
269
245
249
293
255
226
173
144
-7.6
6.0
2.1
7.3
-12.
7-
7.07
.6-
8.91
.61
7.8-
13.0-
11.4
--
16.8
4,84
15
,6196
,1076
,4146
,6467
,1367
,1727
,3647
,8648
,3088
,1588
,01
3.4
16.1
8.7
5.0
3.6
7.4
0.5
2.7
6.8
5.6
-1.8
-1.7
-0
.8
2,43
42
,7753
,1583
,9024
,2154
,7865
,1106
,0545
,5266
,2286
,4886
,30
11.2
14.0
13.8
23.6
8.0
13.5
6.8
18.5
-8.7
12.7
4.2
-2.8
-6
.5
328
323
357
357
355
417
404
381
376
346
372
464
372
212
-17.
7-
1.51
0.50-
0.61
7.5-
3.2-
5.7-
1.3-
8.07
.52
4.7
--
43.0
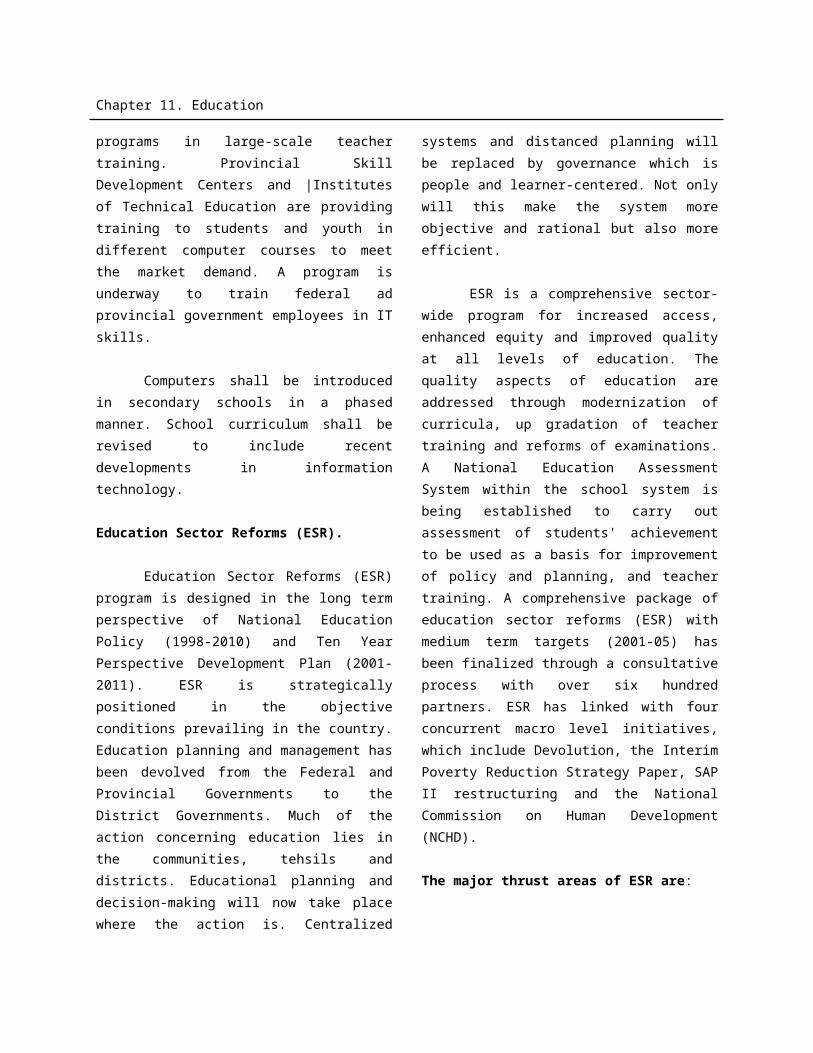
Chapter 15. Energy
2
1,22
81
,442
9
5,85
75
,906
5
4,44
34
,732
Source: Hydrocarbon Development Institute of Pakistan.
As regards the average sectoral shares,
transport sector was the largest consumer of the
petroleum products and accounted for 47.5
percent, followed by power sector (31.5 percent),
industry (12.4 percent), household (4.1 percent),
agriculture (1.9 percent) and others Govt. (2.6
percent).(Table 15.3).
Table 15.3Consumption of Petroleum Products
(Percentage Share)Year House
holdsIndustry Agriculture Transport Power Other
Govt.1990-911991-921992-931993-941994-951995-961996-971997-981998-991999-00 2000-012001-02
Avg.(12 years)Jul-Mar2001-022002-03
9.5
5.6
5.2
4.5
4.2
3.8
3.3
3.0
2.9
2.7
2.6
2
11.5
12.5
12.3
12.5
13.5
15.5
13.7
12.5
12.9
11.9
10.9
9
2.7
2.6
2.4
2.3
1.9
1.6
1.7
1.5
1.5
1.6
1.4
1.
48.6
51.2
50.8
48.5
47.6
45.7
45.9
44.3
47.2
46.8
46.2
47
24.4
25.3
26.3
29.5
30.2
30.7
32.7
36.4
33.2
35.0
36.8
3
3.3
2.9
2.9
2.7
2.5
2.7
2.6
2.3
2.3
1.9
2.1
2
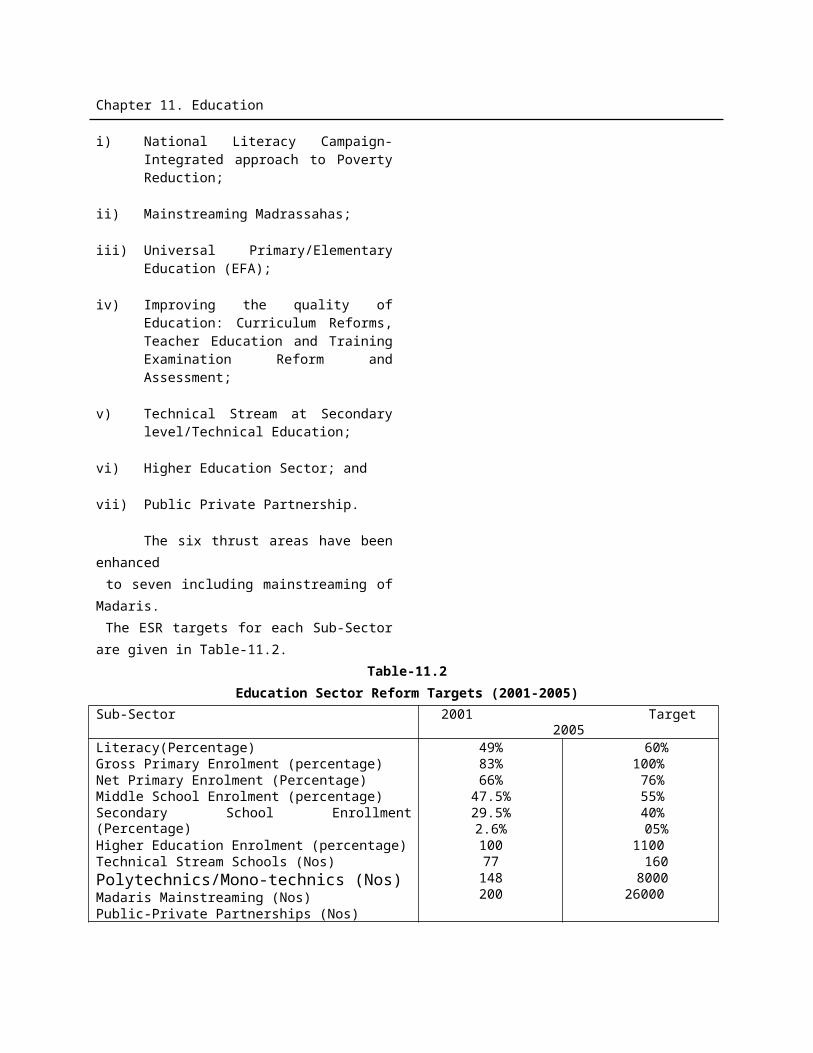
Chapter 15. Energy
.0
4.1
2.1
1.8
.5
12.4
9.8
11.4
3
1.9
1.4
1.1
.3
47.5
47.5
46.3
7.2
31.5
36.0
37.4
.7
2.6
3.0
1.7
Source: Hydrocarbon Development Institute of Pakistan.
B. CONSUMPTION OF GAS
Table 15.4 gives the annual
change in the consumption of gas by
various users since 1990-91 to 2002-
03. The sectoral consumption of gas in
2001-02 exhibits a mix trend. The
relative shares of gas consumption by
various users during the last twelve
years are documented in Table 15.5.
Power sector has emerged as the
largest consumer of gas (34.5 percent),
followed by fertilizer (24.2 percent),
industrial (18.9 percent), households
(17.8 percent), commercial (2.9
percent) and cement (1.7 percent). It
may be noted that the share of power
sector in consuming gas is rising
continuously since 1998-99. The power
sector is gradually reducing its
dependency on imported fuel oil
because of its escalating prices. The
consumption of gas during the first
nine months of 2002-03 also exhibits a
rising trend. The consumption of gas
by power sector increased by 14
percent while industry’s consumption
grew by 10.7 percent followed by
household (6.7 percent) (Table 15.4).
Table 15.4Consumption of Gas
(Billion cft)Year House
Hold%
Change
CommErcial
% Chan
ge
Cement
% Chan
ge
FertiliZer
%Change
Power
% Chan
ge
Industrial
% Chan
ge
90-9191-9292-9393-9494-9595-9696-9797-98
677
17
68
2
11.1
6.0
7.0
7.9
121
31
41
5
10.4
8.3
7.7
7.1
131
21
21
0
62.9
-7.7
0.0
-16.
108
101
119
144
-0.6-
6.51
7.
176
194
187
198
4.3
10.2-
3.6
899
61
031
01
2.9
7.9
7.3
-1.
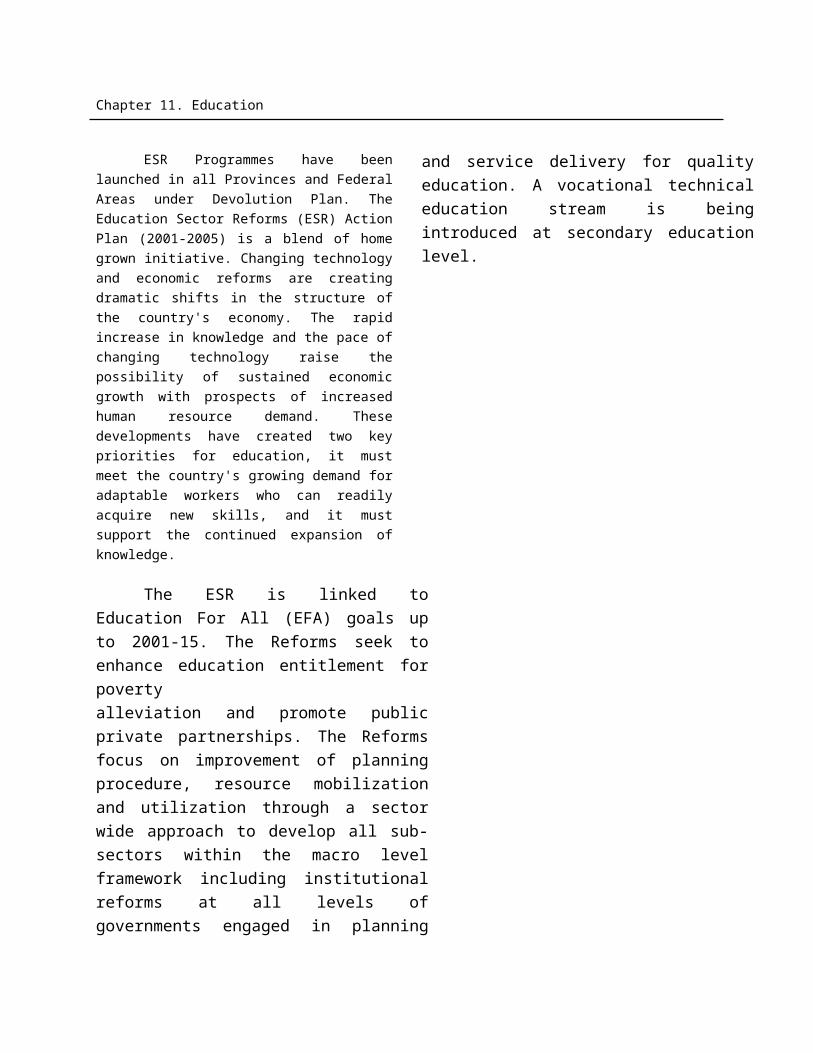
Chapter 15. Energy
98-9999-00
00-0101-02Jul-Mar
01-0202-03
971
101
151
341
311
391
411
44
119
127
18.3
13.4
4.5
16.5
-2.2
6.1
1.4
2.1
6.7
161
71
81
92
12
22
12
2
171
7
6.7
6.3
5.9
5.6
10.5
4.6
-4.5
4.8
0.0
7891
28987
**
7-
30.01
4.31
2.53
3.3-
33.31
2.8-
11.1
-12.
5
142
150
150
148
167
177
175
178
131
131
82
1.0-
1.45
.60
.0-
1.31
2.86
.0-
1.11
.1
0.0
181
186
194
179
184
230
288
315
231
263
5.9
-8.62
.84
.3-
7.72
.82
5.02
5.09
.4
13.9
104
111
110
115
121
135
139
151
122
135
93
.06
.7-
0.94
.55
.21
1.63
.08
.6
10.7
*included in Industrial Sector Source:Hydrocarbon Development Institute of Pakistan
Table 15.5Consumption of Gas
(Percentage Share)Year Household
sCommercial Cement Fertilizer Power Industrial
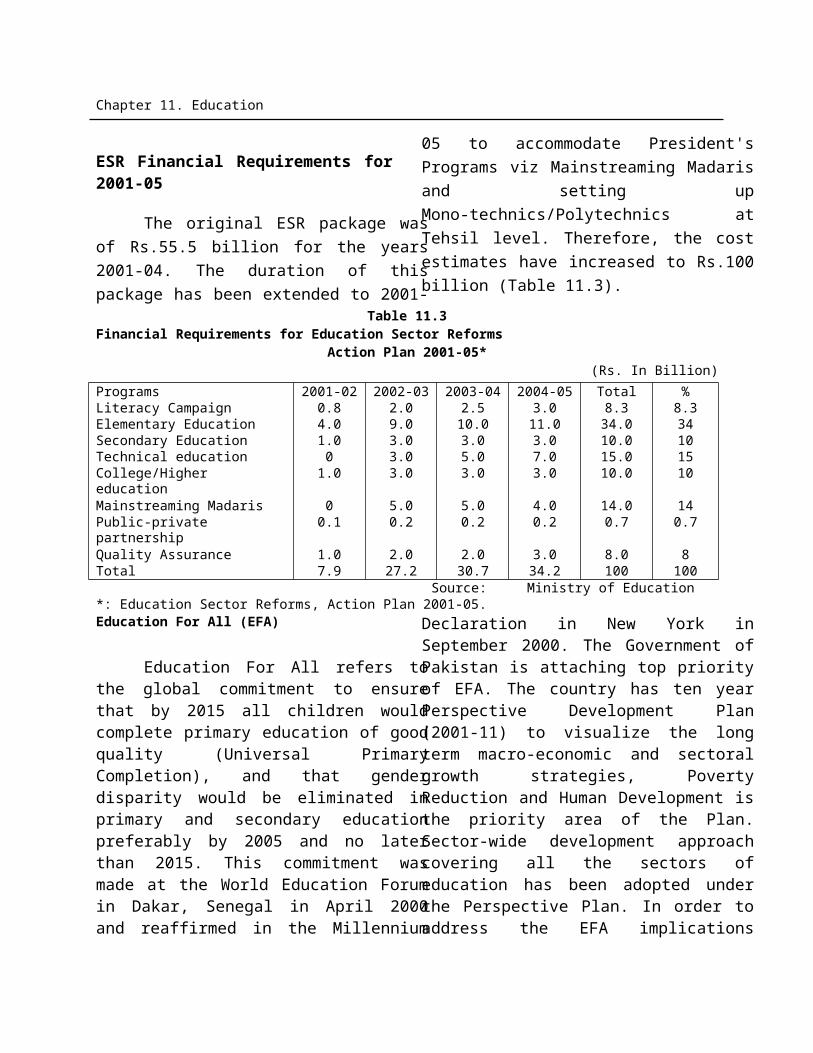
Chapter 15. Energy
1990-911991-921992-931993-941994-951995-961996-971997-981998-991999-002000-012001-02
Average (12 years)
July-March2001-022002-03
14.314.514.814.917.818.919.322.120.719.618.217.6
17.8
19.218.8
2.62.72.82.82.92.93.13.13.43.02.72.7
2.9
2.72.6
2.8
2.4
2.3
1.8
1.2
1.3
1.5
2.0
1.3
1.2
1.2
0.9
1.7
**
23.2
20.8
23.4
26.2
25.9
25.8
25.2
24.3
26.3
24.8
22.8
21.7
24.2
21.0
19.4
37.9
39.8
36.5
35.9
33.1
32.0
32.4
29.4
28.9
32.2
37.2
38.5
34.5
37.2
39.0
19.119.720.118.319.019.118.418.919.118.917.918.5
18.9
19.720.1
* Included in Industrial Sector. Source: Hydrocarbon Development Institute of Pakistan.
C. ELECTRICITY CONSUMPTIONTables 15.6 and 15.7 show the position of
electricity consumption since 1990-91 to 2002-03. On average, the household sector has been the largest consumer of electricity, accounting for 40.7 percent of the total electricity consumption, followed by industrial (31.1
percent), agriculture (14.5 percent), commercial (5.5 percent), other government sector (7.5 percent) and street light (0.7 percent). During the first 9 months of 2002-03, the overall consumption of electricity has increased due to installation of new connections, incentive package offered to industrial consumers and accurate meter reading. (Table-15.6).
Chapter 15. Energy
Table 15.6
Consumption of Electricity By Sectors
(000 GWH)
House hold
Commercial
Industrial Agriculture Street Light (Total)
Other Govt.
Year Gwh
%Chan
ge
Gwh
%Chan
ge
Gwh %Chan
ge
Gwh
%Chang
e
Gwh
%Chan
ge
Gwh %Chan
ge
1990-911991-921992-931993-941994-951995-961996-971997-981998-991999-002000-012001-02July-Mar2001-02E2002-03E
10.411.413.214.015.617.117.818.819.421.422.823.2
16.817.0
11.2
9.6
15.8
6.1
11.4
9.6
4.1
5.6
3.2
10.3
6.5
1.8
-1
.8
2.12.11.71.81.92.22.22.32.42.52.83.0
2.12.3
5.5
0-
19.05
.95
.61
5.804
.54
.35
.21
2.07
.1
-9
.5
11.212.313.012.612.512.111.912.312.013.214.315.1
11.112.1
8.89.85.7
-3.1-0.8-3.2-1.73.4
-2.410.0
8.35.6
-8.1
5.65.85.65.86.26.77.06.95.64.54.95.6
4.14.3
11.8
3.6
-3.4
3.6
6.9
8.1
4.5
-1.4
-18.8
-19.9
8.9
14.3
-4
.9
--
297298324378390387224239213212
--
---
0.38.7
16.73.2
-0.8-42.1
6.7-10.9
-0.5
--
2.12.12.62.83.03.33.43.93.63.63.53.5
2.74.6 *
19.200
23.87.77.1
10.03.0
14.7-7.7
0-2.80.0
-70.4
E-Estimated Source:Hydrocarbon Development Institute of Pakistan.
*Included traction- : not available
Table 15.7Consumption of Electricity(Sectoral Shares)
(Percentage Share)
Year Households
Commercial
Industrial Agriculture Street Light
Other Govt.
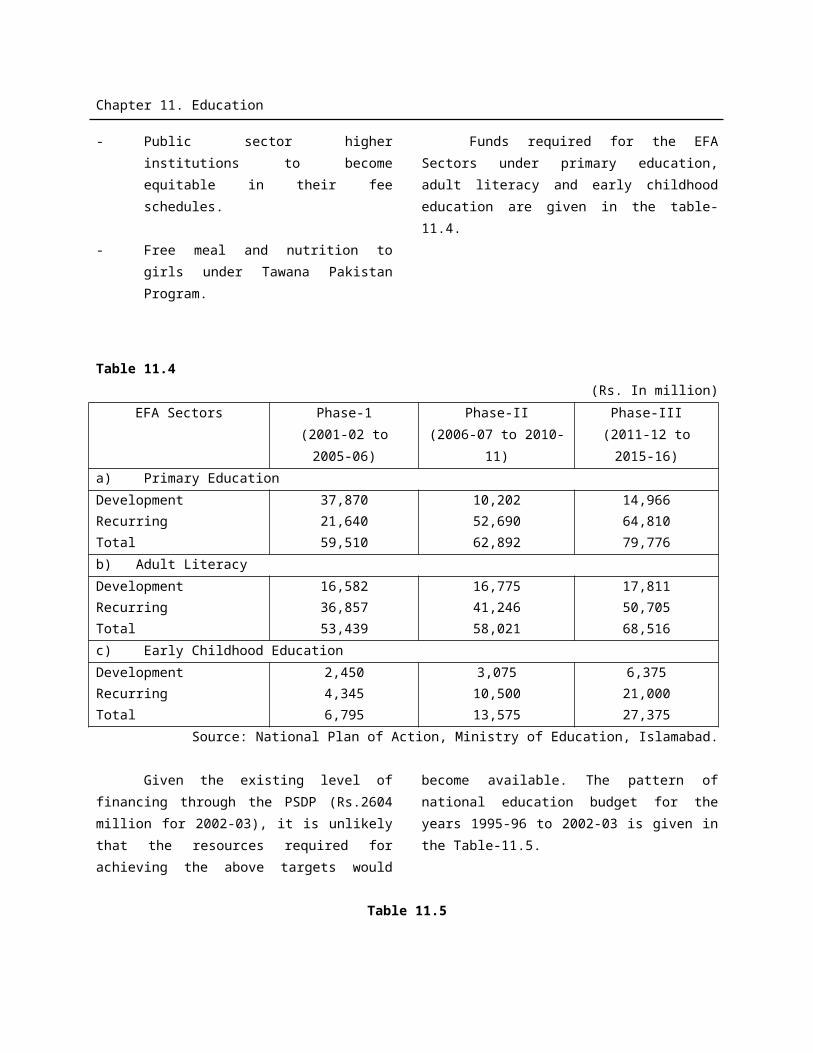
Chapter 15. Energy
1990-911991-921992-931993-941994-951995-961996-971997-981998-991999-20002000-012001-02Average(12 Years)July-March2001-022002-03 E
33.033.836.137.739.340.941.442.144.847.146.945.9
40.7
45.442.2
6.66.34.74.84.95.25.25.25.55.65.75.8
5.5
5.75.8
35.636.335.733.831.629.127.927.627.928.929.529.9
31.1
30.029.4
17.8
17.3
15.4
15.4
15.8
15.9
16.5
15.5
12.9
9.9
10.1
11.1
14.5
11.0
10.8
--0
.80
.80
.80
.90
.90
.90
.50
.50
.40
.4
0.7
0.7
0.3
6.96.27.17.47.57.98.08.68.27.97.36.9
7.5
7.211.4*
E-Estimated Source: Hydrocarbon Development Institute of Pakistan.*Including traction
Energy Supply
The annual trends of primary energy supplies and their per capita
availability, measured in tons of oil equivalent (TOE) since 1990-91 to 2002-03 are given in Table 15.8 and Fig-1& Fig-2
Table 15.8Primary Energy Supply and Per Capita Availability
Energy Supply Per CapitaYear Million TOE %Change Availability (TOE) % Change
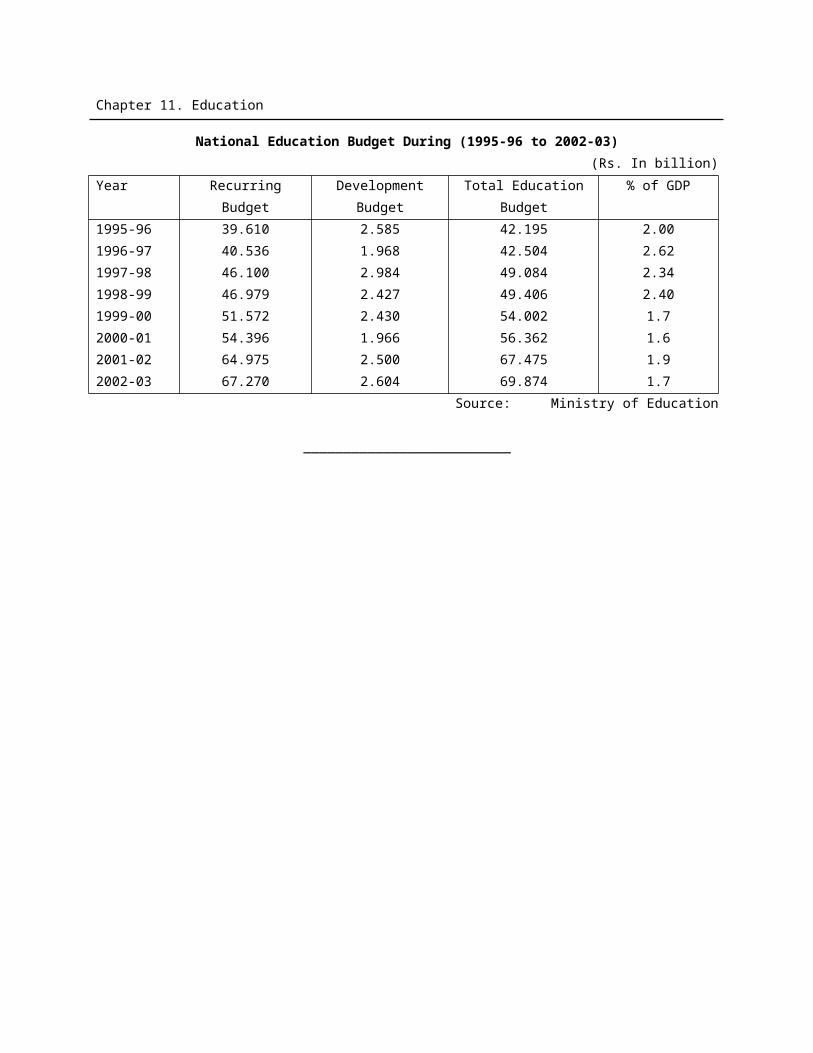
Chapter 15. Energy
1990-911991-921992-931993-941994-951995-961996-971997-981998-991999-002000-012001-02July-March2001-022002-03 E
28.46930.47532.95334.77836.06238.74638.51540.40341.72143.22344.45645.237
33.75134.412
7.08.15.53.77.4
-0.64.93.33.62.91.8
-2.0
0.2530.2640.2780.2860.2900.3040.2950.3020.3050.3090.3110.310
0.2310.231
4.45.42.91.24.9
(3.0)2.51.01.20.6
(0.4)
-0
TOE- Tons of oil equivalent Source: Hydrocarbon Development Institute of Pakistan.E:Estimated
90-91
91-92
92-93
93-94
94-95
95-96
96-97
97-98
98-99
99-00
2000-01
2001-02
25
30
35
40
45
50
Fig-1: Energy Supply (Million TOE)
90-91
91-92
92-93
93-94
94-95
95-96
96-97
97-98
98-99
99-00
2000-01
2001-02
0.25
0.26
0.27
0.28
0.29
0.3
0.31
0.32
Fig-2: Per Capita Availability (TOE)
The supply of primary energy increased from 28.469 million TOE in 1990-91 to 45.237 million TOE in 2001-02 or by 59 percent and per capita availability from 0.253 TOE to 0.310 TOE or by 22.5 percent. Because of the increase of primary energy supplies, its per capita availability recorded a rising trend over the decade of the 1990s, which greatly helped consumers meet their ever-growing annual demand for energy. The energy supplies have also increased from 33.751 million TOE in 2001-02 (July –March) to 34.412 million TOE in 2002-03 (July-March) or by
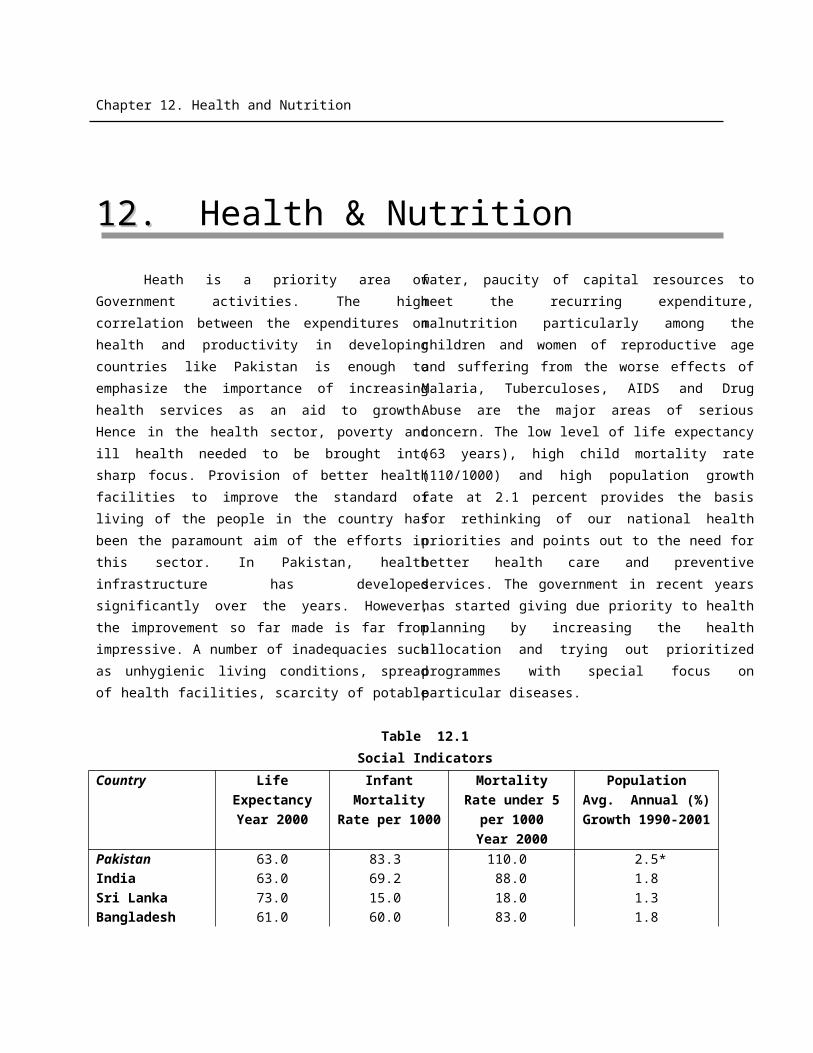
Chapter 15. Energy
2 percent, but no change in the per capita availability. The supply of primary energy by various sources of energy as well as their rates of increase are given in Table 15.9.
Table 15.9 Composition of Energy Supplies
Crude Oil Gas Petroleum Products
Coal Electricity
Year Mln. Barrels
%Chang
e
(bcf)*
%Chang
e
(Mln.T)
%Chang
e
(Mln.T)
%Chang
e
(000Gwh)(a)
%Chang
e
90-9191-9292-9393-9494-9595-9696-9797-9898-9999-0000-0101-02Jul-Mar01-0202-03P
51.752.451.351.448.252.149.850.452.653.373.675.1
58.157.1
13.31.4
-2.10.2
-6.28.1
-4.41.24.41.3
38.02.0
--1.7
518.5
550.7
583.5
624.2
628.2
666.6
697.8
700.0
744.9
818.3
857.4
923.8
690.1
724.6
4.16.26.07.00.66.14.70.36.49.94.87.7
-5.0
10.311.212.313.714.216.015.916.916.817.918.718.4
13.113.3
6.38.79.8
11.43.6
12.7-0.66.3
-0.66.54.5
-1.8
-1.5
3.94.64.34.64.14.74.44.14.44.04.14.3
3.1 3.2
8.917.9-6.57.0
-10.914.6-6.4-6.87.3
-9.12.54.9
-3.2
41.045.448.750.653.556.959.162.165.465.768.172.4
52.0 54.4
9.110.7
7.33.95.76.43.95.15.30.53.76.3
-4.6
*: Billion cubic feet Source: Hydrocarbon Development Institute of Pakistan.
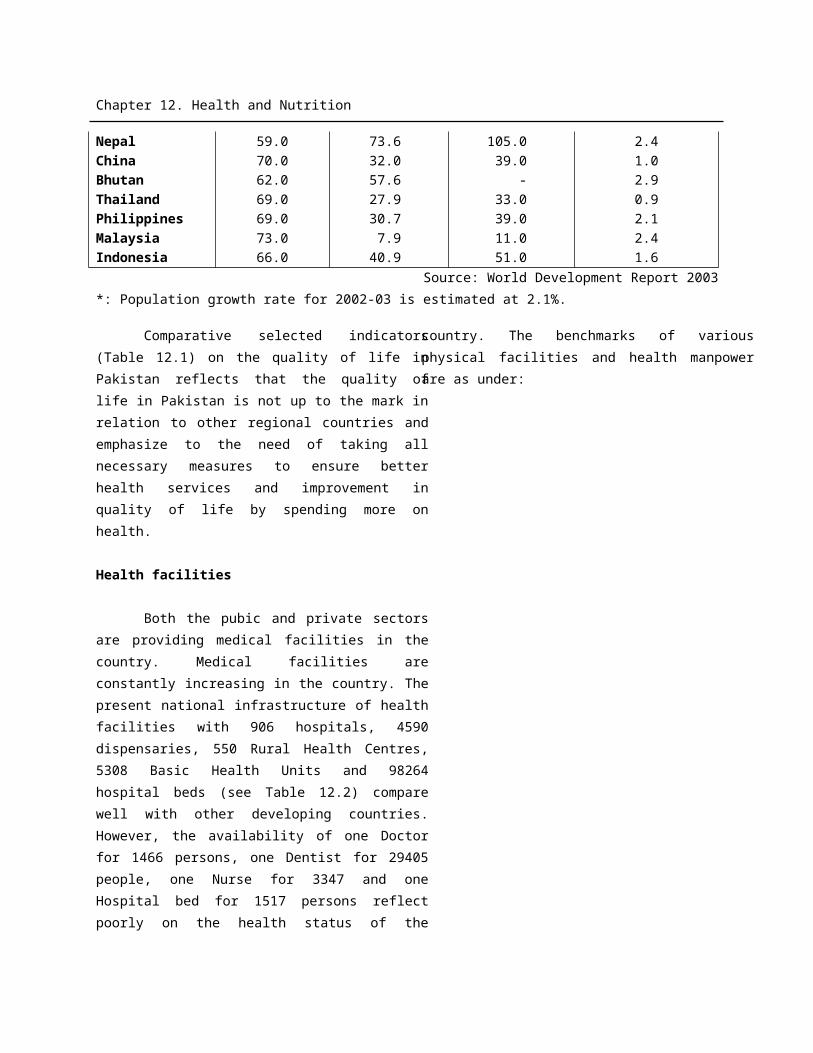
Chapter 15. Energy
a: Gega Walt hour(P)Provisional
a) Crude Oil :
The remaining recoverable reserves of crude oil as of 1st April, 2003 were estimated at 302 million barrels in the country. The average crude oil production during July-March 2002-03 was 64,907 barrels per day, as against 64,361 barrels per day during same period last year, showing an increase of 0.8 percent. During
the period under review, 22,439 (35%) barrels per day were produced in northern region and 42,466 (65%) barrels per day in southern region, as against 21,136 (33%) barrels and 43,225 (67%) barrels per day respectively, during the same period last year. Production of crude oil during July- March 2002-03 and corresponding period of the last year is given in Table 15.10.
Table 15.10Average Production of Crude Oil
(Barrels per day)Region 2001-02 July-March
2001-02July-March 2002-03
% Change
Northern Region- OGDCL- OPI- POL- PPL
Southern Region- OGDCL- BP(Pakistan)- PPL- BHP- OMV/LASMO
21,5008976129989152310
417981145129639
100566
42
21,1368823111387882412
43,2251131131172
116626
-
22,439
8281162193233214
42,466
1334128407
90554
74
6(6.1)
456
33.2
(2)18(9)
(22.4)(12)
-
Total: 63,298 64,361 64,907
0.84
Source: Ministry of Petroleum and Natural Resources.
B) Natural Gas
As of April 1st 2003, the recoverable
reserves of natural gas have been
estimated at 28.3 trillion cubic feet. The
average production of natural gas during
July-March 2002-03 was 2,648 million cubic
feet per day, as against 2,526 mmcfd
during the same period last year, showing
an increase of almost 5 percent. Main
companies currently engaged in oil and gas
production activities are OGDCL, PPL, POL,
OPI, LASMO, BHP, MGCL, BP (PAKISTAN),
OMV and TULLOW. Table 15.11 shows the
natural gas production during 2001-02, and
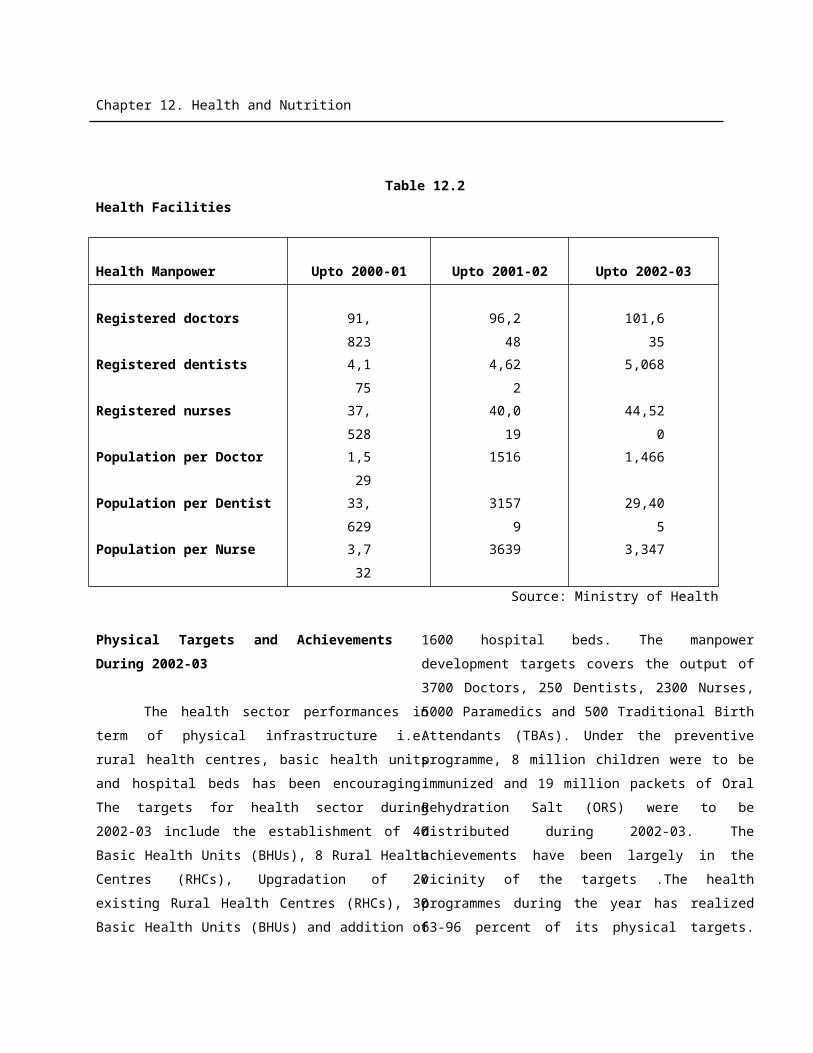
Chapter 15. Energy
July-March 2002-03 and corresponding period of last year.
Table 15.11
Average Production of Natural Gas(mmcft)
Company 2001-02 July-March 2001-02
July-March 2002-03
% Change
LASMOMGCLOGDCLOPIPOLPPLBP (Pakistan)BHPTULLOWOMV
65410733
0646
905213
923061
64411744
546
915209
942711
76427731
740
888226
8928
136
18.83.9
(1.7)40.0
(13.0)(3.0)
8.1(5.3)
3.71136.4
Total: 2,561 2,526 2,648 4.8Source: Ministry of Petroleum and Natural Resources.
c) Drilling Activities
During July-March 2002-03, altogether 52 wells have been drilled, including 13 wells of the OGDCL in the
public sector. Table 15.12 gives the drilling activities of the public and private sector companies, engaged in the exploration and development of wells, with achievements for the corresponding period of last year.
Table 15.12Drilling Activities (Achievement)
Sector 2001-02 July-March 2001-02
July-March 2002-03
% Change
Public Sector(OGDCL)
ExploratoryAppraisal/Dev
Private SectorExploratoryAppraisal/Dev
10
73
347
27
6
33
265
21
13
1201
391227
117
300(66.7)
5014028.6
Total: 44 32 52 62.5Source: Ministry of Petroleum and Natural Resources
d) Gas Infrastructure Development Plan.
As per present Government’s direction, the two gas utility companies, namely, SNGPL and SSGCL have embarked
upon gas infrastructure development projects to enhance their gas handling capacity for the transportation of 928 MMCFD gas expected to be available from the new fields. This additional available gas would be used mainly for replacement of
Chapter 15. Energy
furnace oil in power plants to save foreign exchange. These infrastructure augmentation plans of SNGPL/SSGCL are being completed in two phases, entailing huge capital outlay i.e. at an estimated cost of Rs.20,243 million. On completion of the infrastructure development project, the transmission capacity of SNGPL will increase from 1050 MMCFD to about 1500 MMCFD or by 42.9 percent and of SSGCL from 700 MMCFD to 1000 MMCFD i.e. also by 42.9 percent.
e) Liquefied Petroleum Gas (LPG)
Presently about 1000 tons/day LPG is being produced locally. There are 29 LPG companies, marketing the indigenous and imported LPG. The government is making efforts to ensure availability of domestic and imported LPG at competitive and viable prices in far flung rural areas where supply of natural gas through pipelines is not economically feasible. The government has deregulated the allocation and price of LPG with effect from 15th September 2000 with a view to keep the price at a reasonable level. f) Compressed Natural Gas (CNG)
The use of CNG in automotive vehicles is being encouraged to reduce pressure on petroleum imports and improve environment. The government intended to promote CNG in the transport sector as an alternate fuel. More than 1,052 licenses for installation of CNG stations have been issued. So far 362 stations have been established in different parts of the country. These include 358 in private and 4 in public sector. More than 300 stations are under construction in the private sector. Up to March 2003, over 300,000 vehicles have been converted on CNG as compared to 240,000 vehicles last year, showing an increase of 25 percent. The use of this
indigenous fuel will help in saving foreign exchange and make positive effects on environment by reducing pollution level. Incentives for investment in CNG business are being offered to private sector. During the period July-March 2002-03, over 150 provisional permissions/licenses for setting up CNG stations have been issued.
g) Performance of Major Oil and Gas Companies:
(i) OGDCL
Oil and Gas Development Company Limited (OGDCL) is the largest oil exploration and production (E&P) company in the Pakistan. Since inception to March 2003, the OGDCL has drilled 176 exploratory wells and 229 development wells. As of March 2003, the OGDCL is producing 21,613 barrels of oil per day, 731 million cubic feet per day of gas, 186 metric tons per day of LPG and 44 metric tons per day of sulphur. The company’s remaining recoverable reserves as of December, 2002 comprised 10.05 trillion cubic feet of gas and 145 million barrels of oil. The OGDCL’s average oil production including non-operated JV’s was 29,318 barrels of oil per day and 882 MMCFD gas. The OGDCL has implemented a number of major projects for the developments of oil and gas field including Dhodak gas field, Qadirpur gas field, Pirkoh and Uch gas fields, Nandpur and Panjpir gas fields. Since March 2002, the OGDCL has made eight oil and gas discoveries in Sindh province. Initial production testing results gave a combined flow of 2,872 barrels of oil/condensate per day and 48.3 million cubic feet per day of gas. These discoveries are being appraised to determine their full potential and will help country to save millions of dollar in
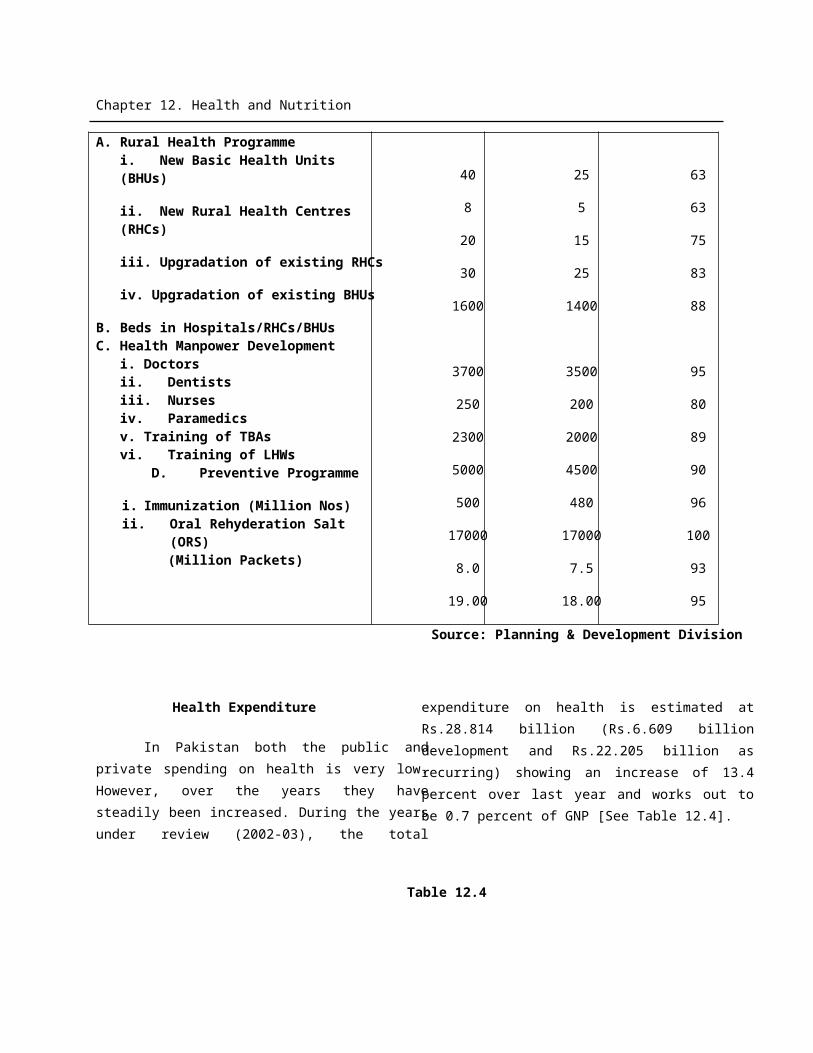
Chapter 15. Energy
foreign exchange. The physical performance of the OGDCL is given in Table-15.13:
Table 15.13OGDCL’s Physical Performance
S.No. Name of Activity
July-March 2001-02
July-March, 2002-03 % Change
1. No. of Wells spuddedi) Exploratoryii) Developmentiii) Drilling Meterage (Meter)
33
16,654
1201
43,315
300(67)160
2. Production*i) Oil (US Barrels)
ii) Gas MMcft
iii) LPG (Tonnes)
iv) Sulphur (Tonnes)
5,533,906(20,197)
206,897(755)
50,741(185)
13,533(49)
5,922,059(21,613)
200,217(731)
50,944(186)
12,083(44)
7
(3)
0.4
(11)
*Figures in brackets show daily average production. Source: Oil and Gas Development Company Ltd.
(ii) Sui Northern Gas Pipelines Limited (SNGPL)
The principal task of the Company is transmission and distribution of natural gas in Punjab, NWFP, AJK and the Federal Capital. During July-March 2002-03, the SNGPL has given connection to 108 industrial, 1,780 commercial and 75,299 domestic consumers, bringing the progressive total number of customers to 2,621 industrial, 38,054 commercial and 2.1 million domestic, respectively. The SNGPL has so far supplied gas to 141 towns in Punjab, NWFP, AJK and the Federal Capital.
(iii) Sui Southern Gas Company Limited (SSGCL)
Sui Southern Gas Company Limited (SSGCL) covers the natural gas supply to the provinces of Sindh & Balochistan. Its core activities comprise of transmission & distribution of natural gas, designing and implementing gas transmission & distribution projects and supporting cross boarder pipelines through Inter-state Gas Systems Limited while the none core business activities cover manufacturing of domestic gas meters and gas training institute. The SSGCL has so far supplied gas to 735 towns/villages of Sindh and Baluchistan. During the period July-March 2002-03, the company has connected 130 industrial, 625 commercial, and 40,984 domestic consumers, bringing the total
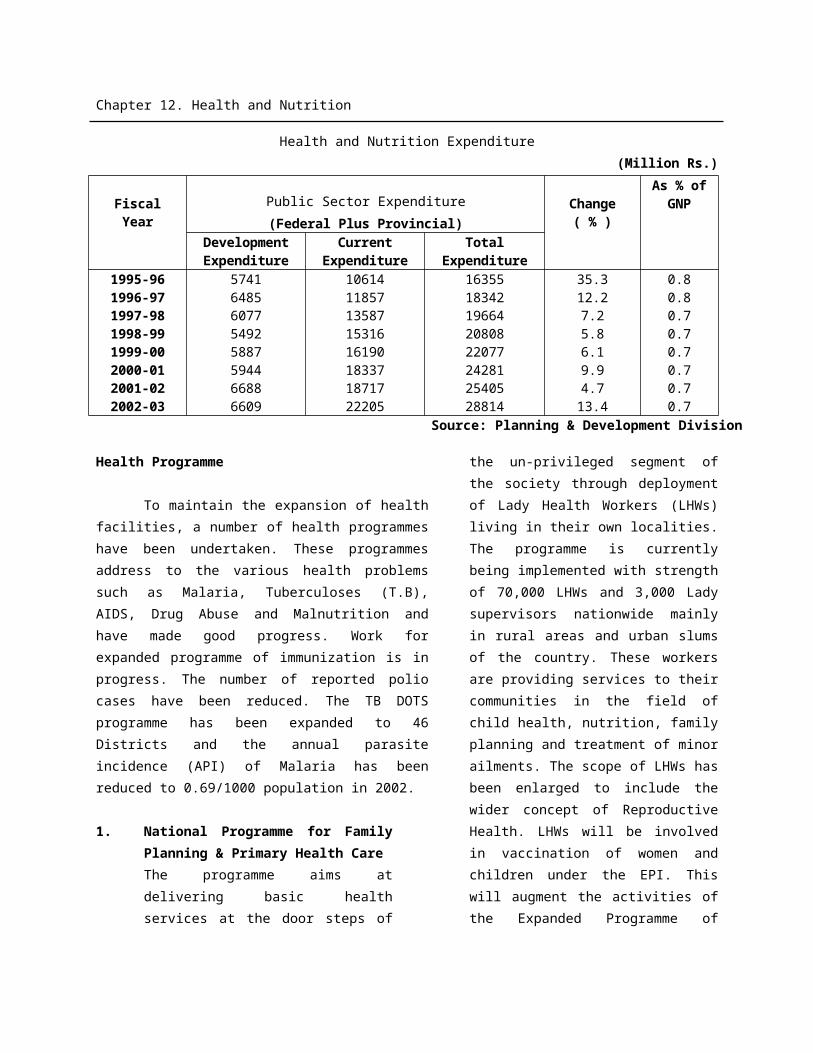
Chapter 15. Energy
number of industrial 2,360, commercial 17,493 and domestic 1.6 million respectively.
Power Sector
With the normal demand-growth rate, WAPDA will face shortages of 500 MW in the year 2005-06 and further to 5,529 MW by the year 2010. To fill the upcoming shortfall, the Government of Pakistan (GOP) has announced a Policy for Power Generation Projects 2002 for attracting
private investors. The main thrust of the policy is on the exploitation of indigenous resources. Investor’s response to the policy is encouraging. Twelve companies have already shown interest in setting up power plants, having cumulative generating capacity of 1,915 MW promising investment in the country for more then US$ 2 billion. The “Policy” has been announced with a view to meet the energy demand of the country through exploitation of indigenous resources. The salient features of the policy are presented in Box-1:
Box-1
General/Administrative:
Applicable for projects in private sector, public sector and through private-public partnership.
One Window facility to be provided at federal level by Private Power and Infrastructure Board (PPIB) for all projects above 50 MW Capacity.
Provinces to manage the investment for projects upto 50 MW capacity. For projects above 50 MW, the provinces would be the main drivers and catalysts for marketing and coordinating projects with PPIB.
Hydel projects to be implemented on Build-Own-Operate-Transfer (BOOT) and thermal projects on Build-Own-Operate (BOO) or BOOT basis.
Implementation of projects through solicited and unsolicited proposals. For hydel and indigenous fuels and renewable projects, unsolicited proposals to
be permitted from sponsors in the absence of feasibility studies for the projects.
For competitive bidding selection process will involve prequalification, issuance of Request of Proposals (RFP) bidding evaluation and award.
For solicited proposals, tariff will be determined through International competition Bidding (ICB) and for proposals on raw sites, tariff will be determined through negotiations.
For indigenous coal and gas based projects, integrated power generation proposals can be furnished.
GOP will guarantee the terms of executed agreements including payment terms.
Availability of standardized security agreements.
Financial Regime:
Chapter 15. Energy
Permission for power generation companies to issue corporate registered bonds.
Permission to issue shares at discounted prices to enable venture capitalists to be provided higher rates of return proportionate to the risk.
Permission for foreign banks to underwrite the issue of shares and bonds by the private power companies to the extent allowed under the laws of Pakistan.
Non-Residents are allowed to purchase securities issued by Pakistani companies without the State Bank of Pakistan’s permission and subject to the prescribed rules and regulations.
Abolition of 5 percent limit on investment of equity in associated undertakings. Independent rating agencies are operating in Pakistan to facilitate investors in
making informed decisions about the risk and profitability of the project company’s Bonds/ Term Finance Certificate (TFCs).
Fiscal Regime:
Customs duty at the rate of 5 percent on the import of plants and equipment not manufactured locally. No levy of sale tax on such plants, machinery and equipment, as the same will be used in production of taxable electricity.
Exemption from income tax including turnover tax and withholding tax on imports; provided that no exemption from these taxes will be available in the case of oil-fired power projects.
Exemption from Provincial and local taxes and duties. Repatriation of equity along with dividends is freely allowed subject to the
prescribed rules and regulation. Parties may raise local and foreign finance in accordance with regulations
applicable to industry in general. GOP approval may be required in accordance with such regulations.
Maximum indigenization shall be promoted in accordance with GOP policy. Non-Muslims and Non-Residents shall be exempted form payment of Zakat on
dividends paid by the Company.
Transfer of Complex: The ownership of hydel projects would be transferred to the GOP at his end of
concession period.
Hydrological Risk: For projects with a capacity above 50 MW, power purchaser will bear the risk
of availability of water.
Environmental Consideration: The environmental guidelines have to be met as per Pakistan Environmental
Chapter 15. Energy
Protection Act (PEPA).
i) Electricity Generationi) Installed Capacity
The Water and Power Development Authority (WAPDA), Karachi Electric Supply Corporation (KESC), Karachi Nuclear Power Plant (KANUPP) and Chashma Nuclear Power Plant are the four main public sector organizations, involved in power generation, transmission and distribution of electricity in the country. The Independent power projects (IPPs)__ the private sector entities are also involved in power generation.
The bulk of the installed capacity of WAPDA’s power system comprising of Northern, Upper, Lower Sindh and Quetta power markets stood at 9,694 MW, hydel 5,009 MW (51.7
percent) and thermal 4,685 MW (48.3 percent) during July-March, 2002-03, followed by the IPPs (5,816 MW) or 32.8 percent and KESC’s (1756 MW) or 9.9 percent and Karachi and Chashma Nuclear Power Plants (462 MW). The total installed capacity stood at 17728 MW during July-March 2002-03, there by registering an increase of 0.2 percent. In the total installed capacity, the share of WAPDA system has been 54.7 percent followed by the IPPs at 32.8 percent, KESC at 9.9 percent, and nuclear at 2.6 percent during the fiscal year 2002-03. Within the WAPDA system, the shares of thermal and hydel were 48.3 percent and 51.7 percent respectively. The details are given in Table 15.14:
Table 15.14
Total Installed Generation Capacity
(MW)Name of Power Company
Installed Capacity 2001-02
% Share Installed Capacity 2002-
03
% Share % Change
WAPDAHydelThermalIPPsNuclearKESC
9930500949215549
56.1 50.4* 49.6*
31.42.69.9
969450094685 581
54.7
51.7* 48.3*
32.82.69.9
(2.4)0.0
(4.8)4.800
Chapter 15. Energy
4621756
64621756
Total 17697
100 17728
100 0.2
* Share in WAPDA system Source: Hydrocarbon Development Institute of Pakistan
ii) Electricity Generation The trend in the composition of
electricity generation between hydel and thermal since 1992-93 is given in Table-15.15. It can be seen that the share of hydel has continuously declined while that of thermal has been rising constantly. The share of hydel was almost 52 percent in 1992-93 and declined to 31.3 percent in 2001-02. It has slightly increased to 34.7 percent in the first nine months of the current fiscal year. On the other hand, the share of thermal has increased from 48.2 percent to 68.7 percent during the same period but it has declined to 65.3 percent in
the first nine months of current fiscal year. It may be noted that in 1960 the share of hydel was 70 percent while that of thermal was only 30 percent. The ratio has changed to 58 percent (hydel) and 42 percent (thermal) in 1980. By 2001-02 the ratio has changed to 31.3 percent and 68.7 percent respectively. Since electricity generated through thermal is much more expensive than hydel, therefore, the massive shift to thermal has made electricity expensive in Pakistan. For reducing the cost of electricity, it is essential that we make effort to reverse the contribution of hydel and thermal in medium-to-long-run.
Table 15.15Electricity Generation
(Million kWh)Year Hydel Percentage
shareThermal Percentage
shareTotal
1992-931993-941994-951995-961996-971997-981998-991999-20002000-012001-02(July-March)2002-03
21,11119,43622,85823,20620,85822,06022,44819,28717,25919,059
15,999
51.845.849.647.541.141.441.834.329.531.3
34.7
19,68022,96023,26825,65329,92431,19931,23536,97241,19641,804
30,110
48.254.250.452.858.958.658.265.770.568.7
65.3
40,79142,39646,12648,85950,78253,25953,68356,25958.45560,863
46,109
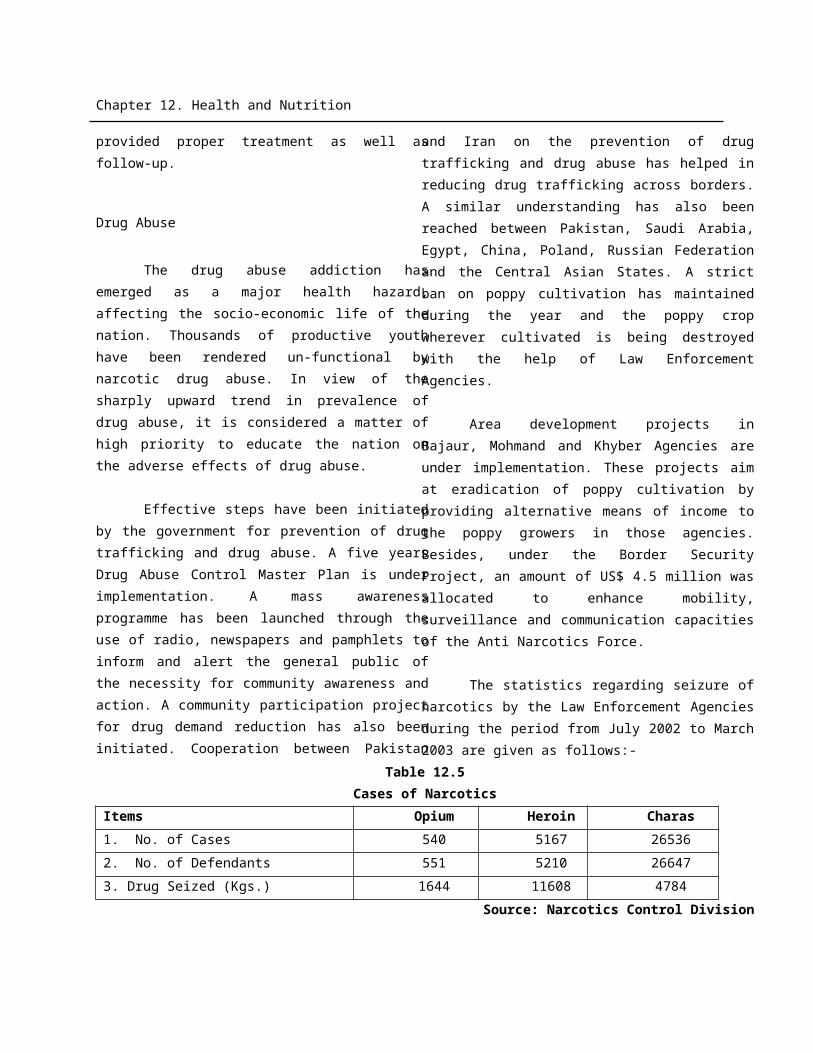
Chapter 15. Energy
Includes purchase from IPPs. Source: Water and Power Development Authority
iii) Growth in Electricity
Consumers
The number of consumers has
increased due to rapid urbanization,
extension of electricity grid supply to
un-electrified areas and rural/village
electrification. The number of
consumers has increased to 13.0
million by March, 2003, as compared to
12.7 million in 2001-02 or by 2.4
percent. Table-15.16 indicates the
annual trend since 1992-93 to 2002-
03.
Table 15.16
Consumers by Economic Groups(Million)
Year General Industrial Agriculture Total1992-931993-941994-951995-961996-671997-981998-991999-002000-012001-02
July-March2002-03
7.98.38.79.19.59.910.411.211.812.3
12.6
0.20.20.20.20.20.20.20.20.20.2
0.2
0.10.10.20.20.20.20.20.20.20.2
0.2
8.28.69.19.59.9
10.210.811.612.212.7
13.0Source: Water and Power Development Authority
Chapter 15. Energy
92-93
93-94
94-95
95-96
96-97
97-98
98-99
99-00
2000-01
2001-02
5
6
7
8
9
10
11
12
13
14
Fig-4: Total Electricity Consumers (Nos. Million)
iv) Village Electrification
The rural/village electrification programme
is an integral part of the total power sector
development in order to increase the
productive capacity and socio-economic
standard of 70 percent of population living
in the rural areas. The number of villages
electrified has increased to 73,063 by
March 2003, as per growth given in Table-
15.17 and Fig.5.
Table 15.17Village Electrification
(Number)Year Target Realization * Progressive
Total% Growth
1992-931993-941994-951995-961996-971997-981998-991999-002000-012001-02
July-March
2002-03
2,0704,5002,0005,0004,0004,0004,0001,852
--
-
4,8245,2836,2434,9572,4411,3831,2321,1091,5951,674
1502
45,64450,92757,17062,12764,56865,95167,18368,29269,88771,561
73,063
-11.612.38.73.92.11.91.62.32.4
2.1
*Including FATA Source: Water and Power Development Authority
Chapter 15. Energy
92-93
93-94
94-95
95-96
96-97
97-98
98-99
99-00
2000-01
2001-02
0
10
20
30
40
50
60
70
80
45.6
50.9
57.2
62.164.6 66 67.2 68.3 69.9 71.6
Fig.5 Village Electrification (000 Nos). v) Electricity consumption by Economic Groups
The sectoral consumption of electricity by economic groups identifies the domestic group as the largest consumer of electricity during July-March 2002-03 by accounting 44 percent, followed by industrial (28.8 percent), agriculture (12.7 percent ), bulk supply (9.2 percent), commercial (5.3 percent) and traction (0.02 percent). Table 15.18 and Fig-6 shows electricity consumption by economic groups since 1992-93 to 2002-03.
Table 15.18
Electricity Consumption by Economic Groups(% Share)
Year Domestic
Commercial
Industrial Agriculture Bulk Supply & Public Lighting
Traction
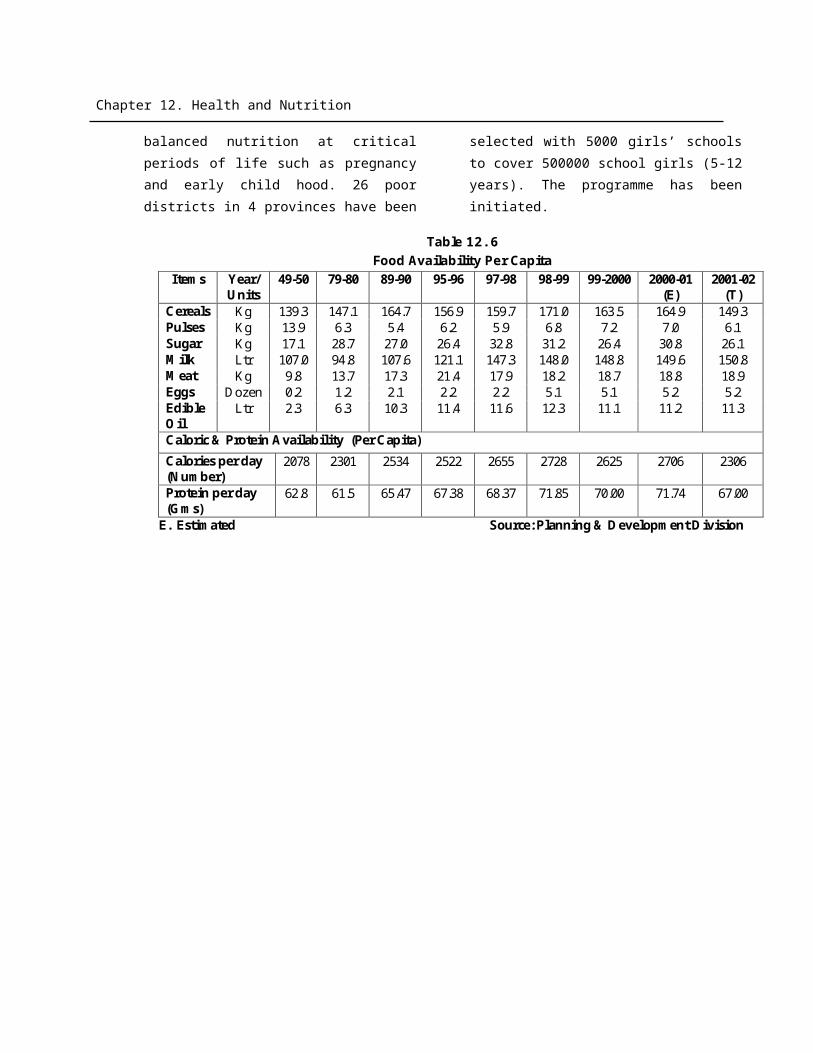
Chapter 15. Energy
1992-931993-941994-951995-961996-971997-981998-991999-002000-012001-02July- March2002-03
35.937.238.440.840.541.543.646.446.145.5
44.0
4.24.14.34.64.64.54.74.94.95.1
5.3
34.932.830.328.726.326.025.626.327.128.0
28.8
17.917.917.818.418.217.514.311.011.312.3
12.7
7.17.99.37.4
10.410.511.811.311.3
9.2
9.2
0.10.10.10.10.1
0.040.040.040.040.03
0.02
Source: Water and Power Development Authority.vi) Power Losses
Despite considerable efforts, the power losses have not been reduced appreciably. The WAPDA has invoked vigorous technical and administrative measures to improve operational and
management efficiency to reduce power
losses and thefts. The transmission and
distribution (T & D) losses were 25.8 percent during 2001-02 but slightly declined to 25.6 percent during the first nine months of current financial year . Table 15.19 shows the annual trend of power losses since 1992-93 to 2002-03.
Table 15.19
WAPDA Power Losses
(Percent)Year Auxiliary
ConsumptionT&D Losses* Total
Fig-6 Electricity Consumption by Economic Groups (% Share)
Domestic45.5%
Commercial5.1%
Industrial28.0%
Agriculture12.3%
Bulk-Sup.& Pub. Lighting9.2%
Domestic35.9%
Industrial34.9%
Agriculture17.9%
Bulk Supply & Public Lighting7.1%
1992-932001-02
Chapter 15. Energy
1992-931993-941994-951995-961996-971997-981998-991999-002000-012001-02July- March2002-03
2.32.62.62.92.42.01.72.12.02.2
2.1
21.121.621.421.521.723.925.825.123.823.6
23.5
23.424.224.024.424.125.927.527.225.825.8
25.6* T&D = Transmission and Distribution Source: Water and Power Development Authority
vii) Power Development Programme
The optimal utilization of hydroelectric potential is accorded priority in the overall power development programme. The projects which will be constructed under the Vision-2025 Programme are Golan Gol (106MW), Khan Khwar (72 MW), Allai Khwar (121 MW), Duber Khwar (130 MW) and Jinnah (96 MW). These projects are planned to be completed by 2008. In order to meet the power demand in the coming years, the WAPDA has proposed to install two high efficiency combined cycle power plants on natural gas of 450 MW each at Faisalabad and Balloki, planned to be completed in 2006 and 2007, respectively.
h) Karachi Electric Supply Corporation Ltd. (KESC)
The installed capacity of KESC's various generating stations remained at 1,756 MW during July-March of the current financial year, 2002-03. The policy for power projects 2002-03 has recently been announced by the Government. The KESC is
pursuing to seek permission to undertake power projects, so that the increasing gap between demand and supply could be minimized. During first nine months of current financial year 2002-03, the KESC generated 6,381 million kWh from its own sources, as compared 6,448 million kWh in the same period last year, showing a decline of 1 percent due to carrying out of major overhauling/rehabilitation works on some of the KESC's units. The total energy made available to KESC system, after taking into account the imports from various agencies, including auxiliary consumption, stood at 9,005 million kWh during July-March 2002-03, as against 8,664 million kWh in the same period last year, thus registering a growth of 4 percent. The Bin Qasim Power Station, the largest power plant of KESC, has been converted to gas. As a result of this conversion, 1,760 million kWh were generated on gas at the Bin Qasim Power Station, compared to 1,275 million kWh in the same period last year, showing an increase of 38 percent. The Tapal Energy Limited and Gul Ahmed Energy limited are the two independent power projects (IPPs) which are hooked to the KESC System, with an aggregate capacity of 262.17 MW. The energy
Chapter 15. Energy
contributed by these two IPPs, during the period under review, was 1,232 million kWh, representing more than 14 percent of the total energy supplied to the KESC system. The KESC’s T&D losses increased marginally to 39.8 percent from 39.5 percent in the same period last year. The KESC’s income has, however, increased from Rs. 28.9 billion in 2000-01 to Rs. 30.7 billion in 2001-02, registering an increase of 6.6 percent but its expenditure has also recorded an increase of 7.6 percent in the same period.
i). Nuclear Power Energy
Pakistan Atomic Energy Commission (PAEC) made a beginning in the field of nuclear power production in 1971 by establishing a 137 MW Karachi Nuclear Power Plant (KANUPP). During July-March 2002-03, the KANUPP has generated 235.9 million kWh of electricity, raising the life time generation to 10.7 billion kWh. A second nuclear power plant has been built at Chashma (CHASNUPP) having a gross capacity of 325 MW, generated 885 million kWh of electricity during July-March 2002-03. Both the power plants are working according to safety standards set by the Pakistan Nuclear Regulatory Authority. The successful functioning of KANUPP and CHASNUPP has given the country great confidence and a sense of direction to plan more nuclear units in future in a manner that would progressively lead to a high degree of self-reliance. D. COAL
The share of coal in the overall commercial energy requirements of the country at the time of Pakistan’s independence was about 60 percent but
with the advent of natural gas in 1952, the utilization had gradually reduced. Currently, the share of coal in the overall energy mix is less than 5 percent. Owing to discovery of large coal field having 175 billion tons resource potential at Thar, the government has decided to enhance the share of coal in the overall energy mix from 5 percent to 20 percent by the end of decade. With the pragmatic government policies, the cement industry is in the process of switching over the indigenous coal from furnace oil that would save 50 percent foreign exchange being spent on import of coal. It would also generate demand of about 2.5 million tons coal/annum in the country by 2005. Almost all the energy consumed in the cement industry is now being generated by a mix of imported and indigenous coal.
E. NATIONAL ELECTRIC POWER REGULATORY AUTHORITY (NEPRA)
NEPRA regulates in conformance with the objectives of providing safe, reliable, efficient and affordable electric power to the country. During July-March 2002-03, the NEPRA granted generation licence to three WAPDA successor generation companies. The KESC was also granted a generation licence. The Transmission License to National Transmission and Dispatch Company (NTDC) was granted on December 31, 2002. This licence also provides a road map for the transitional phases of the competitive market structure. The NEPRA has also determined a Multi Year Tariff formula for the KESC which is a forward looking rate adjustment mechanism, designed to provide reasonable return to the investors in privatized KESC while the excessive returns to be adjusted in tariff reductions in favour of consumers. Thus the objective is
Chapter 15. Energy
to induce the KESC to achieve efficiencies in delivery and production of electric power. Moreover during July - March 2002-03, the NEPRA has determined one WAPDA related and one KESC related tariff petition. In addition the NEPRA has also determined
three WAPDA related and one KESC related rate of adjustments under Automatic Tariff Adjustment formula (ATA). The NEPRA has established a Consumer Affairs Division to address the complaints, lodged by the consumers against utility companies.
____________________________
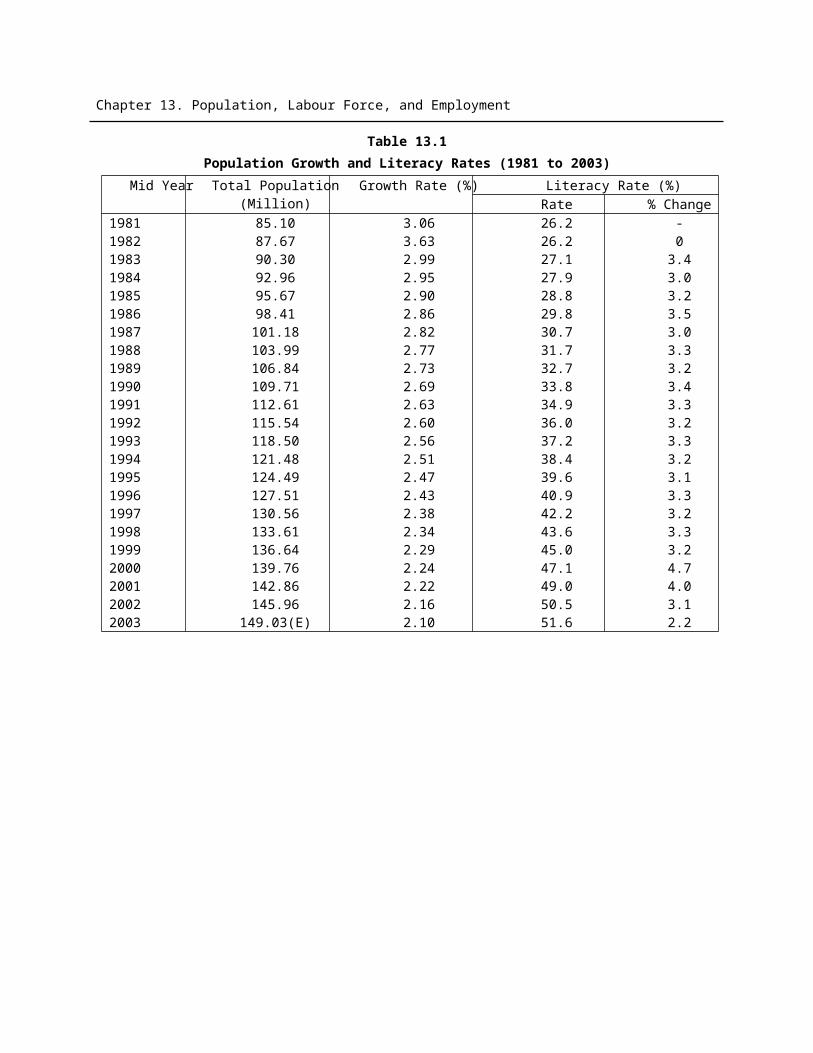
Chapter 16. Environment and Housing
16. Environment and Housing
I. Environment
The efforts to address the environmental concerns at policy, planning, and development level which gained momentum with the establishment of a high level inter-ministerial and multi-stakeholder committee, called Pakistan Environment Protection Council (PEPC) under the chairpersonship of the President of Pakistan in 1993, remained active during the fiscal year 2002-03. During the last decade, Pakistan has made diligent progress in institutional strengthening and capacity building of policy and planning institutions, environmental awareness, and the promulgation of environmental legislation, National Environment Quality Standards (NEQS), and the establishment of environmental tribunals. The energy sector introduced lead-free petrol and since July 2002, all refineries in the country are supplying lead-free petrol and promoting clean fuels including CNG. However, rehabilitation and improvement of biophysical environment and enforcement of environmental legislation remained rather slow.
The PEPC has approved the National Environment Action Plan (NEAP) for improving the state of environment in Pakistan. The major objectives of NEAP are to achieve a healthy environment, and sustainable livelihood by improving the quality of air, water and land with civil society cooperation. In this regard, Initial
Environmental Examination (IEE) and Environment Impact Assessment (EIA) have also been made mandatory for public sector development projects. To implement NEAP, the Government of Pakistan signed a NEAP Support Program (NEAP-SP) with the UNDP in October 2001. Under NEAP-SP, the Ministry of Environment, Local Government and Rural Development is planning to undertake projects in the following six sub-programs over the next five years:i. Policy coordination and
environmental governance;ii. Pollution control;iii. Ecosystems management and
natural resources conservation;iv. Energy conservation and
renewables;v. Dry land management and water
conservation;vi. Grassroots initiatives.
During the fiscal year 2002-03, institutional arrangements to implement NEAP-SP were carried out, including the constitution of the Programme Steering Committee (PSC), establishment of the Programme Management and Implementation Unit (PMIU), as well as constitution of various Sub-Programme Implementation Committees (SPICs) etc. To achieve the objectives of the NEAP, the representatives of non-governmental sector, civil society organizations, and environmental advocacy groups are included in SPICs.
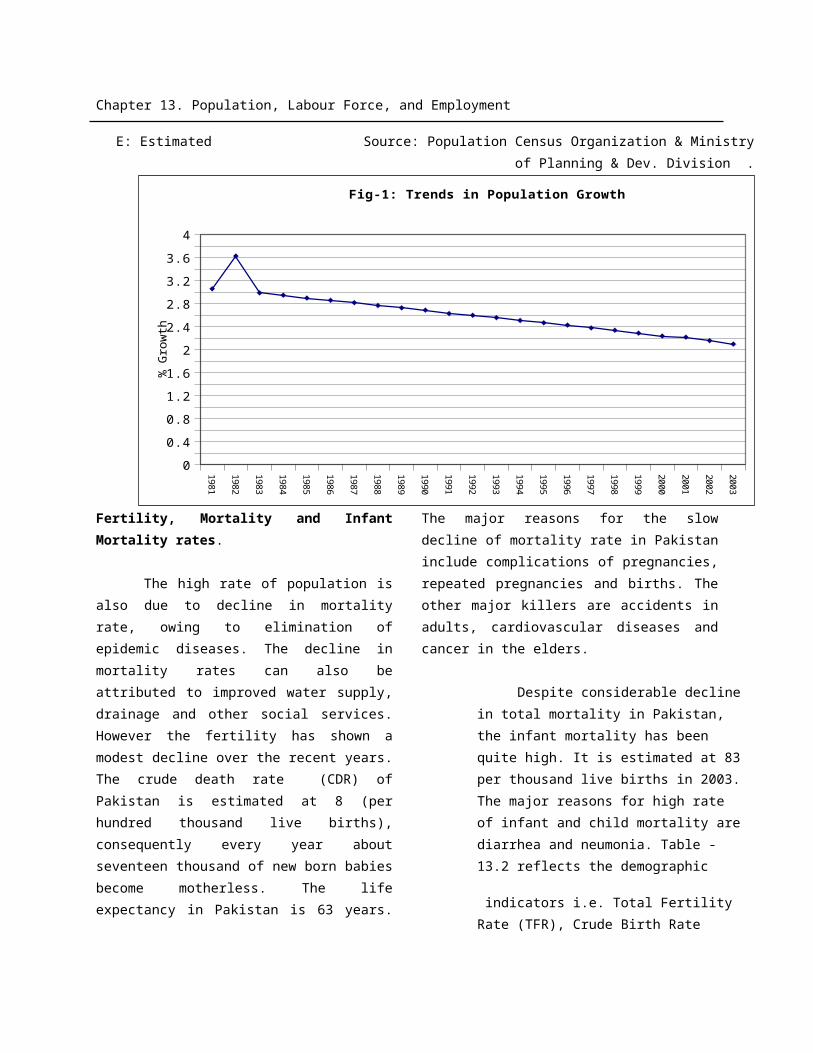
Chapter 16. Environment and Housing
Pakistan has also revived its environmental commitments during the World Summit on Sustainable Development (WSSD: August 26 to September 4, 2002). The country assessment report for WSSD focused on the protection of atmosphere; integrated approach to the planning and management of land resources; combating deforestation and drought; sustainable mountain development; promoting sustainable agriculture; conservation of biological diversity; environmentally sound management of biotechnology and protection of the oceans. NEAP can be one of the means to implement the WSSD commitments. To be consistent with National Environmental Action Plan (NEAP), pollution in air, water and land are discussed in the ensuing pages.
Impact of Pollutiona. Air
Air pollution levels in Pakistan’s most populated cities are among the highest in the world and climbing, causing serious health impacts. The levels of ambient particulates –smoke particles and dust, which cause respiratory disease – are generally twice the world average and more than five times as high as in industrial countries and in Latin America (See Asian Environmental Outlook, 2001). Auto and industrial emissions are the main source of dirty air. The average compound growth of vehicles in Pakistan is about 12% per annum. Over the last two decades, the total number of motor vehicles on the road has jumped from 0.8 million to 4.0 million showing an overall increase of more than 500 % (WSSD Country Assessment Report, MOE 2002). Motorcycles and rickshaws, due to their two-stroke engines, are the most inefficient in burning fuel and contribute most emissions. Fortunately, the rickshaws have only tripled in numbers, but
motorcycles and scooters have gone up more than seven fold in the last two decades (Table 16.1). However, 28.7% of the total vehicles on the road are running on CNG. With improved design of new car engines and conversion of 300,000 vehicles to CNG, pollution load in many urban centers has started declining.
Table 16.1Index of Motor Vehicles on the Road
(1980=100)
Vehicle TypeMotor
Year Cycles/Scooters
Rickshaws
Total
1981 113 105 1111982 131 108 1241983 147 113 1381984 180 116 1671985 202 118 1891986 228 120 2111987 243 121 2271988 261 123 2451989 284 126 2701990 311 129 2921991 335 132 3101992 397 145 3611993 434 158 3891994 467 167 4141995 506 176 4451996 549 185 4771997 598 195 5131998 641 259 5441999 691 284 5812000 735 292 6272001 744 295 6352002 (E) 755 299 644
Source: Sustainable Development Policy Institute (SDPI).Note: Base year numbers of motorcycles,
scooters, rickshaws and total vehicles on the road in thousands were 287.6, 32.0 and 682.2
(E) Estimated.
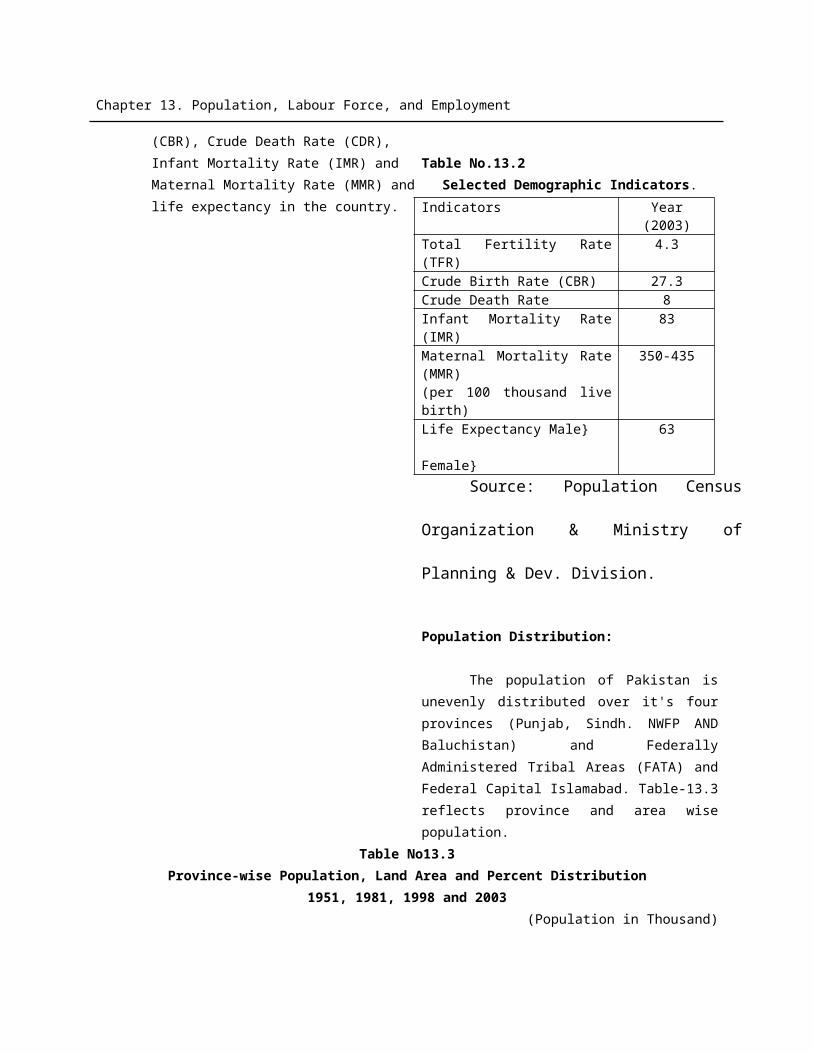
Chapter 16. Environment and Housing
The combustion of coal is another main contributor of air pollution. The three main uses of coal are power, brick-kilns and domestic. Since 1998-99, coal use has decreased gradually for all the three above-mentioned purposes, which is a healthy sign. However, coal is being replaced by natural gas that should be used in a sustainable manner and the focus should be to explore renewable energy sources. As indicated in Table-16.2, the coal consumption in the power sector was steady from 1991-92 to 1994-95 but it increased by almost ten fold in 1995-96 due to the ten-fold increase in the use of coal for thermal electricity generation. However, over the last four years, the use of coal in power sector is gradually decreasing. Likewise, for domestic consumption, it increased by 211 percent in 1996-97 over 1995-96 and since then there is a considerable reduction (almost eight time reduction) in its usage for domestic purposes.
Moreover, run-offs from chemical insecticides, fertilizers and solid wastes generated in urban and rural areas are other important source of environmental pollution. A study of the Ministry of Environment estimated that 47,920 tonnes of waste are generated daily and only 53.6 percent are collected while the rest lies around. Even the waste collection system and dumping sites are inadequate.Table 16.2
Index of Consumption of indigenous coal
by sector (1990-91=100)
Year Sector
Power Brick kilns Domestic
1991-921992-931993-941994-951995-96
160190177165
1,621
101106115
99107
18085878582
1996-971997-981998-991999-002000-012001-02 (E)
1,4301,4081,6881,415
837773
10593
101939570
2555334262626
Source: Sustainable Development Policy Institute (SDPI).E: Estimated.Note: Base Year Consumption value was
24,603; 3,025,520; and 3785 tonnes for power brick-kilns & domestic respectively.
A study by the Pakistan Medical Association indicates that the growth in traffic and dirty fuels have already had an adverse impact. In Pakistan, sulphur in diesel and furnace oil is 1 percent and 3 percent as compared to 0.05 — 0.5 and 0.5 — 1.0 percent for other countries of the region, respectively. The ministry of Petroleum and Natural Resources has planned to phase out sulphur from diesel by first introducing the sulphur content from 0.5% to 0.05%.
According to WHO guidelines, the amount of sulphur dioxide (SO2), carbon monoxide (CO) and Ozone (O3) in the atmosphere are well below danger levels. However, the particulate matter in the atmosphere is well above safety levels across all the major industrial cities in the Punjab. Table–16.3 shows the rapid pace of increase in air emissions over two decades between 1977-78 and 1997-98 across the major commodity producing sectors. The average increase in sulphur dioxide (SO2) across all the sectors was twenty-three fold over these two decades. Similarly, nitrogen oxides (NOx) increased twenty-five fold in the power sector and carbon dioxide (CO2)
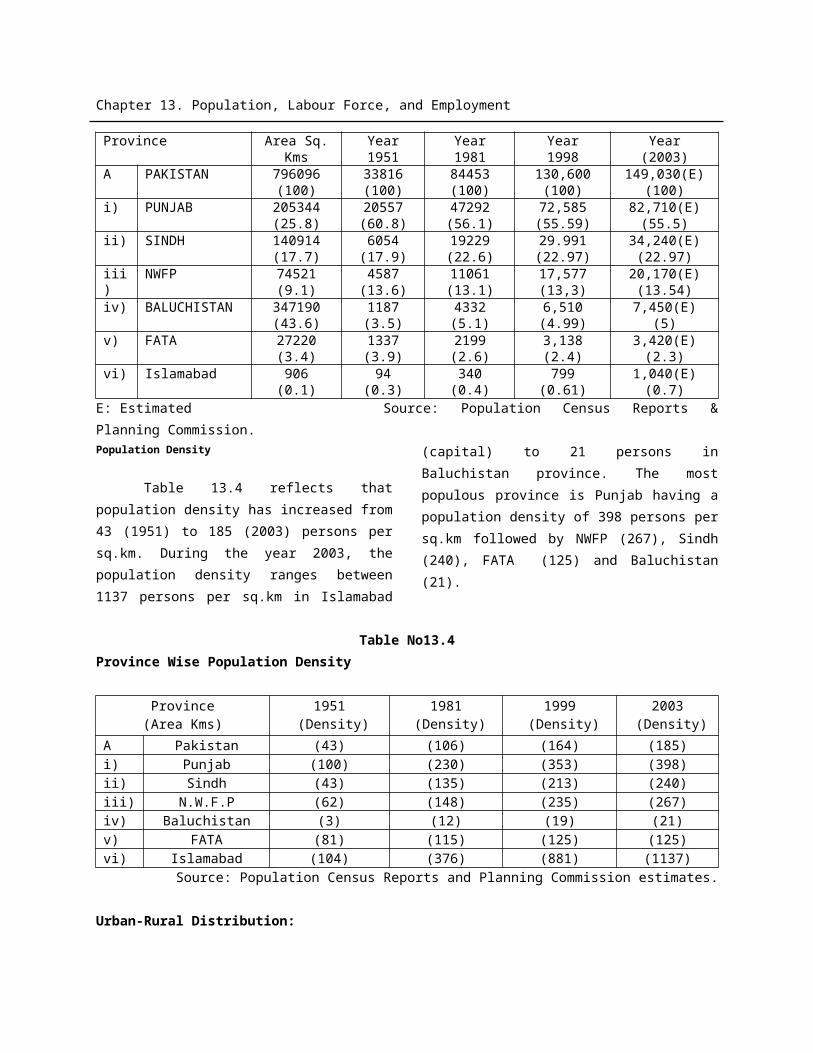
Chapter 16. Environment and Housing
increased an average of four fold across all the sectors.
b. Water
Safe fresh water supplies are at risk in many areas of Pakistan. Pakistan exceeds the threshold of “high water-stress” conditions, which occur when the ratio of use to availability exceeds 40 percent (AEO,
2001). Various estimates have been made over the years in connection with water quality. The National Environmental Quality Standards (NEQS) are used as a reference point to compare how the average quality of water fares on various parameters. On most counts (including temperature, pH content, total dissolved solids and biological Oxygen demand), the water is safe.
Table 16.3Estimated Air Pollutants from various economic sectors
Sector 1977-78 1997-98CO2 SO2 NOx CO2 SO2 NOx
IndustryTransportPowerDomesticAgricultureCommercial
1230870683640
16601845
1726
1952
455
11
N.AN.A3
N.AN.AN.A
53429189875306239098
63684261
982105996
404025
N.AN.A76N.AN.AN.A
N.A Not applicable Source: Sustainable Development Policy InstituteCO2 Carbon dioxideSO2 Sulphur dioxideNOx Nitrogen Oxides
However, in terms of total suspended solids (TSS), the counts are much above the NEQS across the board and for chemical oxygen demand (COD), they are above the NEQS for Ravi and the Hadyara Drain. In terms of fecal coliform, for which traces should be zero in drinking water, the actual presence is millions of times greater than acceptable levels. Water pollution has three main sources: bacterial and organic liquids and solids from domestic sewage; toxic metals, organic, acidic, and other polluting industrial discharges; and agro-chemical pollution in the form of fertilizers and pesticides run-off from agricultural lands. The irrigation run-off feeds into surface water and also seeps into sub-soil waters. As crops do not utilize all the chemicals, tubewells and pumps draw this up in turn as source of drinking water. The growing incidence of salinity also
contributes to the deteriorating quality of ground water, with excessive amounts of salt in the water rendering it impotable. Untreated industrial effluents and untreated disposal of solid wastes intensify the problem.
A study conducted by the Sindh Environmental Protection Agency (EPA) indicates that the industrial pollution levels are higher for major industries in Pakistan, including chemical, tanneries, textile, sugar, fertilizer and oil and ghee. The effluents are way above than NEQS on all account including Biological Oxygen Demand (BOD), Chemical Oxygen Demand (COD), Total Suspended Solids (TSS) and Total Dissolved Solids (TDS). Industrial pollution levels and National Environmental Quality Standards are detailed in Table- 16.4.
Chapter 16. Environment and Housing
Table 16.4Industrial Pollution level
BOD(mg/I.)
COD(mg/I.)
TSS(mg/Tj)
TDS(mg/I.)
ChemicalTanneriesTextileSugarFertilizerOil and ghee
1400-9800800-1680800-8500100-1100400-610460-1470
2300-186401020-2367
1610-16500200-1896860-1650
1260-3280
950298190028509720576
380009104968017300
-15462
NEQS 80 150 150 3500 Source: Sustainable Development Policy
Institute BOD =Biological Oxygen DemandCOD = Chemical Oxygen DemandTSS = Total Suspended SolidsTDS = Total Dissolved Solidsc. Land
Pakistan is one of more than 100 countries of the world affected by desertification, which is resulting in environmental degradation, loss of soil fertility, biodiversity and reduction in land productivity. Pakistan comprises 79.61 million hectare (ha) of land, of which 59.45 million has been surveyed. Of the total reported area, approximately 22.15 million (ha) is total cropped area, 24.36 million (ha) is not available for cultivation, while 9.15 million (ha) is culturable waste. The cropped area registered about 19 percent increase from 1980-81 to 1997-98, i.e., about one percent each year, while it decreased from 23.04 million hectares in 1997-98 to 22.15 million ha in 2001-2002. The recent trends indicate that Pakistan is approaching its physical limits, resulting in the indiscriminate use of chemical fertilizers and pesticides to grow more out of already degrading land. The trend to sow the cultivatable area more than once is increasing, and area sown more than once increased from 5.71 million hectare in 1990-91 to 6.71 million hectares in 2001-02 indicating an increase of 17.5 percent.
The impact of land degradation varies among different geographical regions of Pakistan. North mountains are the major source of water for country’s two major reservoirs: Tarbela and Mangla Dams. However, due to heavy soil erosion, these reservoirs are silting up, thus reducing the capacity of power generation and availability of irrigation water. Barani lands are subject to heavy soil erosion, primarily due to improper land use by crop cultivation, livestock grazing, and illegal removal of vegetation cover. Deserts have acute problem of shifting sand dunes and salinity. The irrigated areas are infected with twin menace of water logging and salinity. Underground water resources in western dry mountains of Baluchistan are shrinking due to overexploitation of the meager quantity of water for horticulture and crop cultivation. The arid coastal strips and mangrove areas are under increased environmental stress from reduced fresh water flows, sewage and industrial pollution and over exploitation of other natural resources.
Forests are the lungs of any country. Forests play an important role in land conservation, regulated flow of water for irrigation and power
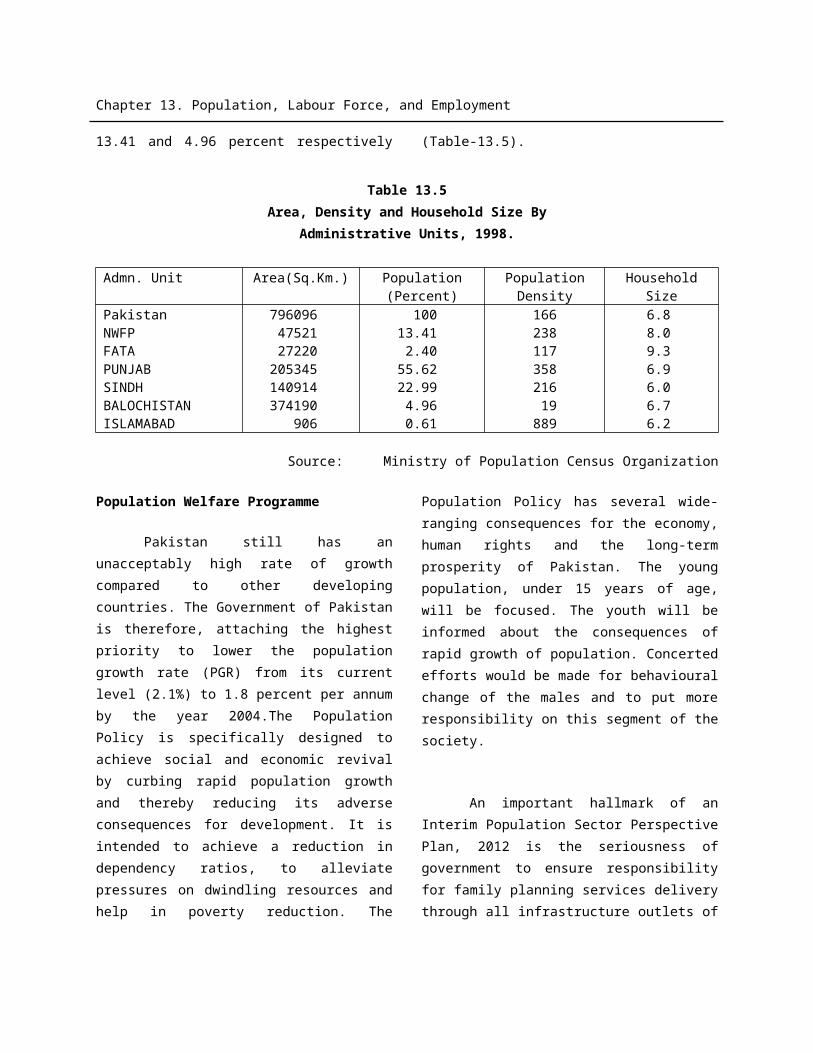
Chapter 16. Environment and Housing
generation, reduction of sedimentation in water channels and reservoirs and maintenance of ecological balance. The area under forests has increased steadily since 1990-91 with little fluctuations, however the overall increase in the forests area in 2001-02 is higher by 10.1 percent over 1990-91 (Table-16.5). Although Pakistan has limited area under forest cover, yet 11.25 percent of the total land area is protected as national parks, wild life sanctuaries or game reserves while a rough percentage recommended by the experts is 12 percent. It has been pointed out in the report of Sustainable Development Policy Institute that Baluchistan and NWFP, which require more protection, have only 6 percent of their land protected while Punjab has 16 percent protection. For Pakistan, currently the real issue is not the amount of land demarcated as a protected area but the poor management of the areas already protected.
Table 16.5
Year Forest Area(Ml.
Hectares)
% Increase/Decrease
1990-911991-921992-931993-941994-951995-961996-971997-981998-991999-002000-012001-02
3.46
3.47
3.48
3.45
3.60
3.61
3.58
3.60
3.60
-0.30.3
-0.94.30.3
-0.80.6
-5.0
-0.31.1
3.78
3.77
3.81% Increase in 2001-02 over 1990-91
10.1 -
Source:Ministry of Food, Agriculture and Livestock.Status of Pakistan in global and regional partnership on environment
To join international efforts for conservation of natural resources, Pakistan has become signatory to many international Conventions/Protocols/Agreements. Pakistan as signatory to these international protocols and conventions, is meeting various obligations with the technical and financial assistance of developed countries. Under the Montreal Protocol, the Ozone Depleting Substances (ODS) based industry such as Chloro Floro Carbons (CFC)) under renovation and consumption of ODS will be eventually phased out by the year 2005. Government has imposed a ban on the import of used ODS-based equipment, and maximum duties are levied on import of new CFC based equipment.
Pakistan is also responding to UN Framework Convention on Climate Change by preparing national Green Houses Gases (GHG) inventories. Several projects aiming at “mitigation of climate change” and “adaptation to changing climate” are in the pipeline, which will be implemented with the technical and financial assistance of developed country parties to the Convention. Some initiatives have been launched under the UN Convention on Biological Diversity and UN Convention on Desertification such as preparation of
Chapter 16. Environment and Housing
Biodiversity Action Plan (BAP) and Desertification Combat Action Plan. However, the pace of implementing international obligations is not up to the mark, which is largely due to lack of in-country capacity and partial fulfillment of commitments by the developed countries.
Environment Sector Programs/Projects
During the fiscal year 2002-03, major projects are under implementation in the following programs areas;i. Institutional Strengthening, Capacity Building, Mass Awareness
Institutional strengthening is an on-going process and has been made an important component of all development projects in environment sector. Capacity building of the project implementing agencies and other functionaries involved in policymaking, planning, law enforcement, and monitoring of environmental activities has been an important area of investment by different donors. Specific PSDP project include “Strengthening of Forestry Wing at the Federal Level for sustained monitoring of the implementation of Forestry Sector Master Plan”, for which an amount of Rs.11.0 million was allocated during 2002-03. The NGOs and other environmental pressure groups have largely undertaken mass awareness campaigns.
ii. Forestry and Watershed Management
A mega project in forestry sector, named “Rachna Doab Afforestation Project” started in July 1995 at a cost of Rs.485.4 million. During 2002-03, Rs.60.0 million were allocated to conclude the ongoing activities towards achievements of afforestation targets. Tarbella Watershed
Management Project sponsored by Ministry of Environment is an on-going project at a total cost of Rs.689.05 million, to which Rs.34.2 million were allocated. The main objectives of the project include; soil and water conservation, extension of forests, appropriate land use, improvement of environment and uplift of socio-economic conditions of people i.e., poverty alleviation. During the fiscal year 2002-03, 14 acres of nurseries have been raised, 2576 acres planted, 7086 acres afforestation maintained and 189 training/exchange visits have been conducted with the total expenditure of Rs.32.9 million till March, 2003. Ministry of Water & Power is implementing another watershed project named “Mangla Watershed Management Project” at a total cost of Rs.168.99 million. During the current fiscal year, Rs.30.0 million were allocated to this project and about 3640 acres/avenue miles of planting/afforestation have been completed with the total expenditure of Rs.18.2 million until March, 2003.
iii.Fuel Efficiency in Road Transport
The Ministry of
Environment/ENERCON is implementing
“Fuel Efficiency in Road Transport Sector
(FERTS) Project at a total cost Rs.230.4
million. The UNDP is providing grant
assistance worth Rs.220.5 million to this
project. The project aims at improving fuel
efficiency and curtailing noxious emissions
from Transport Sector through digital tuning
of gasoline and diesel vehicles. A total of 15
digital tune-up stations have been
established in four provinces. During 2002-
03, Rs.15.81 million were allocated to the
Fuel Efficiency in Road Transport. The
Revolving Loan Fund worth US$ 3.0 million
has been established for financing purchase
Chapter 16. Environment and Housing
of tune-up equipment. Until March 2003,
Rs.8.11 million have been utilized against
PSDP 2002-03.
iv.Industrial Efficiency and
Environmental Management Sector
Development Program
The project is designed to undertake
a comprehensive study and analysis of
environmental impact and issues in the
industrial sector including status of National
Environment Quality Standards (NEQS)
implementation. The project was approved
by the CDWP in September 2000 at a
capital cost of Rs.52.00 million to be
financed by the Technical Assistance of the
Asian Development Bank (ADB).
The project has not yet started
because ADB has not released the funds.
However, an amount of Rs.12.00 million in
foreign exchange has been allocated in the
PSDP 2002-03.
II. Housing Sector
Housing is one of the fundamental
human needs as every family requires a
roof. Provision of house to every family has
become a major issue as a result of rapid
population growth and massive rural to
urban migration. According to the 1998
census, about 32.5% of Pakistan’s
population lives in metropolitan or urban
areas, which means that every third
Pakistani is living in a city or town. The
projected rate is 45.4% for 2010, attesting
to the high rate of urbanization.
The number of cities with a
population over a million people increased
from three in 1981 to seven in 1998. Towns
and cites with a population above 100,000
increased from 29 in 1981 to 50 in 1998.
The current trend suggests that urban
population is increasing at a faster pace
than the total population which is likely to
continue in the future as well.
According to 1998 Population and
Housing Census of Pakistan, there were
over 19.3 million housing units in the
country as compared to 12.6 million
enumerated in 1980, showing an increase
of 53.2 percent. Of the total (19.3 million)
housing units, 67.7 percent were in rural
and 32.3 percent in urban areas, nearly
15.6 million or 80.8 percent were owned,
1.7 million or 9.0 percent rented, and 2.0
million or 10.2 percent rent free. The
percentage of owned housing units were
higher in the rural areas compared to the
urban areas. However, the percentage of
rented houses was significantly higher at
23.2 in urban as compared to only 2.3
percent in the rural areas, as reflected in
Table 16.6.
Table 16.6
Housing Units by Tenure(In million)
Tenure
Census 1998 All Areas Rural Urban
Chapter 16. Environment and Housing
i) All types
ii) Owned
iii) Rented
iv) Rent Free
19.3(100)15.6
(80.8)1.7
(9.0)2.0
(10.2)
13.1(100)11.4
(87.1)0.3
(2.3)1.4
(10.6)
6.2(100)
4.2(67.6)
1.4(23.2)
0.6(9.2)
Note: The figures in parenthesis are percent shares Source: Population & Housing Census 1998
On the basis of the World Bank’s recommended occupancy rates of 6 persons per house, the total number of required housing units in the country would be roughly 24.8 million by the end of June 2003, based on the population of 149 million at present. According to one estimate (National Housing Policy), the country needs an additional supply of 570,000 units per annum while the actual supply does not exceed 300,000. Thus there is a net shortfall of 270,000 units per annum and the backlog is increasing every year.
The rate of construction of new dwellings needed to meet the growing demand has been falling far short of requirement. Therefore, the present government appreciating the gravity of situation and realizing the linkage of this important sector with the construction industry and its potential to generate employment, decided to revitalize it as a vehicle for economic revival. Accordingly, Ministry of Housing and Works formulated a new National Housing Policy –2001, taking into consideration the multifarious
problems including housing shortage, lack of housing finance, non-existence of foreclosure laws, lack of planning, outdated building and zoning regulations, etc. The major emphasis of the policy is on resource mobilization, land availability, incentives for home ownership, incentives to developers and constructors and promotion of research and development activities to make construction cost effective. The main objective of the policy is to create affordability, especially, for the middle and low income groups. One of the cornerstones of the policy is to ensure construction of housing for the poor and needy and housing for the majority of rural population through the use of different instruments like free land, cross-subsidy and concessionary finance etc.
Fortunately, the general conditions in the country are quite conducive to achieving a rapid growth in the construction industry. The country is witnessing stable macroeconomic environment and a foundation has been laid for sustained high growth in the medium – term.
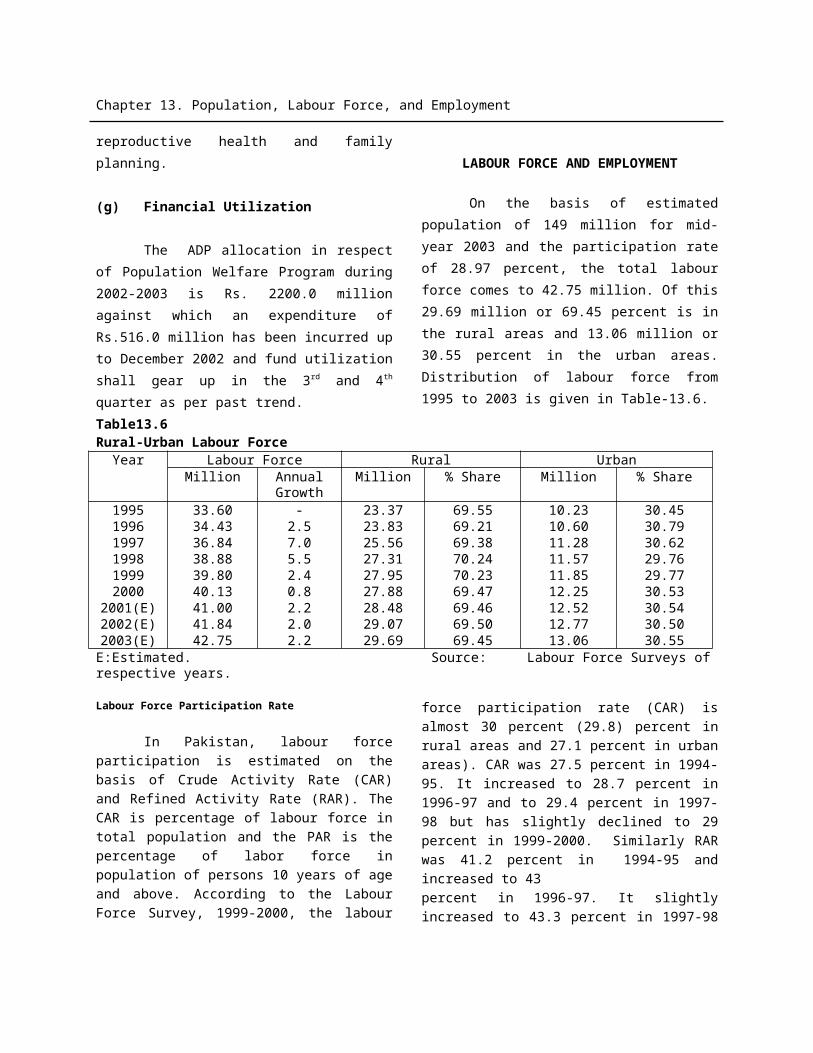
Chapter 16. Environment and Housing
However, one major area that has lagged behind is the housing finance, a critical input required for the promotion of construction industry. In developed countries, on an average, housing finance (outstanding stock) represents over 25% of GDP (US, 53%; European Union, 36%). In the developing countries the corresponding numbers are 21 percent for Malaysia, 16 percent for Thailand, 12 percent for Chile, 7 percent for Morocco, 5.5 percent for Tunisia, 4-5 percent for Brazil and Mexico, 3 percent for Srilanka and Iran and 2.2 percent for Bangladesh.
In contrast, the number is hardly 1% of GDP in Pakistan. This low number does not represent any lack of demand. Instead it is function of absence of a properly organized approach to housing finance, hitherto rather high interest rates, and somewhat lack of competition in the financial sector. There are also other significant constraints in housing sector that either increase the cost of transaction or increase risks for the lender to unmanageable levels (poor record/retrieval of property rights, high stamp duties, bureaucratic delays, corruption, disorganized state of the real estate market, etc.). Therefore, realizing the slump in the housing market and feeling the need to revive the economy of this important sector and narrow the backlog, the government has assigned a high priority to promoting the housing finance sector. To facilitate this sector, a number of steps have been taken which include:
i) Tax incentives were provided to home owners in the form of tax deductibility of mark ups (up to Rs.100,000 per annum) on home loans;
ii) The legal framework for the loan recovery of financial institutions has been further streamlined and strengthened through promulgation of Financial Institutions (Recovery of Finances) Ordinance, 2001; and
iii) Through a more effective macroeconomic management the government has succeeded in reducing the general interest rates in the country. This will provide an opportunity for banks and other financial institutions to provide more affordable mortgage loans.
iv) State Bank of Pakistan has issued guidelines for banking companies to undertake asset securitization, increased the lending limit for such loans to Rs.5 million and allowed banks to issue long-term debts to facilitate financing of housing loans;
v) The House Building Finance Corporation (HBFC) - the country’s largest specialized housing finance provider has been put under a new and professional Board of Directors and management with a mandate to restructure the institution in to a commercially viable and self-sustaining entity with reliance on subsidized official sources of funding. Eventually, HBFC will have to compete in the market for business and resources at par with private sector institutions;
vi) HBFC Act was amended to enable it to provide sharia-complaint housing
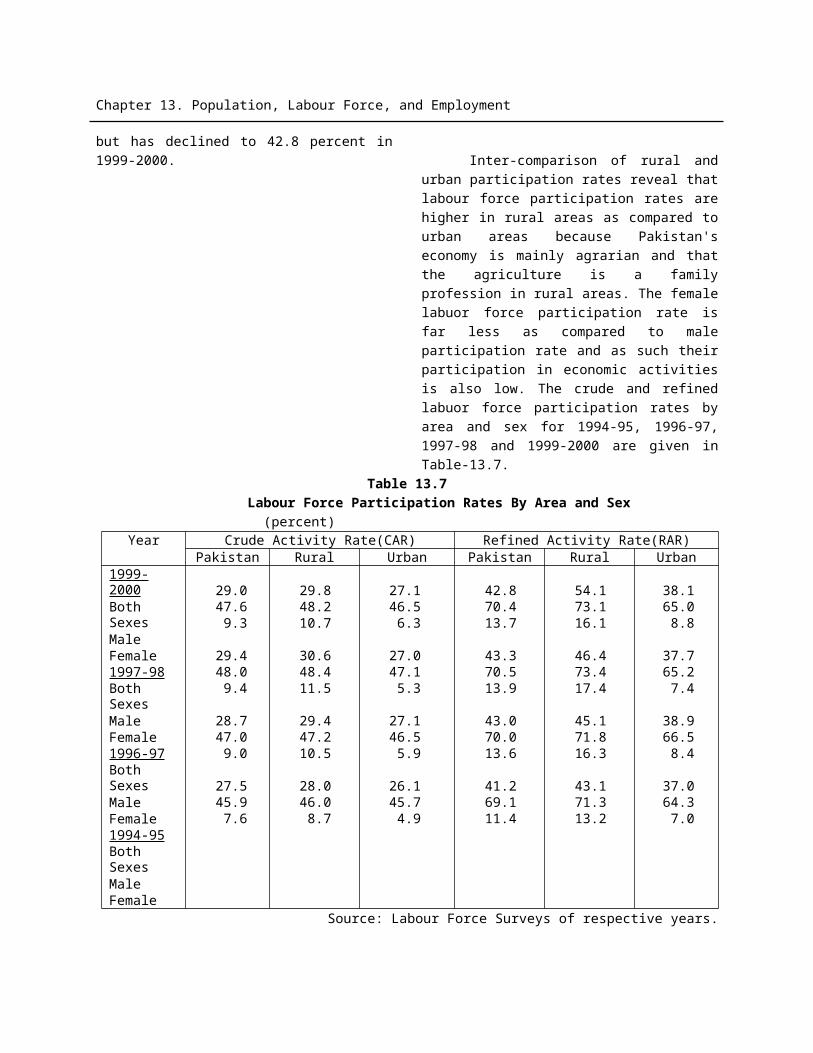
Chapter 16. Environment and Housing
finance product, which has now been introduced.
The present program involves construction of approximately 4564 housing units/apartments in 4 major urban centers of Karachi, Lahore, Islamabad and Peshawar at an estimated cost of Rs.5.0 billion. The execution of this program has been entrusted to the Pakistan Housing Authority.
The work has been awarded to leading construction companies of Pakistan and the design responsibility rests with leading designers. Leading construction managers are carrying out construction management. This combination ensures proper designing, provision of proper facilities and, above all, quality construction and timely completion. Generally, over 78 percent of work has been completed. Due to this initiative of the Government, substantial employment has been created. It is estimated that approximately 8,000--10,000 labourers and skilled workers are working on various projects including more than 500 Professional Engineers and Architects. In addition, this has also provided an incentive to the 40 downstream industries including cement, steel, electrical industries, piping etc.
For the financial year 2002-03, Rs.535.55 million were allocated in the Housing Sector under PSDP of Ministry of Housing and Works. Out of 480 housing units 450 units are expected to be completed by June, 2003.
Ministry of Housing and Works gave approval to Federal Government Employees Housing Foundation to acquire three sub-sectors of G-14 i.e. (G-14/2-3-4) for housing scheme for government employees. Land acquisition process has been initiated in these sub-sectors.
________________________Annexure 1
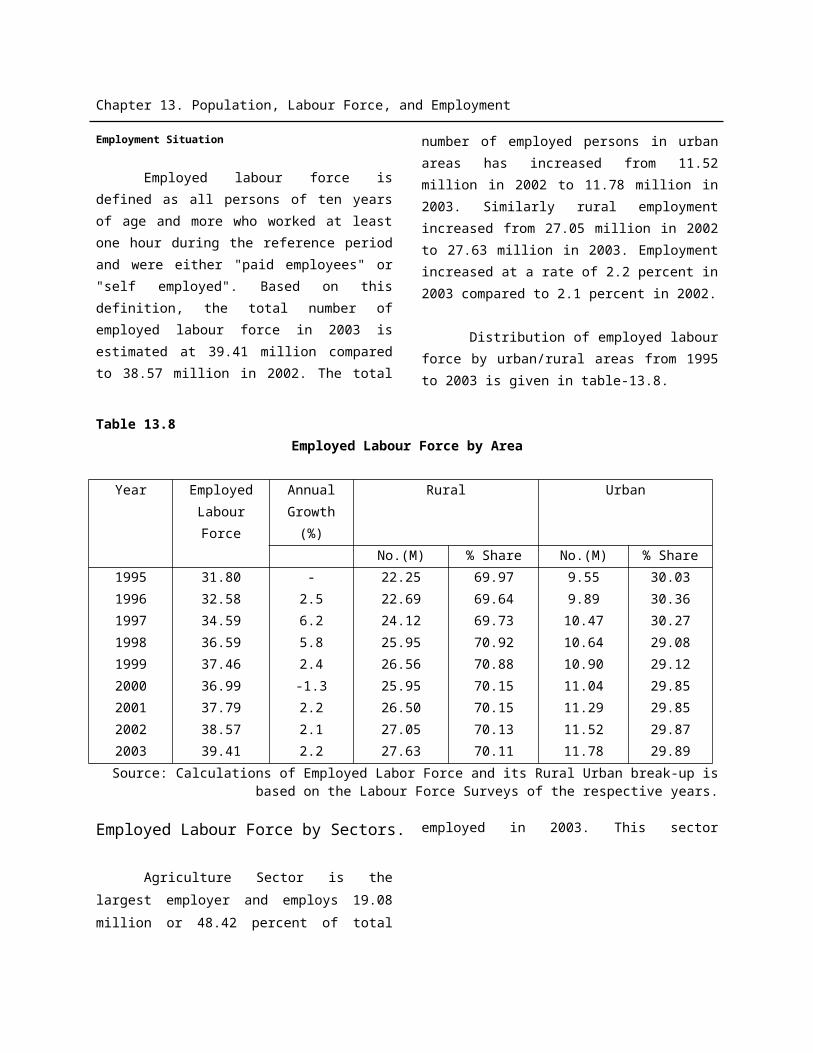
Chapter 16. Environment and Housing
CONTINGENT LIABILITIES
Contingent liabilities are costs which the government will have to pay if a particular event occurs. These are obligations triggered by a discrete but uncertain event. Relative to government policies, the probability of a contingency occurring and the magnitude of the required public outlays are exogenous (such as natural disasters) or endogenous (such as implications of market institutions and government programs for moral hazard in markets). Contingent liabilities therefore not yet recognized as direct liabilities. However, contingent government liabilities are associated with major hidden fiscal risks. A common example of a contingent liability is a government-guaranteed loan. At the time a guarantee is entered into there is no liability for the government, since this is contingent on the borrower failing to repay the loan as contracted. However, in the event of default, the lender can invoke the guarantee and the
government will be obliged to repay the amount of the loan still outstanding. At that point, the contingent liability will become an actual liability of government, and a payment must be made. These liabilities support specific policy objectives by creating financial incentives, without an immediate financial outlay. However, when these contractual guarantees or non-contractual commitments are realized, the government faces significant fiscal costs at the expense of other outlays. Thus analysis of country’s fiscal position is incomplete if it skips over obligations made by the government outside the budget.
The following framework highlights the two types of contingent liabilities. Contingent liabilities grow with weaknesses in the financial sector, macroeconomic policies, regulatory and supervisory system, and information disclosure.
Explicit Contingent Liabilities:These are specific government obligations defined by a contract or a law. The government is legally mandated to settle such an obligation when it becomes due.
Guarantees for borrowing and obligations of provincial governments and public or private entities.
Umbrella guarantees for various loans (SME loans, agriculture loans)
Guarantees for trade & exchange rate risks
Guarantees for private investments State insurance schemes.
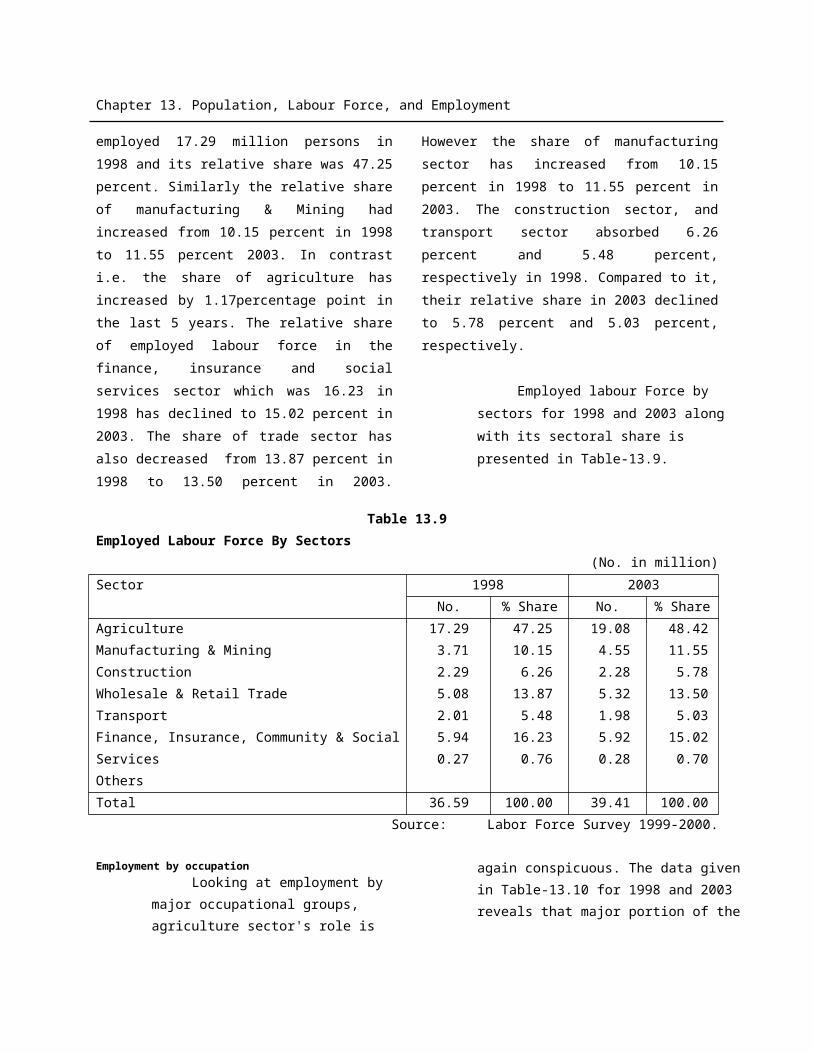
Chapter 16. Environment and Housing
Implicit Contingent Liabilities:These represent a moral obligation or expected burden for the government not in the legal sense, but based on public expectations and political pressures.
Defaults of provincial governments and public or private entities on non-guaranteed debt and other obligations.
Liability clean-up in entities being privatized
Bank failures Disaster and relief financing. Failure on other non-guaranteed funds.
Explicit Contingent Liabilities:
Explicit contingent liabilities legally oblige government to make a payment if a specific event occurs. Because their fiscal cost is invisible until they are triggered, contingent explicit liabilities represent a hidden subsidy, blur fiscal analysis, and can drain future government finances. Nevertheless, government guarantees and financing through government guaranteed institutions are more politically attractive than budget support even if they are more expensive later. The budgetary cost of these legal obligations during FY 2001-02 amounted Rs. 23.60 billion, in FY 2002-03 Rs. 16.18 billion and projected at Rs. 15.54 billion during FY 2003-04. These comprise payments made on account of contractual guarantees issued on Ghee Corporation of Pakistan (GCP), Rice Export Corporation of Pakistan (RECP), Trading Corporation of Pakistan (TCP), Cotton Export Corporation (CEC) and Saindak bonds; Pakistan Steel Mills Corporation’s liability payments contractually assumed by Government; payments to oil refineries on account of guaranteed rates of return; and payments to FFC Jordan on account of 1989 Investment Policy pertaining to fertilizer industry. Key organizations with explicit and implicit
guarantee structure have been discussed below. The following table analyses the trend.
PIA: During FY 2002-03, an amount of Rs 1.7 billion has been given for fleet renewal and Rs. 1.7 billion have been paid out as interest (equity) to the restructured loans and Term Finance Certificates to PIA. GOP has guaranteed interest payments (restructured loans and TFCs) for five years starting FY 2001-02.
Railways: During FY 2002-03, an amount of Rs. 4.98 billion has been paid on account of debt servicing liability (Government guaranteed loans) and Rs. 3.12 billion on account of other operational shortfalls.
WAPDA: GOP is injecting into WAPDA Rs. 26.4 billion through subsidy, Rs. 21 billion on account of non-recovery of loans and Rs. 2.7 billion as fresh loans, totaling to Rs. 50.1 billion during FY 2002-03. An anticipated amount for FY 2003-04 comes out to be Rs. 35 billion.
KESC: GOP has injected fresh equity amounting to Rs. 6.1 billion and loans/subsidy payments of Rs. 20.3 billion during FY 2002-03. Budget estimates for FY 2003-04 amount to Rs. 16.9 billion subsidy.
Explicit Liabilities (Cash outflow streams from federal budget)
Enterprise 2001-02 2002-03 2003-04GCP, RECP, TCP & CEC (GOP guaranteed) 4.70 5.20 4.90Saindak Metal Limited (GOP guaranteed) 2.00 2.30 1.80
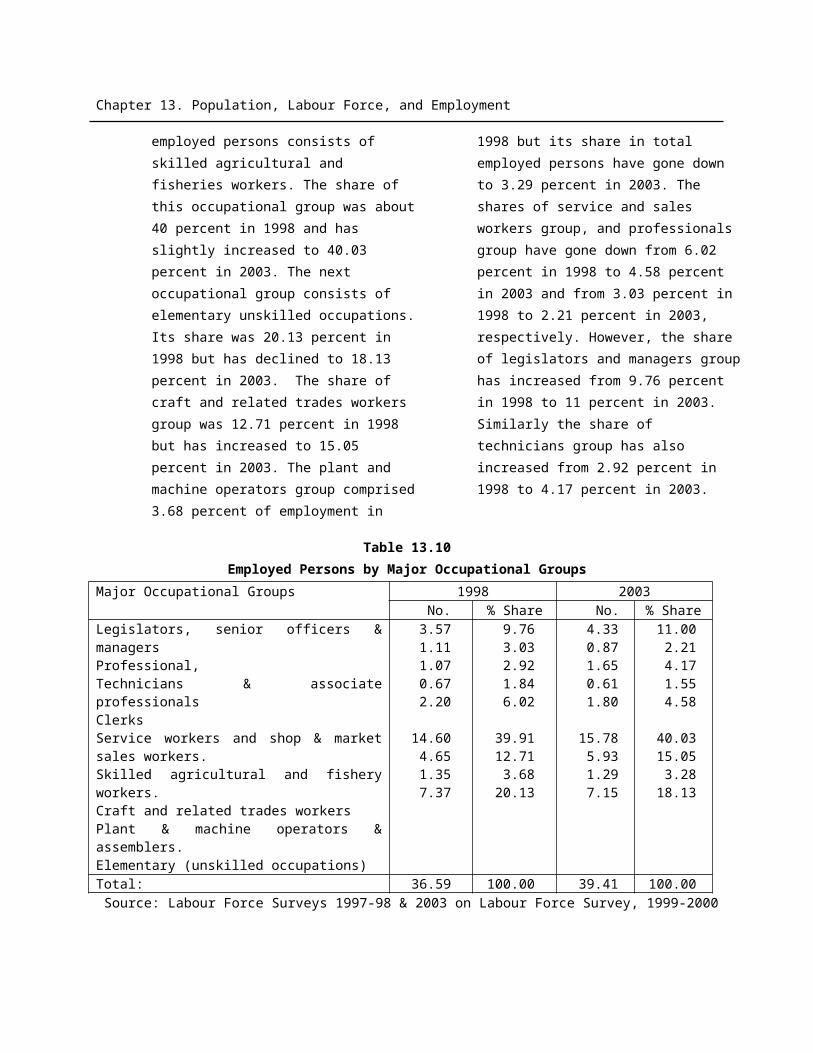
Chapter 16. Environment and Housing
Pakistan Steel Mills (GOP guaranteed) 0.90 0.80 0.75PIA (Interest on GOP guaranteed TFCs and loans) - 1.70 1.66Oil Refineries (GOP guaranteed) 9.00FFC Jordan (GOP guaranteed) 1.00 0.70 1.05Utility Stores Corporation (GOP guaranteed) - - 0.30Pakistan Engineering Company (GOP guaranteed)
- 0.19 0.18
Peoples Steel Mill (GOP guaranteed) 0.75 0.31 -Pakistan Railways (GOP guaranteed debt servicing)
6.00 4.98 4.90
TOTAL (Rs in billion) 24.35 16.18 15.54Source: Ministry of Finance. Figures for FY 2004 are budget estimates.
In consonance with the Macroeconomic and the Medium Term Budgetary Framework adopted by the Government and containing risk exposure, a policy of limiting guarantees and risk analysis of contingent liabilities has been institutionalized. During FY 2002-03, the Government has issued guarantees equivalent to Rs.16.18 billion that is 31.5% lower than FY 2001-02. Additionally, Government’s Fiscal Responsibility Law, pending Cabinet’s approval and to be enacted before June 30, 2003, proposes specific limits on contractually binding guarantees (i.e. explicit contingent liabilities) including those in rupee lending, bonds, rates of return, output purchase agreements and other claims that may threat future fiscal stance of the Government.
Implicit Contingent Liabilities:
Implicit contingent liabilities are not officially recognized until a failure occurs. The triggering event, the amount at risk, and the required government outlay are uncertain. In most countries the financial system is the most serious contingent implicit government liability. Markets expect government support far beyond its legal obligation if financial stability is at risk. These include government’s quasi-fiscal activities including mainly the bail-outs of strategically important State Owned Enterprises and the non-performing loans of banking sector. Through robust financial sector reforms, prudent monetary
management and strengthening of State Bank of Pakistan’s regulatory role, the non–performing loans of the banking sector stand at Rs.266 billion as on December 2002. These were Rs. 258 billion as on June 30, 2002 and Rs. 279 billion as on June 30, 2001 respectively.
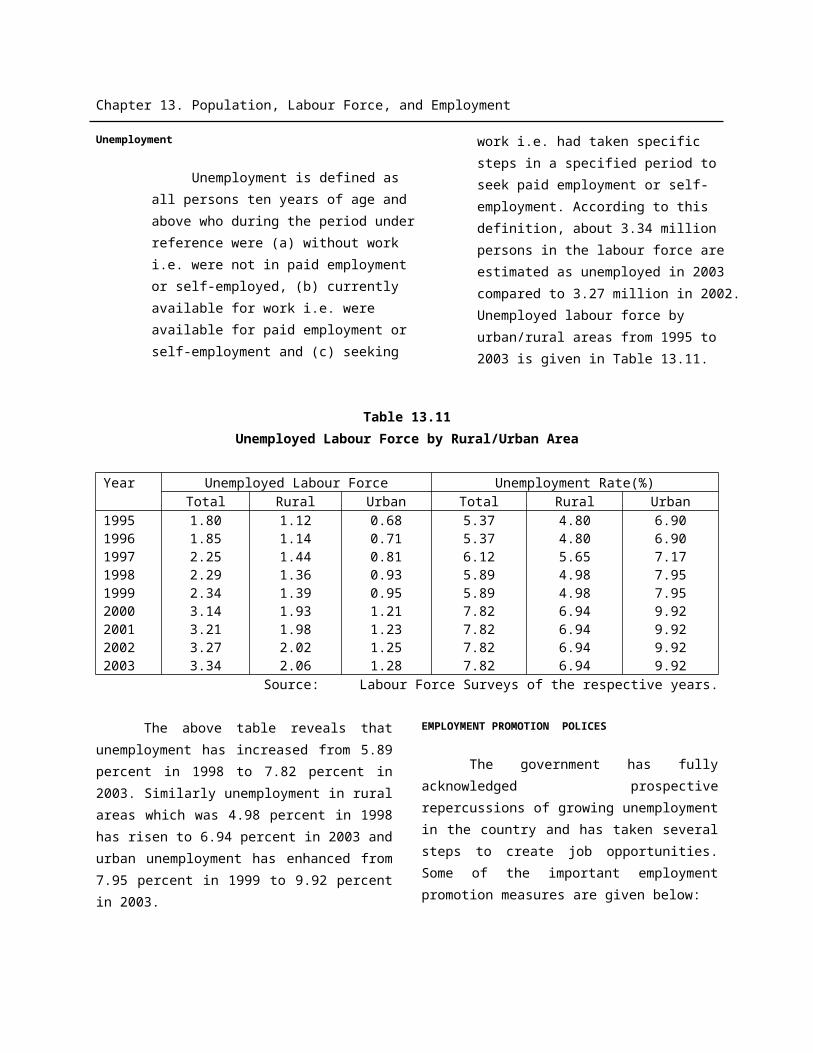
Chapter 16. Environment and Housing
It can be inferred from the above table that Water and Power Development Authority (WAPDA), Karachi Electric Supply Corporation (KESC), and Pakistan Railways have been the
largest drain on the budget. Financial Improvement Plans of the two power utilities are currently under implementation to curtail these outflows. Privatization of KESC and successful corporatization of WAPDA in the years ahead would eventually plug these financial leakages.
Impact of implicit contingent liabilities on the federal budgetEnterprise 2001-02 2002-03 2003-04
WAPDA subsidy 13.5 26.4 15.0WAPDA non recovery of loans 22.00 21.0 20.0WAPDA new loans 3.3 2.7 -KESC Equity (injection of fresh equity) 83.20 6.1 -KESC shortfall in debt servicing 4.00 - -KESC Loans - 9.2 3.7KESC Subsidy (Cash shortfall) - 11.1 13.2Utility Stores Corporation 0.15 0.15 0.15Karachi Shipyard (GOP investment) 0.30 - -Pakistan Railways (Other operational shortfalls)
- 3.12 3.01
Equity in Government Holdings Private Ltd - 3.0 1.0PIA (Fleet Renewal) - 1.7 3.5TOTAL (Rs in billion) 126.45 84.47 59.56
Source: Ministry of Finance. Figures for FY 2004 are budget estimates.
Guarantees Issued (Explicit and Implicit liabilities)Fiscal Year Rs in billion As % of GDP
2001-02 150.80 4.04%2002-03 100.65 2.47%2003-04 (Budget Estimates)
75.10 1.34%
Annexure-II
Chapter 16. Environment and Housing
TAX EXPENDITURES
While taxes are an essential source of revenue for all state economies, the manner in which they are imposed varies widely from country to country. Tax expenditures are provisions in the tax code, such as exclusions, deductions, credits, and deferrals that are designed to encourage certain kinds of activities or to aid taxpayers in special circumstances. When such provisions are enacted into the tax code, they reduce the amount of tax revenues that may be collected. In this sense, the fiscal effects of a tax expenditure are just like those of a direct government expenditure. Some tax expenditures involve a permanent loss of revenue, and thus are comparable to a payment by the government; others cause a deferral of revenue to the future, and thus are comparable to an interest-free loan to the taxpayer. Tax expenditures include exemptions from the tax base, allowances deducted from gross income, tax credits deducted from tax liability, tax rate reductions, and tax deferrals (such as accelerated depreciation). Since tax expenditures are designed to accomplish certain public goals that otherwise might be met through direct expenditures, it seems reasonable to apply to tax expenditures the same kind of analysis and review that the budget appropriation receives.
It is essential to distinguish between those provisions of the tax code that represent tax expenditures and those that are part of the "basic structure" of a given tax. The basic structure is the set of rules that defines the tax; a tax expenditure is an exception to those rules. In general, most taxes have a series of features that define their basic structure. These features are a base on which the tax is levied, such as net income, or a particular class of transactions; a taxable unit, such as a person or a corporation; a rate, to be applied to the base; a definition of the geographic limits of the state's exercise of its tax jurisdiction;
and provisions for the administration of the tax.
The estimates of total tax expenditures in Pakistan for FY 2002-03 come around Rs. 17.5 billion. The figure signifies vast improvement over the previous years when the total tax expenditures stood at Rs. 31 billion during FY 2000-01 and Rs. 25 billion during FY 2001-02. Details for the FY 2002-03 are discussed below:
Income Tax:
Section 53 of the Income Tax Ordinance 2002 empowers the Federal Government to exempt from tax any income or classes of income, or person. However, these powers were sparingly exercised by the Government as it is following a conscious policy of not only phasing out the existing exemptions gradually but also not to allow fresh ones. As a result thereof, fifty-one exemptions form the Part-I of the Second Schedule and four rebates available under the First Schedule were withdrawn through Budget 2002. Categories of exemptions listed in Part-I of the Second Schedule to the Income Tax Ordinance 2001 are broadly as under:
a) Exemption related to pensions,
provident funds and superannuation funds
b) Exemption of interest on
borrowings from external sources
c) Exemption to non-profit charitable,
religious and welfare activities
Chapter 16. Environment and Housing
d) Exemption to non-profit
educational institutions
e) Exemption relating to electric
power generation
f) Unexpired period to tax holidays
for industrial undertaking.
Total number of exemptions under the aforesaid categories contained in Part-I of Second Schedule to the Ordinance 2001
is 114. The cost of these exemptions (excluding agricultural income that is liable to tax under the relevant Provincial Agricultural Income Tax Laws) is Rs. 6.8 billion. It may be noted that exemption expenditure merely relates to National Savings Schemes interest income in respect of investment which has been made up to the year ending June 30, 2001, pensions, provident fund and superannuation fund. Furthermore, exemption related to charitable activities and non-profit educational institutes are common in both developed and developing countries. Similar is the position with regards to basic threshold of income for charging tax.
Following is the estimated cost of exemptions if FY 2002-03 compared to FY 2001-02 and FY 2000-01 respectively.
Table 1Income Tax Expenditure
(Rs. billions)No
Major Income Tax Expenditure Items
Estimated Revenue Loss FY 2000-01 FY 2001-02 FY 2002-
031 Pensions 0.7 0.7 0.72 Allowances 1.0 1.1 1.13 Income from funds (eg NIT Units) 0.6 0.6 0.64 NSS interest income 3.2 2.9 2.75 Other interest income 0.1 0.1 0.16 Capital gains 0.9 0.9 0.97 Sector & enterprise specific
exemptions0.7 0.7 0.7
8 Agricultural Income 4.0 3.2 *TOTAL 11.2 10.2 6.8
* Income tax on agricultural income is now a provincial subject. Income tax thereon is being levied by the concerned Provincial Governments. Accordingly, the cost of the exemptions has not been included in FY 2002-03.
Sales Tax:
Key exemptions on Sales Tax are food items (wheat, grain, pulses and edible oils excluding palm oil and soybean oil). In addition to food items, exemptions also include phosphatic fertilizer, information
technology equipment and pharmaceutical products. As per international practices, the bulk of such items cannot be taxed, for example food grains etc. Cost of Sales Tax exemption is estimated to be around Rs. 10.37 billion for FY 2002-03.
Chapter 16. Environment and Housing
Table 2Sales Tax Expenditure
(Rs. billions)No
Major Sales Tax Expenditure Items Estimated Revenue Loss FY 2000-01 FY 2001-02 FY 2002-
031 Retailers (includes those in turnover
scheme)1.00 0.00 0.55
2 Turnover manufacturers 0.00 0.00 0.353 Domestically produced edible oils 2.00 2.10 2.304 Pharma (excluding life saving drugs) 4.00 4.30 4.605 Tractors and other agri machinery 1.30 1.50 1.756 Fertilizers 4.00 0.60 0.697 Pesticides 0.80 0.00 0.008 Others (eg. agri-seeds, cattle feed) 0.10 0.10 0.109 Exemption on supply of locally
manufactures machinery to petroleum sector
0.00 0.00 0.05
TOTAL 13.20 8.60 10.37
Central Excise:Tax expenditures involved on account of
Central Excise is relatively minimal vis-à-vis other taxes. Cost of Central Excise exemptions for the FY 2002-03 is around Rs. 8.0 million. This exemption was granted to Aga Khan Development Network on the purchase of cement for its on going projects of human development work in Northern Areas and Sindh province.
Customs:Customs exemptions are mainly given on
raw material and components i.e plant, machinery and equipment imported by high tech industry, priority and value added industries, imports for energy sector projects, exemption to exploration and production companies including OGDC exemption for WAPDA, and imports by CNG companies. Some of these exemptions are on account of international commitments and contractual obligations.
Table 3 provides the break-up of key exemptions in customs duties over the years:
Table 3Exemption in Customs Duties
(Rs. Billion)
Chapter 16. Environment and Housing
No Old SRO No & Date
Existing SRO No & Date
Description of SRO Estimated Revenue LossFY
2001-02FY
2002-031 369(I)/
2000 17-06-00
439(I)/2001 18-06-01
Conditional exemption of customs duty on import of plant, machinery and equipment not manufactured locally
0.627 0.327
2 400(I)/97 31-05-97
361(I)/2002 18-06-01
Exemption of customs duty on import of machinery, equipment, materials specialized vehicles, accessories, spares and chemicals as are not manufactured locally, if imported by exploration and production companies including OGDC
0.637 0.0
367(I)/94 09-05-94
367(I)/94 09-05-94
Exemption of customs duty as is in excess of 10% ad val. On machinery equipment materials etc imports for petroleum sector projects
1.215 2.037
3 555(I)/98 12-06-98
444(I)/2001 18-06-01
General conditional exemption 2.214 1.438
358(I)/2002 15-06-2002
0.048
4 504(I)/94 09-06-94
357(I)/2002 15-06-2002
Partial exemption of customs duty on raw materials sub-components as are not manufactured locally of specified goods
0.025 0.438
5 24(I)/9608-01-96
6 557(I)/97 28-07-97
438(I)/2001 18-06-2001
Exemption of customs duty on machinery and equipment and construction materials
0.393 0.275
7 38(I)/98 21-01-98
38(I)/98 21-01-98
Exemption of whole of customs duty and sales tax on import of machinery, equipment on conversion kits and cylinders, if imported by CNG companies during the period commencing from November 01, 1997 to October 31, 2002.
0.263 0.194
TOTAL 5.422 4.709
Following is the consolidated summary of tax expenditures showing percentage
increase/decrease for the FY 2002-03 compared to previous years.
Table 4Summary of Tax Expenditures (Tax Wise)
(Rs. Billion)Type of Tax Cost of Exemptions
FY2000-
01
FY2001-
02
% Change
FY2001-
02
FY2002-03
% Change
Income Tax 11.20 10.20 -8.92% 10.20 6.80 -33.3%
Chapter 16. Environment and Housing
Sales Tax 13.20 8.60 -34.84%
8.60 10.37 20.6%
Customs Duties 6.20 5.42 -12.74%
5.41 4.71 -13.0%
Central Excise 0.50 0.50 0.00% 0.50 0.01 -98.0%TOTAL 31.10 24.72 -
20.54%
24.71 21.89 -11.4%
Note: Since quantification of Tax Expenditures is subjective and estimated, therefore there is slight variance in the provisional tax expenditure numbers reported in Economic Survey 2001 and 2002.
Table 5Summary of Major Tax Expenditures for FY 2002-03 (Item Wise)
(Rs. Billion)No
Major Tax Expenditure Items Estimated Revenue Loss FY 2003
1 Pharmaceutical (excluding life savings drugs) 4.602 NSS interest income 2.703 Domestically produced edible oils 2.304 Import of machinery, equipment materials etc 2.045 Tractors and other agriculture machinery 1.756 General conditional exemption 1.447 Allowances 1.108 Capital gains 0.909 Pensions 0.70
TOTAL 17.53
___________________________
Related Documents