OSS INDICATORS Sunday, July 21, 2013 1 Copyright 2003-2013 Handler & Associates, Inc. OSS INDICATORS NEWSLETTER http://www.oss.cc http://www.urbansurvival.com/ Wall Street Forecaster Blog http://wsf.typepad.com/ Follow on Twitter: @rrhandle8 Insight in market movements www.markettiming.nl "Millionaires don't use astrologers. Billionaires do." - J. P. Morgan

Welcome message from author
This document is posted to help you gain knowledge. Please leave a comment to let me know what you think about it! Share it to your friends and learn new things together.
Transcript

OSS INDICATORS Sunday, July 21, 2013 1
Copyright 2003-2013 Handler & Associates, Inc.
OSS INDICATORS NEWSLETTERhttp://www.oss.cc
http://www.urbansurvival.com/
Wall Street Forecaster Blog
http://wsf.typepad.com/
Follow on Twitter: @rrhandle8
Insight in market movementswww.markettiming.nl
"Millionaires don't use astrologers. Billionaires do." - J. P. Morgan
OSS INDICATORS Sunday, July 21, 2013 2
Copyright 2003-2013 Handler & Associates, Inc.
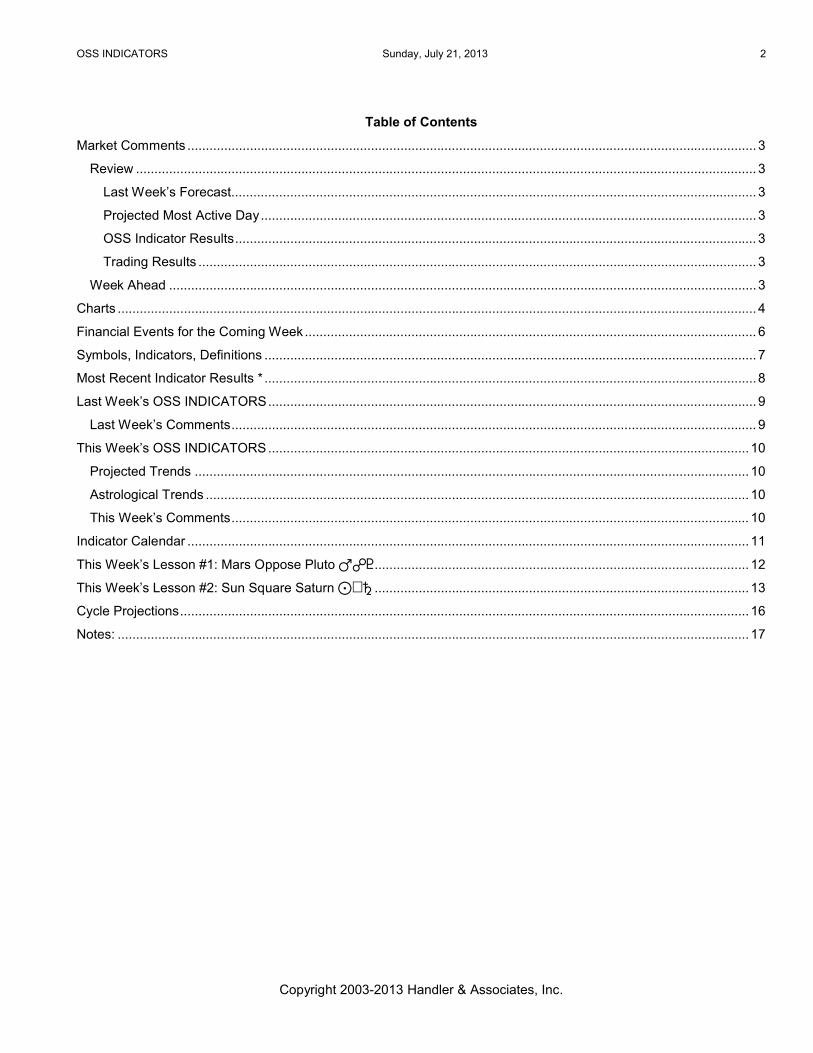
Table of Contents
Market Comments ........................................................................................................................................................... 3
Review ......................................................................................................................................................................... 3
Last Week’s Forecast............................................................................................................................................... 3
Projected Most Active Day....................................................................................................................................... 3
OSS Indicator Results.............................................................................................................................................. 3
Trading Results ........................................................................................................................................................ 3
Week Ahead ................................................................................................................................................................3
Charts .............................................................................................................................................................................. 4
Financial Events for the Coming Week........................................................................................................................... 6
Symbols, Indicators, Definitions ...................................................................................................................................... 7
Most Recent Indicator Results * ...................................................................................................................................... 8
Last Week’s OSS INDICATORS..................................................................................................................................... 9
Last Week’s Comments............................................................................................................................................... 9
This Week’s OSS INDICATORS................................................................................................................................... 10
Projected Trends ....................................................................................................................................................... 10
Astrological Trends .................................................................................................................................................... 10
This Week’s Comments............................................................................................................................................. 10
Indicator Calendar ......................................................................................................................................................... 11
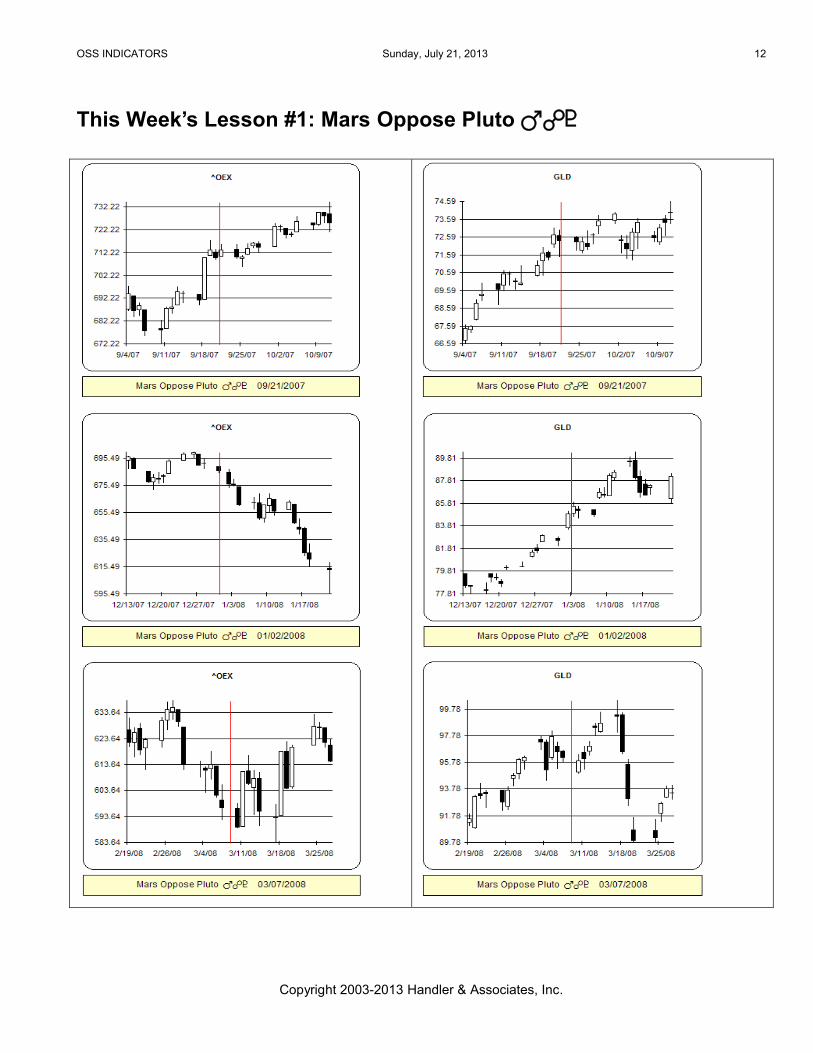
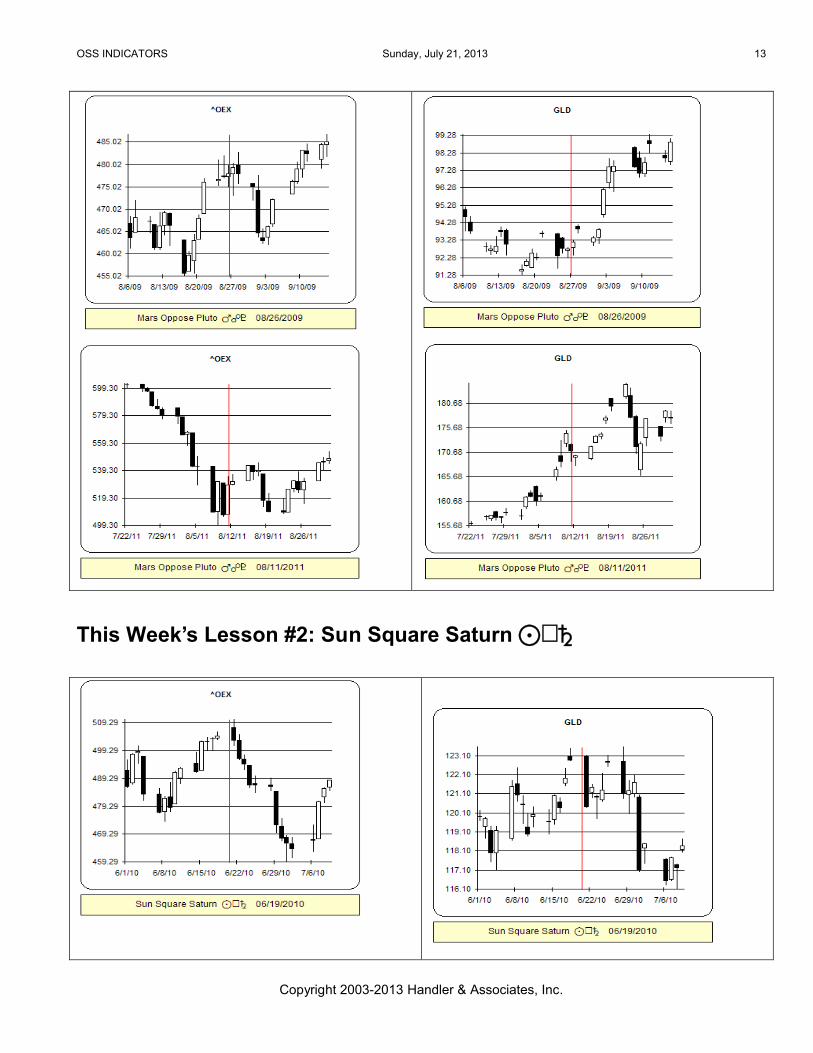
This Week’s Lesson #1: Mars Oppose Pluto NuQ...................................................................................................... 12
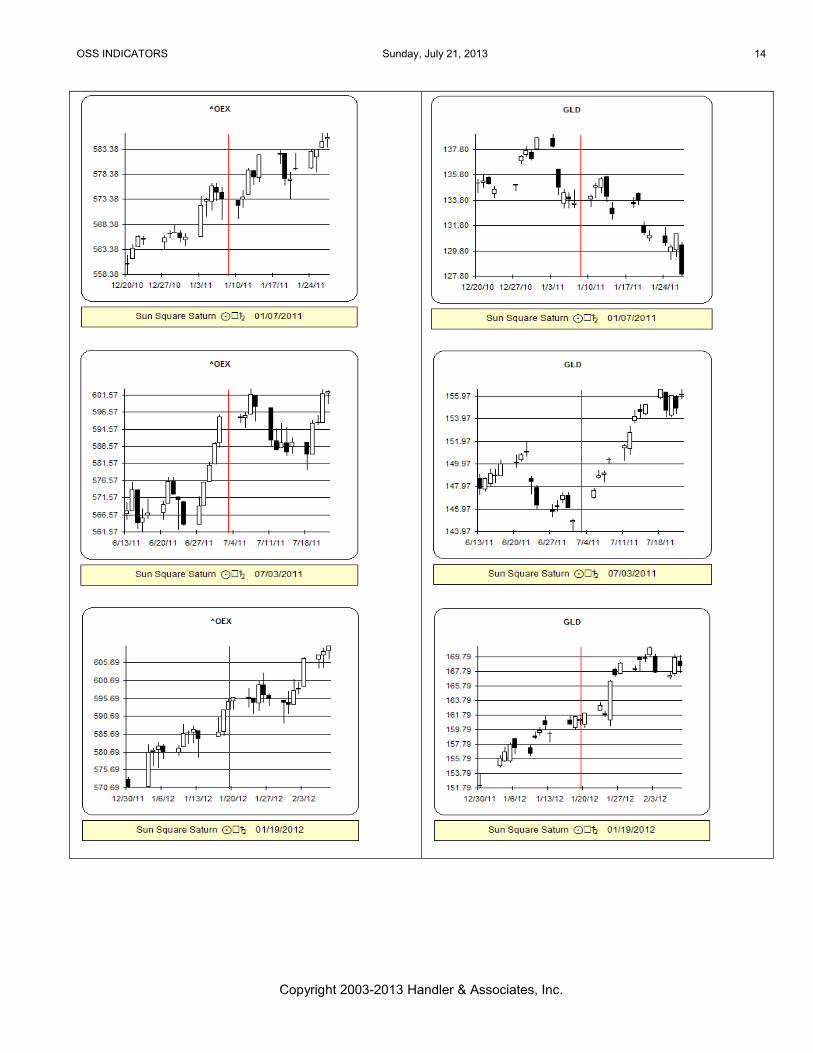
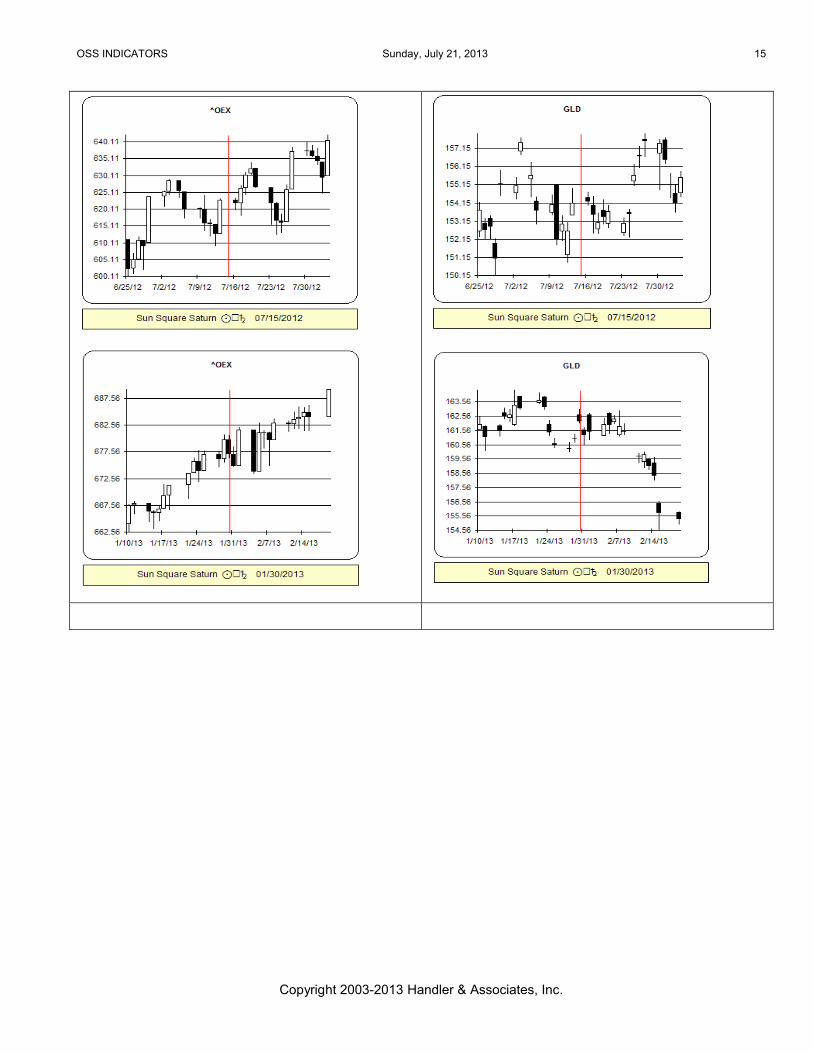
This Week’s Lesson #2: Sun Square Saturn [\R ...................................................................................................... 13
Cycle Projections........................................................................................................................................................... 16
Notes: ............................................................................................................................................................................ 17
OSS INDICATORS Sunday, July 21, 2013 3
Copyright 2003-2013 Handler & Associates, Inc.
Market Comments
Review
Last Week’s ForecastLast week’s advice to subscribers was to expect a move higher as
we moved into the Grand Trine, and that is what we got.
Gold and Silver continue to be difficult to predict.
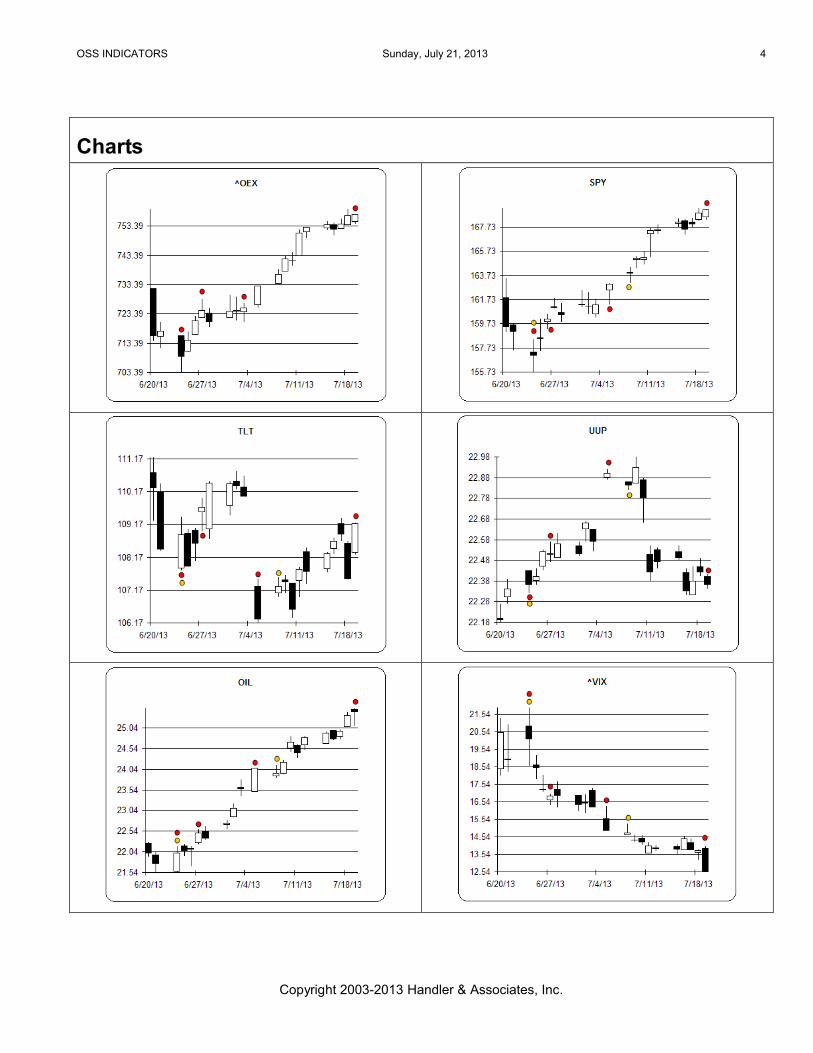
Projected Most Active DayAnother week with no V-indicator over the value of 1. The Project
Trend was most concentrated on Tuesday and Wednesday. Three
of the five markets we watch did have their largest moves at this
time. See chart below.
Week beginning: 07/15/13
Ticker Mon Tue Wed Thr Fir
OEX 0.14% -0.26% 0.27% 0.39% 0.07%
GLD 0.04% 0.57% -1.26% 0.56% 0.89%
SLV 0.36% 0.26% -3.47% 0.32% 0.85%
UUP 0.09% -0.71% 0.22% 0.18% -0.27%
TLT 0.53% 0.34% 0.18% -1.25% 1.58%
Indicators PT PT PT
Tuesdays and Friday continue to be extremely bullish days.\
Single Day StatsMon Tue Wed Thr Fri
Avg -0.07% 0.34% -0.13% 0.12% 0.23%
Days Up 14 20 14 17 20
Days Down 12 8 14 11 7
OSS Indicator ResultsHits and Misses for the week before last can be found in
the Most Recent Indicator Results on page 8.
Indicators Percentages
56 HIT 79%
13 MISS 18%
2 MIXED 3%
71 Total Predictions
Trading ResultsNightly trading results can be found here: http://wsf.typepad.com/l
A two-free trial is available here: http://oss.cc/oss_Subscription.asp
Last week’s results – Single Day Plays
Ticker Option Exit Price Profit %
GMCR Jul13 75 Calls 7/16/2013 $1.50 50
XOM Jul13 32 Calls 7/16/2013 $0.30 50
BIDU Jul13 105 Puts 7/17/2013 $0.97 -20
GS Jul13 160 Puts 7/17/2013 $1.14 -20
ABT Jul13 37 Puts 7/18/2013 $0.99 -20
LULU Jul13 65 Calls 7/18/2013 $1.04 50
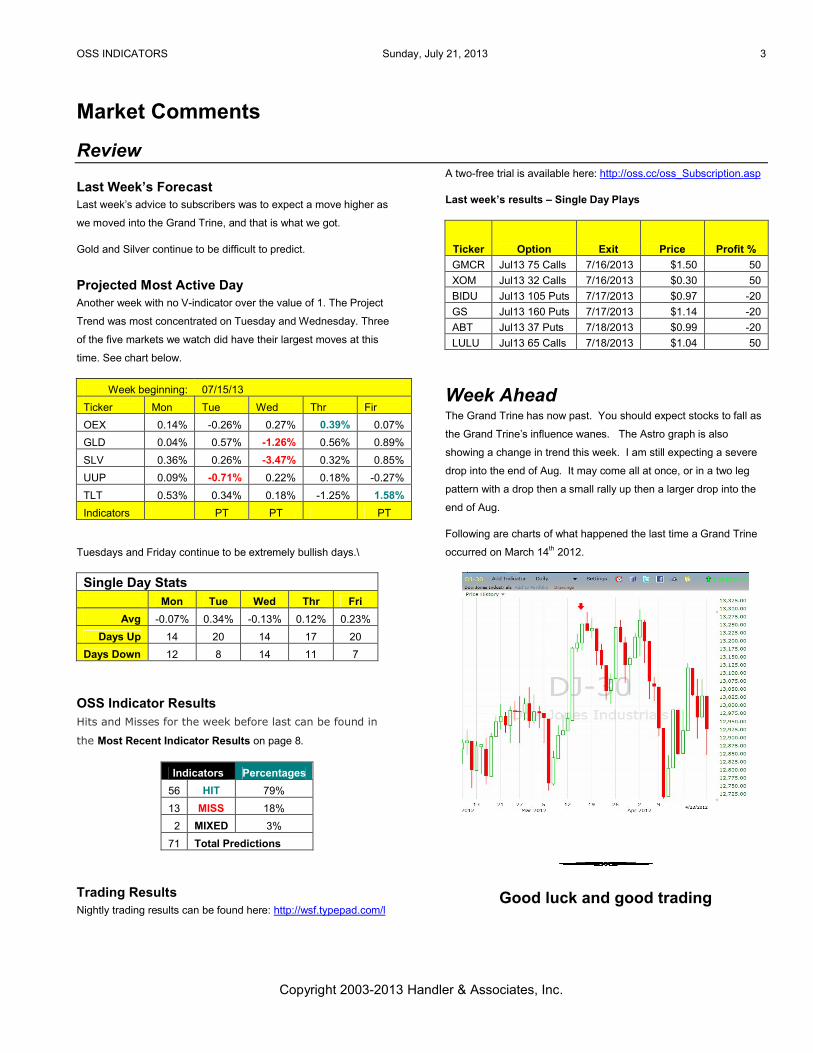
Week AheadThe Grand Trine has now past. You should expect stocks to fall as
the Grand Trine’s influence wanes. The Astro graph is also
showing a change in trend this week. I am still expecting a severe
drop into the end of Aug. It may come all at once, or in a two leg
pattern with a drop then a small rally up then a larger drop into the
end of Aug.
Following are charts of what happened the last time a Grand Trine
occurred on March 14th 2012.
Good luck and good trading
OSS INDICATORS Sunday, July 21, 2013 4
Copyright 2003-2013 Handler & Associates, Inc.
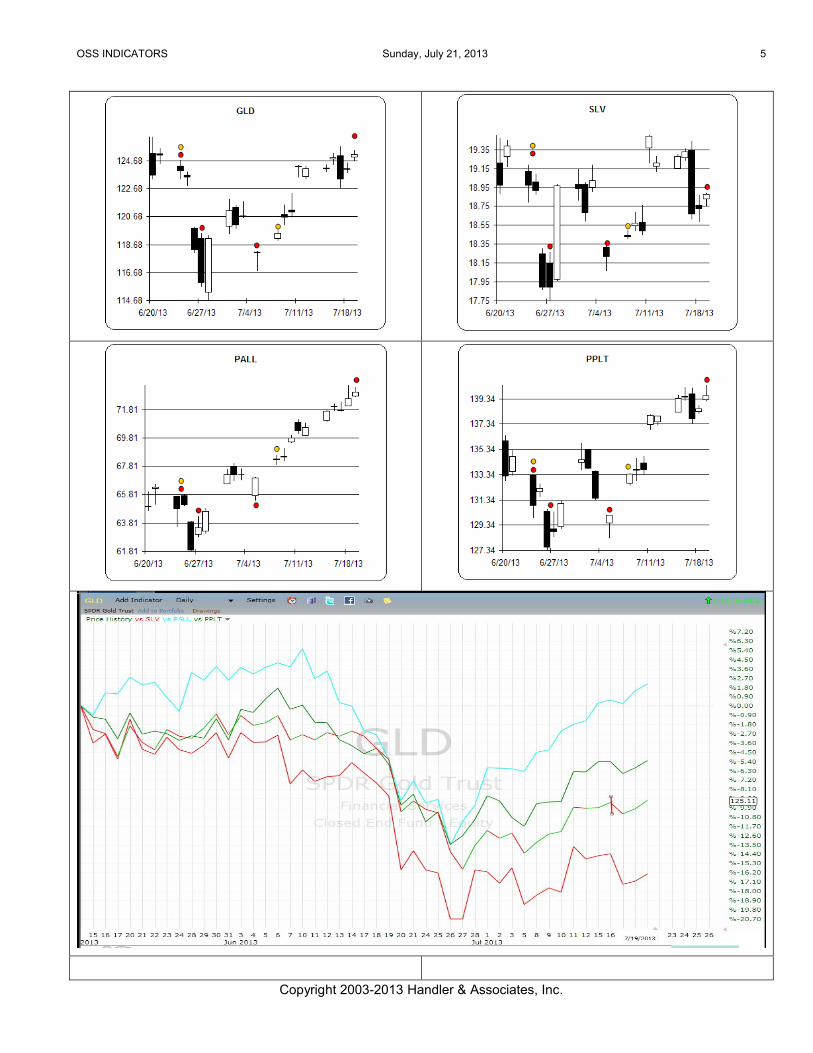
Charts
OSS INDICATORS Sunday, July 21, 2013 5
Copyright 2003-2013 Handler & Associates, Inc.
OSS INDICATORS Sunday, July 21, 2013 6
Copyright 2003-2013 Handler & Associates, Inc.
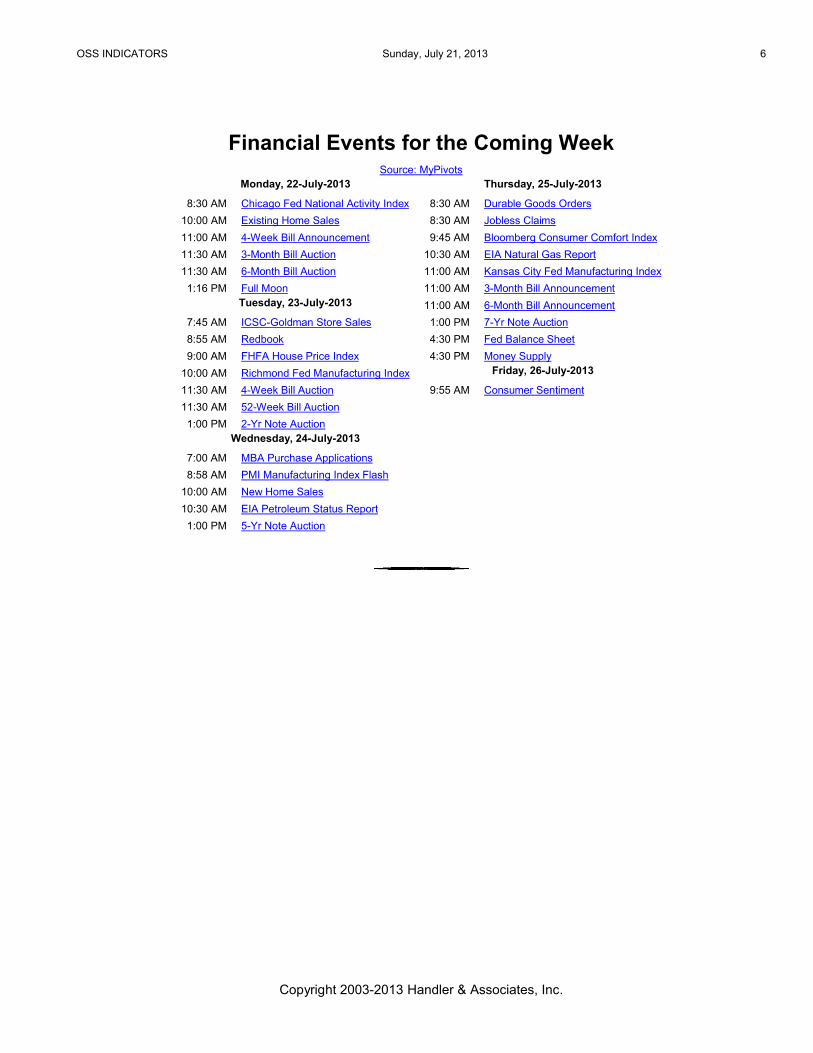
Financial Events for the Coming WeekSource: MyPivots
Monday, 22-July-2013 Thursday, 25-July-2013
8:30 AM Chicago Fed National Activity Index 8:30 AM Durable Goods Orders
10:00 AM Existing Home Sales 8:30 AM Jobless Claims
11:00 AM 4-Week Bill Announcement 9:45 AM Bloomberg Consumer Comfort Index
11:30 AM 3-Month Bill Auction 10:30 AM EIA Natural Gas Report
11:30 AM 6-Month Bill Auction 11:00 AM Kansas City Fed Manufacturing Index
1:16 PM Full Moon 11:00 AM 3-Month Bill AnnouncementTuesday, 23-July-2013 11:00 AM 6-Month Bill Announcement
7:45 AM ICSC-Goldman Store Sales 1:00 PM 7-Yr Note Auction
8:55 AM Redbook 4:30 PM Fed Balance Sheet
9:00 AM FHFA House Price Index 4:30 PM Money Supply
10:00 AM Richmond Fed Manufacturing Index Friday, 26-July-2013
11:30 AM 4-Week Bill Auction 9:55 AM Consumer Sentiment
11:30 AM 52-Week Bill Auction
1:00 PM 2-Yr Note AuctionWednesday, 24-July-2013
7:00 AM MBA Purchase Applications
8:58 AM PMI Manufacturing Index Flash
10:00 AM New Home Sales
10:30 AM EIA Petroleum Status Report
1:00 PM 5-Yr Note Auction
OSS INDICATORS Sunday, July 21, 2013 7
Copyright 2003-2013 Handler & Associates, Inc.
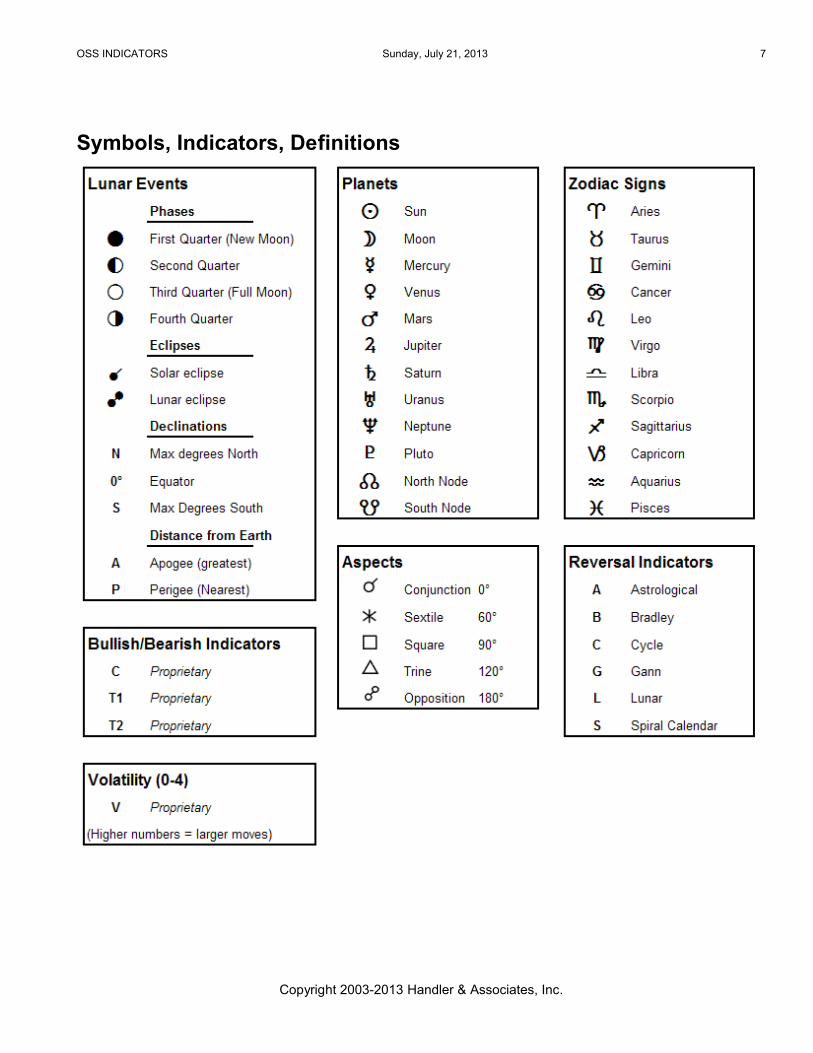
Symbols, Indicators, Definitions
OSS INDICATORS Sunday, July 21, 2013 8
Copyright 2003-2013 Handler & Associates, Inc.
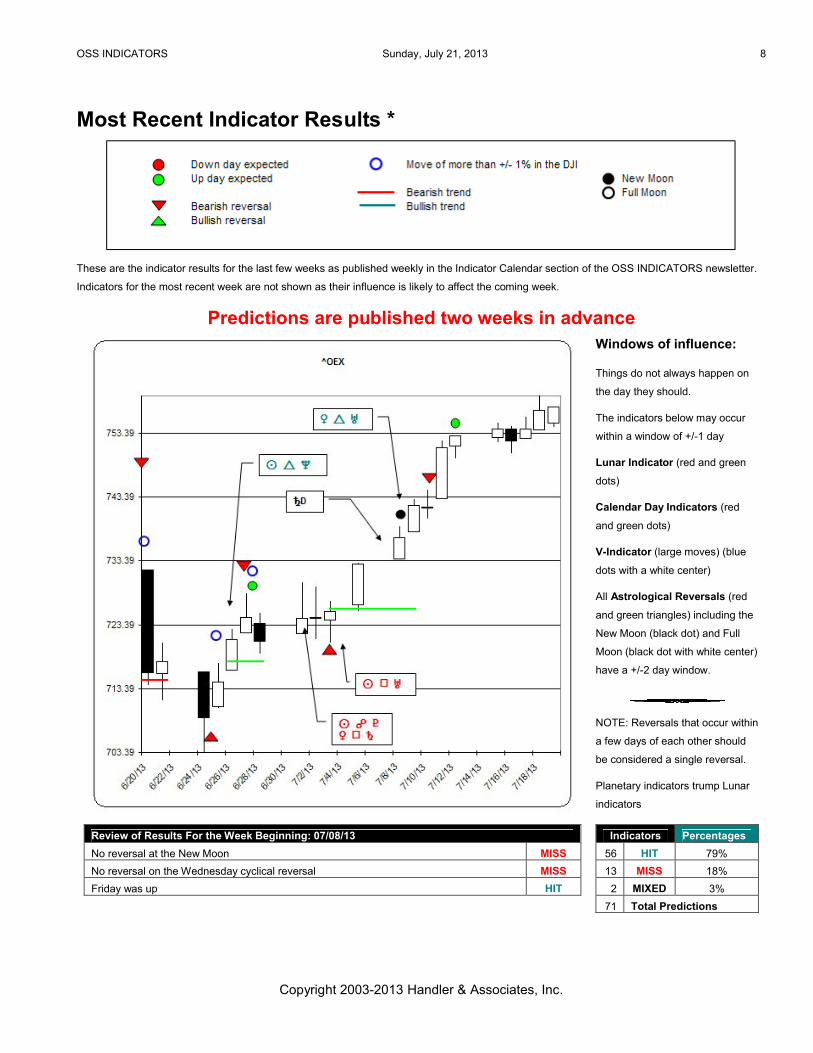
Most Recent Indicator Results *
These are the indicator results for the last few weeks as published weekly in the Indicator Calendar section of the OSS INDICATORS newsletter.
Indicators for the most recent week are not shown as their influence is likely to affect the coming week.
Predictions are published two weeks in advanceWindows of influence:
Things do not always happen on
the day they should.
The indicators below may occur
within a window of +/-1 day
Lunar Indicator (red and green
dots)
Calendar Day Indicators (red
and green dots)
V-Indicator (large moves) (blue
dots with a white center)
All Astrological Reversals (red
and green triangles) including the
New Moon (black dot) and Full
Moon (black dot with white center)
have a +/-2 day window.
NOTE: Reversals that occur within
a few days of each other should
be considered a single reversal.
Planetary indicators trump Lunar
indicators
Review of Results For the Week Beginning: 07/08/13
No reversal at the New Moon MISS
No reversal on the Wednesday cyclical reversal MISS
Friday was up HIT
Indicators Percentages
56 HIT 79%
13 MISS 18%
2 MIXED 3%
71 Total Predictions
OSS INDICATORS Sunday, July 21, 2013 9
Copyright 2003-2013 Handler & Associates, Inc.
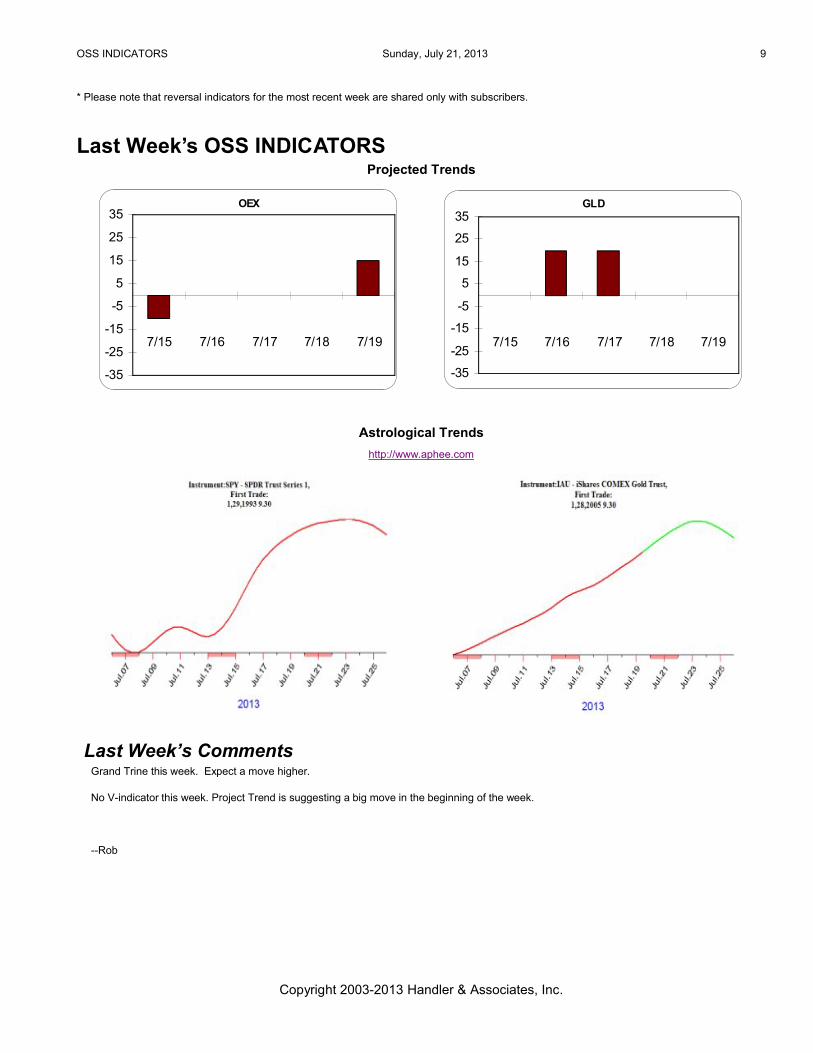
* Please note that reversal indicators for the most recent week are shared only with subscribers.
Last Week’s OSS INDICATORS Projected Trends
OEX
-35
-25
-15
-5
5
15
25
35
7/15 7/16 7/17 7/18 7/19
GLD
-35
-25
-15
-5
5
15
25
35
7/15 7/16 7/17 7/18 7/19
Astrological Trends
http://www.aphee.com
Last Week’s CommentsGrand Trine this week. Expect a move higher.
No V-indicator this week. Project Trend is suggesting a big move in the beginning of the week.
--Rob
OSS INDICATORS Sunday, July 21, 2013 10
Copyright 2003-2013 Handler & Associates, Inc.
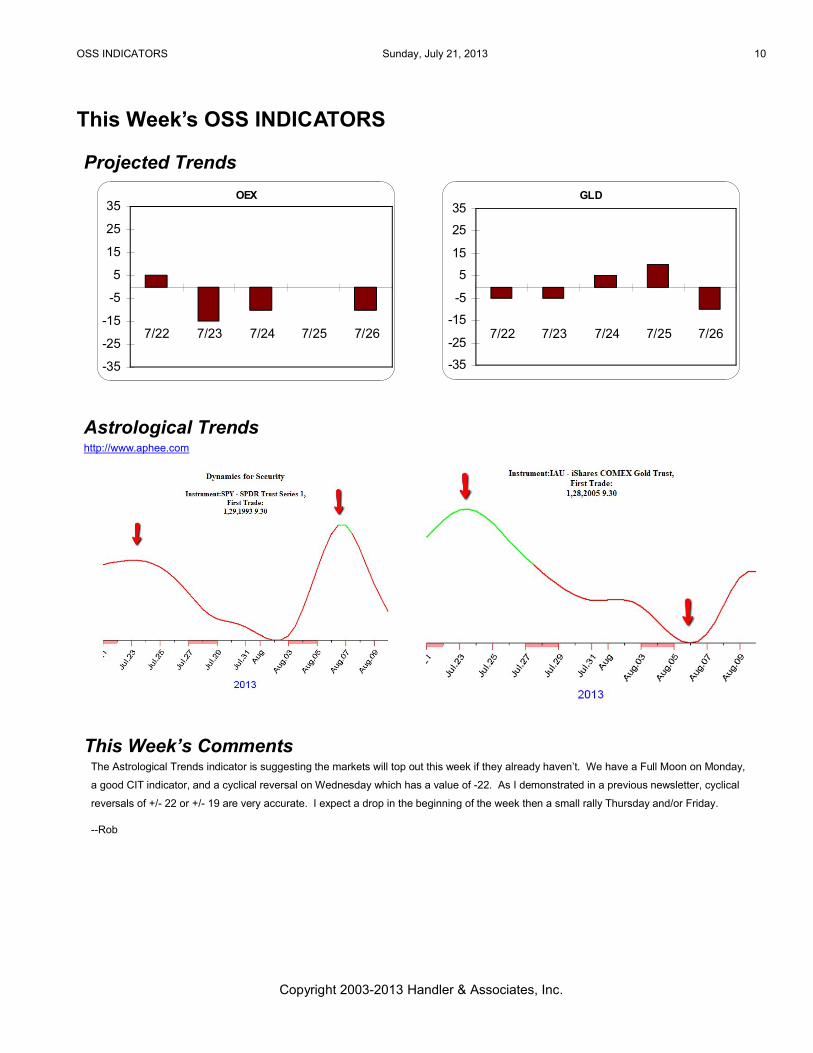
This Week’s OSS INDICATORS
Projected Trends
OEX
-35
-25
-15
-5
5
15
25
35
7/22 7/23 7/24 7/25 7/26
GLD
-35
-25
-15
-5
5
15
25
35
7/22 7/23 7/24 7/25 7/26
Astrological Trendshttp://www.aphee.com
This Week’s CommentsThe Astrological Trends indicator is suggesting the markets will top out this week if they already haven’t. We have a Full Moon on Monday,
a good CIT indicator, and a cyclical reversal on Wednesday which has a value of -22. As I demonstrated in a previous newsletter, cyclical
reversals of +/- 22 or +/- 19 are very accurate. I expect a drop in the beginning of the week then a small rally Thursday and/or Friday.
--Rob
OSS INDICATORS Sunday, July 21, 2013 11
Copyright 2003-2013 Handler & Associates, Inc.
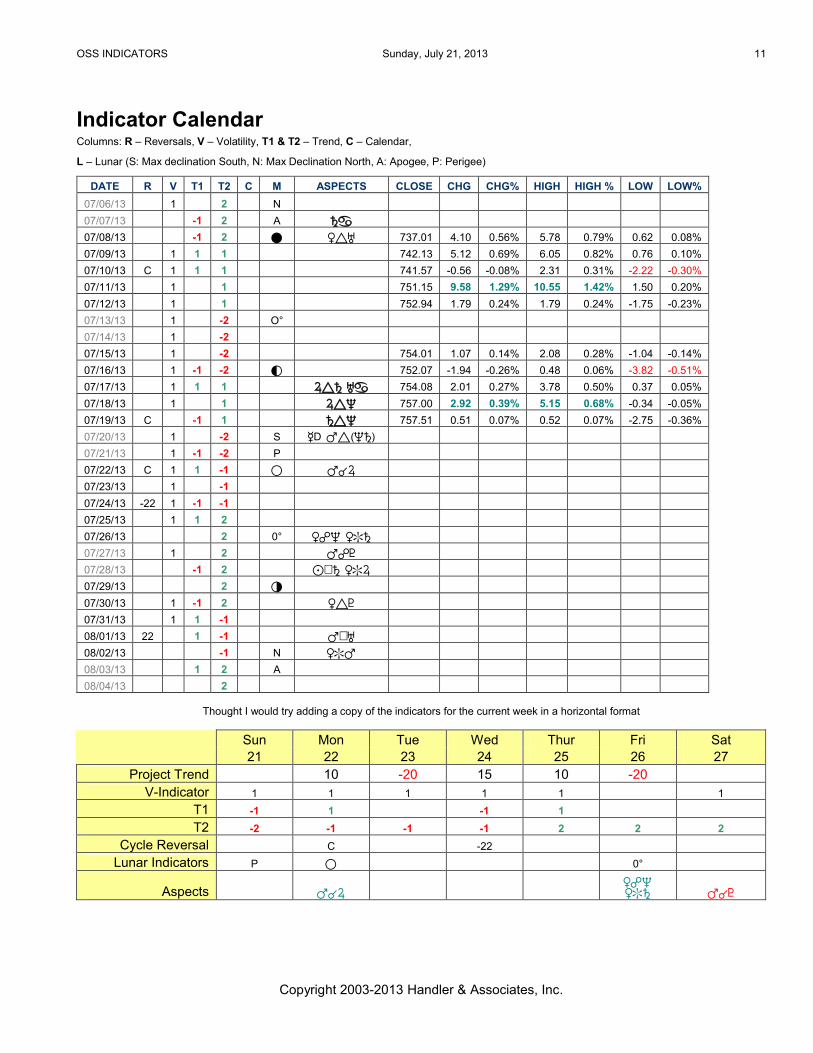
Indicator CalendarColumns: R – Reversals, V – Volatility, T1 & T2 – Trend, C – Calendar,
L – Lunar (S: Max declination South, N: Max Declination North, A: Apogee, P: Perigee)
DATE R V T1 T2 C M ASPECTS CLOSE CHG CHG% HIGH HIGH % LOW LOW%
07/06/13 1 2 N
07/07/13 -1 2 A RD
07/08/13 -1 2 ) TZS 737.01 4.10 0.56% 5.78 0.79% 0.62 0.08%
07/09/13 1 1 1 742.13 5.12 0.69% 6.05 0.82% 0.76 0.10%
07/10/13 C 1 1 1 741.57 -0.56 -0.08% 2.31 0.31% -2.22 -0.30%
07/11/13 1 1 751.15 9.58 1.29% 10.55 1.42% 1.50 0.20%
07/12/13 1 1 752.94 1.79 0.24% 1.79 0.24% -1.75 -0.23%
07/13/13 1 -2 O°
07/14/13 1 -2
07/15/13 1 -2 754.01 1.07 0.14% 2.08 0.28% -1.04 -0.14%
07/16/13 1 -1 -2 ! 752.07 -1.94 -0.26% 0.48 0.06% -3.82 -0.51%
07/17/13 1 1 1 MZR SD 754.08 2.01 0.27% 3.78 0.50% 0.37 0.05%
07/18/13 1 1 MZP 757.00 2.92 0.39% 5.15 0.68% -0.34 -0.05%
07/19/13 C -1 1 RZP 757.51 0.51 0.07% 0.52 0.07% -2.75 -0.36%
07/20/13 1 -2 S OD NZ(PR)
07/21/13 1 -1 -2 P
07/22/13 C 1 1 -1 # NtM
07/23/13 1 -1
07/24/13 -22 1 -1 -1
07/25/13 1 1 2
07/26/13 2 0° TuP T*R
07/27/13 1 2 NuQ
07/28/13 -1 2 [\R T*M
07/29/13 2 $
07/30/13 1 -1 2 TZQ
07/31/13 1 1 -1
08/01/13 22 1 -1 N\S
08/02/13 -1 N T*N
08/03/13 1 2 A
08/04/13 2
Thought I would try adding a copy of the indicators for the current week in a horizontal format
Sun Mon Tue Wed Thur Fri Sat21 22 23 24 25 26 27
Project Trend 10 -20 15 10 -20V-Indicator 1 1 1 1 1 1
T1 -1 1 -1 1
T2 -2 -1 -1 -1 2 2 2
Cycle Reversal C -22
Lunar Indicators P # 0°
Aspects NtMTuPT*R NtQ
OSS INDICATORS Sunday, July 21, 2013 12
Copyright 2003-2013 Handler & Associates, Inc.
This Week’s Lesson #1: Mars Oppose Pluto NuQ
OSS INDICATORS Sunday, July 21, 2013 13
Copyright 2003-2013 Handler & Associates, Inc.
This Week’s Lesson #2: Sun Square Saturn [\R
OSS INDICATORS Sunday, July 21, 2013 14
Copyright 2003-2013 Handler & Associates, Inc.
OSS INDICATORS Sunday, July 21, 2013 15
Copyright 2003-2013 Handler & Associates, Inc.
OSS INDICATORS Sunday, July 21, 2013 16
Copyright 2003-2013 Handler & Associates, Inc.
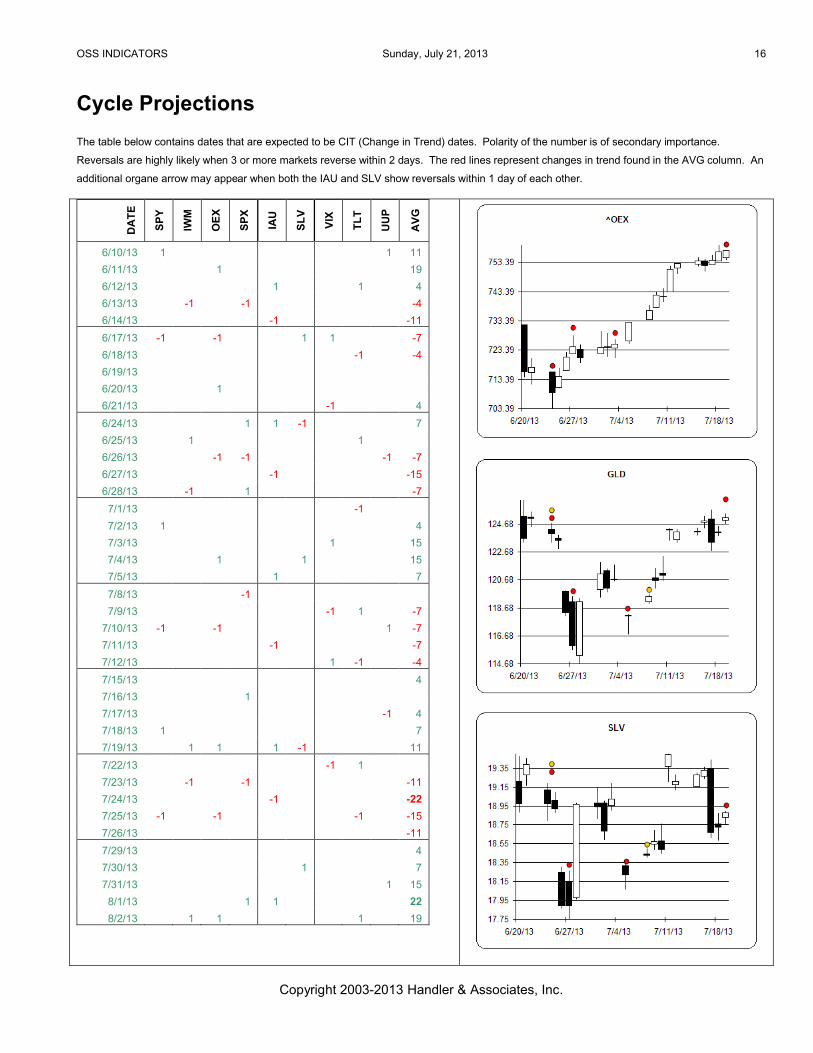
Cycle Projections
The table below contains dates that are expected to be CIT (Change in Trend) dates. Polarity of the number is of secondary importance.
Reversals are highly likely when 3 or more markets reverse within 2 days. The red lines represent changes in trend found in the AVG column. An
additional organe arrow may appear when both the IAU and SLV show reversals within 1 day of each other.
DA
TE
SP
Y
IWM
OE
X
SP
X
IAU
SL
V
VIX
TL
T
UU
P
AV
G
6/10/13 1 0 0 0 0 0 0 0 1 11
6/11/13 0 0 1 0 0 0 0 0 0 19
6/12/13 0 0 0 0 1 0 0 1 0 4
6/13/13 0 -1 0 -1 0 0 0 0 0 -4
6/14/13 0 0 0 0 -1 0 0 0 0 -11
6/17/13 -1 0 -1 0 0 1 1 0 0 -7
6/18/13 0 0 0 0 0 0 0 -1 0 -4
6/19/13 0 0 0 0 0 0 0 0 0 0
6/20/13 0 0 1 0 0 0 0 0 0 0
6/21/13 0 0 0 0 0 0 -1 0 0 4
6/24/13 0 0 0 1 1 -1 0 0 0 7
6/25/13 0 1 0 0 0 0 0 1 0 0
6/26/13 0 0 -1 -1 0 0 0 0 -1 -7
6/27/13 0 0 0 0 -1 0 0 0 0 -15
6/28/13 0 -1 0 1 0 0 0 0 0 -7
7/1/13 0 0 0 0 0 0 0 -1 0 0
7/2/13 1 0 0 0 0 0 0 0 0 4
7/3/13 0 0 0 0 0 0 1 0 0 15
7/4/13 0 0 1 0 0 1 0 0 0 15
7/5/13 0 0 0 0 1 0 0 0 0 7
7/8/13 0 0 0 -1 0 0 0 0 0 0
7/9/13 0 0 0 0 0 0 -1 1 0 -7
7/10/13 -1 0 -1 0 0 0 0 0 1 -7
7/11/13 0 0 0 0 -1 0 0 0 0 -7
7/12/13 0 0 0 0 0 0 1 -1 0 -4
7/15/13 0 0 0 0 0 0 0 0 0 4
7/16/13 0 0 0 1 0 0 0 0 0 0
7/17/13 0 0 0 0 0 0 0 0 -1 4
7/18/13 1 0 0 0 0 0 0 0 0 7
7/19/13 0 1 1 0 1 -1 0 0 0 11
7/22/13 0 0 0 0 0 0 -1 1 0 0
7/23/13 0 -1 0 -1 0 0 0 0 0 -11
7/24/13 0 0 0 0 -1 0 0 0 0 -22
7/25/13 -1 0 -1 0 0 0 0 -1 0 -15
7/26/13 0 0 0 0 0 0 0 0 0 -11
7/29/13 0 0 0 0 0 0 0 0 0 4
7/30/13 0 0 0 0 0 1 0 0 0 7
7/31/13 0 0 0 0 0 0 0 0 1 15
8/1/13 0 0 0 1 1 0 0 0 0 22
8/2/13 0 1 1 0 0 0 0 1 0 19
OSS INDICATORS Sunday, July 21, 2013 17
Copyright 2003-2013 Handler & Associates, Inc.
Notes:
Related Documents