ORGANIC RICHNESS AND THERMAL MATURITY OF POTENTIAL HYDROCARBON SOURCE ROCKS, LOWER PARMEENER SUPERGROUP, TASMANIA BASIN A professional opinion prepared by David M. McKirdy McKirdy Geoscience for November 2013

Welcome message from author
This document is posted to help you gain knowledge. Please leave a comment to let me know what you think about it! Share it to your friends and learn new things together.
Transcript

ORGANIC RICHNESS AND THERMAL MATURITY OF
POTENTIAL HYDROCARBON SOURCE ROCKS, LOWER PARMEENER SUPERGROUP,
TASMANIA BASIN
A professional opinion prepared by
David M. McKirdy
McKirdy Geoscience
for
November 2013

McKirdy Geoscience 2
Executive summary The organic richness and thermal maturity of the Permian Woody Island Formation in the central Tasmania Basin qualify it as a potential source for unconventional gas resources. Its total organic carbon content is at the low end of the range for marine shales known to be sources of commercial accumulations of petroleum hydrocarbons, while its kerogen ranges from oil-prone Type I/II to dry gas-prone Type IV. The volumetrically less significant shales and siltstones of the overlying Bundella Formation and Liffey Group are two to three times more organic-rich, although their kerogen is of poorer quality (Types III & IV). Regional maturation levels decrease southward, from the peak-oil generation zone of catagenesis in the north of the basin to the dry gas zone of metagenesis along the Styx Valley. Dolerite intrusions have locally increased the thermal maturity of the Woody Island Formation in the vicinity of Ross and the Liffey Group at Granton. The highest yields of free hydrocarbons (residual oil and gas) are found within the Woody Island Formation at Tunbridge and in the Styx Valley, making these localities the most prospective sites so far identified within the area encompassed by PetraGas’s permit application EL3/2013. Significantly, all three units exhibit many geochemical similarities with the Upper Palaeozoic Woodford and Barnett Shales, which host major shale oil and gas reserves in the southern midcontinent USA.
McKirdy Geoscience 3
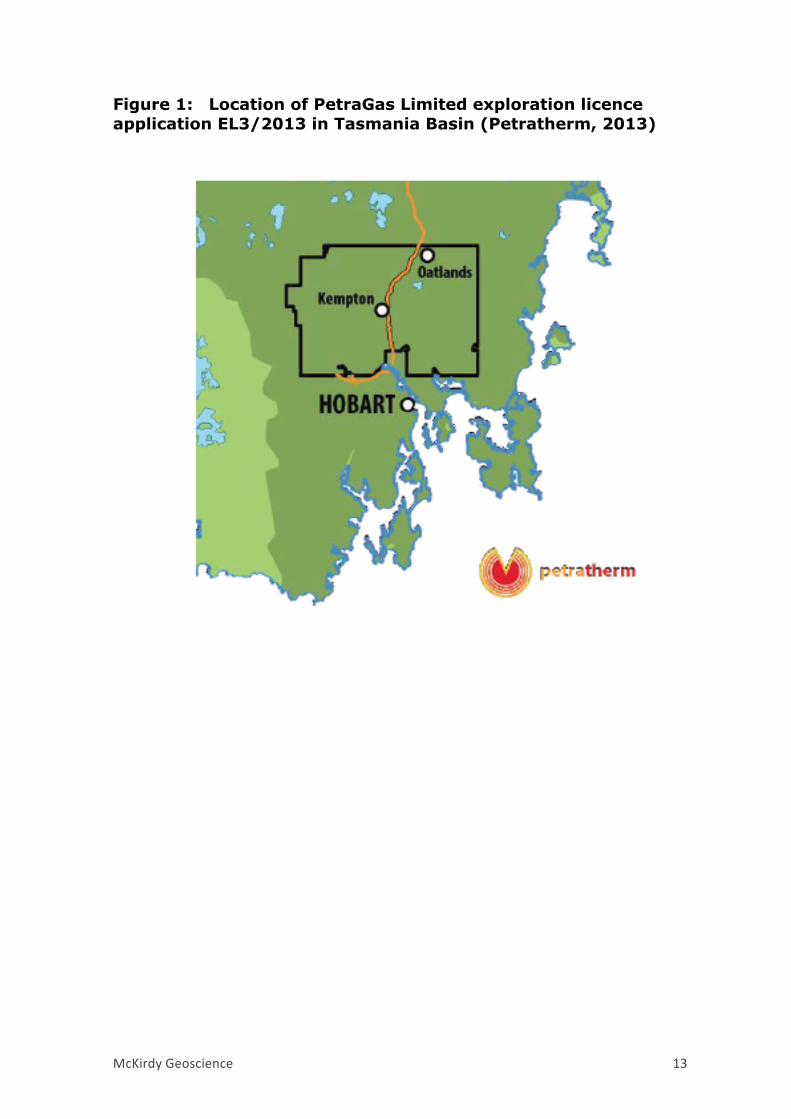
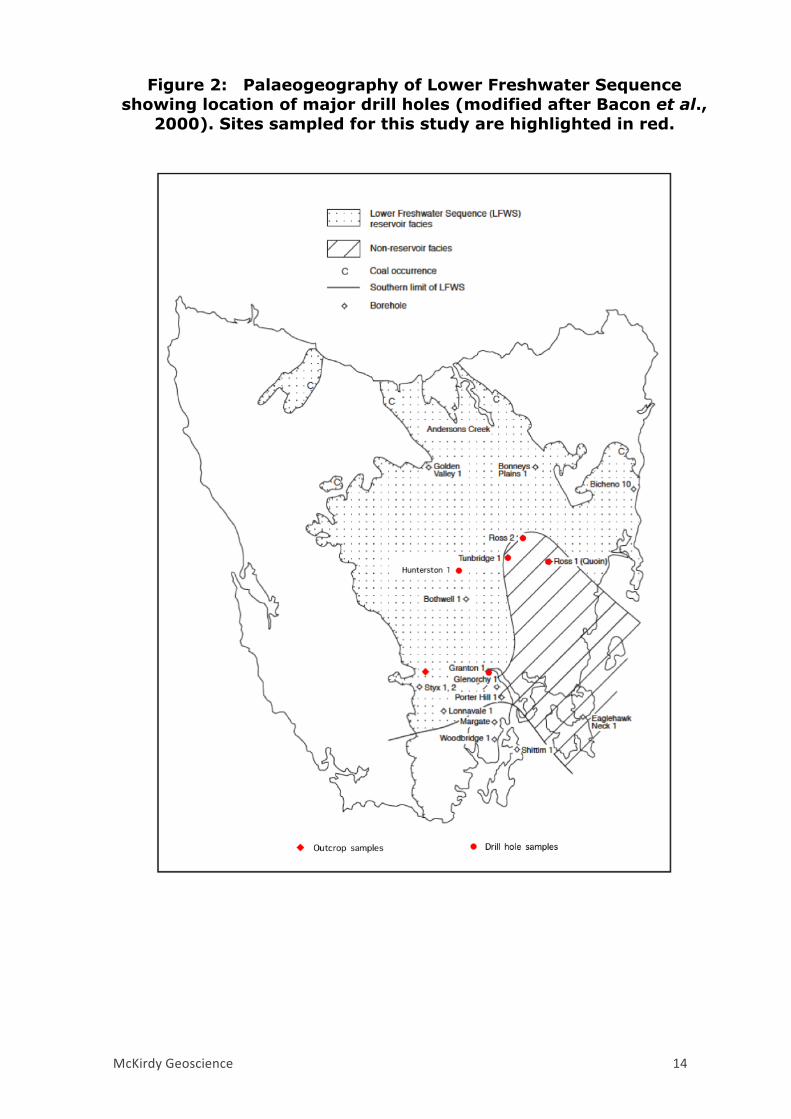
Introduction This brief report was prepared in response to a request from Peter Reid (Exploration Manager) for a review of the available total organic carbon (TOC), Rock-Eval and programmed pyrolysis data on the Woody Island Formation (non-Tasmanites facies), Bundella Formation and Liffey Group. These units are potential targets for unconventional shale oil and gas in subsidiary PetraGas’s proposed exploration of the onshore Tasmania Basin (application EL3/2013: Figure 1). Newly acquired analytical data on 20 samples (17 drill hole, 3 outcrop) were compared with archival data on the same units collated by the Tasmanian Geological Survey (Bacon et al., 2000) and more recent data from DDH Hunterston-1 (Reid et al., 2003). Sample locations are shown in Figure 2. The report addresses the following questions:
1. What is the organic richness of the aforementioned units and how does it vary across the study area?
2. What is the kerogen type and present thermal maturity of these units?
3. How do they compare with two Devonian-Carboniferous marine
formations that host major shale oil and gas plays in the southern mid-continent USA?
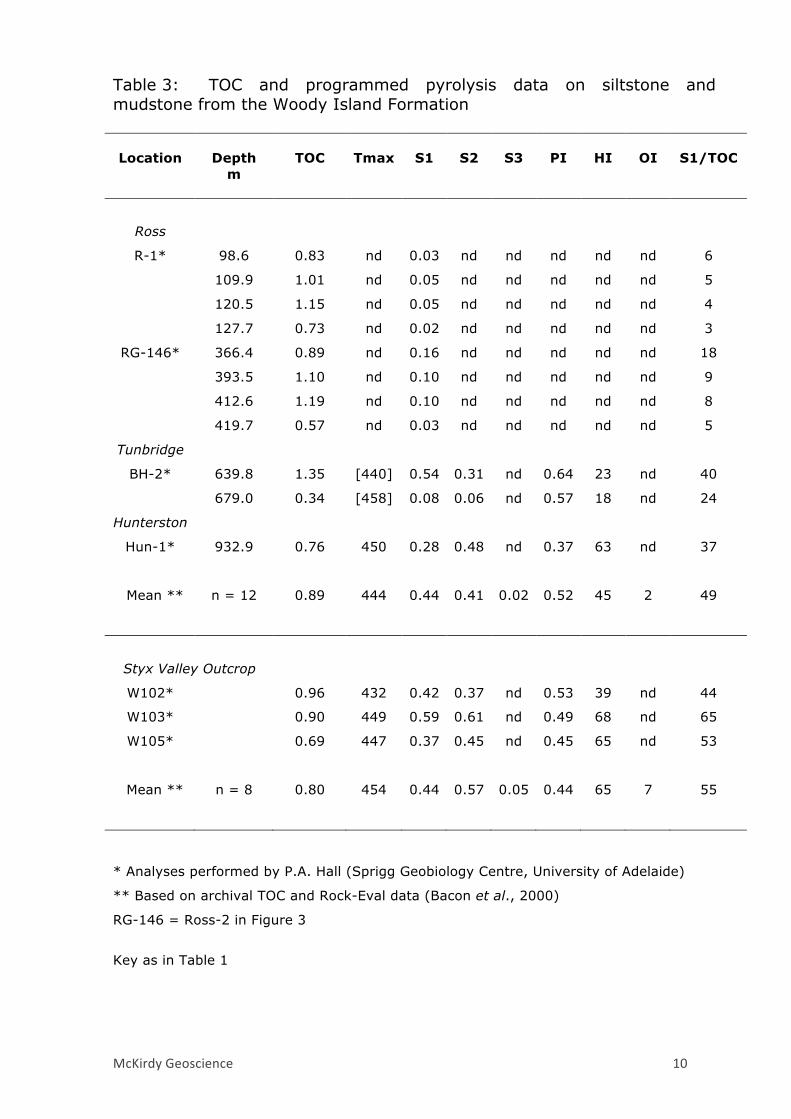
Analytical data The assembled organic geochemical data are presented in Tables 1–4 and Figures 3–6. Organic richness The TOC contents of the three units sampled in the study area (Figure 1) are summarised in Tables 1–3. In terms of conventional source rock richness, these values range from fair to very good. Their mean TOC contents range from 0.90% in the Woody Island Formation (n = 34), through 1.92% in the Liffey Group (n = 9), to 2.97% in the Bundella Formation (n = 2). The highest values recorded in each unit are 1.35%, 3.10% and 4.34%, respectively, all from the Tunbridge and Hunterston drill holes located in the central Tasmania Basin (Figure 2). The results for the Woody Island Formation compare favourably with those previously reported from Ross-1 (78-128 m depth, mean 1.1% TOC) and Bicheno-10 (mean 1.2%, maximum 1.7%: Bacon et al., 2000).
McKirdy Geoscience 4
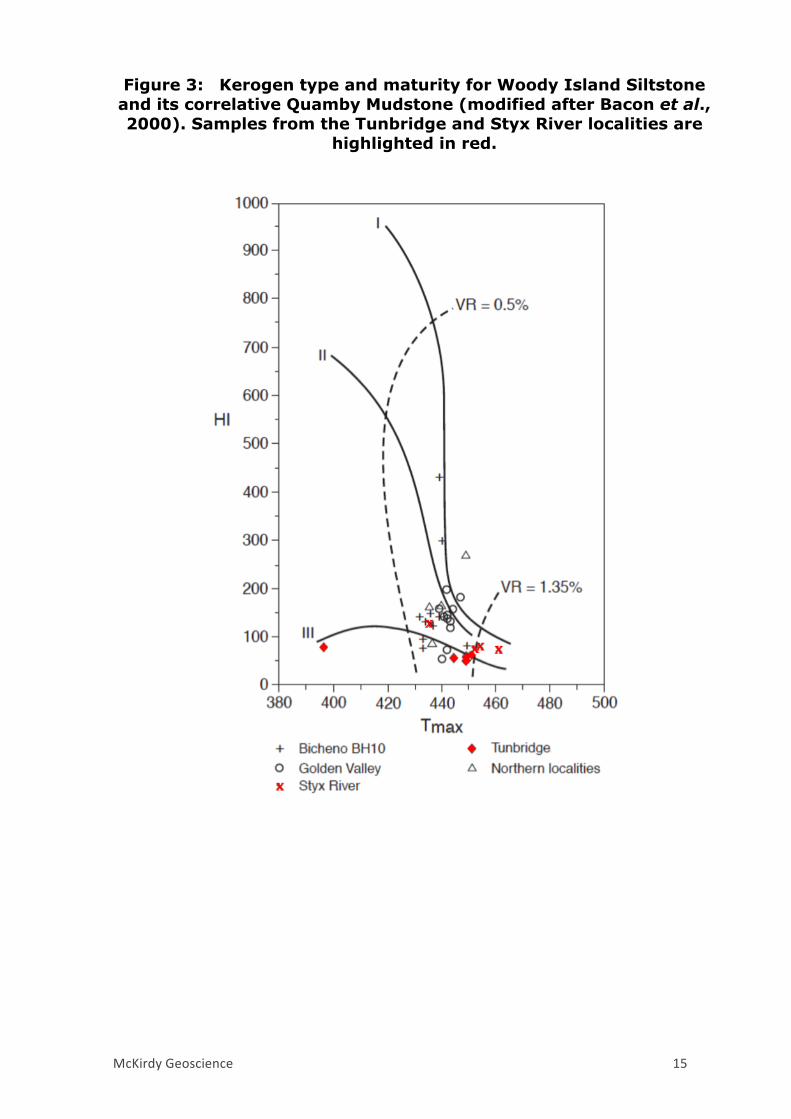
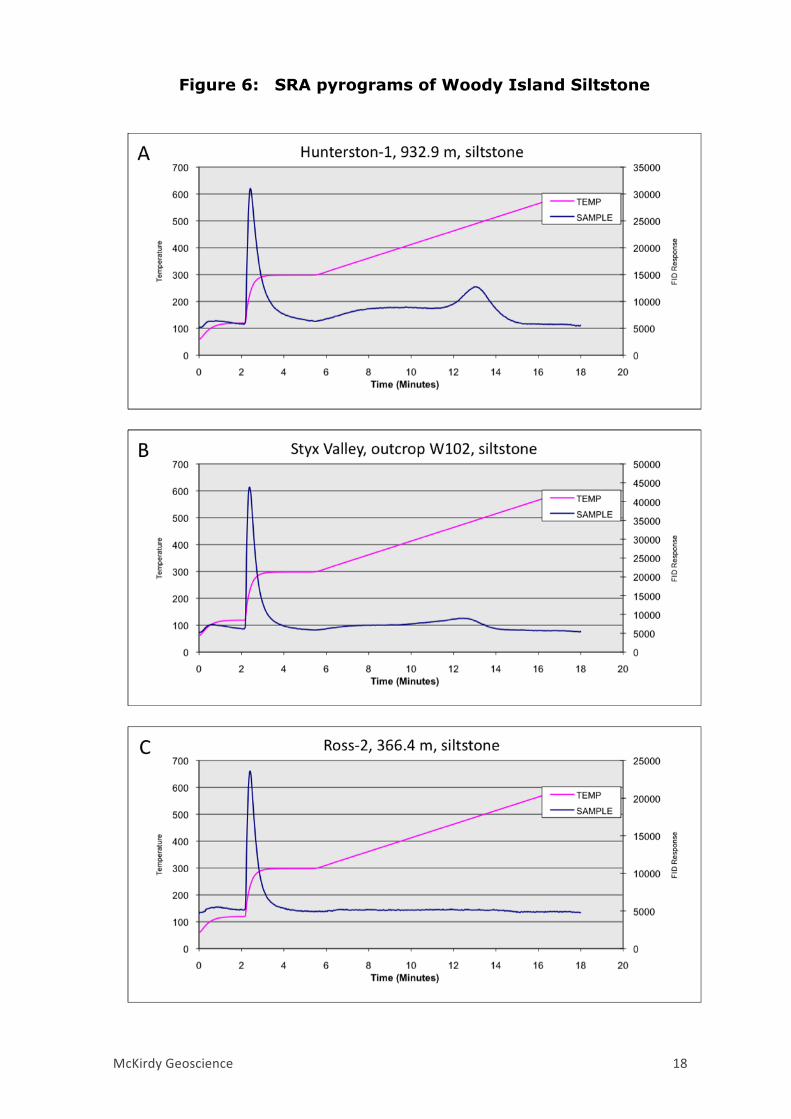
The corresponding mean normalised free hydrocarbon yields (in mg HC/g TOC) range from 11 in the Liffey Group, through 21 in the Bundella Formation, to 38 in the Woody Island Formation, with the highest values being 25, 29 and 95, respectively. The highest yields (commonly >50 mg/g TOC) were obtained from the Woody Island Formation in the Tunbridge drill hole and the Styx Valley (Figure 2). Kerogen type and thermal maturity The hydrocarbon generative potential of a source rock depends on its kerogen type and thermal maturity, the assignment of which in this instance is based on the hydrogen index, Tmax and calculated vitrinite reflectance data summarised in Table 4. Given the Permian age, carbonaceous pyritic shale/mudstone/siltstone lithofacies and suboxic marine depositional setting of the Woody Island and Bundella Formations (Bacon et al., 2000), it is reasonable to assume that their original dispersed organic matter was mostly of algal origin, giving rise to oil and gas-prone Type II kerogen. The paralic depocentre of the Liffey Group shale would have received a greater input of allochthonous higher plant detritus, and so its protokerogen is likely to have been gas-prone Type III in composition. The regional variation of both the thermal maturity and kerogen type of the Woody Island Formation (non-tasmanite facies) is illustrated in Figure 3. There is a clear trend of increasing thermal maturity from peak oil-generative Type I/II kerogen at Bicheno, Golden Valley and other northern localities, to late mature (light oil and wet gas-generating) and overmature (dry gas-generating) Type II and III kerogens at Tunbridge and in the Styx Valley. This interpretation is supported by methylphenanthrene index (MPI)-derived calculated vitrinite reflectance values of 1.35% for the Woody Island Formation (or its correlative) at Tunbridge-1 and Ross-2 (Bacon et al., 2000, table 5). The apparent shift from Type II to Type III kerogen in the late oil window may in part reflect the micrinitisation of bituminite and other oil-prone liptinite macerals (e.g. alginite) following their catagenic release of liquid hydrocarbons. Low free hydrocarbon yields from the Woody Island Formation at Ross-1 (3-6 mg/g TOC: Table 3) may be partly attributable to local heating by igneous intrusions (Bacon et al., 2000). Here the base of the formation is 85 m above a 470+ m-thick dolerite sill. At Ross-2, where the base of the formation lies 63 m above a 21 m-thick dolerite intersection there is a steady decline in hydrocarbon yield, from 18 mg/g TOC at 366 m to 5 mg/g TOC at 420 m depth.
McKirdy Geoscience 5
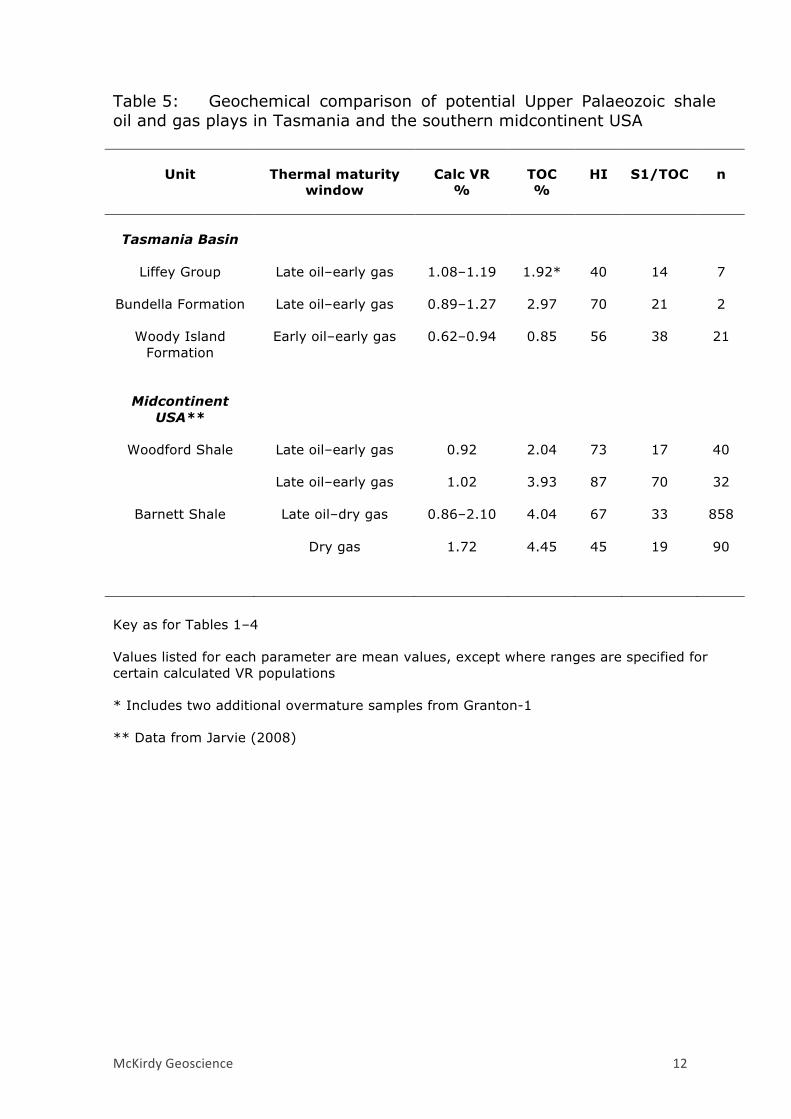
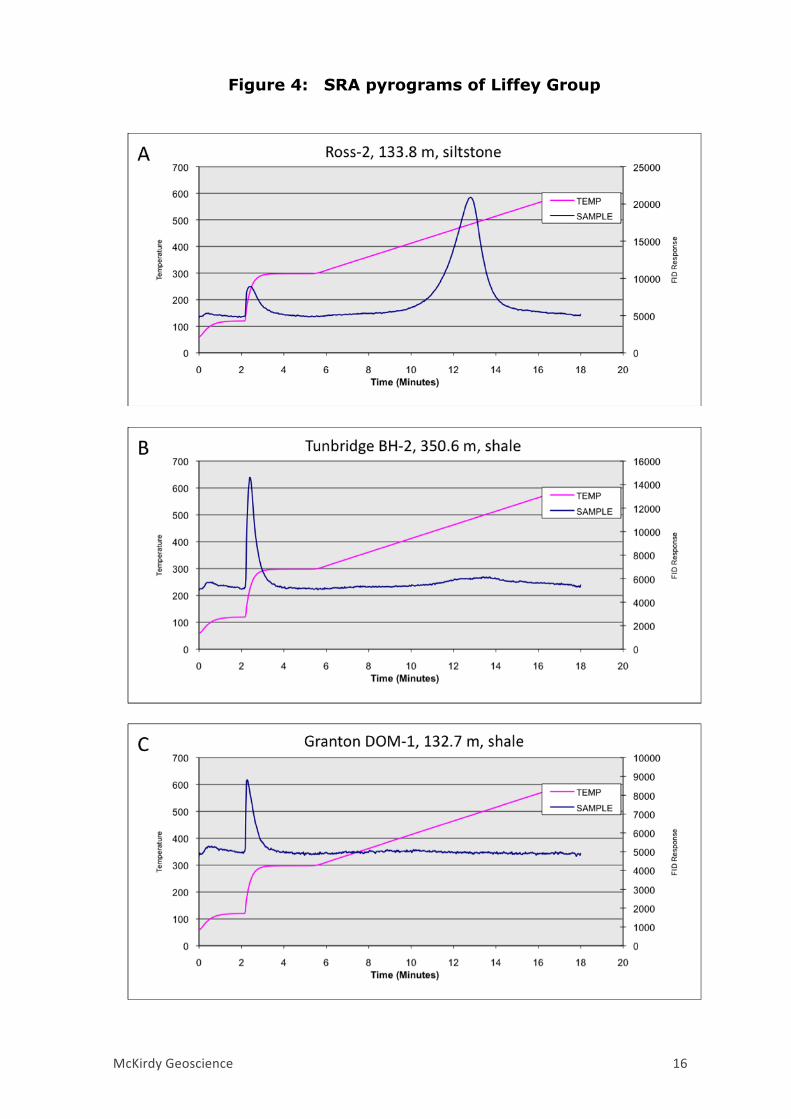
Likewise, the very low hydrocarbon yields from shale of the Liffey Group at Granton (2 mg/g TOC: Table 1), and the lack of an S2 peak in its pyrogram (Figure 4) suggests overmaturity due to baking by a dolerite intrusion. The pyrograms shown in Figure 4 illustrate three stages in the thermal progression of this source rock from late oil window to overmature (i.e. totally spent). All marine shales undergo significant loss of organic carbon during the oil and gas-generation phases of thermal maturation (Raiswell and Berner, 1987). According to Hunt (1996), the maximum theoretical loss of TOC from a source rock during the generation and expulsion of hydrocarbons (oil and gas) is 48% for Type II kerogen, compared with 25% for Type III kerogen. The above estimates may be somewhat conservative. According to Behar and Vandenbroucke (1987), Type II kerogens lose ~60% of their original organic carbon during the oil generation phase of maturation (0.5–1.2% vitrinite reflectance). Fate of generated hydrocarbons Regardless of their kerogen type and initial hydrogen index, expulsion efficiencies for rocks containing less than 1–2% TOC are likely to be low (Peters et al., 2005). Accordingly, in his petrographic study of the Devonian Woodford Shale, Lewin (1987) concluded that rocks with TOC values <2.5% contained insufficient dispersed organic matter to establish a continuous bitumen network, necessary for primary oil migration and expulsion to occur. In other words, the generated oil is retained in the source rock for subsequent cracking to gas. It is of interest that this formation was subsequently identified as a major source of unconventional oil and gas (Jarvie, 2008: see below). Comparison with known shale oil and gas plays In terms of their present organic richness, normalised hydrocarbon yield, hydrogen index and thermal maturity, three potential source rocks in the central and southern Tasmania Basin compare favourably with the aforementioned Woodford Shale and another formation, the Mississippian Barnett Shale (Jarvie et al., 2005, 2007; Kinley et al., 2008), which together host major shale oil and gas plays throughout Texas, Oklahoma, New Mexico and Kansas (Table 5). Conclusions The three units sampled display fair to good source rock potential for oil and gas, both conventional and unconventional. Although they are the least organic-rich, siltstones of the Woody Island Formation are

McKirdy Geoscience 6
volumetrically more significant than the more carbonaceous shales of the overlying Bundella Formation and Liffey Group. The highest normalised free hydrocarbon yields were measured in samples of the Woody Island Formation from the Tunbridge and Styx Valley localities, where it exceeds 200 m in thickness. This finding confirms the shale gas prospectivity of the western half of PetraGas’s permit application. Geochemically, these Tasmanian shales and siltstones appear remarkably similar to the Woodford and Barnett Shales which host major unconventional oil and gas resources in the southern USA. References BACON, C.A., CALVER, C.R., BOREHAM, C.J., LEAMAN, D.E., MORRISON, K.C., REVILL, A.T. and VOLKMAN, J.K., 2000. The petroleum potential of onshore Tasmania: a review. Geological Survey of Tasmania Bulletin 71, 93 p. BEHAR, F.H. and VANDENBROUCKE, M., 1987. Chemical modelling of kerogens. Organic Geochemistry, 11, 15–24. HUNT, J.M., 1996. Petroleum Geochemistry and Geology. W.H. Freeman, New York. JARVIE, D.M., 2008. Geochemical characteristics of the Devonian Woodford Shale. Presentation to Oklahoma Gas Shales Symposium, Oklahoma Geological Survey, Oklahoma City, Oct. 22. JARVIE, D.M., HILL, R.J. and POLLASTRO, R.M., 2005. Assessment of the gas potential and yields from shales: the Barnett Shale model. In: Cardott, B.J. (ed.), Unconventional Energy Sources in the Southern Midcontinent, 2004 Symposium. Oklahoma Geological Survey Circular 110, pp. 37-50. JARVIE, D.M., HILL, R.J., RUBLE, T.E. and POLLASTRO, R.M., 2007. Unconventional shale-gas systems: the Mississippian Barnett Shale of north-central Texas as one model for thermogenic shale-gas assessment. AAPG Bulletin, 91, 475–495. KINLEY, T.J., COOK, L.W., BREYER, J.A., JARVIE, D.M. and BUSBEY, A.B., 2008. Hydrocarbon potential of the Barnett Shale (Mississippian), Delaware Basin, west Texas and southeastern New Mexico. AAPG Bulletin, 92, 967–991.
McKirdy Geoscience 7
LEWAN, M.D., 1987. Petrographic study of primary petroleum migration in the Woodford Shale and related rock units. In: Doligez, B. (ed.), Migration of Hydrocarbons in Sedimentary Basins. Editions Technip, Paris, pp. 113–130. PETERS, K.E., WALTERS, C.C. and MOLDOWAN, J.M., 2005. The Biomarker Guide, 2nd edition, Vol. 1: Biomarkers and isotopes in petroleum exploration and Earth history. Cambridge University Press, Cambridge, p. 100. PETRATHERM, 2013. Clean energy for future generations. Quarterly Report, Petratherm Ltd, 30 October. RAISWELL, R. and BERNER, R.A., 1987. Organic carbon losses during burial and thermal maturation of normal marine shales. Geology, 15, 853– 856. REID, C.M., CHESTER, A.D., STACEY, A.R. and BURRETT, C.R., 2003. Stratigraphic results of diamond drilling of the Hunterston Dome, Tasmania: implications for palaeogeography and hydrocarbon potential. Papers and Proceedings of the Royal Society of Tasmania, 137, 87–94.

McKirdy Geoscience 8
Table 1: TOC and programmed pyrolysis data on shale and siltstone from the Liffey Group
Location
Depth
m
TOC
Tmax
S1
S2
S3
PI
HI
OI
S1/TOC
Ross
RG-146* 133.8 0.75 445 0.03 0.43 nd 0.07 57 nd 4
Tunbridge
BH-2* 350.6 0.80 [467] 0.09 0.10 nd 0.47 11 nd 11
361.4 2.21 [436] 0.12 0.34 nd 0.26 5 nd 5
Hunterston
Hun-1** 850.2 3.10 459 0.54 1.90 nd 0.22 61 nd 17
856.5 2.35 464 0.38 1.84 nd 0.17 78 nd 16
859.2 2.24 458 0.41 1.49 nd 0.22 67 nd 17
869.5 2.20 464 0.55 1.51 nd 0.27 71 nd 25
Granton
DOM-1* 132.7 1.11 nd 0.02 nd nd nd nd nd 2
157.8 2.48 nd 0.48 nd nd nd nd nd 2
* Analyses performed by P.A. Hall (Sprigg Geobiology Centre, University of Adelaide)
** Based on archival TOC and Rock-Eval data (Reid et al., 2003)
RG-146 = Ross-2 in Figure 2
Key
nd = not determined
[ ] = unreliable because of low S2
TOC = total organic carbon (wt %)
Tmax = temperature at which S2 peak reaches its maximum (ºC)
HI = hydrogen index (mg hydrocarbons/g TOC)
S1 = free hydrocarbons (mg hydrocarbons/g rock) = residual oil
S2 = hydrocarbons released from kerogen (mg hydrocarbons/g rock)
S3 = CO2 released from kerogen (mg CO2/g rock)
PI = S1 / (S1 + S2)
HI = hydrogen index (mg S2/g TOC)
OI = oxygen index (mg S3/g TOC)
S1/TOC = mg free hydrocarbons/g TOC

McKirdy Geoscience 9
Table 2: TOC and programmed pyrolysis data on shale and siltstone from the Bundella Formation
Location
Depth
m
TOC
Tmax
S1
S2
S3
PI
HI
OI
S1/TOC
Tunbridge
BH-2* 390.1 4.34 468 0.53 2.55 nd 0.17 59 nd 12
Hunterston
Hun-1** 874.4 1.26 447 0.36 1.01 nd 0.26 80 nd 29
* Analysis performed by P.A. Hall (Sprigg Geobiology Centre, University of Adelaide)
** Based on archival TOC and Rock-Eval data (Reid et al., 2003) Key as in Table 1
McKirdy Geoscience 10
Table 3: TOC and programmed pyrolysis data on siltstone and mudstone from the Woody Island Formation
Location
Depth
m
TOC
Tmax
S1
S2
S3
PI
HI
OI
S1/TOC
Ross
R-1* 98.6 0.83 nd 0.03 nd nd nd nd nd 6
109.9 1.01 nd 0.05 nd nd nd nd nd 5
120.5 1.15 nd 0.05 nd nd nd nd nd 4
127.7 0.73 nd 0.02 nd nd nd nd nd 3
RG-146* 366.4 0.89 nd 0.16 nd nd nd nd nd 18
393.5 1.10 nd 0.10 nd nd nd nd nd 9
412.6 1.19 nd 0.10 nd nd nd nd nd 8
419.7 0.57 nd 0.03 nd nd nd nd nd 5
Tunbridge
BH-2* 639.8 1.35 [440] 0.54 0.31 nd 0.64 23 nd 40
679.0 0.34 [458] 0.08 0.06 nd 0.57 18 nd 24
Hunterston
Hun-1* 932.9 0.76 450 0.28 0.48 nd 0.37 63 nd 37
Mean ** n = 12 0.89 444 0.44 0.41 0.02 0.52 45 2 49
Styx Valley Outcrop
W102* 0.96 432 0.42 0.37 nd 0.53 39 nd 44
W103* 0.90 449 0.59 0.61 nd 0.49 68 nd 65
W105* 0.69 447 0.37 0.45 nd 0.45 65 nd 53
Mean ** n = 8 0.80 454 0.44 0.57 0.05 0.44 65 7 55
* Analyses performed by P.A. Hall (Sprigg Geobiology Centre, University of Adelaide)
** Based on archival TOC and Rock-Eval data (Bacon et al., 2000)
RG-146 = Ross-2 in Figure 3
Key as in Table 1

McKirdy Geoscience 11
Table 4: Thermal maturity and kerogen type
Location
Depth
m
Unit
Calc VR *
%
Maturity **
Kerogen type **
Ross
RG-146 133.8 LG 0.85 Late oil window III
Tunbridge
BH-2 350.6 LG 1.24 Overmature III
390.1 BF 1.27 Overmature II
639.8 WIF 0.76 Early oil window IV
679.0 WIF 1.09 Overmature III
Hunterston
Hun-1 874.4 BF 0.89 Late oil window III
932.9 WIF 0.94 Late oil window III
Styx Valley Outcrop
W102 WIF 0.62 Initially mature III-IV
W103 WIF 0.93 Late oil window III
W105 WIF 0.89 Late oil window III
S3# WIF 1.01 Overmature II
S6# WIF 1.14 Overmature II
S10# WIF 0.98 Late oil window II
S11# WIF 0.69 Early oil window II
* Calculated vitrinite reflectance, VR (%) = 0.018 x Tmax – 7.16 (Jarvie et al., 2007)
** Based on comparison of HI and Tmax values in Tables 1–3 with Figure 3
Based on data from Reid et al. (2003)
# Based on data from Bacon et al. (2000)
LG = Liffey Group BF = Bundella Formation WIF = Windy Island Formation
McKirdy Geoscience 12
Table 5: Geochemical comparison of potential Upper Palaeozoic shale oil and gas plays in Tasmania and the southern midcontinent USA
Unit
Thermal maturity
window
Calc VR
%
TOC %
HI
S1/TOC
n
Tasmania Basin
Liffey Group
Late oil–early gas 1.08–1.19 1.92* 40 14 7
Bundella Formation
Late oil–early gas 0.89–1.27 2.97 70 21 2
Woody Island Formation
Early oil–early gas 0.62–0.94 0.85 56 38 21
Midcontinent
USA**
Woodford Shale
Late oil–early gas 0.92 2.04 73 17 40
Late oil–early gas
1.02 3.93 87 70 32
Barnett Shale Late oil–dry gas
0.86–2.10 4.04 67 33 858
Dry gas
1.72 4.45 45 19 90
Key as for Tables 1–4 Values listed for each parameter are mean values, except where ranges are specified for certain calculated VR populations * Includes two additional overmature samples from Granton-1 ** Data from Jarvie (2008)
McKirdy Geoscience 13
Figure 1: Location of PetraGas Limited exploration licence application EL3/2013 in Tasmania Basin (Petratherm, 2013)
McKirdy Geoscience 14
Figure 2: Palaeogeography of Lower Freshwater Sequence showing location of major drill holes (modified after Bacon et al.,
2000). Sites sampled for this study are highlighted in red.
McKirdy Geoscience 15
Figure 3: Kerogen type and maturity for Woody Island Siltstone and its correlative Quamby Mudstone (modified after Bacon et al., 2000). Samples from the Tunbridge and Styx River localities are
highlighted in red.
McKirdy Geoscience 16
Figure 4: SRA pyrograms of Liffey Group

McKirdy Geoscience 17
Figure 5: SRA pyrogram of Bundella Formation
McKirdy Geoscience 18
Figure 6: SRA pyrograms of Woody Island Siltstone

McKirdy Geoscience 19
For further information please contact McKirdy Geoscience ABN 33 558 021 809 David M. McKirdy BSc (Hons), MSc, PhD, DipT Principal Consultant 11 Dover Street Malvern SA, 5061 Australia Phone +61 8 8272 0520 E-mail [email protected]
Related Documents