1 Optical performance requirements for MEMS-scanner based microdisplays Hakan Urey, David W. Wine, Thor D. Osborn Microvision Inc., 19910 North Creek Pkwy, Bothell, WA 98011 Phone/Fax: +1(425) 415-6736 / 6601, E-mail: [email protected] ABSTRACT High-resolution (i.e., large pixel-count) and high frame rate dynamic microdisplays can be implemented by scanning a photon beam in a raster format across the viewer’s retina. Microvision is developing biaxial MEMS scanners for such video display applications. This paper discusses the optical performance requirements for scanning display systems. The display resolution directly translates into a scan-angle-mirror-size product (θD-product) and the frame rate translates into vertical and horizontal scanner frequencies (f v and f h ). θD-product and f h are both very important figures of merit for scanner performance comparison. In addition, the static and dynamic flatness of the scanners, off-axis motion and scan repeatability, scanner position sensor accuracy all have a direct impact on display image quality. Keywords: Scanner, Resolution, Retinal Scanning Display, RSD 1. INTRODUCTION There are many competing technologies for displays that are used in hand-held or head-worn devices. Microvision is developing the Retinal Scanning Display (RSD) technology, where point light sources (e.g., laser diode, fiber-coupled laser, LED) are scanned onto a screen or directly onto a retina as a 2-D raster pattern using two uniaxial or one biaxial scanner. Current Microvision RSDs use torsional flexure-based mechanical scanners that have the potential to enable a scanning display that meets the simultaneous requirements of speed, resolution, size, and cost, while retaining all other advantages demonstrated by other scanning systems (e.g., laser printer, CRT) 1 . For example, the single scanned pixel can be well controlled without many of the compromises needed to treat 10 6 pixels of a matrix display. Microvision has developed an array of scanning technologies that show promise for RSDs, including Microvision’s mechanical resonant scanner and biaxial MEMS scanners. Another paper published in these proceedings discusses the scanner and display performance using current Microvision MEMS scanners. 2 For mass production at low cost, MEMS scanners have significant advantages compared to matrix displays, including smaller wafer area and higher yield, especially for VGA and higher resolutions. Further development of compact light sources and MEMS scanner technology will assist RSD technology in growing rapidly in a number of diverse application areas. In this paper we review the scanner performance requirements for scanner based dynamic display systems using mechanical scan mirrors. Section 2 discusses biaxial scanner architecture and RSD operation. Section 3 details the resolution, pixel timing, scanner frequency, and raster quality requirements. Section 4 discusses dynamic flatness theory and presents results of MEMS scanner dynamic flatness measurements. 2. SCANNER ARCHITECTURE AND RSD OPERATION In this paper we assume that the horizontal scan axis is resonant, and the vertical scan axis is non-resonant and driven with a sawtooth waveform at the refresh rate of the display. As will be discussed in Section 3.2, the horizontal scanner will typically run at frequencies exceeding 10 KHz, and should provide a large scan angle-mirror size product. The resonant torsional scanner can meet these frequency and resolution requirements with the added advantage of low power consumption. Additionally, the resonant horizontal scanner can provide a master pixel clock for the system. For good image quality, the vertical scan position and frequency should derive from the horizontal scanner position and frequency. Therefore, the vertical axis is preferably non-resonant and driven with a waveform that provides equal spacing between raster lines. A fast vertical retrace time at the end of each frame reduces constraints on the system design caused by limited frame periods.

Welcome message from author
This document is posted to help you gain knowledge. Please leave a comment to let me know what you think about it! Share it to your friends and learn new things together.
Transcript
1
Optical performance requirements for MEMS-scanner basedmicrodisplays
Hakan Urey, David W. Wine, Thor D. Osborn
Microvision Inc., 19910 North Creek Pkwy, Bothell, WA 98011Phone/Fax: +1(425) 415-6736 / 6601, E-mail: [email protected]
ABSTRACT
High-resolution (i.e., large pixel-count) and high frame rate dynamic microdisplays can be implemented by scanning aphoton beam in a raster format across the viewer’s retina. Microvision is developing biaxial MEMS scanners for such videodisplay applications. This paper discusses the optical performance requirements for scanning display systems. The displayresolution directly translates into a scan-angle-mirror-size product (θD-product) and the frame rate translates into vertical andhorizontal scanner frequencies (fv and fh). θD-product and fh are both very important figures of merit for scanner performancecomparison. In addition, the static and dynamic flatness of the scanners, off-axis motion and scan repeatability, scannerposition sensor accuracy all have a direct impact on display image quality.
Keywords: Scanner, Resolution, Retinal Scanning Display, RSD
1. INTRODUCTIONThere are many competing technologies for displays that are used in hand-held or head-worn devices. Microvision isdeveloping the Retinal Scanning Display (RSD) technology, where point light sources (e.g., laser diode, fiber-coupled laser,LED) are scanned onto a screen or directly onto a retina as a 2-D raster pattern using two uniaxial or one biaxial scanner.Current Microvision RSDs use torsional flexure-based mechanical scanners that have the potential to enable a scanningdisplay that meets the simultaneous requirements of speed, resolution, size, and cost, while retaining all other advantagesdemonstrated by other scanning systems (e.g., laser printer, CRT)1. For example, the single scanned pixel can be wellcontrolled without many of the compromises needed to treat 106 pixels of a matrix display.
Microvision has developed an array of scanning technologies that show promise for RSDs, including Microvision’smechanical resonant scanner and biaxial MEMS scanners. Another paper published in these proceedings discusses thescanner and display performance using current Microvision MEMS scanners.2 For mass production at low cost, MEMSscanners have significant advantages compared to matrix displays, including smaller wafer area and higher yield, especiallyfor VGA and higher resolutions. Further development of compact light sources and MEMS scanner technology will assistRSD technology in growing rapidly in a number of diverse application areas.
In this paper we review the scanner performance requirements for scanner based dynamic display systems using mechanicalscan mirrors. Section 2 discusses biaxial scanner architecture and RSD operation. Section 3 details the resolution, pixeltiming, scanner frequency, and raster quality requirements. Section 4 discusses dynamic flatness theory and presents resultsof MEMS scanner dynamic flatness measurements.
2. SCANNER ARCHITECTURE AND RSD OPERATIONIn this paper we assume that the horizontal scan axis is resonant, and the vertical scan axis is non-resonant and driven with asawtooth waveform at the refresh rate of the display. As will be discussed in Section 3.2, the horizontal scanner will typicallyrun at frequencies exceeding 10 KHz, and should provide a large scan angle-mirror size product. The resonant torsionalscanner can meet these frequency and resolution requirements with the added advantage of low power consumption.Additionally, the resonant horizontal scanner can provide a master pixel clock for the system. For good image quality, thevertical scan position and frequency should derive from the horizontal scanner position and frequency. Therefore, the verticalaxis is preferably non-resonant and driven with a waveform that provides equal spacing between raster lines. A fast verticalretrace time at the end of each frame reduces constraints on the system design caused by limited frame periods.
hurey
Hakan Urey, David Wine, and Thor Osborn, "Optical performance requirements for MEMS-scanner based microdisplays," Conf. on MOEMS and Miniaturized Systems, SPIE Vol. 4178, pp. 176-185, Santa Clara, California (2000)
2
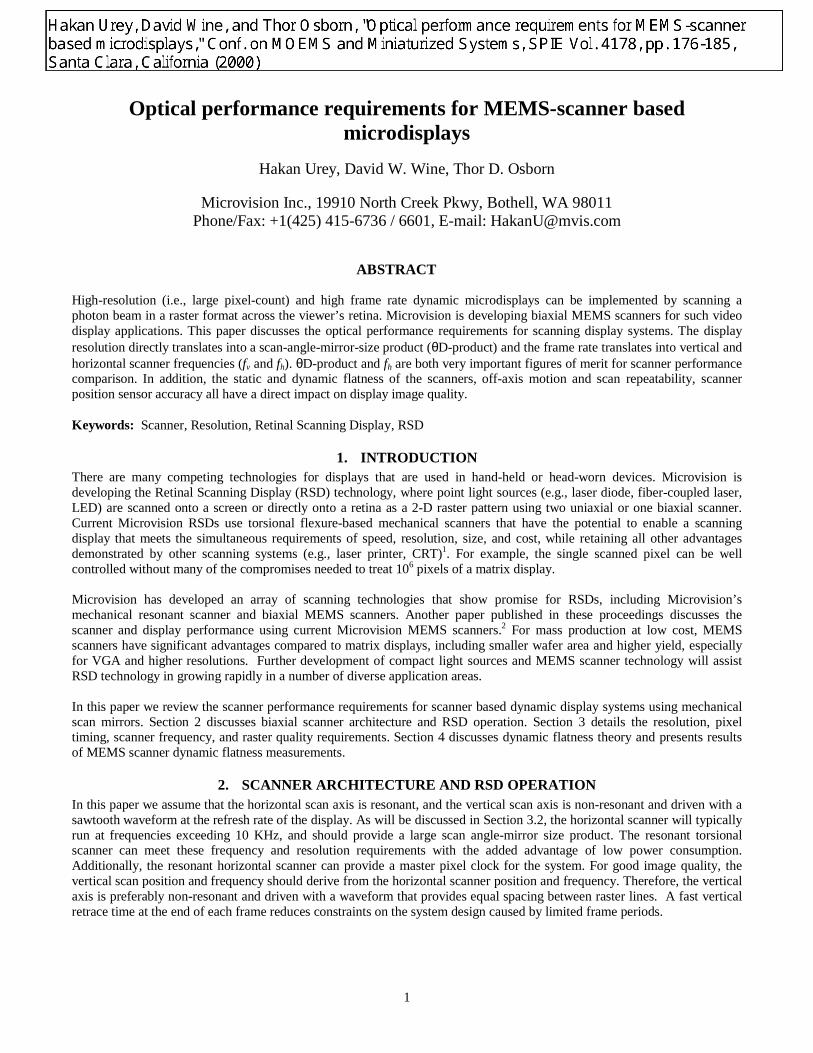
A 2-D raster can be generated using one biaxial or two uniaxial scanners. Uniaxial scanners are simpler to design andfabricate; however, biaxial scanners provide important optical and packaging advantages for display systems. The analysis inthis paper is generally applicable to both types of scanners.
Figure 1 shows a schematic of a Microvision MEMS scanner. The biaxial scanner architecture eliminates the need for asecond scanner and makes the system much more compact. The horizontal scan mirror is supported with two torsionalflexures and operates in resonant mode. It has a high Q-factor, thus it requires small amount of power to operate in closedloop. The vertical axis is driven non-resonantly in a sawtooth pattern at the desired display frame rate. The horizontal axis isactuated electrostatically and the vertical axis is actuated magnetically.
Horizontal Scan mirror
Vertical scan frameand drive coils
Figure 1: Diagrammatic view of Microvision MEMS scanner
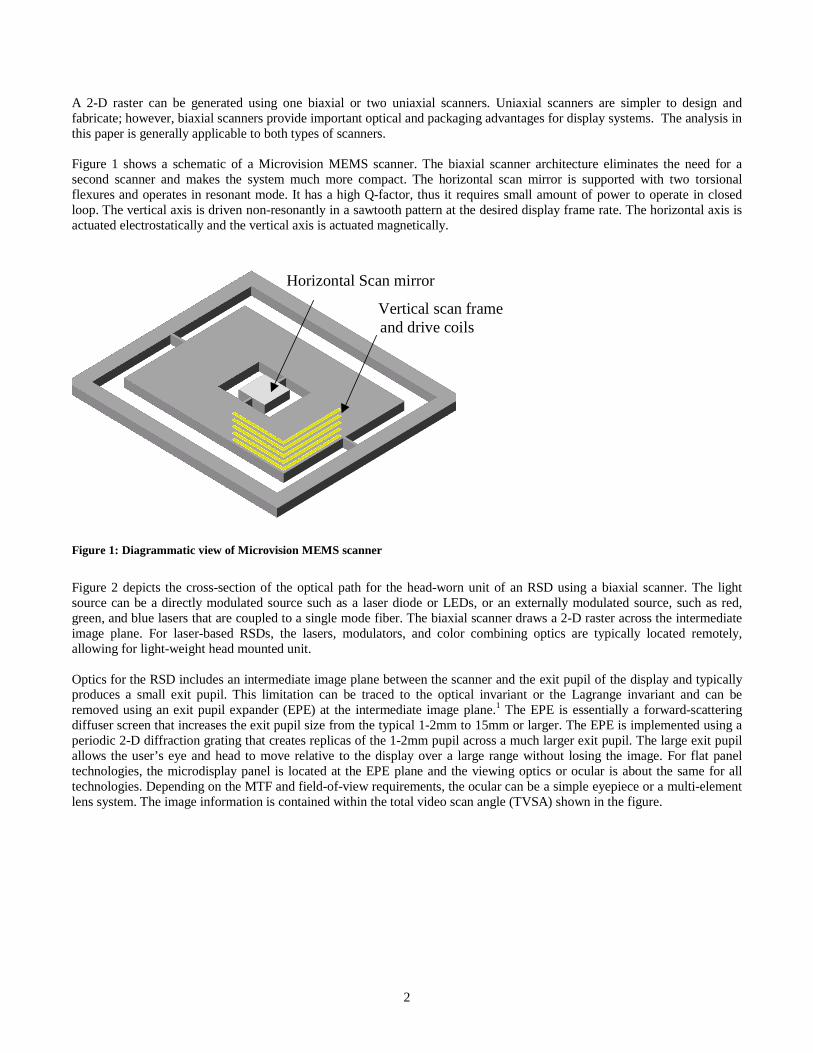
Figure 2 depicts the cross-section of the optical path for the head-worn unit of an RSD using a biaxial scanner. The lightsource can be a directly modulated source such as a laser diode or LEDs, or an externally modulated source, such as red,green, and blue lasers that are coupled to a single mode fiber. The biaxial scanner draws a 2-D raster across the intermediateimage plane. For laser-based RSDs, the lasers, modulators, and color combining optics are typically located remotely,allowing for light-weight head mounted unit.
Optics for the RSD includes an intermediate image plane between the scanner and the exit pupil of the display and typicallyproduces a small exit pupil. This limitation can be traced to the optical invariant or the Lagrange invariant and can beremoved using an exit pupil expander (EPE) at the intermediate image plane.1 The EPE is essentially a forward-scatteringdiffuser screen that increases the exit pupil size from the typical 1-2mm to 15mm or larger. The EPE is implemented using aperiodic 2-D diffraction grating that creates replicas of the 1-2mm pupil across a much larger exit pupil. The large exit pupilallows the user’s eye and head to move relative to the display over a large range without losing the image. For flat paneltechnologies, the microdisplay panel is located at the EPE plane and the viewing optics or ocular is about the same for alltechnologies. Depending on the MTF and field-of-view requirements, the ocular can be a simple eyepiece or a multi-elementlens system. The image information is contained within the total video scan angle (TVSA) shown in the figure.
3
θo FOVTVSAD
θi
Bi-axialScanner
Fiber or otherlight source
Dlens
Exit PupilExpander
Exit pupil
Ocular(viewing optics)
Viewer’s eye
IntermediateImage Plane
Figure 2: Cross-sectional view of the optical path for Retinal Scanning Displays
3. SCANNER REQUIREMENTSFor scanners, the highest resolvable spatial frequency is determined by the scan angle required to move the tip of the scanmirror by approximately λ/2. Τhe motion of the tip of the scanner is proportional to the product of the scan angle and themirror size. Thus, the total number of resolvable spots for the scanner is proportional to the scan angle mirror size product(θD-product) for the scanner and inversely proportional to the light wavelength. Likewise, in scanning displays, displayresolution requirement directly translates into a θD requirement and the display refresh rate requirement translates intovertical and horizontal scanner frequencies (fv and fh). Both the θD-product and fh are very important figures of merit forscanner performance comparison.
In calculating the required θD-product for a given display format, one has to factor in (1) beam profile across the scanner(e.g., clipping ratio of Gaussian beams) and operation wavelength; (2) usable portion of the scan line (limitations due tosinusoidal motion of resonant scanners); (3) clear aperture size of the scanner; (4) display MTF and contrast requirements;and (5) static and dynamic flatness of the scan mirror surface. Other important requirements are related to scan repeatabilityand accuracy of scanner position information from position sensors. All of these parameters have a direct impact on displayimage quality and are discussed in this section and Section 4. Luminance requirements of displays are not discussed in thispaper.
3.1. Resolution and Number of Pixels
As discussed above, the resolution of the scanner is proportional to the θD product of the scanner. Besides the number ofpixels, many other factors impact the θD requirements for the scanner. For instance, one important advantage of laserscanning systems is that one scanner can be used to redirect multiple beams simultaneously, thereby improving the horizontalor vertical resolution of the display. As an example, four-beam unidirectional scanning has been successfully implemented atMicrovision. In the four-beam approach, each feed beam is coupled to a different light source modulator and all beams arecombined together in a four-channel waveguide. Multiline writing increases the line rate of the system by the number ofbeams.
When a multi-beam approach is considered the general scan equation for horizontal and vertical resolution of a scanningdisplay system can be written as:
λ
αθaK
KDKN
T
hosspMMSAh
)cos(4 _= (1)
4
λ
αθaK
nKKKDN
T
vubvosspMMSAv
)cos(’’4 _= (2)
vvosub
vrs nKK
NFf
_
= (3)
Nh = horizontal resolution of displayNv = vertical resolution of displayD = scan mirror size along horizontal axesD’ = scan mirror size along vertical axesθMMSA = Maximum mechanical scan angle amplitude (0-peak)θ’MMSA = Maximum mechanical scan angle amplitude in vertical axes (0-peak)θTVSA = Total video scan angle (θTVSA = 4θMMSA Kos)Ksp = spot size to pixel size ratio (typically 0.5<Ksp<2)Kos (Kos_h and Kos_v) = overscan constants (Kos �����IRU�KRUL]RQWDO�DQG�YHUWLFDO�D[HVKub = 1 for unidirectional and 2 for bidirectional scanningα= feed beam angle (can be different for horizontal and vertical axis)nv = number of vertical feed beamsKT = beam clipping constanta = mirror shape factor (a =1 for square/rectangular mirrors)fs = horizontal scanner frequency (Hz)Fr = frame rate or refresh rate for the display (typically 60Hz)fv = vertical scanner frequency (fv = Fr)
Spot Overlap (Ksp):Ksp is the ratio of the spot size to pixel size and is a very important parameter in scanning display design. Because thehorizontal scanner is a continuous motion device, the display has effectively infinite addressability in the horizontal direction.The amount of spot overlap between adjacent pixels is the main parameter that determines the MTF of the display.3 Pixel sizeis typically chosen equal to full-width at 50% irradiance of the Gaussian spot (FWHM). This corresponds to a Ksp of 1.0.This ratio determines raster modulation (RM) and contrast ratio (CR). Raster modulation is an undesired backgroundmodulation effect that can be observed in areas where the beam is ON during every sweep. For Ksp=1, RM and CR are about6% and 78%. In some applications, 6% RM is objectionable and can be reduced at the expense of contrast by increasing Ksp.
Overscan Factor (Kos):The speed variations resulting from sinusoidal motion of resonant scanners produces pixel size and brightness variationsacross the scan line. Typically, writing is halted during the extremities of the scan line to minimize the speed variation. Thepixel size and brightness variations during the visible portion of the scan can be easily corrected electronically. In the abovecalculation, the horizontal overscan factor, Kos_h, accounts for the unused portion of the scan, and usually ranges from 0.7 to0.9. Similarly, the vertical overscan factor, Kos_v, takes into account the retrace time of the nonresonant vertical scanner andusually ranges from 0.9 to 0.95.
Beam Clipping (KT):The diffraction limited spot diameter for a clipped Gaussian beam is proportional to focal-ratio (f#) of the focusing geometry,wavelength of the light, and beam clipping constant KT, which is a function of the amount of beam clipping at the limitingsystem aperture (scanner in this case). The spot diameter is:
#, fKs FWHMTFWHM λ= (4)
where the FWHM spot size for clipped Gaussians can be calculated using the following formulas:4
)(4.0156.0057.0
037.12, GaussianClippedT
TTK FWHMT >+−= (5)
5
)(5.075.0
, GaussianTT
K FWHMT <= (6)
The truncation ratio, T, is the ratio of feed beam 1/e2 diameter (FWE2) at the mirror to the mirror diameter. Equation 5 isfound by curve-fitting to the Huygens-Fresnel diffraction integral for clipped Gaussian beams. Note that T can be differentfor the horizontal and the vertical axes. Gaussian beam formulas are valid for T<0.5 (i.e., beam clipping is negligible).Various values of KT are shown in the Table below.
Table 1: Beam Truncation ratio and the corresponding spot size proportionality factor for Gaussian beams.
Truncation Ratio Scanned Beam Shape KT, FWHM ValueT = 0.5 Full Gaussian (clipping negligible) 1.5T = 1 Gaussian truncated at FWE2 1.14T = 2 ‘Uniform’ center (87%) of Gaussian 1.05T � Uniform beam (focused spot is Airy pattern) 1.04
Feed Beam Angle, cos(α):The angle of the incoming beam also affects pixel size resolution. As the incoming beam angle α increases from vertical (α= 0), the projected area of the spot on the mirror increases as a cosine function, which must be taken into account. α can bedifferent for the horizontal and the vertical axes.
Unidirectional/Bidirectional and Multibeam Scanning (Kub, nv):Bidirectional scanning refers to writing or displaying a new line of data in both scan directions as opposed to writing dataonly during the forward sweep of the horizontal scanner. This is discussed in more detail in Section 3.3. Bidirectionalscanning doubles the display line-rate by permitting the scanner to “write” two lines during one scan cycle. Using multiplebeams to scan multiple lines further increases the vertical resolution by increasing the number of lines written during a singlesweep of the scan mirror. As illustrated by Equation 3, horizontal scanner frequency is inversely proportional to the numberof scan beams. The number of beams, N, in a given display will depend on a variety of factors, such as the complexity of theoverall system, cost, and optical alignment considerations.
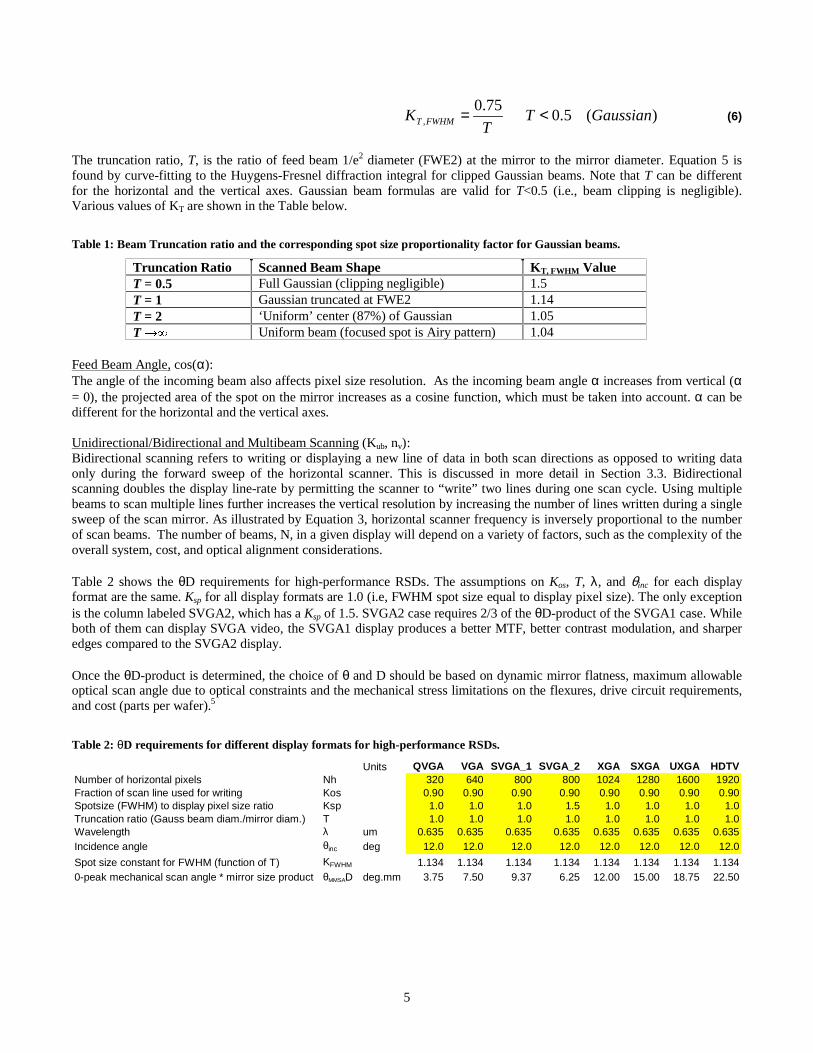
Table 2 shows the θD requirements for high-performance RSDs. The assumptions on Kos, T, λ, and θinc for each displayformat are the same. Ksp for all display formats are 1.0 (i.e, FWHM spot size equal to display pixel size). The only exceptionis the column labeled SVGA2, which has a Ksp of 1.5. SVGA2 case requires 2/3 of the θD-product of the SVGA1 case. Whileboth of them can display SVGA video, the SVGA1 display produces a better MTF, better contrast modulation, and sharperedges compared to the SVGA2 display.
Once the θD-product is determined, the choice of θ and D should be based on dynamic mirror flatness, maximum allowableoptical scan angle due to optical constraints and the mechanical stress limitations on the flexures, drive circuit requirements,and cost (parts per wafer).5
Table 2: θD requirements for different display formats for high-performance RSDs.
Units QVGA VGA SVGA_1 SVGA_2 XGA SXGA UXGA HDTVNumber of horizontal pixels Nh 320 640 800 800 1024 1280 1600 1920Fraction of scan line used for writing Kos 0.90 0.90 0.90 0.90 0.90 0.90 0.90 0.90Spotsize (FWHM) to display pixel size ratio Ksp 1.0 1.0 1.0 1.5 1.0 1.0 1.0 1.0Truncation ratio (Gauss beam diam./mirror diam.) T 1.0 1.0 1.0 1.0 1.0 1.0 1.0 1.0Wavelength λ um 0.635 0.635 0.635 0.635 0.635 0.635 0.635 0.635Incidence angle θinc deg 12.0 12.0 12.0 12.0 12.0 12.0 12.0 12.0
Spot size constant for FWHM (function of T) KFWHM 1.134 1.134 1.134 1.134 1.134 1.134 1.134 1.1340-peak mechanical scan angle * mirror size product θMMSAD deg.mm 3.75 7.50 9.37 6.25 12.00 15.00 18.75 22.50
6
3.2. Frequency and Pixel Timing RequirementsThe resonant horizontal scanner moves fastest at the center of the scan and comes to a stop at the extremities of the scan. Kos,discussed in Section 3.1, defines the usable portion of the scan line. Within the usable area, pixel time should be variedelectronically to produce display pixels with equal width. The pixel time at the center (tc) and the edges (te) of the display canbe expressed as:
hh
hosc Nf
Kt
π_= , (7)
hh
hoshos
e Nf
KKt
π
2__ 1−
= , (8)
The maximum allowable vertical retrace time tvret can be expressed as
)2
1(1
h
vv
vvret f
fN
ft −= (9)
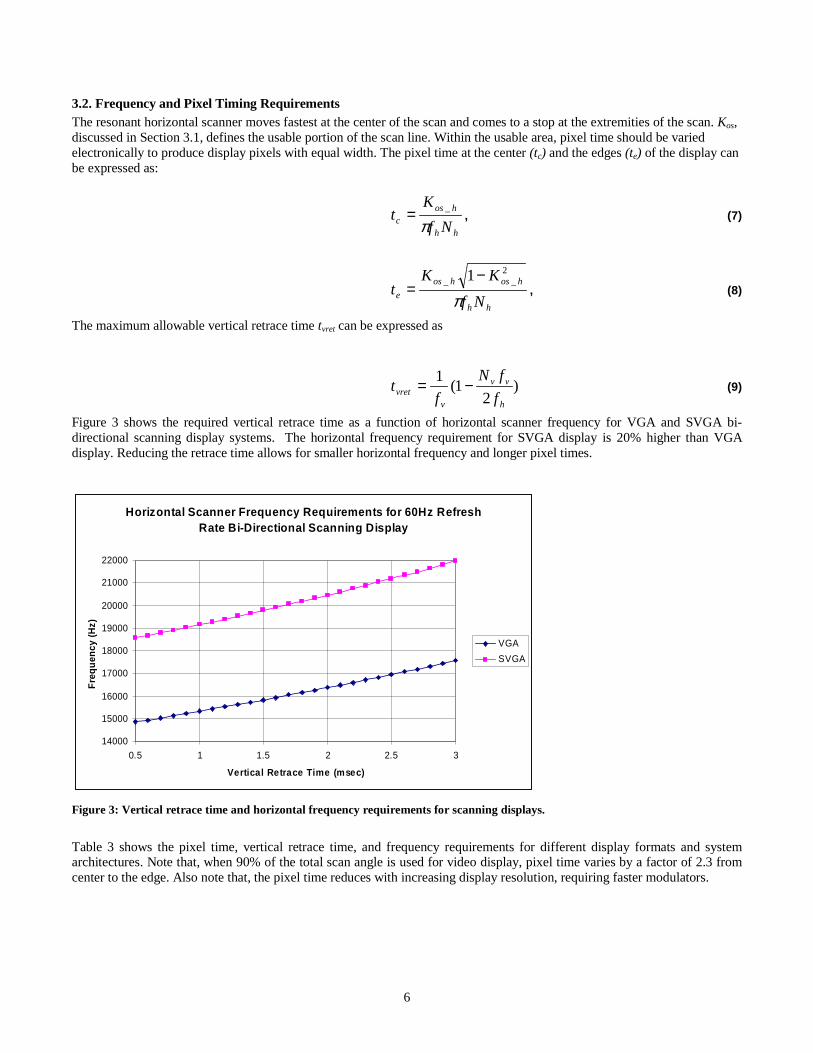
Figure 3 shows the required vertical retrace time as a function of horizontal scanner frequency for VGA and SVGA bi-directional scanning display systems. The horizontal frequency requirement for SVGA display is 20% higher than VGAdisplay. Reducing the retrace time allows for smaller horizontal frequency and longer pixel times.
Horizontal Scanner Frequency Requirements for 60Hz Refresh Rate Bi-Directional Scanning Display
14000
15000
16000
17000
18000
19000
20000
21000
22000
0.5 1 1.5 2 2.5 3
Vertical Retrace Time (msec)
Fre
qu
ency
(H
z)
VGA
SVGA
Figure 3: Vertical retrace time and horizontal frequency requirements for scanning displays.
Table 3 shows the pixel time, vertical retrace time, and frequency requirements for different display formats and systemarchitectures. Note that, when 90% of the total scan angle is used for video display, pixel time varies by a factor of 2.3 fromcenter to the edge. Also note that, the pixel time reduces with increasing display resolution, requiring faster modulators.
7
Table 3: Pixel timing and frequency requirements for various display formats and display architectures
Display Format VGA SVGA XGA SXGA HDTVFr - Frame Rate (progressive) (Hz) 60 60 60 60 60Nh - Horizontal Scan Pixel Number 640 800 1024 1280 1920Nv - Vertical Scan Pixel Number (Number of Lines) 480 600 768 1024 1080fh - Horizontal Scanner Frequency (Hz) 15750 19200 24500 16400 17200Kos - Fraction of the scan-line length used for writing 0.900 0.900 0.900 0.900 0.900nv - Number of parallel scan lines 1 1 1 4 41 for uni-directional & 2 for bi-directional scanning 2 2 2 1 1tret - Maximum retrace time allowed for vertical scanner (msec) 1.4 1.0 1.0 1.1 1.0Pixel-time at the center of horizontal scan line (nsec) 28.4 18.7 11.4 13.6 8.7Pixel-time at the edge of the written area (nsec) 65.2 42.8 26.2 31.3 19.9Maximum pixel clock frequency (MHz) 35.2 53.6 87.6 73.3 115.3
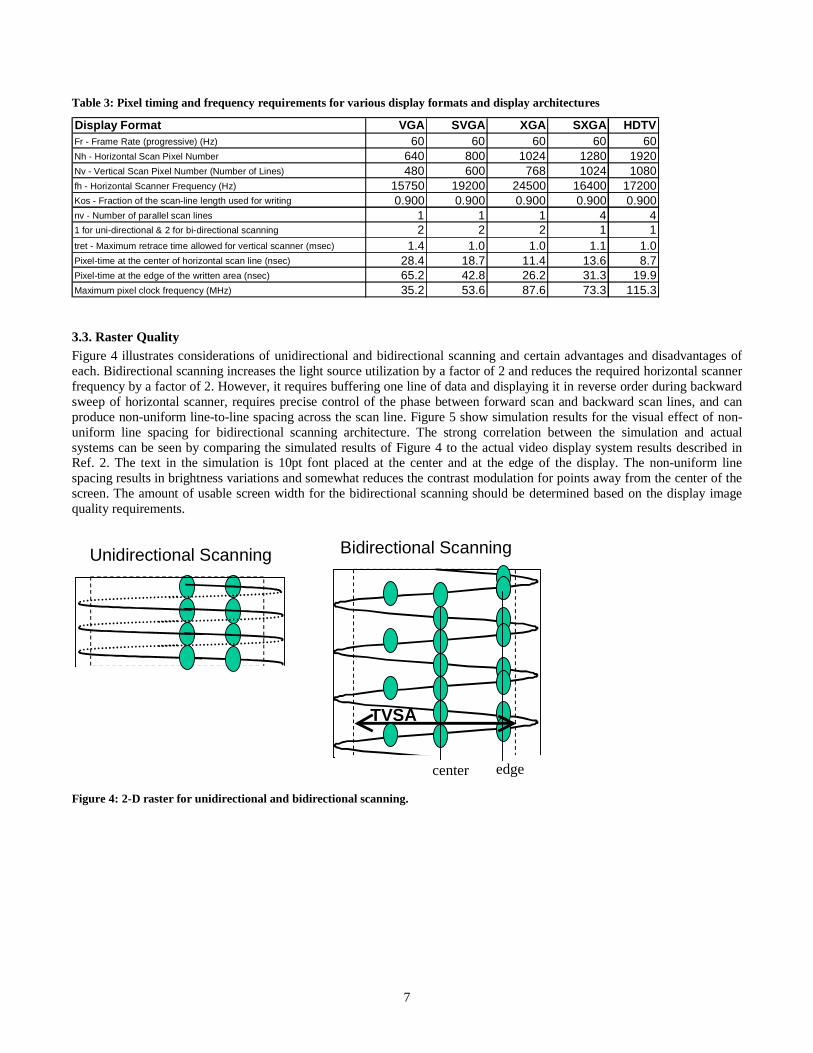
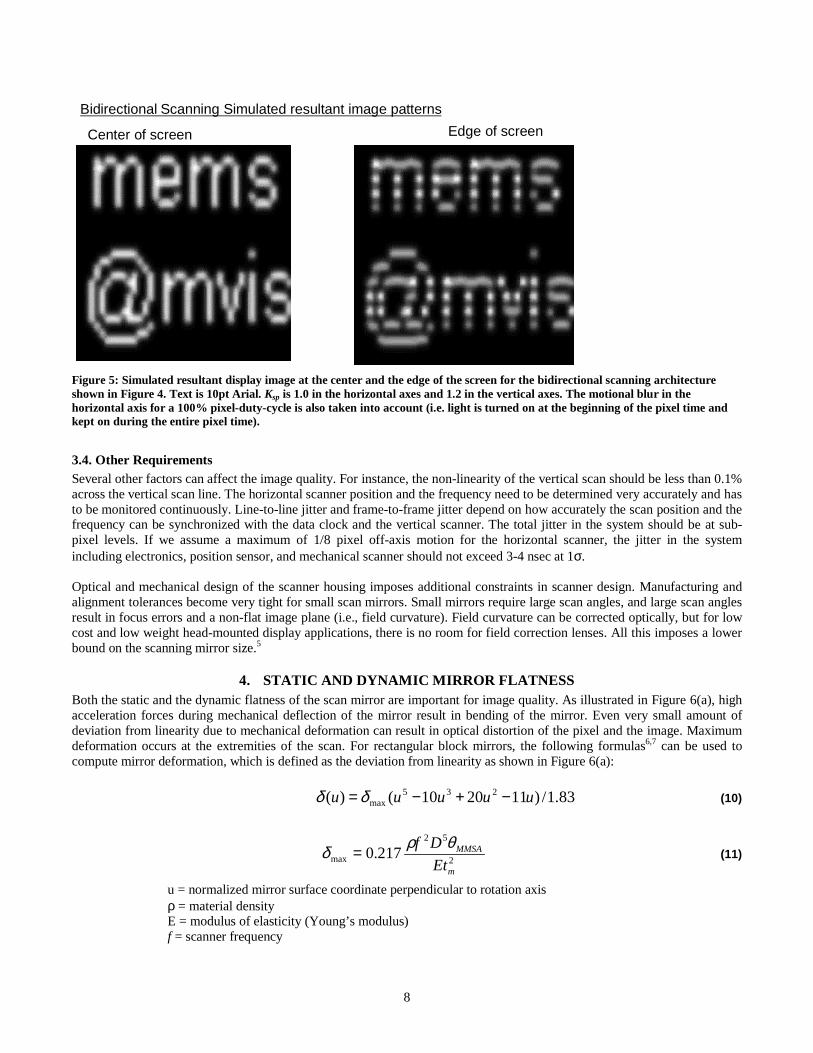
3.3. Raster QualityFigure 4 illustrates considerations of unidirectional and bidirectional scanning and certain advantages and disadvantages ofeach. Bidirectional scanning increases the light source utilization by a factor of 2 and reduces the required horizontal scannerfrequency by a factor of 2. However, it requires buffering one line of data and displaying it in reverse order during backwardsweep of horizontal scanner, requires precise control of the phase between forward scan and backward scan lines, and canproduce non-uniform line-to-line spacing across the scan line. Figure 5 show simulation results for the visual effect of non-uniform line spacing for bidirectional scanning architecture. The strong correlation between the simulation and actualsystems can be seen by comparing the simulated results of Figure 4 to the actual video display system results described inRef. 2. The text in the simulation is 10pt font placed at the center and at the edge of the display. The non-uniform linespacing results in brightness variations and somewhat reduces the contrast modulation for points away from the center of thescreen. The amount of usable screen width for the bidirectional scanning should be determined based on the display imagequality requirements.
Bidirectional ScanningUnidirectional Scanning
TVSA
center edge
Figure 4: 2-D raster for unidirectional and bidirectional scanning.
8
Center of screen Edge of screen
Bidirectional Scanning Simulated resultant image patterns
Figure 5: Simulated resultant display image at the center and the edge of the screen for the bidirectional scanning architectureshown in Figure 4. Text is 10pt Arial. Ksp is 1.0 in the horizontal axes and 1.2 in the vertical axes. The motional blur in thehorizontal axis for a 100% pixel-duty-cycle is also taken into account (i.e. light is turned on at the beginning of the pixel time andkept on during the entire pixel time).
3.4. Other RequirementsSeveral other factors can affect the image quality. For instance, the non-linearity of the vertical scan should be less than 0.1%across the vertical scan line. The horizontal scanner position and the frequency need to be determined very accurately and hasto be monitored continuously. Line-to-line jitter and frame-to-frame jitter depend on how accurately the scan position and thefrequency can be synchronized with the data clock and the vertical scanner. The total jitter in the system should be at sub-pixel levels. If we assume a maximum of 1/8 pixel off-axis motion for the horizontal scanner, the jitter in the systemincluding electronics, position sensor, and mechanical scanner should not exceed 3-4 nsec at 1σ.
Optical and mechanical design of the scanner housing imposes additional constraints in scanner design. Manufacturing andalignment tolerances become very tight for small scan mirrors. Small mirrors require large scan angles, and large scan anglesresult in focus errors and a non-flat image plane (i.e., field curvature). Field curvature can be corrected optically, but for lowcost and low weight head-mounted display applications, there is no room for field correction lenses. All this imposes a lowerbound on the scanning mirror size.5
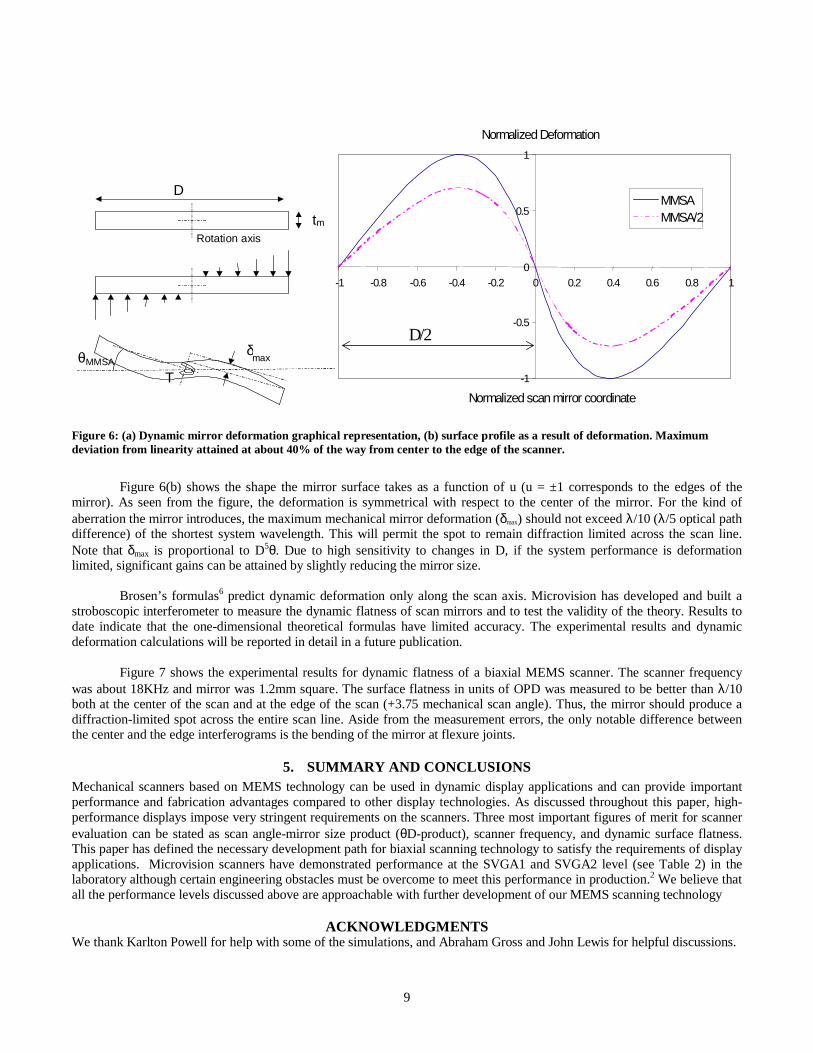
4. STATIC AND DYNAMIC MIRROR FLATNESSBoth the static and the dynamic flatness of the scan mirror are important for image quality. As illustrated in Figure 6(a), highacceleration forces during mechanical deflection of the mirror result in bending of the mirror. Even very small amount ofdeviation from linearity due to mechanical deformation can result in optical distortion of the pixel and the image. Maximumdeformation occurs at the extremities of the scan. For rectangular block mirrors, the following formulas6,7 can be used tocompute mirror deformation, which is defined as the deviation from linearity as shown in Figure 6(a):
83.1/)112010()( 235max uuuuu −+−=δδ (10)
2
52
max 217.0m
MMSA
Et
Df θρδ = (11)
u = normalized mirror surface coordinate perpendicular to rotation axisρ = material densityE = modulus of elasticity (Young’s modulus)f = scanner frequency
9
tm
D
δmax
TθMMSA
Rotation axis
Normalized Deformation
-1
-0.5
0
0.5
1
-1 -0.8 -0.6 -0.4 -0.2 0 0.2 0.4 0.6 0.8 1
Normalized scan mirror coordinate
MMSAMMSA/2
D/2
Figure 6: (a) Dynamic mirror deformation graphical representation, (b) surface profile as a result of deformation. Maximumdeviation from linearity attained at about 40% of the way from center to the edge of the scanner.
Figure 6(b) shows the shape the mirror surface takes as a function of u (u = ±1 corresponds to the edges of themirror). As seen from the figure, the deformation is symmetrical with respect to the center of the mirror. For the kind ofaberration the mirror introduces, the maximum mechanical mirror deformation (δmax) should not exceed λ/10 (λ/5 optical pathdifference) of the shortest system wavelength. This will permit the spot to remain diffraction limited across the scan line.Note that δmax is proportional to D5θ. Due to high sensitivity to changes in D, if the system performance is deformationlimited, significant gains can be attained by slightly reducing the mirror size.
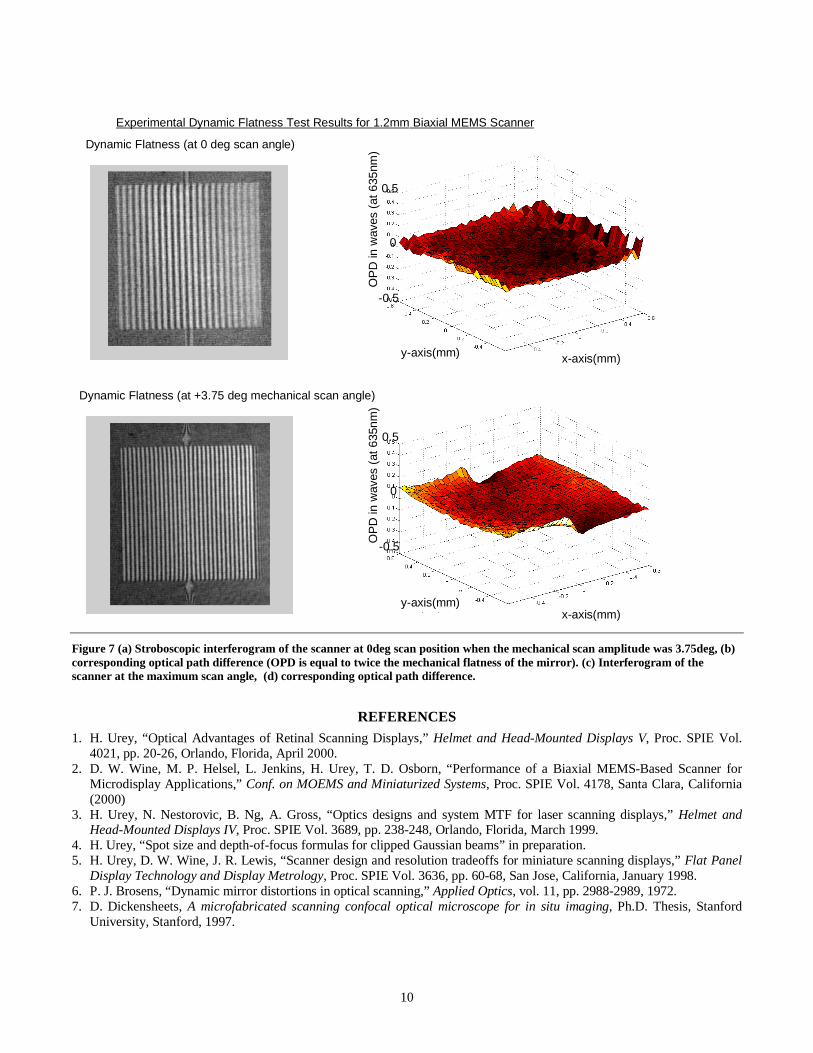
Brosen’s formulas6 predict dynamic deformation only along the scan axis. Microvision has developed and built astroboscopic interferometer to measure the dynamic flatness of scan mirrors and to test the validity of the theory. Results todate indicate that the one-dimensional theoretical formulas have limited accuracy. The experimental results and dynamicdeformation calculations will be reported in detail in a future publication.
Figure 7 shows the experimental results for dynamic flatness of a biaxial MEMS scanner. The scanner frequencywas about 18KHz and mirror was 1.2mm square. The surface flatness in units of OPD was measured to be better than λ/10both at the center of the scan and at the edge of the scan (+3.75 mechanical scan angle). Thus, the mirror should produce adiffraction-limited spot across the entire scan line. Aside from the measurement errors, the only notable difference betweenthe center and the edge interferograms is the bending of the mirror at flexure joints.
5. SUMMARY AND CONCLUSIONSMechanical scanners based on MEMS technology can be used in dynamic display applications and can provide importantperformance and fabrication advantages compared to other display technologies. As discussed throughout this paper, high-performance displays impose very stringent requirements on the scanners. Three most important figures of merit for scannerevaluation can be stated as scan angle-mirror size product (θD-product), scanner frequency, and dynamic surface flatness.This paper has defined the necessary development path for biaxial scanning technology to satisfy the requirements of displayapplications. Microvision scanners have demonstrated performance at the SVGA1 and SVGA2 level (see Table 2) in thelaboratory although certain engineering obstacles must be overcome to meet this performance in production.2 We believe thatall the performance levels discussed above are approachable with further development of our MEMS scanning technology
ACKNOWLEDGMENTSWe thank Karlton Powell for help with some of the simulations, and Abraham Gross and John Lewis for helpful discussions.
10
OP
D in
wav
es (
at 6
35nm
)
0
-0.5
0.5
y-axis(mm) x-axis(mm)O
PD
in w
aves
(at
635
nm)
0
-0.5
0.5
y-axis(mm)x-axis(mm)
Dynamic Flatness (at 0 deg scan angle)
Dynamic Flatness (at +3.75 deg mechanical scan angle)
Experimental Dynamic Flatness Test Results for 1.2mm Biaxial MEMS Scanner
Figure 7 (a) Stroboscopic interferogram of the scanner at 0deg scan position when the mechanical scan amplitude was 3.75deg, (b)corresponding optical path difference (OPD is equal to twice the mechanical flatness of the mirror). (c) Interferogram of thescanner at the maximum scan angle, (d) corresponding optical path difference.
REFERENCES1. H. Urey, “Optical Advantages of Retinal Scanning Displays,” Helmet and Head-Mounted Displays V, Proc. SPIE Vol.
4021, pp. 20-26, Orlando, Florida, April 2000.2. D. W. Wine, M. P. Helsel, L. Jenkins, H. Urey, T. D. Osborn, “Performance of a Biaxial MEMS-Based Scanner for
Microdisplay Applications,” Conf. on MOEMS and Miniaturized Systems, Proc. SPIE Vol. 4178, Santa Clara, California(2000)
3. H. Urey, N. Nestorovic, B. Ng, A. Gross, “Optics designs and system MTF for laser scanning displays,” Helmet andHead-Mounted Displays IV, Proc. SPIE Vol. 3689, pp. 238-248, Orlando, Florida, March 1999.
4. H. Urey, “Spot size and depth-of-focus formulas for clipped Gaussian beams” in preparation.5. H. Urey, D. W. Wine, J. R. Lewis, “Scanner design and resolution tradeoffs for miniature scanning displays,” Flat Panel
Display Technology and Display Metrology, Proc. SPIE Vol. 3636, pp. 60-68, San Jose, California, January 1998.6. P. J. Brosens, “Dynamic mirror distortions in optical scanning,” Applied Optics, vol. 11, pp. 2988-2989, 1972.7. D. Dickensheets, A microfabricated scanning confocal optical microscope for in situ imaging, Ph.D. Thesis, Stanford
University, Stanford, 1997.
Related Documents