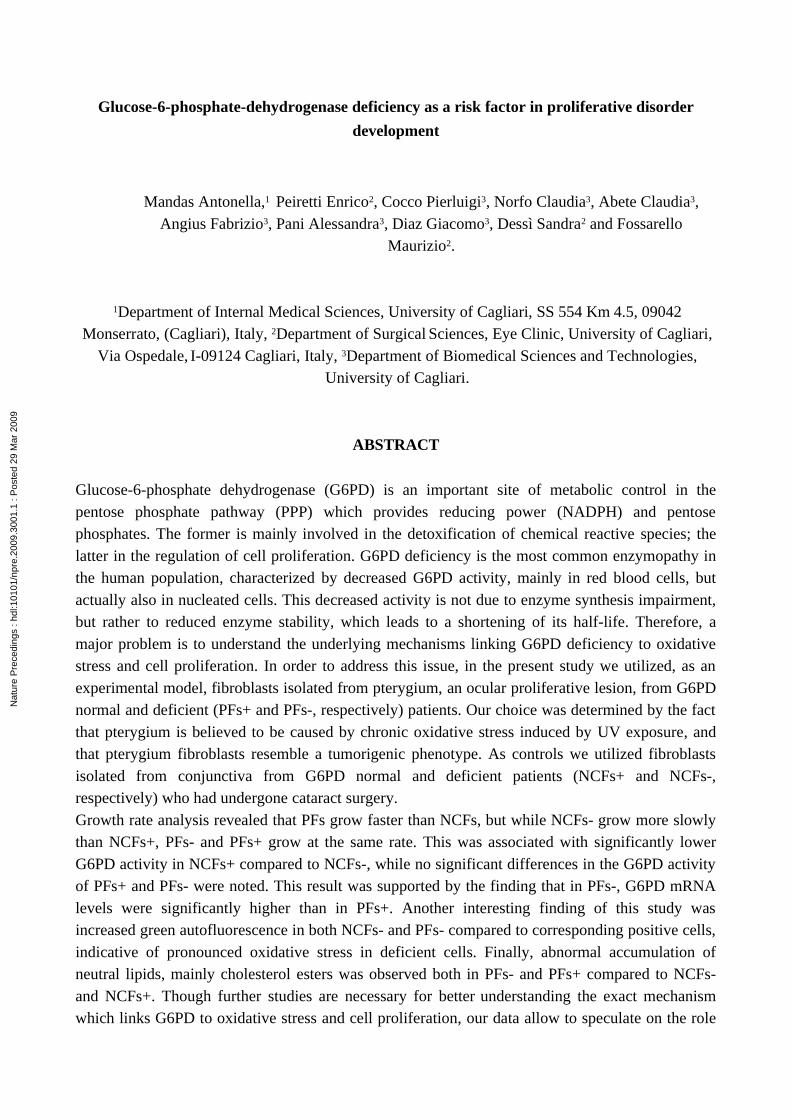
Glucose-6-phosphate-dehydrogenase deficiency as a risk factor in proliferative disorder development Mandas Antonella, 1 Peiretti Enrico 2 , Cocco Pierluigi 3 , Norfo Claudia 3 , Abete Claudia 3 , Angius Fabrizio 3 , Pani Alessandra 3 , Diaz Giacomo 3 , Dessì Sandra 2 and Fossarello Maurizio 2 . 1 Department of Internal Medical Sciences, University of Cagliari, SS 554 Km 4.5, 09042 Monserrato, (Cagliari), Italy, 2 Department of Surgical Sciences, Eye Clinic, University of Cagliari, Via Ospedale, I-09124 Cagliari, Italy, 3 Department of Biomedical Sciences and Technologies, University of Cagliari. ABSTRACT Glucose-6-phosphate dehydrogenase (G6PD) is an important site of metabolic control in the pentose phosphate pathway (PPP) which provides reducing power (NADPH) and pentose phosphates. The former is mainly involved in the detoxification of chemical reactive species; the latter in the regulation of cell proliferation. G6PD deficiency is the most common enzymopathy in the human population, characterized by decreased G6PD activity, mainly in red blood cells, but actually also in nucleated cells. This decreased activity is not due to enzyme synthesis impairment, but rather to reduced enzyme stability, which leads to a shortening of its half-life. Therefore, a major problem is to understand the underlying mechanisms linking G6PD deficiency to oxidative stress and cell proliferation. In order to address this issue, in the present study we utilized, as an experimental model, fibroblasts isolated from pterygium, an ocular proliferative lesion, from G6PD normal and deficient (PFs+ and PFs-, respectively) patients. Our choice was determined by the fact that pterygium is believed to be caused by chronic oxidative stress induced by UV exposure, and that pterygium fibroblasts resemble a tumorigenic phenotype. As controls we utilized fibroblasts isolated from conjunctiva from G6PD normal and deficient patients (NCFs+ and NCFs-, respectively) who had undergone cataract surgery. Growth rate analysis revealed that PFs grow faster than NCFs, but while NCFs- grow more slowly than NCFs+, PFs- and PFs+ grow at the same rate. This was associated with significantly lower G6PD activity in NCFs+ compared to NCFs-, while no significant differences in the G6PD activity of PFs+ and PFs- were noted. This result was supported by the finding that in PFs-, G6PD mRNA levels were significantly higher than in PFs+. Another interesting finding of this study was increased green autofluorescence in both NCFs- and PFs- compared to corresponding positive cells, indicative of pronounced oxidative stress in deficient cells. Finally, abnormal accumulation of neutral lipids, mainly cholesterol esters was observed both in PFs- and PFs+ compared to NCFs- and NCFs+. Though further studies are necessary for better understanding the exact mechanism which links G6PD to oxidative stress and cell proliferation, our data allow to speculate on the role Nature Precedings : hdl:10101/npre.2009.3001.1 : Posted 29 Mar 2009

Welcome message from author
This document is posted to help you gain knowledge. Please leave a comment to let me know what you think about it! Share it to your friends and learn new things together.
Transcript
Glucose-6-phosphate-dehydrogenase deficiency as a risk factor in proliferative disorder
development
Mandas Antonella,1 Peiretti Enrico2, Cocco Pierluigi3, Norfo Claudia3, Abete Claudia3, Angius Fabrizio3, Pani Alessandra3, Diaz Giacomo3, Dessì Sandra2 and Fossarello
Maurizio2.
1Department of Internal Medical Sciences, University of Cagliari, SS 554 Km 4.5, 09042 Monserrato, (Cagliari), Italy, 2Department of Surgical Sciences, Eye Clinic, University of Cagliari,
Via Ospedale, I-09124 Cagliari, Italy, 3Department of Biomedical Sciences and Technologies, University of Cagliari.
ABSTRACT
Glucose-6-phosphate dehydrogenase (G6PD) is an important site of metabolic control in the pentose phosphate pathway (PPP) which provides reducing power (NADPH) and pentose phosphates. The former is mainly involved in the detoxification of chemical reactive species; the latter in the regulation of cell proliferation. G6PD deficiency is the most common enzymopathy in the human population, characterized by decreased G6PD activity, mainly in red blood cells, but actually also in nucleated cells. This decreased activity is not due to enzyme synthesis impairment, but rather to reduced enzyme stability, which leads to a shortening of its half-life. Therefore, a major problem is to understand the underlying mechanisms linking G6PD deficiency to oxidative stress and cell proliferation. In order to address this issue, in the present study we utilized, as an experimental model, fibroblasts isolated from pterygium, an ocular proliferative lesion, from G6PD normal and deficient (PFs+ and PFs-, respectively) patients. Our choice was determined by the fact that pterygium is believed to be caused by chronic oxidative stress induced by UV exposure, and that pterygium fibroblasts resemble a tumorigenic phenotype. As controls we utilized fibroblasts isolated from conjunctiva from G6PD normal and deficient patients (NCFs+ and NCFs-, respectively) who had undergone cataract surgery. Growth rate analysis revealed that PFs grow faster than NCFs, but while NCFs- grow more slowly than NCFs+, PFs- and PFs+ grow at the same rate. This was associated with significantly lower G6PD activity in NCFs+ compared to NCFs-, while no significant differences in the G6PD activity of PFs+ and PFs- were noted. This result was supported by the finding that in PFs-, G6PD mRNA levels were significantly higher than in PFs+. Another interesting finding of this study was increased green autofluorescence in both NCFs- and PFs- compared to corresponding positive cells, indicative of pronounced oxidative stress in deficient cells. Finally, abnormal accumulation of neutral lipids, mainly cholesterol esters was observed both in PFs- and PFs+ compared to NCFs- and NCFs+. Though further studies are necessary for better understanding the exact mechanism which links G6PD to oxidative stress and cell proliferation, our data allow to speculate on the role
Nat
ure
Pre
cedi
ngs
: hdl
:101
01/n
pre.
2009
.300
1.1
: Pos
ted
29 M
ar 2
009
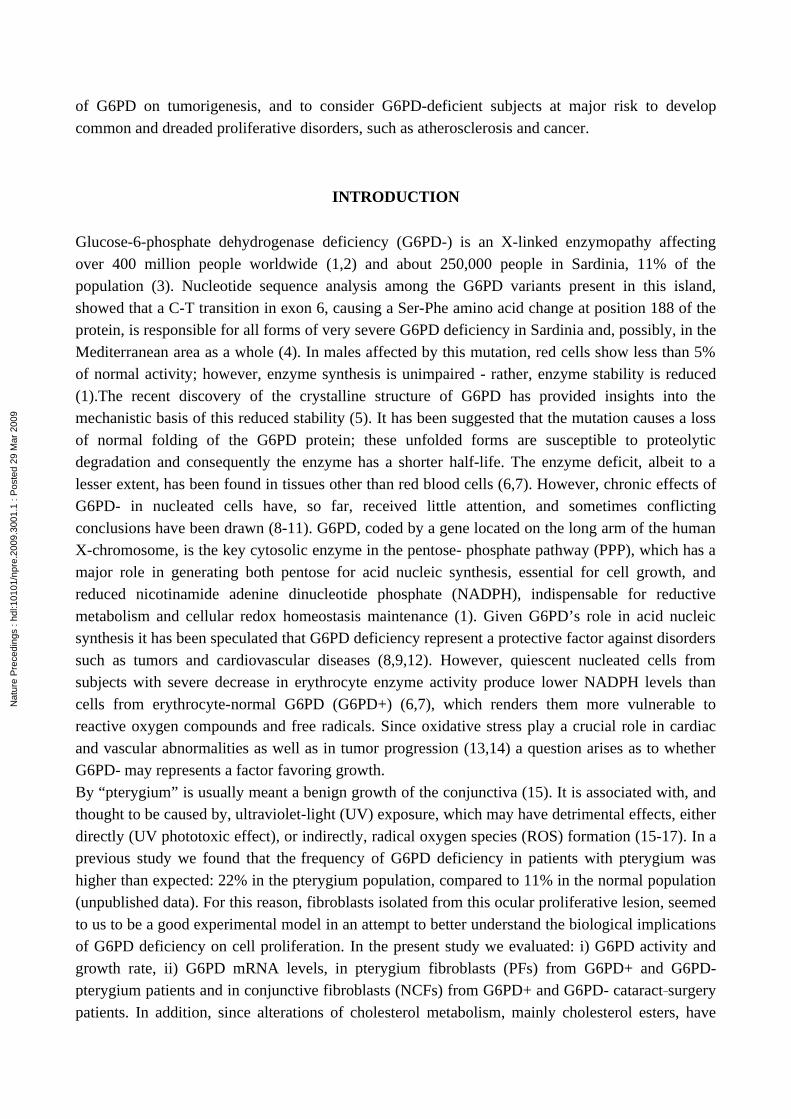
of G6PD on tumorigenesis, and to consider G6PD-deficient subjects at major risk to develop common and dreaded proliferative disorders, such as atherosclerosis and cancer.
INTRODUCTION
Glucose-6-phosphate dehydrogenase deficiency (G6PD-) is an X-linked enzymopathy affecting over 400 million people worldwide (1,2) and about 250,000 people in Sardinia, 11% of the population (3). Nucleotide sequence analysis among the G6PD variants present in this island, showed that a C-T transition in exon 6, causing a Ser-Phe amino acid change at position 188 of the protein, is responsible for all forms of very severe G6PD deficiency in Sardinia and, possibly, in the Mediterranean area as a whole (4). In males affected by this mutation, red cells show less than 5% of normal activity; however, enzyme synthesis is unimpaired - rather, enzyme stability is reduced (1).The recent discovery of the crystalline structure of G6PD has provided insights into the mechanistic basis of this reduced stability (5). It has been suggested that the mutation causes a loss of normal folding of the G6PD protein; these unfolded forms are susceptible to proteolytic degradation and consequently the enzyme has a shorter half-life. The enzyme deficit, albeit to a lesser extent, has been found in tissues other than red blood cells (6,7). However, chronic effects of G6PD- in nucleated cells have, so far, received little attention, and sometimes conflicting conclusions have been drawn (8-11). G6PD, coded by a gene located on the long arm of the human X-chromosome, is the key cytosolic enzyme in the pentose- phosphate pathway (PPP), which has a major role in generating both pentose for acid nucleic synthesis, essential for cell growth, and reduced nicotinamide adenine dinucleotide phosphate (NADPH), indispensable for reductive metabolism and cellular redox homeostasis maintenance (1). Given G6PD’s role in acid nucleic synthesis it has been speculated that G6PD deficiency represent a protective factor against disorders such as tumors and cardiovascular diseases (8,9,12). However, quiescent nucleated cells from subjects with severe decrease in erythrocyte enzyme activity produce lower NADPH levels than cells from erythrocyte-normal G6PD (G6PD+) (6,7), which renders them more vulnerable to reactive oxygen compounds and free radicals. Since oxidative stress play a crucial role in cardiac and vascular abnormalities as well as in tumor progression (13,14) a question arises as to whether G6PD- may represents a factor favoring growth. By “pterygium” is usually meant a benign growth of the conjunctiva (15). It is associated with, and thought to be caused by, ultraviolet-light (UV) exposure, which may have detrimental effects, either directly (UV phototoxic effect), or indirectly, radical oxygen species (ROS) formation (15-17). In a previous study we found that the frequency of G6PD deficiency in patients with pterygium was higher than expected: 22% in the pterygium population, compared to 11% in the normal population (unpublished data). For this reason, fibroblasts isolated from this ocular proliferative lesion, seemed to us to be a good experimental model in an attempt to better understand the biological implications of G6PD deficiency on cell proliferation. In the present study we evaluated: i) G6PD activity and growth rate, ii) G6PD mRNA levels, in pterygium fibroblasts (PFs) from G6PD+ and G6PD- pterygium patients and in conjunctive fibroblasts (NCFs) from G6PD+ and G6PD- cataract_surgery patients. In addition, since alterations of cholesterol metabolism, mainly cholesterol esters, have
Nat
ure
Pre
cedi
ngs
: hdl
:101
01/n
pre.
2009
.300
1.1
: Pos
ted
29 M
ar 2
009
been found during the growth of PFs, (18-20), iii) cholesterol metabolism was also determined in NCFs+, NCFs, PFs+ and PFs-.quiescent and growth stimulated.
MATERIAL AND METHODS
Fibroblasts isolation
For fibroblast isolation, we selected eight male patients (4 erythrocyte G6PD+ and 4 erythrocyte G6PD-) with primary pterygium (age range, 45–65 years; mean, 57.3 ± 3.5 [SE] years) and eight male patients (4 erythrocyte G6PD+ and 4 erythrocyte G6PD-) with normal conjunctiva (age range, 60–70 years; mean, 63.7 ± 1.4 years), who underwent cataract surgery at the University Eye Clinic of Cagliari. All patients with pterygium had at least a 3-year history of a slow-growing lesion, with a corneal extension of at least 4 mm, as measured with a caliper, from the limbus to the corneal vertex. No subject in the control group had any inflammatory signs or symptoms. The research adhered to the tenets of the Declaration of Helsinki. Written informed consent was obtained from all the patients before blood and tissues were collected. Blood samples from these subjects were utilized for erythrocyte G6PD determination. This study and all the procedures, including biopsy from the conjunctiva during cataract surgery, were approved by the Ethics Committee of the University of Cagliari. All tissue samples were obtained as previously described (18-20). In summary, at the time of surgery, tissue was excised from the inner canthus with microforceps. As a rule, within 1 hour of excision, samples were placed in sterile boxes containing a preservative solution (Eurocollins; Roche Biochemicals, Mannheim, Germany) and were transferred to the cell culture room. For fibroblast isolation, pterygium and normal conjunctiva tissues were dissected into three to four tissue fragments (1 mm2). Tissue fragments were placed in six-well plates for 2 hours. After 2 hours of adhesion, a few drops of Dulbecco modified Eagle medium (DMEM; Gibco, Grand Island, NY) supplemented with 10% fetal bovine serum (FBS; Sigma Aldrich, Munich, Germany), 100 U/mL penicillin/streptomycin (Sigma Aldrich), and fungizone (Life Technologies, Bethesda, MD) were added to cover each fragment. The next day, the tissue fragments were covered with culture medium and were placed in a humidified incubator (37°C, 5% CO2). The medium was changed every 2 days. After 5 to 6 days, fibroblasts began to proliferate from the fragment margin (halo of cells) and created a monolayer. The outgrowing cells were morphologically consistent with fibroblasts by their characteristic spindle shape. After 4 weeks, fibroblasts were purified by repeat trypsinization (trypsin/EDTA, 0.05%/0.02%) and passaging to achieve a homogenous population of spindle cells. Purified fibroblasts were washed twice with sterile phosphate-buffered saline (PBS) and centrifuged. Cells (1 x 10⁶) were then seeded into a 25-cm2 culture flask and grown to confluence. At this time, cells were used for in vitro staining experiments or were transferred to cryopreservation medium at a suspension of 1 x 10⁷ cells/ml. After swift freezing, fibroblasts were placed in liquid nitrogen for long-term storage. Based on the need of experiments, cryopreserved cells were removed from liquid nitrogen tank and cultured under the conditions described. All experiments were conducted using fibroblasts between passages 2 to 4.
Determination of growth rate
Nat
ure
Pre
cedi
ngs
: hdl
:101
01/n
pre.
2009
.300
1.1
: Pos
ted
29 M
ar 2
009
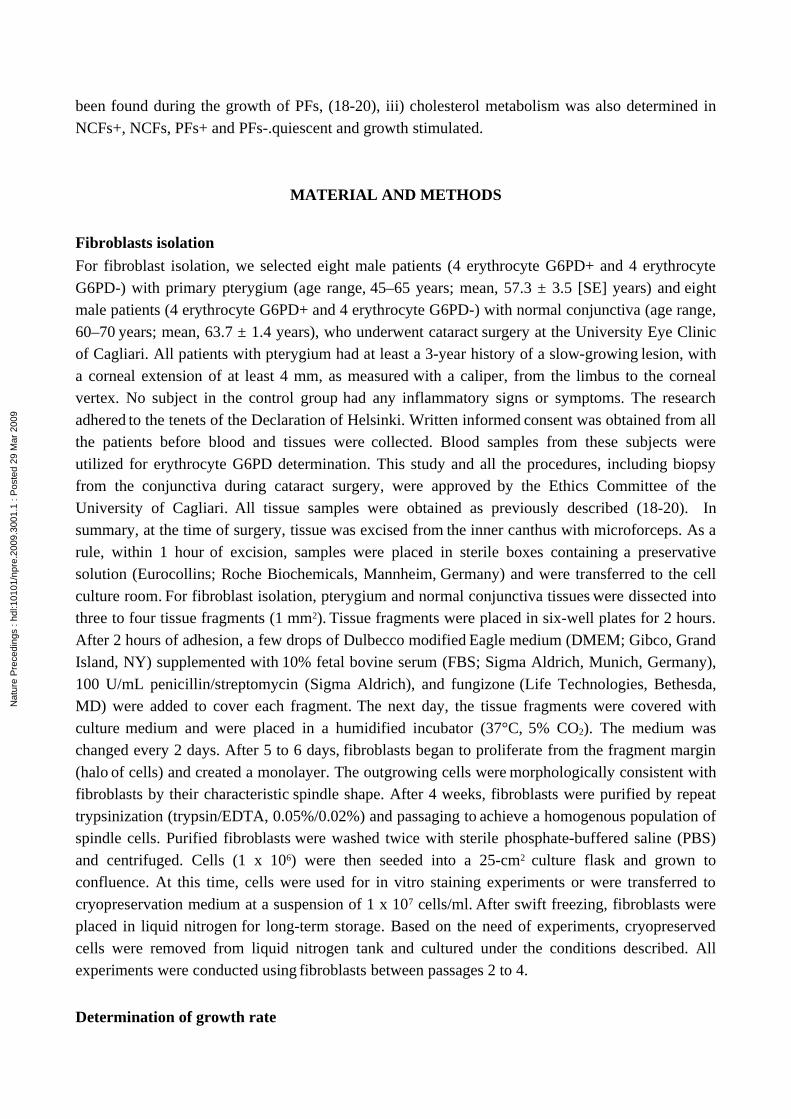
For growth rate determination cells were placed at a density of 40,000 cell/cm2 in six-well plates and then were incubated for 24 hours in DMEM with 0.2% FCS to synchronize cells at a quiescent state. Quiescent fibroblasts were then diluted in complete growth medium containing 10% FCS. Cells were harvested at the indicated time points. Growth rate was assessed by counting cells with a hemocytometer and by incorporating 3H-thymidine (10 Ci/ml) into DNA. In this experiment μ 3H-thymidine was added 3 hours before harvesting. Trypan blue uptake was used to determine cell viability.
G6PD activity assay.
Venous blood from patients and controls was collected in EDTA. Red blood cells were prepared by centrifuging whole blood at 2,000 g for 10 min at 4°C. Plasma and buffy coat were carefully removed and red cells were hemolyzed with 4 vol. of cold distilled water. G6PD activity was evaluated in hemolysates and values expressed as mµmoles of NADPH formed per minute per 10 9
red cells. In all G6PD deficient subjects analyzed, the residual activity of the enzyme in red blood cells was about 2-5% of the activity found in G6PD normal subjects (data not shown). For G6PD activity determination in fibroblasts, 106 cells were homogenated with 9 vol. of 50 mmol/l Tris-HCl buffer pH 7.5 containing 0.15 mmol/l KCl. G6PD activity was determined in fibroblast homogenates and expressed as mµmoles of NADPH formed per minute per 106 fibroblasts.
Determination of intracellular lipid
To visualize intracellular lipids, cultured fibroblasts were washed with PBS and fixed in 4% paraformaldehyde. Cell were then stained with Oil red-O (ORO) (Sigma), Nile Red and filipin. ORO staining, specific for neutral lipids, was made in 60% isopropyl alcohol, followed by Mayer’s hematoxylin counterstaining. ORO was observed in transmitted white light. Nile Red (9-diethylamino-5H-benzo[α]phenoxazine-5-one) (Fluka, Buchs, SG, Switzerland) is a fluorescent dye which stains differentially polar lipids (i.e., phospholipids) and neutral lipids (i.e., cholesterol ester and triglycerides (21). Polar lipids show a prevalent red emission, while neutral lipids show both a red and yellow emission. Red emission (referred to as Nile Red-590) was observed with 540±12.5 excitation and 590 LP emission filters. Yellow emission (referred to as Nile Red-535) was observed with 460±25 excitation and 535±20 emission filters. Filipin (Sigma) is a fluorescent dye which stains only free cholesterol. Filipin was observed with 360±20 excitation and 460±25 emission filters. Filipin and Nile Red emissions were completely separated using the indicated filters, so that these fluorochromes could be used in combination (21). Cells growing in glass-bottomed dishes were observed with an Olympus IX 71 inverted microscope (Olympus, Tokyo, Japan), using a 20x/0.7 or 60x/1.3 planapochromatic objective (Olympus UPlanSApo series) which provided a good alignment of different color emissions. 12 bit-images were captured with a cooled CCD camera (Sensicam PCO, Kelheim, Germany). Nominal resolutions of images were 0.3 µm/pixel and 0.1 µm/pixel for the 20x and 60x objective, respectively. Quantitative image analysis was performed with the ImagePro Plus package (Media Cybernetics, Silver Springs, MD).
RT-PCR Analysis
Nat
ure
Pre
cedi
ngs
: hdl
:101
01/n
pre.
2009
.300
1.1
: Pos
ted
29 M
ar 2
009
Expression levels of G6PD mRNAs were evaluated in PFs and in NCFs by semiquantitative, reverse transcription polymerase chain reaction (RT-PCR) with ß-actin as RNA controls. RNA extractions were performed in approximately 106 cells using reagent (Trizol; Invitrogen). Equal amounts of total RNA (1 µg) were reverse transcribed into cDNA using the random hexamer method. cDNA was subsequently amplified by PCR in the presence of specific primers according to the instructions provided by the manufacturer (GeneAmp RNA PCR Kit; Perkin-Elmer Cetus, Foster City, CA). The overall procedure was standardized by expressing the amount of PCR product for G6PD mRNA relative to the amount of product formed for ß-actin. The National Institutes of Health Image 1.63 Analysis Software program (Scion Image) was used to assess the intensity of the bands in the autoradiograms.
Autofluorecence analysis
The intrinsic autofluorescence properties of fibroblasts were investigated on single living fibroblasts grown under conditions described above. Cells were viewed by using an Olympus IX 71 inverted microscope (Olympus, Tokyo, Japan), equipped with 20x/0.7 or 60x/1.3 planapochromatic objective (Olympus UPlanSApo series). Green autofluorescence was detected under a 535 nm emission signal. Autofluorescence values were obtained with the ImagePro Plus package (Media Cybernetics, Silver Springs, MD). At least 50 cells were measured for each group.
Statistical analysis
Data were reported as mean ± standard error (SE). Statistical calculations were performed with the software Origin (Microcal, Inc, Northampton, MA), and Statistica (StatSoft, Tulsa, OK). Comparisons between data were made with Student t-test. P<0.05 was considered as statistically significant.
RESULTS
In an attempt to better understand the biological implications of G6PD deficiency on cell proliferation, in the present study we analyzed the correlation between growth rate, G6PD activity, and lipid metabolism in primary culture of fibroblasts isolated from human normal conjunctiva (NCFs) and pterygium (PFs) of erythrocyte G6PD normal (G6PD+) and deficient (G6PD-) male subjects.
Growth rate in NCFs and PFs
Growth rate analysis, assessed by counting cells with a hemocytometer and by incorporating 3H-thymidine into DNA (Figure. 1 A and 1 B, respectively), revealed that PFs grow faster than NCFs, but while NCFs- grow more slowly than NCFs+, PFs- and PFs+ grow at the same rate.
Nat
ure
Pre
cedi
ngs
: hdl
:101
01/n
pre.
2009
.300
1.1
: Pos
ted
29 M
ar 2
009
10 0 10 20 30 40 50 600
20
40
60
80
100
°
24h
cell number x 103
NFC+ NFC PF+ PF
0h FCS (0.2%) 24h FCS (10%)
*
°
10 0 10 20 30 40 50 60
0
20
40
60
°
°°
*
3 Hthymidine incorporation (cpm
x103/m
l)
NCF+ NCF PF+ PF
3h FCS (0.2%) 24h FCS (10%) 24 h
°
A B
Figure 1. Growth rate in NCFs and PFs. For growth rate determination cells were placed at a
density of 40,000 cell/cm2 in six-well plates and then were incubated for 24 hours in DMEM with 0.2% FCS to synchronize cells at a quiescent state. Quiescent fibroblasts were then diluted in complete growth medium containing 10% FCS and incubated for further 24 h hours. A) cell number as determined by hemocytometer. *NCF- vs NCF+ P<0.05; °PF+ and PF- vs NCF+ and NCF-. B) 3H-thymidine incorporated into DNA. 3H-thymidine (10 Ci/ml) was added three hoursμ before harvesting cells. Data shown are the mean ± SE of eight NCFs (4 G6PD+ and 4 G6PD-) and eight NCFs (4 G6PD+ and 4 G6PD-) made in duplicate. *NCF- vs NCF+ P<0.05; °PF+ and PF- vs NCF+ and NCF-.P<0.05.
G6PD activity in NCFs and PFs
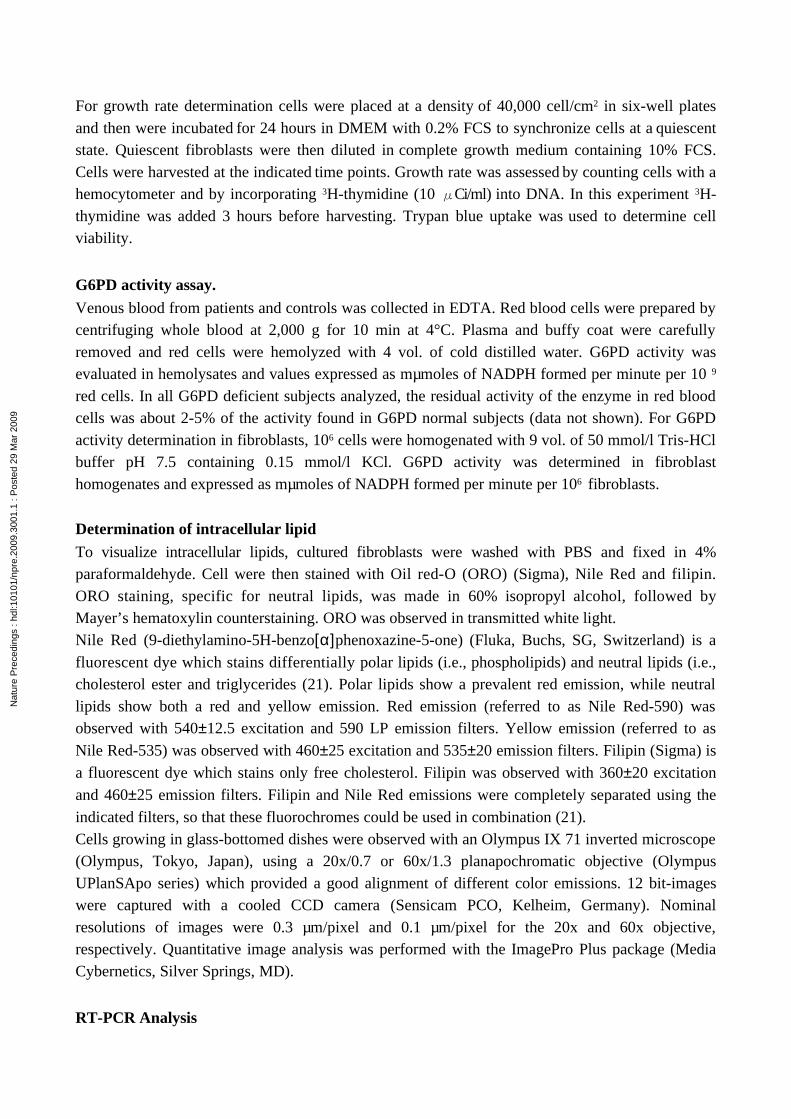
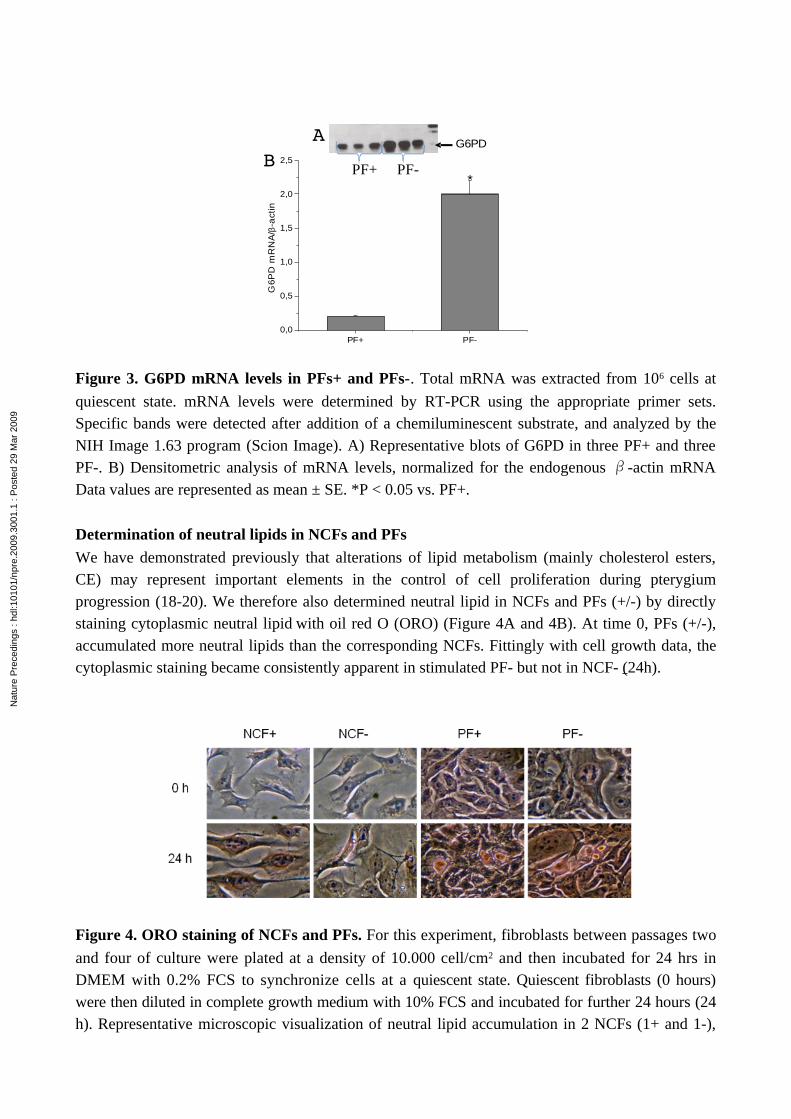
Accordingly, G6PD activity was significantly lower (about 50% less) in NCFs- compared to NCF+, but not in PFs – compared to PF+. Also in this case, G6PD activity was significantly higher in PFs, both G6PD+ and G6PD- as compared to the corresponding NCFs (Figure 2). These results were validated by the finding that mRNA levels of G6PD in the PF- were significantly higher than PF+ (Figure 3).
1 20
20
40
60
80
100
G6PD-
°
*
mµm
ole
s o
f N
AD
PH
/min
/10
6 ce
lls)
NCFs PFs
G6PD+
*
Figure 2. G6PD activity in NCFs and PFs. Enzyme activity was measured in fibroblast
homogenates and expressed in mµmoles of NADPH formed per minute per 106 cells. Data shown are the mean ± SE of eight NCFs (4 G6PD+ and 4 G6PD-) and eight NCFs (4 G6PD- and 4 G6PD+) made in duplicate. *P<0.05 vs G6PD-; °P<0.05 vs NCFs.
Nat
ure
Pre
cedi
ngs
: hdl
:101
01/n
pre.
2009
.300
1.1
: Pos
ted
29 M
ar 2
009
PF+ PF-0,0
0,5
1,0
1,5
2,0
2,5
G6P
D m
RN
A/β
-act
in
*PF+ PF-
G6PDAB
Figure 3. G6PD mRNA levels in PFs+ and PFs-. Total mRNA was extracted from 106 cells at
quiescent state. mRNA levels were determined by RT-PCR using the appropriate primer sets. Specific bands were detected after addition of a chemiluminescent substrate, and analyzed by the NIH Image 1.63 program (Scion Image). A) Representative blots of G6PD in three PF+ and three PF-. B) Densitometric analysis of mRNA levels, normalized for the endogenous -actin mRNAβ Data values are represented as mean ± SE. *P < 0.05 vs. PF+.
Determination of neutral lipids in NCFs and PFs
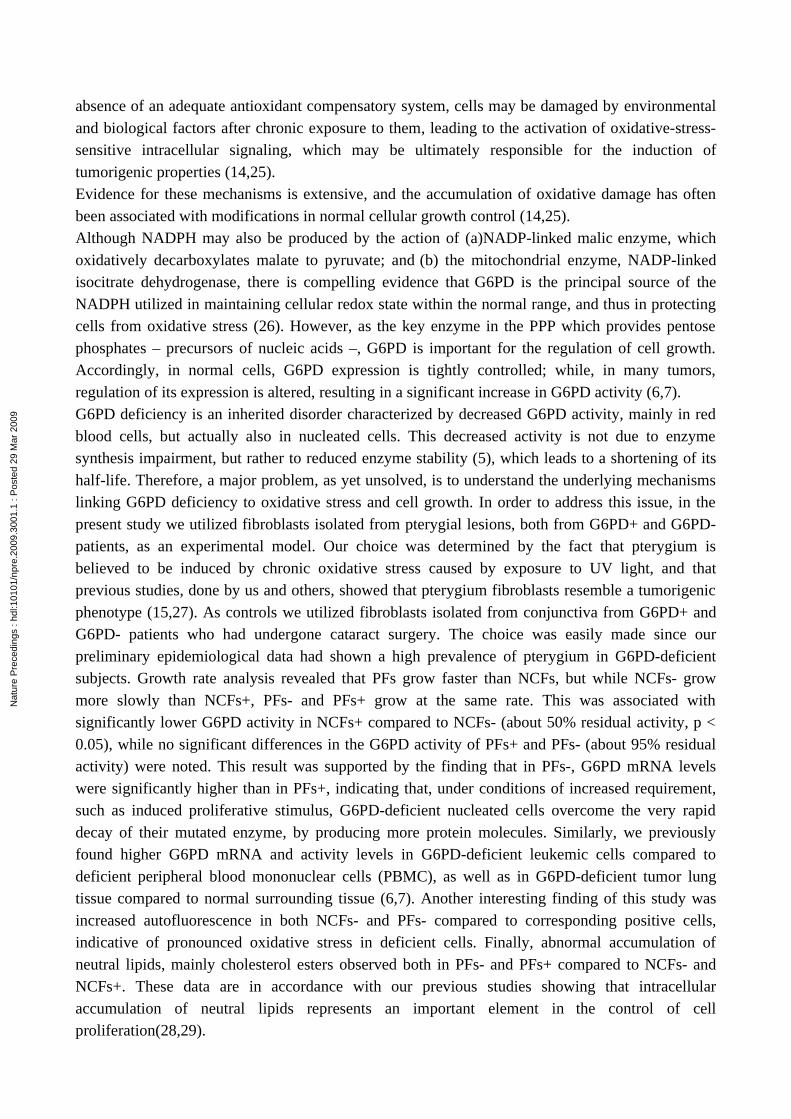
We have demonstrated previously that alterations of lipid metabolism (mainly cholesterol esters, CE) may represent important elements in the control of cell proliferation during pterygium progression (18-20). We therefore also determined neutral lipid in NCFs and PFs (+/-) by directly staining cytoplasmic neutral lipid with oil red O (ORO) (Figure 4A and 4B). At time 0, PFs (+/-), accumulated more neutral lipids than the corresponding NCFs. Fittingly with cell growth data, the cytoplasmic staining became consistently apparent in stimulated PF- but not in NCF- (24h).
Figure 4. ORO staining of NCFs and PFs. For this experiment, fibroblasts between passages two
and four of culture were plated at a density of 10.000 cell/cm2 and then incubated for 24 hrs in DMEM with 0.2% FCS to synchronize cells at a quiescent state. Quiescent fibroblasts (0 hours) were then diluted in complete growth medium with 10% FCS and incubated for further 24 hours (24 h). Representative microscopic visualization of neutral lipid accumulation in 2 NCFs (1+ and 1-),
Nat
ure
Pre
cedi
ngs
: hdl
:101
01/n
pre.
2009
.300
1.1
: Pos
ted
29 M
ar 2
009
and 2 PFs (1+ and 1-) cell cultures. Cells were treated with isopropyl alcohol (60%), washed, stained with ORO and counterstained with Mayer’s hematoxylin. Stained cells were examined by light microscopy and digital images recorded.
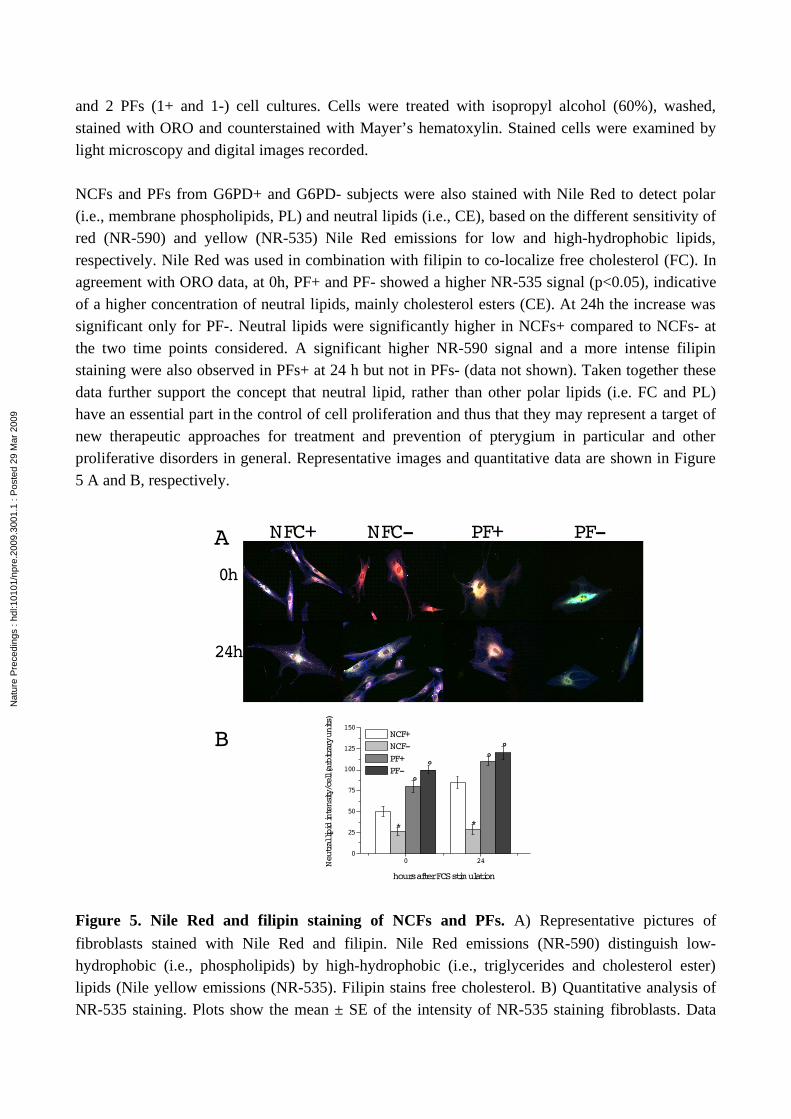
NCFs and PFs from G6PD+ and G6PD- subjects were also stained with Nile Red to detect polar (i.e., membrane phospholipids, PL) and neutral lipids (i.e., CE), based on the different sensitivity of red (NR-590) and yellow (NR-535) Nile Red emissions for low and high-hydrophobic lipids, respectively. Nile Red was used in combination with filipin to co-localize free cholesterol (FC). In agreement with ORO data, at 0h, PF+ and PF- showed a higher NR-535 signal (p<0.05), indicative of a higher concentration of neutral lipids, mainly cholesterol esters (CE). At 24h the increase was significant only for PF-. Neutral lipids were significantly higher in NCFs+ compared to NCFs- at the two time points considered. A significant higher NR-590 signal and a more intense filipin staining were also observed in PFs+ at 24 h but not in PFs- (data not shown). Taken together these data further support the concept that neutral lipid, rather than other polar lipids (i.e. FC and PL) have an essential part in the control of cell proliferation and thus that they may represent a target of new therapeutic approaches for treatment and prevention of pterygium in particular and other proliferative disorders in general. Representative images and quantitative data are shown in Figure 5 A and B, respectively.
0 240
25
50
75
100
125
150
*
°
°
°
Neutral lipid intensity/cell (arbitrary units)
hours after FCS stimulation
NCF+ NCF PF+ PF
*
°
NFC+ NFC PF+ PF
0h
24h
A
B
Figure 5. Nile Red and filipin staining of NCFs and PFs. A) Representative pictures of
fibroblasts stained with Nile Red and filipin. Nile Red emissions (NR-590) distinguish low-hydrophobic (i.e., phospholipids) by high-hydrophobic (i.e., triglycerides and cholesterol ester) lipids (Nile yellow emissions (NR-535). Filipin stains free cholesterol. B) Quantitative analysis of NR-535 staining. Plots show the mean ± SE of the intensity of NR-535 staining fibroblasts. Data
Nat
ure
Pre
cedi
ngs
: hdl
:101
01/n
pre.
2009
.300
1.1
: Pos
ted
29 M
ar 2
009
were obtained from 6 microscopic fields per group, each field including a total area of 3252 µm of cytoplasm (excluding the background). *NCF- vs NCF+, P<0.05; °PF (+/-) vs NCF (+/-), P<0.05.
Autofluorescence in NCFs and PFs
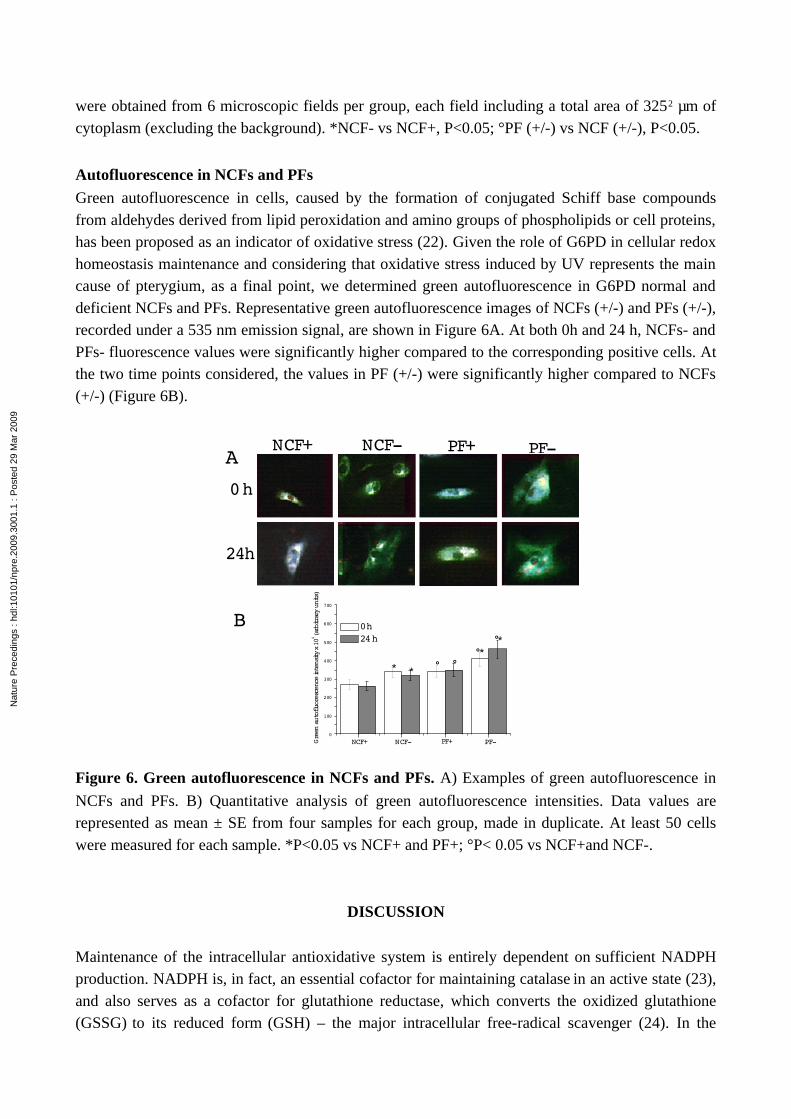
Green autofluorescence in cells, caused by the formation of conjugated Schiff base compounds from aldehydes derived from lipid peroxidation and amino groups of phospholipids or cell proteins, has been proposed as an indicator of oxidative stress (22). Given the role of G6PD in cellular redox homeostasis maintenance and considering that oxidative stress induced by UV represents the main cause of pterygium, as a final point, we determined green autofluorescence in G6PD normal and deficient NCFs and PFs. Representative green autofluorescence images of NCFs (+/-) and PFs (+/-), recorded under a 535 nm emission signal, are shown in Figure 6A. At both 0h and 24 h, NCFs- and PFs- fluorescence values were significantly higher compared to the corresponding positive cells. At the two time points considered, the values in PF (+/-) were significantly higher compared to NCFs (+/-) (Figure 6B).
0 h
NCF+ NCF PF+ PF
24h
1 2 3 40
100
200
300
400
500
600
700
°°
°
**
*
PFPF+NCFGreen autofluorescence intensity x 104
(arbitrary units)
0 h 24 h
NCF+
* °
A
B
Figure 6. Green autofluorescence in NCFs and PFs. A) Examples of green autofluorescence in
NCFs and PFs. B) Quantitative analysis of green autofluorescence intensities. Data values are represented as mean ± SE from four samples for each group, made in duplicate. At least 50 cells were measured for each sample. *P<0.05 vs NCF+ and PF+; °P< 0.05 vs NCF+and NCF-.
DISCUSSION
Maintenance of the intracellular antioxidative system is entirely dependent on sufficient NADPH production. NADPH is, in fact, an essential cofactor for maintaining catalase in an active state (23), and also serves as a cofactor for glutathione reductase, which converts the oxidized glutathione (GSSG) to its reduced form (GSH) – the major intracellular free-radical scavenger (24). In the
Nat
ure
Pre
cedi
ngs
: hdl
:101
01/n
pre.
2009
.300
1.1
: Pos
ted
29 M
ar 2
009
absence of an adequate antioxidant compensatory system, cells may be damaged by environmental and biological factors after chronic exposure to them, leading to the activation of oxidative-stress-sensitive intracellular signaling, which may be ultimately responsible for the induction of tumorigenic properties (14,25).Evidence for these mechanisms is extensive, and the accumulation of oxidative damage has often been associated with modifications in normal cellular growth control (14,25).Although NADPH may also be produced by the action of (a)NADP-linked malic enzyme, which oxidatively decarboxylates malate to pyruvate; and (b) the mitochondrial enzyme, NADP-linked isocitrate dehydrogenase, there is compelling evidence that G6PD is the principal source of the NADPH utilized in maintaining cellular redox state within the normal range, and thus in protecting cells from oxidative stress (26). However, as the key enzyme in the PPP which provides pentose phosphates – precursors of nucleic acids –, G6PD is important for the regulation of cell growth. Accordingly, in normal cells, G6PD expression is tightly controlled; while, in many tumors, regulation of its expression is altered, resulting in a significant increase in G6PD activity (6,7). G6PD deficiency is an inherited disorder characterized by decreased G6PD activity, mainly in red blood cells, but actually also in nucleated cells. This decreased activity is not due to enzyme synthesis impairment, but rather to reduced enzyme stability (5), which leads to a shortening of its half-life. Therefore, a major problem, as yet unsolved, is to understand the underlying mechanisms linking G6PD deficiency to oxidative stress and cell growth. In order to address this issue, in the present study we utilized fibroblasts isolated from pterygial lesions, both from G6PD+ and G6PD- patients, as an experimental model. Our choice was determined by the fact that pterygium is believed to be induced by chronic oxidative stress caused by exposure to UV light, and that previous studies, done by us and others, showed that pterygium fibroblasts resemble a tumorigenic phenotype (15,27). As controls we utilized fibroblasts isolated from conjunctiva from G6PD+ and G6PD- patients who had undergone cataract surgery. The choice was easily made since our preliminary epidemiological data had shown a high prevalence of pterygium in G6PD-deficient subjects. Growth rate analysis revealed that PFs grow faster than NCFs, but while NCFs- grow more slowly than NCFs+, PFs- and PFs+ grow at the same rate. This was associated with significantly lower G6PD activity in NCFs+ compared to NCFs- (about 50% residual activity, p < 0.05), while no significant differences in the G6PD activity of PFs+ and PFs- (about 95% residual activity) were noted. This result was supported by the finding that in PFs-, G6PD mRNA levels were significantly higher than in PFs+, indicating that, under conditions of increased requirement, such as induced proliferative stimulus, G6PD-deficient nucleated cells overcome the very rapid decay of their mutated enzyme, by producing more protein molecules. Similarly, we previously found higher G6PD mRNA and activity levels in G6PD-deficient leukemic cells compared to deficient peripheral blood mononuclear cells (PBMC), as well as in G6PD-deficient tumor lung tissue compared to normal surrounding tissue (6,7). Another interesting finding of this study was increased autofluorescence in both NCFs- and PFs- compared to corresponding positive cells, indicative of pronounced oxidative stress in deficient cells. Finally, abnormal accumulation of neutral lipids, mainly cholesterol esters observed both in PFs- and PFs+ compared to NCFs- and NCFs+. These data are in accordance with our previous studies showing that intracellular accumulation of neutral lipids represents an important element in the control of cell proliferation(28,29).
Nat
ure
Pre
cedi
ngs
: hdl
:101
01/n
pre.
2009
.300
1.1
: Pos
ted
29 M
ar 2
009
The results of this study, although restricted to a limited group of subjects (i.e. those of Sardinian ancestry), lead to important mechanistic considerations:
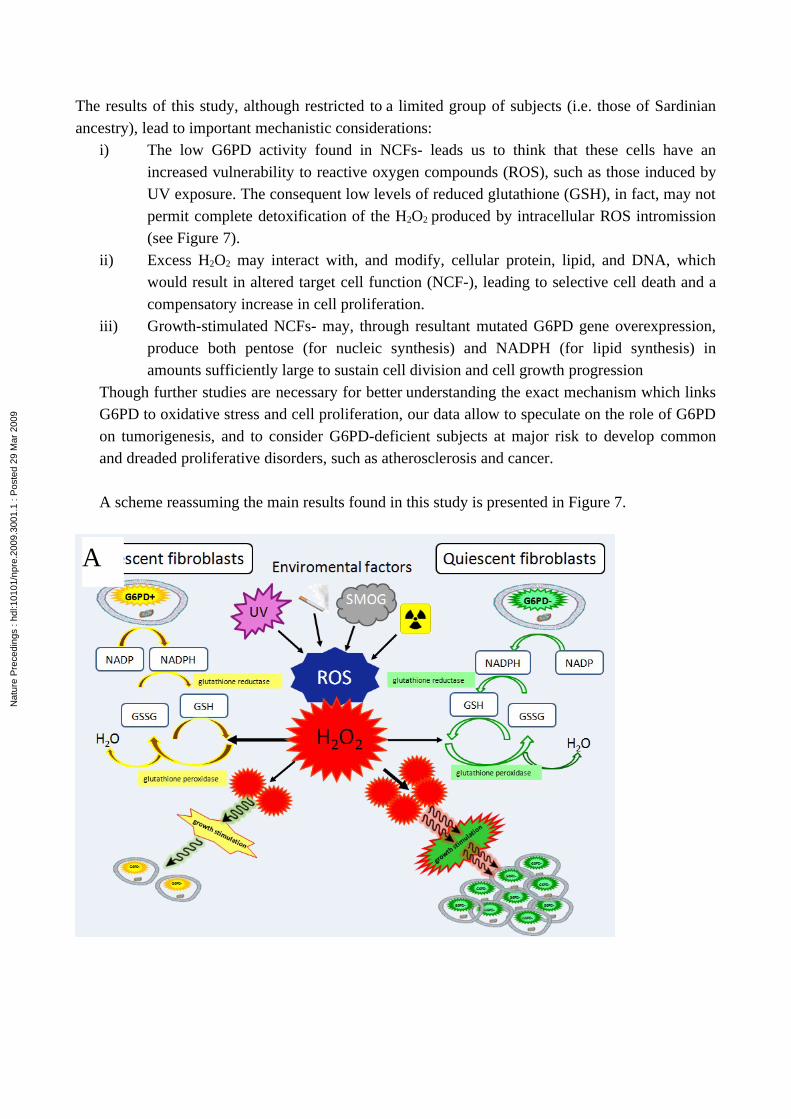
i) The low G6PD activity found in NCFs- leads us to think that these cells have an increased vulnerability to reactive oxygen compounds (ROS), such as those induced by UV exposure. The consequent low levels of reduced glutathione (GSH), in fact, may not permit complete detoxification of the H2O2 produced by intracellular ROS intromission (see Figure 7).
ii) Excess H2O2 may interact with, and modify, cellular protein, lipid, and DNA, which would result in altered target cell function (NCF-), leading to selective cell death and a compensatory increase in cell proliferation.
iii) Growth-stimulated NCFs- may, through resultant mutated G6PD gene overexpression, produce both pentose (for nucleic synthesis) and NADPH (for lipid synthesis) in amounts sufficiently large to sustain cell division and cell growth progression
Though further studies are necessary for better understanding the exact mechanism which links G6PD to oxidative stress and cell proliferation, our data allow to speculate on the role of G6PD on tumorigenesis, and to consider G6PD-deficient subjects at major risk to develop common and dreaded proliferative disorders, such as atherosclerosis and cancer.
A scheme reassuming the main results found in this study is presented in Figure 7.
A
Nat
ure
Pre
cedi
ngs
: hdl
:101
01/n
pre.
2009
.300
1.1
: Pos
ted
29 M
ar 2
009
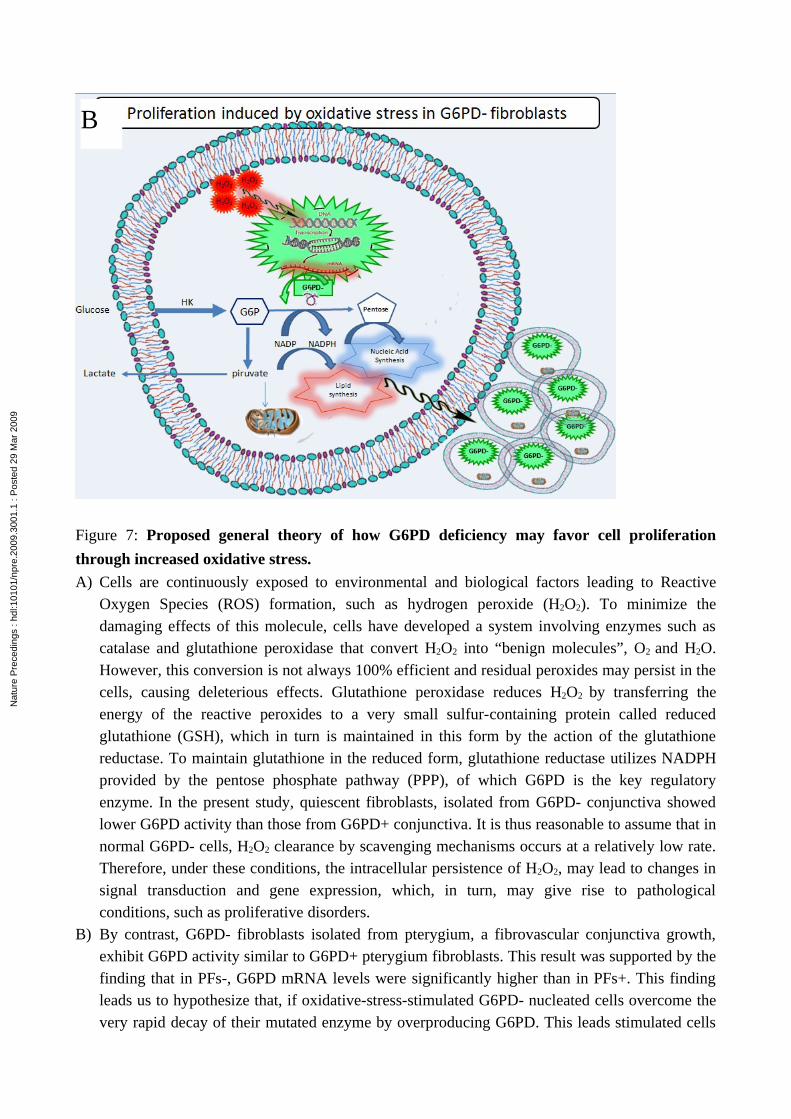
Figure 7: Proposed general theory of how G6PD deficiency may favor cell proliferation
through increased oxidative stress.
A) Cells are continuously exposed to environmental and biological factors leading to Reactive Oxygen Species (ROS) formation, such as hydrogen peroxide (H2O2). To minimize the damaging effects of this molecule, cells have developed a system involving enzymes such as catalase and glutathione peroxidase that convert H2O2 into “benign molecules”, O2 and H2O. However, this conversion is not always 100% efficient and residual peroxides may persist in the cells, causing deleterious effects. Glutathione peroxidase reduces H2O2 by transferring the energy of the reactive peroxides to a very small sulfur-containing protein called reduced glutathione (GSH), which in turn is maintained in this form by the action of the glutathione reductase. To maintain glutathione in the reduced form, glutathione reductase utilizes NADPH provided by the pentose phosphate pathway (PPP), of which G6PD is the key regulatory enzyme. In the present study, quiescent fibroblasts, isolated from G6PD- conjunctiva showed lower G6PD activity than those from G6PD+ conjunctiva. It is thus reasonable to assume that in normal G6PD- cells, H2O2 clearance by scavenging mechanisms occurs at a relatively low rate. Therefore, under these conditions, the intracellular persistence of H2O2, may lead to changes in signal transduction and gene expression, which, in turn, may give rise to pathological conditions, such as proliferative disorders.
B) By contrast, G6PD- fibroblasts isolated from pterygium, a fibrovascular conjunctiva growth, exhibit G6PD activity similar to G6PD+ pterygium fibroblasts. This result was supported by the finding that in PFs-, G6PD mRNA levels were significantly higher than in PFs+. This finding leads us to hypothesize that, if oxidative-stress-stimulated G6PD- nucleated cells overcome the very rapid decay of their mutated enzyme by overproducing G6PD. This leads stimulated cells
B
Nat
ure
Pre
cedi
ngs
: hdl
:101
01/n
pre.
2009
.300
1.1
: Pos
ted
29 M
ar 2
009
to produce sufficient amounts of pentose for nucleic acid synthesis, and of NAPDH for lipid synthesis, in order to sustain growth.
ACKNOWLEDGEMENTS
This study was supported by grants from Regione Autonoma della Sardegna and Fondazione Banco di Sardegna. The Authors wish to thank Anna Saba for technical assistance and Edward Steeden for English revision. The authors state that there are not conflicts of interest that may have influenced this work.
REFERENCES
1. Beutler E. Glucose 6-phosphate dehydrogenase. In Stanbury JB, Wyngaarden JB,. Fredrickson DJ, Goldstein JL, and Brown MS, eds. The metabolic basis of inherited disease. McGraw-Hill, NewYork 1983, Pp.1629-1653.
2. Luzzatto L, and Battistuzzi G. Glucose-6-phosphate dehydrogenase. Variants Adv Hum Genet 1985, 14:217-329.
3. Fenu MP, Finazzi G, Manoussakis C, Palomba V, and Fiorelli G. Glucose-6-phosphate dehydrogenase deficiency: genetic heterogeneity in Sardinia. Ann Hum Genet 1982, 46:105-114.
4. De Vita G, Alcalay M, Sampietro M, Cappelini D, Fiorelli G, and Toniolo D. Two Point Mutations Are Responsible for G6PD Polymorphism in Sardinia. Am J Hum Genet 1989, 44:233-240.
5. Huang Y, Choi MJ, Wing Ngor Au S, Man Yee Au D, Min Sien Lam V, and Engel PC. Purification and detailed study of two clinically different human glucose 6-phosphate dehydrogenase variants, G6PDPlymouth and G6PDMahidol: Evidence for defective protein folding as the basis of disease Mol Gen Met 2008, 93(1):44-53.
6. Dessì S, Batetta B, Cherchi R, Onnis R, Pisano M, and PaniP. Hexose monophosphate shunt enzymes in lung tumors from normal and glucose-6-phosphate-dehydrogenase-deficient subjects. Oncology 1988, 45(4):287-291.
7. Batetta B, Pulisci D, Bonatesta RR, Sanna F, Piras S, Mulas MF, Spano O, Putzolu M, Broccia G, and
Dessì S. G6PD activity and gene expression in leukemic cells from G6PD-deficient subjects. Cancer Lett. 1999, 140(1-2):53-58.
8. Sulis E. G.-6-P.D. deficiency and cancer. Lancet 1972, 1(7761):1185. 9. Meloni, L, Manca MR, Loddo I, Cioglia G, Cocco P, Schwartz A, Muntoni S, and Muntosi S.
Glucose-6-phosphate dehydrogenase deficiency protects against coronary heart disease. J Inherit Metab Dis. 2008, 31(3):412-427.
10. Forteleoni G, Argiolas L, Farris A, Ferraris AM, Gaetani GF, Meloni T. G6PD deficiency and breast cancer. Tumori. 1988, 74(6):665-667.
Nat
ure
Pre
cedi
ngs
: hdl
:101
01/n
pre.
2009
.300
1.1
: Pos
ted
29 M
ar 2
009
11. Cocco P, Dessì S, Avataneo G, Picchiri G, and Heinemann E. Glucose-6-phosphate dehydrogenase deficiency and cancer in a Sardinian male population: a case-control study. Carcinogenesis, 1989; 10(5):813-816.
12. Cocco P, Todde P, Fornera S, Manca MB, Manca P, and Sias AR. Mortality in a cohort of men expressing the glucose-6-phosphate dehydrogenase deficiency. Blood, 1998; 91:706–709.
13. Giordano FJ. Oxygen, oxidative stress, hypoxia, and heart failure. J Clin Invest, 2005; 115(3):500-508.
14. Droge W. Free Radicals in the Physiological Control of Cell Function. Physiol Rev, 2002; 82:47-95.
15. Coroneo MT, DiGirolamo N, and Wakefield D. The pathogenesis of pterygia. Curr Opin Ophthalmol, 1999; 10:282–288.
16. Threlfall TJ, and English DR. Sun exposure and pterygium of the eye: a dose-response curve. Am J Ophthalmol, 1999; 128:280–287.
17. Dushku N, John MK, Schultz GS, and Reid TW. Pterygia pathogenesis. Arch Ophthalmol, 2001; 119:695–706.
18. Peiretti E, Dessì S, Mulas MF, Abete C, Galantuomo MS, and Fossarello M. Fibroblasts isolated from human pterygia exhibit altered lipid metabolism characteristics. Exp Eye Res, 2006; 83:536–542.
19. Peiretti E, Dessì S, Mulas C, Abete C, Norfo C, Putzolu M, and Fossarello M. Modulation of cholesterol homeostasis by antiproliferative, drugs in human pterygium fibroblasts. Invest Ophthalmol Vis Sci, 2007; 48(8):3450-3458.
20. Peiretti E, Dessì S, Putzolu M, and Fossarello M. Hyperexpression of low density lipoprotein receptors and hydroxy-methylglutaryl-coenzyme A-reductase in human pinguecula and primary pterygium. Invest Ophthalmol Vis Sci, 2004; 5(11):3982-3985.
21. Diaz G, Batetta B, Sanna F, Uda S, Reali C, Angius F, Melis M, and Falchi AM. Lipid droplet changes in proliferating and quiescent 3T3 fibroblasts. Histochem Cell Biol, 2008; 129(5): 611-621.
22. Bidlack WR, and Tappel AL. Fluorescent products of phospholipids during lipid peroxidation. Lipids, 1973; 8(4):203-207.
23. Kirkman HN, and Gaetani GF. Catalase: a tetrameric enzyme with four tightly bound molecules of NADPH. Proc Natl Acad Sci USA, 1984; 81:4343-4347.
24. Armstrong JS, Steinauer KK, Hornung B, Irish JM, Lecane P, Birrell GW, Peehl DM,and Knox SJ. Role of glutathione depletion and reactive oxygen species generation in apoptotic signaling
in a human B lymphoma cell line. Cell Death Differ, 2002; 9:252–263.25. Okada F. Chronic Oxidative Stress and Inflammation: Role in Human Cancer Development.
Inter J Cancer, 2007;121 (11):2364-2372.
26. Martini G, and Ursini MV. A new lease of life for an old enzyme. Bioessays, 1996; 18(8):631-
637.27. Chen J-K, Tsai RJF, and Lin S-S. Fibroblasts isolated from human pterygia exhibit transformed
cell characteristics. In Vitro Cell Dev Biol. 1994; 30A:243–248.
Nat
ure
Pre
cedi
ngs
: hdl
:101
01/n
pre.
2009
.300
1.1
: Pos
ted
29 M
ar 2
009

28.Batetta B, Mulas MF, Sanna F, Putzolu M, Bonatesta RR, Gasperi-Campani A, Roncuzzi L,
Baiocchi D, and Dessi S. Role of cholesterol ester pathway in the control of cell cycle in human
aortic smooth muscle cells Faseb J, 2003; 17:746-748.
29. Dessì S, Batetta B, Pani A, Spano O, Sanna F, Putzolu M, Bonatesta R, Piras S, and Pani P. Role of cholesterol synthesis and esterification in the growth of CEM and MOLT4 lymphoblastic cells. Biochem J, 1997; 321:603-608.
Nat
ure
Pre
cedi
ngs
: hdl
:101
01/n
pre.
2009
.300
1.1
: Pos
ted
29 M
ar 2
009
Related Documents