1 OECD Blue Sky meeting on Science and Innovation Indicators Theme : “Trust, culture, and citizens' engagement in science and innovation” Ghent, 19-21 September 2016 July 2016 [email protected] [12810 words; 25 pages, excluding references, annexes] Relating ‘Science Culture’ and Innovation Bauer MW (LSE) & A Suerdem (Istanbul Bilgi University) Contact: [email protected] List of Contents: 1. Towards subjective indicators of science culture and innovation 1.1 Defining ‘Science Culture’ 2. Methods, data curation and the etic/emic perspective 2.1 Data curating and mining 2.2 Validating a 2D evaluation model: accepting the Promise and harbouring Reservations 2.3 Measurement invariance and fit of a parametrised 4D-model of Science Culture 3. Results: Characterising Four Science Cultures across EU32+ 3.1 Clustering EU32+ countries 3.2 Validating the four clusters 4. Conclusion: The Subjective Levers of Performance

Welcome message from author
This document is posted to help you gain knowledge. Please leave a comment to let me know what you think about it! Share it to your friends and learn new things together.
Transcript
1
OECD Blue Sky meeting on Science and Innovation Indicators
Theme : “Trust, culture, and citizens' engagement in science and innovation”
Ghent, 19-21 September 2016
July 2016 [email protected]
[12810 words; 25 pages, excluding references, annexes]
Relating ‘Science Culture’ and Innovation
Bauer MW (LSE) & A Suerdem (Istanbul Bilgi University)
Contact: [email protected]
List of Contents:
1. Towards subjective indicators of science culture and innovation
1.1 Defining ‘Science Culture’
2. Methods, data curation and the etic/emic perspective
2.1 Data curating and mining
2.2 Validating a 2D evaluation model: accepting the Promise and harbouring Reservations
2.3 Measurement invariance and fit of a parametrised 4D-model of Science Culture
3. Results: Characterising Four Science Cultures across EU32+
3.1 Clustering EU32+ countries
3.2 Validating the four clusters
4. Conclusion: The Subjective Levers of Performance
2
1 Towards subjective indicators of science culture and innovation
The process of modernisation is generally understood as to unleash the productive power of
science and technology into society and to fuel economic growth for well-being. Historical
narratives position science and technology as the key productive force culminating in a
‘scientific-technological civilisation’ for which notions like the ‘nuclear society’, ‘bio-
society’, ‘information’ and ‘knowledge society’ are subordinate and more specific trends.
According to this perspective, science, progress and modernity are essentially connected.
19th
century economists might have considered growth to be a function of the basic factors of
land, labour, capital and entrepreneurship in a system where tastes, technology and
institutions are exogenous parameters or historical constants. Later, Kaldor (1957) added
technology to the productive factors. Recent historical accounts notice the endogeneity of all
these parameters and assumed material output to be dependent on a mix of population,
resources, technology and institutions. And for each of these parameters there is a ‘cluster of
variables’ (Cameron, 1997, p9ff). Furthermore, historical accounts of long-term developments
stress that this variable mix must include indicators of subjective mentality in terms of world
view, welcoming the everyday use of novel products and care about material efficiency, and
of the imagination which enables such welcoming and care (Bloch, 1948; Rosenberg &
Birdzell, 1986; Quintanilla, 2012; Aibar & Quintanilla, 2002). Cohen (1994, 282) asked three
questions: who are those people who cultivate science as distinct from technology, who
supports them and what symbols and images scaffold their support?
The quest for subjective factors of mentality acknowledges that no society dispenses of its
cultural environment which can be variously uneasy with, inconsistent with, or simply putting
the achievements of science and technology at stake. During the 20th
century the
environmental and consumer movements raised the stakes for science and technology by
setting benchmarks of acceptability for product safety and environmental sustainability. This
amounts to the rejection of the equation: STI = PROGRESS. This equation is no longer self-
evident; it is tested against benchmarks of variously motivated resistance (see Bauer, 2015a).
Many observers struggle with the ‘productivity paradox’ in a world where labour
productivity stagnates or declines despite large investments in new technology, particularly in
information technology. Hence, science culture may play a role in engaging citizens to STI
and maintaining an environment for productivity. One must expect that the “gap” between
culture and science may manifest itself differently in the various regions of the world. This is
an eminently empirical question for the engagement of citizens into responsible research and
innovation. We might happily admit that science is a global affair, but the culture of
science remains bound by local morality (Bauer, 2015b).
In this paper, we emphasize the need for extending FRASCATI and OSLO Manuals of
defining performance indicators of science, technology and innovative capacity, and to
include subjective indicators of culture of science and innovation. Indicators of science
culture are part of the modern quest of harnessing economic productivity for the benefit of
society. Our aim is to demonstrate procedures for constructing cultural indicators of STI
based on subjective attitude data. For this purpose we rely on data mining of data sources
accumulated in Eurobarometer databases since the 1980s. These databases cover information
about cognitive, evaluative and affective dimensions on which individuals relate science to

3
their everyday life. They provide an invaluable data source for studying science literacy;
interest and engagement with science events; expectations of utility and welfare arising from
science; and worries and concerns, images and representations of science and trust in its
institutions.
Our ongoing research concerns the General S&T surveys in the Eurobarometer series
collected hitherto in seven waves from 1989 to 2013 (EB 31; EB 38.1; EB 55.2; CCEB
2002.3; EB 63.1 and EB 78.1, EB79.2; N=1000 per country). This data stream initially
covered 12 EU members; after 2002 it is extended to 32+ countries, covering European
member and candidate states. Similar large datasets of attitudes to science are available in
India (2005 and planned 2017), China (2007, 2010 and 2015), and across Latin America and
USA (see overview in Bauer & Falade, 2014). The present analysis focuses on EB 55.2_2001;
CCEB 2002.3; EB 63.1-2005 and EB 78.1_2010 as they are most comprehensive for our
purposes of testing the indicators.
2.1 Defining ‘Science Culture’
To develop the guidelines for a science indicator system, we start with a distinction between
‘scientific’ and ‘science’ culture concepts. STI indicators traditionally focus on ‘scientific’
culture [from Latin ‘scientia facere’], which comprises the material conditions of and the
performance of science and innovations in terms of inputs, process and outputs. Innovation
indicators use existing S&T information such as R&D investment, scientific publication
output and impact, patents and manpower. As such, they are focussed on the innovators, a tiny
subsection of the population. However, it is increasingly been recognised that a “science
environment” needs to include the wider mentality of public imagination which supports or
challenges the material conditions and creates and sustains the career aspirations that staff it.
We call the latter ‘science culture’ in contrast to the former ‘scientific system’. While the
former is a global affair and lends itself to standardised indicators whose variance is a matter
of quantity and rank ordering; the indicators of mentality, however, do not so easily stack up
along a single universal model. To use an analogy: the scientific system of innovation is a fish
bowl, where effort goes into conditioning the fish for activity. Little attention however is
given to the larger environment that maintains the fish bowl in the first place, by
acknowledging its existence, loving its displays and supporting its maintenance.
The quest for indicators of science culture is old, however, side-lined by an economistic focus
(Godin, 2005). Various researchers and agencies have sought in the past to capture the human
patterns of diverse practices, world views, and values with sets of indicators of mass media
trends (‘world view’ cultivation effect models), of local knowledge of indigenous peoples for
agriculture (FAO), of the performance of the culture industry in pop music, opera and other
arts (culture indicators of national statistics), of moral values and their change (e.g. World
Value Survey), effect of national values on doing business (Hofstede, 1997) or of longitudinal
shifts in cultural production (culture trends; for a review of these see Bauer, 2012).
As the concept of ‘culture indicator’ might be controversial, we need to clarify the term
‘culture’ here. Even anthropology debates the usefulness of the concept and its right or wrong
applications. The ideological critique is pertinent when the concept is used to discursively
transform historical variability into ‘natural’ essences of race, ethnic or tribal locality; when

4
bounded homogeneity, coherence, and stable structures are privileged over a reality that is
fluid, inconsistent, and full of conflict, agency and change (Brumann, 1999). However, the
term ‘culture’ remains useful to refer to routines of feeling, thinking and striving in a
community, learnt and accumulated, as long as incomplete sharing is part of the concept.
Culture in this sense refers to a reality where features are distributed onto individuals with
fuzzy boundaries as in statistical cluster sets which become the basis to mobilise collective
identities (ibidem, pS7).
Utilitarian-rationalist accounts of human behaviour tend to be sceptical of ‘culture’ concept,
considering it as residual variance for which the exact variable has yet to be defined.
Accordingly, culture is an exogenous variable constraining the self-interested rational
behaviour of the individuals. Culture seems a remnant of pre-market societies, in modern
market societies human interactions are no longer determined by cultural and kinship
obligations. Such atomized-individualist accounts of human behaviour are challenged on the
grounds that all economic action is embedded in social relationships and persistent cultural
values of moral concerns, politics and religion (Polanyi, 1944; Granovetter, 1985; Taylor,
2004). This embeddedness challenges both the view of culture which assumes individuals to
be trapped in essentialist identities and the rationalist view which assumes that human
behaviour occurs in a vacuum of socially shielded rationality. It emphasizes the role of culture
as a context shaping and shaped by the patterns of interactions between individuals.
Equally, innovation indicators tend to ignore culture and focus on competitive performance of
innovative activities. Input factors such as investment in R&D support process activities to
convert research into output goods, services, and processes for the market. For example,
the Innovation Union Scoreboard (IUS), the instrument of the European Commission, focuses
on competiveness as performance of the ‘environment’ and particular actors. This scoreboard
is developed under the Lisbon Strategy for a Knowledge Society and revised after the
adoption of the Europe 2020 Strategy to provide a comparative assessment of EU Member
States. (see http://ec.europa.eu/growth/industry/innovation/).
However, culture is not an exogenous variable to the performance of some target variables.
Economics of innovation in heterogeneous populations needs to recognise that all processes
of contagion, social influence and social learning of innovations depend on a prior belief
space and prior dispositions in the wider population (Young, 2009). Indicators of innovation
must consider not only the conditions of supply of innovations but also the generic conditions
of their adoption and uses. Hence, we need to broaden the approach and include indicators for
mapping people’s belief spaces and mentalities.
For this purpose, we will present our ongoing research for generating science culture
indicators that make use of existing data from different contexts. Our current project has been
curating such data for purposes of reframing and further analyses. Our approach starts with a
psychometric model of individual differences on a set of science culture variables; however,
we consider the target concept ‘culture of science’ not as aggregations of a set of variables,
but as structural pattern of relations between these variables.

5
2. Methods, data curation and ‘etic’ / ‘emic’ perspectives
We have two operating principles which distinguish our study from other development
efforts: First, we follow an abductive logic for construct development and side-step the more
common deductive and inductive approach. Second, we focus on configurative similarity and
difference, and not on ranking. We conduct relational analyses between constructs and avoid
ranking on aggregate measures to compare the countries and units of analysis.
Traditional subjective indicator development is largely following psychometric attitude
research and deductive operationalization of a conceptual framework. However, such a view
imposes an “etic” observer perspective on local culture: it generalizes a putatively ‘universal’
parameter model of human experience and behaviour which is then linked to exogenous
factors such as economic or ecological conditions. This is reflected in the politics of data
collection; over the years there has been much regional reluctance in the research on attitudes
to science to replicate simple extensions of ethnocentric standards despite theoretical
justification. Hypothetico-deductive reasoning is a top-down approach to scientific inference.
It starts with a theory about the subject domain and narrows down with observable
hypotheses. Operating principles of psychometric tests are usually built upon deductive
reasoning. They start with a theoretical definition of the subject domain, identify its
dimensions and determine the items that could be the indicators of these dimensions. On the
other hand, inductive reasoning is a bottom-up approach arriving at concepts by means of
detecting patterns and regularities in particular observations. While deductive reasoning
appears culturally neutral it remains ‘etic’ in outlook, inductive reasoning follows a more
‘emic’, actor-based understanding of cultural elements. However, neither approach is
satisfactory for cross-cultural studies. While the former forces a structure on observations, the
latter makes comparison impossible. Abductive pattern recognition (Reichertz, 2004; Harman,
1965) offers a more flexible way of rule-governed and replicable production of new and valid
constructs. Abductive logic, while considering changing and fragmented cultures, aims to
hypothesize tentative structures that possess local validity.
. As for our second principle, while we start from a psychometric approach to individual
differences on attitudes, we consider the ‘culture of science’ not as aggregations of particular
variables, but as structural features of bundles of such variables, i.e. of the correlations
between them. Cultural analysis involves comparing patterns of relations between attitude
responses, thus stressing diversity-in-communality. The culture of science cannot be
assessed by ranking isolated indicators, each of which is subject to semantic diversity and
ambiguity despite all precautions of item wording, translations and statistical item analysis.
Ranking on any indicator creates a performance index; to achieve a culture index, we must
focus on the statistical interaction between bundles of indicators and contexts (see Wagner et
al, 2015). Hence, our methodology focuses on similarity and differences of correlations
among indicators across units/countries on a tested and fixed regional model. To reach this
methodological objective, we used data mining techniques. We fix the cultural model
regionally in order to make visible a pattern of relations within that model. We do not assume
that this model is universal. In this paper we report our benchmark study of analysing
Eurobarometer data and thereby suggest concrete procedures for the development of such a
science culture indicator system across the world along similar lines: clustering unit-based
correlation patterns on a regionally fixed parameter model.

6
2.1. Data Curating and Data Mining
The increasing availability, encouraged by open access policy, of large scale longitudinal
datasets produced for different purposes (WVS, EVS, ESS, EB, NSF etc...) opens up new
horizons for indicator development. Cultural meanings are more likely to be endogenous
(emic) and we must expect that the relations between indicators vary according to contexts to
reflect diverse meanings. Data mining and secondary analysis offers procedures for revealing
such structures through inductive pattern detection techniques followed by abductive
reasoning, i.e. inference to the most plausible explanation (Harman, 1965). These techniques
help us to detect similarities and differences across local patterns. Like any designed product,
data once collected and documented enjoys a degree of interpretative flexibility: the use of
data is not determined by its initial design. We curate data collected mainly for one purpose,
to measure ‘scientific literacy’, to put it to a different purpose, to construct ‘culture of science’
indicators. The abductive move is re-interpreting the past in order to open up new futures.
This chapter reports on our explorations of a science culture indicator system (SCIS) derived
from large scale attitude surveys and other data sources. We are currently extending this
approach to datasets curated in India (2005 and planned for 2017), China (2007, 2010 and
2015, and planned for 2020) and into South and North America in the context of our
international project MACAS (mapping the cultural authority of science; http://www.macas-
project.com/ funded by ESRC, DFG and ISSRC, 2014-2016). We generate indicators using
existing nationally representative attitude data taken in different contexts since the 1980s; this
database is curated in the MACAS project. Our current analysis will focus on the General
S&T surveys in the Eurobarometer series 2001/02, 2005 and 2010 (EB 55.2; CCEB 2002.3;
EB 63.1 and EB 78.1; N=1000 per country) as they are most comprehensive for our purposes.
Data mining is following six step phases (Larose & Larose, 2014). We used different R
packages (see R, 2008) for examining evaluative attitudes to science, more specifically we
used Revelle (2016) for psychometric analyses including exploratory factor analysis (EFA)
and item response theory (IRT) and Rosseel (2012) for confirmatory factor analysis (CFA):
1. Project Understanding: the project objectives are determined and formulated to data
mining problem definition.
2. Data Understanding: involves familiarizing with the data by exploring it for checking
the quality of the data; discovering initial insights and selecting interesting subsets that
may contain actionable patterns.
3. Data Preparation: involves cleaning the raw data; preparing the data set and selecting
the cases and variables for analysis and performing transformations on certain
variables and imputations of missing data if needed.
4. Modelling: requires identifying, applying and calibrating appropriate modelling
strategies.
5. Evaluation: compares different models for quality and effectiveness and if the model
achieves the objectives defined in phase 1.
6. Deployment: reporting of final model for policy considerations and decisions.

7
In the following paragraphs, we will explain how we implemented these phases for modelling
science culture as a data mining exercise. In terms of Project understanding (phase 1) We
have started determining project objectives and problem formulation with the definition of
science culture, its conceptualization as patterns of indicators as explained above.
For Data Understanding (Phase 2) we explored and pre-processed the data to increase the
analytical quality; this included missing value analysis. After collating the data from different
datasets, work done in the MACAS project, we identified common variables and prepared an
integrated codebook for these. We started with EB 78.1 (2010) as benchmark data. We
explored the univariate and multivariate distributions for the variables in the codebook for
testing parametric assumptions and outliers. Special issues arise for modelling when we have
missing data. Listwise and pairwise deletion are the two popular methods for dealing with
missing data in basic statistics packages such as SPSS, however these are the worst methods
for practical applications. (Wilkinson, 1999). A better practice is to examine if the data is
MCAR (missing completely at random; missing values do not show any systematic patterns),
MAR (missing at random; missing values on one variable show some systematic patterns
depending on other variables) or MNAR (missing not at random; missing values have
systematic patterns depending on the variable itself) and follow some imputation strategies
accordingly. If the data is MCAR, missing values can be imputed with their means or can be
deleted listwise. If the data is MAR, different imputation strategies depending on the values of
non-missing variables can be followed. For MNAR, missingness is dependent on the variable
itself, hence it is difficult to estimate values for missing cases. To check if the missing values
follow systematic patterns on other variables (MAR) we explored the proportion of missing
values for the attitude items (for missing pattern visualization on EB 78.1_2010 see Appendix
1). Missing values make about four percent of the data, sometimes exceeding five percent.
This suggests that data may not be MCAR. Hence, we checked spinograms if missing values
follow any correlation patterns, and we can see patterns with sex, age, education and interest
in science: Women, people of lower education, older age and lower interest to science tend to
have more missing responses than others.
For Data Preparation (Phase 3) we cleaned the raw data from outliers and made necessary
imputations to compensate for missing value analysis. In our dataset, attitude responses are
collected as 5-point Likert items (1= agree, 5=disagree); data are then recoded in reverse
order so that disagreement with the proposition is marked by low scale values (SD=1) and
agreement is marked by high scale values (SA=5) on all items; DK-responses recoded as
missing. Missing data that occur in more than one variable presents a special challenge. A
common approach for imputing such data is known as multivariate imputation by chained
equations (MICE). MICE helps imputing missing values with plausible data values. These
plausible values are drawn from a distribution specifically designed for each missing
datapoint. These data points are determined according to the non-missing values of selected
variables (gender, education, age and interest to science in our case).
We explored the structure of the evaluative attitude space for EB 78.1 data. First we tested
if the attitude space is uni-dimensional (positive-negative attitudes to science) for fifteen
Likert items. Cronbach’s alpha is low (.57) suggesting that items are not coherently organized
in a one-dimensional space. Then, we split the data and conducted exploratory factor analyses
(EFA) on the first half to recover the dimensions of the attitude space. We kept the second
half for confirmatory factor analysis (CFA) of the structure recovered from exploratory

8
analysis. We applied different EFA methods, namely minimum residuals, principal
components, Omega factor analysis and item cluster analysis, to check the stability of the
final structure (see appendix 2). All exploratory analyses recover three components with
similar items.
Items in Factor1 point to a critical view on science consistent with harbouring reservation
with reference to non-utilitarian assumption such as action ends or terminal values:
The applications of science and technology can threaten human rights.
Science and technology can sometimes damage people’s moral sense.
Because of their knowledge, scientists have a power that makes them dangerous.
Science makes our ways of life change too fast.
Science and technology could be used by terrorists in the future.
We depend too much on science and not enough on faith.
Factor2 points to an instrumental view of science consistent with a more pragmatic attitude
and expressing a concern with utility and assessing means-to-given ends:
Science and technology make our lives healthier, easier and more comfortable
Thanks to science and technology, there will be more opportunities for future
generations.
The application of science and new technologies will make people’s work more
interesting
Scientists should be allowed to do research on animals like mice if it produces new
information about human health problems.
Factor3 suggests a world view element and images of ‘science in the world’ including of what
science is capable of achieving, how important it is personally, and the notion of luck in life:
Thanks to scientific and technological advances, the Earth’s natural resources will be
inexhaustible.
Science and technology can sort out any problem.
In my daily life, it is not important to know about science.
Some numbers are especially lucky for some people.
Science and technology cannot really play a role in improving the environment.
These findings strongly suggest more than one dimension is required to capture the attitude-
evaluation domain of a culture of science across Europe: An instrumental dimension, a value-
critical dimension and maybe a world view dimension. We might call this the 3-factor 3F
model.

9
2.2 Validating a 2D evaluation model: accepting the Promise and harbouring Reserve
In the next Modelling Phase (4) we identified, applied and calibrated strategies in several
steps. This involves identifying the model and testing for measurement invariance across
units. Firstly, we applied a confirmatory factor analysis (CFA) on the second half of the EB
78.1_2010 data to check the stability of the aforementioned 3F model. Secondly, we checked
for the content validity by grounding the model in the literature. Thirdly, we checked if the
final model meets the criteria for measurement invariance.
We performed a CFA to cross-validate if the model emerged from exploratory analysis fits
the other half of the pooled data. Fit measures (see table 1) are not satisfactory according to
benchmarks. Checking for modification indices, we have noticed that the items ‘luck’, ‘daily
life’ and ‘cannot save environment’ have low coefficients and they are ambivalent as they are
also loading on other constructs which can be seen from EFA. Removing these items
improved the fit values, but not at a satisfactory level. Checking for the modification indices
again, we observed that the items in what we named as world view factor also load highly
with the value critical factor. Hence, we excluded those items and decided to settle on a two
dimensional structure: a 2D-model of evaluative attitude of science, comprising an
instrumental and critical factor. For this model, all fit measures are satisfactory (see table
1).
Table 1: CFA fit indices for evaluative attitude models on EB 2010 data
Chisq df cfi rmsea tli
3D model 11248.5 74 0.798 0.070 0.751
3D model, modified 3705.4 41 0.919 0.054 0.891
2D model 350.8 13 0.984 0.029 0.973
The literature on attitudes to science is edging towards a global consensus on two-dimensions
of evaluation, the naming of which remains something to be discussed. Miller & Pardo (2000)
reported a two-dimensional space for the evaluation of science based on an overlapping and
not identical set of items in US, German, Japanese and Canadian data collected in the 1980s
and early 1990s. Their CFA refers to these dimensions as Promise and Reservations. Crettaz
(in press for 2017) examines the six waves of the World Value Survey (1981-2014) across
Sweden, US, Japan, India, Chile, Spain and South Africa. On the items pertaining to the
evaluation of science, she again finds a two dimensional space being the best fit using CFA,
which she identifies as Promise and Reservation, following Miller & Pardo’s earlier analyses.
Todorov et al. (2009) examined 18 Likert-type attitude items included in Eurobarometer
survey 224 (EB 63.1_2005, split-ballot A only) using principal component exploratory
analysis (EFA). They find three factors which they name ‘evaluation’, ‘efficacy’ and
‘control’ of science following Osgood’s universal semantic space of ‘associative meaning’
(Osgood, Suci & Tannenbaum, 1957). ‘Evaluation’ includes items that celebrate the
achievements of science and its promises; ‘efficacy’ refers to the limitations of science
including statements of what science cannot achieve. The third factor, ‘control’ refers to the
need to regulate science under public oversight and within the boundaries of ethics. It is not
surprising, that their 1st and 2
nd factors are close to what others have called ‘promise’ and
‘reservation’ about science, and which we have confirmed on the same 2005 data. Finally,
Bauer & Howard (2013) in their analysis of Eurobarometer time-series data for Spain

10
explored a 3D-model of attitudes to science - Attention, Enculturation and Progressivism -
by examining the associations of items on interest, knowledge, engagement and evaluation
over time; the model remains descriptive, but it shows that these three dimensions have
different time trajectories for age cohorts and educational groups.
More generally, American political science, taking a new look at polity mood over past 60
years, suggests that the belief space of US citizens, long expected to be exhausted by the left-
right continuum, does requires a second dimension to represent the flow of issues. The first
dimension is the ‘economic’ assessment of government policy delivery; while the second
dimension captures ‘cultural’ issues on which people take positions (Stimson, 2014). Despite
different naming, this does not seem too far from the distinction between promise and reserve.
We might expect at least similar degrees of complexity elsewhere. And on an even more
abstract note, we consider Rokeach (1973) who distinguishes between ‘instrumental’ and
‘terminal’ values which can be mobilised for the evaluation of attitude objects. Terminal
values are the goals that a person would like to achieve during his or her lifetime; they refer to
desirable end-states of human existence. Instrumental values refer to preferable modes of
behaviour or means of achieving these terminal values. It might well be that we rediscover
this means-end distinction also in the evaluation of science, ‘means’ being the very down-to-
earth evaluation of the good of science in utilitarian terms, and ‘ends’ as the assessment of
more ‘transcendental’ orientations towards science less bound up with the empirical reality of
experience and giving rise to a more critical evaluation.
The distinction between ‘instrumental’ and ‘critical’ criteria for the evaluation of public
goods is also resonant of Horkheimer’s (1947) statement in the first chapter of ‘Eclipse of
Reason’ entitled ‘Means and Ends’. Horkheimer demarcates between two different types of
rationality which form the basis of enlightenment philosophy: Instrumental reason is
interested in determining the means to a goal, without reasoning about ends; while critical
reason is concerned with more transcendent ends in themselves and their relation to the
progress of civilization. According to Horkheimer, Enlightenment turns against itself as it
largely equates Progress with the advancement of instrumental reason. “Enlightenment,
understood in the widest sense as the advance of thought, has always aimed at liberating
human beings from fear and installing them as masters. Yet the wholly enlightened earth is
radiant with triumphant calamity” (Horkheimer, 1947, p.1).
Hence, we suggest that a first factor of evaluating science is consistent with a drive to make
nature calculable, and calculability is assimilated to usefulness of science. This scientific
picture is further reproduced through activities which seek to dominate nature, thus
instrumental-scientific activity creates a reality to fit this picture and evaluates states-of-
affairs in these terms. On a second factor, the critical reasoning seeks to root truth and
meaning, the proper ends of thought, within a more comprehensive totality than means-to-
given-ends. Critical reasoning is oriented towards examining and elaborating ends, while
instrumental reason remains fixated on means to given ends. The identification of historical
‘Progress’ with the rise of instrumental reasoning has given rise to Horkheimer & Adorno’s
(2002) later analysis of modernity and its discontents dominated by instrumental reasoning.
We thus expect to find resonance of both features of modern sentiment, instrumental and
critical, economic and cultural, means and ends reasoning in the public perceptions of science
of most contexts. And our examination of the data on evaluative attitudes towards science
11
seems consistent with these analyses. After examining the structure of evaluation of science
globally, and struggling over the naming of this structure, we proceed with checking if the
2D-hypothesis fits across all of Europe, and we call it ‘promise’ and ‘reserve’ (see box 1).
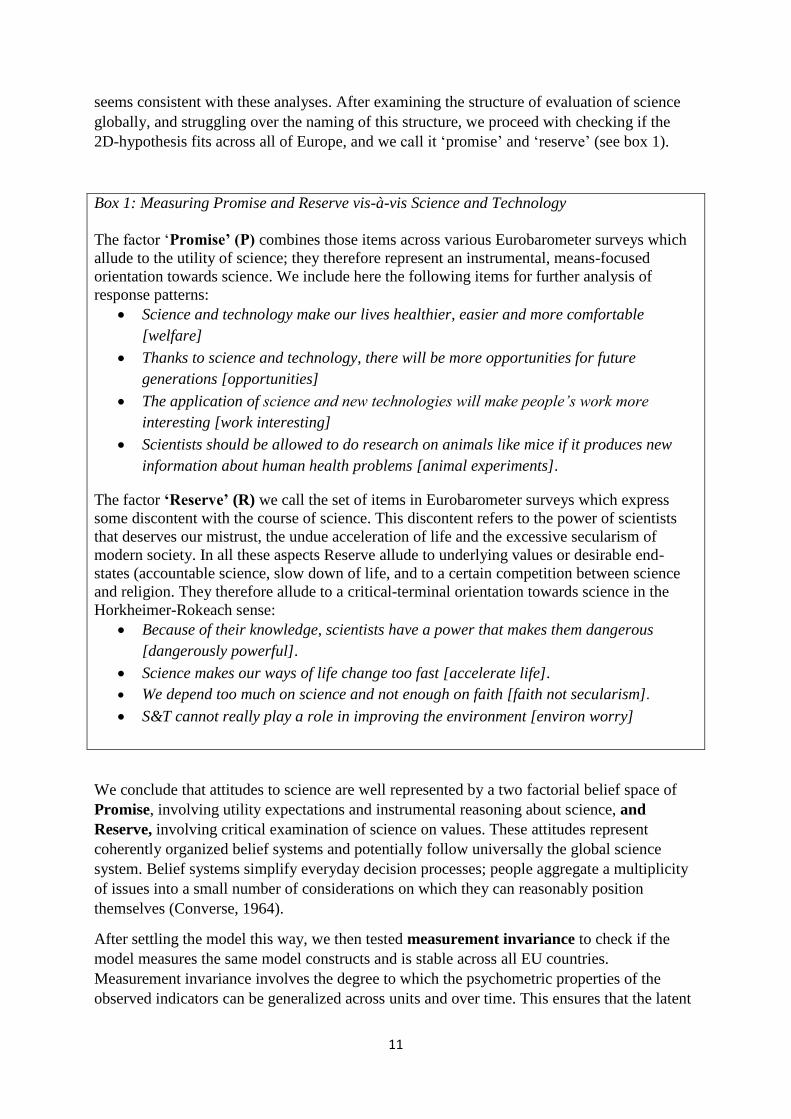
Box 1: Measuring Promise and Reserve vis-à-vis Science and Technology
The factor ‘Promise’ (P) combines those items across various Eurobarometer surveys which
allude to the utility of science; they therefore represent an instrumental, means-focused
orientation towards science. We include here the following items for further analysis of
response patterns:
Science and technology make our lives healthier, easier and more comfortable
[welfare]
Thanks to science and technology, there will be more opportunities for future
generations [opportunities]
The application of science and new technologies will make people’s work more
interesting [work interesting]
Scientists should be allowed to do research on animals like mice if it produces new
information about human health problems [animal experiments].
The factor ‘Reserve’ (R) we call the set of items in Eurobarometer surveys which express
some discontent with the course of science. This discontent refers to the power of scientists
that deserves our mistrust, the undue acceleration of life and the excessive secularism of
modern society. In all these aspects Reserve allude to underlying values or desirable end-
states (accountable science, slow down of life, and to a certain competition between science
and religion. They therefore allude to a critical-terminal orientation towards science in the
Horkheimer-Rokeach sense:
Because of their knowledge, scientists have a power that makes them dangerous
[dangerously powerful].
Science makes our ways of life change too fast [accelerate life].
We depend too much on science and not enough on faith [faith not secularism].
S&T cannot really play a role in improving the environment [environ worry]
We conclude that attitudes to science are well represented by a two factorial belief space of
Promise, involving utility expectations and instrumental reasoning about science, and
Reserve, involving critical examination of science on values. These attitudes represent
coherently organized belief systems and potentially follow universally the global science
system. Belief systems simplify everyday decision processes; people aggregate a multiplicity
of issues into a small number of considerations on which they can reasonably position
themselves (Converse, 1964).
After settling the model this way, we then tested measurement invariance to check if the
model measures the same model constructs and is stable across all EU countries.
Measurement invariance involves the degree to which the psychometric properties of the
observed indicators can be generalized across units and over time. This ensures that the latent

12
construct has the same correlative meaning across (EU) countries, allowing for cross-country
comparisons of their configuration. We first tested for configural invariance, that is the fit of
the same 2-factor structure is imposed on all countries (same factor structure in each country,
but factor loadings can vary). And fits indices are good (see table xxx). Then, we tested for
weak invariance, i.e. fixing the factor structure and the factor loadings. The fit measures are
not perfect but satisfactory (see table 2).
Table 2: CFA fit indices for measurement invariance
chisq df cfi rmsea tli
Configural invariance 1267.8 442 0.962 0.045 0.939
Weak invariance 1684.1 469 0.927 0.053 0.889
Bulgaria, Ireland and Romania are ‘Heywood cases’ (i.e. units with dubious fit as indicated by
negative estimates of variances or standardized regression coefficients > 1 in absolute value
for some of the variables), where the regression assumptions are violated with too few latent
variable indicators (Kolenikov & Bollen, 2012). While for some countries parametric
assumptions of linearity and multivariate normality are violated, the overall distribution of the
data is close to multivariate normal for the pooled data. Increasing the number of indicators
could improve this situation. Hence, we must interpret results for these countries with
Heywood cases cautiously. As we are working with secondary data, the design is not under
our control. But this suggests a consideration for future research: designs on attitude to
science need increase the number of items and pilot those items locally.
For a cultural analysis of subjective data, we seek out the relations between these two
dimensions Reserve and Promise, which gives us an idea about the organization of belief
space in different contexts. While checking for measurement invariance to ensure that the
‘same construct’ is being measured across different countries, we relaxed the orthogonality
assumption and allowed the correlation between the factors to vary to reflect the science
culture in different contexts.
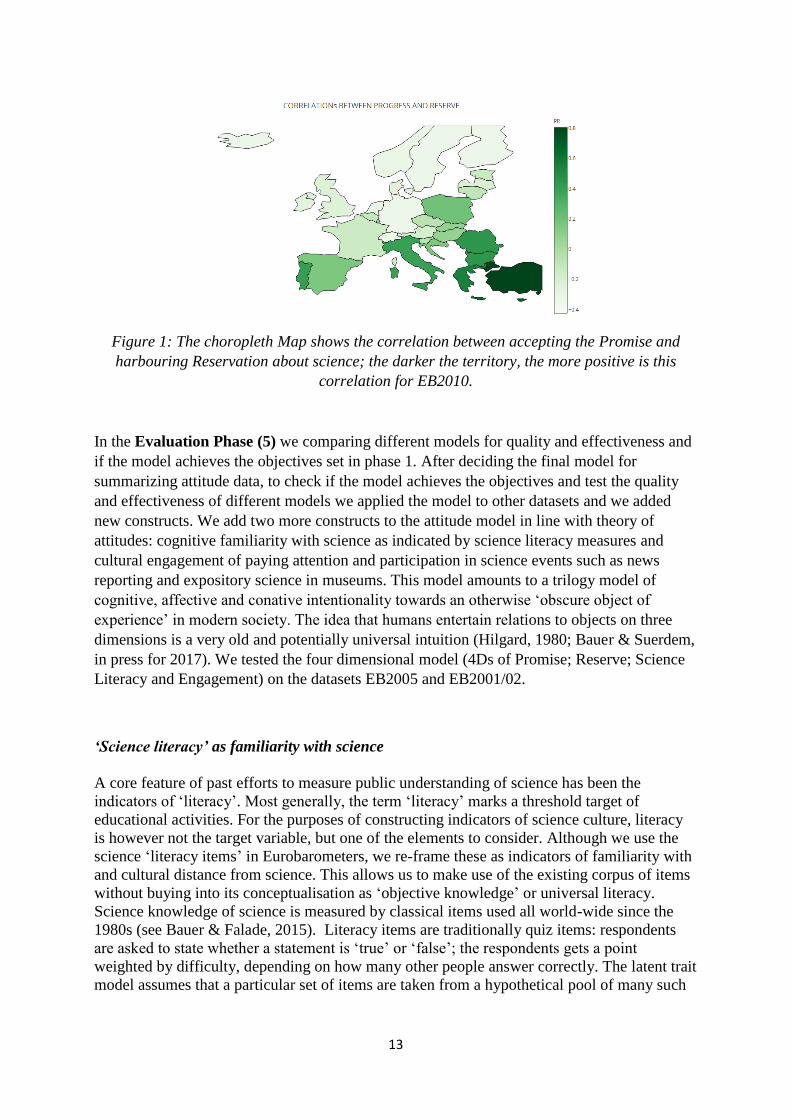
As we can observe from Choropleth map in figure 1, Turkey (and Bulgaria, Cyprus, Greece,
Portugal, Italy and Romania to a lesser degree) aligns Promise and Reserve, the utilitarian
come together with the critical dimensions: those who see much utility in science have also
much reservation; and those who do not see any utility in science have also few reservations.
One can have critical thoughts about science but this does not prevent the Turks from
accepting its utility. On the other hand, in Germany and Scandinavian countries Promise and
Reservation are negatively correlated: if one is critical of science one has few utilitarian or
instrumental expectations, and if one has high expectations of science, one is not critical of it.
In many other countries, there is no correlation between Promise and Reservation, as they are
independent criteria on which to evaluate science; scoring on one has not implications on
scoring on the other, all combinations are possible. We conclude that the way these two
dimensions stack up constitutes an important feature of the belief spaces across Europe, and to
evaluate science one needs two dimensions, a one-dimensional valence ‘good-bad’ does not
suffice for the evaluation of science. We will come back to this observation later.
13
Figure 1: The choropleth Map shows the correlation between accepting the Promise and
harbouring Reservation about science; the darker the territory, the more positive is this
correlation for EB2010.
In the Evaluation Phase (5) we comparing different models for quality and effectiveness and
if the model achieves the objectives set in phase 1. After deciding the final model for
summarizing attitude data, to check if the model achieves the objectives and test the quality
and effectiveness of different models we applied the model to other datasets and we added
new constructs. We add two more constructs to the attitude model in line with theory of
attitudes: cognitive familiarity with science as indicated by science literacy measures and
cultural engagement of paying attention and participation in science events such as news
reporting and expository science in museums. This model amounts to a trilogy model of
cognitive, affective and conative intentionality towards an otherwise ‘obscure object of
experience’ in modern society. The idea that humans entertain relations to objects on three
dimensions is a very old and potentially universal intuition (Hilgard, 1980; Bauer & Suerdem,
in press for 2017). We tested the four dimensional model (4Ds of Promise; Reserve; Science
Literacy and Engagement) on the datasets EB2005 and EB2001/02.
‘Science literacy’ as familiarity with science
A core feature of past efforts to measure public understanding of science has been the
indicators of ‘literacy’. Most generally, the term ‘literacy’ marks a threshold target of
educational activities. For the purposes of constructing indicators of science culture, literacy
is however not the target variable, but one of the elements to consider. Although we use the
science ‘literacy items’ in Eurobarometers, we re-frame these as indicators of familiarity with
and cultural distance from science. This allows us to make use of the existing corpus of items
without buying into its conceptualisation as ‘objective knowledge’ or universal literacy.
Science knowledge of science is measured by classical items used all world-wide since the
1980s (see Bauer & Falade, 2015). Literacy items are traditionally quiz items: respondents
are asked to state whether a statement is ‘true’ or ‘false’; the respondents gets a point
weighted by difficulty, depending on how many other people answer correctly. The latent trait
model assumes that a particular set of items are taken from a hypothetical pool of many such

14
items, which jointly indicate a latent construct ‘science literacy’. Items are not equally
difficult and thus not equally useful to discriminate the population on ‘science literacy’.
For testing the quality of the test and selecting the items for science literacy questions, we
relied on Item Response Theory (IRT). IRT is a method for assessing psychometric quality by
providing information about a scale’s items and of the entire scale. According to IRT, a
person’s response to an item is affected by the quality of the person and the item. IRT
provides us with two important indicators showing the quality of a test and its items:
difficulty and discrimination. An item’s difficulty shows the probability of responding in a
specific way to an item, positive values indicating more difficulty. An item’s discrimination
is the degree to which the item differentiates people with low levels of the underlying
construct from people with high levels. In a sense, it reflects the degree to which the item
reflects the underlying psychological construct; in this way, it is conceptually similar to an
item-total correlation or an item’s factor loading. Discrimination values usually range from
zero to 3.0 or more, with large values reflecting better psychometric quality.
According to our analysis, the results suggest that difficulties and discriminatory power of the
items is stable over the years, implying that the test has the quality to test science literacy.
Testing the psychometric qualities of 12 available quiz items in the data led us to select the six
items with the highest power of discrimination (see table 3). The six items are as follows:
Radioact: All radioactivity is man-made [false=correct]
Laser: Laser words by focusing soundwaves [false=correct]
Contin: The continents on which we live have been moving for millions of years and
will continue to move in the future [true=correct]
Radmilk: Radioactive milk can be made safe by boiling [false=correct]
Dinosaur: The earliest humans lived at the same time as the dinosaurs
[false=correct]
Antibio: antibiotics kills viruses as well as bacteria [false=correct]
Table 3: Item response theory IRT results for all literacy items; the first six are the ones
selected for the model
Diff2
difficulty discrim difficulty discrim
radioact 0.006 1.831 -0.209 1.888 0.046
laser 0.591 1.673 0.290 1.573 0.091
radmilk -0.532 1.330 -0.782 1.550 0.062
contin -1.221 1.353 -1.563 1.370 0.117
dinosaur -0.200 1.306 -0.500 1.362 0.090
antibio 0.706 1.214 0.265 1.319 0.195
suntime -0.447 1.135 -0.701 1.219 0.064
earth -1.669 1.249 -1.832 1.103 0.026
sexgene 0.733 0.307 -0.602 0.937 1.781
electron 0.419 0.916 0.358 0.806 0.004
evolution -0.839 0.525 -1.251 0.476 0.169
oxygen -3.004 0.533 -4.788 0.335 3.183
2001-2002 2005

15
Engagement with expository science
The fourth dimension of our model of cognitive, evaluative and conative relations with
science is ‘engagement’. Here we consider items that ask about people’s interest in new
scientific discoveries (very interested, moderately interested, or not at all), how much they
feel informed about new scientific discoveries and whether they have visited science and
nature in museums or zoos in the past 12 months. Being interested, informed and making
visits all point to science on display that require attention, an older term here is ‘expository
science’ (Shinn & Whitley, 1985). All three indicators combine well to form the indicator of
engagement, interest or attention to science; we call it ‘engagement’ from the point of view of
the public. There is a different meaning of ‘engagement’ in the activity of setting up
opportunities for public contacts and displays from the point of view of scientific actors,
which is a whole other data stream for indicators of science culture (Entradas & Bauer, 2016).
2.3 Measurement Invariance and Fit of a Parametrised 4D-Model of Science Culture
Having now refined our model to include four dimensions we test this model for weak
invariance across years and across countries to determine its parameters, i.e. fixed loadings
and varying correlations between constructs across countries. However, when testing this
model on EB 2005 data we encountered a small difficulty: attitude-evaluation items were split
into A and B versions. Hence we conducted our analysis separately on these two parts, by
matching the corresponding items to the relevant latent dimension of Promise and Reserve.
From split A, we retained for dimension Promise the items of ‘makes work more interesting’
and ‘more future opportunities’. For Reserve we retained ‘makes life change too fast’ and
‘scientists have power making them dangerous’. CFA fit measures for weak invariance are
satisfactory (see table 4), however, this model needs some caution for Greece, Cyprus, Spain,
France, Germany, N. Ireland, Bulgaria, Estonia, Latvia and Switzerland as they are Heywood
cases. For split B, we retained on Promise the items ‘more comfort and health’ and ‘allow
animal experiments’. For Reserve we retained ‘not enough faith’ and ‘S&T cannot improve
environment’. The weak invariance CFA modelling shows Heywood cases for Belgium, Italy,
Luxembourg, Austria, Bulgaria, Cyprus, Latvia, Malta, Slovakia and Slovenia. By examining
both version A and B, we finally created a synthetic model using either A or B, depending on
the quality of the data when considering the Heywood cases. Fit measures are good for both
splits. For 2001-2002 we find the four dimensional model with good overall fit. We retained
for Promise the items ‘welfare’, ‘work interesting’ and ‘opportunities’, but excluded animals
experiments to improve the fit. For Reserve we included ‘not enough faith’, ‘life change too
fast’ and ‘scientists are dangerous’. Again the overall fit is satisfactory.
Table 4: CFA fit indices for measurement invariance
chisq df cfi rmsea tli
2005 A 4447.5 2435 0.957 0.042 0.938
2005 B 4679.4 2435 0.954 0.043 0.931
2001/2 4394.9 2506 0.981 0.028 0.980

16
This overall procedure for developing the regional parameter model allows us to be flexible
with the choices of the exact items, while keeping the underlying dimensions as the
communality: Literacy, Promise, Reserve and Engagement. For each of the survey waves, the
linear combination is slightly different, both in the items included. Whether an item is
included or not depends on availability and on model fit. For each survey wave the item
weights are also slightly different reflecting the optimal fit to the latent dimension. Table 5
below shows the fixed weights for the regional parameter model, a linear combination of each
wave of survey. We assume that on a regional model with variable parameters we are
comparing functional equivalences, the basic indicators for our cultural analysis: Promise,
Reserve, Engagement and Literacy.
Promise P = a1P1 + …. akPk [k=3 or 4]
Reserve R = b1R1 + …. bkRk [k=3 or 4]
Engagement E = c1E1 + …. ckEk [k=3]
Knowledge K = d1K1 +…. dkKk [k=6]
Table 5: The regional fixed parameter model for Europe at different years
2001-2002 2005A 2005B 2010
Promise =~com 0.618 0.719 0.349
Promise=~opp 0.767 0.738 0.759
Promise=~interest 0.726 0.522 0.678
Promise=~mice 0.299 0.606
Reserve=~res_dang 0.476 0.318 0.390
Reseve=~fast 0.688 0.884 0.820
Reserve=~faith 0.583 0.412 0.525
Reserve=~envi 0.574
engage=~int 0.692 0.905 0.874
engage=~info 0.690 0.786 0.805
engage=~sci.muse 0.548 0.495 0.489
knowledge=~radmilk 0.612 0.639 0.640
knowledge=~radioact 0.730 0.723 0.720
knowledge=~laser 0.696 0.668 0.635
knowledge=~antibio 0.567 0.596 0.582
knowledge=~dinosaur 0.580 0.554 0.558
knowledge=~contin 0.530 0.537 0.530

17
3 Results: Characterising Four Science Cultures across EU32+
As we have tested the robustness of the model across countries and through time, we can
proceed with the cross-cultural comparison of the organization of the science culture space
across Europe. Taking a structural approach, we will concentrate on the correlations between
the constructs rather than the level differences. The structure of the correlation matrix reflects
the organization of the cross-cultural space of attitudes to science.
3.1 Clustering the EU32+ countries
We amalgamated matrices by averaging the 2001/02 and 2005 correlations and draw the
cluster from the average matrix. We assume that cultural structures do not change so fast, and
indeed when we compared the shifts between 2001/02 and 2005 correlation matrices, we
observed that squared differences across waves are very small (mean <.03; see appendix, table
A1). For the 2005 data, we combined the split data by taking into consideration the Heywood
cases. If a country was a Heywood case in any of the split, we opted for the value in the other
split.
This correlation matrix is our core rendered data; it gives us a raw idea but is too complex to
draw conclusions. We need to reduce the information in the correlation matrix by detecting
patterns to understand how science culture is mapped. Cluster analysis is a pattern detection
technique which groups objects (observations, cases) based on the information found in the
data describing the objects or their relationships. The goal is that the objects in a group will be
similar (or related) to one other and different from (or unrelated to) the objects in other
groups. The definition of what constitutes a cluster is imprecise, and the best definition
depends on the type of data and the desired results.
Cluster analysis is an exploratory technique and findings may change depending on the
method used. Two most common methods are Hierarchical and K-means. In hierarchical
clustering the goal is to produce a hierarchical series of nested clusters, ranging from clusters
of individual points at the bottom to an all-inclusive cluster at the top. A diagram called
‘dendrogram’ graphically represents this emerging hierarchy. Hierarchical techniques do not
assume any particular number of clusters. On the other hand, k-means classifies a given data
set through a pre-determined number of clusters a priori by defining k centroids, one for each
cluster and associating each point in the data to the nearest centroid. Hence, hierarchical
methods are commonly used for exploring and determining the number of clusters, k-means is
used for understanding the typical characteristics of the clusters. There are a variety of
hierarchical clustering methods, their use depending on the purpose and data. After
experimenting with different methods, we have decided on WARD’s method because other
methods tend to count outliers as clusters. Besides, it overlaps reasonably with k-means
clusters. Basically, WARD looks at cluster analysis as an analysis of variance problem as it
aims to minimize within cluster variance and maximize between clusters variance. This
method is most appropriate for quantitative variables, which is our case, and less so for binary
variables. Ward's Method has a tendency to split data into groups of roughly equal size. This
means that when the "natural" clusters differ much in size, then the big ones will be split in
smaller parts roughly equal in size to the smaller "natural" clusters. The advantage of
WARD's Method is that it doesn't leave any outliers. All data is grouped in bite size chunks,
which can be examined further quite easily.

18
When examining the patterns of correlations across countries, we examined various indices
for determining the optimal number of clusters: for WARD’s method, 7 indices proposed 4 as
the optimal number of clusters and for k-means 6 indices suggested 2 or 3 clusters (see
appendix, Figure A2). Silhouette analysis helps us to visually examine cluster membership; it
shows how far they are away from the neighbouring members in their clusters, and whether a
country is a core or a marginal member of the cluster (see appendix, Figure A3). After
checking for various options, we decided on a four cluster solution; both Ward’s and k-means
methods produce similar results. EU countries are thus mapped into one of four Science
Cultures as shown in figure 2 below in the form of a listing and profiles of overall and
relative correlation patterns.
The overall science culture model across Europe suggests little or no correlation between
Promise and Reserve and between Knowledge and Promise (r <0.10); positive correlations
between Interest and Promise, and between Knowledge and Interest (r >0.25); negative
correlations between Interest and Reserve and between Knowledge and Reserve (r < -0.20).
All clusters show the strongest relation between being interested in and being familiar with
science (r > 0.50). Our profile chart shows how each of the four groups deviates from the
average overall ‘standard’ profile in terms of z-values.
EU countries in the cluster Relationship to science
Cluster_1
(15)
BE, CH, DE-E, DE-W, DK, FI, FR, GB-GBN,
GB-NIR, EIRE, IS, IT, NL, NO, SE Either love it or hate it
[scientific literacy model]
Cluster_2
(4)
AT, BG, PT, RO Love it and worry, or be
indifferent and ignorant
Cluster_3
(3)
CY, GR, TR [most contrasting to C1] Love and hate, knowledge
makes little difference
Cluster_4
(12)
CZ, EE, ES, HR, HU, LT, LU, LV, MT, PL, SI, S
K [least constraint]
Anything goes: worries or
optimism or knowledge-interest
Figure 2: Listing the countries in the four clusters; the overall ‘standard’ profile of absolute
correlations (n=34), and profiling the clusters on z-values for PR, PE, RE, PK, RK, and EK
(see also appendix, figures A6 for absolute profiles).
19
In the following, we are characterising these four Science Cultures by giving them meaningful
names and by examining the meanings of the indicated correlations. The naming of these
cultures might deserve further work.
Cluster 1: Either you love or worry, but operate on the ‘scientific literacy model’
Cluster_1 is the largest group comprising 15 units, mainly Old Europe, and consistent with
the ‘deficit model’ of the more you know, the more you love it. Ireland, Finland, Britain,
Sweden, Belgium, France and Netherlands are the typical members in this group. Their
cluster profile shows accentuated negative correlations for PR, RE and RK. Those who
harbouring reservation, do not accept the promise of science (r = -0.27), are less interest in
science and tend to be less familiar with it. Those who harbour few reservations also accept its
promises and tend to be more familiar with science and also more interested. And those
familiar with science also show are certain indifference as they seem to take science rather for
granted in life. In these contexts, citizens are casting utilitarian judgements or they are
fundamentally critical. We recognise here the operation of the classical model of scientific
literacy on both sides: ‘the more you know it, the more you love it’ and ‘the more you know,
the less you worry’ (see Miller, 1983: being scientifically literate means being familiar and
interested in science, and showing positive appreciation), you either love it or hate it
depending on how familiar you. Familiarity with science comes with a moderate, but positive
correlation with accepting its utilitarian outcomes. This observation is often invoked to
remind observers of the empirically reality of a ‘deficit model’ of the public (Allum et al.,
2008). While our results are consistent with this argument, we also show that its validity is
specific to a subset of European countries.
Cluster 2: Love it and be worried; the more so, the more you know
Cluster_2 groups a small set of countries, namely Portugal, Rumania, Bulgaria and Austria,
where all correlations are accentuated compared to the rest, particularly high for those
involving knowledge and familiarity with science as in PE, PK, and EK. Basic knowledge of
science makes a difference here, and our all dimensions are highly constraint. But more
importantly, these four countries embody a love-hate relationship with science. Accepting
the promise and harbouring reservations about science go hand in hand (r=0.14). Being
interested in science and accepting its promise, being knowledgeable and accepting the
promise, and knowledge and interest are all highly correlated. Those who are familiar with
science are more likely to accept its promises, but they also hold more reservations. Those
who accept the promise of science also harbour more reservations. Here citizens both ‘love
and hate’ the sciences, and this in proportion to their interest and familiarity. Those who
have utility expectations also harbour reservation; those who have no utility expectation do
not think badly of science; they have rather no evaluation at all. These countries seem to be
internally polarised between those who are interested, familiar and opinionated and those who
are indifferent towards science.
Cluster 3: Love it and hate it, and knowledge does hardly matter

20
Cluster_3 comprises the three countries of Cyprus, Greece, and Turkey in the Eastern
Mediterranean of the old Levant. Here the pattern is the most dissimilar to Cluster_1, as they
display higher than expected correlations on PR, RE and RK. The key feature is here as in
Cluster_2 that reservation and accepting the promise is strongly correlated, and interest comes
with reservations, and knowledge discourages accepting the promise. Interest in science fuels
both reservations and accepting the promise, while more knowledge brings little endorsement
of its promises but much reservation. Those who know about science are more sceptical as to
its outcomes. Those who accept the promise, do so more likely from a position of being
unfamiliar with it. However, acceptance of the promise and reservations are strongly
correlated (r = 0.39), which suggests either the love-hate relationship with science or
otherwise being indifferent; this is the region of stark ambivalence towards science. In these
places, citizens love and hate science or otherwise they are indifferent, and lack of interest
means indifference and, contrary to cluster_2 knowledge has little impact on how people feel
as if cognition and judgement are unconnected. Maybe here still resonates the feeling
expressed by old Roman poet Catullus who, exiled to the Black Sea, is known for his clamour
of ‘Odi et amo .. nescio, sed fieri sentio…’ (I love and hate, I don’t know why, but I feel it
strongly …..). The passion is felt with or without a clear notion of the object.
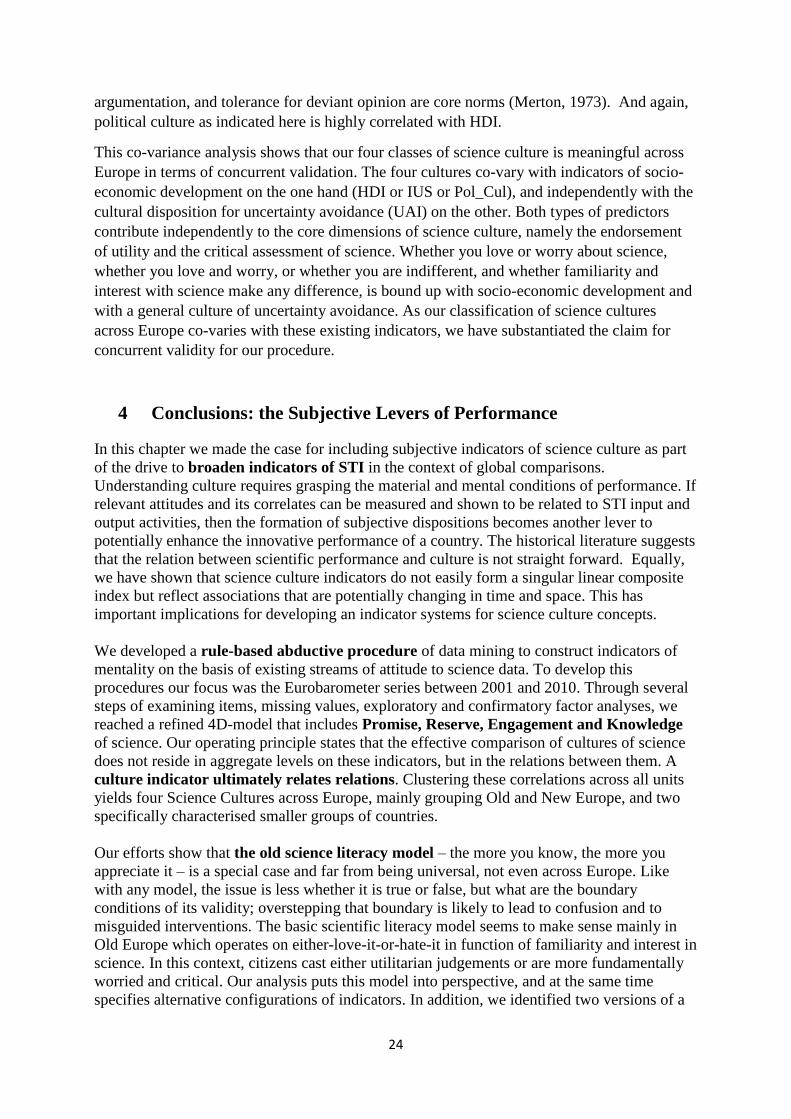
Figure 3: Choropleth Map of four Cultures of Science across Europe (EB2005) on the
dimension PR; component scores of four relational indicators produces a visualisation of 32+
European countries into a 2D Euclidean space.
R+ P+MR1 MR2
RE 0.96 -0.10
RK 0.94 0.09
PR 0.85 0.01
PE 0.12 0.79
PK -0.12 0.87
EK 0.07 0.56

21
Cluster 4: Anything goes: utilitarian or critical, knowledgeable or interested.
Cluster_4 groups again a larger set of countries, mainly New Europe of the former East, but
also including Spain, Malta, and Luxembourg. Czech Republic, Estonia and Croatia are the
prototypical members here. Their profile is overall similar to Cluster 1, but correlations are
regressing towards the mean on all dimensions; none of the dimensions of the model seem to
combine as elsewhere. Admittedly, interest in science comes with less reservations and more
acceptance of the promise; and familiarity brings acceptance of the welfare promise with less
reservation and vice-versa. But this is all a more mooted affair with less constraint than
elsewhere. The key contrast to Old Europe of cluster_1 is the no-correlation between
promise and reservations (r = 0.05) and between knowledge and promise in this group (r =
0.05): whether you accept the promise of science has little bearing on whether you also
harbour reservations or not; some love it and also hate it, some love it or worry, others are
entirely indifferent and neither love nor worry. Interest in science plays a role in this, but
does so less than elsewhere. The old literacy model only works one-sided: ‘the more you
know, the less you worry’ in New Europe. Overall, we are as likely to encounter there the
informed optimist and naïve pessimist as we find the naïve utilitarian and the informed
sceptic. It seems that citizens in the New Europe make good use of all four dimensions in
sorting out their relationship with science.
Mapping the countries on principal component weightings is another way of visualising the
cluster characteristics. When we reduce to two dimensions, we observe a first dimension
loading high on RP and RK; we call this Reserve R+. The second dimension shows high
loadings PE and PK; we call this Promise P+. The first component R+ points to an association
between being both critical and utilitarian and being scientifically literate when worrying or
not about science. The second component P+ refers to a pattern of being utilitarian and
engaged and being interested and familiar with science when accepting its promises, or being
unengaged, unfamiliar and without expectations. If we plot the principal component scores for
34 units on all six correlations into a two-dimensional space, we come to one visualisation of
the cultural space of science (see figure 3). Of all our relational indicators, PR has the largest
range (-.40 < r < .59) and this indicator orders all EU32+ countries on a gradient as shown in
the Choropleth map in figure 3.
3.2 Validating the four clusters of Science Culture
In the final Deployment Phase (6) of data mining we validated our four clusters with other
indicators of socio-economic and cultural affairs. People develop long-term socialized value
predispositions which they cultivate through institutions and cultural values. They acquire
basic beliefs and attitudes about science through formal and informal, primary and secondary
socialisation processes. While basic attitudes towards science are acquired through education
and family, the institutional environment of political culture and social values usually updates
this knowledge by focusing on specific topics in public controversies and debates (see
Brossard & Shanahan 2003; Brossard & Nisbet 2007 for such debates in the USA). In this
part of the study, we will investigate the relations of institutional and value variables and our
four European science cultures.

22
Figure 4 shows two indicators, The Human Development Index (HDI) and Hofstede’s
Uncertainty Avoidance Index (uai) which show significant co-variation with our four science
cultures. HDI differentiates Cluster_1 from all others; uai distinguishes Cluster_2 and
Cluster_3 from the others two.
Figure 4: Box Plots for Human Development Index (HDI; eta2=0.54) and Hofstede’s
uncertainty avoidance index (UAI; eta2=0.43) for four science cultures across Europe 32+.
The UN’s HDI is an index emphasizing the capabilities of the people for having a long and
healthy life, being knowledgeable and having a decent standard of living as criterion for level
of development of a country. It is widely reported and comprises indicators of life expectancy
at birth, adult basic literacy rates, gross school enrolment, and GDP per capita. We are using
data for 2003, close to our attitude data 2005. The HDI is an important policy indicator as it
helps us to detect human development outcomes controlling for per capita income and thus
contrast government policy priorities. (http://hdr.undp.org/en/content/human-development-
index-hdi). HDI is an important candidate to understand the shaping of science culture as it
includes information on schooling and life expectancy. Countries in cluster_1 tend to be
higher on HDI compared to the other three clusters (see figure 4; eta2 = 0.54); the difference
among those three clusters is not significant. Cluster 1 indeed groups most of Old Europe,
which is highly development in economic and human development.
Cultural dimensions are prominent in comparative psychology which maps society and
subsections of it into aggregate value profiles of individuals and shows how these values
relate to organisational-productive behaviour (Hofstede, 1997). The Uncertainty Avoidance
Index (UAI) represents one of several dimensions in this profile: individualism-collectivism;
uncertainty avoidance; power distance (i.e. strength of social hierarchy) and masculinity-
femininity (i.e. task orientation versus person-orientation). UAI reflects the extent to which a
typical person feels uncomfortable with experiencing uncertainty and ambiguity. High UAI
cultures maintain rigid mental codes and are intolerant towards unorthodox behaviour and
unusual, unconventional ideas. We consider tolerance of uncertainty, low UAI scores, to
indicate a disposition of openness for innovation. According to Merton (1973) organized
scepticism is one of the institutional norms that define the ethos of modern science.
Sometimes, expansion of scientific research may challenge established attitudes and values
and the authority of established institutions. Low UAI enables such scepticism as the
individuals tend to be more open and inclined to challenge traditional dogmas. UAI makes a
difference for the smaller clusters 2 and 3 as compared to clusters 1 and 4 (see figure 4; eta2 =

23
0.43). What we identified as the love-and-hate ambivalence cultures, the utility-and-critical
judgement of science is correlated with a tendency towards uncertainty avoidance and
intolerance. People feel the love-hate relationship and seem to suffer from it at the same time.
Further analyses of the data in these contexts might reveal a strong polarisation between
opinionated and indifferent publics; this is not something we can demonstrate here.
F2: Regressing dimension PR on various predictor combinations (beta values)
PR = a – 0.61*zHDI + 0.38*zUAI [adjR2 = 0.73; n=34]
PR = a – 0.59*zIUS + 0.36*zUAI [adjR2= 0.69; n=34]
PR = a – 0.52*zPol_Cul + 0.43*zUAI [adjR2 = 0.65; n=34]
If we consider only the correlation of our model with the largest variability, the relational
indicator PR, we find that the partial correlation with HDI is negative (r = -0.73) and with
UAI it is positive (r = 0.55; n=34) on a regression model. Other predictors are not making any
independent contribution due to multi-collinearity; they are strongly correlated to HDI, but
their individual contribution can be compared as in F2 below, which shows that HDI and UAI
are indeed the best predictors of promise and worry correlations.
We also examined the European Innovation Union index (IUS) and an index of political
culture (Pol_Cul) in relation to our four science cultures (see appendix, figure A7). The
pattern is similar to that of HDI: they distinguish cluster_1 from all other cultures of science.
Innovation Union Scoreboard (IUS) is a measure of innovation performance in EU Member
States, other European countries, and regional neighbours. It assesses the relative strengths
and weaknesses of innovation systems and helps countries identify areas they could address to
improve innovation performance (http://ec.europa.eu/growth/industry/innovation/facts-
figures/scoreboards/). Innovation must be related to people’s attitudes toward science.
Attitudes signal an environment of mentality that supports innovative activities in general and
mostly likely also the investment in research and development (R&D). However, this impact
is not very specific as yet as IUS and HDI are highly correlated for our 32+ countries. One
might consider moving outlier countries Italy and Norway to cluster_4, and Luxembourg to
cluster_1 to increase the fit on this criterion.
The democracy Indicators are compiled by the Economist Intelligence Unit and Freedom
House measuring the state of democracy in 167 countries. The index is based on 60 indicators
grouped in five different categories including pluralism, civil liberties, and political
culture. Political culture (Pol_Cul) measures the level of anomie and the strength of
democratic practice and is an indicator of the sustainability of democracy. Passivity and
apathy, an obedient and docile citizenry do not go together with a democratic political culture
(see http://graphics.eiu.com/PDF/ Democracy%20Index%202008.pdf). Political culture refers
to the process by which values are mobilised, made explicit and brought into public decision-
making (Purcel et al. 2000). Complexity of scientific issues should not impede citizens from
expressing their voice on moral concerns, questions of equity and access, and transparency
and procedures in decision making. Therefore, people’s attitudes towards science maybe
related to a democratic political culture; we would assume that a wider culture of science
reflects elements of the ‘republic of science’ where freedom of expression and evidence-based
24
argumentation, and tolerance for deviant opinion are core norms (Merton, 1973). And again,
political culture as indicated here is highly correlated with HDI.
This co-variance analysis shows that our four classes of science culture is meaningful across
Europe in terms of concurrent validation. The four cultures co-vary with indicators of socio-
economic development on the one hand (HDI or IUS or Pol_Cul), and independently with the
cultural disposition for uncertainty avoidance (UAI) on the other. Both types of predictors
contribute independently to the core dimensions of science culture, namely the endorsement
of utility and the critical assessment of science. Whether you love or worry about science,
whether you love and worry, or whether you are indifferent, and whether familiarity and
interest with science make any difference, is bound up with socio-economic development and
with a general culture of uncertainty avoidance. As our classification of science cultures
across Europe co-varies with these existing indicators, we have substantiated the claim for
concurrent validity for our procedure.
4 Conclusions: the Subjective Levers of Performance
In this chapter we made the case for including subjective indicators of science culture as part
of the drive to broaden indicators of STI in the context of global comparisons.
Understanding culture requires grasping the material and mental conditions of performance. If
relevant attitudes and its correlates can be measured and shown to be related to STI input and
output activities, then the formation of subjective dispositions becomes another lever to
potentially enhance the innovative performance of a country. The historical literature suggests
that the relation between scientific performance and culture is not straight forward. Equally,
we have shown that science culture indicators do not easily form a singular linear composite
index but reflect associations that are potentially changing in time and space. This has
important implications for developing an indicator systems for science culture concepts.
We developed a rule-based abductive procedure of data mining to construct indicators of
mentality on the basis of existing streams of attitude to science data. To develop this
procedures our focus was the Eurobarometer series between 2001 and 2010. Through several
steps of examining items, missing values, exploratory and confirmatory factor analyses, we
reached a refined 4D-model that includes Promise, Reserve, Engagement and Knowledge
of science. Our operating principle states that the effective comparison of cultures of science
does not reside in aggregate levels on these indicators, but in the relations between them. A
culture indicator ultimately relates relations. Clustering these correlations across all units
yields four Science Cultures across Europe, mainly grouping Old and New Europe, and two
specifically characterised smaller groups of countries.
Our efforts show that the old science literacy model – the more you know, the more you
appreciate it – is a special case and far from being universal, not even across Europe. Like
with any model, the issue is less whether it is true or false, but what are the boundary
conditions of its validity; overstepping that boundary is likely to lead to confusion and to
misguided interventions. The basic scientific literacy model seems to make sense mainly in
Old Europe which operates on either-love-it-or-hate-it in function of familiarity and interest in
science. In this context, citizens cast either utilitarian judgements or are more fundamentally
worried and critical. Our analysis puts this model into perspective, and at the same time
specifies alternative configurations of indicators. In addition, we identified two versions of a

25
culture of science where an ambivalent love-hate relationship (odi et amo …) is the
characteristic feature. In one type of these, knowledge drives acceptance of the promise of
science and at the same time the harbouring of reservations. In the other type, knowledge is
much less of a driver; judgements seem to be ambivalent sui-generis. Finally, we identified a
fourth culture, mainly but not exclusively in New Europe, where the literacy model is evident,
but flat and less constraint, tending towards anything goes. Worries or optimism about
science combine freely with familiarity and interest, ignorance and indifference; the anything
goes mentality seems to be the prevailing mentality, where all four dimensions of our model
are independently used to position oneself vis-à-vis science.
Validating this four-fold classification of cultures of science shows that the UN’s HDI and
Hofstede’s uncertainty avoidance index are independent correlates of this diversity. HDI
separates the ‘literacy type’ from all other types, while uncertainty avoidance is a
characteristic of the ‘love-hate’ type in contrast to either-love-it-or-hate-it or anything goes.
The difference between the constraint literacy model of Old Europe and the weaker ‘anything
goes’ model of New Europe could be a additional third gradient on cultural ‘Masculinity’
(according to Hofstede), however, this correlation needs further examination.
We have undertaken this exploration of science cultures with European data, and in the effort
we developed a model of regionally fixed parameters to capture the diversity-in-unity of
science. This reflects our starting point that science is a global affair, but science culture
remains bound by morality and local common sense. Future work within our immediate reach
will extend these analytic procedures to data curated on the Indian subcontinent, in mainland
China and across North and Latin America (project MACAS http://www.macas-
project.com/). Guidelines for an indicator system of science culture need to define, beyond the
collection of data through questionnaires and representative sampling designs, also the
analytic procedure for detecting science cultures on the operating principles of ‘relating
relations’ and ‘diversity-in-communality’. We see two immediate implications of this
argument. First, it will help policy makers to understand better the contextual features of
science cultures between and within their country, and help them to concentrate on targeted
policy rather than assuming a one-dimensional and universal policy space called ‘scientific
literacy’. Culture indicators will enhance the fine-tuning of interventions beyond any self-
defeating logic of ‘one shoe fits all’. Subjective science culture is most likely a ‘mediator’
between input and output of innovation. Future work will have to concentrate on an input-
output mediator models to guide policy intervention. Secondly, the explicit statement of our
analytic operating principle of ‘relating relations’ and ‘diversity-in-communality’ will avoid
the difficulties which have hampered earlier attempts to globalise indicators of science
culture. Previous attempts to ‘globalise’ a local, mainly US-EU model through premature
standardisation have over the past 30 years created much resistance and difficulties for
collaborations in collecting and analysing data on attitudes to science. A culturally
circumspect and context sensitive approach is required for making progress in understanding
the innovation process.
This study is a good beginning but has limits in so far as we have not yet concentrated our
efforts on the analysis of mediating model between ‘hard’ traditional STI performance
indicators and ‘soft’ cultural indicators of attitudes. Future studies will have to focus on the
associations between these different classes of indicators to examine and explain the
differences in contexts. Work on this complex task remains piecemeal and unfinished, but
with large amounts of data at hand, and the right approach in mind, we might well have real
progress within reach.

26
5 References
Aibar E and MA Quintanilla (2002) Cultura Tecnologica. Estudios de ciencia, tecnologia y
sociedad, Barcelona: Editorial Horsoi, ICE Universidad de Barcelona.
Allum, N, P Sturgis, D Tabourazi and I Brunton-Smith (2008) Scientific knowledge and
attitudes across cultures: a meta-analysis, Public Understanding of Science, 17, 38-54.
Bauer MW and A Suerdem (in press for 2017) The trilogy model of attitudes to science, in:
Bauer MW, P Pansegrau & R Shukla (eds) Mapping the Cultural Authority of Science,
London, Routledge Studies on Science, Technology and Society.
Bauer MW (2015a) Atoms, Bytes & Genes - Public Resistance and Techno-Scientific
Responses, New York, Routledge [Routledge Advances in Sociology 126]
Bauer MW (2015b) Making Science is Global, Science Culture Remains Local, Journal of
Scientific Temper, 3, 1/2, 44-55 [Delhi, ISSN: 2278-2788 / 2278-2796]
Bauer MW and B Falade (2014) Public understanding of science: survey research around the
world, in: M Bucchi and B Trench (eds) Routledge Handbook of Public Communication of
Science and Technology, 2nd edition, NY, Routledge, pp140-159
Bauer MW and S Howard (2013) The Culture of Science in Modern Spain: An Analysis
across Time, Age Cohorts and Regions. Bilbao: Fundación BBVA
Bauer MW (2012) Science culture and its indicators, in: Schiele B, M Claessens, S Shi (eds)
Science communication in the world – practices, theories and trends, Dordrecht, Springer,
295-211 [translated as ‘cultura cientifica y sus indicators – una revision actualizada, in: JA
Lopez Cereza & Belem Lapra (2014) (eds) Cultura cientifica y innovacion
Bauer, MW, R Shukla and N Allum (2012) The Culture of Science – How the Public Relates
to Science across the Globe. New York, Routledge – Vol 15 Routledge Science, Technology
& Society Series. [ISBN13: 978-0-415-87369-7 HB / ISBN13: 978-0-203-81362-1 ePB]
Bloch M (1948) Les transformation des technique comme problem de psychologie collective,
Journal de Psychologie, 41, 104-119.
Brossard, D.& Nisbet, M. C. 2007. Deference to scientific authority among a low information
public: Understanding U.S. opinion on agricultural biotechnology. International Journal of
Public Opinion Research, 19, 24–52.
Brossard, D.&Shanahan, J. 2003. Do citizens want to have their say? Media, agricultural
biotechnology, and authoritarian views of democratic processes in science. Mass
Communication and Society, 6, 291–312.
Brumann C (1999) Writing for culture – why a successful concept should not be discarded,
Current Anthropology, 40, Supplment, Feb, S1-S27.

27
Cameron R (1997) A concise economic history of the world – from paleolithic times to the
present, Oxford, OUP.
Cohen, HF (1994) The scientific revolution – a historiographical inquiry, Chicago, CUP.
Converse PE (2006) The nature of belief systems in mass publics (1964), Critical Review,
18:1-3, 1-74.
Crettaz (in press for 2017) Attitudes to science in the World Value Survey – the longitudinal
evidence, in: Bauer MW, P Pansegrau & R Shukla (eds) Mapping the Cultural Authority of
Science, London, Routledge Studies on Science, Technology and Society.
Entradas M & MW Bauer (2016) Mobilisation for Public Engagement: Benchmarking the
Practices of Research Institutes, Public Understanding of Science, [March, DOI:
10.1177/0963662516633834]
Granovetter, M. (1985). Economic Action and Social Structure: The Problem of
Embeddedness. American Journal of Sociology, 91(3), 481-510.
Godin B (2005) Measurement and Statistics of Science and Technology – 1020 to the present,
London, Routledge.
Harman GH (1965) The Inference to the Best Explanation, The Philosophical Review, 74(1):
88–95.
Hilgard ER (1980) The trilogy of mind: cognition, affection and conation, Journal of the
History of the Behavioural Sciences, 16, 107-117.
Hofstede G (1997) Cultures and organizations: Software of the mind, New York, McGraw
Hill
Horkheimer, M (1947) Eclipse of Reason, Oxford, Oxford University Press
Horkheimer, M & Adorno, TW (2002) Collected works, Stanford, Stanford Press
Kaldor N(1957) A Model of Economic Growth, Economic Journal,
Kolenikov S & Bollen KA, (2012), Testing negative error variances: Is Heywood case a
symptom of misspecification? Sociological Methods & Research, 41(1), 124-167
Larose, DT and CD Larose (2014) Discovering Knowledge in Data: An Introduction to Data
Mining, Hoboken, New Jersey, John Wiley and Sons, Inc.
Merton, RK. (1973) [1942] The Normative Structure of Science, in The Sociology of Science:
Theoretical and Empirical Investigations, Chicago: University of Chicago Press,
Miller JD (1983) Scientific Literacy: a conceptual and empirical review, Daedalus, 112, 2, 29-
48.

28
Miller JD and R Pardo (2000) Civic scientific literacy and attitudes to science and
technology: a comparative analysis of the EU, US, Japan and Canada, in: Dierkes M and C
vonGrote (eds) Between Understanding and Trust – The Public, Science and Technology,
Amsterdam, Harwood Academic Publishers, pp81-130.
Osgood CE, G Suci and P Tannenbaum (1957) The measurement of meaning, Urbana Ill,
Urbana University Press.
Quintanilla MA (2012) Technology, Culture and Innovation, in: Enciclopedia Iberoamericana
de Filosofia, Ciencia, Tecnologia y Socidad, Madrid, Trotta.
Polanyi K (1944) The Great Transformation, New York, Holt, Rinehart
Purcell, K., Clarke, L. & Renzulli, L. (2000) Menus of choice: the social embeddedness of
decisions. In MJ. Cohen (Ed.), Risk in the modern age - Social Theory, Science and
Environmental Decision-Making, London, Palgrave/Macmillan, pp62-79.
R Development Core Team (2008). R: A language and environment for statistical computing.
R Foundation for Statistical Computing, Vienna, Austria. ISBN 3-900051-07-0, URL
http://www.R-project.org.
Reichertz J (2004) Abduction, Deduction and Induction in Qualitative Research, in: Flick U,
E von Kardorff and I Steinke (eds) A Companion to Qualitative Research, eds, London, Sage,
pp 159-165.
Rokeach, M (1975), The Nature of Human Values, New York, The Free Press
Rosenberg N and LE Birdzell (1986) How the West grew rich – the economic transformation
of the industrial world, NY, Basic Books.
Revelle, W. (2016) psych: Procedures for Personality and Psychological Research,
Northwestern University, Evanston, Illinois, USA, http://CRAN.R-project.org/package
=psych Version = 1.6.6.
Rosseel Y (2012). lavaan: An R Package for Structural Equation Modeling. Journal of
Statistical Software, 48(2), 1-36. URL http://www.jstatsoft.org/v48/i02/
Shinn T and R Whitley (1985) (eds) Expository science: forms and functions of
popularisation, Dordrecht, Reidel.
Stimson JA (2012) On the meaning and measurement of mood, Daedalus, 141, 4, 23-34.
Taylor C (2004) The Secular Age, Cambridge MA, Belknap Press.
Toderov, Petkova and Bauer (2009) In search of the universal dimensions of public
perceptions of science, Science, Technology and Society, 14, 2, 331-347.
Wagner W, K Hansen and N Kronberger (2014) Quantitative and Qualitative Research across
Cultures and Languages: Cultural Metrics and their Application, Integr Psych Behav, DOI
10.1007/s12124-014-9269-z

29
Wilkinson & American Psychological Association Science Directorate Task Force on
Statistical Inference, 1999, p. 598
Young H Peyton (2009) Innovation diffusion in heterogeneous populations: contagion, social
influence and social learning, American Economic Review, 99, 5, 1899-1924.

30
Appendices
Figure A1: ratios of missing values for different evaluation-attitude items in EB2010
Figure A2: Spinogram: sex, education, age, interest in science (EB 2010)

31
Minimum residuals Principal components
Omega ICluster
Figure A3: different structural solutions for evaluation-attitude items (data EB 2010)

32
Table A1: the correlation matrix among basic indicators for each country 2001/02 and 2005
Figure A4: Optimal cluster numbers
PR PE RE PK RK EK PR PE RE PK RK EK PR PE RE PK RK EK Average
AT 0.05 0.34 -0.33 0.28 -0.19 0.83 -0.01 0.47 -0.14 0.22 -0.22 0.41 0.02 0.04 0.17 0.04
BE -0.22 0.68 -0.25 0.29 -0.43 0.70 -0.17 0.29 -0.20 0.05 -0.39 0.42 0.15 0.06 0.07 0.05
BG 0.13 0.38 0.06 0.13 -0.08 0.78 0.47 0.48 0.13 0.34 0.10 0.74 0.11 0.01 0.01 0.04 0.03 0.03
CH -0.24 0.32 -0.25 0.05 -0.24 0.39
CY 0.18 0.09 0.00 -0.06 -0.06 0.73 0.52 0.26 0.23 -0.12 0.12 0.53 0.11 0.03 0.05 0.03 0.04 0.05
CZ 0.22 0.29 -0.11 0.21 -0.35 0.38 0.05 0.22 -0.05 0.10 -0.21 0.41 0.03 0.01 0.02 0.01
DE-E -0.01 0.10 -0.35 0.04 -0.34 0.63 -0.09 0.53 -0.18 0.14 -0.35 0.43 0.01 0.19 0.03 0.01 0.04 0.05
DE-W -0.30 0.27 -0.20 0.13 -0.35 0.74 -0.15 0.39 -0.23 0.16 -0.37 0.61 0.02 0.01 0.02 0.01
DK -0.44 0.27 -0.91 0.02 -0.75 0.77 -0.28 0.17 -0.37 0.10 -0.44 0.55 0.03 0.01 0.29 0.01 0.1 0.05 0.08
EE -0.08 0.19 -0.14 0.02 -0.33 0.45 -0.02 0.10 -0.15 -0.03 -0.18 0.49 0.01 0.02 0.01
ES 0.26 0.42 0.02 0.15 -0.25 0.56 0.23 0.29 -0.07 0.13 -0.14 0.48 0.02 0.01 0.01 0.01 0.01
FI -0.20 0.40 -0.42 0.29 -0.47 0.81 -0.24 0.30 -0.35 0.10 -0.37 0.53 0.01 0.04 0.01 0.08 0.02
FR -0.33 0.49 -0.34 0.17 -0.45 0.66 -0.17 0.22 -0.18 -0.06 -0.39 0.50 0.03 0.07 0.03 0.05 0 0.03 0.03
GB-GBN -0.44 0.32 -0.59 0.13 -0.58 0.90 -0.17 0.19 -0.23 -0.06 -0.38 0.49 0.07 0.02 0.13 0.04 0.04 0.17 0.08
GB-NIR -0.11 0.55 -0.59 0.43 -0.56 0.92 -0.10 0.30 -0.30 0.14 -0.35 0.55 0.06 0.08 0.09 0.04 0.14 0.07
GR 0.38 0.20 0.07 -0.14 -0.05 0.46 0.43 0.23 0.15 -0.05 -0.02 0.50 0.01 0.01 0.00
HR 0.29 0.38 -0.05 -0.02 -0.23 0.65
HU 0.05 0.16 -0.25 0.01 -0.52 0.77 0.16 0.22 -0.12 0.07 -0.19 0.66 0.01 0.02 0.1 0.01 0.03
IE -0.21 0.41 -0.57 0.00 -0.51 0.73 -0.29 0.32 -0.29 0.13 -0.40 0.52 0.01 0.01 0.07 0.02 0.01 0.04 0.03
IS -0.22 0.25 -0.12 0.06 -0.33 0.41
IT -0.03 0.31 -0.44 -0.06 -0.59 0.72 0.21 0.26 -0.17 0.10 -0.32 0.55 0.06 0.08 0.03 0.07 0.03 0.04
LT -0.04 0.19 -0.34 0.06 -0.45 0.50 0.06 0.20 -0.18 0.16 -0.20 0.43 0.01 0.03 0.01 0.06 0.02
LU -0.03 0.14 -0.50 -0.02 -0.55 0.61 0.17 0.23 -0.25 -0.10 -0.49 0.37 0.04 0.01 0.06 0.01 0.06 0.03
LV 0.05 0.23 0.01 0.04 -0.21 0.43 0.35 0.13 -0.01 -0.01 -0.20 0.32 0.09 0.01 0.01 0.02
MT 0.01 0.09 -0.32 -0.09 -0.41 0.59 0.18 0.18 0.00 -0.04 -0.11 0.73 0.03 0.01 0.1 0.08 0.02 0.04
NL -0.36 0.27 -0.45 0.08 -0.46 0.76 -0.15 0.23 -0.35 0.10 -0.50 0.51 0.04 0.01 0.06 0.02
NO -0.20 0.17 -0.25 0.04 -0.30 0.42
PL 0.12 0.21 -0.17 0.02 -0.34 0.48 0.21 0.16 -0.17 0.16 -0.19 0.56 0.01 0.02 0.02 0.01 0.01
PT 0.19 0.34 -0.22 0.08 -0.21 0.72 0.16 0.52 -0.08 0.31 -0.14 0.70 0.03 0.02 0.05 0.01 0.02
RO 0.07 0.15 -0.19 0.07 -0.35 0.76 0.28 0.60 0.01 0.39 -0.15 0.75 0.04 0.2 0.04 0.1 0.04 0.07
SE -0.34 0.24 -0.53 0.02 -0.49 0.65 -0.31 0.25 -0.29 0.04 -0.32 0.47 0.05 0.03 0.03 0.02
SI -0.13 0.18 -0.15 -0.14 -0.42 0.62 -0.08 0.22 -0.06 -0.13 -0.40 0.25 0.01 0.13 0.02
SK 0.25 0.43 0.01 0.09 -0.27 0.53 0.30 0.27 0.03 0.12 -0.10 0.46 0.03 0.03 0.01 0.01
TR 0.29 0.08 -0.01 -0.14 -0.16 0.32 0.80 0.35 0.16 -0.14 -0.14 0.49 0.26 0.07 0.03 0.03 0.06
Total -0.03 0.28 -0.27 0.07 -0.37 0.65 0.06 0.29 -0.13 0.07 -0.25 0.51 0.03 0.03 0.04 0.02 0.03 0.04 0.03
2001/02 2005 Squared differences

33
Figure A5: two overlapping cluster solutions: silhouette plots of hierarchical analysis on the
left, k-means analysis on the right
Figure A6: Correlation profiles between the four dimensions on each cluster which underlie
the z-value profiles reported in Figure 2 in the text.

34
Figure A7: Box plots for European Union Innovation Scoreboard (IUS) and Freedom House-
Economist Political Culture index (Pol_Cul) for the four culture of science. The pattern is the
same as with HDI. HDI, IUS and Pol_Cul are highly correlated.
Related Documents
![OECD Reviews of Innovation Policy and …...Source: OECD (2010), Measuring Innovation: A New Perspective, OECD, Paris, based on COINVEST [], national estimates by researchers, EU KLEMS](https://static.cupdf.com/doc/110x72/5f33212c23005118ad24e3e7/oecd-reviews-of-innovation-policy-and-source-oecd-2010-measuring-innovation.jpg)