1 SNA/M1.05/06 UPDATE OF THE 1993 SNA – ISSUE No. 23 ISSUE PAPER FOR THE MEETING OF THE AEG, JULY 2005 OBSOLESCENCE AND DEPRECIATION EXECUTIVE SUMMARY Nadim Ahmad, Charles Aspden and Paul Schreyer, OECD Introduction 1. The major accomplishment of the first incarnation of the Canberra Group was the production of the OECD manual Measuring Capital (2001). In the course of its work the Group identified several issues that needed further discussion and research effort. One of them was the treatment of obsolescence and depreciation (i.e. consumption of fixed capital), which although subject to lively debate, was not settled. The lively debate has continued within the Canberra II Group, but it still has not been settled to the satisfaction of all and nor is it likely to be in the near future. 2. Essentially, there are two sides to the debate. Paradoxically, both sides believe that the SNA is correct and does not require substantive change. The point of contention is the interpretation of what the 1993 SNA has to say about the measurement of depreciation. The key paragraph is 10.118 Consumption of fixed capital constitutes a negative change in the value of the fixed assets used for production. It covers both tangible fixed assets and intangible fixed assets, such as mineral exploration costs and software. Consumption of fixed capital must be measured with reference to a given set of prices, i.e. the average prices of the period. It may then be defined as the decline, between the beginning and the end of the accounting period, in the value of the fixed assets owned by an enterprise, as a result of their physical deterioration and normal rates of obsolescence and accidental damage. The value of a fixed asset depends upon the benefits that can be expected from using it in production over the remainder of its service life. This value is given by the present discounted value, calculated at the average prices of the period, of the stream of rentals that the owner of a fixed asset could expect to receive if it were rented out to producers over the remainder of its service life. Consumption of fixed capital is then measured by the proportionate decline in this value between the beginning and end of the accounting period. 3. Put simply, the bone of contention is the interpretation of “average prices of the period”. Ahmad, Aspden and Schreyer have argued that it should be with respect to a constant-quality price index of the asset concerned. This view is also the one advocated in OECD’s Measuring Capital and is the one underpinning the estimation of depreciation by many OECD member countries. It implies valuing the flow of depreciation at average replacement costs of the current period. Hill and Diewert have argued that depreciation should be valued with respect to a general price index as long as the latter rises faster than the constant-quality price index of the asset concerned. Thus, depreciation should reflect (expected) real holding losses of assets. Each side has written long and sometimes complex papers to support their point of view. The conclusions of the latest paper in the series, by Ahmad, Aspden and Schreyer (attached), were broadly supported by Canberra II members. 4. The attached paper has been the subject of detailed criticism from Robin Lynch, who is a both a member of the Canberra II Group and the AEG, although he agrees with the conclusions of the authors. His criticisms can be summed up as saying the paper is overly complex and hard to follow. The authors

Welcome message from author
This document is posted to help you gain knowledge. Please leave a comment to let me know what you think about it! Share it to your friends and learn new things together.
Transcript
1
SNA/M1.05/06 UPDATE OF THE 1993 SNA – ISSUE No. 23 ISSUE PAPER FOR THE MEETING OF THE AEG, JULY 2005
OBSOLESCENCE AND DEPRECIATION
EXECUTIVE SUMMARY
Nadim Ahmad, Charles Aspden and Paul Schreyer, OECD Introduction 1. The major accomplishment of the first incarnation of the Canberra Group was the production of the OECD manual Measuring Capital (2001). In the course of its work the Group identified several issues that needed further discussion and research effort. One of them was the treatment of obsolescence and depreciation (i.e. consumption of fixed capital), which although subject to lively debate, was not settled. The lively debate has continued within the Canberra II Group, but it still has not been settled to the satisfaction of all and nor is it likely to be in the near future. 2. Essentially, there are two sides to the debate. Paradoxically, both sides believe that the SNA is correct and does not require substantive change. The point of contention is the interpretation of what the 1993 SNA has to say about the measurement of depreciation. The key paragraph is 10.118
Consumption of fixed capital constitutes a negative change in the value of the fixed assets used for production. It covers both tangible fixed assets and intangible fixed assets, such as mineral exploration costs and software. Consumption of fixed capital must be measured with reference to a given set of prices, i.e. the average prices of the period. It may then be defined as the decline, between the beginning and the end of the accounting period, in the value of the fixed assets owned by an enterprise, as a result of their physical deterioration and normal rates of obsolescence and accidental damage. The value of a fixed asset depends upon the benefits that can be expected from using it in production over the remainder of its service life. This value is given by the present discounted value, calculated at the average prices of the period, of the stream of rentals that the owner of a fixed asset could expect to receive if it were rented out to producers over the remainder of its service life. Consumption of fixed capital is then measured by the proportionate decline in this value between the beginning and end of the accounting period.
3. Put simply, the bone of contention is the interpretation of “average prices of the period”. Ahmad, Aspden and Schreyer have argued that it should be with respect to a constant-quality price index of the asset concerned. This view is also the one advocated in OECD’s Measuring Capital and is the one underpinning the estimation of depreciation by many OECD member countries. It implies valuing the flow of depreciation at average replacement costs of the current period. Hill and Diewert have argued that depreciation should be valued with respect to a general price index as long as the latter rises faster than the constant-quality price index of the asset concerned. Thus, depreciation should reflect (expected) real holding losses of assets. Each side has written long and sometimes complex papers to support their point of view. The conclusions of the latest paper in the series, by Ahmad, Aspden and Schreyer (attached), were broadly supported by Canberra II members. 4. The attached paper has been the subject of detailed criticism from Robin Lynch, who is a both a member of the Canberra II Group and the AEG, although he agrees with the conclusions of the authors. His criticisms can be summed up as saying the paper is overly complex and hard to follow. The authors
2
accept this criticism and believe it reflects the complexity of the subject and the history of the debate. The authors believe that to really satisfy Robin’s criticisms would require a completely new paper and there is insufficient time to do this well. The authors propose that such a text should be incorporated in the planned revision of the OECD’s Measuring Capital. In the interim, the authors have written a longer than normal executive summary that presents the essential arguments, and which it is hoped will prove sufficient for AEG members to be able to make an informed decision without referring to the main paper. But the paper is there for those who wish to delve more deeply into the subject. More about the issue 5. The value of an asset – its market price – changes between the beginning and the end of the accounting period. This price change is due to several factors:
a) Wear and tear or deterioration: the asset has aged and its productive efficiency has declined
b) Exhaustion: even if the asset has lost nothing of its productive capacity during the accounting period, it has moved one year closer to retirement. Thus, there is a smaller bundle of exploitable future capital services left in the asset
c) Foreseen obsolescence
d) Other changes that bear on supply and demand for the asset and that may change its relative price during the accounting period
e) Changes in the overall price level.
6. There is broad agreement among national accountants that depreciation should capture price changes due to (a), (b) and (c). There is also agreement that depreciation in the national accounts should not reflect changes in the overall price level. Consequently, the effects of (e) have to be removed when asset values at the beginning and at the end of each period are compared to measure depreciation for the period. 7. There are, however, different views on how the effects of (c) should be measured, which also impinge on (d), i.e., with the treatment of foreseen obsolescence and factors affecting real holding gains and losses of the asset during the accounting period:
• One view, advocated in particular by Hill (2005) and also proposed by Diewert (2003), is that foreseen obsolescence should be equated with ANY expected real holding loss. Hill proposes that depreciation be conceived as the change in price of an asset over a period excluding general inflation, as well as any real holding gains or unexpected real holding losses.
• An alternative view, described in attached paper by Ahmad, Aspden and Schreyer, is that no real
holding gains and losses should be part of depreciation. Hence, they propose that depreciation be conceived as the change in price of an asset over a period excluding price changes due to general inflation and price changes due to supply and demand factors peculiar to the asset type, other than those due to obsolescence (i.e. excluding (d) and (e)). This view is consistent with current practice in national accounts of OECD countries.
8. Which of the two measures of depreciation should be chosen depends on:
3
(a) conceptual considerations. More specifically, the choice between depreciation measures has to be governed by the answer to the following question: ‘What is the significance and economic rationale for the net measures produced by the System?’ In particular, what is the economic meaning of the net income measure obtained by deducting depreciation from gross income?
Ignoring the problems associated with an asymmetrical treatment of expected holding gains and losses, the Hill/Diewert measure of depreciation corresponds to a notion of income that measures maximum consumption in a given period, provided that the purchasing power of the capital stock is kept intact. Conceptually, the purchasing power of the capital stock is measured in terms of an overall bundle of goods and services. A real holding loss from capital goods is tantamount to a loss of purchasing power and under the Hill/Diewert measure this is reflected in depreciation. Put differently, to preserve purchasing power of the capital stock, investment will be required not only to replace capital goods that have been used up in production but also to compensate for the loss in value of capital goods relative to other goods and services.
The Ahmad/Aspden/Schreyer measure of depreciation corresponds to a notion of income that
measures maximum consumption in a given period, provided that the volume of the capital stock – and therefore its productive capacity – is kept intact. To preserve productive capacity, only replacement investment will be required to match the value of capital used up in production. Replacement investment and depreciation are valued at current replacement costs but no additional allowance is made for the fact that the real value of the capital stock has changed between the beginning and the end of the period. This adjustment is recognized in the revaluation account.
(b) practical considerations: two such considerations come into play.
Only accounting for expected real holding losses in the Hill/Diewert measure of depreciation but not for expected holding gains means that implementation may be more difficult to handle than a simple exclusion of holding gains and losses. There is also the question of which general price index should be used – CPI or a broader index? Does it matter that these indexes reflect the effects of obsolescence in other goods and services?
In practice, national accountants derive estimates of depreciation in line with the depreciation measure described by Ahmad/Aspden/Schreyer. They express estimates of gross fixed capital formation in constant prices, derived by deflating the current price estimates by asset specific (constant-quality) price indexes, and then use age-price functions that reflect the effects of wear, tear, exhaustion and foreseen obsolescence to derive estimates of depreciation in constant prices. These are then inflated using specific the same asset specific price indexes to obtain current price estimates of depreciation. They do not include real holding losses (or gains) in their estimates of depreciation.
9. In summary, the SNA states that depreciation should include foreseen obsolescence and there is consent about the desirability of this inclusion. However, the question arose as to how foreseen obsolescence should be measured. There is no unanimous view on this matter, partly because different proponents have defined obsolescence differently, and empirical observations are sometimes mixed up with conceptual considerations. However, the discussions during and alongside the meetings of the Canberra II Group led to the broadly accepted view that there is no one-to-one correspondence between effects of obsolescence and real holding losses. For example, the economic service lives of assets are affected by obsolescence and consequently factor (b) – exhaustion – would reflect obsolescence effects. Consequently, excluding real holding losses from the measure of depreciation does not necessarily imply an exclusion of expected obsolescence. It is also apparent that the effects of obsolescence are hard to disentangle from other factors bearing on supply and demand of assets. Thus, the inclusion of expected real holding losses in a measure of depreciation, may or may not accurately reflect the effects of obsolescence
4
on asset values. The specifics of the debate can be found in Ahmad Aspden and Schreyer (2005) and Hill (2005) and Diewert (2003).
5
Recommendations 10. The following recommendations are made: 1) No change of substance is required to the present text of the SNA on consumption of fixed capital, but a clarification is needed to make it clear that it should be measured at the average prices of the period with respect to a constant-quality price index of the asset concerned. 2) More discussion should be provided on the concepts underlying the SNA measure of depreciation. 3) More guidance should be provided on the implementation of depreciation measures. Such guidance should be integrated into the broader setting of a revised manual on capital measurement, to be prepared alongside the revision of the SNA. Issues for discussion 11. The principal issue for discussion is, of course, which of the two interpretations of “average prices” in paragraph 10.118 is the appropriate one. Once this has been decided, discussion should then focus on consequential actions.
6
DEPRECIATION AND OBSOLESCENCE – ISSUE 23
Nadim Ahmad, Charles Aspden, and Paul Schreyer
OECD Statistics Directorate 2, rue André Pascal
75775 Paris Cedex 16
Paper prepared for the meeting of the Canberra Group on Non-Financial Assets
Canberra, 29 March – 1 April 2005
Email: [email protected] [email protected] [email protected] 21/06/2005
7
TABLE OF CONTENTS
1. Background .......................................................................................................................................8 2. The issue ...........................................................................................................................................8
Introduction and terminology...................................................................................................................8 Measures of depreciation .........................................................................................................................9 What the SNA says ................................................................................................................................11 SNA depreciation and cross section depreciation compared – the concepts..........................................13 SNA depreciation and cross section depreciation compared – in practice.............................................15 More references to the productivity literature ........................................................................................16 Heterogeneous assets..............................................................................................................................17
3. Which to choose? – Four observations ...........................................................................................18 First, the choice of the depreciation measure depends on the choice of underlying measure of income................................................................................................................................................................18 Second, expected obsolescence is reflected in SNA depreciation .........................................................19 Third, SNA depreciation exactly exhausts the purchase value of an asset.............................................22 Fourth, more on the empirical aspect of depreciation estimates ............................................................23
4. Summary and conclusions ..............................................................................................................24 REFERENCES..............................................................................................................................................27 ANNEX A: AGE-EFFICIENCY PROFILES AND DEPRECIATION .......................................................29
8
1. Background
1. The major accomplishment of the first incarnation of the Canberra Group was the production of the OECD Manual Measuring Capital (2001). In the course of its work the Group identified several issues that needed further discussion and research effort. One of them was the treatment of obsolescence and depreciation which, although subject to lively debate, was not settled. The principal goal of Canberra II is the update of the 1993 SNA in respect of non-financial assets, and this clearly includes the question of how to measure depreciation. The measurement of depreciation also impacts on the introduction of capital services into the SNA, which is the concern of other Canberra II issues. This document has been presented to the September 2004 meeting of the Canberra Group in London for discussion. The present version, prepared for the meeting in Canberra (April 2005), takes account of the comments made in the London meeting and has been extended in some places. However, the basic conclusion of the earlier version – no changes required to the present text in the SNA – remains intact.
2. The issue
Introduction and terminology
2. Depreciation is an important variable in the national accounts and for economic analysis – it provides the link from various gross measures of income and expenditure to net measures and the latter constitute a closer link to economic welfare and the standard of living than gross measures.
3. In several papers, Hill (2000, 2003) pointed out that there was a controversy concerning the precise notion of depreciation. He argues that there is a difference between the national accounts/SNA view of depreciation and the way depreciation is defined and measured in the productivity literature where he quotes as examples Jorgenson (1989), and Hulten and Wykoff (1996). Hill’s main point is that these authors define depreciation
“…not as the change in the value of an individual asset over time but as the difference between the values of successive vintages of otherwise identical assets at the same point in time. Obsolescence is thereby excluded because it does not affect the relative values of the different vintages. Depreciation is restricted to wear and tear […]”
4. Hill points out that the traditional national accounts concept of depreciation is a different one, that treats obsolescence as an integral part of depreciation whereas the (other) vintage approach treats it as a separate item, a revaluation, which has to be treated as a real holding loss in the SNA. “Reclassifying part of what has always been treated as depreciation in both business and economic accounting as a holding loss would reduce depreciation and increase every balancing item in the SNA from Net National Product and Income to net saving” (Hill, 2000).
5. In subsequent papers, Diewert (2001, 2003) sheds light on the debate. He discusses Hill’s statements and brings the various measures of depreciation together in a single, formalised framework. However, Diewert does not come out strongly in favour of one or the other definition of depreciation.
6. Because depreciation is an important variable in the national accounts, the issue needs settling. This paper revolves around the SNA and its recommendations for the measurement of depreciation. We compare the SNA measure with the measures that have been under discussion. A key element in our argument will be that there has been a mis-understanding about how and where obsolescence enters the
9
analysis. Another important point is valuation – the price base to measure the flow of depreciation during an accounting period.
7. In the present paper, we shall use the following terminology:
• the vintage of an asset should be understood as a particular model of a class of assets or a bundle of characteristics that first appeared at one particular historical date;
• the age of an asset is a measure of its past usage where time is used as the metric for measuring usage. Age is not necessarily the same as vintage: there could be a car of 1999 vintage that is new (of age zero) in 2000;
• Obsolescence is the process whereby a capital good goes out of use, out of date or experiences a decline in its capacity to generate returns for reasons other than wear and tear and catastrophes. Note that this definition of obsolescence has a volume dimension – obsolescence is a process that one way or another impacts on the present or future flow of capital services delivered by an asset;
• The age-efficiency function of an asset depicts the expected productive efficiency as the asset ages. Among other things, the expected service life shapes the form of the age-efficiency function. The economically useful service life is chosen by the user-producer of an asset and depends on economic as well as on purely physical characteristics of a capital good.
• The age-price function of an asset depicts the expected value of an asset as it ages. For meaningful statements about the value loss due to ageing, age-price profiles are expressed in prices of a particular year.
• Age price and age-efficiency functions are not independent of each other and are related by an asset market equilibrium condition. The latter states that the price of an asset equals the discounted flow of the expected value of its future services.
Measures of depreciation
8. Before presenting our argument, it is worth spelling out the three variants of depreciation that are commonly cited in the debate. We shall add a fourth one that in our view corresponds directly to the SNA language on depreciation. To keep things simple, no difference is made between expected and unexpected variables at this stage. The distinction – while important for an ultimate definition of depreciation – provides little additional insight in the issue at hand, namely favouring one or the other concept of depreciation as most proponents in the debate would agree that unexpected price changes or unexpected obsolescence should not enter measures of depreciation. Hence, for the purpose at hand, the assumption of perfect foresight is made, implying that all expectations are realised.
9. Diewert’s (2001, 2003) basic notation is used to restate the three measures of depreciation. We call t
nP the market price at time t for an n-year old asset. Diewert makes a careful distinction between prices that apply to the beginning and prices that apply to the end of the period. We follow his notation and let the sequence of prices relate to the beginning of the period. As will be discussed later, in an applied national accounts context prices have to constitute average prices over the accounting period for flows of investment, capital services and user costs.
10
10. For purposes of exposition, and to discuss obsolescence, we introduce another subscript, A and B, that designates a particular individual asset: A and B are identical except for their age: A has been purchased n years ago, and B n+1 years ago.
11. Cross section depreciation per unit of an n year old asset A is defined as
(1) t1nB
tnA
tnA PPD +−≡
12. Thus, ‘cross section’ depreciation captures the price difference between the market price at time t of an asset A purchased at t-n and another asset B of the same vintage as A but purchased one year earlier. At time t the first asset (A) is n years old and the second (B) is n+1 years old. It should be noted that this interpretation of (1), also reflected by its name, relies on comparing prices of several assets of different age at the same point in time: depreciation for asset A is measured by comparing its value with that of asset B – identical but one year older. Similarly, depreciation for asset B would be measured by comparing its price with that of another asset that is one year older than B, say asset C, etc. So understood, cross-section depreciation is not formulated with regard to a single asset – and, so, in theory, remains undefined unless there are several assets that are identical except for their age.
13. Nominal time series depreciation per unit of an n-year old asset A is defined as
(2) 1t1nA
tnA
tnA PP +
+−≡∆
(3) ( ) ( )t1nB
1t1nA
t1nB
tnA
1t1nA
tnA
tnA PPPPPP +
+++
++ −−−=−≡∆
14. Nominal time series depreciation comprises two movements: the change in age from n to n+1 and the price change in time from t to t+1, often labelled ‘revaluation’ or ‘capital gains and losses’ in the economics literature. Because all expected variables are perfectly realised, there are no unexpected holding gains or losses in (2). Thus, the term ( )t
1nB1t1nA PP +++ − measures foreseen price changes and it is this
expression that Hill (2000) identifies as capturing the effects of foreseen obsolescence. Consequently, he argues, it should be part of depreciation. Unlike (1), the definition of nominal time series depreciation relies on a single asset A only, as shown in (2). Although, the above decomposition (3) requires a second asset, B, that is a year older or at least a hypothetical price for an identical asset that is one year older.
15. The third main measure identified by Diewert is real time series depreciation. It corrects the price change of the same asset between two periods for general inflation. Diewert introduces tρ as the rate of general inflation and this leads to the following expression of real time series depreciation:
(4) )1/(PP t1t1nA
tnA
tnA ρ+−≡Π +
+
16. Diewert uses (4) to define (expected) obsolescence as the situation when the change in the real asset price is negative1 (i.e. the rate of change in the asset price over time ( ) t
1nBt
1nB1t1nA P/PP ++++ − , corrected
1 We note that this introduces an asymmetry in the treatment of assets, depending on whether the real asset inflation
rate is negative or not. In the first case, it would enter the depreciation measure, in the second case it would not – an issue well recognised by Diewert. There has been some considerable debate concerning this asymmetry. However because we have come to the view (as shown later) that this measure of depreciation is not appropriate in an SNA context, a discussion of the asymmetric treatment of price change, here, is obviated.

11
for general inflation, tρ , is negative). Like cross-section depreciation, real time series depreciation is expressed in prices of the beginning of period t. However, unlike cross section depreciation, the prices involved here are not only asset prices. Due to the use of the general inflation term, units of vintage investment are partly converted into units of general purchasing power at the beginning of t. This means that an element of real holding loss is included in the measure of depreciation.
17. Note that the definition of time series depreciation – be it nominal or real - is coined in terms of a single asset A whose value is compared over time. Unlike cross-section depreciation which relies on the co-existence of several assets that are only different in age, time series depreciation can be formulated for a single asset by looking at its price changes between two periods.
What the SNA says
18. The 1993 SNA defines depreciation or consumption of fixed capital in paragraph 10.118 in the following way:
“Consumption of fixed capital constitutes a negative change in the value of the fixed assets used for production […] it must be measured with reference to a given set of prices, i.e., the average prices of the period. It may then be defined as the decline, between the beginning and end of the accounting period, in the value of the fixed assets owned by an enterprise, and as a result of their physical deterioration, normal rates of obsolescence and accidental damage. The value of a fixed asset depends upon the benefits than can be expected from using it in production over the remainder of its service life. This value is given by the present discounted value, calculated at the average prices of the period, of the stream of rentals that the owner of a fixed asset could expect if it were rented out to producers over the remainder of its service life. Consumption of fixed capital is then measured by the proportionate decline in this value between the beginning and the end of the accounting period.” Three remarks are made here:
• There is a clear requirement by the SNA that foreseen or normal obsolescence should be part of depreciation or consumption of fixed capital.
• The SNA definition of depreciation does not include the effects of price change between accounting periods. Emphasis is put on valuation at average prices and only to the extent that average year prices reflect price changes between one year and the next, would price changes within a year enter measures of depreciation. Measurement of depreciation proceeds with regard to a given vector of prices and this would disqualify nominal and real time series depreciation measures as inconsistent with the SNA because both include some form of price change – a nominal one in the first case and a relative price change in the second case.
• There is no contradiction between the two preceding points unless a claim is made that obsolescence only translates into price changes and that nominal (or real) price changes are exclusively or mainly driven by obsolescence.
19. We now introduce a fourth measure of depreciation which we call SNA depreciation. It is defined as
(5a) ( ) ( )2i1)i1(PPS tt1t1nA
tnA
tnA +⋅+−≡ +
+
This measure of depreciation captures the time series aspect of depreciation as set out in the SNA (“the decline, between the beginning and end of the accounting period, in the value of the fixed assets”). Like nominal and real time series depreciation, SNA depreciation is defined in the context of a single asset thus distinguishing it from cross section depreciation. Unlike nominal and real time series depreciation, it
12
excludes nominal or real holding gains. Although not essential to the conceptual argument, average-year valuation is what the SNA requires and as a consequence, this has been reflected in the definition of (5a). Consider the various components of this measure of depreciation.
20. First, the rate ti stands for the rental price escalation rate, as expected at time t. In most cases, as we will show below, this corresponds to the difference between the prices of otherwise identical assets of the same age at times t and t+1. However for unique assets it is not possible to formulate SNA depreciation using changes in asset prices but it is possible using changes in rental prices. The rental price escalation rate is the expected price change of capital services delivered by asset A. To understand its importance, we invoke the standard asset price equilibrium condition which states that the value of an asset at time t corresponds to the discounted flow of the value of future capital services produced by the asset. Let t
nf be the nominal value at the beginning of period t of the service flows produced by an n-year old asset, let tr be the nominal rate of discount, and T the service life of the asset, then the asset price equilibrium condition is:
(5b) )nT(t
nTtT
2t
2t2n
t
1t1nt
ntnA )r1(
f...)r1(
f)r1(
ffP −
−+++
++
+++
++
++=
21. The rental price escalation rate is then defined as tT
tT
t2n
t2n
t1n
t1n
tn
tnt
ff...
ff
ff
ff)i1(
τ+
+
τ++
+
τ++
τ+τ ====+ for
t,...2,1,0=τ . We have used here the simplifying assumption that the expected rental price change is independent of the age of the asset that produces the service. This assumption is not necessary for the reasoning below but simplifies notation. It should be noted that under standard conditions,
tt1nB
1t1nA i1P/P +=+++ , and so the user cost escalation factor equals the price change of assets of the same
age. But the present argument is in terms of a single asset and so we cannot invoke asset B. Also, as will be shown later the above equality does not hold for all cases of obsolescence.
22. Second, )2/i1(P ttnA + is the mid-year price of asset A (which is n years old at the beginning of
year t), obtained by multiplying the price at the beginning of the year, tnA P , by the price change to mid
year, 2/i1 t+ . In this way, the valuation principles of the SNA are followed.
23. Third, ⎟⎟⎠
⎞⎜⎜⎝
⎛
+
+++ t
t1t1nA i1
2/i1P is the value of asset A when it is n+1 years old but expressed in
comparable mid-year prices of t. This is obtained by dividing the price at the end of the year, 1t1nA P ++ , first
by its price index ti1+ and then revaluing it at mid-year prices of t.
24. Expression (5a) shows the time-series dimension of the SNA depreciation measure – the value of an asset at two different points in time is compared but this comparison has to be based on a consistent valuation (mid-year prices of the period t). Consequently, two adjustments apply to nominal prices: an adjustment to move the valuation from the beginning of the year to the middle of the year and an adjustment to express projected values of asset A in period t+1 at comparable prices of period t.
25. It was mentioned above that under standard assumptions – to be defined below – the expected rate of change of rental prices )i1( t+ was equal to the rate of change of asset prices 1P/P t
1nB1t1nA −+++ .
13
Suppose for a moment that this equality holds so that i1P/P t1nB
1t1nA +=+++ . Inserting this into (5a)
produces ( ) ( )2i1PP tt1nB
tnA +⋅− + . Compare this with a formulation of cross-section depreciation at average
prices, ( ) ( )2i1PPD tt1nB
tnA
tnA +⋅−= + and it is apparent that the two expressions are identical. How should
this be interpreted? The equality will hold whenever the two assets A and B share exactly the same age-price and age-efficiency profile. Identity of age-efficiency and age-price profiles may appear obvious for two assets that are identical except for their age (this is how A and B were defined) and yet, this identity may not hold under all processes of obsolescence. This is further dealt with in the next section.
SNA depreciation and cross section depreciation compared – the concepts
26. Cross section and SNA depreciation are clearly quite similar. Unlike nominal and real time series depreciation, neither of them includes the direct effects of changing prices and they both, in a general sense, capture obsolescence to the extent that foreseen obsolescence is reflected in an asset’s service life and its value (see A.1). However, cross-section depreciation as conventionally defined and interpreted, assumes that the age-efficiency function and/or the service life of a particular type of asset is independent of the date at which the asset is purchased, i.e., independent of its age. This may not be true, and indeed differences in the service lives of identical assets of different age may be a salient feature of processes of obsolescence. This is best explained by way of examples.
27. Consider a Pentium III PC of age n at time t and another of age n+1 at time t. If it is known that a new PC, a Pentium IV, say, is to be introduced at time t+k, rendering Pentium IIIs completely obsolete at this point in time, then the expected remaining service lives of both Pentium III PCs are the same (assuming that, in the absence of obsolescence, they could both be used beyond t+k). By extension, assuming that the efficiency of both Pentium IIIs is the same between t and t+k (i.e. there is no wear and tear) then the value of both is the same, and so the difference in value between the two Pentium IIIs at time t (cross section depreciation) would be zero. This would not be the case for SNA depreciation, however, since it measures the change in value of the same asset between two points at the average prices over that period. Thus, depreciation would be measured for the n-year old Pentium III and for the n+1 year old Pentium III separately and added up. In this case, the sum and, consequently, SNA depreciation would not be zero. This arises from the fact that the two Pentiums have different total service lives (or identical remaining service lives) and consequently, time-dependent age-efficiency functions.
28. An example that is often quoted as a criticism of cross-section depreciation is the so-called ‘mine’ example. This example refers to the infrastructure and machinery at a mine site that are fixed and become obsolete when the mine is worked out because they can not be moved to another mine site (e.g. roads, dams, air strips) or are too costly to move (e.g. heavy machinery). All the assets making up the mine site infrastructure reach the end of their service lives before they are worn out, irrespective of when they were purchased. Thus two mine assets of the same vintage but purchased at different times, and therefore of a different age, are retired at exactly the same time. The age-price profiles of the two assets are different, but this is not reflected in the cross-section measure of depreciation.
29. As stated above, cross-section and SNA depreciation will yield the same value if )i1/(P 1t1nA +++ ,
the deflated value of asset A’s price once it will be n+1 years old equals t1nB P + , the price of asset B that is
n+1 years old in year t. The two prices will be equal if the two assets have the same age-price and age-efficiency profiles. In the mine example above, the profiles are different and so would be the two measures of depreciation. Consider the following two cases.
14
30. Case 1 . The service lives of the two identical assets purchased at time t-n and time t-n+1 are both of length tT . As in (5b), the price of each asset is determined by the expected flow of discounted future rents. (6) shows the prices of the two capital goods in period t:
(6) )nT(t
nTtT
2t
2t2n
t
1t1nt
ntnA )r1(
f...)r1(
f)r1(
ffP −
−+++
++
+++
++
++=
)1nT(t
1nTtT
2t
2t3n
t
1t2nt
1nt
1nB )r1(f...
)r1(f
)r1(ffP −−
−−+++
++
++ +++
++
++=
31. Furthermore, to obtain a measure for SNA depreciation, the expected value of capital good A in year t+1 is needed. In nominal terms, this value is given by (7):
(7) )1nT(t
nTtT
2t
3t3n
t
2t2n1t
1n1t1nA )r1(
f...)r1(
f)r1(
ffP −−
−+++
+++
+++ +
+++
++
+=
32. But (7) is in prices of the year t+1 and for consistent valuation needs to be expressed in prices of period t. This is achieved by multiplying through with the expected rental price escalation rate )i1/(1 t+ :
(8)
)1nT(t
1nTtT
2t
2t3n
t
1t2nt
1n
t)1nT(t
nTtT
t2t
3t3n
tt
2t2n
t
1t1n
t
1t1nA
)r1(f...
)r1(f
)r1(ff
)i1()r1(f...
)i1()r1(f
)i1)(r1(f
)i1(f
)i1(P
−−
−−+++
++
+
−−
−+++
++
++
++
+++
++
++=
++++
+++
+++
+=
+
33. It follows from (7) and (8) that t1nB P + = )i1/(P 1t
1nA +++ . Under these circumstances, the rate of
asset price changes equals the rate of rental price changes. It is not difficult to verify that under these circumstances (identical age-price and age-efficiency profile of A and B), cross section depreciation at average prices and SNA depreciation for asset A coincide because the values of both assets t
1nB P + and )i1/(P t1t
1nA +++ reflect identical productive services during T-n periods. Consequently:
(9) ( ) ( ) tn
tt1t1nA
tnA
tt1nB
tnA
tn S)2/i1()i1/(PP)2/i1(PPD =++−=+−= +
++
34. Case 2. Suppose now that asset A and asset B, as a result of obsolescence, cease to have value at a particular time, say the end of period t+2. Then
(10) 2t
2t2n
t
1t1nt
ntnA )r1(
f)r1(
ffP+
++
+=++
++
2t
2t3n
t
1t2nt
1nt
1nB )r1(f
)r1(ffP
++
++=
++
++
++
15
)r1(ff
)i1)(r1(f
)i1(f
)i1(P
t
1t2nt
1n
tt
2t2n
t
1t1n
t
1t1nA
++=
+++
+=
+++
+
++
++
++
35. In this case, t1nB P + is not equal to )i1/(P t1t
1nA +++ : SNA time series depreciation and cross section
depreciation are not equal because the price of asset B, t1nB P + reflects three periods of service that are left
whereas the price of asset A, t1nA P + is based on only two periods of service. Thus, SNA depreciation at
prices of the beginning of year t exceeds cross section depreciation by 2t2t3n )r1/(f ++
+ . Similarly, SNA depreciation at mid-year prices exceeds cross section depreciation at mid-year prices:
(11) tn
t1nA
tnA
t1nB
tnA
tn SPPPPD =−<−= ++ .
SNA depreciation and cross section depreciation compared – in practice
36. National statistical offices rarely, if ever, calculate depreciation at the level of detail of a particular model of computer or a particular mine. In practice, depreciation is calculated at a much broader level and assets are grouped within categories, e.g. PCs, or all computers, motor vehicles, dwellings, other buildings, other construction with an institutional and/or industry dimension. Hence, the service lives used are the average of many different particular kinds of asset. In practice, the examples given above of the Pentium III and the mine, in which there is a time-dependent obsolescence event, are not dealt with.
37. In practice, while service lives may change over time they are generally fixed for all assets in the same category purchased at a particular time. If n+1-year old assets in a category at time t have the same service life as n+1-year old assets at time t+1 in the same category then cross-section depreciation and SNA depreciation produce identical results. If the service life of an asset category is fixed over time then this will automatically be the case. However, if the expected service life of assets purchased at t-n-1 differs from that of assets in the same category purchased at t-n then the n+1-year old assets at time t will have a different remaining service life than the n+1-year old assets at time t+1 in the same asset category. Unless different service lives are used for the same asset category at different points in the calculation then cross-section depreciation will not produce the same results as SNA depreciation.
38. Practitioners do not generally have detailed indices of rental price escalation rates or indeed asset prices. Indeed, the formulation in (5a) relies on the construction of a price index that is specific to asset A and perceived as such by the owner of this asset. Of course, such information is a theoretical construct, not usually available to national accountants. In practice, price indices relating to categories of assets are available, usually relating to new capital goods such as new personal computers or new passenger cars. Hence, in practice, assuming no unforeseen obsolescence, the formulation in (5a) is generally applied to asset categories using price indices for new assets representative of the asset category.
39. In conclusion then, there are conceptual differences between the cross-section approach as conventionally defined and the SNA depreciation measure. In practice, however, SNA depreciation and cross-section depreciation, valued at average prices, coincide if asset lives are not changing over time. If asset lives are changing over time they will produce different results unless cross-section depreciation is applied in such a way as to mimic SNA depreciation.
16
More references to the productivity literature
40. Griliches (1963) notes: “The net stock concept is motivated by the observed fact that the value of a capital good declines with age (and/or use). This decline is due to several factors, the main ones being the decline in the life expectancy of the asset (it has fewer work years left), the decline in the physical productivity of the asset (it has poorer work years left) and the decline in the relative market return for the productivity of this asset due to the availability of better machines and other relative price changes (its remaining work years are worth less). One may label these three major forces as exhaustion, deterioration and obsolescence.”
41. Triplett’s (1996) view is close to Griliches’: “Depreciation is the decline in the value of an asset, or a group of assets, as they age. […] It is useful to enumerate reasons why an existing asset declines in value as it is used, or as it ages. Value decline with age occurs because of […] physical declines in the productiveness of capital goods: an older capital good, compared to a newer one of the same specification, experiences input and output decay, and is thus less valuable to its owner than one that is identical in specification but new. In addition, the used capital good has suffered some exhaustion – it contains fewer productive years of its service life than does a new machine. We can combine these elements by saying that the age-price profile reflects the cumulative value of ‘capital used up in production’. The age-price schedule, however, may also reflect another element: obsolescence. Obsolescence is the loss in value of an old asset because a newly-introduced asset of the same class contains improvements in productiveness or efficiency or suitability in production.”
42. Dale Jorgenson (1996) defines depreciation as follows: “Durable goods decline in efficiency with age, and thus require replacement in order to maintain productive capacity. This is the quantity interpretation of the intuitive notion of ‘maintaining capital intact’. Similarly, the price of a durable good declines with age, resulting in depreciation that reflects both the decline in efficiency and the present value of future declines in efficiency”. Thus, he makes no specific reference to obsolescence as an element of depreciation. At the same time, Jorgenson has also expressed rates of depreciation with regard to capital stocks that have been built up from cumulating time series of investment, where each period’s investment expenditure has been valued consistently by using a constant quality investment price index. In so doing, technical advances embodied in new models compared to old models of a particular capital good have been translated into relatively more constant efficiency units of the new model compared to the old model. By down-scaling the relative importance of older investment goods, obsolescence effects have been expressed via the size of the constant-quality capital stock.
43. Hulten (1996) similarly, says: “The vintage-price path of a given asset can be expressed as the sum of two factors: a pure ageing effect (analogous to the partial derivative of the [investment good] price
s,tP with respect to age, s), and a pure time effect (analogous to the partial derivative of the [investment
good] price s,tP with respect to time, t). The age effect is caused by the decay in asset productivity and is
represented by the age-price profile, defined as the set of asset prices s,tP for t held fixed. This effect is also called economic depreciation, and is of central importance in the measurement of income and wealth. The time effect, on the other hand, is associated with changes in the general price level, changes in relative prices, and changes in the quality of capital goods, and is called revaluation.”
44. Wykoff (2004), in a comment on Diewert (2002) advocates the view that: “I am not sure depreciation deductions should cover real asset-specific time effects. I think depreciation should consist only of deterioration plus obsolescence as defined in HJH2. The reason for this is subtle but worth
2 Hall and Jorgenson (1967), Hall (1968, 1971), Jorgenson (1974), Hulten (1990).
17
discussion. In addition to deterioration, only vintage-specific changes cause prices of old assets to fall relative to new ones. All other time changes in supply of or demand for assets will influence new and old assets proportionally and leave depreciation rates unchanged.”
45. The above citations show that:
• There are few, if any, differences between the notion of depreciation as used in the productivity literature and consumption of fixed capital as defined by the SNA. Both associate depreciation with the aging of an asset. Value losses as a consequence of catastrophes aside, both concepts are understood as losses in value of an asset over time due to wear and tear, retirement and obsolescence. Different authors may attach different importance to the various elements but there is no systematic tendency in the productivity literature to explicitly exclude obsolescence as a factor that bears on depreciation. The question is then whether the measurement of depreciation as in (1) or in the national accounts practice can accommodate value losses due to obsolescence or whether it defines them away – as Hill (2000) has argued.
• The ‘age-price function’ which reflects the price of a capital good as a function of its age is the recommended tool for measuring depreciation and this corresponds to SNA depreciation.
• Unlike the SNA which explicitly recommends average prices to value consumption of fixed capital, the productivity literature gives few indications how to go about valuation. It often treats depreciation in continuous-time models where the accounting period is very short and where there is only one-point valuation. But this is a practical issue without conceptual consequences.
Heterogeneous assets
46. Another issue emerges from the above citations, namely the relationship between obsolescence and heterogeneity of assets within a class of models. To this point, the discussion has been about a single asset and how expectations about rental prices and efficiency influence asset prices and depreciation. In the discussion about obsolescence, other assets of the same class of assets, such as different models in the asset class ‘passenger cars’ played a role only insofar as their appearance on the market may impact on the service life and on the expected evolution of the rental price of the single asset under consideration.
47. In practice, measurement of depreciation and capital will always be based on classes of assets and not on individual models and this requires some extra precision when we talk about asset and rental prices. When assets are heterogeneous, i.e., when different models in a class of asset have different characteristics, the ‘price’ of an asset can either be expressed as the dollar value per transaction unit such as a ‘BMW moto cycle R 1150 RT” or it can be expressed as the dollar value per unit of characteristic such as maximum speed, acceleration, presence of ABS breaking system etc.
48. This distinction is important because there is a direct link to the measurement of depreciation and obsolescence. For a full discussion of the issues involved here, the reader is referred to Hulten (1996) but for the present purpose it suffices to evoke the following points:
49. When price comparisons between models with different characteristics at a particular point in time are made on the basis of prices per transaction unit (say one “BMW R 1150 RT that is one year old” and another “BMW R1200 RT that is new”), it is apparent that the relative price between two models of different age carries two components: a component which accounts for those price differences that are due to differences in characteristics and another component that reflects the fact that one asset is one year older
18
than the other one. In our example, the characteristics component would take account of the fact that the new 1200 model has electronic injection, and a maintenance-free Kardan transmission both of which are not present in the 1150 model. The age effect could simply be measured by comparing the price of a new 1150 model today with the one-year old 1150 model today, or by comparing the price of a new 1200 model today with the price of a one-year old 1200 model today3.
50. The characteristics component has also been called ‘vintage’ effect by some authors and, as Hulten (1996) shows, is directly linked to the extra technology embodied in the new model. The characteristics component in the price comparison has also been identified with obsolescence: in a competitive market, the price per transaction unit of the 1150 model will adjust until it represents the same bundle of characteristics as the price for the 1200 bike. In terms of measuring depreciation then, it is apparent that by comparing prices per transaction unit of assets of different age within a class of assets, a measure of cross-section depreciation captures both the ageing and the characteristics components.
51. On the other hand, when price comparisons between models are based on prices per unit of characteristic, any comparison of assets of different age within the same class of assets will only reflect the ageing component. That is, the rates of depreciation will pick up ageing and retirement effects but the characteristics effect is already incorporated into the price measure itself. Constant quality price indices, as they are routinely used by statistical offices for the deflation of classes of assets are, conceptually spoken, changes in prices per unit of characteristic4. We also note that rental prices can be expressed as the rental price per transaction unit or per unit of characteristics. In the present context, and in parallel with purchase prices, they are interpreted as the rental value per unit of characteristic.
52. The conclusion is that in the presence of heterogeneous models, our discussion for a single asset carries directly over to a class of assets as long as it is well understood that prices for all models in the asset class have been converted into a common reference unit, i.e., into dollar values per unit of (combined) characteristics. It also means that rates of asset price deflators are to be interpreted as constant-quality deflators that reflect the average price movements of the asset class, including those price movements that are driven by technical change. There is also an implication for the use of hedonic models in estimating depreciation rates and this issue is briefly addressed under point four of section 3.
3. Which to choose? – Four observations
First, the choice of the depreciation measure depends on the choice of underlying measure of income
53. Depreciation is directly connected with net domestic product and net income and any choice about measuring depreciation has to depend on the net income that should be measured. The discussion about measuring income goes back a long way and no effort is made here to do its richness any justice. In a very broad sense, there is general acceptance of Hick’s (1939) notion of income, i.e., the maximum amount that can be consumed while keeping wealth intact. However, there are different views when it comes to the
3 Provided the one-year old 1200 model exists, i.e., has not only been introduced in the present period. If it does not
exist, a hypothetical price would have to be estimated, for example from hedonic models. The fact that new models are inevitable introduced at one particular point in time, i.e., the fact that there is a particular age to each model can make it difficult to distinguish age effects and characteristics effects, an observation that was first made by Hall (1968). We abstract from this complication here.
4 This is apparent when hedonic models are used to develop deflators: hedonic models explicitly identify characteristics between models and control for these differences when identifying the ‘pure’ temporal effect of price change. But the same is true when matched model techniques are used: wherever possible, the prices of the same model, sold at the same outlet, are compared between two periods. This amounts to keeping quality constant.
19
precise definition of wealth that is intact. In particular, there are different views about the degree to which holding gains and losses should be reflected in sustainable income (see also Hill and Hill (2003) for a discussion). Three views are relevant for the present discussion:
• Income should include all capital gains and losses that accrue during the accounting period. This ex-post notion of income is mainly useful from a fiscal perspective and has been coined Haig-Simons income in reflection of the work by Simons (1938) and Haig (1959).
• Income should include all expected capital gains and losses that accrue during the accounting period. This is closest to Hick’s income measure under uncertainty that implies that expected stock revaluations belong to income. Hill and Hill (2003) point out that this ex-ante definition of income is essentially the same as Friedman’s (1957) concept of permanent income which figures prominently as an analytical determinant of consumption.
• Income should include no capital gains or losses. This is essentially the position taken by national accountants who measure income as the sum of factor payments and net current transfers whereas holding gains and losses are relegated to the revaluation account – they affect changes in wealth but are not considered income. ‘Income’ in the SNA is confined to income from production and in the current period (Harrison 1999). Whether this is a rule explained by practical considerations (the difficulties to distinguish ex-post from ex-ante price changes) or by conceptual ones is not entirely clear from the SNA 93 but the fact remains that at present holding gains and losses do neither qualify as production nor income.
54. Each notion of income brings with it a different notion of depreciation: if net income is to be measured free of holding gains and losses, it follows that the same principles should underscore depreciation so that it is measured free of price changes – this would be the position emerging from the SNA 93. If, on the other hand, net income should reflect expected price changes, then depreciation measures would have to reflect those as well. The Haig-Simons notion of income would require recognising all price changes as part of depreciation – this gives rise to an unsuitable measure of income from a national accounts perspective and shall not be pursued any further here.
55. Whether or not one wishes to stick with present national accounts prescriptions that exclude all holding gains and losses from income or whether one wants to introduce measures of expected price changes into income and depreciation is a matter of analytical usefulness and practicality. But such a move would certainly constitute a change in one of the fundamental principles of national income accounting.
56. What is of importance here is that this question cannot and should not be decided in conjunction with a discussion about measuring obsolescence. As we shall argue below, expected obsolescence enters measures of income and depreciation even if holding gains and losses, in line with current national accounts principles, are excluded from depreciation and income. Thus, staying with the present SNA rules in no way implies ignoring the effects of expected obsolescence.
Second, expected obsolescence is reflected in SNA depreciation
57. We shall use ‘depreciation’ in the sense of the SNA’s definition of consumption of fixed capital (see above) as the decline, between the beginning and end of the accounting period, in the value of the fixed assets owned by an enterprise, and as a result of their physical deterioration, normal rates of obsolescence and accidental damage. Consumption of fixed capital or depreciation is therefore understood
20
as the value of ‘capital used up in production’5, where ‘using up’ comprises all effects of deterioration, foreseen obsolescence and accidental damage.
58. Obsolescence has also been defined earlier in this paper as a process whereby a capital good goes out of use, out of date or experiences a decline in its capacity to generate returns for reasons other than wear and tear and catastrophes. The appearance of a new vintage or model may render existing models obsolete, not because they change the physical characteristics of the old vintage but because its economic usefulness is reduced. This reduction may translate into a different service life, possibly a different distribution of usage over the service life and almost certainly into a different price of the old model. But price effects are not the only manifestation of obsolescence6.
59. Depreciation in the SNA comprises foreseen or normal rates of obsolescence. It can arise for numerous reasons ranging from technological developments to government actions and even simple geography. A criticism that is often made of cross-section depreciation, however, is that it does not adequately capture obsolescence. Consider again the two quite different examples given earlier: the rapid development of computers and the infrastructure at a worked-out mine. In the first case, computers become obsolete because their capacity is insufficient to meet requirements and it is cheaper to replace them than upgrade them. The infrastructure at a mine site becomes obsolete when the mine is worked because it can either not be moved to another mine site (e.g., roads, dams, air strips) or it is too costly to move (e.g., heavy machinery). Both computers and mine site infrastructure reach the end of their service lives before they are worn out and in both cases the owners of the assets can expect this to happen when they acquire the assets. Because their actual service lives are less than their potential physical lives they produce less capital service than they would otherwise and have a lower value than they would otherwise. If these expectations are built in to age price and age-efficiency profiles, the SNA depreciation will capture this obsolescence.
60. Annex A shows how expected service lives in the age-efficiency function influence (SNA) depreciation measures: the result is shown in the expression below. The value of SNA depreciation at the beginning of period t for an asset A depends on the rental price of the asset ( t
0f ) and the discounted value
of future rentals, themselves governed by the expected development of the rental price ( ti1+ ) and future changes in the efficiency of the asset, captured by changes in the age-efficiency profile t
1t hh +ττ − .
5 “Despite the name, capital used up in production does not measure – and should not be interpreted as measuring –
current capital services or capital inputs to production. Instead it is an income or wealth concept. “(Triplett 1996 p. 95)
6 In a related communication, Diewert (2004) quotes Church (1917) who makes precisely this point : « Even though a machine is used fairly and uniformly as contemplated when the rate of depreciation was fixed there is another influence that may shorten its period of usefulness in an unexpected way. The progress of the technical art in which it is employed may develop more efficient machines for doing the same work, so that it becomes advisable to scrap it long before it is worn out. The machine becomes obsolete and the loss of value from this cause is called ‘obsolescence’. Again, unless the machine is of a very generalised type, such as an engineer’s lathe, another type of misfortune may overtake it. If it is a machine that can only be used for certain definite kinds of work or some special article, as for example many of the machines used in automobile and bicycle manufacture, it may happen that changes in demand, or in style, make the manufacture of that special article no longer profitable. In this case, unless the machine can be transformed for another use, it is a dead loss. » (A. Hamilton Church (1917), Manufacturing Costs and Accounts, New York).
21
(12) ( )( ) ( )t
1tT
0 t
tt0
t1t1A
t0A hh
r1i1f)i1/(PP
t
+ττ=τ τ
τ+ −
+
+=+− ∑
61. Alternatively, depreciation measures could be obtained by making assumptions about the age-
price profile of assets. Suppose that age-price profiles are linear: )Tn1(P t
tn −= . Then, straight line SNA
depreciation at the beginning of the period would be measured as
(13) ⎟⎠⎞
⎜⎝⎛=+− +
tt0A
t1t1A
t0A T
nP)i1/(PP .
62. SNA depreciation based on average prices of the period instead of prices at the beginning of the year is obtained by multiplying through by the mid year price deflator. A derivation similar to (12) can be made for cross section depreciation with identical results, depending on whether age-efficiency profiles of assets A and B are identical.
63. From (12) and/or (13) it is apparent that:
• SNA and cross section depreciation can be expressed as a discounted series of changes in the rental income, itself dependent on the age-efficiency profile of an asset, its expected price changes and the discount rate.
• Future asset price changes – represented by the escalation rate i – enter the value of today’s cross section depreciation via t
0f and the term ( ti1+ ). Thus, to the extent that expected changes in asset prices reflect expected obsolescence, they make their way into average price time series depreciation. This was already pointed out by Diewert (2001, 2003).
• At the same time, price and quantity effects are closely linked and it seems wrong to conclude that price changes – nominal or real – constitute the only manifestation of obsolescence. Nor is it true, for that matter, that all drops in expected asset prices are a manifestation of obsolescence. Many other factors bear on asset price changes and for all these reasons the identification of obsolescence with price effects is problematic. For example, the prices of new cars in the UK fell over a period of several years because the price fixing by the retail trade was exposed and undercut. Thus, competition in product and labour markets, exposure to foreign trade flows and simple changes in taste, fashion or demographics may have an effect on prices and there is no reason to identify all such changes even when expected, with obsolescence.
• The service life and the age-efficiency function that are expected and relevant for a particular asset at time t shape the value of depreciation. In particular, it is apparent that a longer service life – such as the 20 year physical service life of a computer mentioned earlier – will result in a lower value of depreciation. In other words, if obsolescence affects age-efficiency functions, it affects the discounted value of capital services.
• Under perfect foresight, the correct age-efficiency function will be chosen at the time of purchase of an asset. With a setting where the set of available information evolves over time, and/or where obsolescence affects not only service lives of new but also of older assets, it
22
may be necessary to revise the age-efficiency and/or age-price functions of assets of all ages as time goes on.
Third, SNA depreciation exactly exhausts the purchase value of an asset
64. The question of measuring investment and depreciation arises when assets are used over a time span that exceeds the accounting period – typically one year. An important function of depreciation is to allocate the value of capital used up over time and it would seem sensible that the cumulative value of depreciation over the asset’s lifetime adds up to the initial value of the asset – at least as long as there are no unexpected events and as long as expectations are realised. The same suggestion follows from the observation that the consumption of fixed capital is the value of capital used up in production (Triplett 1996).
65. Obviously, adding up values of depreciation that relate to different years requires that they are all expressed in a common set of prices, for example the prices of the year when the asset was purchased. It can then be shown that the sum of SNA depreciation, expressed in prices of the same base period, exactly equals the purchase price of the asset.
66. To demonstrate, consider SNA depreciation for period t, expressed in the mid-year prices of year t: ( )( )( )2i1i1PPS tt1t
1nAtnA
tnA ++−≡ +
+ . Suppose that the asset was purchased in period 0t and has a
service life of T years. Period t depreciation, expressed in prices of the year of purchase, 0t , is then
(14) ( ) ( ){ }( )2/i1i1/)i1/(PPS 0000 ttttt1t1nA
tnA
0tnA +++−=
−++
where )i1( 0t+ = annual rental price change as anticipated at the beginning of t0. Summing up over all ages of the asset yields (15)
(15)
( )( )( )2/i1P
2/i1)i1/(P...)i1/(P)i1/(P)i1/(PPS00
0000000000
tt0A
tT
0nTtTt
TA2t2t
1At1t
1At1t
1At0A
tnA
+=
++++−+++−=∑ =++++
67. Thus, the sum of ‘constant price’ depreciation, i.e., depreciation expressed in prices of the purchasing period reproduces the value of the asset in that period as one would expect. This holds as long as the rate of price change has been correctly anticipated but the present argument is not about the difference between expected and unexpected variables, as was stated earlier on. Under the assumption of fixed asset service lives the above derivation and argument also holds for cross section depreciation.
68. It is not obvious that a similar calculation using real time series depreciation would produce the same property, namely exhaustion of the initial value. Consider, for example, and for simplicity, deflating the real time series depreciation of period t with the asset price inflation index ( )0ti1+ : this would produce
( ) ( ) )1/(i1PPi1/ 000000 ttt1nA
tnA
ttttnA ρ++−=+Π +
−for an asset of age n and unless asset price inflation
coincides with overall inflation, the sum of depreciation across all vintages will not produce the initial purchase value 0t
0A P . If overall inflation and asset price inflation coincide, the difference between SNA and real time series depreciation disappears and so does the issue at hand.
23
69. A similar statement can be made for nominal time series depreciation. Deflating the sum of 1t1nA
tnA PP +
+− using asset price inflation gives 00 ttt1t1nA
tnA )i1/()PP( −+
+ +− = 1t1nA
tnA
00 PP ++− , and
∑ ==∏
t
ontnA
0 1t1A
t0A
00 PP +− + 1t2A
t1A
00 PP +− …..which does not necessarily add up to 0t0A P .
Fourth, more on the empirical aspect of depreciation estimates
70. Knowledge about service lives and age-efficiency functions that are time or vintage-specific together with assumptions about expected price changes are instrumental in generating a set of asset prices for each vintage and/or age, where the asset-price equilibrium condition (A.1) provides the bridge between age-price and age-efficiency profiles. This so-generated set of prices can then be used to value net capital stocks and to compute depreciation. To the extent that the parameters that enter this calculation – in particular asset service lives - reflect processes of obsolescence, these will be picked up by measures of SNA depreciation and net income.
71. Alternatively, empirical implementation of depreciation measures can start directly with the age-price functions which show the relative value of a particular vintage as it ages, thereby combining the various effects that contribute to price differences between assets of different age. These effects are in particular wear and tear (deterioration, decay) and obsolescence. The loss in value of an asset because of wear and tear, and decay is difficult to distinguish from obsolescence, conceptually and empirically. Hall (1968) showed that there is a fundamental indeterminacy in separating these effects. Empirical estimates of age-price functions will thus also capture both wear and tear and obsolescence effects.
72. Econometric studies of depreciation use price observations on new and used assets for several periods (for a more extensive survey of depreciation studies see Jorgenson 1996). Most approaches can be traced back to the work of Hall (1971) who put forward an econometric model of vintage price functions. Major empirical work in the field was conducted by Hulten and Wykoff (1981). Examples of more recent work are Oliner (1993, 1996), Geske and Ramey (2004), and Doms et al. (2004). In simplified form, these models can be characterised as follows.
(1) ε+µ+γ+β+= tvst,v,s DDDaPln
73. Observations on prices of a particular class of assets are distinguished by the age s of the capital good, by its vintage (i.e., a particular model, described by a set of characteristics v) and by the time of purchase t. The coefficient µ in this regression will yield an estimate of the average price change of the class of assets under consideration, while controlling for the age and for the characteristics of the models in the sample. In other words, µ is an estimate for a constant-quality price index for new assets, very much the kind of price index discussed in the context of deflating investment expenditure as a first step towards constructing measures of capital stocks.
74. The coefficient β , attached to the age variable, represents the percentage change in prices when age moves by one unit, holding characteristics constant. The first economic effect measured by β is essentially what has been labelled ‘decay’ by some authors (see Triplett 1998 for a discussion), i.e., the loss in value due to wear and tear as a capital good is used and as it ages. It is a pure age effect in the sense that it is measured while quality characteristics are held constant. β is also the parameter liable to picking up a second effect, the ‘lemons’ effect, first identified by Akerlof (1970). Used assets trade at a discount when buyers cannot assess the quality of the goods offered for sale when they assume that vendors attempt to sell deficient goods.
24
75. The third effect captured by β is any price effect that is not picked up by differences in quality characteristics and by the passage of time. This may include certain types of obsolescence and is best explained by way of an example. Different models of computers can be distinguished by different quality characteristics such as processor speed, storage capacity etc. In the price equation above, these characteristics are captured by the variable Dv. Some of these characteristics may directly reflect effects of obsolescence, for example a variable that marks the presence or absence of a DVD player. Models without a DVD player will be sold at a discount relative to models equipped with one. Thus, the old models have suffered from obsolescence. As long as the vector of quality variables captures these effects, they will not enter the depreciation term β . However, the set of quality characteristics v will hardly ever be complete in the sense that it describes every aspect of price-relevant features. For example, there may be increasing incompatibility of older computers with the current state of IT. This is a source of obsolescence, which may be difficult to capture by the list of characteristics v and so would be reflected in the age-related depreciation coefficient. For capital goods other than computers old assets may be marked down over new ones if the old assets have been customised when new: this discount for specificity of a used asset is also expression of obsolescence. Finally, if old assets have different service lives from new assets, such a premium or discount will be picked up by the depreciation coefficient, even though the assumption is usually made that service lives are constant.
76. The coefficient γ captures the effects of product characteristics, i.e., product quality on prices. Obsolescence is directly associated with product characteristics: a new model of a class of assets may have new features or more of certain characteristics than an old model and this will typically depress the price of old models even if they are physically unchanged as such. Because obsolescence is considered part of depreciation in the national accounts, the obsolescence-related effects have to be combined with the pure ageing effects to obtain a measure of depreciation. However, as Oliner (1993) has shown, when investment data has been deflated with constant quality price indices – as is typically the case – only β (“partial depreciation rates”) should form the basis for empirical estimates of rates of depreciation because quality change has already been captured by the constant-quality deflator.
“The intuition for the use of a partial depreciation measure is simple. […] Because BEA deflates current-dollar (investment) outlays with constant-quality prices, one constant dollar of investment has the same embodied quality for all vintages. Thus, one constant dollar of vintage t-s investment that remains in service will be worth less than a full constant dollar of vintage t investment only because of price differences due to factors other than the embodied characteristics. These price differences are captured in what I have called the partial depreciation” (Oliner 1993, p.53).
4. Summary and conclusions
77. The change in value of an asset over a period of time can be decomposed into three components:
a) Changes in value due to obsolescence and wear and tear.
b) Changes in value due to general price change.
c) Other changes in value due to supply and demand factors peculiar to this particular type of asset, other those in component (a).
78. Nominal time series depreciation comprises all three components. Real time series depreciation comprises components (a) and (c). SNA time series depreciation comprises only component (a).
79. This paper defines obsolescence as a process whereby a capital good goes out of use, out of date or experiences a decline in its capacity to generate returns for reasons other than wear and tear and
25
catastrophes. The appearance of a new vintage or model may render existing models obsolete, not because they change the physical characteristics of the old vintage but because its economic usefulness is reduced. This reduction will translate into a different service life, possibly a different distribution of usage over the service life and almost certainly into a different price of the old model. Price and quantity effects are closely linked and it seems wrong to conclude that price changes – nominal or real – constitute the only manifestation of obsolescence. Nor is it true, for that matter, that all drops in expected asset prices are a manifestation of obsolescence. Many other factors bear on asset price changes and for all these reasons the identification of obsolescence with price effects is problematic. For example the prices of new cars in the UK fell over a period of several years because the price fixing by the retail trade was exposed and undercut. Thus, competition in product and labour markets, exposure to foreign trade flows and simple changes in taste, fashion or demographics may have an effect on prices and there is no reason to identify all such changes even when expected, with obsolescence.
80. Because there is no easily identifiable link between (expected) asset price changes and obsolescence, the formulae for depreciation that explicitly include price changes – nominal and real time series depreciation – do not necessarily capture obsolescence appropriately. Nor do those measures of depreciation that explicitly exclude price changes – cross section and SNA depreciation – necessarily exclude obsolescence.
81. Obsolescence will always impact on the market prices of assets, and in many cases also on the quantity of capital services. By implication, all measures of depreciation will be affected. Where there is foreseen obsolescence, its effects would appear to be widespread and nearly every variable that plays into price and quantity measures of capital can be linked to foreseen obsolescence. Whether or not this is done in an empirically satisfactory way depends on the quality of the empirical information that is at the statistician’s disposal. For example, a standard assumption in capital measurement is the time-invariance of age-efficiency functions and service lives. If one important avenue by which foreseen obsolescence enters the picture is service lives and age-efficiency functions, and if we are not in a position to capture these changes empirically, then our measures of capital and depreciation will incorrectly reflect foreseen obsolescence. But this is an issue of data availability, not of concepts and should be treated by improving the empirical basis.
82. The choice between time series depreciation (nominal or real) and SNA depreciation cannot be made on the basis of a discussion about obsolescence. The choice can only be made with reference to the notion of income that one wants to embrace. Time series depreciation with its inclusion of expected capital gains and losses could be envisaged if the national accounts were to move to a Hicksian notion of income that reflects such capital gains and losses. However, such a move would be much more fundamental than formulating a specific measure for depreciation and is quite independent from the discussion about obsolescence.
83. SNA depreciation is based on the SNA concept of income that does not reflect price changes (holding gains and losses) of assets, even though the price levels may be influenced by expectations about future price changes. It captures the effects of obsolescence via reduced service lives and shifting age-price and/or age-efficiency functions. This strikes us as the right measure of depreciation given the principles underlying the SNA and there appears thus to be no case for changing the SNA definition of depreciation.
84. On purely conceptual grounds, cross-section depreciation can differ from SNA depreciation for example when obsolescence affects different age groups of the same type of asset such that the remaining service lives are the same for all age groups. In this sense it is true that not all occurrences of obsolescence are adequately captured by cross-section depreciation measures. In practice, SNA depreciation and cross section depreciation coincide when asset lives do not change over time. If asset lives are changing over
26
time they will produce different results unless cross-section depreciation is applied in such a way as to mimic SNA depreciation.
85. But there are many empirical challenges for statistical offices to better capture effects of obsolescence via studies on service lives, retirement distributions and used asset prices, and periodic adjustments of age-efficiency functions that underlie capital stock estimates. Further, depreciation estimates have to be embedded into a broader and consistent framework of measures of capital services, net capital stocks, and productivity.
27
REFERENCES
Fraumeni, Barbara (1997); “The Measurement of Depreciation in the U.S. National Income and Product Accounts”; Survey of Current Business.
Diewert, Erwin (2003); “Notes on the Treatment of Obsolescence and Depreciation”; Paper presented at the 2nd meeting of the Canberra II Group on the Measurement of Non-financial Assets, Paris, October 13-15, 2003.
Diewert, Erwin (2001); “Measuring the Price and Quantity of Capital Services under Alternative Assumptions”; University of British Columbia Discussion Paper 1-24.
Friedman, Milton (1957); A Theory of the Consumption Function, Princeton.
Griliches, Zvi (1963); “Capital Stock in Investment Functions: Some Problems of Concept and Measurement”; in Measurement in Economics, C. Christ et al. (eds.) Stanford University Press.
Hall, Robert (1968); “Technical Change and Capital from the Point of View of the Dual”; Review of Economic Studies 35; pp. 34-46.
Hall, Robert (1971); “The Measurement of Quality Changes from Vintage Price Data”; in: Zvi Griliches (ed.) Price Indexes and Quality Change, Cambridge Mass.
Haig, R.M. (1959); “The Concept of Income: Economic and Legal Aspects”; in Musgrave, R.A. and C.S. Shoup (eds.) Readings in the Economics of Taxation; Homewood IL.
Harrison, Anne (1999); “Accounting for income”; unpublished note OECD Statistics Directorate.
Hicks, John (1939); Value and Capital, 2nd edition Oxford University Press 1946.
Hill, Peter (2000); “Economic Depreciation and the SNA”; paper presented at the Conference of the International Association for Research on Income and Wealth; Krakow.
Hill, Robert J. and Peter Hill (2003); “Expectations, Capital Gains and Income”; Economic Inquiry, Vol. 41, No4, October; pp. 607-619.
Hulten R. Charles (1996); “Quality Change in Capital Goods and its Impact on Economic Growth”; NBER Working Paper 5569.
Hulten R. Charles (1990); “The Measurement of Capital”; in: Ernst R. Berndt and Jack E. Triplett (eds.) Fifty Years of Economic Measurement; Studies in Income and Wealth Volume 54.
Hulten, Charles R. and Frank C. Wykoff (1996); “Issues in the Measurement of Economic Depreciation: Introductory Remarks, Symposium on Depreciation”; Economic Inquiry 34(1), pp. 10-23.
28
Hulten, Charles R. and Frank C. Wykoff (1981); “Economic Depreciation and the Taxation of Structures in United States Manufacturing Industries: An Empirical Analysis” in Dan Usher (ed.) The Measurement of Capital, University of Chicago Press 83-120.
Jorgenson, Dale W. (1996); “Empirical Studies of Depreciation”; Economic Inquiry, Vol XXXIV, pp.24-42.
Jorgenson, Dale W. (1989); “Capital as a Factor of Production”; in: Technology and Capital Formation, edited by D.W. Jorgenson and R. Landau, Cambridge MA, pp. 1-35.
Jorgenson, Dale W. (1974); “The Economic Theory of Replacement and Depreciation” in W. Sellekraets (ed.) Econometrics and Economic Theory, MacMillan New York.
OECD (2001a); Measuring Productivity: OECD Manual; Measurement of Aggregate and Industry-level Productivity Growth, Paris.
OECD (2001b); Measuring Capital: A Manual on the Measurement of Capital Stocks, Consumption of Fixed Capital and Capital Services, Paris.
Oliner, Stephen D.(1996); “New Evidence on the Retirement and Depreciation of Machine Tools”; Economic Inquiry, Vol XXXIV, pp.57-77.
Oliner, Stephen D. (1993) “Constant-Quality Price Change, Depreciation, and Retirement of Mainframe Computers” in: Foss, M. F., M. E. Manser and A.H. Young (eds.) Price Measurement and their Uses, University of Chicago Press.
Simons, H. (1938); Personal Income Taxation: The Definition of Income as a Problem of Fiscal Policy; University of Chicago Press.
Triplett, Jack E. (1998); A Dictionary of Usage for Capital Measurement Issues, presented at the Second Meeting of the OECD Canberra Group on Capital Stock Statistics.
Triplett, Jack E. (1996), “Depreciation in Production Analysis and in Income and Wealth Accounts: Resolution of an old Debate”; Economic Inquiry, Vol. 34, pp.93-115.
Wykoff, Frank C. (2004); Comment on W. Erwin Diewert: Issues in the Measurement of Capital Services, Depreciation, Asset Price Changes and Interest Rates; NBER/CRIW conference Spring 2002; US Federal Reserve Board of Governors, Washington DC.
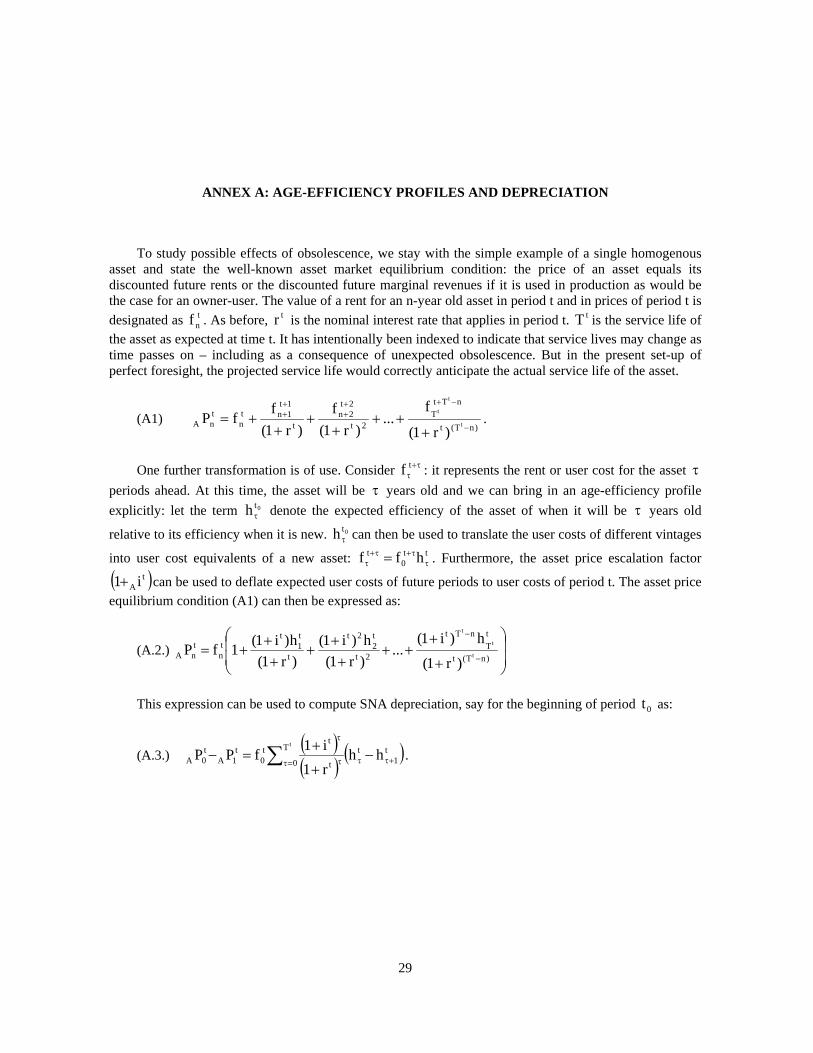
29
ANNEX A: AGE-EFFICIENCY PROFILES AND DEPRECIATION
To study possible effects of obsolescence, we stay with the simple example of a single homogenous asset and state the well-known asset market equilibrium condition: the price of an asset equals its discounted future rents or the discounted future marginal revenues if it is used in production as would be the case for an owner-user. The value of a rent for an n-year old asset in period t and in prices of period t is designated as t
nf . As before, tr is the nominal interest rate that applies in period t. tT is the service life of the asset as expected at time t. It has intentionally been indexed to indicate that service lives may change as time passes on – including as a consequence of unexpected obsolescence. But in the present set-up of perfect foresight, the projected service life would correctly anticipate the actual service life of the asset.
(A1) )nT(t
nTtT
2t
2t2n
t
1t1nt
ntnA t
t
t
)r1(
f...
)r1(f
)r1(ffP
−
−+++
++
+++
++
++= .
One further transformation is of use. Consider τ+τtf : it represents the rent or user cost for the asset τ
periods ahead. At this time, the asset will be τ years old and we can bring in an age-efficiency profile explicitly: let the term 0th τ denote the expected efficiency of the asset of when it will be τ years old
relative to its efficiency when it is new. 0th τ can then be used to translate the user costs of different vintages
into user cost equivalents of a new asset: tt0
t hff ττ+τ+
τ = . Furthermore, the asset price escalation factor
( )tA i1+ can be used to deflate expected user costs of future periods to user costs of period t. The asset price
equilibrium condition (A1) can then be expressed as:
(A.2.) ⎟⎟
⎠
⎞
⎜⎜
⎝
⎛
+
+++
++
+++
+=−
−
)nT(t
tT
nTt
2t
t2
2t
t
t1
ttn
tnA t
t
t
)r1(
h)i1(...
)r1(h)i1(
)r1(h)i1(1fP
This expression can be used to compute SNA depreciation, say for the beginning of period 0t as:
(A.3.) ( )( ) ( )t
1tT
0 t
tt0
t1A
t0A hh
r1i1fPP
t
+ττ=τ τ
τ
−+
+=− ∑ .
Related Documents