CENTRAL DISTRICT • KISSIMMEE RIVER BASIN • UPPER KISSIMMEE PLANNING UNIT FINAL TMDL Report Nutrient TMDL for Lake Marian (WBID 3184) Woo-Jun Kang, Ph.D., and Douglas Gilbert Water Quality Evaluation and TMDL Program Division of Environmental Assessment and Restoration Florida Department of Environmental Protection December 2013 2600 Blair Stone Road Mail Station 3575 Tallahassee, FL 32399-2400

Welcome message from author
This document is posted to help you gain knowledge. Please leave a comment to let me know what you think about it! Share it to your friends and learn new things together.
Transcript
CENTRAL DISTRICT • KISSIMMEE RIVER BASIN • UPPER KISSIMMEE PLANNING UNIT
FINAL TMDL Report
Nutrient TMDL for Lake Marian (WBID 3184)
Woo-Jun Kang, Ph.D., and Douglas Gilbert
Water Quality Evaluation and TMDL Program Division of Environmental Assessment and Restoration
Florida Department of Environmental Protection
December 2013
2600 Blair Stone Road Mail Station 3575
Tallahassee, FL 32399-2400

FINAL TMDL Report: Kissimmee River Basin, Lake Marian (WBID 3184), Nutrients, December 2013
Acknowledgments
This analysis could not have been accomplished without the funding support of the Florida Legislature.
Contractual services were provided by Camp Dresser and McKee (CDM) under Contract WM912.
Sincere thanks to CDM for the support provided by Lena Rivera (Project Manager), Silong Lu
(hydrology), and Richard Wagner (water quality). Additionally, significant contributions were made by
staff in the Florida Department of Environmental Protection’s Watershed Assessment Section,
particularly Barbara Donner for Geographic Information System (GIS) support. The Department also
recognizes the substantial support and assistance of its Central District Office, South Florida Water
Management District (SFWMD), Polk County Natural Resource Division, and Osceola County, and
their contributions towards understanding the issues, history, and processes at work in the Lake
Kissimmee Basin.
Editorial assistance was provided by Jan Mandrup-Poulsen and Linda Lord.
For additional information on the watershed management approach and impaired waters in the Upper
Kissimmee River Planning Unit, contact:
Beth Alvi Florida Department of Environmental Protection Bureau of Watershed Restoration Watershed Planning and Coordination Section 2600 Blair Stone Road, Mail Station 3565 Tallahassee, FL 32399-2400 Email: [email protected] Phone: (850) 245–8559 Fax: (850) 245–8434 Access to all data used in the development of this report can be obtained by contacting:
Douglas Gilbert, Environmental Manager Florida Department of Environmental Protection Water Quality Evaluation and TMDL Program Watershed Evaluation and TMDL Section 2600 Blair Stone Road, Mail Station 3555 Tallahassee, FL 32399-2400 Email: [email protected] Phone: (850) 245–8450 Fax: (850) 245–8536
Page ii of xi
FINAL TMDL Report: Kissimmee River Basin, Lake Marian (WBID 3184), Nutrients, December 2013 Woo-Jun Kang Florida Department of Environmental Protection Water Quality Evaluation and TMDL Program Watershed Evaluation and TMDL Section 2600 Blair Stone Road, Mail Station 3555 Tallahassee, FL 32399-2400 Email: [email protected] Phone: (850) 245–8437 Fax: (850) 245–8536
Page iii of xi
FINAL TMDL Report: Kissimmee River Basin, Lake Marian (WBID 3184), Nutrients, December 2013
Contents
CHAPTER 1: INTRODUCTION ............................................................................................................1 1.1 Purpose of Report ....................................................................................................................1 1.2 Identification of Waterbody ....................................................................................................1 1.3 Background Information ........................................................................................................4
CHAPTER 2: STATEMENT OF WATER QUALITY PROBLEM ...................................................5 2.1 Legislative and Rulemaking History .......................................................................................5 2.2 Information on Verified Impairment ......................................................................................5
CHAPTER 3. DESCRIPTION OF APPLICABLE WATER QUALITY STANDARDS AND TARGETS ............................................................................................................16
3.1 Classification of the Waterbody and Criteria Applicable to the TMDL ..............................16 3.2 Interpretation of the Narrative Nutrient Criterion for Lakes ..............................................17 3.3 Narrative Nutrient Criterion Definitions ..............................................................................19
CHAPTER 4: ASSESSMENT OF SOURCES .....................................................................................21 4.1 Overview of Modeling Process ..............................................................................................21 4.2 Potential Sources of Nutrients in the Lake Marian Watershed ..........................................22 4.3 Estimating Point and Nonpoint Source Loadings ...............................................................27
CHAPTER 5: DETERMINATION OF ASSIMILATIVE CAPACITY ...........................................32 5.1 Determination of Loading Capacity .....................................................................................32 5.2 Model Calibration ..................................................................................................................37 5.3 Background Conditions.........................................................................................................60 5.4 Selection of the TMDL Target ..............................................................................................60 5.5 Critical Conditions .................................................................................................................61
CHAPTER 6: DETERMINATION OF THE TMDL..........................................................................63 6.1 Expression and Allocation of the TMDL .............................................................................63 6.2 Load Allocation (LA) .............................................................................................................64 6.3 Wasteload Allocation (WLA) ................................................................................................65 6.4 Margin of Safety (MOS) ........................................................................................................65
CHAPTER 7: NEXT STEPS: IMPLEMENTATION PLAN DEVELOPMENT AND BEYOND ........................................................................................................................67
7.1 Basin Management Action Plan ...........................................................................................67 7.2 Next Steps for TMDL Implementation .................................................................................68 7.3 Restoration Goals ...................................................................................................................69
REFERENCES .........................................................................................................................................71
APPENDICES .........................................................................................................................................75 Appendix A: Background Information on Federal and State Stormwater Programs ..............75
Page iv of xi

FINAL TMDL Report: Kissimmee River Basin, Lake Marian (WBID 3184), Nutrients, December 2013
Appendix B: Electronic Copies of Measured Data and 2008 CDM Report for the Lake Marian TMDL ........................................................................................................77
Appendix C: HSPF Water Quality Calibration Values for Lake Marian .................................78 Appendix D: All Hydrologic Outputs and Model Calibrations for the Impaired Lake
and Its Connected Lakes ........................................................................................79
Page v of xi
FINAL TMDL Report: Kissimmee River Basin, Lake Marian (WBID 3184), Nutrients, December 2013
Tables
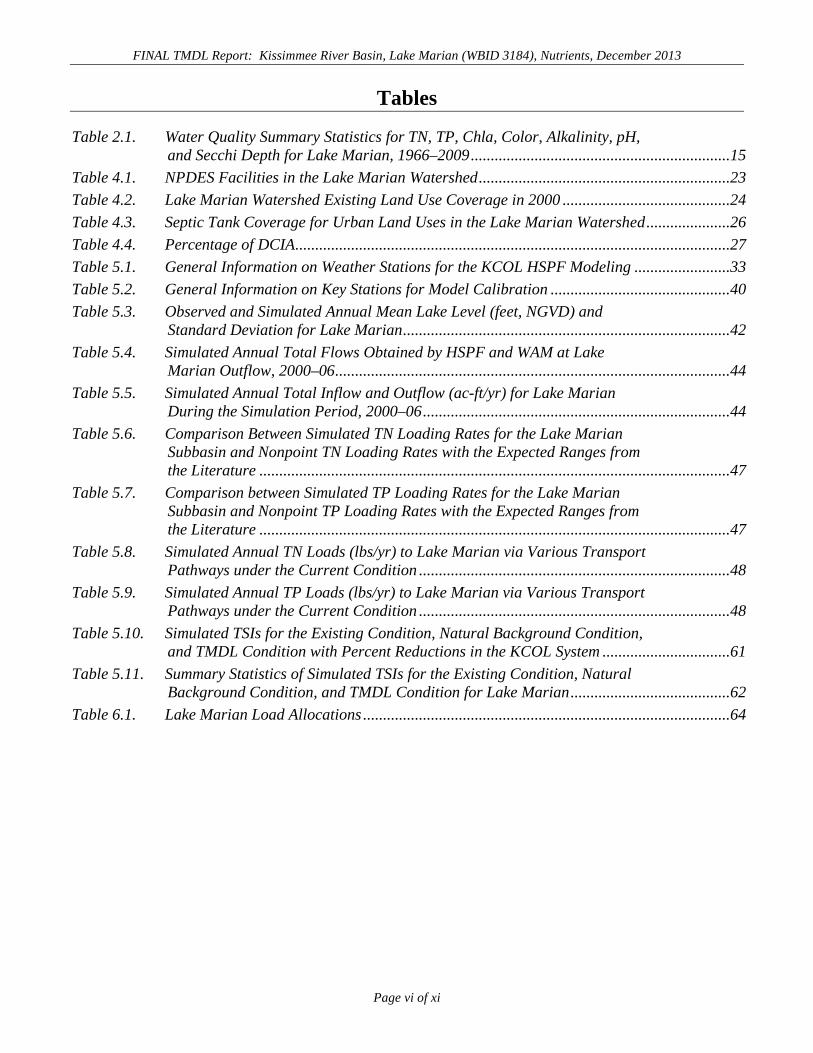
Table 2.1. Water Quality Summary Statistics for TN, TP, Chla, Color, Alkalinity, pH, and Secchi Depth for Lake Marian, 1966–2009 .................................................................15
Table 4.1. NPDES Facilities in the Lake Marian Watershed ...............................................................23 Table 4.2. Lake Marian Watershed Existing Land Use Coverage in 2000 ..........................................24 Table 4.3. Septic Tank Coverage for Urban Land Uses in the Lake Marian Watershed .....................26 Table 4.4. Percentage of DCIA .............................................................................................................27 Table 5.1. General Information on Weather Stations for the KCOL HSPF Modeling ........................33 Table 5.2. General Information on Key Stations for Model Calibration .............................................40 Table 5.3. Observed and Simulated Annual Mean Lake Level (feet, NGVD) and
Standard Deviation for Lake Marian ..................................................................................42 Table 5.4. Simulated Annual Total Flows Obtained by HSPF and WAM at Lake
Marian Outflow, 2000–06 ...................................................................................................44 Table 5.5. Simulated Annual Total Inflow and Outflow (ac-ft/yr) for Lake Marian
During the Simulation Period, 2000–06 .............................................................................44 Table 5.6. Comparison Between Simulated TN Loading Rates for the Lake Marian
Subbasin and Nonpoint TN Loading Rates with the Expected Ranges from the Literature ......................................................................................................................47
Table 5.7. Comparison between Simulated TP Loading Rates for the Lake Marian Subbasin and Nonpoint TP Loading Rates with the Expected Ranges from the Literature ......................................................................................................................47
Table 5.8. Simulated Annual TN Loads (lbs/yr) to Lake Marian via Various Transport Pathways under the Current Condition ..............................................................................48
Table 5.9. Simulated Annual TP Loads (lbs/yr) to Lake Marian via Various Transport Pathways under the Current Condition ..............................................................................48
Table 5.10. Simulated TSIs for the Existing Condition, Natural Background Condition, and TMDL Condition with Percent Reductions in the KCOL System ................................61
Table 5.11. Summary Statistics of Simulated TSIs for the Existing Condition, Natural Background Condition, and TMDL Condition for Lake Marian ........................................62
Table 6.1. Lake Marian Load Allocations ............................................................................................64
Page vi of xi
FINAL TMDL Report: Kissimmee River Basin, Lake Marian (WBID 3184), Nutrients, December 2013
Figures
Figure 1.1. Upper Kissimmee Planning Unit and Lake Marian Watershed ..........................................2 Figure 1.2. Lake Marian (WBID 3184) and Monitoring Stations ..........................................................3 Figure 2.1. Daily Average Color (PCU) for the Period of Record, 1966–2009 ....................................6 Figure 2.2. Annual Average Color (PCU) for the Period of Record, 1966–2009 .................................7 Figure 2.3. Daily Average Alkalinity (milligrams per liter [mg/L]) for the Period of
Record, 1966–2009 .............................................................................................................7 Figure 2.4. Daily Average pH (Standard Units [SU]) for the Period of Record, 1966–
2009.....................................................................................................................................8 Figure 2.5. Daily Average Secchi Depth (meters), 1975–2010 .............................................................8 Figure 2.6. TSI Results for Lake Marian Calculated from Annual Average
Concentrations of TP, TN, and CChla, 1980–2009 ............................................................10 Figure 2.7. TN Daily Average Results for Lake Marian, 1971–2009 ....................................................11 Figure 2.8. TN Annual Average Results for Lake Marian, 1971–2009 .................................................11 Figure 2.9. TN Monthly Average Results for Lake Marian, 1971–2009 ................................................12 Figure 2.10. TP Daily Average Results for Lake Marian, 1970–2009 ....................................................12 Figure 2.11. TP Annual Average Results for Lake Marian, 1970–2009 ..................................................13 Figure 2.12. TP Monthly Average Results for Lake Marian, 1970–2009 ................................................13 Figure 2.13. Chla Daily Average Results for Lake Marian, 1980–2009 .................................................14 Figure 2.14. Chla Annual Average Results for Lake Marian, 1980–2009...............................................14 Figure 2.15. Chla Monthly Average Results for Lake Marian, 1980–2009 .............................................15 Figure 4.1. Lake Marian Watershed Existing Land Use Coverage in 2000 ..........................................25 Figure 5.1. Hourly Observed Air Temperature (°F.) Observed from the FAWN Station,
1998–2009...........................................................................................................................35 Figure 5.2. Hourly Observed Wind Speed (mph) Observed from the FAWN Station,
1998–2009...........................................................................................................................35 Figure 5.3. Hourly Rainfall (inches/hour) for the Lake Marian Subbasin, 1996–2006 ........................36 Figure 5.4. Annual Rainfall (inches/year) for the Lake Marian Subbasin During the
Simulation Period and Long-Term (1909–2009) State Average Annual Rainfall (54 inches/year).....................................................................................................36
Figure 5.5. Observed Versus Simulated Daily Lake Temperature (°C.) in Lake Marian During the Simulation Period, 2000–06 .............................................................................38
Figure 5.6. Monthly Variation of Observed Versus Simulated Daily Lake Temperature (°C.) in Lake Marian During the Selected Simulation Period, January 2003-June 2004 ...................................................................................................................38
Figure 5.7. Daily Measured Versus Simulated Lake Temperature for Lake Marian During the Selected Period, January 2003–June 2004. .....................................................39
Figure 5.8. Time-Series Observed Versus Simulated Lake Stage (feet, National Geodetic Vertical Datum [NGVD]) in Lake Marian During the Simulation Period, 2000–06 ..................................................................................................................41
Page vii of xi
FINAL TMDL Report: Kissimmee River Basin, Lake Marian (WBID 3184), Nutrients, December 2013 Figure 5.9. Daily Point-to-Point Paired Calibration of Lake Level (feet) During the
Simulation Period, 2000–06 (solid line indicates the ideal 1-to-1 line, R represents a correlation coefficient of the best fit between observed and simulated lake levels, and n indicates the number of observations) ...................................42
Figure 5.10. Cumulative Daily Flows Obtained by HSPF and WAM at Lake Marian Outflow, 2000–06 ................................................................................................................43
Figure 5.11. Long-Term (7-year) Averaged Annual Percent Inflows to Lake Marian During the Simulation Period, 2000–06 .............................................................................45
Figure 5.12. Percent TN Contribution to Lake Marian under the Existing Condition During the Simulation Period, 2000–06 .............................................................................49
Figure 5.13. Percent TP Contribution to Lake Marian under the Existing Condition During the Simulation Period, 2000–06 .............................................................................49
Figure 5.14. Relationship Between Rainfall Versus Watershed Annual TN Loads to Lake Marian under the Existing Condition During the Simulation Period, 2000–06...............................................................................................................................50
Figure 5.15. Relationship Between Rainfall Versus Watershed Annual TP Loads to Lake Marian under the Existing Condition During the Simulation Period, 2000–06.........................................................................................................................................50
Figure 5.16. Time-Series of Observed Versus Simulated Daily TN Concentrations in Lake Marian During the Simulation Period, 2000–06 .......................................................55
Figure 5.17. Box and Whisker Plot of Simulated Versus Observed TN in Lake Marian, 2000–06 (red line represents mean concentration of each series) .....................................55
Figure 5.18. Annual Mean Concentrations of Observed Versus Simulated TN in Lake Marian During the Simulation Period, 2000–06 (error bars represent 1-sigma standard deviations) .................................................................................................56
Figure 5.19. Time-Series of Observed Versus Simulated Daily TP Concentrations in Lake Marian During the Simulation Period, 2000–06 .......................................................56
Figure 5.20. Box and Whisker Plot of Simulated Versus Observed TP in Lake Marian, 2000–06 (red line represents mean concentration of each series) .....................................57
Figure 5.21. Annual Mean Concentrations of Observed Versus Simulated TP in Lake Marian during the Simulation Period, 2000–06 (error bars represent 1-sigma standard deviations) .................................................................................................57
Figure 5.22. Time-Series of Observed Versus Simulated Daily CChla Concentrations in Lake Marian During the Simulation Period, 2000–06 .......................................................58
Figure 5.23. Box and Whisker Plot of Simulated Versus Observed CChla in Lake Marian from 2000 to 2006 (red line represents mean concentration of each series) .........................................................................................................................58
Figure 5.24. Annual Mean Concentrations of Observed Versus Simulated CChla in Lake Marian During the Simulation Period, 2000–06 (error bars represent 1-sigma standard deviations)..............................................................................59
Figure 5.25. Observed Versus Simulated Annual TSIs in Lake Marian During the Simulation Period, 2000–06 (solid line indicates TSI threshold of 60) ..............................59
Figure 5.26. Simulated TSIs for the Existing Condition, Natural Background Condition, and TMDL Condition for Lake Marian during the Simulation Period, 2000–06...............................................................................................................................62
Page viii of xi
FINAL TMDL Report: Kissimmee River Basin, Lake Marian (WBID 3184), Nutrients, December 2013 Figure D-1. Observed Versus Simulated Daily Flow (cfs) at Shingle Creek near
Airport, 2000–06 .................................................................................................................79 Figure D-2. Observed Versus Simulated Daily Flow (cfs) at Campbell Station in
Shingle Creek, 2000–06 ......................................................................................................79 Figure D-3. Observed Versus Simulated Daily Flow (cfs) at S59 for East Lake
Tohopekaliga Outflow, 2000–06 .........................................................................................80 Figure D-4. Observed Versus Simulated Daily Flow (cfs) at S61 for Lake Toho
Outflow, 2000–06 ................................................................................................................80 Figure D-5. Observed Versus Simulated Daily Flow (cfs) at S63 for Lake Gentry
Outflow, 2000–06 ................................................................................................................81 Figure D-6. Observed Versus Simulated Daily Flow (cfs) at Reedy Creek Station,
2000–06...............................................................................................................................81 Figure D-7. Observed Versus Simulated Cumulative Daily Flows for Shingle Creek
near Airport, 2000–06 ........................................................................................................82 Figure D-8. Observed Versus Simulated Monthly Flows for Shingle Creek near Airport,
2000–06...............................................................................................................................82 Figure D-9. Relationship Between Observed and Simulated Monthly Flows for Shingle
Creek near Airport, 2000–06 ..............................................................................................83 Figure D-10. Observed Versus Simulated Cumulative Daily Flows for Shingle Creek at
Campbell, 2000–06 .............................................................................................................83 Figure D-11. Observed Versus Simulated Monthly Flows for Shingle Creek at Campbell,
2000–06...............................................................................................................................84 Figure D-12. Relationship Between Observed and Simulated Monthly Flows for Shingle
Creek at Campbell, 2000–06 ..............................................................................................84 Figure D-13. Observed Versus Simulated Cumulative Daily Flows for East Lake
Tohopekaliga Outflow at S59, 2000–06..............................................................................85 Figure D-14. Relationship Between Observed and Simulated Monthly Flows for East
Lake Tohopekaliga Outflow at S59, 2000–06 .....................................................................85 Figure D-15. Observed Versus Simulated Monthly Flows for East Lake Tohopekaliga
Outflow at S59, 2000–06.....................................................................................................86 Figure D-16. Observed Versus Simulated Cumulative Daily Flows for Lake
Tohopekaliga Outflow at S61, 2000–06..............................................................................86 Figure D-17. Relationship Between Observed and Simulated Monthly Flows for Lake
Tohopekaliga Outflow at S61, 2000–06..............................................................................87 Figure D-18. Observed Versus Simulated Monthly Flows for Lake Tohopekaliga Outflow
at S61, 2000–06 ..................................................................................................................87 Figure D-19. Observed Versus Simulated Cumulative Daily Flows for Reedy Creek,
2000–06...............................................................................................................................88 Figure D-20. Relationship Between Observed and Simulated Monthly Flows for Reedy
Creek, 2000–06 ...................................................................................................................88 Figure D-21. Observed Versus Simulated Monthly Flows for Reedy Creek, 2000–06 .............................89 Figure D-22. Observed Versus Simulated Lake Elevation in Lake Tohopekaliga, 2000–
06.........................................................................................................................................89
Page ix of xi
FINAL TMDL Report: Kissimmee River Basin, Lake Marian (WBID 3184), Nutrients, December 2013 Figure D-23. Observed Versus Simulated Lake Elevation in East Lake Tohopekaliga,
2000–06...............................................................................................................................90 Figure D-24. Observed Versus Simulated Lake Elevation in Lake Gentry, 2000–06 ...............................90
Page x of xi
FINAL TMDL Report: Kissimmee River Basin, Lake Marian (WBID 3184), Nutrients, December 2013
Websites
Florida Department of Environmental Protection, Bureau of Watershed Restoration
TMDL Program http://www.dep.state.fl.us/water/tmdl/index.htm Identification of Impaired Surface Waters Rule http://www.dep.state.fl.us/legal/Rules/shared/62-303/62-303.pdf STORET Program http://www.dep.state.fl.us/water/storet/index.htm 2012 Integrated 305(b) Report http://www.dep.state.fl.us/water/docs/2012_integrated_report.pdf Criteria for Surface Water Quality Classifications http://www.dep.state.fl.us/water/wqssp/classes.htm Water Quality Status Report: Kissimmee River/Fisheating Creek http://www.dep.state.fl.us/water/basin411/kissimmee/index.htm Water Quality Assessment Report: Kissimmee River/Fisheating Creek http://www.dep.state.fl.us/water/basin411/kissimmee/index.htm
U.S. Environmental Protection Agency, National STORET Program
http://www.epa.gov/storet/
Page xi of xi

FINAL TMDL Report: Kissimmee River Basin, Lake Marian (WBID 3184), Nutrients, December 2013
Chapter 1: INTRODUCTION
1.1 Purpose of Report This report presents the Total Maximum Daily Load for nutrients for Lake Marian, located in the
Kissimmee River Basin. The TMDL will constitute the site-specific numeric interpretation of the
narrative nutrient criterion pursuant to 62-302.531(2)(a), Florida Administrative Code (F.A.C.). Lake
Marian was initially verified as impaired during Cycle 1 (verified period January 1, 1998, to June 30,
2005) due to excessive nutrients using the methodology in the Identification of Impaired Surface Waters
Rule (IWR) (Rule 62-303, F.A.C.), and was included on the Cycle 1 Verified List of impaired waters for
the Kissimmee River Basin that was adopted by Secretarial Order on May 12, 2006.
Subsequently, during the Cycle 2 assessment (verified period January 1, 2003, to June 30, 2010), the
impairment for nutrients was documented as continuing, as the Trophic State Index (TSI) threshold of
60 was exceeded during both 2003 and 2007. The TMDL establishes the allowable loadings to the lake
that would restore the waterbody so that it meets its applicable water quality narrative criterion for
nutrients.
1.2 Identification of Waterbody Lake Marian is located in Osceola County, Florida. The estimated average surface area of the lake is
6,553 acres, with a normal pool volume of 46,819 acre-feet (ac-ft) and an average depth of 13 feet.
Lake Marian is an open hydrologic system that receives drainage from a directly connected area of
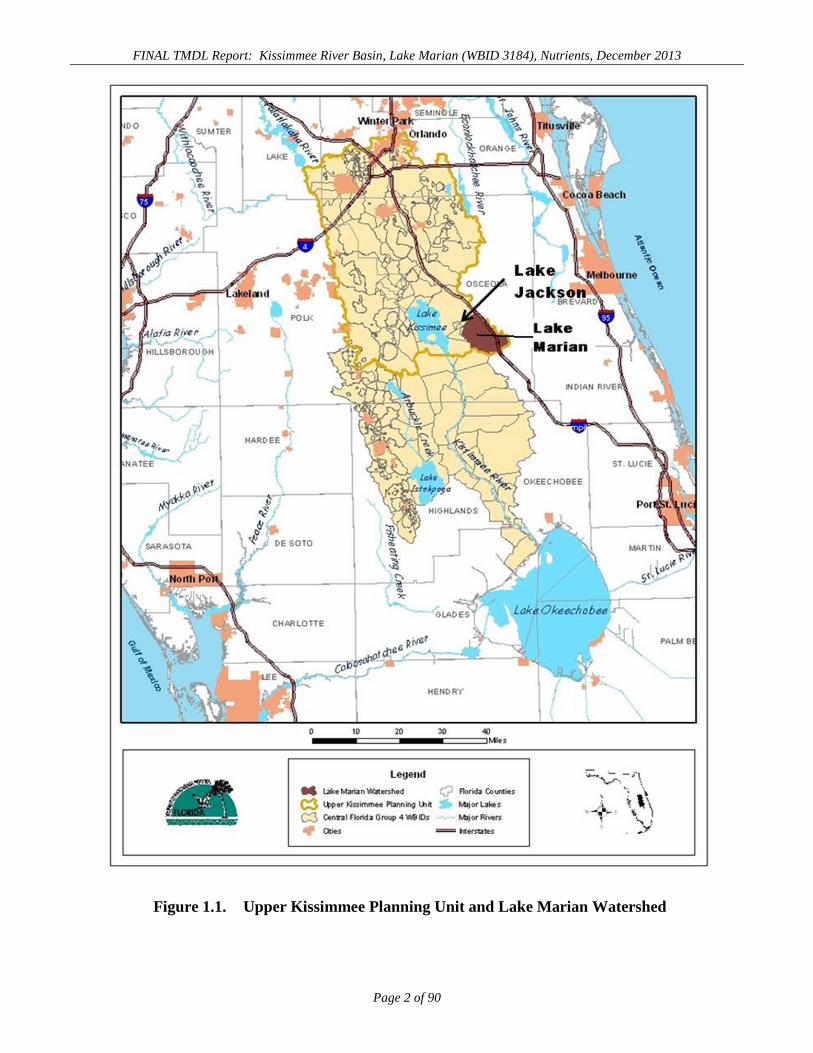
approximately 35,437 acres (Figure 1.1). The Lake Marian watershed’s land use designations are
primarily agriculture (43%), wetland (21.2%), pastureland (23.2%), and rangeland/upland forest
(10.9%). Lake Marian receives runoff from the local basin and discharges to Lake Jackson, which
discharges to Lake Kissimmee. Lake Kissimmee discharges to the Kissimmee River.
For assessment purposes, the Florida Department of Environmental Protection has divided the
Kissimmee River Basin into water assessment polygons with a unique waterbody identification (WBID)
number for each watershed or stream reach. Lake Marian is WBID 3184.
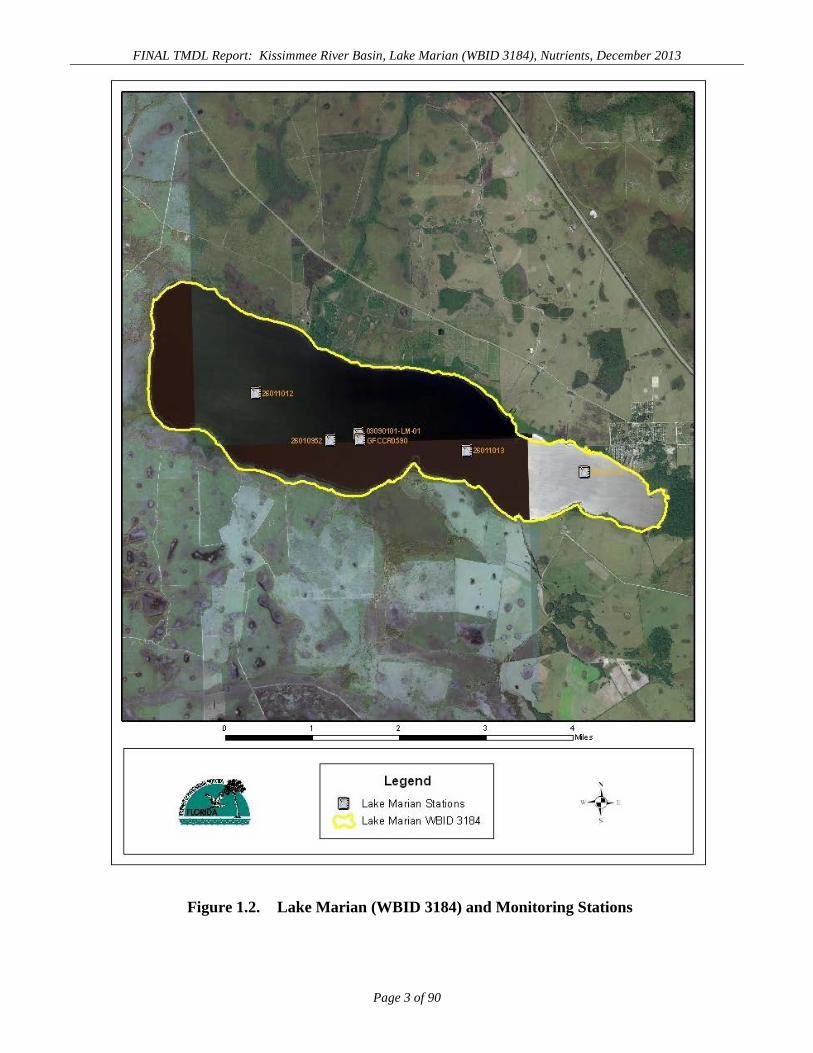
Figure 1.2 shows the location of the Lake Marian WBID and its sampling/monitoring stations.
Page 1 of 90
FINAL TMDL Report: Kissimmee River Basin, Lake Marian (WBID 3184), Nutrients, December 2013
Figure 1.1. Upper Kissimmee Planning Unit and Lake Marian Watershed
Page 2 of 90
FINAL TMDL Report: Kissimmee River Basin, Lake Marian (WBID 3184), Nutrients, December 2013
Figure 1.2. Lake Marian (WBID 3184) and Monitoring Stations
Page 3 of 90
FINAL TMDL Report: Kissimmee River Basin, Lake Marian (WBID 3184), Nutrients, December 2013
1.3 Background Information As depicted in Figure 1.1, the Lake Marian watershed has a total surface water drainage area of
approximately 35,437 acres. The water in Lake Marian discharges to Lake Jackson, which flows into
Lake Kissimmee. Thus, water quality and quantity in Lake Marian directly influence the water quality
and quantity of these downstream receiving waterbodies, and ultimately the Kissimmee River (Figure
1.1).
The TMDL report for Lake Marian is part of the implementation of the Department’s watershed
management approach for restoring and protecting water resources and addressing TMDL Program
requirements. The watershed approach, which is implemented using a cyclical management process that
rotates through the state’s 52 river basins over a 5-year cycle, provides a framework for implementing
the requirements of the 1972 federal Clean Water Act and the 1999 Florida Watershed Restoration Act
(FWRA) (Chapter 99-223, Laws of Florida).
A TMDL represents the maximum amount of a given pollutant that a waterbody can assimilate and still
meet the waterbody’s designated uses. A waterbody that does not meet its designated uses is defined as
impaired. TMDLs must be developed and implemented for each of the state’s impaired waters, unless
the impairment is documented to be a naturally occurring condition that cannot be abated by a TMDL or
unless a management plan already in place is expected to correct the problem.
This TMDL Report will be followed by the development and implementation of a restoration plan to
reduce the amount of pollutants that caused the verified impairment. These activities will depend
heavily on the active participation of Osceola County, the South Florida Water Management District
(SFWMD), local governments, local businesses, and other stakeholders. The Department will work
with these organizations and individuals to undertake or continue reductions in the discharge of
pollutants and achieve the established TMDLs for the impaired lake.
Page 4 of 90
FINAL TMDL Report: Kissimmee River Basin, Lake Marian (WBID 3184), Nutrients, December 2013
Chapter 2: STATEMENT OF WATER QUALITY PROBLEM
2.1 Legislative and Rulemaking History Section 303(d) of the federal Clean Water Act requires states to submit to the U.S. Environmental
Protection Agency (EPA) a list of surface waters that do not meet applicable water quality standards
(impaired waters) and establish a TMDL for each pollutant causing the impairment of the listed waters
on a schedule. The Department has developed such lists, commonly referred to as 303(d) lists, since
1992. The list of impaired waters in each basin, referred to as the Verified List, is also required by the
FWRA (Subsection 403.067[4], Florida Statutes [F.S.]), and the state’s 303(d) list is amended annually
to include basin updates.
Lake Marian was on Florida’s 1998 303(d) list. However, the FWRA (Section 403.067, F.S.) stated that
all previous Florida 303(d) lists were for planning purposes only and directed the Department to
develop, and adopt by rule, a new science-based methodology to identify impaired waters. The
Environmental Regulation Commission adopted the new methodology as Rule 62-303, F.A.C.
(Identification of Impaired Surface Waters Rule, or IWR), in April 2001; the rule was amended in 2006
and January 2007.
2.2 Information on Verified Impairment The Department used the IWR to assess water quality impairments in Lake Marian. All data presented
in this report are from IWR Run 41. Data reduction followed the procedures in Rule 62-303, F.A.C.
Data were further reduced by calculating daily averages. These are the data from which graphs and
summary statistics were prepared. The annual averages were calculated from these data by averaging
for each calendar quarter and then averaging the four quarters to determine the annual average. The lake
was verified as impaired for nutrients based on an elevated annual average Trophic State Index (TSI)
value over the Cycle 1 verified period for the Group 4 basins, which was January 1, 1998, to June 30,
2005). The impaired condition was documented as still present during the Cycle 2 verified period from
January 1, 2003, to June 30, 2010.
The IWR methodology uses the water quality variables total nitrogen (TN), total phosphorus (TP), and
chlorophyll a (chla) (a measure of algal mass, corrected and uncorrected) in calculating annual TSI
values and in interpreting Florida’s narrative nutrient threshold. For Lake Marian, data were available
for the three water quality variables for all four seasons in 1998, 1999, 2000, 2002, 2003, and 2007 of
the Cycle 1 and Cycle 2 verified periods. The resulting annual average TSI values for these years are
Page 5 of 90
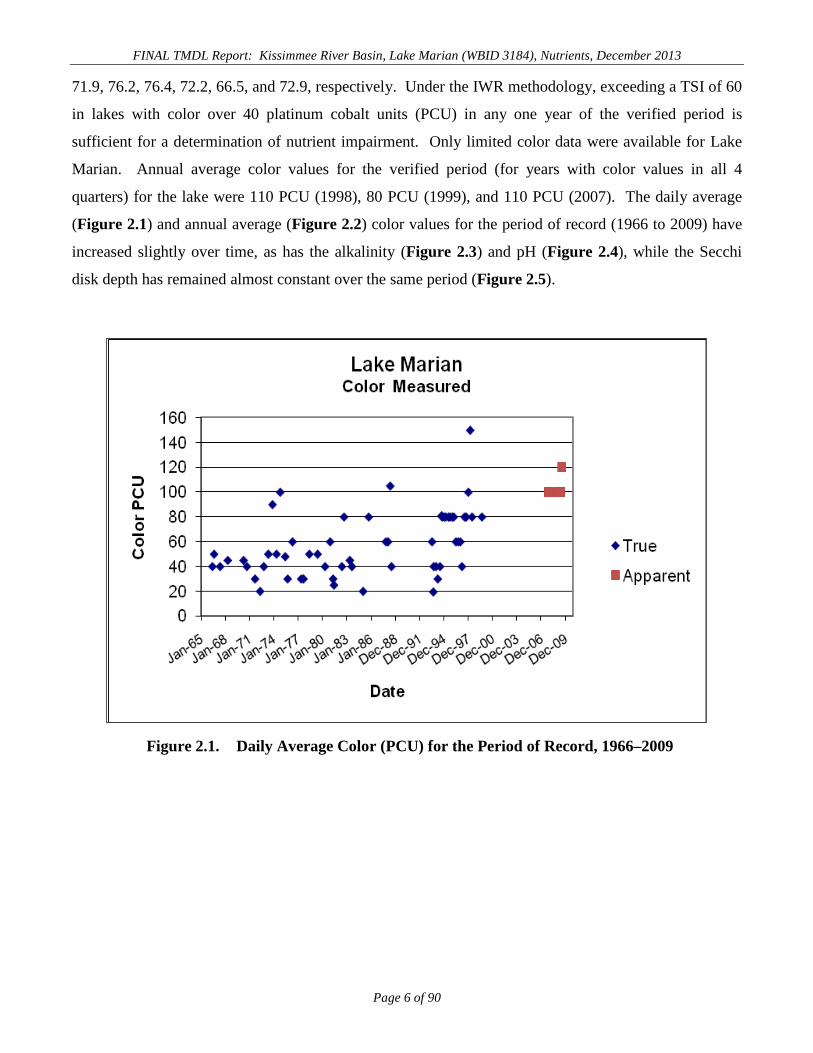
FINAL TMDL Report: Kissimmee River Basin, Lake Marian (WBID 3184), Nutrients, December 2013 71.9, 76.2, 76.4, 72.2, 66.5, and 72.9, respectively. Under the IWR methodology, exceeding a TSI of 60
in lakes with color over 40 platinum cobalt units (PCU) in any one year of the verified period is
sufficient for a determination of nutrient impairment. Only limited color data were available for Lake
Marian. Annual average color values for the verified period (for years with color values in all 4
quarters) for the lake were 110 PCU (1998), 80 PCU (1999), and 110 PCU (2007). The daily average
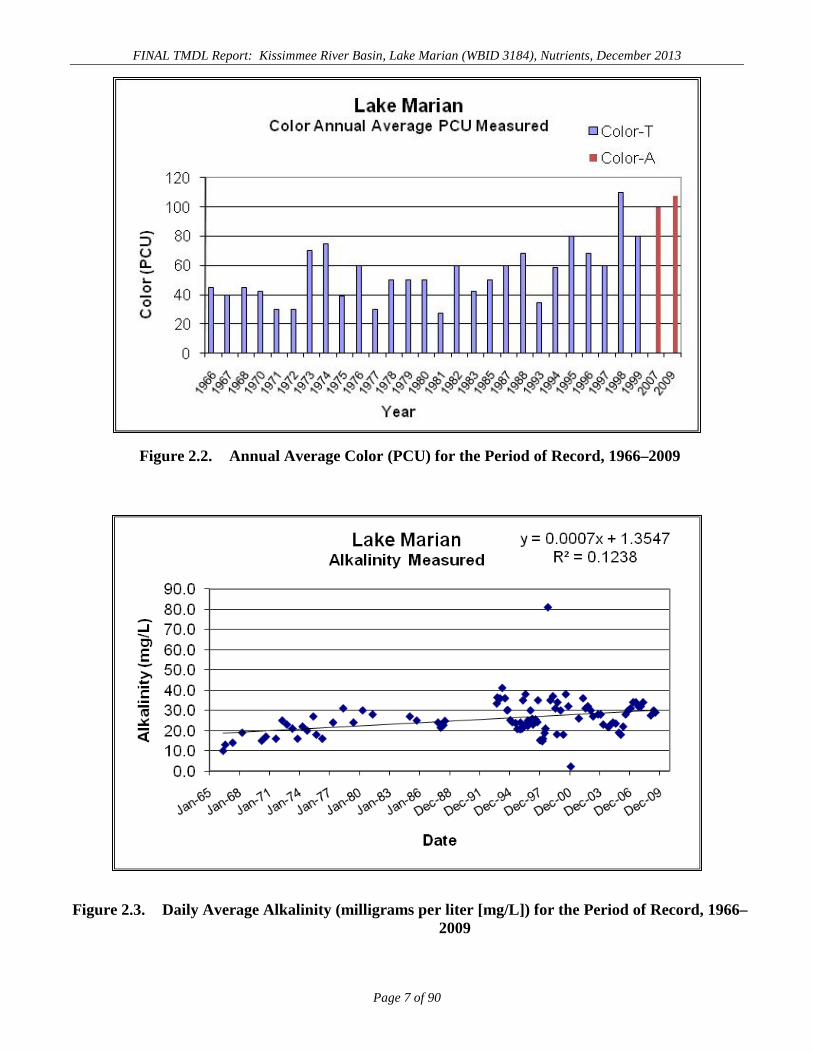
(Figure 2.1) and annual average (Figure 2.2) color values for the period of record (1966 to 2009) have
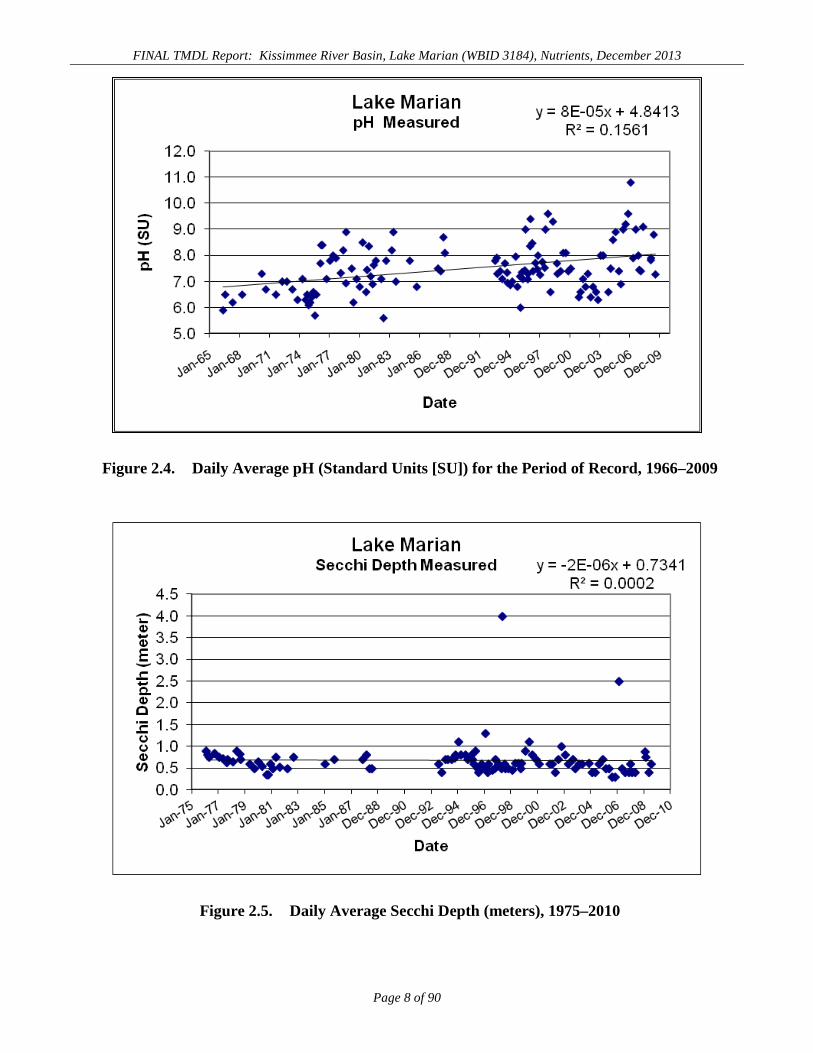
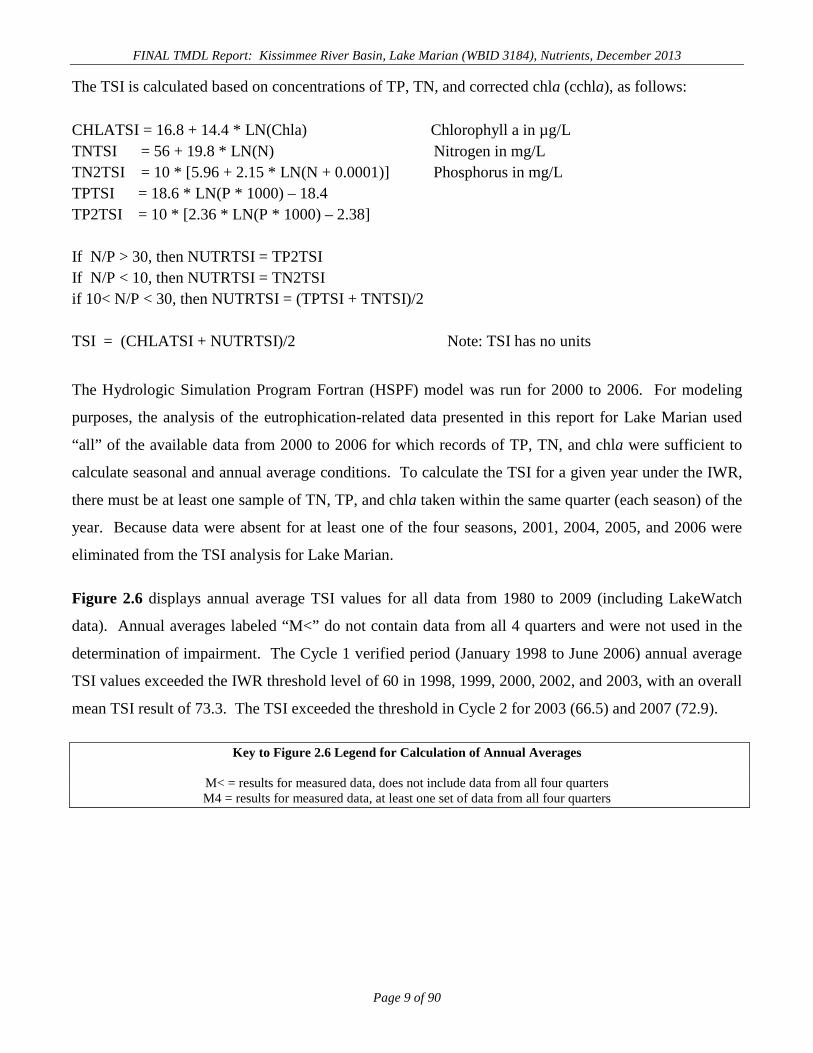
increased slightly over time, as has the alkalinity (Figure 2.3) and pH (Figure 2.4), while the Secchi
disk depth has remained almost constant over the same period (Figure 2.5).
Figure 2.1. Daily Average Color (PCU) for the Period of Record, 1966–2009
Page 6 of 90
FINAL TMDL Report: Kissimmee River Basin, Lake Marian (WBID 3184), Nutrients, December 2013
Figure 2.2. Annual Average Color (PCU) for the Period of Record, 1966–2009
Figure 2.3. Daily Average Alkalinity (milligrams per liter [mg/L]) for the Period of Record, 1966–2009
Page 7 of 90
FINAL TMDL Report: Kissimmee River Basin, Lake Marian (WBID 3184), Nutrients, December 2013
Figure 2.4. Daily Average pH (Standard Units [SU]) for the Period of Record, 1966–2009
Figure 2.5. Daily Average Secchi Depth (meters), 1975–2010
Page 8 of 90
FINAL TMDL Report: Kissimmee River Basin, Lake Marian (WBID 3184), Nutrients, December 2013 The TSI is calculated based on concentrations of TP, TN, and corrected chla (cchla), as follows:
CHLATSI = 16.8 + 14.4 * LN(Chla) Chlorophyll a in µg/L TNTSI = 56 + 19.8 * LN(N) Nitrogen in mg/L TN2TSI = 10 * [5.96 + 2.15 * LN(N + 0.0001)] Phosphorus in mg/L TPTSI = 18.6 * LN(P * 1000) – 18.4 TP2TSI = 10 * [2.36 * LN(P * 1000) – 2.38] If N/P > 30, then NUTRTSI = TP2TSI If N/P < 10, then NUTRTSI = TN2TSI if 10< N/P < 30, then NUTRTSI = (TPTSI + TNTSI)/2 TSI = (CHLATSI + NUTRTSI)/2 Note: TSI has no units The Hydrologic Simulation Program Fortran (HSPF) model was run for 2000 to 2006. For modeling
purposes, the analysis of the eutrophication-related data presented in this report for Lake Marian used
“all” of the available data from 2000 to 2006 for which records of TP, TN, and chla were sufficient to
calculate seasonal and annual average conditions. To calculate the TSI for a given year under the IWR,
there must be at least one sample of TN, TP, and chla taken within the same quarter (each season) of the
year. Because data were absent for at least one of the four seasons, 2001, 2004, 2005, and 2006 were
eliminated from the TSI analysis for Lake Marian.
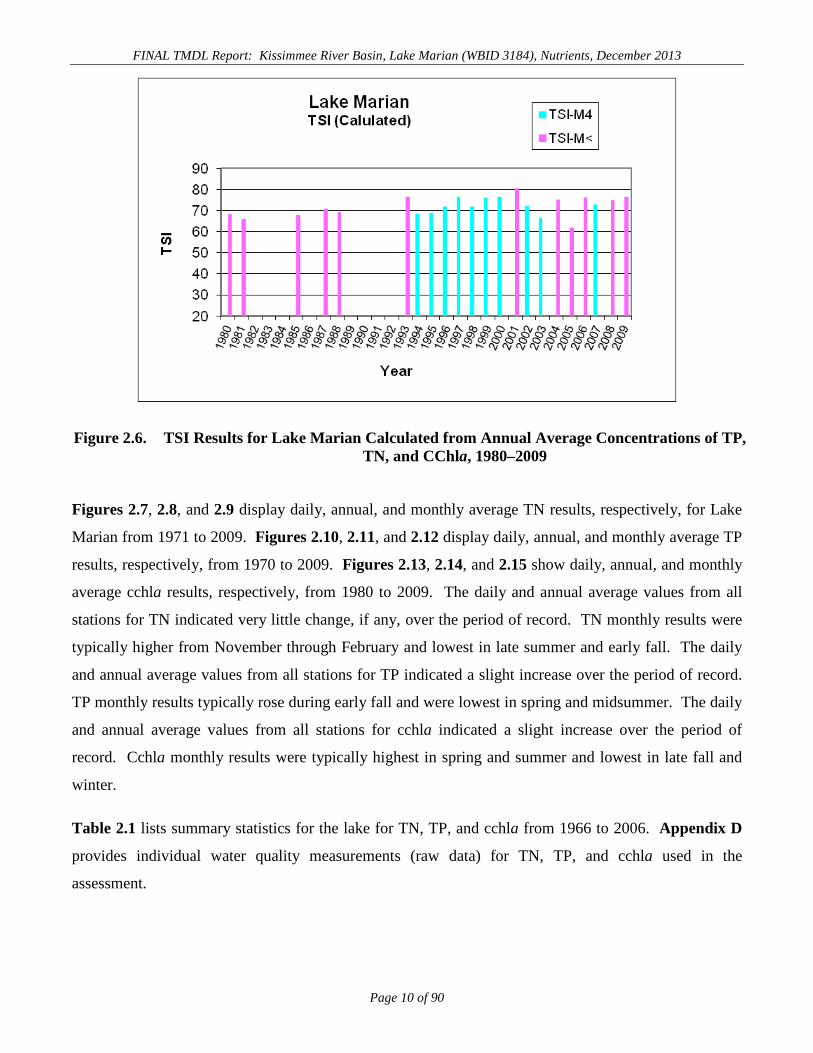
Figure 2.6 displays annual average TSI values for all data from 1980 to 2009 (including LakeWatch
data). Annual averages labeled “M<” do not contain data from all 4 quarters and were not used in the
determination of impairment. The Cycle 1 verified period (January 1998 to June 2006) annual average
TSI values exceeded the IWR threshold level of 60 in 1998, 1999, 2000, 2002, and 2003, with an overall
mean TSI result of 73.3. The TSI exceeded the threshold in Cycle 2 for 2003 (66.5) and 2007 (72.9).
Key to Figure 2.6 Legend for Calculation of Annual Averages
M< = results for measured data, does not include data from all four quarters M4 = results for measured data, at least one set of data from all four quarters
Page 9 of 90
FINAL TMDL Report: Kissimmee River Basin, Lake Marian (WBID 3184), Nutrients, December 2013
Figure 2.6. TSI Results for Lake Marian Calculated from Annual Average Concentrations of TP, TN, and CChla, 1980–2009
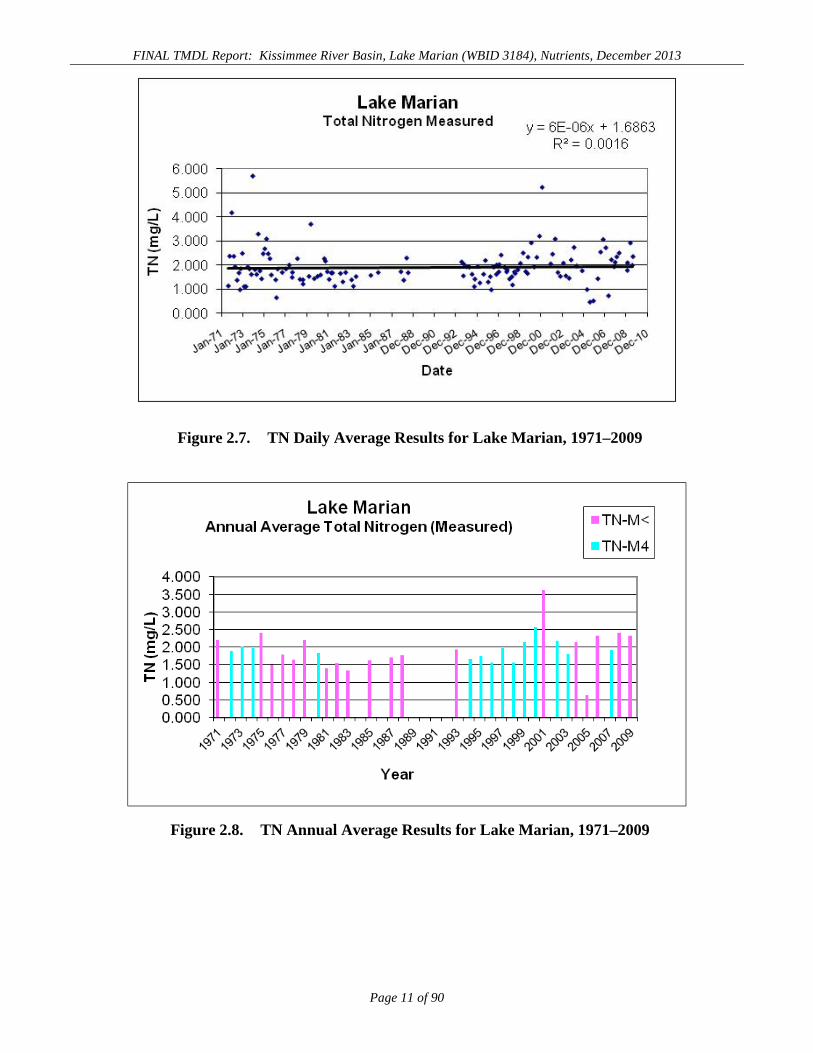
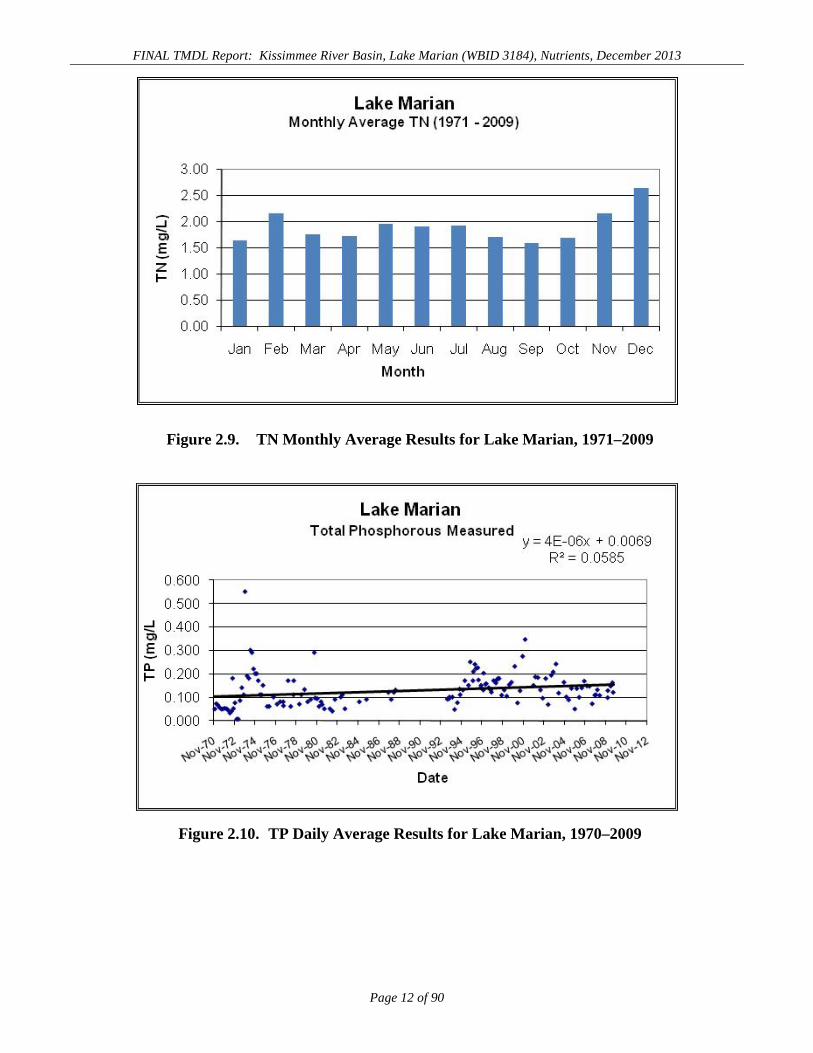
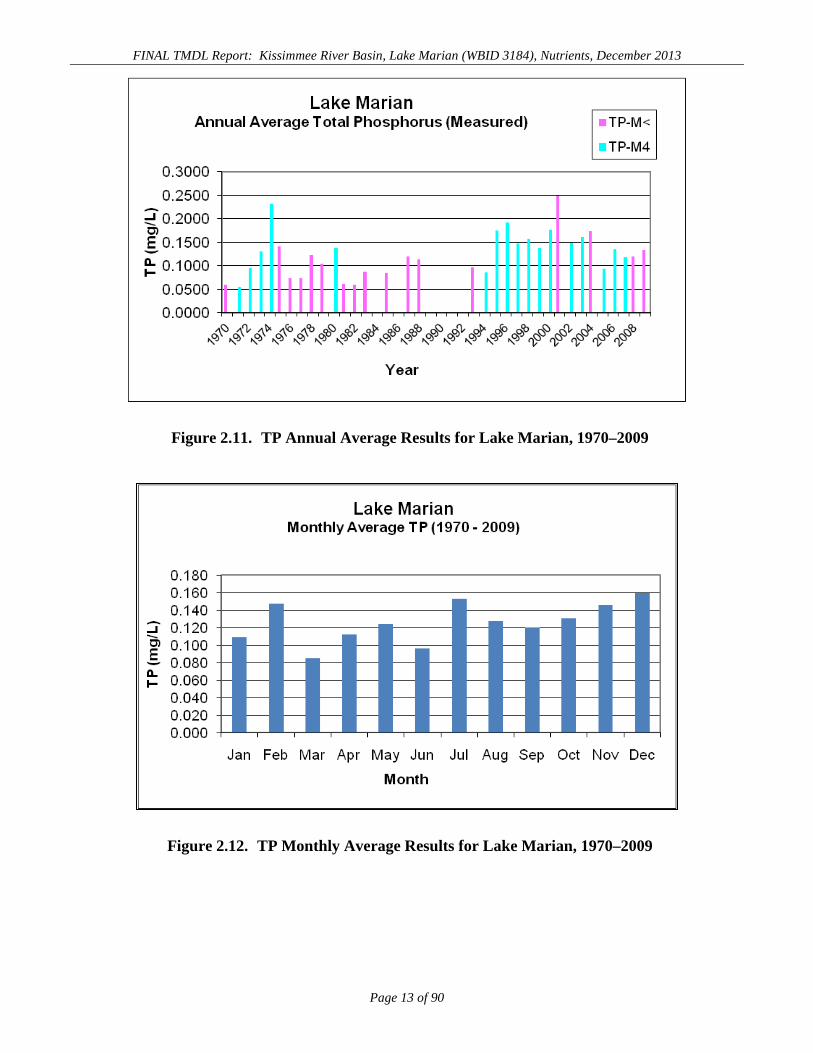
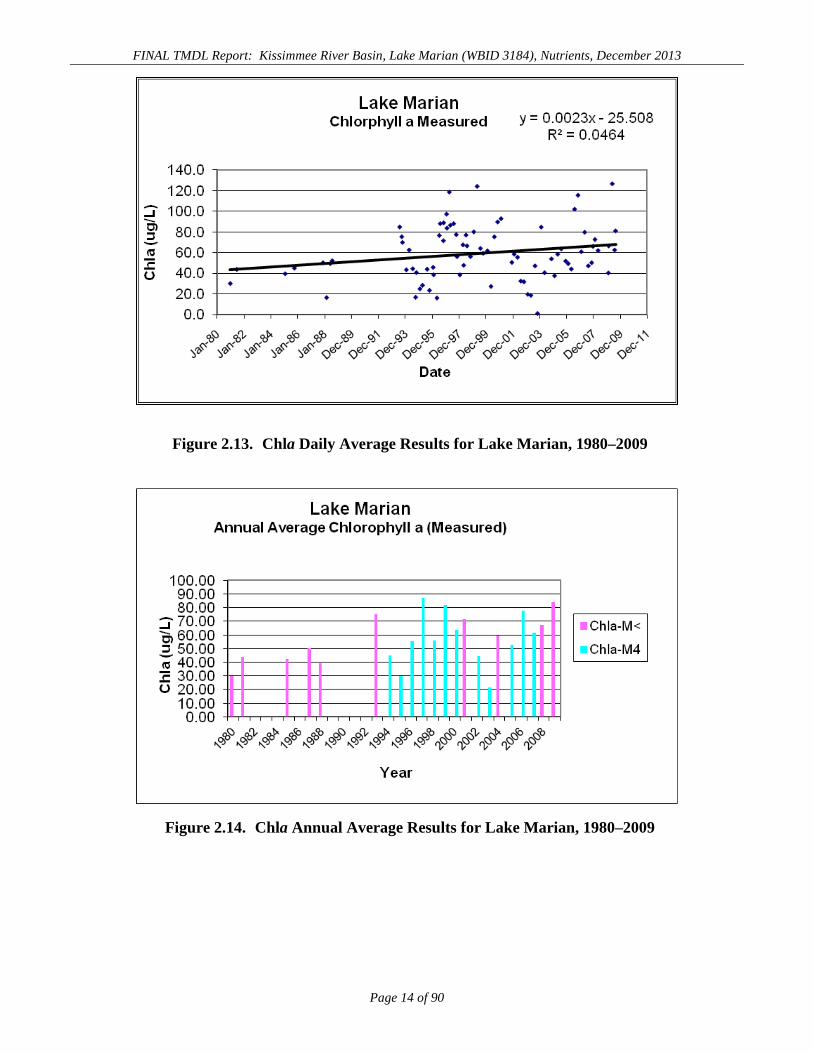
Figures 2.7, 2.8, and 2.9 display daily, annual, and monthly average TN results, respectively, for Lake
Marian from 1971 to 2009. Figures 2.10, 2.11, and 2.12 display daily, annual, and monthly average TP
results, respectively, from 1970 to 2009. Figures 2.13, 2.14, and 2.15 show daily, annual, and monthly
average cchla results, respectively, from 1980 to 2009. The daily and annual average values from all
stations for TN indicated very little change, if any, over the period of record. TN monthly results were
typically higher from November through February and lowest in late summer and early fall. The daily
and annual average values from all stations for TP indicated a slight increase over the period of record.
TP monthly results typically rose during early fall and were lowest in spring and midsummer. The daily
and annual average values from all stations for cchla indicated a slight increase over the period of
record. Cchla monthly results were typically highest in spring and summer and lowest in late fall and
winter.
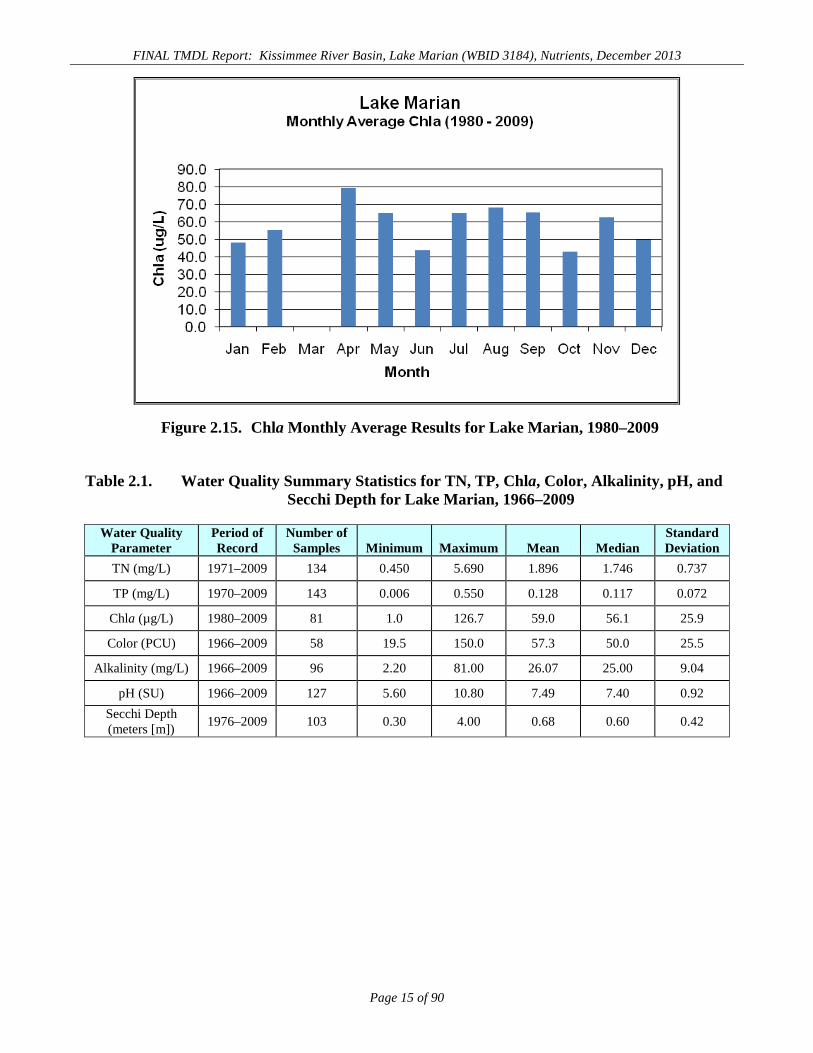
Table 2.1 lists summary statistics for the lake for TN, TP, and cchla from 1966 to 2006. Appendix D
provides individual water quality measurements (raw data) for TN, TP, and cchla used in the
assessment.
Page 10 of 90
FINAL TMDL Report: Kissimmee River Basin, Lake Marian (WBID 3184), Nutrients, December 2013
Figure 2.7. TN Daily Average Results for Lake Marian, 1971–2009
Figure 2.8. TN Annual Average Results for Lake Marian, 1971–2009
Page 11 of 90
FINAL TMDL Report: Kissimmee River Basin, Lake Marian (WBID 3184), Nutrients, December 2013
Figure 2.9. TN Monthly Average Results for Lake Marian, 1971–2009
Figure 2.10. TP Daily Average Results for Lake Marian, 1970–2009
Page 12 of 90
FINAL TMDL Report: Kissimmee River Basin, Lake Marian (WBID 3184), Nutrients, December 2013
Figure 2.11. TP Annual Average Results for Lake Marian, 1970–2009
Figure 2.12. TP Monthly Average Results for Lake Marian, 1970–2009
Page 13 of 90
FINAL TMDL Report: Kissimmee River Basin, Lake Marian (WBID 3184), Nutrients, December 2013
Figure 2.13. Chla Daily Average Results for Lake Marian, 1980–2009
Figure 2.14. Chla Annual Average Results for Lake Marian, 1980–2009
Page 14 of 90
FINAL TMDL Report: Kissimmee River Basin, Lake Marian (WBID 3184), Nutrients, December 2013
Figure 2.15. Chla Monthly Average Results for Lake Marian, 1980–2009
Table 2.1. Water Quality Summary Statistics for TN, TP, Chla, Color, Alkalinity, pH, and Secchi Depth for Lake Marian, 1966–2009
Water Quality Parameter
Period of Record
Number of Samples Minimum Maximum Mean Median
Standard Deviation
TN (mg/L) 1971–2009 134 0.450 5.690 1.896 1.746 0.737
TP (mg/L) 1970–2009 143 0.006 0.550 0.128 0.117 0.072
Chla (µg/L) 1980–2009 81 1.0 126.7 59.0 56.1 25.9
Color (PCU) 1966–2009 58 19.5 150.0 57.3 50.0 25.5
Alkalinity (mg/L) 1966–2009 96 2.20 81.00 26.07 25.00 9.04
pH (SU) 1966–2009 127 5.60 10.80 7.49 7.40 0.92 Secchi Depth (meters [m]) 1976–2009 103 0.30 4.00 0.68 0.60 0.42
Page 15 of 90
FINAL TMDL Report: Kissimmee River Basin, Lake Marian (WBID 3184), Nutrients, December 2013
Chapter 3. DESCRIPTION OF APPLICABLE WATER QUALITY
STANDARDS AND TARGETS
3.1 Classification of the Waterbody and Criteria Applicable to the TMDL Florida’s surface water is protected for five designated use classifications, as follows:
Class I Potable water supplies Class II Shellfish propagation or harvesting Class III Recreation, propagation, and maintenance of a healthy, well-balanced
population of fish and wildlife Class IV Agricultural water supplies Class V Navigation, utility, and industrial use (there are no state waters currently in this
class) Lake Marian is classified as a Class III freshwater waterbody, with a designated use of recreation,
propagation, and maintenance of a healthy, well-balanced population of fish and wildlife. The Class III
water quality criterion applicable to the observed impairment for Lake Marian is the state of Florida’s
narrative nutrient criterion (Paragraph 62-302.530[48][b], F.A.C.). This TMDL will constitute the site-
specific numeric interpretation of the narrative nutrient criterion pursuant to 62-302.531(2)(a), F.A.C.,
which states:
(2) The narrative water quality criterion for nutrients in paragraph 62-302.530(47)(b), F.A.C., shall be numerically interpreted for both nutrients and nutrient response variables in a hierarchical manner as follows:
(a) Where a site specific numeric interpretation of the criterion in paragraph 62-302.530(47)(b), F.A.C., has been established by the Department, this numeric interpretation shall be the primary interpretation. If there are multiple interpretations of the narrative criterion for a waterbody, the most recent interpretation established by the Department shall apply. A list of the site specific numeric interpretations of paragraph 62-302.530(47)(b), F.A.C., may be obtained from the Department’s internet site at http://www.dep.state.fl.us/water/wqssp/swq-docs.htm or by writing to the Florida Department of Environmental Protection, Standards and Assessment Section, 2600 Blair Stone Road, MS 6511, Tallahassee, FL 32399-2400.
1. The primary site specific interpretations are as follows: a. Total Maximum Daily Loads (TMDLs) adopted under Chapter 62-304, F.A.C., that
interpret the narrative water quality criterion for nutrients in paragraph 62-302.530(47)(b), F.A.C., for one or more nutrients or nutrient response variables;
b. Site specific alternative criteria (SSAC) for one or more nutrients or nutrient response variables as established under Rule 62-302.800, F.A.C.;
Page 16 of 90
FINAL TMDL Report: Kissimmee River Basin, Lake Marian (WBID 3184), Nutrients, December 2013
c. Estuary-specific numeric interpretations of the narrative nutrient criterion established in Rule 62-302.532, F.A.C.; or
d. Other site specific interpretations for one or more nutrients or nutrient response variables that are formally established by rule or final order by the Department, such as a Reasonable Assurance Demonstration pursuant to Rule 62-303.600, F.A.C., or Level II Water Quality Based Effluent Limitations (WQBEL) established pursuant to Rule 62-650.500, F.A.C. To be recognized as the applicable site specific numeric interpretation of the narrative nutrient criterion, the interpretation must establish the total allowable load or ambient concentration for at least one nutrient that results in attainment of the applicable nutrient response variable that represents achievement of the narrative nutrient criterion for the waterbody. A site specific interpretation is also allowable where there are documented adverse biological effects using one or more Biological Health Assessments, if information on chlorophyll a levels, algal mats or blooms, nuisance macrophyte growth, and changes in algal species composition indicate there are no imbalances in flora and a stressor identification study demonstrates that the adverse biological effects are not due to nutrients.
3.2 Interpretation of the Narrative Nutrient Criterion for Lakes To place a waterbody segment on the Verified List for nutrients, the Department must identify the
limiting nutrient or nutrients causing impairment, as required by the IWR. The following method was
used to identify the limiting nutrient(s) in streams and lakes:
The individual ratios over the entire verified periods for Cycle 1 (i.e., January 1, 1998, to June 30, 2005) and Cycle 2 (i.e., January 1, 2003, to June 30, 2010) were evaluated to determine the limiting nutrient(s). If all the sampling event ratios were less than 10, nitrogen was identified as the limiting nutrient, and if all the ratios were greater than 30, phosphorus was identified as the limiting nutrient. Both nitrogen and phosphorus were identified as limiting nutrients if the ratios were between 10 and 30. Although for 1998 and 2005, the lake was nitrogen limited; the mean TN/TP ratio was 14.2 for the Cycle 1 and Cycle 2 periods, indicating co-limitation of TP and TN for the lake.
Florida’s nutrient criterion is narrative only, i.e., nutrient concentrations of a body of water shall not be
altered so as to cause an imbalance in natural populations of aquatic flora or fauna. Accordingly, a
nutrient-related target was needed to represent levels at which an imbalance in flora or fauna is expected
to occur. While the IWR provides a threshold for nutrient impairment for lakes based on annual average
TSI levels, these thresholds are not standards and are not required to be used as the nutrient-related
water quality target for TMDLs. In recognition that the IWR thresholds were developed using statewide
average conditions, the IWR (Section 62-303.450, F.A.C.) specifically allows the use of alternative, site-
Page 17 of 90
FINAL TMDL Report: Kissimmee River Basin, Lake Marian (WBID 3184), Nutrients, December 2013 specific thresholds that more accurately reflect conditions beyond which an imbalance in flora or fauna
occurs in the waterbody.
The TSI originally developed by R.E. Carlson (1977) was calculated based on Secchi depth, chlorophyll
concentration, and TP concentration, and was used to describe a lake’s trophic state. It assumed that the
lakes were all phosphorus limited. In Florida, because the local geology has produced a phosphorus-rich
soil, nitrogen can be the sole or co-limiting factor for phytoplankton population in some lakes. In
addition, because of the existence of dark-water lakes in the state, using Secchi depth as an index to
represent lake trophic state can produce misleading results.
Therefore, the TSI was revised to be based on TN, TP, and chla concentrations. This revised calculation
for TSI now contains options for determining a TN-TSI, TP-TSI, and chla-TSI. As a result, there are
three different ways of calculating a final in-lake TSI. If the TN to TP ratio is equal to or greater than
30, the lake is considered phosphorus limited, and the final TSI is the average of the TP-TSI and the
chla-TSI. If the TN to TP ratio is 10 or less, the lake is considered nitrogen limited, and the final TSI is
the average of the TN-TSI and the chla-TSI. If the TN to TP ratio is between 10 and 30, the lake is
considered co-limited, and the final TSI is the result of averaging the chla-TSI with the average of the
TN- and TP-TSIs.
The Florida-specific TSI was determined based on the analysis of data from 313 Florida lakes. The
index was adjusted so that a chla concentration of 20 µg/L was equal to a chla-TSI value of 60. The
final TSI for any lake may be higher or lower than 60, depending on the TN- and TP-TSI values. A TSI
of 60 was then set as the threshold for nutrient impairment for most lakes (for those with color higher
than 40 PCU) because, generally, phytoplankton communities may become dominated by blue-green
algae at chla levels above 20 µg/L. These blue-green algae are often an undesirable food source for
zooplankton and many other aquatic animals. Some blue-green algae may even produce toxins, which
could be harmful to fish and other animals. In addition, excessive phytoplankton growth and the
subsequent death of these algae may consume large quantities of dissolved oxygen (DO) and result in
anaerobic conditions in a lake, making conditions unfavorable for fish and other wildlife. All of these
processes may negatively impact the health and balance of native fauna and flora.
Because of the amazing diversity and productivity of Florida lakes, almost all lakes have a natural
background TSI that is different from 60. In recognition of this natural variation, the IWR allows for the
use of a lower TSI (40) in very clear lakes, a higher TSI if paleolimnological data indicate the lake was
Page 18 of 90
FINAL TMDL Report: Kissimmee River Basin, Lake Marian (WBID 3184), Nutrients, December 2013 naturally above 60, and the development of site-specific thresholds that better represent the levels at
which nutrient impairment occurs.
For the Lake Marian TMDL, the Department applied the HSPF model to simulate water quality
discharges and eutrophication (or accelerated aging) processes, in order to determine the appropriate
nutrient target. The model was used to estimate existing conditions in the Lake Marian watershed and
the background TSI by setting land uses to natural or forested land, and then comparing the resulting
TSI with the IWR thresholds. If the background TSI could be reliably determined and represented an
appropriate target for TMDL development, then an increase of 5 TSI units above background would be
used as the water quality target for the TMDL. Otherwise, the IWR threshold TSI of 60 would be
established as the target for TMDL development.
3.3 Narrative Nutrient Criterion Definitions
3.3.1 Chlorophyll a
Chlorophyll is a green pigment found in plants and is an essential component in the process of
converting light energy into chemical energy. Chlorophyll is capable of channeling the energy of
sunlight into chemical energy through the process of photosynthesis. In photosynthesis, the energy
absorbed by chlorophyll transforms carbon dioxide and water into carbohydrates and oxygen. The
chemical energy stored by photosynthesis in carbohydrates drives biochemical reactions in nearly all
living organisms. Thus, chlorophyll is at the center of the photosynthetic oxidation-reduction reaction
between carbon dioxide and water.
There are several types of chlorophyll; however, the predominant form is chla. The measurement of
chla in a water sample is a useful indicator of phytoplankton biomass, especially when used in
conjunction with the analysis of algal growth potential and species abundance. Typically, the greater the
abundance of chla in a waterbody, the greater the abundance of algae. Algae are the primary producers
in the aquatic food web and thus are very important in characterizing the productivity of lakes and
streams. As noted earlier, chla measurements are also used to estimate the trophic conditions of lakes
and lentic waters.
3.3.2 Nitrogen Total as N (TN)
TN is the combined measurement of nitrate (NO3), nitrite (NO2), ammonia, and organic nitrogen found
in water. Nitrogen compounds function as important nutrients to many aquatic organisms and are
essential to the chemical processes that take place between land, air, and water. The most readily Page 19 of 90
FINAL TMDL Report: Kissimmee River Basin, Lake Marian (WBID 3184), Nutrients, December 2013 bioavailable forms of nitrogen are ammonia and nitrate. These compounds, in conjunction with other
nutrients, serve as an important base for primary productivity.
The major sources of excessive amounts of nitrogen in surface water are the effluent from municipal
treatment plants and runoff from urban and agricultural sites. When nutrient concentrations consistently
exceed natural levels, the resulting nutrient imbalance can cause undesirable changes in a waterbody’s
biological community and accelerate the eutrophication rate in an aquatic system. Usually, the
eutrophication process is observed as a change in the structure of the algal community and includes
severe algal blooms that may cover large areas for extended periods. Large algal blooms are generally
followed by depletion in DO concentrations as a result of algal decomposition.
3.3.3 Phosphorus Total as P (TP)
Phosphorus is one of the primary nutrients that regulates algal and macrophyte growth in natural waters,
particularly in fresh water. Phosphate, the form in which almost all phosphorus is found in the water
column, can enter the aquatic environment in a number of ways. Natural processes transport phosphate
to water through atmospheric deposition, ground water percolation, and terrestrial runoff. Municipal
treatment plants, industries, agriculture, and domestic activities also contribute to phosphate loading
through direct discharge and natural transport mechanisms. The very high levels of phosphorus in some
Florida streams and estuaries are sometimes linked to phosphate mining and fertilizer processing
activities.
High phosphorus concentrations are frequently responsible for accelerating the eutrophication process in
a waterbody. Once phosphorus and other important nutrients enter the ecosystem, they are extremely
difficult to remove. They become tied up in biomass or deposited in sediments. Nutrients, particularly
phosphates, deposited in sediments generally are redistributed to the water column. This type of cycling
compounds the difficulty of halting the eutrophication process.
Page 20 of 90
FINAL TMDL Report: Kissimmee River Basin, Lake Marian (WBID 3184), Nutrients, December 2013
Chapter 4: ASSESSMENT OF SOURCES
4.1 Overview of Modeling Process The Lake Marian watershed is a part of a larger network of lakes and streams that drain to the
Kissimmee River, and ultimately, Lake Okeechobee. As there are several other lakes/streams in the
Kissimmee River Basin for which TMDLs are being developed, the Department contracted with CDM
to gather all available information and to set up, calibrate, and validate HSPF model projects for these
waters (see Appendix B for modeling details).
HSPF (EPA 2001; Bicknell et al. 2001) is a comprehensive package that can be used to develop a
combined watershed and receiving water model. The external load assessment conducted using HSPF
was intended to determine the loading characteristics of the various sources of pollutants to Lake
Marian. Assessing the external load entailed assessing land use patterns, soils, topography,
hydrography, point sources, service area coverages, climate, and rainfall to determine the volume,
concentration, timing, location, and underlying nature of the point, nonpoint, and atmospheric sources of
nutrients to the lake.
The model has the capability of modeling various species of nitrogen and phosphorus, chla, coliform
bacteria, and metals in receiving waters (bacteria and metals can be simulated as a “general” pollutant
with potential in-stream processes, including first-order decay and adsorption/desorption with suspended
and bed solids). HSPF has been developed and maintained by Aqua Terra and the EPA and is available
as part of the EPA-supported software package BASINS (Better Assessment Science Integrating Point
and Nonpoint Sources).
The PERLND (pervious land) module performs detailed analyses of surface and subsurface flow for
pervious land areas based on the Stanford Watershed Model. Water quality calculations for sediment in
pervious land runoff can include sediment detachment during rainfall events and reattachment during
dry periods, with potential for wash off during runoff events. For other water quality constituents,
runoff water quality can be determined using buildup-wash off algorithms, “potency factors” (e.g.,
factors relating constituent wash off to sediment wash off), or a combination of both.
The IMPLND (impervious land) module performs analysis of surface processes only and uses buildup-
wash off algorithms to determine runoff quality. The RCHRES (free-flowing reach or mixed reservoir)
module is used to simulate flow routing and water quality in the receiving waters, which are assumed to
Page 21 of 90
FINAL TMDL Report: Kissimmee River Basin, Lake Marian (WBID 3184), Nutrients, December 2013 be one-dimensional. Receiving water constituents can interact with suspended and bed sediments
through soil-water partitioning. HSPF can incorporate “special actions” that utilize user-specified
algorithms to account for occurrences such as opening/closing of water control structures to maintain
seasonal water stages or other processes beyond the normal scope of the model code. More information
on HSPF/BASINS is available at www.epa.gov/waterscience/basins/.
4.2 Potential Sources of Nutrients in the Lake Marian Watershed An important part of the TMDL analysis is the identification of pollutant source categories, source
subcategories, or individual sources of the pollutant of concern in the watershed and the amount of
pollutant loading contributed by each of these sources. Sources are broadly classified as either “point
sources” or “nonpoint sources.” Historically, the term point sources has meant discharges to surface
waters that typically have a continuous flow via a discernible, confined, and discrete conveyance, such
as a pipe. Domestic and industrial wastewater treatment facilities (WWTFs) are examples of traditional
point sources. In contrast, the term “nonpoint sources” was used to describe intermittent, rainfall-driven,
diffuse sources of pollution associated with everyday human activities, including runoff from urban land
uses, agriculture, silviculture, and mining; discharges from failing septic systems; and atmospheric
deposition.
However, the 1987 amendments to the Clean Water Act redefined certain nonpoint sources of pollution
as point sources subject to regulation under the EPA’s National Pollutant Discharge Elimination System
(NPDES) Program. These nonpoint sources included certain urban stormwater discharges, such as those
from local government master drainage systems, construction sites over five acres, and a wide variety of
industries (see Appendix A for background information on the federal and state stormwater programs).
To be consistent with Clean Water Act definitions, the term “point source” will be used to describe
traditional point sources (such as domestic and industrial wastewater discharges) and stormwater
systems requiring an NPDES stormwater permit when allocating pollutant load reductions required by a
TMDL. However, the methodologies used to estimate nonpoint source loads do not distinguish between
NPDES stormwater discharges and non-NPDES stormwater discharges, and as such, this source
assessment section does not make any distinction between the two types of stormwater.
4.2.1 Point Sources
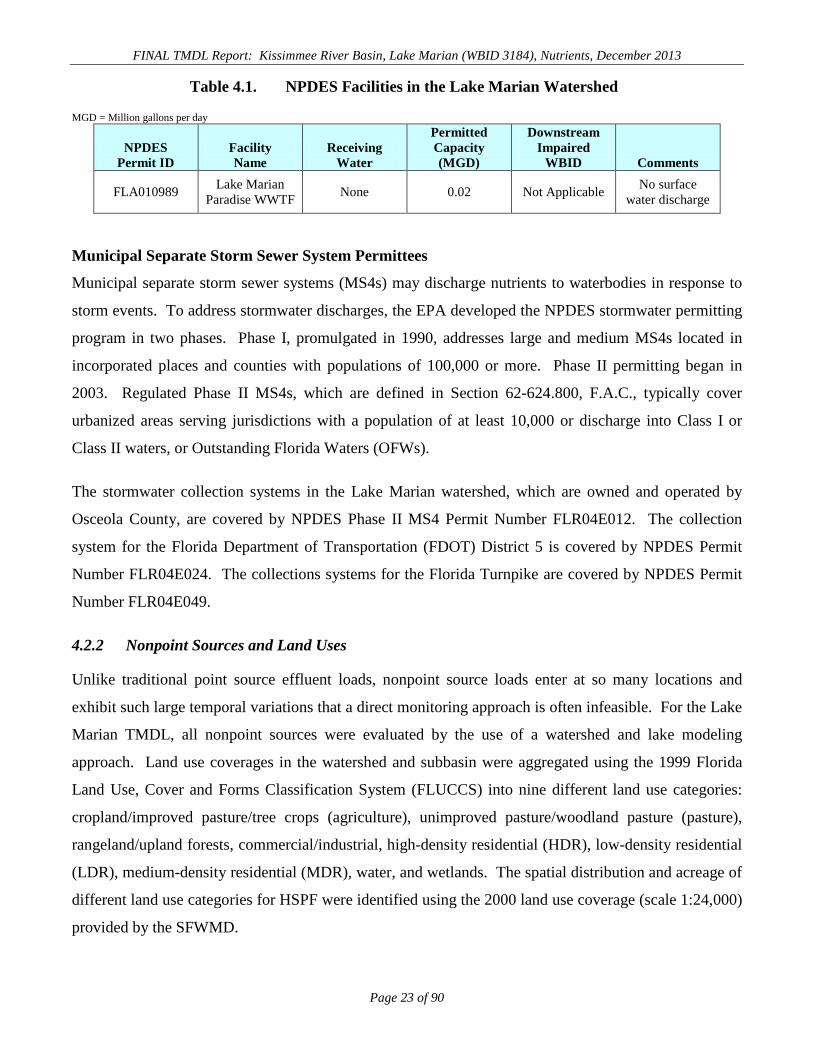
There are no permitted WWTFs or industrial wastewater facilities that discharge directly to Lake
Marian. The facility listed in Table 4.1 is within the Lake Marian watershed but was not included in the
model, as it is not a surface water discharger.
Page 22 of 90
FINAL TMDL Report: Kissimmee River Basin, Lake Marian (WBID 3184), Nutrients, December 2013
Table 4.1. NPDES Facilities in the Lake Marian Watershed
MGD = Million gallons per day
NPDES Permit ID
Facility Name
Receiving Water
Permitted Capacity (MGD)
Downstream Impaired
WBID Comments
FLA010989 Lake Marian Paradise WWTF None 0.02 Not Applicable No surface
water discharge
Municipal Separate Storm Sewer System Permittees
Municipal separate storm sewer systems (MS4s) may discharge nutrients to waterbodies in response to
storm events. To address stormwater discharges, the EPA developed the NPDES stormwater permitting
program in two phases. Phase I, promulgated in 1990, addresses large and medium MS4s located in
incorporated places and counties with populations of 100,000 or more. Phase II permitting began in
2003. Regulated Phase II MS4s, which are defined in Section 62-624.800, F.A.C., typically cover
urbanized areas serving jurisdictions with a population of at least 10,000 or discharge into Class I or
Class II waters, or Outstanding Florida Waters (OFWs).
The stormwater collection systems in the Lake Marian watershed, which are owned and operated by
Osceola County, are covered by NPDES Phase II MS4 Permit Number FLR04E012. The collection
system for the Florida Department of Transportation (FDOT) District 5 is covered by NPDES Permit
Number FLR04E024. The collections systems for the Florida Turnpike are covered by NPDES Permit
Number FLR04E049.
4.2.2 Nonpoint Sources and Land Uses
Unlike traditional point source effluent loads, nonpoint source loads enter at so many locations and
exhibit such large temporal variations that a direct monitoring approach is often infeasible. For the Lake
Marian TMDL, all nonpoint sources were evaluated by the use of a watershed and lake modeling
approach. Land use coverages in the watershed and subbasin were aggregated using the 1999 Florida
Land Use, Cover and Forms Classification System (FLUCCS) into nine different land use categories:
cropland/improved pasture/tree crops (agriculture), unimproved pasture/woodland pasture (pasture),
rangeland/upland forests, commercial/industrial, high-density residential (HDR), low-density residential
(LDR), medium-density residential (MDR), water, and wetlands. The spatial distribution and acreage of
different land use categories for HSPF were identified using the 2000 land use coverage (scale 1:24,000)
provided by the SFWMD.
Page 23 of 90
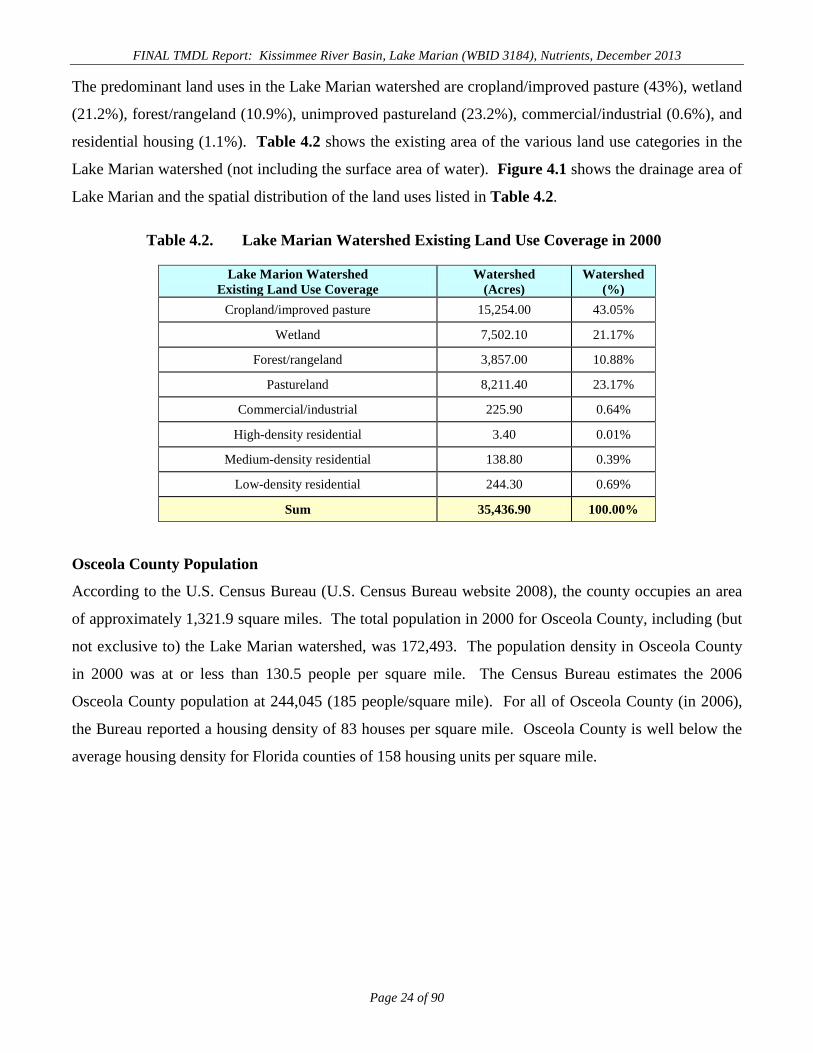
FINAL TMDL Report: Kissimmee River Basin, Lake Marian (WBID 3184), Nutrients, December 2013 The predominant land uses in the Lake Marian watershed are cropland/improved pasture (43%), wetland
(21.2%), forest/rangeland (10.9%), unimproved pastureland (23.2%), commercial/industrial (0.6%), and
residential housing (1.1%). Table 4.2 shows the existing area of the various land use categories in the
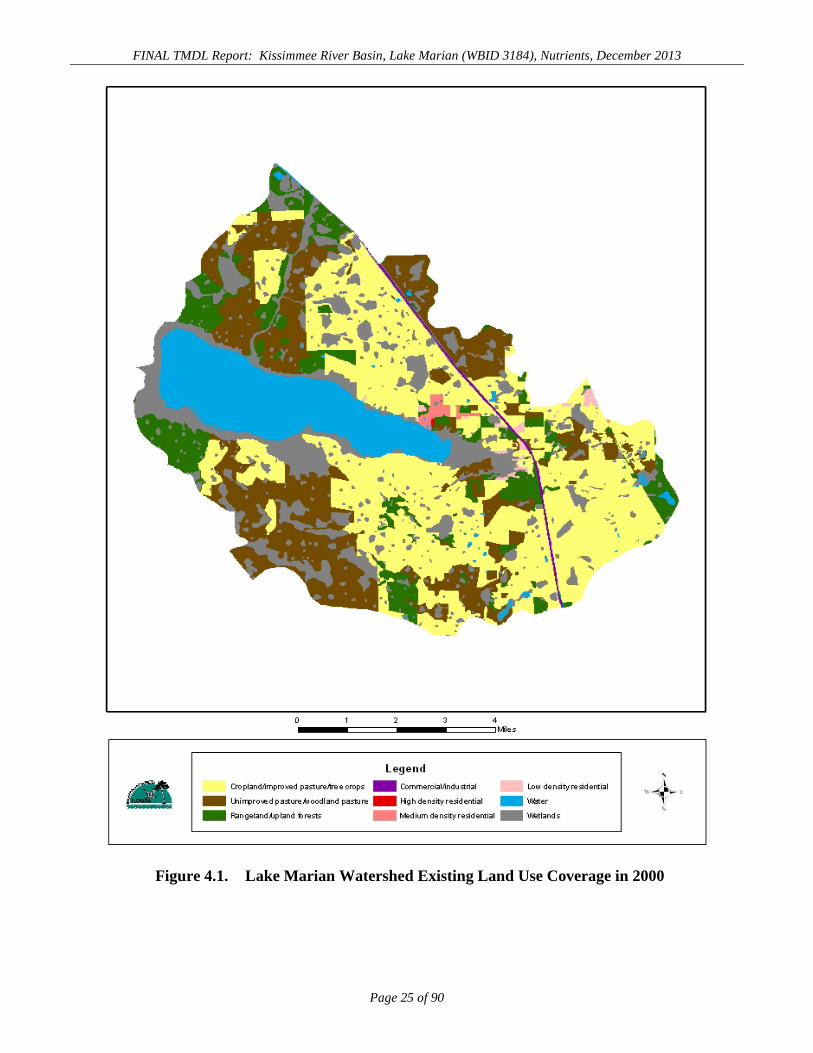
Lake Marian watershed (not including the surface area of water). Figure 4.1 shows the drainage area of
Lake Marian and the spatial distribution of the land uses listed in Table 4.2.
Table 4.2. Lake Marian Watershed Existing Land Use Coverage in 2000
Lake Marion Watershed Existing Land Use Coverage
Watershed (Acres)
Watershed (%)
Cropland/improved pasture 15,254.00 43.05%
Wetland 7,502.10 21.17%
Forest/rangeland 3,857.00 10.88%
Pastureland 8,211.40 23.17%
Commercial/industrial 225.90 0.64%
High-density residential 3.40 0.01%
Medium-density residential 138.80 0.39%
Low-density residential 244.30 0.69%
Sum 35,436.90 100.00%
Osceola County Population
According to the U.S. Census Bureau (U.S. Census Bureau website 2008), the county occupies an area
of approximately 1,321.9 square miles. The total population in 2000 for Osceola County, including (but
not exclusive to) the Lake Marian watershed, was 172,493. The population density in Osceola County
in 2000 was at or less than 130.5 people per square mile. The Census Bureau estimates the 2006
Osceola County population at 244,045 (185 people/square mile). For all of Osceola County (in 2006),
the Bureau reported a housing density of 83 houses per square mile. Osceola County is well below the
average housing density for Florida counties of 158 housing units per square mile.
Page 24 of 90
FINAL TMDL Report: Kissimmee River Basin, Lake Marian (WBID 3184), Nutrients, December 2013
Figure 4.1. Lake Marian Watershed Existing Land Use Coverage in 2000
Page 25 of 90
FINAL TMDL Report: Kissimmee River Basin, Lake Marian (WBID 3184), Nutrients, December 2013 Septic Tanks
Onsite sewage treatment and disposal systems (OSTDS), including septic tanks, are commonly used in
areas where providing central sewer is not cost-effective or practical. When properly sited, designed,
constructed, maintained, and operated, OSTDS are a safe means of disposing of domestic waste. The
effluent from a well-functioning OSTDS is comparable to secondarily treated wastewater from a sewage
treatment plant. When not functioning properly, however, OSTDS can be a source of nutrients (nitrogen
and phosphorus), pathogens, and other pollutants to both ground water and surface water.
The 2008 CDM report, Section 2.5.2.1, Septic Tanks, describes in detail how septic tanks were included
in the HSPF model. In general, the model does not directly account for the impacts of failing septic
tanks. CDM concluded that failing septic tanks were not thought to have significant impacts on Lake
Marian and therefore were not explicitly included in the model, because (1) there is a limited amount of
urban land in the study area, (2) failure rates are typically low (10% failing or less), and (3) the amount
of urban land believed to be served by septic tanks is also low in the study area.
Osceola County Septic Tanks
As of 2006, Osceola County had a cumulative registry of 24,148 septic systems. Data for septic tanks
are based on 1971 to 2006 census results, with year-by-year additions based on new septic tank
construction. The data do not reflect septic tanks that have been removed going back to 1970. From
fiscal years 1994 to 2006, an average of 157.4 permits per year for repairs was issued in Osceola County
(Florida Department of Health [FDOH] 2008). Based on the number of permitted septic tanks estimated
for 2006 (24,148) and housing units (109,892) located in the county, approximately 78% of the housing
units are connected to a central sewer line (i.e., wastewater treatment facility), with the remaining 22%
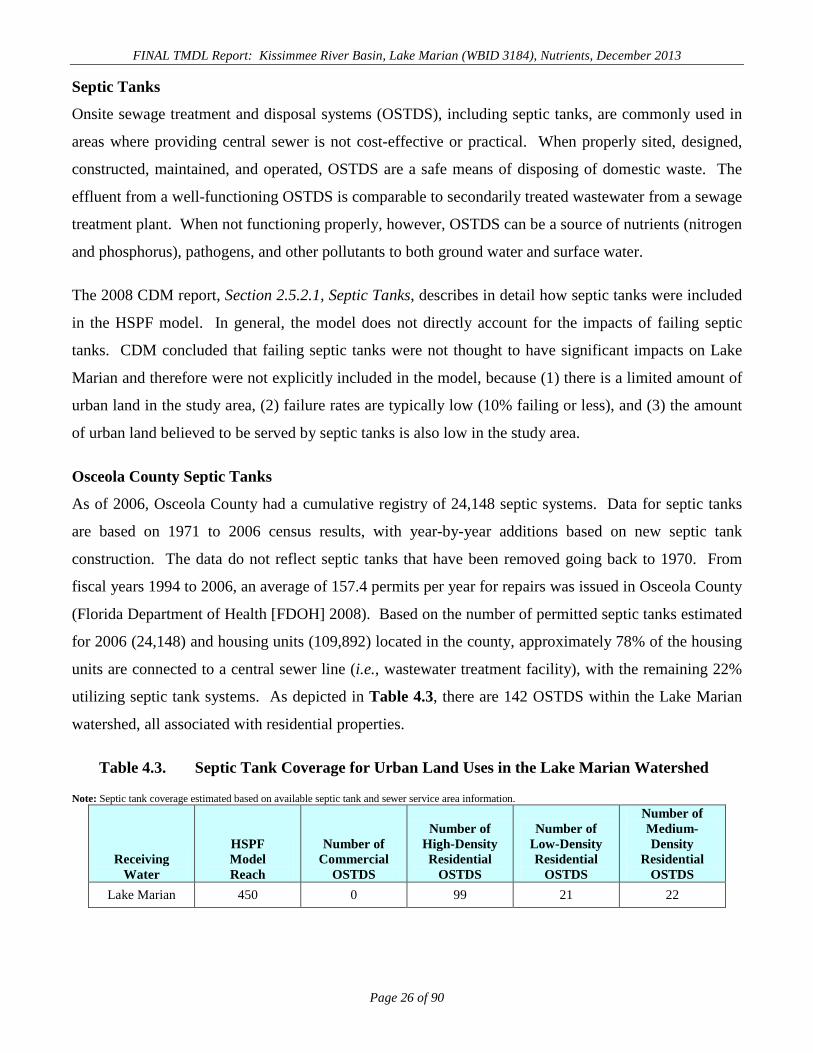
utilizing septic tank systems. As depicted in Table 4.3, there are 142 OSTDS within the Lake Marian
watershed, all associated with residential properties.
Table 4.3. Septic Tank Coverage for Urban Land Uses in the Lake Marian Watershed
Note: Septic tank coverage estimated based on available septic tank and sewer service area information.
Receiving Water
HSPF Model Reach
Number of Commercial
OSTDS
Number of High-Density Residential
OSTDS
Number of Low-Density Residential
OSTDS
Number of Medium-Density
Residential OSTDS
Lake Marian 450 0 99 21 22
Page 26 of 90
FINAL TMDL Report: Kissimmee River Basin, Lake Marian (WBID 3184), Nutrients, December 2013
4.3 Estimating Point and Nonpoint Source Loadings
4.3.1 Model Approach
The HSPF model was utilized to estimate the nutrient loads within and discharged from the Lake Marian
watershed. The model allows the Department to interactively simulate and assess the environmental
effects of various land use changes and associated land use practices. The water quality parameters
(impact parameters) simulated within the model for Lake Marian include water quantity (surface runoff,
interflow, and baseflow), and water quality (TN, organic nitrogen, ammonia nitrogen, nitrogen oxides
[NOX], TP, organic phosphorus, ortho phosphorus, phytoplankton as biologically active chla
[corrected], temperature, total suspended solids [TSS], DO, and ultimate carbonaceous biological
oxygen demand [CBOD]). Datasets of land use, soils, topography and depressions, hydrography, U.S.
Geological Survey (USGS) gauge and flow data, septic tanks, water use pumpage, point sources, ground
water, atmospheric deposition, solar radiation, control structures, and rainfall (CDM 2008) are used to
calculate the combined impact of the watershed characteristics for a given modeled area on a waterbody
represented in the model as a reach.
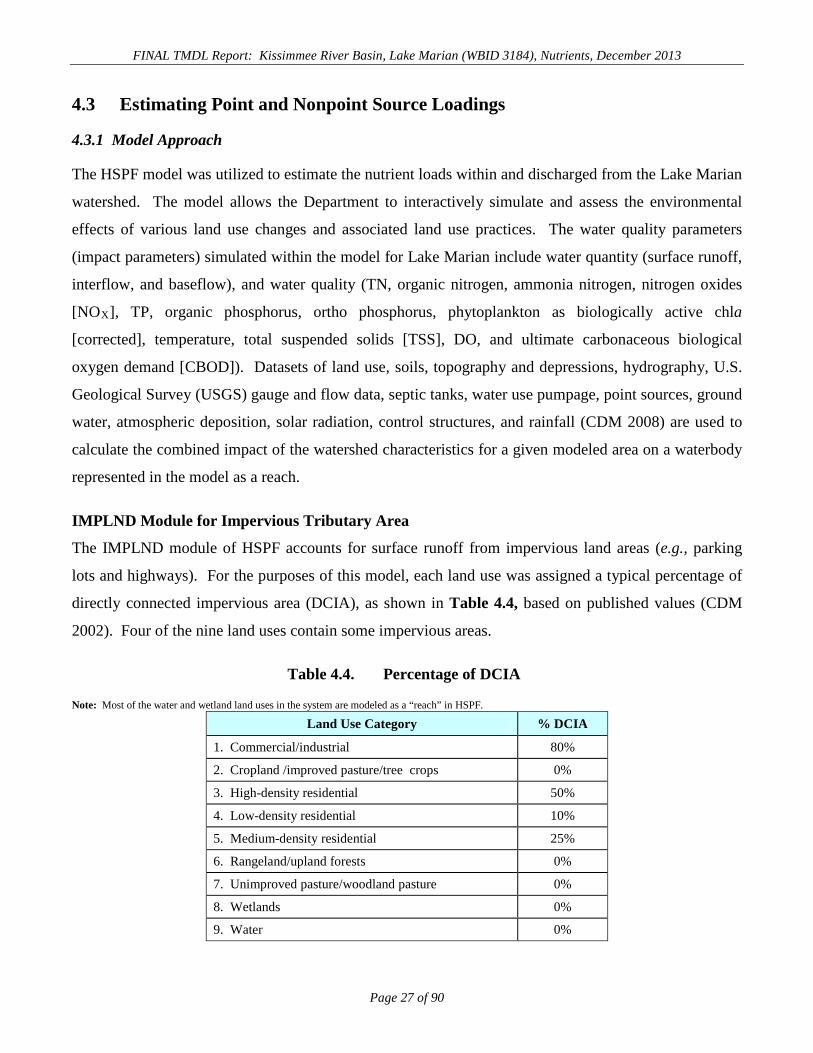
IMPLND Module for Impervious Tributary Area
The IMPLND module of HSPF accounts for surface runoff from impervious land areas (e.g., parking
lots and highways). For the purposes of this model, each land use was assigned a typical percentage of
directly connected impervious area (DCIA), as shown in Table 4.4, based on published values (CDM
2002). Four of the nine land uses contain some impervious areas.
Table 4.4. Percentage of DCIA
Note: Most of the water and wetland land uses in the system are modeled as a “reach” in HSPF.
Land Use Category % DCIA
1. Commercial/industrial 80%
2. Cropland /improved pasture/tree crops 0%
3. High-density residential 50%
4. Low-density residential 10%
5. Medium-density residential 25%
6. Rangeland/upland forests 0%
7. Unimproved pasture/woodland pasture 0%
8. Wetlands 0%
9. Water 0%
Page 27 of 90
FINAL TMDL Report: Kissimmee River Basin, Lake Marian (WBID 3184), Nutrients, December 2013 PERLND Module for Pervious Tributary Area
The PERLND module of HSPF accounts for surface runoff, interflow, and ground water flow (baseflow)
from pervious land areas. For the purposes of modeling, the total amount of pervious tributary area was
estimated as the total tributary area minus the impervious area.
HSPF uses the Stanford Watershed Model methodology as the basis for hydrologic calculations. This
methodology calculates soil moisture and flow of water between a number of different storages,
including surface storage, interflow storage, upper soil storage zone, lower soil storage zone, active
ground water zone, and deep storage. Rain that is not converted to surface runoff or interflow infiltrates
into the soil storage zones. The infiltrated water is lost by evapotranspiration, discharged as baseflow,
or lost to deep percolation (e.g., deep aquifer recharge). In the HSPF model, water and wetlands land
uses were generally modeled as pervious land (PERLND) elements. Since these land use types are
expected to generate more flow as surface runoff than other pervious lands, the PERLND elements
representing water and wetlands were assigned lower values for infiltration rate (INFILT), upper zone
nominal storage (UZSN), and lower zone nominal storage (LZSN).
Hydrology for large waterbodies (e.g., lakes) and rivers and streams that connect numerous lakes
throughout the project area were modeled in RCHRES rather than PERLND (see Section 4.3.1.3 of the
2008 CDM report). For each subbasin containing a main stem reach, a number of acres were removed
from the water land use in PERLND that were modeled explicitly in RCHRES. The acres removed from
these subbasins correspond to the areas of the lakes and the streams. In the reaches representing these
waterbodies, HSPF accounted for direct rainfall on the water surface and direct evaporation from the
water surface.
Several of the key parameters adjusted in the analysis include the following:
• LZSN (lower zone nominal storage) – LZSN is the key parameter in establishing an
annual water balance. Increasing the value of LZSN increases the amount of
infiltrated water that is lost by evapotranspiration and therefore decreases the annual
stream flow volume.
• LZETP (lower zone evapotranspiration parameter) – LZETP affects the amount of
potential evapotranspiration that can be satisfied by lower zone storage and is
another key factor in the annual water balance.
Page 28 of 90
FINAL TMDL Report: Kissimmee River Basin, Lake Marian (WBID 3184), Nutrients, December 2013
• INFILT (infiltration) – INFILT can also affect the annual water balance. Increasing
the value of INFILT decreases surface runoff and interflow, increases the flow of
water to lower soil storage and ground water, and results in greater
evapotranspiration.
• UZSN (upper zone nominal storage) – Reducing the value of UZSN increases the
percentage of flow associated with surface runoff, as opposed to ground water flow.
This would be appropriate for areas where receiving water inflows are highly
responsive to rainfall events. Increasing UZSN can also affect the annual water
balance by resulting in greater overall evapotranspiration.
RCHRES Module for Stream/Lake Routing
The RCHRES module of HSPF conveys flows input from the PERLND and IMPLND modules,
accounts for direct water surface inflow (rainfall) and direct water surface outflow (evaporation), and
routes flows based on a rating curve supplied by the modeler. Within each subbasin of each planning
unit model, a RCHRES element was developed that defines the depth-area-volume relationship for the
modeled waterbody.
The depth-area-volume relationships for Lakes Alligator, Myrtle, Hart, Gentry, East Tohopekaliga,
Tohopekaliga, Cypress, Hatchineha, and Kissimmee in the Upper Kissimmee Planning Unit were
obtained from the Upper Kissimmee Chain of Lakes Routing Model, Appendix B (Post Buckley Schuh
and Jernigan [PBSJ] et al. 2001). For all other major lakes and the impaired WBIDs in the project area,
the stage-area-volume relationships were developed based on the lake’s bathymetry data. Section 4.2.10
of the 2008 CDM report provides more detailed information on how the lake bathymetry data were used
to develop the depth-area-volume relationships.
For the lakes with hydraulic control structures, the design discharge rates were used in the depth-area-
volume-discharge relationships once the lake stages were 1 foot or more than the target levels. When
the lake stages were between 0 and 1 foot above the targets, the flows were assumed to vary linearly
between 0 (0 feet above target) and the design flows (1 foot above target).
As discussed in the 2008 CDM report, Section 4.2.11, the depth-area-volume relationships for the
reaches in the Upper Kissimmee Planning Unit were developed based on the cross-section data extracted
from the other models.
Page 29 of 90
FINAL TMDL Report: Kissimmee River Basin, Lake Marian (WBID 3184), Nutrients, December 2013 An initial Manning’s roughness coefficient value of 0.035, typical for natural rivers and streams, was
used in flow calculations. In some instances, the roughness coefficient value was adjusted during the
model calibrations to reflect local conditions, such as smaller values for well-maintained canals and
larger values for meandering, highly vegetated, and not well-defined streams. The slopes of water
surface (S) were approximated with the reach bottom slopes, which were estimated based on the Digital
Elevation Model data.
Implementation of Hydraulic Control Structure Regulation Schedules
To simulate the hydraulic control structure regulation schedules in the HSPF model, the stages were
approximated with step functions, as described in detail in Section 4 of the 2008 CDM report. Variable
step functions were used to approximate different regulation schedules. In each approximation, a step
function was defined such that stage variations generally equaled 1 foot. In several instances, however,
stage variations were less than 1 foot or less than 1.5 feet due to the stage variations in the original
regulation schedules. For each hydraulic control structure, a sequential dataset was created to mimic the
regulation schedules. Sequential datasets in this HSPF modeling application define the discharge
column to evaluate from the FTABLE.
An FTABLE is a table in the HSPF model input file that summarizes the geometric and hydraulic
properties of a reach. Normally, an FTABLE has at least three columns: depth, surface area, and
volume. For the FTABLE associated with a reach with a control structure, Columns 4 through 8 can be
used to define control structure operation flow rates for different operation zones. For example, the
approximated operation schedule for a given lake may have four operation zones (1 through 4). For
each year from January 1 to April 5 (Zone 1), the sequential dataset instructs the HSPF model to use the
discharge rate in Column 4 in the FTABLE. Similarly, Columns 5, 6, and 7 in the FTABLE are used as
the operation schedule progresses into Zones 2, 3, and 4, respectively.
Lake Marian Existing Land Use Loadings
The HSPF simulation of pervious lands (PERLNDs) and impervious lands (IMPLNDs) calculates hourly
values of runoff from pervious and impervious land areas, and interflow and baseflow from pervious
lands, plus loads of water quality constituents associated with these flows. For PERLNDs, TSS
(sediment) was simulated in HSPF by accounting for sediment detachment caused by rainfall, and the
subsequent wash off of detached sediment when surface runoff occurs. Loads of other constituents in
PERLND runoff were calculated in the GQUAL (general quality constituent) model of HSPF, using a
Page 30 of 90
FINAL TMDL Report: Kissimmee River Basin, Lake Marian (WBID 3184), Nutrients, December 2013 “potency factor” approach (i.e., defining how many pounds of constituent are washed off per ton of
sediment washed off).
One exception occurs for DO, which HSPF evaluates at the saturation DO concentration in surface
runoff. For PERLNDs, concentrations of constituents in baseflow were assigned based on typical values
observed in several tributaries in the study area such as Boggy Creek and Reedy Creek, and interflow
concentrations were set at values between the estimated runoff and baseflow concentrations. For
IMPLNDs, TSS (sediment) is simulated by a “buildup-wash off” approach (buildup during dry periods,
wash off with runoff during storm events), and again the “potency factor” approach was used in the
IQUAL module for other constituents except DO, which again was analyzed at saturation.
The “general” water quality constituents that were modeled in HSPF include the following:
• Ammonia nitrogen.
• Nitrate nitrogen.
• CBOD (ultimate).
• Orthophosphate.
• Refractory organic nitrogen.
One feature of HSPF is that the CBOD concentration has associated concentrations of organic-N and
organic-P. Consequently, the TN concentration is equal to the sum of ammonia-N, nitrate-N, refractory
organic-N, and a fraction of the CBOD concentration. Similarly, the TP concentration is equal to the
sum of ortho-P and a fraction of the CBOD concentration.
The total loadings of nitrogen and phosphorus for Lake Marian were estimated using the HSPF model.
Modeling frameworks were designed to simulate the period from 2000 to 2006.
Page 31 of 90
FINAL TMDL Report: Kissimmee River Basin, Lake Marian (WBID 3184), Nutrients, December 2013
Chapter 5: DETERMINATION OF ASSIMILATIVE CAPACITY
5.1 Determination of Loading Capacity Nutrient enrichment and the resulting problems related to eutrophication are generally widespread and
frequently manifested far (in both time and space) from their source. Addressing eutrophication
involves relating water quality and biological effects (such as photosynthesis, decomposition, and
nutrient recycling), as acted upon by hydrodynamic factors (including flow, wind, tide, and salinity), to
the timing and magnitude of constituent loads supplied from various categories of pollution sources.
The assimilative capacity should be related to some specific hydrometeorological condition such as an
“average” during a selected time span or to cover some range of expected variation in these conditions.
The goal of this TMDL development is to identify the maximum allowable TN and TP loadings from
the watershed, so that Lake Marian will meet the narrative nutrient criterion and thus maintain its
function and designated use as a Class III water. To achieve this goal and address public comments, the
Department decided to update the model developed by CDM (2008) by focusing on the water budgets
and nutrient loads of the lakes with nutrient impairments. The model inputs were reconstructed by
utilizing hourly input data, and the hydrology and water quality calibrations were significantly improved
by adding additional stations for calibration. The HSPF model input data (meteorological data) were
compiled from December 1997 to August 2009 at different weather stations, and the model was run
from 2000 to 2006 on an hourly time step. The model results obtained from the revised HSPF were
compared with the observed data and the independent model results simulated by the Watershed
Assessment Model (WAM) that was recently updated by Soil and Water Engineering Technology, Inc.
(SWET) for the South Florida Nutrient Budget Analysis for the Lake Okeechobee watershed.
The entire watershed area in the Kissimmee Chain of Lakes (KCOL) HSPF TMDL model covers more
than 900,000 acres and consists of 41 subbasins in the model domain. Given this large model domain
and the use of the model to develop long-term average TMDL conditions for the impaired lakes, it is
impossible at this time to address many of the issues for smaller pieces of land embedded within the 41
larger subbasins. This is because the model is set up with large subbasins, and all the area for each land
use within each subbasin is aggregated into one total area for each land use type, and then the subbasin-
scale nutrient loads to the impaired waterbodies are estimated for TMDL development.
Page 32 of 90
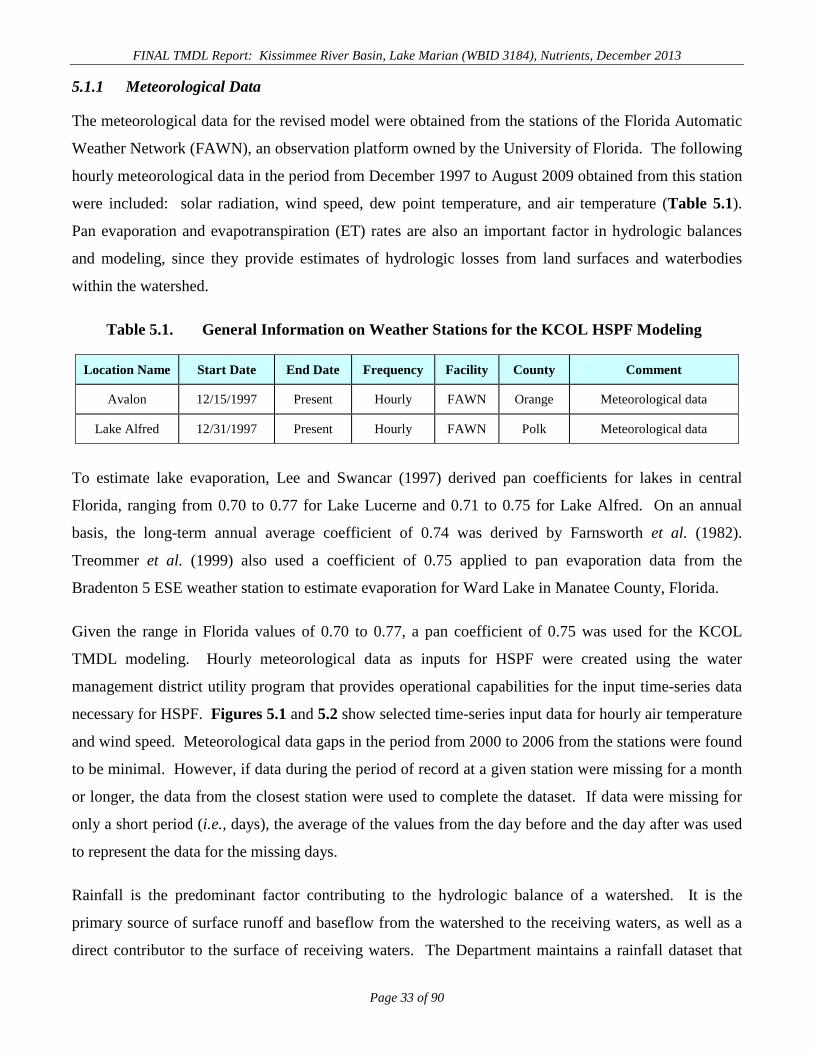
FINAL TMDL Report: Kissimmee River Basin, Lake Marian (WBID 3184), Nutrients, December 2013 5.1.1 Meteorological Data
The meteorological data for the revised model were obtained from the stations of the Florida Automatic
Weather Network (FAWN), an observation platform owned by the University of Florida. The following
hourly meteorological data in the period from December 1997 to August 2009 obtained from this station
were included: solar radiation, wind speed, dew point temperature, and air temperature (Table 5.1).
Pan evaporation and evapotranspiration (ET) rates are also an important factor in hydrologic balances
and modeling, since they provide estimates of hydrologic losses from land surfaces and waterbodies
within the watershed.
Table 5.1. General Information on Weather Stations for the KCOL HSPF Modeling
Location Name Start Date End Date Frequency Facility County Comment
Avalon 12/15/1997 Present Hourly FAWN Orange Meteorological data
Lake Alfred 12/31/1997 Present Hourly FAWN Polk Meteorological data To estimate lake evaporation, Lee and Swancar (1997) derived pan coefficients for lakes in central
Florida, ranging from 0.70 to 0.77 for Lake Lucerne and 0.71 to 0.75 for Lake Alfred. On an annual
basis, the long-term annual average coefficient of 0.74 was derived by Farnsworth et al. (1982).
Treommer et al. (1999) also used a coefficient of 0.75 applied to pan evaporation data from the
Bradenton 5 ESE weather station to estimate evaporation for Ward Lake in Manatee County, Florida.
Given the range in Florida values of 0.70 to 0.77, a pan coefficient of 0.75 was used for the KCOL
TMDL modeling. Hourly meteorological data as inputs for HSPF were created using the water
management district utility program that provides operational capabilities for the input time-series data
necessary for HSPF. Figures 5.1 and 5.2 show selected time-series input data for hourly air temperature
and wind speed. Meteorological data gaps in the period from 2000 to 2006 from the stations were found
to be minimal. However, if data during the period of record at a given station were missing for a month
or longer, the data from the closest station were used to complete the dataset. If data were missing for
only a short period (i.e., days), the average of the values from the day before and the day after was used
to represent the data for the missing days.
Rainfall is the predominant factor contributing to the hydrologic balance of a watershed. It is the
primary source of surface runoff and baseflow from the watershed to the receiving waters, as well as a
direct contributor to the surface of receiving waters. The Department maintains a rainfall dataset that
Page 33 of 90
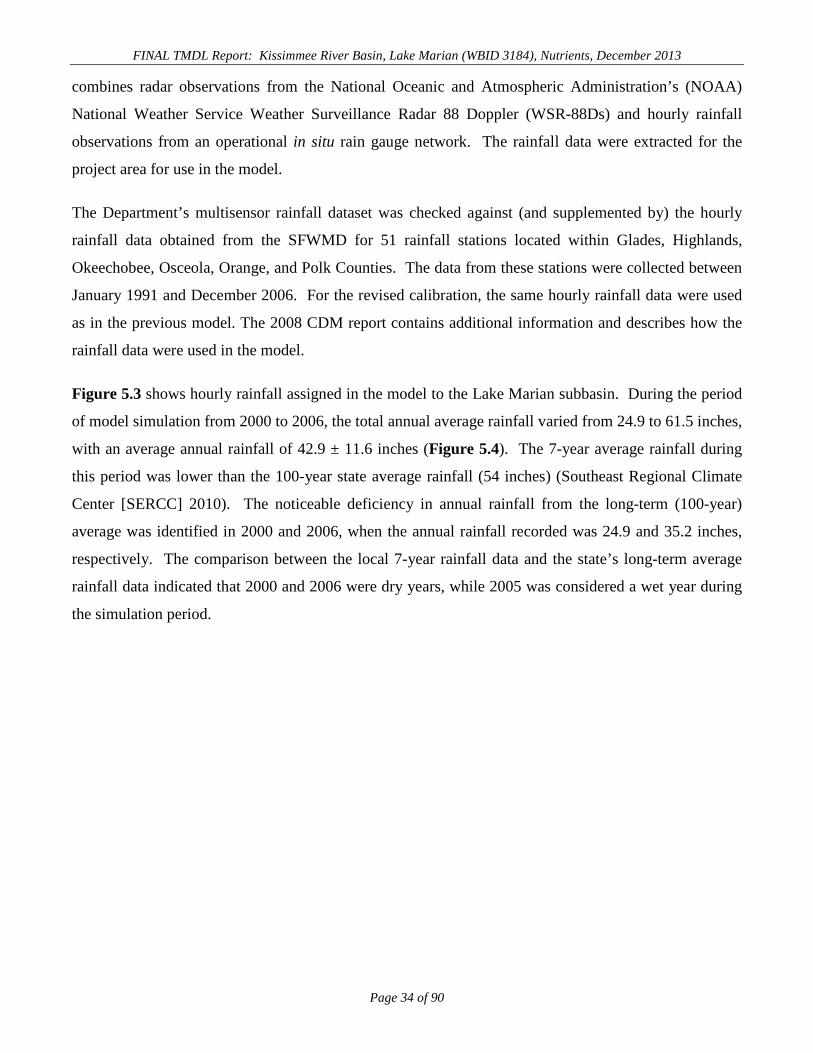
FINAL TMDL Report: Kissimmee River Basin, Lake Marian (WBID 3184), Nutrients, December 2013 combines radar observations from the National Oceanic and Atmospheric Administration’s (NOAA)
National Weather Service Weather Surveillance Radar 88 Doppler (WSR-88Ds) and hourly rainfall
observations from an operational in situ rain gauge network. The rainfall data were extracted for the
project area for use in the model.
The Department’s multisensor rainfall dataset was checked against (and supplemented by) the hourly
rainfall data obtained from the SFWMD for 51 rainfall stations located within Glades, Highlands,
Okeechobee, Osceola, Orange, and Polk Counties. The data from these stations were collected between
January 1991 and December 2006. For the revised calibration, the same hourly rainfall data were used
as in the previous model. The 2008 CDM report contains additional information and describes how the
rainfall data were used in the model.
Figure 5.3 shows hourly rainfall assigned in the model to the Lake Marian subbasin. During the period
of model simulation from 2000 to 2006, the total annual average rainfall varied from 24.9 to 61.5 inches,
with an average annual rainfall of 42.9 ± 11.6 inches (Figure 5.4). The 7-year average rainfall during
this period was lower than the 100-year state average rainfall (54 inches) (Southeast Regional Climate
Center [SERCC] 2010). The noticeable deficiency in annual rainfall from the long-term (100-year)
average was identified in 2000 and 2006, when the annual rainfall recorded was 24.9 and 35.2 inches,
respectively. The comparison between the local 7-year rainfall data and the state’s long-term average
rainfall data indicated that 2000 and 2006 were dry years, while 2005 was considered a wet year during
the simulation period.
Page 34 of 90
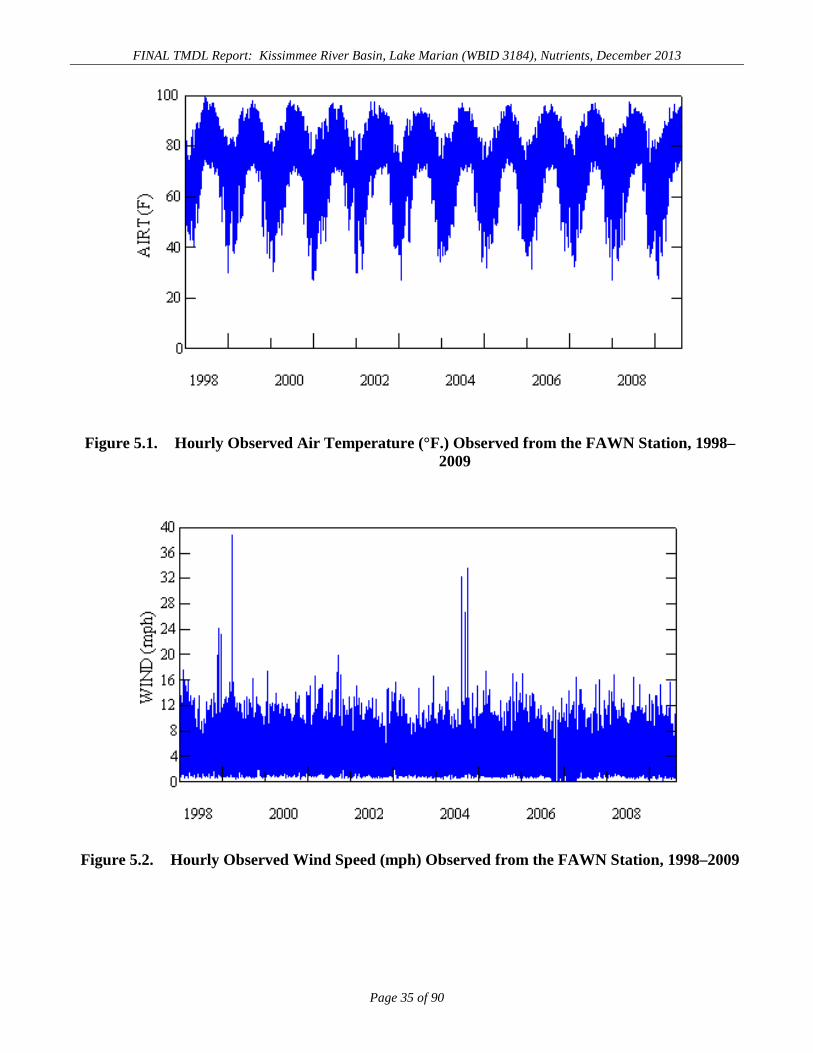
FINAL TMDL Report: Kissimmee River Basin, Lake Marian (WBID 3184), Nutrients, December 2013
Figure 5.1. Hourly Observed Air Temperature (°F.) Observed from the FAWN Station, 1998–2009
Figure 5.2. Hourly Observed Wind Speed (mph) Observed from the FAWN Station, 1998–2009
Page 35 of 90
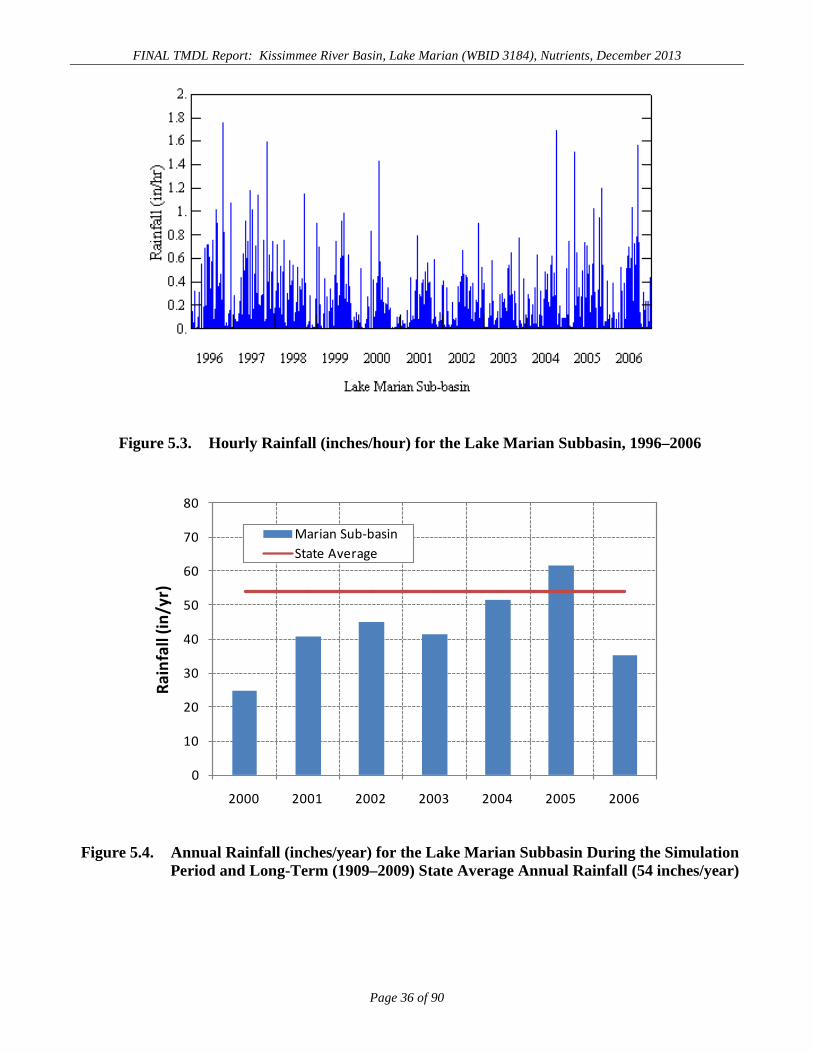
FINAL TMDL Report: Kissimmee River Basin, Lake Marian (WBID 3184), Nutrients, December 2013
Figure 5.3. Hourly Rainfall (inches/hour) for the Lake Marian Subbasin, 1996–2006
Figure 5.4. Annual Rainfall (inches/year) for the Lake Marian Subbasin During the Simulation Period and Long-Term (1909–2009) State Average Annual Rainfall (54 inches/year)
0
10
20
30
40
50
60
70
80
2000 2001 2002 2003 2004 2005 2006
Rain
fall
(in/y
r)
Marian Sub-basinState Average
Page 36 of 90
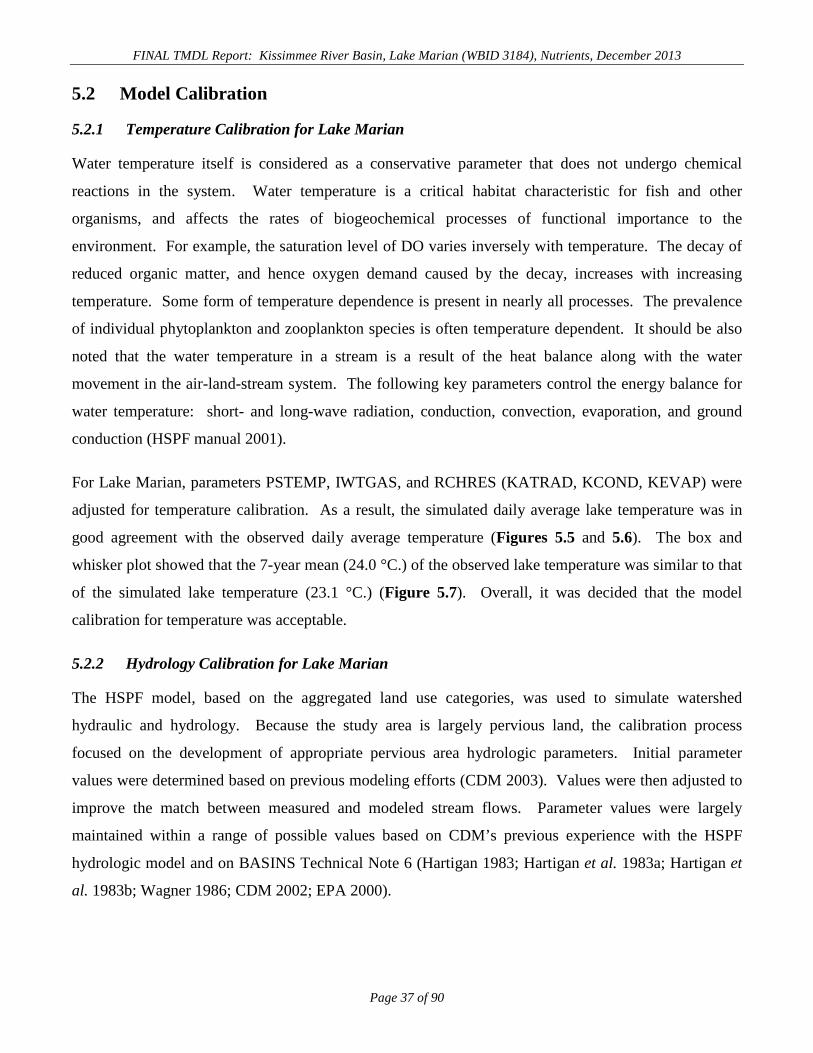
FINAL TMDL Report: Kissimmee River Basin, Lake Marian (WBID 3184), Nutrients, December 2013
5.2 Model Calibration
5.2.1 Temperature Calibration for Lake Marian
Water temperature itself is considered as a conservative parameter that does not undergo chemical
reactions in the system. Water temperature is a critical habitat characteristic for fish and other
organisms, and affects the rates of biogeochemical processes of functional importance to the
environment. For example, the saturation level of DO varies inversely with temperature. The decay of
reduced organic matter, and hence oxygen demand caused by the decay, increases with increasing
temperature. Some form of temperature dependence is present in nearly all processes. The prevalence
of individual phytoplankton and zooplankton species is often temperature dependent. It should be also
noted that the water temperature in a stream is a result of the heat balance along with the water
movement in the air-land-stream system. The following key parameters control the energy balance for
water temperature: short- and long-wave radiation, conduction, convection, evaporation, and ground
conduction (HSPF manual 2001).
For Lake Marian, parameters PSTEMP, IWTGAS, and RCHRES (KATRAD, KCOND, KEVAP) were
adjusted for temperature calibration. As a result, the simulated daily average lake temperature was in
good agreement with the observed daily average temperature (Figures 5.5 and 5.6). The box and
whisker plot showed that the 7-year mean (24.0 °C.) of the observed lake temperature was similar to that
of the simulated lake temperature (23.1 °C.) (Figure 5.7). Overall, it was decided that the model
calibration for temperature was acceptable.
5.2.2 Hydrology Calibration for Lake Marian
The HSPF model, based on the aggregated land use categories, was used to simulate watershed
hydraulic and hydrology. Because the study area is largely pervious land, the calibration process
focused on the development of appropriate pervious area hydrologic parameters. Initial parameter
values were determined based on previous modeling efforts (CDM 2003). Values were then adjusted to
improve the match between measured and modeled stream flows. Parameter values were largely
maintained within a range of possible values based on CDM’s previous experience with the HSPF
hydrologic model and on BASINS Technical Note 6 (Hartigan 1983; Hartigan et al. 1983a; Hartigan et
al. 1983b; Wagner 1986; CDM 2002; EPA 2000).
Page 37 of 90
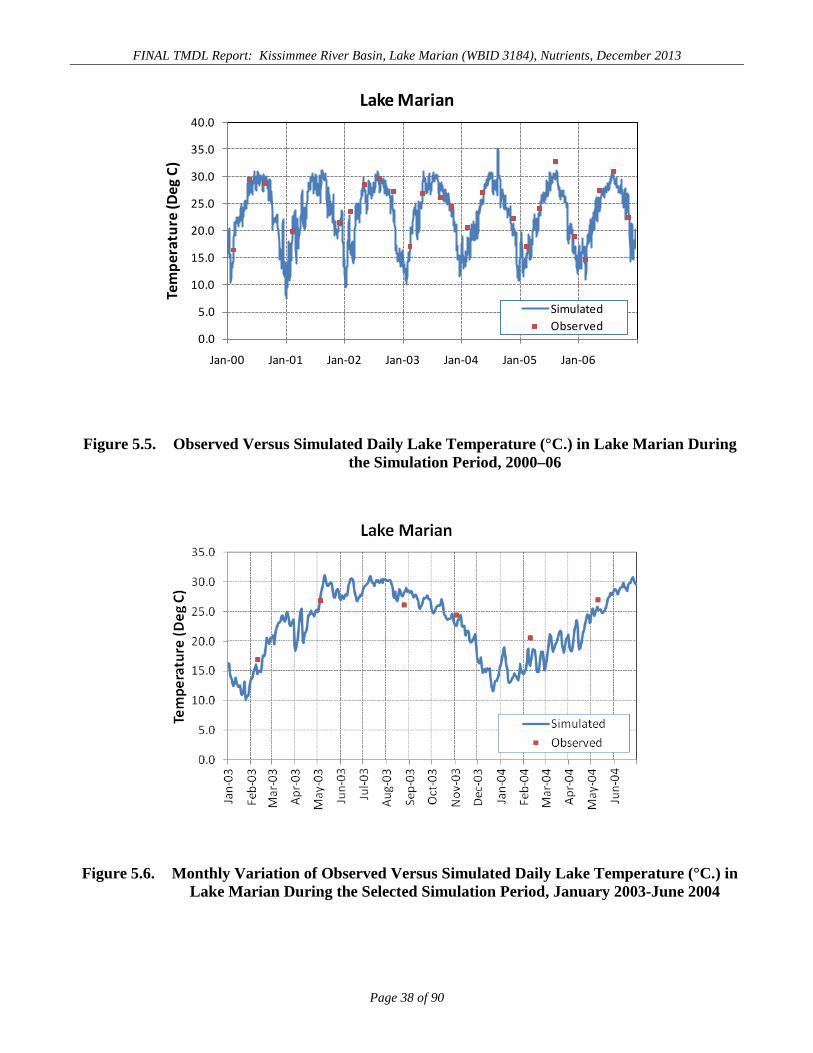
FINAL TMDL Report: Kissimmee River Basin, Lake Marian (WBID 3184), Nutrients, December 2013
Figure 5.5. Observed Versus Simulated Daily Lake Temperature (°C.) in Lake Marian During the Simulation Period, 2000–06
Figure 5.6. Monthly Variation of Observed Versus Simulated Daily Lake Temperature (°C.) in Lake Marian During the Selected Simulation Period, January 2003-June 2004
0.0
5.0
10.0
15.0
20.0
25.0
30.0
35.0
40.0
Jan-00 Jan-01 Jan-02 Jan-03 Jan-04 Jan-05 Jan-06
Tem
pera
ture
(Deg
C)
Lake Marian
SimulatedObserved
Page 38 of 90
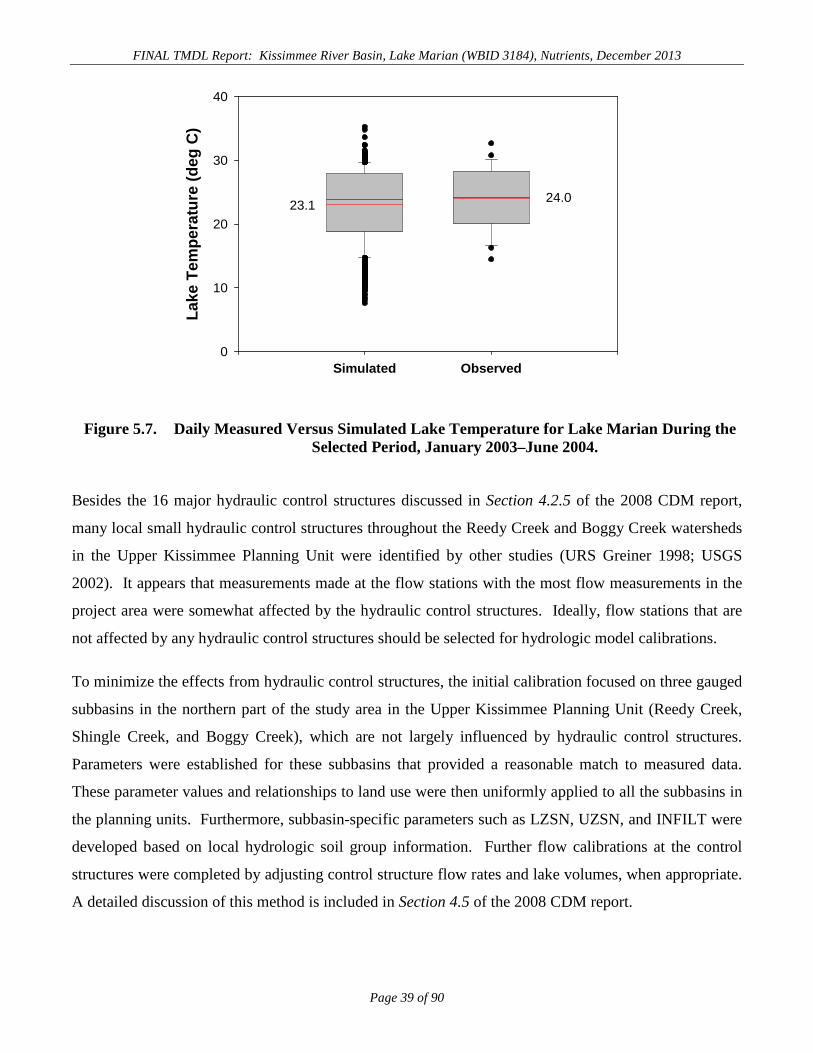
FINAL TMDL Report: Kissimmee River Basin, Lake Marian (WBID 3184), Nutrients, December 2013
Figure 5.7. Daily Measured Versus Simulated Lake Temperature for Lake Marian During the Selected Period, January 2003–June 2004.
Besides the 16 major hydraulic control structures discussed in Section 4.2.5 of the 2008 CDM report,
many local small hydraulic control structures throughout the Reedy Creek and Boggy Creek watersheds
in the Upper Kissimmee Planning Unit were identified by other studies (URS Greiner 1998; USGS
2002). It appears that measurements made at the flow stations with the most flow measurements in the
project area were somewhat affected by the hydraulic control structures. Ideally, flow stations that are
not affected by any hydraulic control structures should be selected for hydrologic model calibrations.
To minimize the effects from hydraulic control structures, the initial calibration focused on three gauged
subbasins in the northern part of the study area in the Upper Kissimmee Planning Unit (Reedy Creek,
Shingle Creek, and Boggy Creek), which are not largely influenced by hydraulic control structures.
Parameters were established for these subbasins that provided a reasonable match to measured data.
These parameter values and relationships to land use were then uniformly applied to all the subbasins in
the planning units. Furthermore, subbasin-specific parameters such as LZSN, UZSN, and INFILT were
developed based on local hydrologic soil group information. Further flow calibrations at the control
structures were completed by adjusting control structure flow rates and lake volumes, when appropriate.
A detailed discussion of this method is included in Section 4.5 of the 2008 CDM report.
Simulated Observed
Lake
Tem
pera
ture
(deg
C)
0
10
20
30
40
23.1 24.0
Page 39 of 90
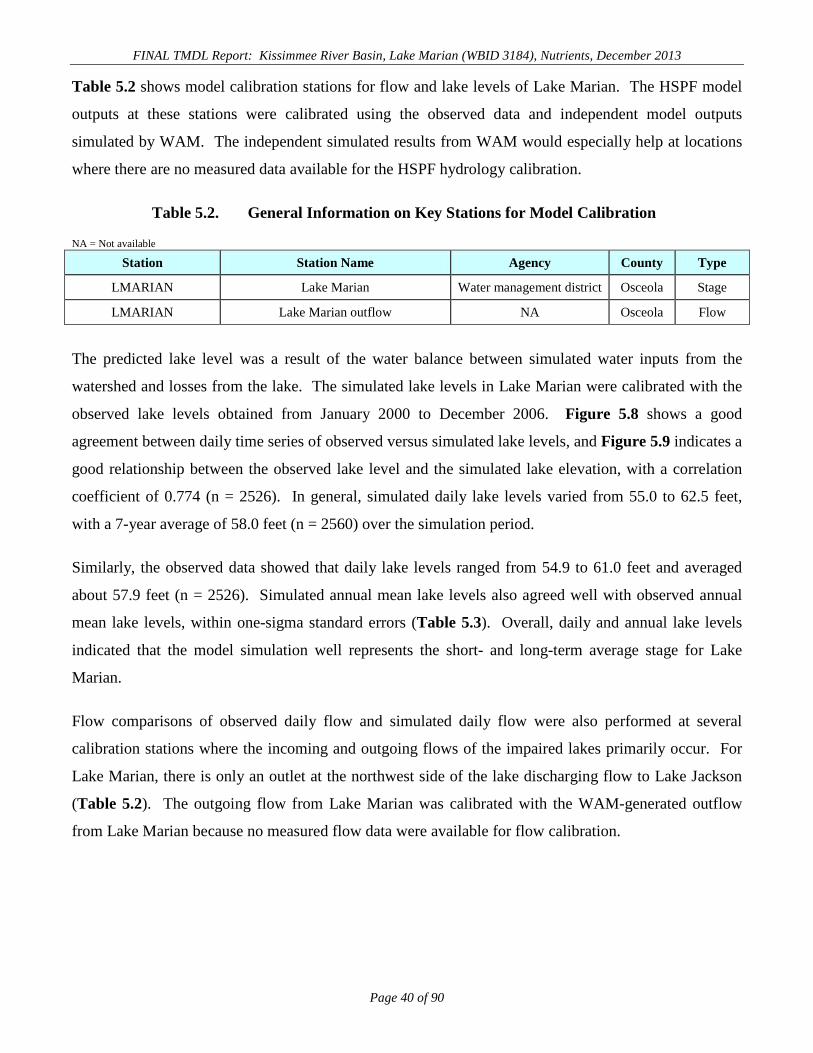
FINAL TMDL Report: Kissimmee River Basin, Lake Marian (WBID 3184), Nutrients, December 2013 Table 5.2 shows model calibration stations for flow and lake levels of Lake Marian. The HSPF model
outputs at these stations were calibrated using the observed data and independent model outputs
simulated by WAM. The independent simulated results from WAM would especially help at locations
where there are no measured data available for the HSPF hydrology calibration.
Table 5.2. General Information on Key Stations for Model Calibration
NA = Not available
Station Station Name Agency County Type
LMARIAN Lake Marian Water management district Osceola Stage
LMARIAN Lake Marian outflow NA Osceola Flow The predicted lake level was a result of the water balance between simulated water inputs from the
watershed and losses from the lake. The simulated lake levels in Lake Marian were calibrated with the
observed lake levels obtained from January 2000 to December 2006. Figure 5.8 shows a good
agreement between daily time series of observed versus simulated lake levels, and Figure 5.9 indicates a
good relationship between the observed lake level and the simulated lake elevation, with a correlation
coefficient of 0.774 (n = 2526). In general, simulated daily lake levels varied from 55.0 to 62.5 feet,
with a 7-year average of 58.0 feet (n = 2560) over the simulation period.
Similarly, the observed data showed that daily lake levels ranged from 54.9 to 61.0 feet and averaged
about 57.9 feet (n = 2526). Simulated annual mean lake levels also agreed well with observed annual
mean lake levels, within one-sigma standard errors (Table 5.3). Overall, daily and annual lake levels
indicated that the model simulation well represents the short- and long-term average stage for Lake
Marian.
Flow comparisons of observed daily flow and simulated daily flow were also performed at several
calibration stations where the incoming and outgoing flows of the impaired lakes primarily occur. For
Lake Marian, there is only an outlet at the northwest side of the lake discharging flow to Lake Jackson
(Table 5.2). The outgoing flow from Lake Marian was calibrated with the WAM-generated outflow
from Lake Marian because no measured flow data were available for flow calibration.
Page 40 of 90
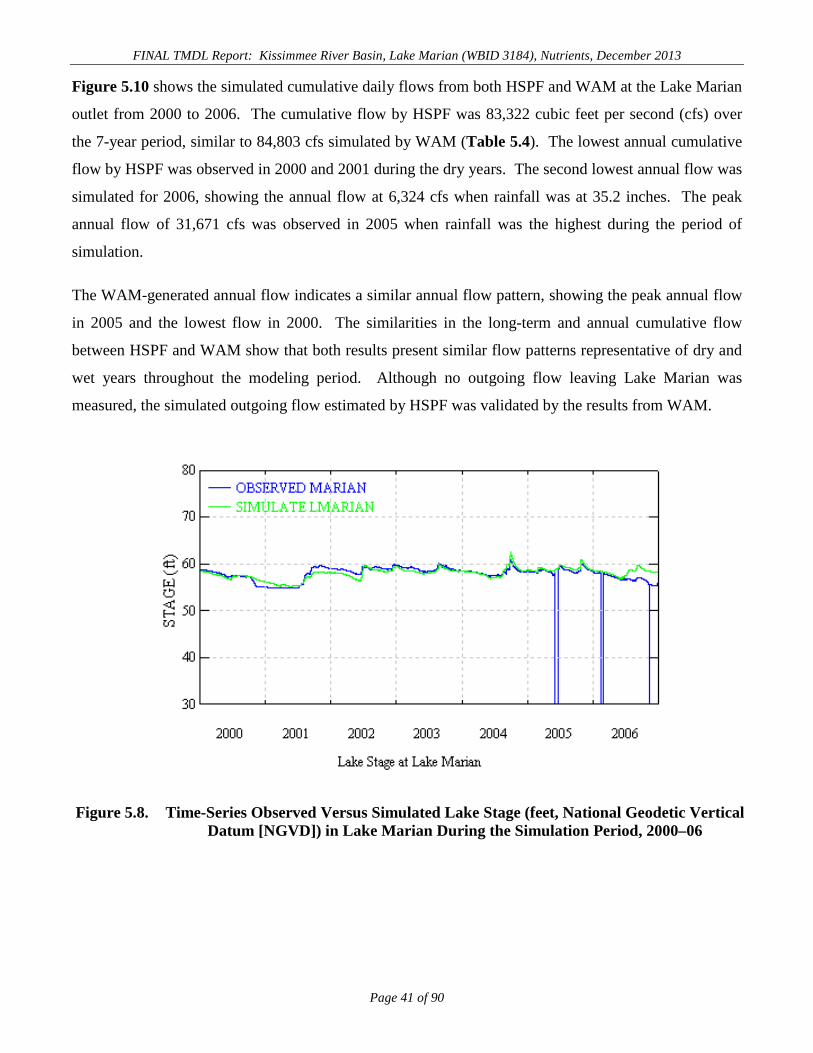
FINAL TMDL Report: Kissimmee River Basin, Lake Marian (WBID 3184), Nutrients, December 2013 Figure 5.10 shows the simulated cumulative daily flows from both HSPF and WAM at the Lake Marian
outlet from 2000 to 2006. The cumulative flow by HSPF was 83,322 cubic feet per second (cfs) over
the 7-year period, similar to 84,803 cfs simulated by WAM (Table 5.4). The lowest annual cumulative
flow by HSPF was observed in 2000 and 2001 during the dry years. The second lowest annual flow was
simulated for 2006, showing the annual flow at 6,324 cfs when rainfall was at 35.2 inches. The peak
annual flow of 31,671 cfs was observed in 2005 when rainfall was the highest during the period of
simulation.
The WAM-generated annual flow indicates a similar annual flow pattern, showing the peak annual flow
in 2005 and the lowest flow in 2000. The similarities in the long-term and annual cumulative flow
between HSPF and WAM show that both results present similar flow patterns representative of dry and
wet years throughout the modeling period. Although no outgoing flow leaving Lake Marian was
measured, the simulated outgoing flow estimated by HSPF was validated by the results from WAM.
Figure 5.8. Time-Series Observed Versus Simulated Lake Stage (feet, National Geodetic Vertical Datum [NGVD]) in Lake Marian During the Simulation Period, 2000–06
Page 41 of 90

FINAL TMDL Report: Kissimmee River Basin, Lake Marian (WBID 3184), Nutrients, December 2013
Figure 5.9. Daily Point-to-Point Paired Calibration of Lake Level (feet) During the Simulation Period, 2000–06 (solid line indicates the ideal 1-to-1 line, R represents a correlation
coefficient of the best fit between observed and simulated lake levels, and n indicates the number of observations)
Table 5.3. Observed and Simulated Annual Mean Lake Level (feet, NGVD) and Standard Deviation for Lake Marian
Year
Observed Stage (feet)
Standard Deviation
(+/-)
Simulated Stage (feet)
Standard Deviation
(+/-) 2000 57.3 1.1 57.4 0.6
2001 56.6 1.9 56.5 1.2
2002 58.9 0.5 58.2 0.8
2003 59.0 0.5 58.6 0.4
2004 58.3 0.7 58.4 1.1
2005 58.6 0.5 59.0 0.5
2006 56.9 0.8 58.2 0.6
Average 57.9 1.3 58.0 1.1
y = 0.647x + 20.54R = 0.774n = 2526
50
53
56
59
62
65
50 53 56 59 62 65
Sim
ulat
ed La
ke Le
vel (
ft)
Observed Lake Level (ft)
Page 42 of 90
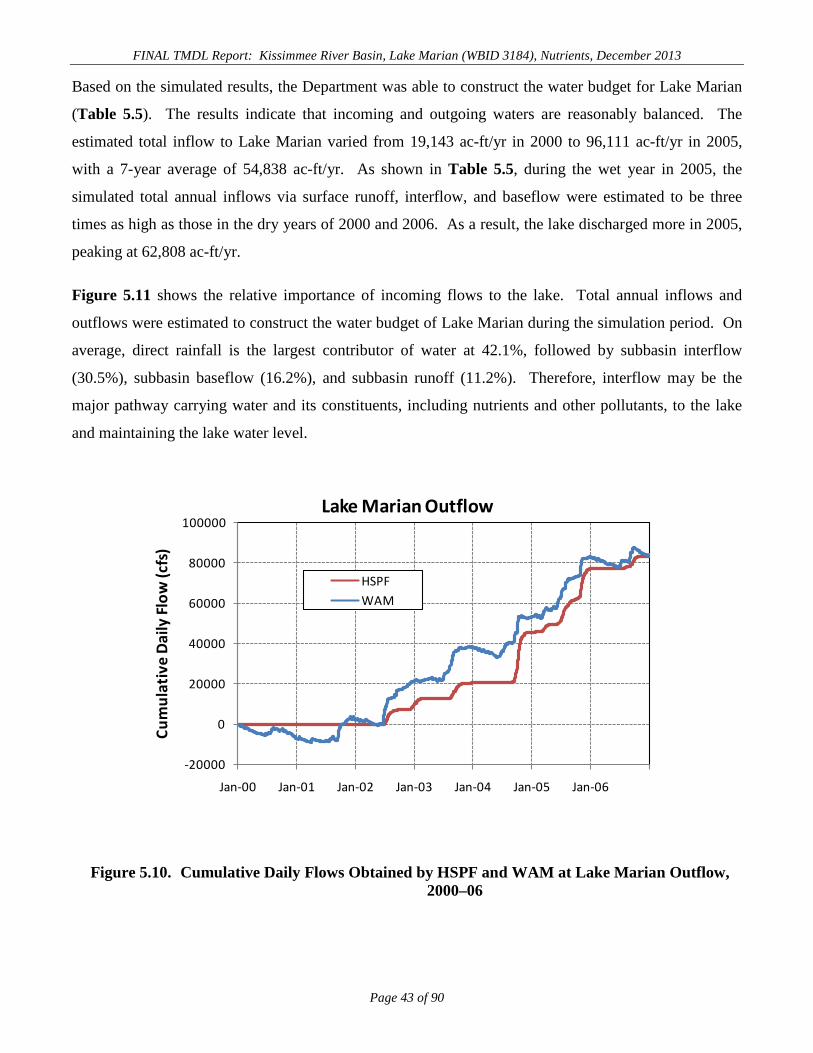
FINAL TMDL Report: Kissimmee River Basin, Lake Marian (WBID 3184), Nutrients, December 2013 Based on the simulated results, the Department was able to construct the water budget for Lake Marian
(Table 5.5). The results indicate that incoming and outgoing waters are reasonably balanced. The
estimated total inflow to Lake Marian varied from 19,143 ac-ft/yr in 2000 to 96,111 ac-ft/yr in 2005,
with a 7-year average of 54,838 ac-ft/yr. As shown in Table 5.5, during the wet year in 2005, the
simulated total annual inflows via surface runoff, interflow, and baseflow were estimated to be three
times as high as those in the dry years of 2000 and 2006. As a result, the lake discharged more in 2005,
peaking at 62,808 ac-ft/yr.
Figure 5.11 shows the relative importance of incoming flows to the lake. Total annual inflows and
outflows were estimated to construct the water budget of Lake Marian during the simulation period. On
average, direct rainfall is the largest contributor of water at 42.1%, followed by subbasin interflow
(30.5%), subbasin baseflow (16.2%), and subbasin runoff (11.2%). Therefore, interflow may be the
major pathway carrying water and its constituents, including nutrients and other pollutants, to the lake
and maintaining the lake water level.
Figure 5.10. Cumulative Daily Flows Obtained by HSPF and WAM at Lake Marian Outflow, 2000–06
-20000
0
20000
40000
60000
80000
100000
Jan-00 Jan-01 Jan-02 Jan-03 Jan-04 Jan-05 Jan-06
Cum
ulat
ive
Daily
Flow
(cfs
)
Lake Marian Outflow
HSPFWAM
Page 43 of 90
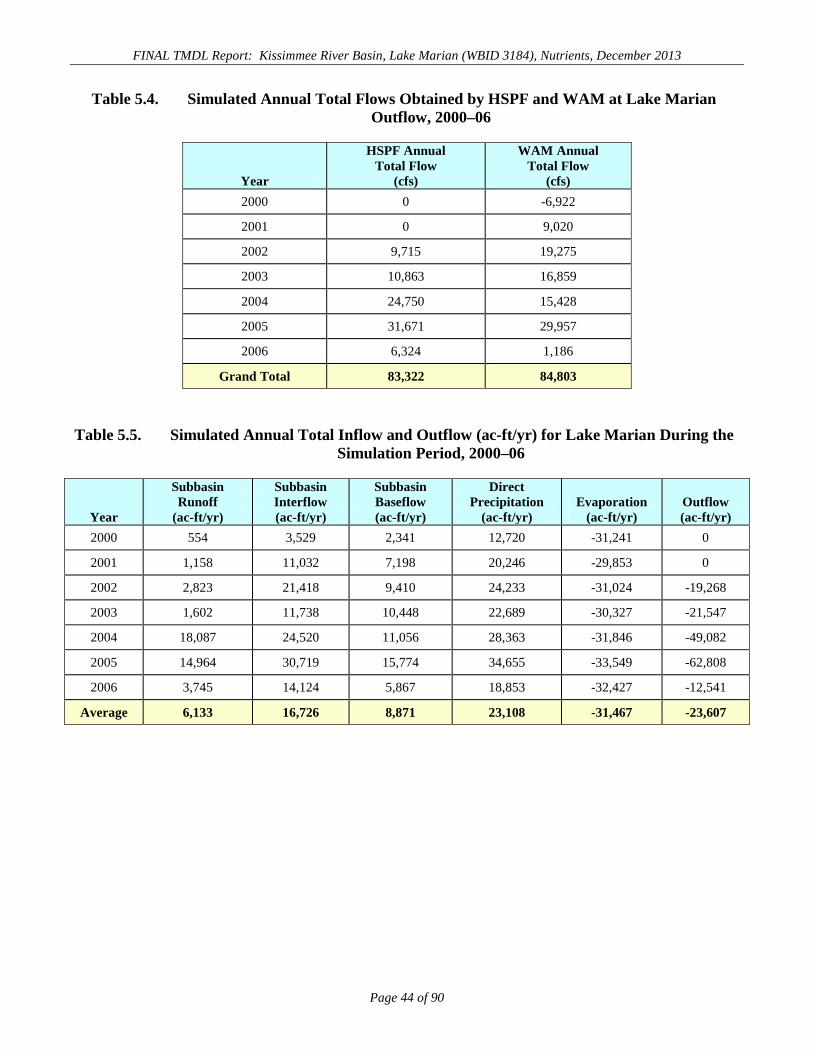
FINAL TMDL Report: Kissimmee River Basin, Lake Marian (WBID 3184), Nutrients, December 2013
Table 5.4. Simulated Annual Total Flows Obtained by HSPF and WAM at Lake Marian Outflow, 2000–06
Year
HSPF Annual Total Flow
(cfs)
WAM Annual Total Flow
(cfs) 2000 0 -6,922
2001 0 9,020
2002 9,715 19,275
2003 10,863 16,859
2004 24,750 15,428
2005 31,671 29,957
2006 6,324 1,186
Grand Total 83,322 84,803 Table 5.5. Simulated Annual Total Inflow and Outflow (ac-ft/yr) for Lake Marian During the
Simulation Period, 2000–06
Year
Subbasin Runoff
(ac-ft/yr)
Subbasin Interflow (ac-ft/yr)
Subbasin Baseflow (ac-ft/yr)
Direct Precipitation
(ac-ft/yr) Evaporation
(ac-ft/yr) Outflow (ac-ft/yr)
2000 554 3,529 2,341 12,720 -31,241 0
2001 1,158 11,032 7,198 20,246 -29,853 0
2002 2,823 21,418 9,410 24,233 -31,024 -19,268
2003 1,602 11,738 10,448 22,689 -30,327 -21,547
2004 18,087 24,520 11,056 28,363 -31,846 -49,082
2005 14,964 30,719 15,774 34,655 -33,549 -62,808
2006 3,745 14,124 5,867 18,853 -32,427 -12,541
Average 6,133 16,726 8,871 23,108 -31,467 -23,607
Page 44 of 90
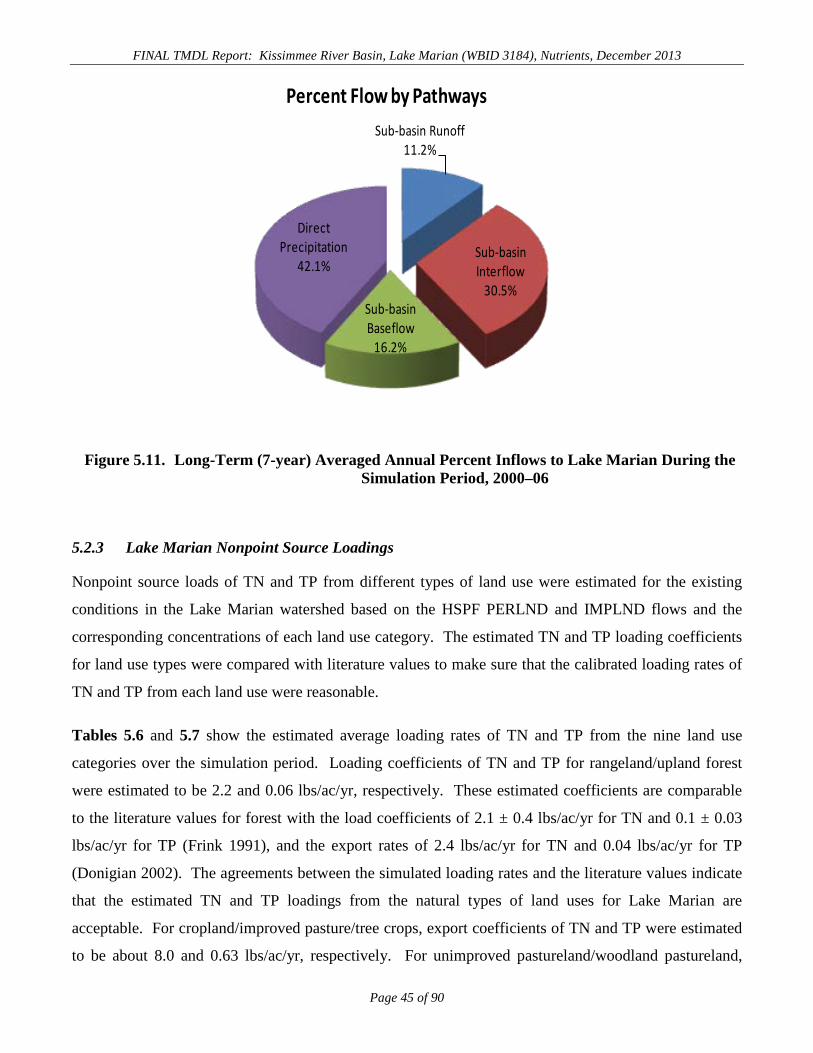
FINAL TMDL Report: Kissimmee River Basin, Lake Marian (WBID 3184), Nutrients, December 2013
Figure 5.11. Long-Term (7-year) Averaged Annual Percent Inflows to Lake Marian During the Simulation Period, 2000–06
5.2.3 Lake Marian Nonpoint Source Loadings
Nonpoint source loads of TN and TP from different types of land use were estimated for the existing
conditions in the Lake Marian watershed based on the HSPF PERLND and IMPLND flows and the
corresponding concentrations of each land use category. The estimated TN and TP loading coefficients
for land use types were compared with literature values to make sure that the calibrated loading rates of
TN and TP from each land use were reasonable.
Tables 5.6 and 5.7 show the estimated average loading rates of TN and TP from the nine land use
categories over the simulation period. Loading coefficients of TN and TP for rangeland/upland forest
were estimated to be 2.2 and 0.06 lbs/ac/yr, respectively. These estimated coefficients are comparable
to the literature values for forest with the load coefficients of 2.1 ± 0.4 lbs/ac/yr for TN and 0.1 ± 0.03
lbs/ac/yr for TP (Frink 1991), and the export rates of 2.4 lbs/ac/yr for TN and 0.04 lbs/ac/yr for TP
(Donigian 2002). The agreements between the simulated loading rates and the literature values indicate
that the estimated TN and TP loadings from the natural types of land uses for Lake Marian are
acceptable. For cropland/improved pasture/tree crops, export coefficients of TN and TP were estimated
to be about 8.0 and 0.63 lbs/ac/yr, respectively. For unimproved pastureland/woodland pastureland,
Sub-basin Runoff11.2%
Sub-basin Interflow
30.5%Sub-basin Baseflow
16.2%
Direct Precipitation
42.1%
Percent Flow by Pathways
Page 45 of 90
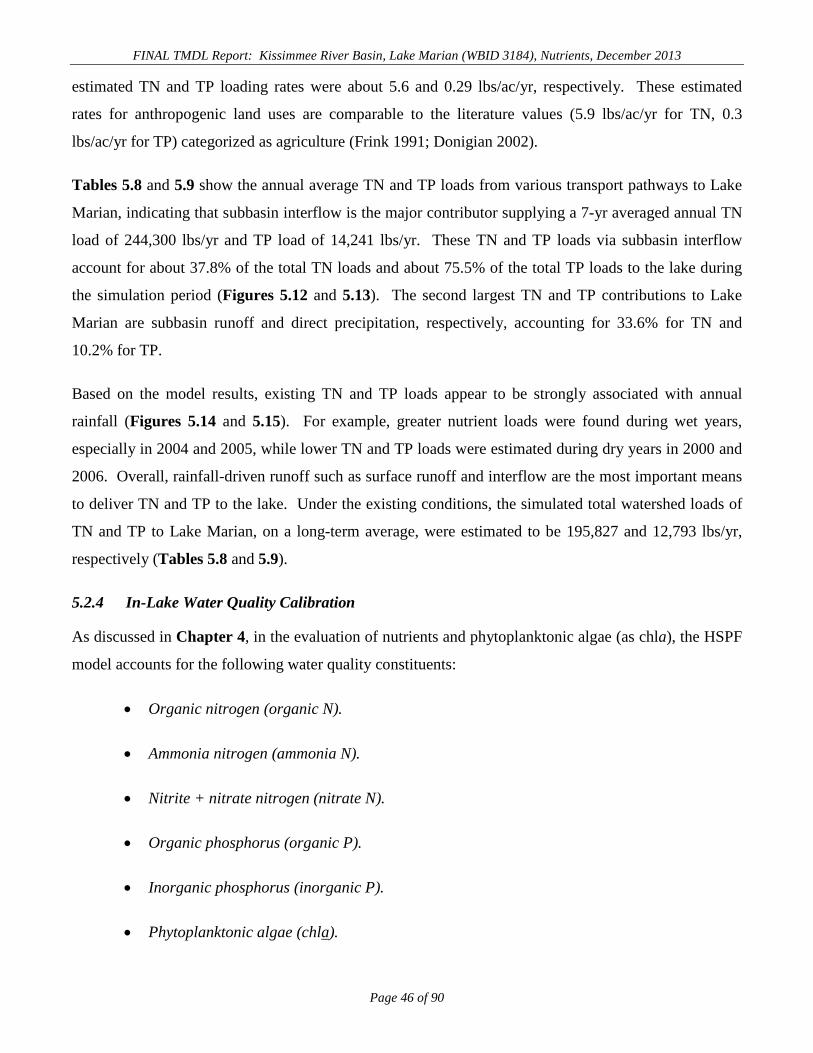
FINAL TMDL Report: Kissimmee River Basin, Lake Marian (WBID 3184), Nutrients, December 2013 estimated TN and TP loading rates were about 5.6 and 0.29 lbs/ac/yr, respectively. These estimated
rates for anthropogenic land uses are comparable to the literature values (5.9 lbs/ac/yr for TN, 0.3
lbs/ac/yr for TP) categorized as agriculture (Frink 1991; Donigian 2002).
Tables 5.8 and 5.9 show the annual average TN and TP loads from various transport pathways to Lake
Marian, indicating that subbasin interflow is the major contributor supplying a 7-yr averaged annual TN
load of 244,300 lbs/yr and TP load of 14,241 lbs/yr. These TN and TP loads via subbasin interflow
account for about 37.8% of the total TN loads and about 75.5% of the total TP loads to the lake during
the simulation period (Figures 5.12 and 5.13). The second largest TN and TP contributions to Lake
Marian are subbasin runoff and direct precipitation, respectively, accounting for 33.6% for TN and
10.2% for TP.
Based on the model results, existing TN and TP loads appear to be strongly associated with annual
rainfall (Figures 5.14 and 5.15). For example, greater nutrient loads were found during wet years,
especially in 2004 and 2005, while lower TN and TP loads were estimated during dry years in 2000 and
2006. Overall, rainfall-driven runoff such as surface runoff and interflow are the most important means
to deliver TN and TP to the lake. Under the existing conditions, the simulated total watershed loads of
TN and TP to Lake Marian, on a long-term average, were estimated to be 195,827 and 12,793 lbs/yr,
respectively (Tables 5.8 and 5.9).
5.2.4 In-Lake Water Quality Calibration
As discussed in Chapter 4, in the evaluation of nutrients and phytoplanktonic algae (as chla), the HSPF
model accounts for the following water quality constituents:
• Organic nitrogen (organic N).
• Ammonia nitrogen (ammonia N).
• Nitrite + nitrate nitrogen (nitrate N).
• Organic phosphorus (organic P).
• Inorganic phosphorus (inorganic P).
• Phytoplanktonic algae (chla).
Page 46 of 90
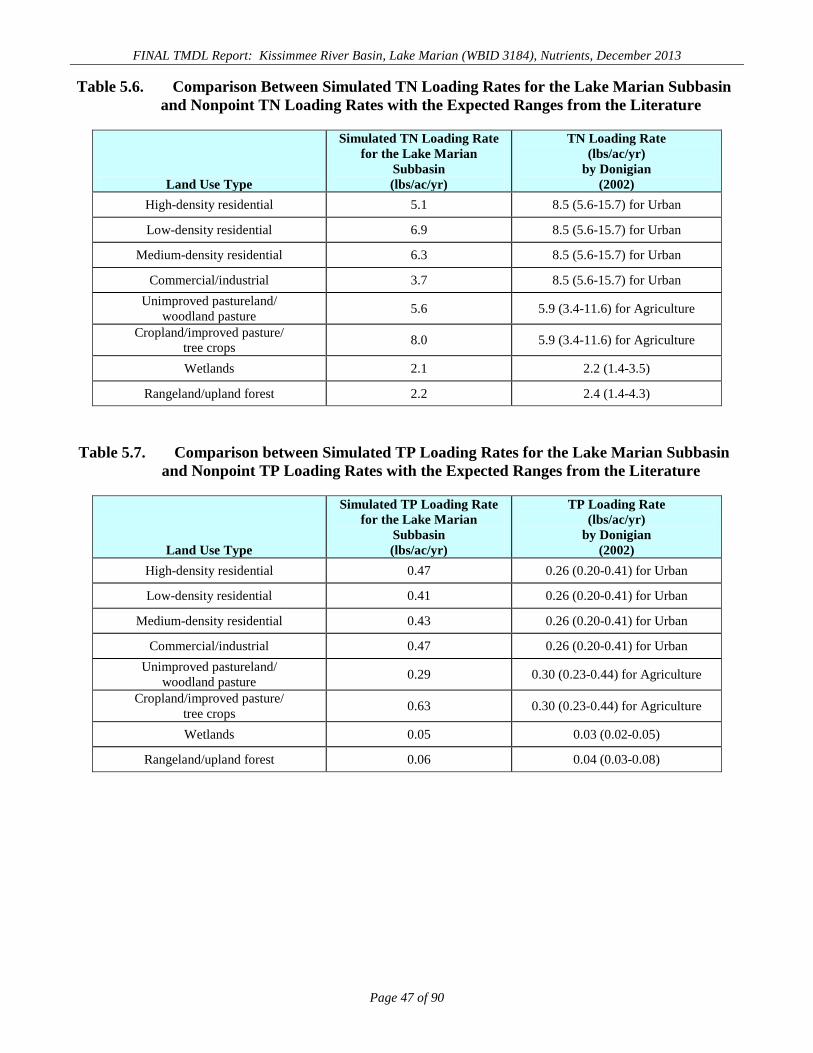
FINAL TMDL Report: Kissimmee River Basin, Lake Marian (WBID 3184), Nutrients, December 2013 Table 5.6. Comparison Between Simulated TN Loading Rates for the Lake Marian Subbasin
and Nonpoint TN Loading Rates with the Expected Ranges from the Literature
Land Use Type
Simulated TN Loading Rate for the Lake Marian
Subbasin (lbs/ac/yr)
TN Loading Rate (lbs/ac/yr)
by Donigian (2002)
High-density residential 5.1 8.5 (5.6-15.7) for Urban
Low-density residential 6.9 8.5 (5.6-15.7) for Urban
Medium-density residential 6.3 8.5 (5.6-15.7) for Urban
Commercial/industrial 3.7 8.5 (5.6-15.7) for Urban Unimproved pastureland/
woodland pasture 5.6 5.9 (3.4-11.6) for Agriculture
Cropland/improved pasture/ tree crops 8.0 5.9 (3.4-11.6) for Agriculture
Wetlands 2.1 2.2 (1.4-3.5)
Rangeland/upland forest 2.2 2.4 (1.4-4.3) Table 5.7. Comparison between Simulated TP Loading Rates for the Lake Marian Subbasin
and Nonpoint TP Loading Rates with the Expected Ranges from the Literature
Land Use Type
Simulated TP Loading Rate for the Lake Marian
Subbasin (lbs/ac/yr)
TP Loading Rate (lbs/ac/yr)
by Donigian (2002)
High-density residential 0.47 0.26 (0.20-0.41) for Urban
Low-density residential 0.41 0.26 (0.20-0.41) for Urban
Medium-density residential 0.43 0.26 (0.20-0.41) for Urban
Commercial/industrial 0.47 0.26 (0.20-0.41) for Urban Unimproved pastureland/
woodland pasture 0.29 0.30 (0.23-0.44) for Agriculture
Cropland/improved pasture/ tree crops 0.63 0.30 (0.23-0.44) for Agriculture
Wetlands 0.05 0.03 (0.02-0.05)
Rangeland/upland forest 0.06 0.04 (0.03-0.08)
Page 47 of 90
FINAL TMDL Report: Kissimmee River Basin, Lake Marian (WBID 3184), Nutrients, December 2013
Table 5.8. Simulated Annual TN Loads (lbs/yr) to Lake Marian via Various Transport Pathways under the Current Condition
Year
TN Load by Subbasin Runoff
(lbs/yr)
TN Load by Subbasin Interflow
(lbs/yr)
TN Load by Subbasin Baseflow (lbs/yr)
TN Load by Direct
Precipitation (lbs/yr)
Total Incoming TN Load (lbs/yr)
2000 13,048 21,113 5,735 26,663 66,559
2001 34,336 62,743 17,527 42,425 157,031
2002 89,229 116813 22,836 50,797 279,675
2003 45,304 63,922 25,554 47,552 182,333
2004 104,782 133,451 26,976 59,530 324,738
2005 188,957 168,635 37,994 72,772 468,358
2006 98,738 79,074 14,019 39,578 231,409
Average 82,056 92,250 21,520 48,474 244,300
Table 5.9. Simulated Annual TP Loads (lbs/yr) to Lake Marian via Various Transport Pathways under the Current Condition
Year
TP Load by Subbasin Runoff
(lbs/yr)
TP Load by Subbasin Interflow
(lbs/yr)
TP Load by Subbasin Baseflow (lbs/yr)
TP Load by Direct
Precipitation (lbs/yr)
Total Incoming TP Load (lbs/yr)
2000 168 2,526 347 796 3,838
2001 335 7,389 1,060 1,267 10,051
2002 716 13,565 1,380 1,517 17,178
2003 424 7,416 1,546 1,420 10,806
2004 1,081 15,488 1,631 1,778 19,979
2005 1,621 19,622 2,292 2,174 25,709
2006 834 9,267 844 1,182 12,127
Average 740 10,753 1,300 1,448 14,241
Page 48 of 90
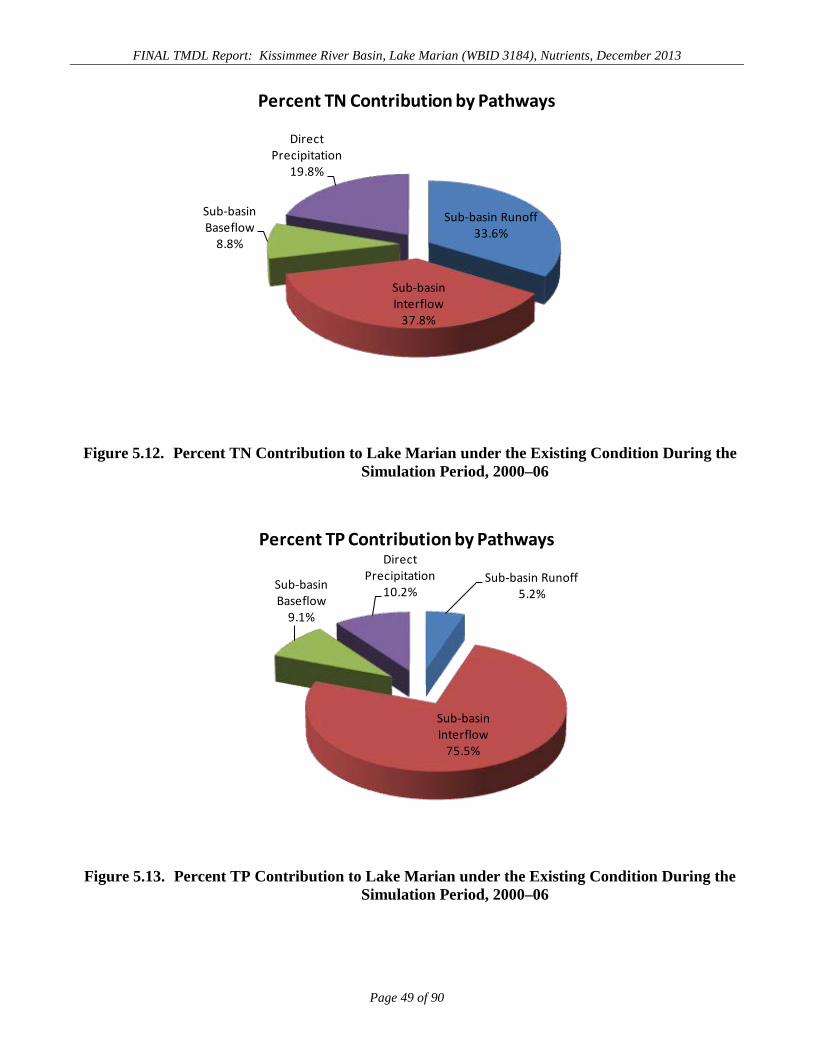
FINAL TMDL Report: Kissimmee River Basin, Lake Marian (WBID 3184), Nutrients, December 2013
Figure 5.12. Percent TN Contribution to Lake Marian under the Existing Condition During the Simulation Period, 2000–06
Figure 5.13. Percent TP Contribution to Lake Marian under the Existing Condition During the Simulation Period, 2000–06
Sub-basin Runoff33.6%
Sub-basin Interflow
37.8%
Sub-basin Baseflow
8.8%
Direct Precipitation
19.8%
Percent TN Contribution by Pathways
Sub-basin Runoff5.2%
Sub-basin Interflow
75.5%
Sub-basin Baseflow
9.1%
Direct Precipitation
10.2%
Percent TP Contribution by Pathways
Page 49 of 90
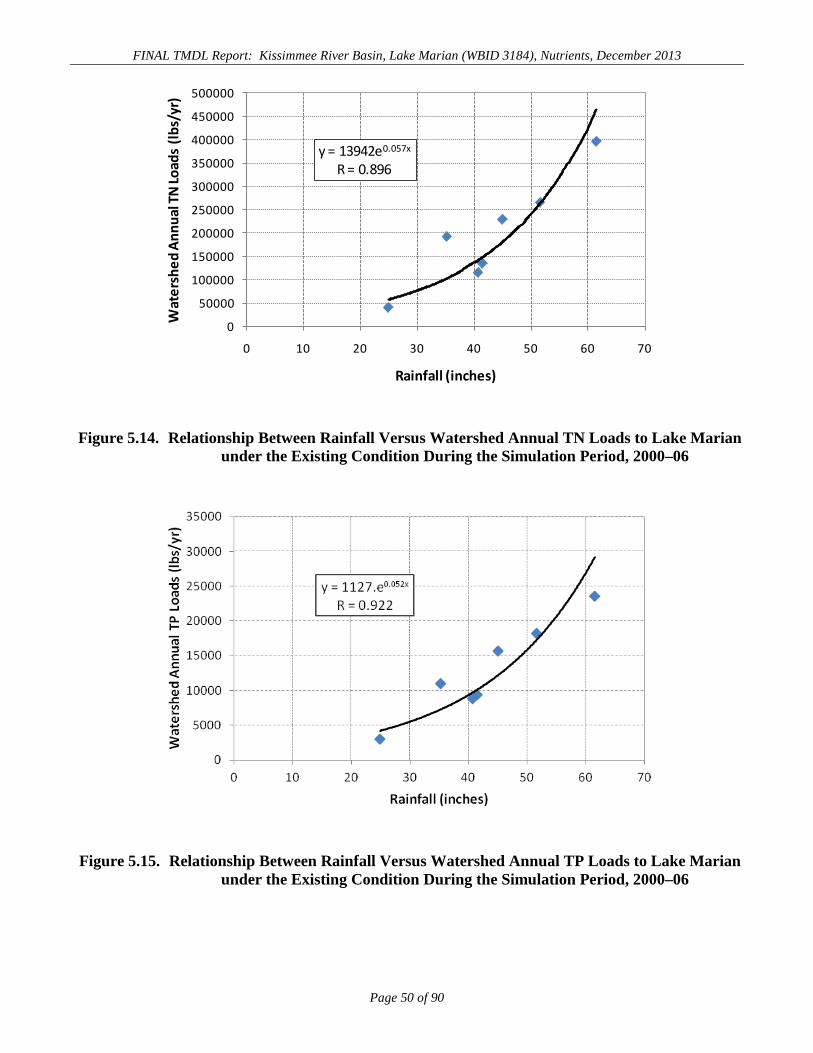
FINAL TMDL Report: Kissimmee River Basin, Lake Marian (WBID 3184), Nutrients, December 2013
Figure 5.14. Relationship Between Rainfall Versus Watershed Annual TN Loads to Lake Marian under the Existing Condition During the Simulation Period, 2000–06
Figure 5.15. Relationship Between Rainfall Versus Watershed Annual TP Loads to Lake Marian under the Existing Condition During the Simulation Period, 2000–06
y = 13942e0.057x
R = 0.896
0
50000
100000
150000
200000
250000
300000
350000
400000
450000
500000
0 10 20 30 40 50 60 70
Wat
ersh
ed A
nnua
l TN
Load
s (lb
s/yr
)
Rainfall (inches)
Page 50 of 90
FINAL TMDL Report: Kissimmee River Basin, Lake Marian (WBID 3184), Nutrients, December 2013 Organic N and organic P in the model are associated with several water quality constituents, including
ultimate CBOD, phytoplankton, and refractory organics that result from the death of algae. The
following key processes affect the model simulation of phytoplankton concentration in receiving waters:
phytoplankton growth, phytoplankton respiration, phytoplankton death, and phytoplankton settling.
Phytoplankton growth is modeled based on a specified maximum growth rate, which is adjusted by the
model based on water temperature, and is limited by the model based on available light and inorganic N
and P. Similarly, death and respiration are modeled based on specified rates that are adjusted for water
temperature. A higher death rate may be applied by the model under certain conditions (e.g., high water
temperature, high chla concentration). Settling is modeled based on a constant settling rate. Growth
increases the concentration of phytoplankton, while the other processes reduce the concentration of
phytoplankton.
The key processes affecting the model simulation of nitrogen concentrations in receiving waters include
the following:
• First-order decay of biochemical oxygen demand (BOD) (organic N associated with
BOD is converted to ammonia N in this process).
• BOD settling (organic N associated with BOD is lost to lake sediments).
• Phytoplankton growth (inorganic N is converted to phytoplankton N).
• Phytoplankton respiration (phytoplankton N is converted to ammonia N).
• Phytoplankton death (phytoplankton N is converted to BOD and/or refractory organic
N).
• Phytoplankton settling (phytoplankton N is lost to lake sediments).
• Refractory organic N settling to lake sediments.
• Nitrification (conversion of ammonia N to nitrate N).
• Sediment flux (ammonia N is released from sediment to overlying water).
Page 51 of 90
FINAL TMDL Report: Kissimmee River Basin, Lake Marian (WBID 3184), Nutrients, December 2013 Ultimately, the rate at which nitrogen is removed from the receiving water depends on the rate at which
inorganic N is converted to organic N (by phytoplankton growth) and the rate at which the organic N
forms (as BOD, as refractory organic N, and as phytoplankton N) settle to the lake sediments.
The key processes affecting the model simulation of phosphorus concentrations in the lake include the
following:
• First-order decay of BOD (organic P associated with BOD is converted to inorganic
P in this process).
• BOD settling (organic P associated with BOD is lost to lake sediments).
• Phytoplankton growth (inorganic P is converted to phytoplankton P).
• Phytoplankton respiration (phytoplankton P is converted to inorganic P).
• Phytoplankton death (phytoplankton P is converted to BOD and/or refractory organic
P).
• Phytoplankton settling (phytoplankton P is lost to lake sediments).
• Refractory organic P settling to lake sediments.
• Sediment flux (inorganic P is released from sediment to overlying water).
Ultimately, the rate at which phosphorus is removed from the lake water depends on the rate at which
inorganic P is converted to organic P (by phytoplankton growth) and the rate at which the organic P
forms (as BOD, as refractory organic P, and as phytoplankton P) settle to the lake sediments.
Waterbodies with long mean residence times (months or years) allow substantial time and relatively
quiescent conditions for phytoplankton growth. In contrast, these processes are expected to have little
impact in free-flowing stream reaches with short residence times (a day or less) and relatively turbulent
conditions. However, it is possible to see high phytoplankton levels in streams during dry weather
periods, if the stream has some areas of standing water.
Reaeration is a process of exchange between the water and the overlying atmosphere that typically
brings oxygen into the receiving water (unless the receiving water DO concentration is above saturation
Page 52 of 90
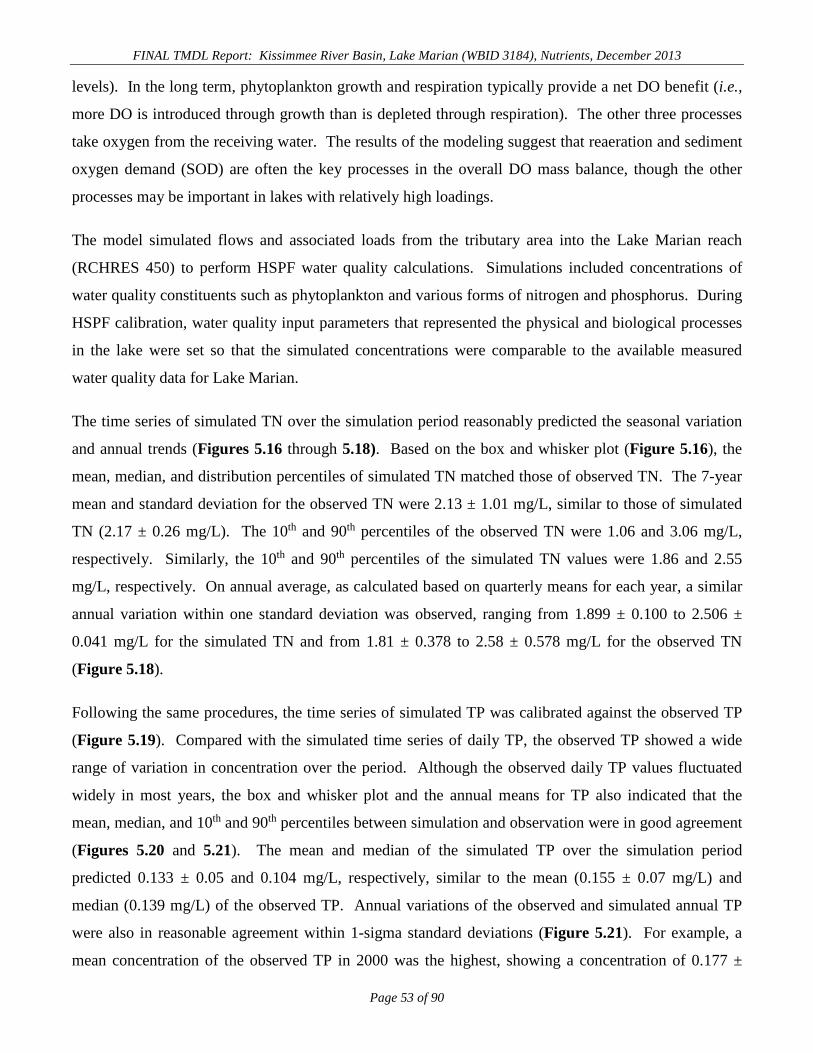
FINAL TMDL Report: Kissimmee River Basin, Lake Marian (WBID 3184), Nutrients, December 2013 levels). In the long term, phytoplankton growth and respiration typically provide a net DO benefit (i.e.,
more DO is introduced through growth than is depleted through respiration). The other three processes
take oxygen from the receiving water. The results of the modeling suggest that reaeration and sediment
oxygen demand (SOD) are often the key processes in the overall DO mass balance, though the other
processes may be important in lakes with relatively high loadings.
The model simulated flows and associated loads from the tributary area into the Lake Marian reach
(RCHRES 450) to perform HSPF water quality calculations. Simulations included concentrations of
water quality constituents such as phytoplankton and various forms of nitrogen and phosphorus. During
HSPF calibration, water quality input parameters that represented the physical and biological processes
in the lake were set so that the simulated concentrations were comparable to the available measured
water quality data for Lake Marian.
The time series of simulated TN over the simulation period reasonably predicted the seasonal variation
and annual trends (Figures 5.16 through 5.18). Based on the box and whisker plot (Figure 5.16), the
mean, median, and distribution percentiles of simulated TN matched those of observed TN. The 7-year
mean and standard deviation for the observed TN were 2.13 ± 1.01 mg/L, similar to those of simulated
TN (2.17 ± 0.26 mg/L). The 10th and 90th percentiles of the observed TN were 1.06 and 3.06 mg/L,
respectively. Similarly, the 10th and 90th percentiles of the simulated TN values were 1.86 and 2.55
mg/L, respectively. On annual average, as calculated based on quarterly means for each year, a similar
annual variation within one standard deviation was observed, ranging from 1.899 ± 0.100 to 2.506 ±
0.041 mg/L for the simulated TN and from 1.81 ± 0.378 to 2.58 ± 0.578 mg/L for the observed TN
(Figure 5.18).
Following the same procedures, the time series of simulated TP was calibrated against the observed TP
(Figure 5.19). Compared with the simulated time series of daily TP, the observed TP showed a wide
range of variation in concentration over the period. Although the observed daily TP values fluctuated
widely in most years, the box and whisker plot and the annual means for TP also indicated that the
mean, median, and 10th and 90th percentiles between simulation and observation were in good agreement
(Figures 5.20 and 5.21). The mean and median of the simulated TP over the simulation period
predicted 0.133 ± 0.05 and 0.104 mg/L, respectively, similar to the mean (0.155 ± 0.07 mg/L) and
median (0.139 mg/L) of the observed TP. Annual variations of the observed and simulated annual TP
were also in reasonable agreement within 1-sigma standard deviations (Figure 5.21). For example, a
mean concentration of the observed TP in 2000 was the highest, showing a concentration of 0.177 ±
Page 53 of 90
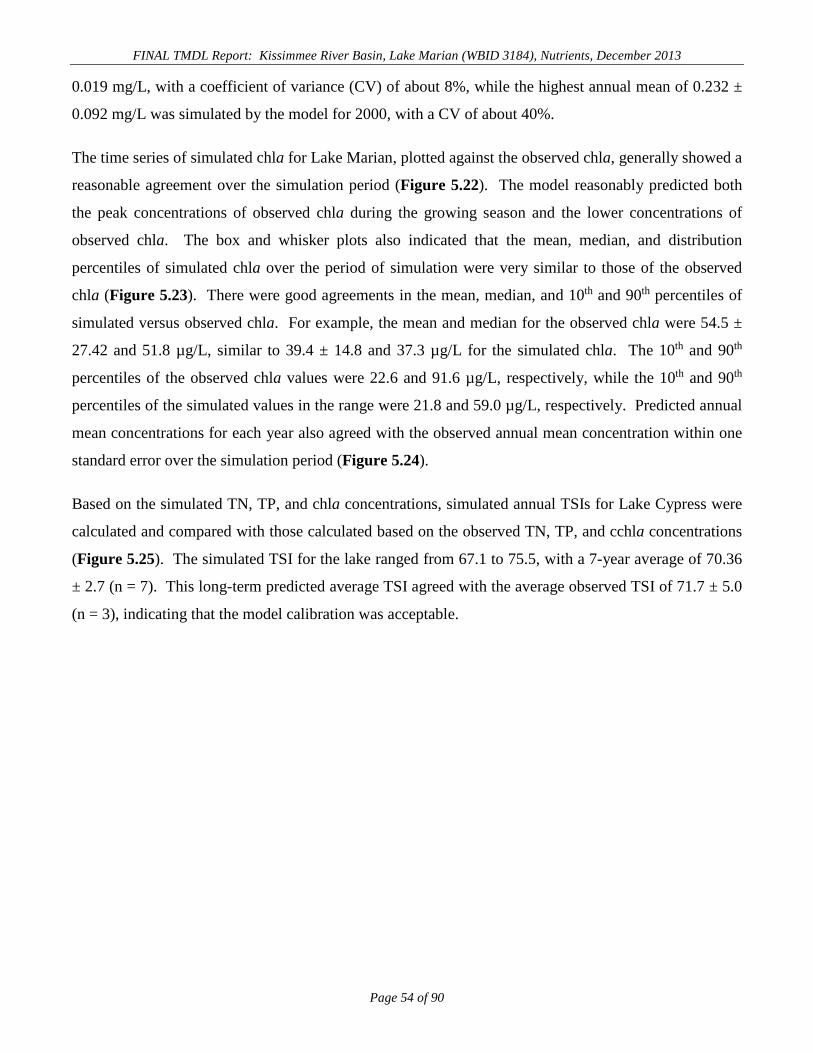
FINAL TMDL Report: Kissimmee River Basin, Lake Marian (WBID 3184), Nutrients, December 2013 0.019 mg/L, with a coefficient of variance (CV) of about 8%, while the highest annual mean of 0.232 ±
0.092 mg/L was simulated by the model for 2000, with a CV of about 40%.
The time series of simulated chla for Lake Marian, plotted against the observed chla, generally showed a
reasonable agreement over the simulation period (Figure 5.22). The model reasonably predicted both
the peak concentrations of observed chla during the growing season and the lower concentrations of
observed chla. The box and whisker plots also indicated that the mean, median, and distribution
percentiles of simulated chla over the period of simulation were very similar to those of the observed
chla (Figure 5.23). There were good agreements in the mean, median, and 10th and 90th percentiles of
simulated versus observed chla. For example, the mean and median for the observed chla were 54.5 ±
27.42 and 51.8 µg/L, similar to 39.4 ± 14.8 and 37.3 µg/L for the simulated chla. The 10th and 90th
percentiles of the observed chla values were 22.6 and 91.6 µg/L, respectively, while the 10th and 90th
percentiles of the simulated values in the range were 21.8 and 59.0 µg/L, respectively. Predicted annual
mean concentrations for each year also agreed with the observed annual mean concentration within one
standard error over the simulation period (Figure 5.24).
Based on the simulated TN, TP, and chla concentrations, simulated annual TSIs for Lake Cypress were
calculated and compared with those calculated based on the observed TN, TP, and cchla concentrations
(Figure 5.25). The simulated TSI for the lake ranged from 67.1 to 75.5, with a 7-year average of 70.36
± 2.7 (n = 7). This long-term predicted average TSI agreed with the average observed TSI of 71.7 ± 5.0
(n = 3), indicating that the model calibration was acceptable.
Page 54 of 90
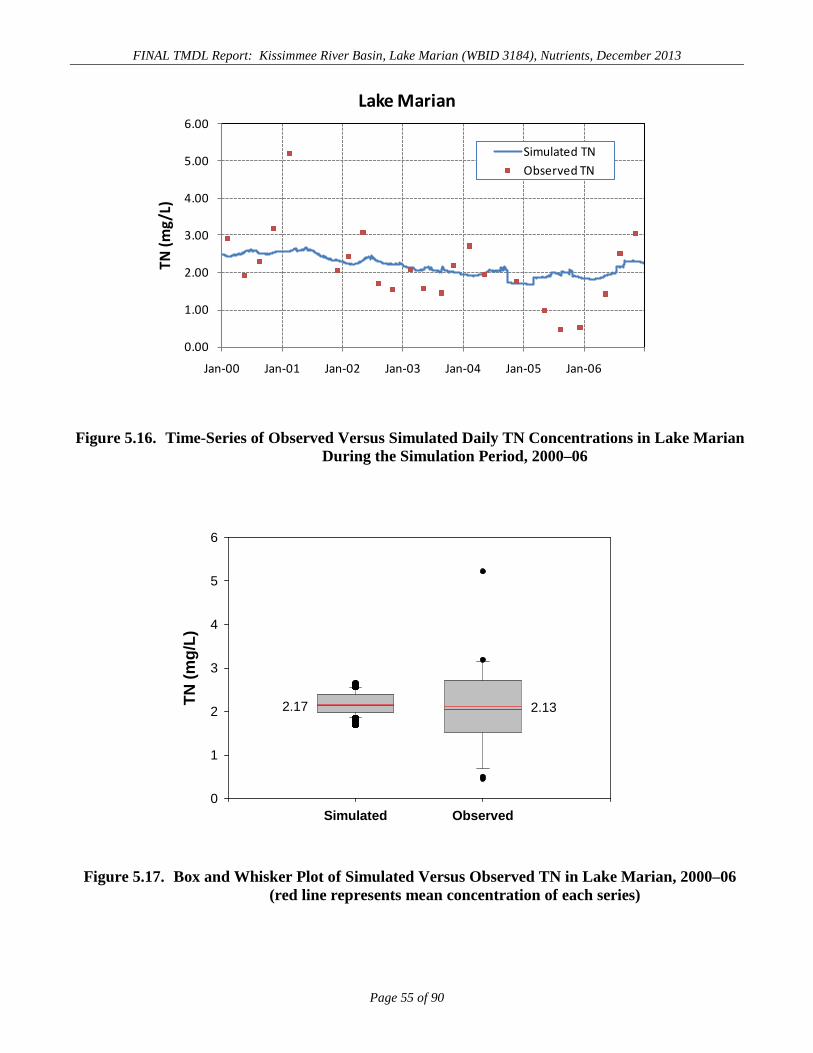
FINAL TMDL Report: Kissimmee River Basin, Lake Marian (WBID 3184), Nutrients, December 2013
Figure 5.16. Time-Series of Observed Versus Simulated Daily TN Concentrations in Lake Marian During the Simulation Period, 2000–06
Figure 5.17. Box and Whisker Plot of Simulated Versus Observed TN in Lake Marian, 2000–06 (red line represents mean concentration of each series)
0.00
1.00
2.00
3.00
4.00
5.00
6.00
Jan-00 Jan-01 Jan-02 Jan-03 Jan-04 Jan-05 Jan-06
TN (m
g/L)
Lake Marian
Simulated TNObserved TN
Simulated Observed
TN (m
g/L)
0
1
2
3
4
5
6
2.17 2.13
Page 55 of 90
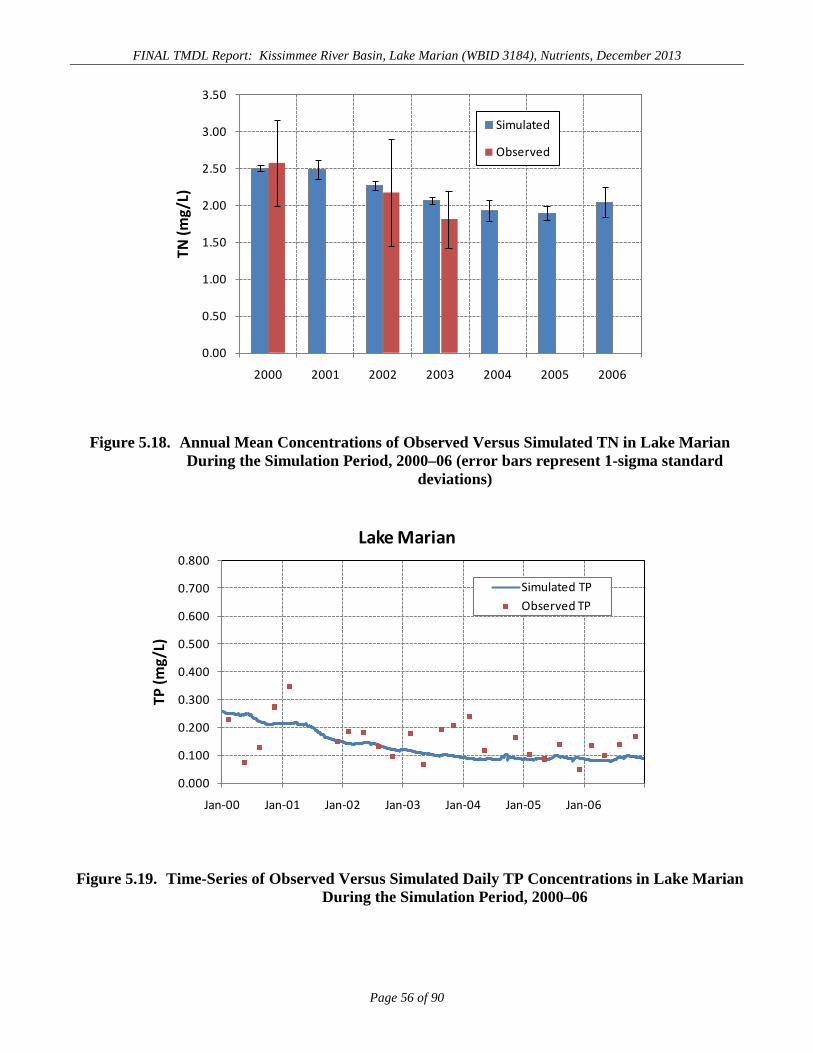
FINAL TMDL Report: Kissimmee River Basin, Lake Marian (WBID 3184), Nutrients, December 2013
Figure 5.18. Annual Mean Concentrations of Observed Versus Simulated TN in Lake Marian During the Simulation Period, 2000–06 (error bars represent 1-sigma standard
deviations)
Figure 5.19. Time-Series of Observed Versus Simulated Daily TP Concentrations in Lake Marian During the Simulation Period, 2000–06
0.00
0.50
1.00
1.50
2.00
2.50
3.00
3.50
2000 2001 2002 2003 2004 2005 2006
TN (m
g/L)
Simulated
Observed
0.000
0.100
0.200
0.300
0.400
0.500
0.600
0.700
0.800
Jan-00 Jan-01 Jan-02 Jan-03 Jan-04 Jan-05 Jan-06
TP (m
g/L)
Lake Marian
Simulated TPObserved TP
Page 56 of 90
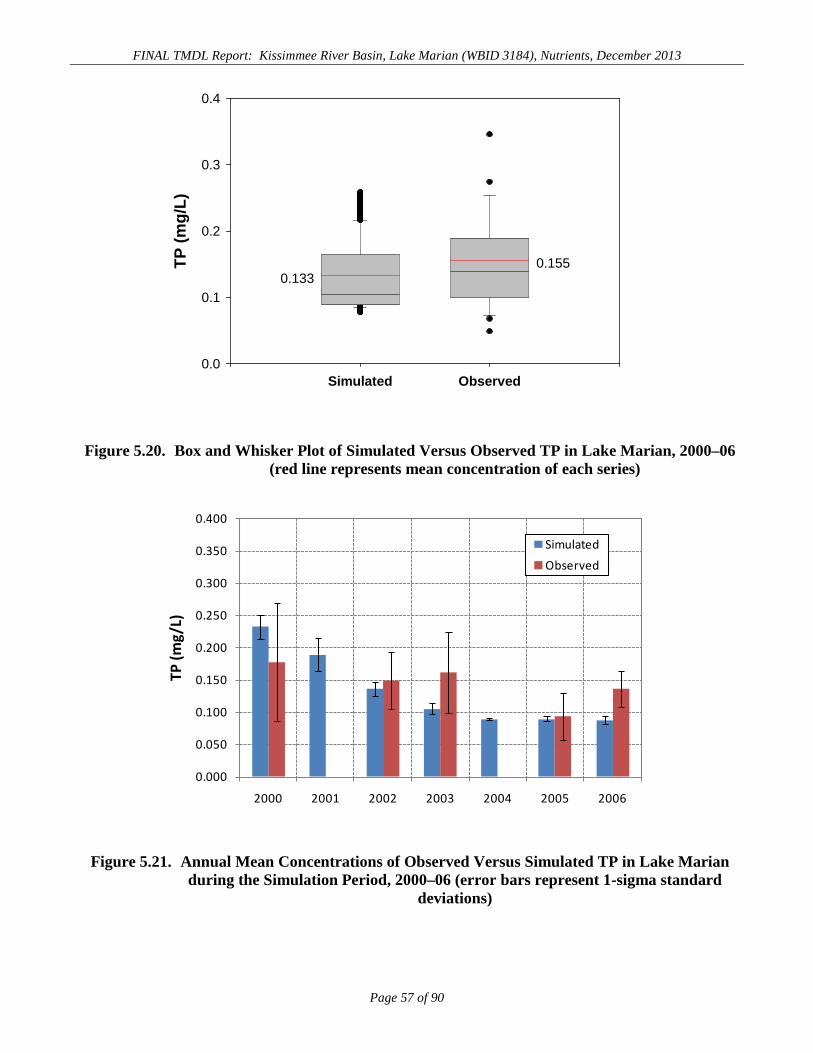
FINAL TMDL Report: Kissimmee River Basin, Lake Marian (WBID 3184), Nutrients, December 2013
Figure 5.20. Box and Whisker Plot of Simulated Versus Observed TP in Lake Marian, 2000–06 (red line represents mean concentration of each series)
Figure 5.21. Annual Mean Concentrations of Observed Versus Simulated TP in Lake Marian during the Simulation Period, 2000–06 (error bars represent 1-sigma standard
deviations)
Simulated Observed
TP (m
g/L)
0.0
0.1
0.2
0.3
0.4
0.1330.155
0.000
0.050
0.100
0.150
0.200
0.250
0.300
0.350
0.400
2000 2001 2002 2003 2004 2005 2006
TP (m
g/L)
SimulatedObserved
Page 57 of 90
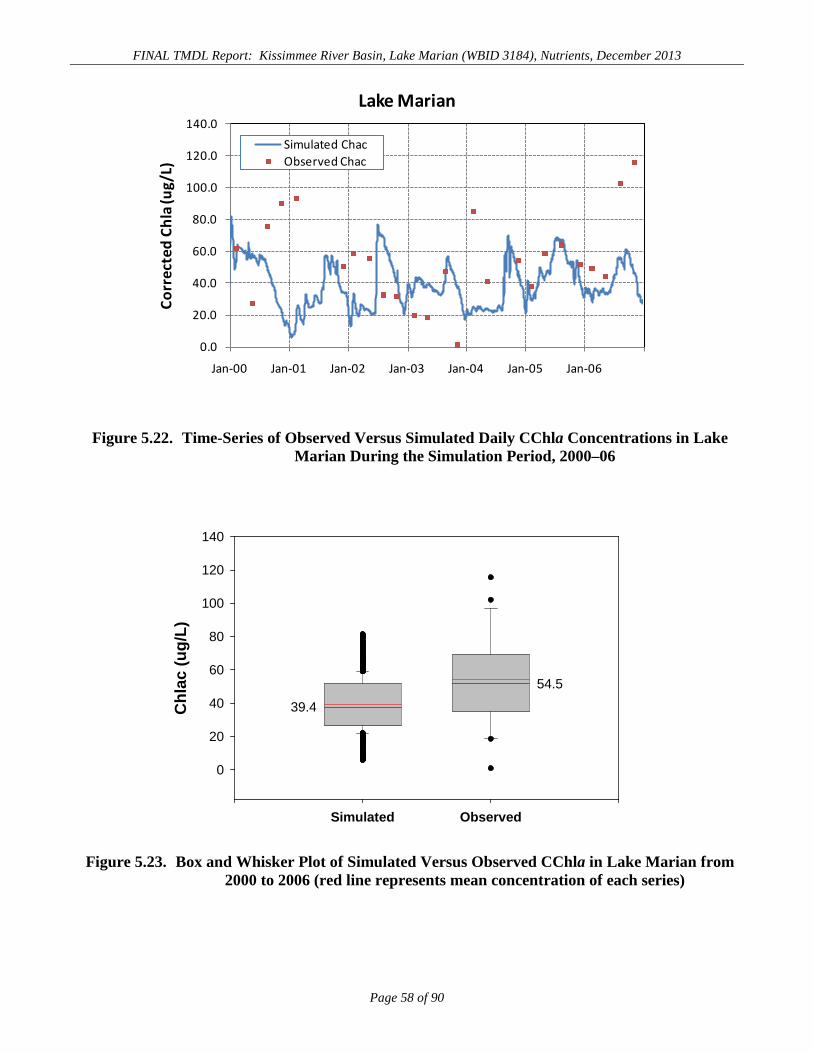
FINAL TMDL Report: Kissimmee River Basin, Lake Marian (WBID 3184), Nutrients, December 2013
Figure 5.22. Time-Series of Observed Versus Simulated Daily CChla Concentrations in Lake Marian During the Simulation Period, 2000–06
Figure 5.23. Box and Whisker Plot of Simulated Versus Observed CChla in Lake Marian from 2000 to 2006 (red line represents mean concentration of each series)
0.0
20.0
40.0
60.0
80.0
100.0
120.0
140.0
Jan-00 Jan-01 Jan-02 Jan-03 Jan-04 Jan-05 Jan-06
Corr
ecte
d Ch
la (u
g/L)
Lake Marian
Simulated ChacObserved Chac
Simulated Observed
Chl
ac (u
g/L)
0
20
40
60
80
100
120
140
39.4
54.5
Page 58 of 90
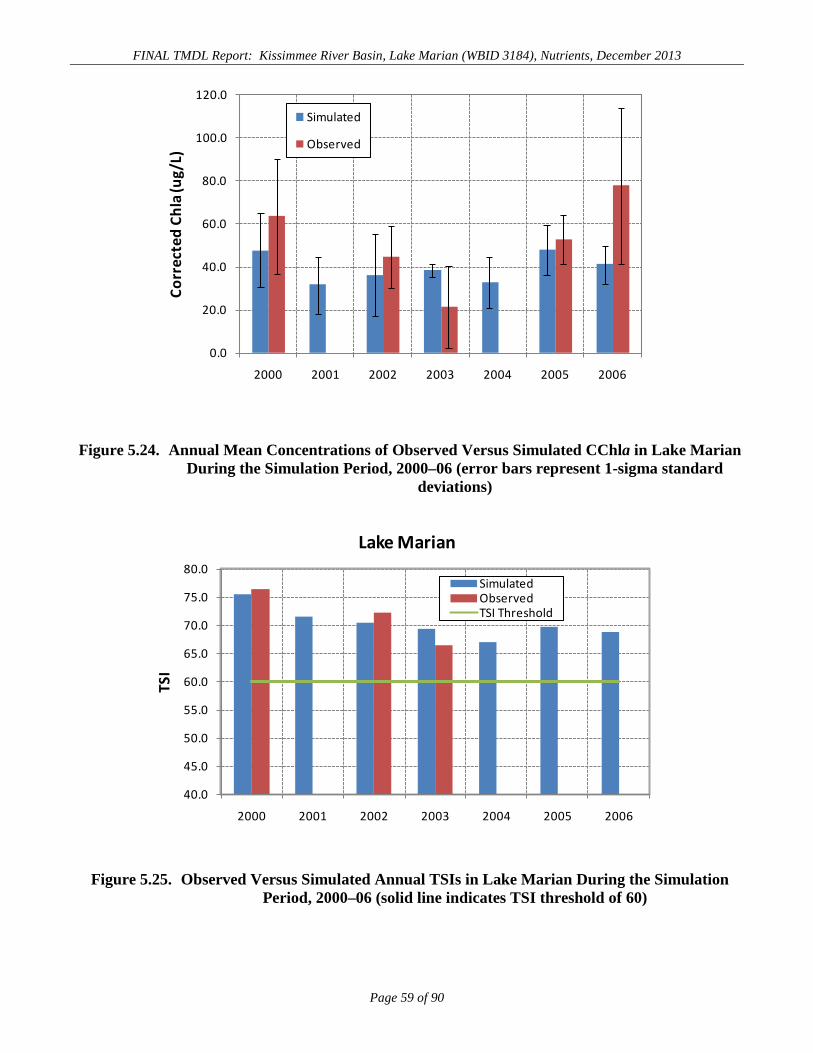
FINAL TMDL Report: Kissimmee River Basin, Lake Marian (WBID 3184), Nutrients, December 2013
Figure 5.24. Annual Mean Concentrations of Observed Versus Simulated CChla in Lake Marian During the Simulation Period, 2000–06 (error bars represent 1-sigma standard
deviations)
Figure 5.25. Observed Versus Simulated Annual TSIs in Lake Marian During the Simulation Period, 2000–06 (solid line indicates TSI threshold of 60)
0.0
20.0
40.0
60.0
80.0
100.0
120.0
2000 2001 2002 2003 2004 2005 2006
Corr
ecte
d Ch
la (u
g/L)
Simulated
Observed
40.0
45.0
50.0
55.0
60.0
65.0
70.0
75.0
80.0
2000 2001 2002 2003 2004 2005 2006
TSI
Lake Marian
SimulatedObservedTSI Threshold
Page 59 of 90
FINAL TMDL Report: Kissimmee River Basin, Lake Marian (WBID 3184), Nutrients, December 2013
5.3 Background Conditions HSPF was used to evaluate the “natural land use background condition” for the Lake Marian watershed.
For this simulation, all current land uses were “reassigned” to a mixture of forest and wetland. The
current condition was maintained the same as in the calibrated model for all waterbody physical
characteristics. From this point forward, the natural land use background is referred to as “background.”
As discussed earlier, for existing conditions, the threshold TSI value of 60 was exceeded in all 7 years of
the simulation (as well as the measured data), and the lake is considered co-limited by nitrogen and
phosphorus (average ratio of 13.5). Based on the background model run results, the predeveloped lake
should have had annual average TP concentrations ranging from 0.024 to 0.040 mg/L, with a long-term
average of 0.030 mg/L. The predeveloped annual average TN concentrations ranged between 0.93 and
1.22 mg/L, with a long-term average of 1.13 mg/L. The predeveloped annual average chla ranged from
9.8 to 13.9 µg/L, with an average of 11.2 µg/L. The resulting annual average TSI values ranged
between 51.9 and 55.5, with a long-term average of 53.1.
5.4 Selection of the TMDL Target It should be recognized that the direct application of background as the target TSI would not allow for
any assimilative capacity. The IWR uses, as one measure of impairment in lakes, a 10-unit change in
the TSI from “historical” levels. This 10-unit increase is assumed to represent the transition of a lake
from one trophic state (e.g., mesotrophic) to another nutrient-enriched condition (eutrophic). The
Department has assumed that allowing a 5-unit increase in TSI over the background condition would
prevent a lake from becoming impaired (changing trophic states) and reserves 5 TSI units to allow for
future changes in the basin and as part of the implicit margin of safety (MOS) in establishing the
assimilative capacity. The final target developed for the restoration of Lake Marian includes achieving a
long-term average TSI less than or equal to 58.1 (background of 53.1 plus 5). Table 5.10 shows that the
existing TSI for Lake Jackson may improve as Lake Marian meets the TSI target under the TMDL
condition.
Page 60 of 90
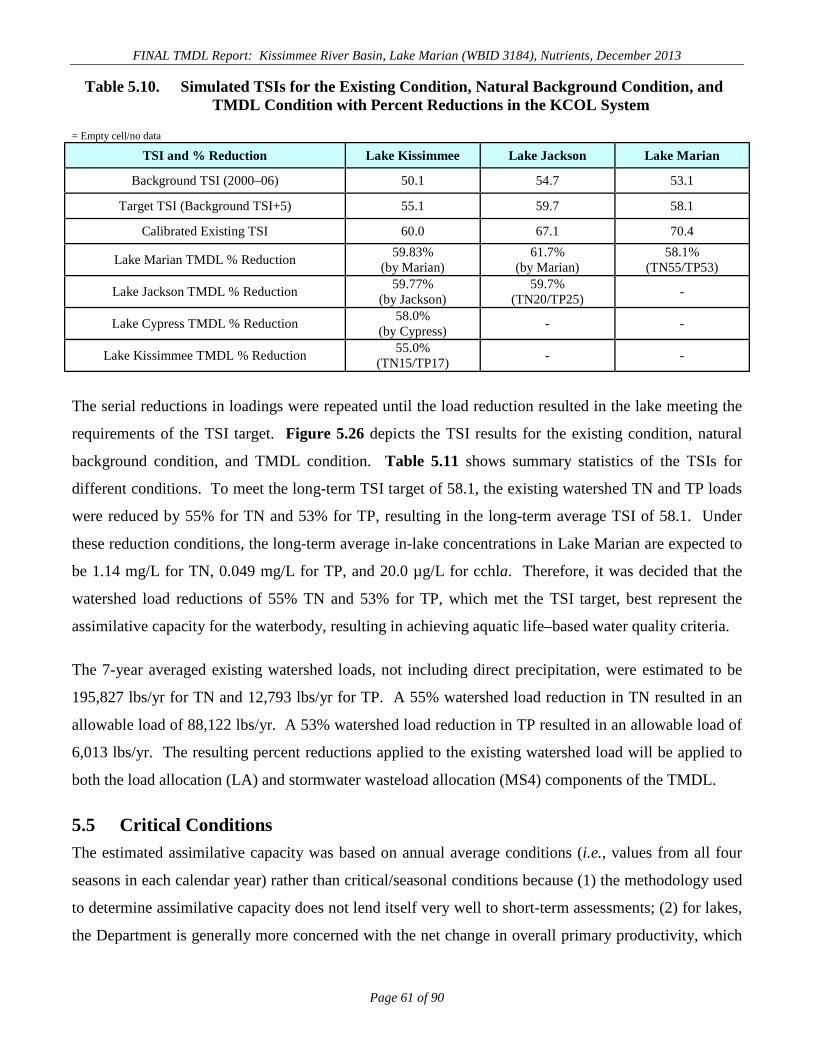
FINAL TMDL Report: Kissimmee River Basin, Lake Marian (WBID 3184), Nutrients, December 2013
Table 5.10. Simulated TSIs for the Existing Condition, Natural Background Condition, and TMDL Condition with Percent Reductions in the KCOL System
= Empty cell/no data
TSI and % Reduction Lake Kissimmee Lake Jackson Lake Marian
Background TSI (2000–06) 50.1 54.7 53.1
Target TSI (Background TSI+5) 55.1 59.7 58.1
Calibrated Existing TSI 60.0 67.1 70.4
Lake Marian TMDL % Reduction 59.83% (by Marian)
61.7% (by Marian)
58.1% (TN55/TP53)
Lake Jackson TMDL % Reduction 59.77% (by Jackson)
59.7% (TN20/TP25) -
Lake Cypress TMDL % Reduction 58.0% (by Cypress) - -
Lake Kissimmee TMDL % Reduction 55.0% (TN15/TP17) - -
The serial reductions in loadings were repeated until the load reduction resulted in the lake meeting the
requirements of the TSI target. Figure 5.26 depicts the TSI results for the existing condition, natural
background condition, and TMDL condition. Table 5.11 shows summary statistics of the TSIs for
different conditions. To meet the long-term TSI target of 58.1, the existing watershed TN and TP loads
were reduced by 55% for TN and 53% for TP, resulting in the long-term average TSI of 58.1. Under
these reduction conditions, the long-term average in-lake concentrations in Lake Marian are expected to
be 1.14 mg/L for TN, 0.049 mg/L for TP, and 20.0 µg/L for cchla. Therefore, it was decided that the
watershed load reductions of 55% TN and 53% for TP, which met the TSI target, best represent the
assimilative capacity for the waterbody, resulting in achieving aquatic life–based water quality criteria.
The 7-year averaged existing watershed loads, not including direct precipitation, were estimated to be
195,827 lbs/yr for TN and 12,793 lbs/yr for TP. A 55% watershed load reduction in TN resulted in an
allowable load of 88,122 lbs/yr. A 53% watershed load reduction in TP resulted in an allowable load of
6,013 lbs/yr. The resulting percent reductions applied to the existing watershed load will be applied to
both the load allocation (LA) and stormwater wasteload allocation (MS4) components of the TMDL.
5.5 Critical Conditions The estimated assimilative capacity was based on annual average conditions (i.e., values from all four
seasons in each calendar year) rather than critical/seasonal conditions because (1) the methodology used
to determine assimilative capacity does not lend itself very well to short-term assessments; (2) for lakes,
the Department is generally more concerned with the net change in overall primary productivity, which
Page 61 of 90
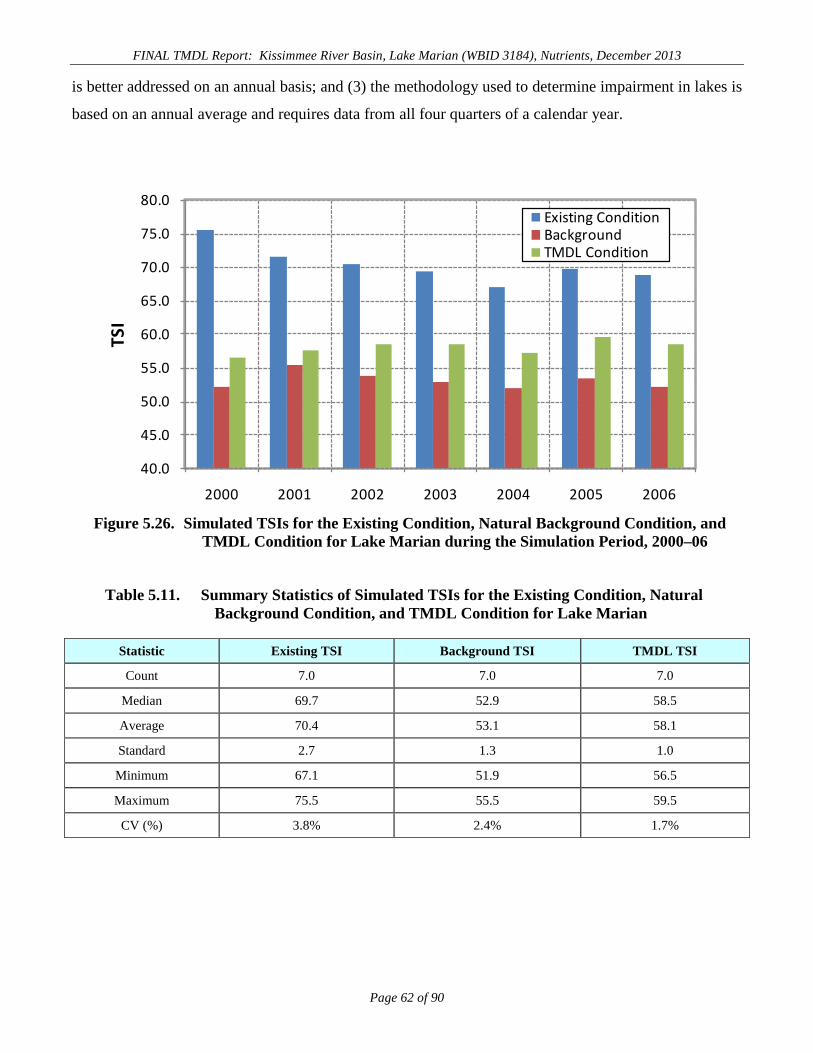
FINAL TMDL Report: Kissimmee River Basin, Lake Marian (WBID 3184), Nutrients, December 2013 is better addressed on an annual basis; and (3) the methodology used to determine impairment in lakes is
based on an annual average and requires data from all four quarters of a calendar year.
Figure 5.26. Simulated TSIs for the Existing Condition, Natural Background Condition, and TMDL Condition for Lake Marian during the Simulation Period, 2000–06
Table 5.11. Summary Statistics of Simulated TSIs for the Existing Condition, Natural Background Condition, and TMDL Condition for Lake Marian
Statistic Existing TSI Background TSI TMDL TSI
Count 7.0 7.0 7.0
Median 69.7 52.9 58.5
Average 70.4 53.1 58.1
Standard 2.7 1.3 1.0
Minimum 67.1 51.9 56.5
Maximum 75.5 55.5 59.5
CV (%) 3.8% 2.4% 1.7%
40.0
45.0
50.0
55.0
60.0
65.0
70.0
75.0
80.0
2000 2001 2002 2003 2004 2005 2006
TSI
Existing ConditionBackgroundTMDL Condition
Page 62 of 90
FINAL TMDL Report: Kissimmee River Basin, Lake Marian (WBID 3184), Nutrients, December 2013
Chapter 6: DETERMINATION OF THE TMDL
6.1 Expression and Allocation of the TMDL A TMDL can be expressed as the sum of all point source loads (wasteload allocations, or WLAs),
nonpoint source loads (load allocations, or LAs), and an appropriate margin of safety (MOS) that takes
into account any uncertainty about the relationship between effluent limitations and water quality.
As mentioned previously, the WLA is broken out into separate subcategories for wastewater discharges
and stormwater discharges regulated under the NPDES Program:
TMDL ≅ ∑ WLAswastewater + ∑ WLAsNPDES Stormwater + ∑ LAs + MOS
It should be noted that the various components of the TMDL equation may not sum up to the value of
the TMDL because (1) the WLA for NPDES stormwater is typically based on the percent reduction
needed for nonpoint sources and is accounted for within the LA, and (2) TMDL components can be
expressed in different terms (for example, the WLA for stormwater is typically expressed as a percent
reduction and the WLA for wastewater is typically expressed as mass per day).
WLAs for stormwater discharges are typically expressed as a “percent reduction” because it is very
difficult to quantify the loads from MS4s (given the numerous discharge points) and to distinguish loads
from MS4s from nonpoint sources (given the nature of stormwater transport). The permitting of MS4
stormwater discharges is also different than the permitting of most wastewater point sources. Because
MS4 stormwater discharges cannot be centrally collected, monitored, and treated, they are not subject to
the same types of effluent limitations as wastewater facilities, and instead are required to meet a
performance standard of providing treatment to the “maximum extent practical” through the
implementation of Best Management Practices (BMPs).
This approach is consistent with federal regulations (40 Code of Federal Regulations § 130.2[I]), which
state that TMDLs can be expressed in terms of mass per time (e.g., pounds per day), toxicity, or other
appropriate measure. The NPDES stormwater WLA is expressed as a percent reduction in the
stormwater from MS4 areas. The TMDLs are the site-specific numeric interpretation of the narrative
nutrient criterion pursuant to 62-302.531(2)(a), F.A.C. The TMDLs for Lake Marian are expressed as
loads and percent reductions and represent the long-term annual average load of TN and TP from all
Page 63 of 90
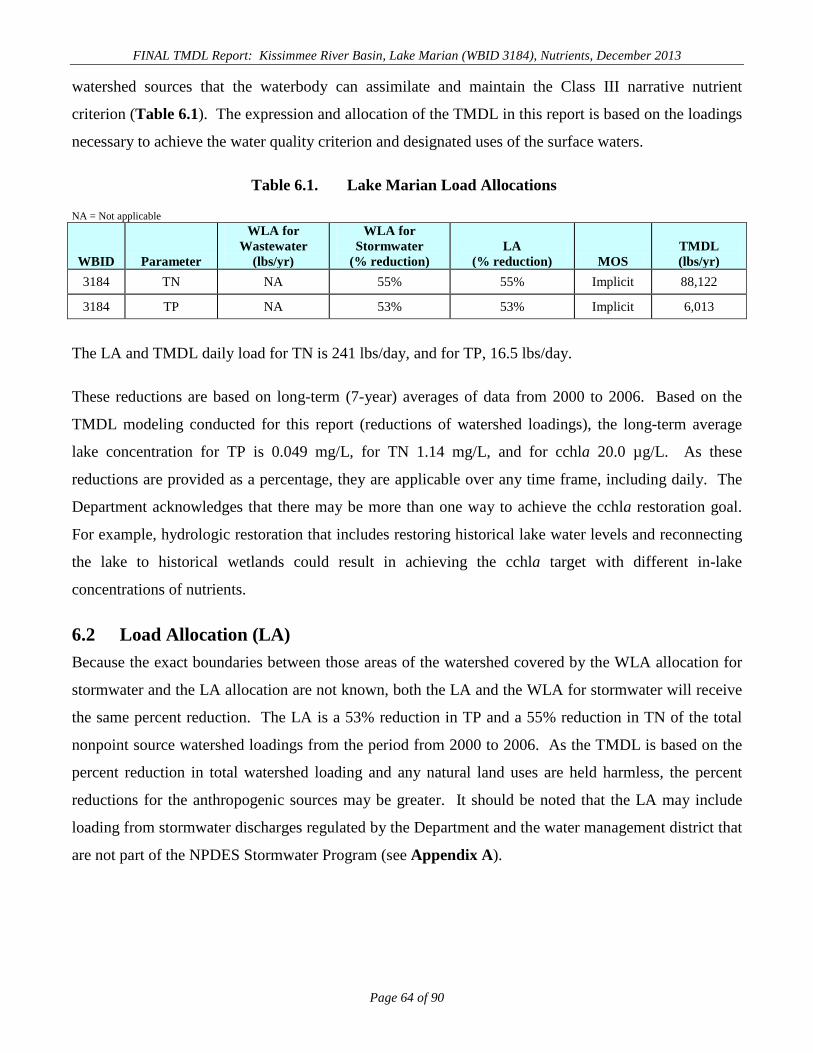
FINAL TMDL Report: Kissimmee River Basin, Lake Marian (WBID 3184), Nutrients, December 2013 watershed sources that the waterbody can assimilate and maintain the Class III narrative nutrient
criterion (Table 6.1). The expression and allocation of the TMDL in this report is based on the loadings
necessary to achieve the water quality criterion and designated uses of the surface waters.
Table 6.1. Lake Marian Load Allocations
NA = Not applicable
WBID Parameter
WLA for Wastewater
(lbs/yr)
WLA for Stormwater
(% reduction) LA
(% reduction) MOS TMDL (lbs/yr)
3184 TN NA 55% 55% Implicit 88,122
3184 TP NA 53% 53% Implicit 6,013 The LA and TMDL daily load for TN is 241 lbs/day, and for TP, 16.5 lbs/day.
These reductions are based on long-term (7-year) averages of data from 2000 to 2006. Based on the
TMDL modeling conducted for this report (reductions of watershed loadings), the long-term average
lake concentration for TP is 0.049 mg/L, for TN 1.14 mg/L, and for cchla 20.0 µg/L. As these
reductions are provided as a percentage, they are applicable over any time frame, including daily. The
Department acknowledges that there may be more than one way to achieve the cchla restoration goal.
For example, hydrologic restoration that includes restoring historical lake water levels and reconnecting
the lake to historical wetlands could result in achieving the cchla target with different in-lake
concentrations of nutrients.
6.2 Load Allocation (LA) Because the exact boundaries between those areas of the watershed covered by the WLA allocation for
stormwater and the LA allocation are not known, both the LA and the WLA for stormwater will receive
the same percent reduction. The LA is a 53% reduction in TP and a 55% reduction in TN of the total
nonpoint source watershed loadings from the period from 2000 to 2006. As the TMDL is based on the
percent reduction in total watershed loading and any natural land uses are held harmless, the percent
reductions for the anthropogenic sources may be greater. It should be noted that the LA may include
loading from stormwater discharges regulated by the Department and the water management district that
are not part of the NPDES Stormwater Program (see Appendix A).
Page 64 of 90
FINAL TMDL Report: Kissimmee River Basin, Lake Marian (WBID 3184), Nutrients, December 2013
6.3 Wasteload Allocation (WLA)
6.3.1 NPDES Wastewater Discharges
As noted in Chapter 4, Section 4.2.1, there are no active NPDES-permitted facilities located within the
Lake Marian watershed that discharge surface water within the watershed. Therefore, the WLA for
wastewater for the Lake Marian TMDL is “not applicable” because there are no wastewater or industrial
wastewater NPDES facilities that discharge directly to Lake Marian.
6.3.2 NPDES Stormwater Discharges
The stormwater collection systems in the Lake Marian watershed, which are owned and operated by
Osceola County, are covered by NPDES Phase II MS4 Permit Number FLR04E012. The collection
system for FDOT District 5 is covered by NPDES Permit Number FLR04E024. The collection systems
for the Florida Turnpike are covered by NPDES Permit Number FLR04E049. The WLA for MS4
stormwater discharges is a 53% reduction in TP and a 55% reduction in TN of the total watershed
loading for the period from 2000 to 2006; these are the required percent reductions in MS4 stormwater
sources.
It should be noted that any MS4 permittee is only responsible for reducing the anthropogenic loads
associated with stormwater outfalls that it owns or otherwise has responsible control over, and it is not
responsible for reducing other nonpoint source loads within its jurisdiction. As the TMDL is based on
the percent reduction in total watershed loading and any natural land uses are held harmless, the percent
reduction for just the anthropogenic sources may be greater.
6.4 Margin of Safety (MOS) TMDLs must address uncertainty issues by incorporating an MOS into the analysis. The MOS is a
required component of a TMDL and accounts for the uncertainty about the relationship between
pollutant loads and the quality of the receiving waterbody (Clean Water Act, Paragraph 303[d][1][c]).
Considerable uncertainty is usually inherent in estimating nutrient loading from nonpoint sources, as
well as predicting water quality response. The effectiveness of management activities (e.g., stormwater
management plans) in reducing loading is also subject to uncertainty.
The MOS can either be implicitly accounted for by choosing conservative assumptions about loading or
water quality response, or explicitly accounted for during the allocation of loadings.
Page 65 of 90
FINAL TMDL Report: Kissimmee River Basin, Lake Marian (WBID 3184), Nutrients, December 2013 Consistent with the recommendations of the Allocation Technical Advisory Committee (Department
2001), an implicit MOS was used in the development of the Lake Marian TMDL because the TMDL
was based on the conservative decisions associated with a number of the modeling assumptions and
allows only a five-unit TSI increase above background conditions in determining the assimilative
capacity (i.e., loading and water quality response) for Lake Marian.
Page 66 of 90
FINAL TMDL Report: Kissimmee River Basin, Lake Marian (WBID 3184), Nutrients, December 2013
Chapter 7: NEXT STEPS: IMPLEMENTATION PLAN
DEVELOPMENT AND BEYOND
7.1 Basin Management Action Plan Following the adoption of the TMDL by rule, the Department will work cooperatively with stakeholders
to development a plan to restore the waterbody. This will be accomplished by creating a Basin
Management Action Plan. BMAPs are the primary mechanism through which TMDLs are implemented
in Florida (see Subsection 403.067[7], F.S.). A single BMAP may provide the conceptual plan for the
restoration of one or many impaired waterbodies. The BMAP will be designed to identify the actions
needed to achieve the restoration goals, including steps to meet a long-term average cchla concentration
in the lake of no greater than 13.7 µg/L. These projects will depend heavily on the active participation
of the SFWMD, local governments, businesses, and other stakeholders. While the required percent
reduction for nutrients is specified in Chapter 6, no specific projects have been identified at this time.
The Department will work with these organizations and individuals during BMAP development to
identify specific projects directed towards achieving the established TMDL for the impaired waterbody.
The BMAP will be developed through a transparent, stakeholder-driven process intended to result in a
plan that is cost-effective, technically feasible, and meets the restoration needs of the applicable
waterbodies. Section 7.2 (below) provides a framework of the issues and activities that need to be
completed as part of the development of the BMAP.
Once adopted by order of the Department Secretary, BMAPs are enforceable through wastewater and
MS4 permits for point sources and through BMP implementation for nonpoint sources. Among other
components, BMAPs typically include the following:
• Water quality goals.
• Appropriate load reduction allocations for stakeholders (quantitative detailed
allocations, if technically feasible).
• A description of the load reduction activities to be undertaken, including structural
projects, nonstructural BMPs, and public education and outreach.
Page 67 of 90
FINAL TMDL Report: Kissimmee River Basin, Lake Marian (WBID 3184), Nutrients, December 2013
• A description of further research, data collection, or source identification needed (if
any) to achieve the TMDL.
• Timetables for implementation.
• Confirmed and potential funding mechanisms.
• An evaluation of future increases in pollutant loading due to population growth.
• Any applicable signed agreement(s).
• Local ordinances defining actions to be taken or prohibited.
• Any applicable local water quality standards, permits, or load limitation agreements.
• Implementation milestones, project tracking, water quality monitoring, and adaptive
management procedures.
• Stakeholder statements of commitment (typically a local government resolution).
BMAPs are updated through annual meetings and may be officially revised every five years. Completed
BMAPs in the state have improved communication and cooperation among local stakeholders and state
agencies; improved internal communication within local governments; applied high-quality science and
local information in managing water resources; clarified the obligations of wastewater point source,
MS4, and non-MS4 stakeholders in TMDL implementation; enhanced transparency in the Department’s
decision making; and built strong relationships between the Department and local stakeholders that have
benefited other program areas.
7.2 Next Steps for TMDL Implementation The Department will establish the detailed allocation for the WLA for stormwater and the LA for
nonpoint sources under Paragraph 403.067(6)(b), F.S.
As part of BMAP development, the Department will work with stakeholders to identify the water quality
monitoring locations appropriate for assessing progress towards lake restoration. The BMAP will be
developed over a period that is sufficient to allow for the collection and analysis of any necessary
additional information. Development of the BMAP under Paragraph 403.067(6)(b), F.S., does allow
Page 68 of 90
FINAL TMDL Report: Kissimmee River Basin, Lake Marian (WBID 3184), Nutrients, December 2013 time for further monitoring, data analysis, and modeling to develop a better understanding of the
relationship between watershed loadings, impacts from permitted WWTFs, proposed hydrologic
modifications, proposed reconnection to wetlands, and resulting algae (cchla) concentration. As is the
case when any modeling approach is used, some uncertainty always remains in the existing data and
model predictions, and this may lead the Department to support gathering additional data or information.
For lakes within the Kissimmee Chain of Lakes, the refinement of water quality targets may be needed,
and making this decision should be a high priority. This element should be investigated prior to any
determination calling for new projects, to ensure that the outcome of such projects will provide the
expected or implied water quality benefit and help achieve system restoration goals.
The future BMAP planning process may need to consider the issue of the related stresses of nutrient
loading within the complexities of hydrologic alteration. For example, in some cases reductions in
Florida lake elevations over the last several decades have likely led to reduced tannin levels and
influenced assimilative capacities for nutrient loading (D. Tomasko, pers. comm., 2013), factors not
addressed in these current TMDLs. Lakes Cypress and Marian, for example, have dropped
approximately 2 to 3 feet in lake elevation since the 1940s and 1950s, respectively. In Lake Cypress,
the TP-rich sediments are 55% more likely to be resuspended into the water column in their recent,
lowered stages, than if lake levels had remained at historical levels. As such, nutrient load reduction
targets based on water quality models that used TSI criteria could be problematic for lakes where
hydrologic restoration might improve water quality by decreasing the frequency of bottom resuspension
and increasing the amounts of tannins.
7.3 Restoration Goals The impairments in Lakes Cypress, Jackson, Kissimmee, and Marian are linked to the Department’s
nutrient criterion and as stated in Chapter 3, Florida’s nutrient criterion is narrative only. Accordingly,
a nutrient-related target is needed to represent levels at which an imbalance in flora or fauna is expected
to occur. While the IWR provides a threshold for nutrient impairment for lakes based on annual average
TSI levels, these thresholds are not standards and are not required to be used as the nutrient-related
water quality target for TMDLs. The IWR (Section 62-303.450, F.A.C.) specifically allows the use of
alternative, site-specific thresholds that more accurately reflect conditions beyond which an imbalance
in flora or fauna occurs in a waterbody. The draft TMDLs are based on maintaining the current lake
levels and color.
Page 69 of 90
FINAL TMDL Report: Kissimmee River Basin, Lake Marian (WBID 3184), Nutrients, December 2013 Stakeholders have requested that the Department include as a component of the BMAP the evaluation of
alternative restoration goals that might result if lake levels and lake color were increased as a result of
other restoration projects. They are seeking to restore to the extent practicable the historical lake levels,
seasonal variations in stage, and connections to wetlands that have been isolated from the lakes due to
current lake stage operational criteria. An adaptive management approach to restoration, in which the
Department considers hydrologic restoration—and its effects on tannin levels—is a viable consideration
to be evaluated in achieving the TMDL.
One of the major restoration efforts under way in the region is the Kissimmee River Restoration Project.
Lakes Kissimmee, Hatchineha, and Cypress are part of the Central and Southern Florida (C&SF) Project
operated by the SFWMD under regulations prescribed by the Secretary of the Army. Modifications to
C&SF waterbody regulation schedules require evaluations of environmental effects that meet National
Environmental Policy Act (NEPA) procedural requirements for a proposed federal action. The
authorized headwaters component of the Kissimmee River Restoration Project increases the regulatory
range of water levels on Lakes Kissimmee, Hatchineha, and Cypress by 1.5 feet and modifies the stage
regulation schedule in a manner that increases the seasonal variations in stage and the connections to
wetlands that have been isolated from the lakes as a result of current lake stage regulation. These
changes may restore the lake stage and color to a more natural condition over time and may also have
the potential to alter the relationship between watershed loading and the resulting in-lake concentrations
of chla. Plans to alter the hydrology of C&SF Project lakes must meet NEPA procedural requirements,
which include input from stakeholders and evaluation of the effects of proposed actions on water
quality, water supply, and flood protection.
Additionally, another way of determining if returning to a more natural lake stage and color level would
alter the restoration goals would be to conduct paleolimnological studies on the lake sediments to
identify historical water quality conditions. If such studies are agreed to as part of the BMAP process,
the Department may take the lead and conduct studies in Lake Tohopekaliga (WBID 3173A), Lake
Cypress (WBID 3180A), and/or Lake Kissimmee (WBID 3183B), and reevaluate restoration goals
before making any final allocation of load reductions under the BMAP. Additionally, the Department
will not move forward with setting final specific allocations of load reductions under the BMAP for
Lakes Marian or Jackson without determining whether there is a need for further studies to identify
historical water quality conditions in these lakes.
Page 70 of 90
FINAL TMDL Report: Kissimmee River Basin, Lake Marian (WBID 3184), Nutrients, December 2013
References Bicknell, B.R., J.C. Imhoff, J.L. Kittle, A.S. Donigian, Jr., and R.C. Johanson. 2001. Hydrologic
Simulation Program-Fortran, User’s manual for Release 12. EPA/600/R-97/080. Athens, GA:
U.S. Environmental Protection Agency, Environmental Research Laboratory.
Camp Dresser McKee. 2002. Northern Coastal Basin watersheds hydrology model development:
Pellicer Creek Planning Unit 9B. Prepared for the St. Johns River Water Management District,
Palatka, FL.
———. October 2003. Framework model of the Upper St. Johns River Basin: Hydrology and
hydraulics. Prepared for the St. Johns River Water Management District, Palatka, FL.
———. 2008. Kissimmee River watershed TMDL model development report. Volumes 1 and 2.
Prepared for the Florida Department of Environmental Protection.
Carlson, R.E. 1977. A trophic state index for lakes. Limnology and Oceanography 22: 361–369.
Chapter 99-223, Laws of Florida. 1999. Florida Watershed Restoration Act.
Donigian, A.S., Jr. 2002. Watershed model calibration and validation: The HSPF experience. WEF
National TMDL Science and Policy 2002, November 13-16, 2002. Phoenix, AZ. WEF Specialty
Conference Proceedings on CD-ROM.
Farnsworth, R.K., E.S. Thompson, and E.L. Peck. 1982. Evaporation atlas for the contiguous 48
United States. National Oceanic and Atmospheric Administration Technical Report NWS 33.
Florida Department of Environmental Protection. February 2001. A report to the Governor and the
Legislature on the allocation of Total Maximum Daily Loads in Florida. Tallahassee, FL:
Allocation Technical Advisory Committee, Division of Water Resource Management, Bureau of
Watershed Management.
———. April 2001a. Chapter 62-302, Surface water quality standards, Florida Administrative Code.
Tallahassee, FL: Division of Water Resource Management, Bureau of Watershed Management.
Page 71 of 90
FINAL TMDL Report: Kissimmee River Basin, Lake Marian (WBID 3184), Nutrients, December 2013 ———. April 2001b. Chapter 62-303, Identification of impaired surface waters rule (IWR), Florida
Administrative Code. Tallahassee, FL: Division of Water Resource Management, Bureau of
Watershed Management.
———. June 2004. Geographic information systems. Tallahassee, FL: Division of Water Resource
Management, Bureau of Information Systems, Geographic Information Systems Section.
Available: http://www.dep.state.fl.us/gis/contact.htm.
Florida Department of Health. 2008. OSTDS statistics. Available: http://www.doh.state.fl.us/ or
http://www.doh.state.fl.us/environment/OSTDS/statistics/ostdsstatistics.htm.
Florida Department of Transportation. 1999. Florida Land Use, Cover and Forms Classification
System (FLUCCS). Florida Department of Transportation Thematic Mapping Section.
Frink, C.R. 1991. Estimating nutrient exports to estuaries. J. Environ. Qual. 20(4): 717–724.
Hartigan, J. 1983. Chesapeake Bay Basin model – Final report. Prepared by the Northern Virginia
Planning District Commission for the U.S. Environmental Protection Agency, Chesapeake Bay
Program, Annapolis, MD .
Hartigan, J.P., J.A. Friedman, and E. Southerland. 1983a. Post-audit of lake model used for NPS
management. ASCE Journal of Environmental Engineering 109(6).
Hartigan, J.P., T.F. Quasebarth, and E. Southerland. 1983b. Calibration of NPS loading factors. ASCE
Journal of Environmental Engineering 109(6).
Lee, T.M., and A. Swancar. 1997. Influence of evaporation, ground water, and uncertainty in the
hydrologic budget of Lake Lucerne, a seepage lake in Polk County, Florida. U.S. Geological
Survey Water-Supply Paper 2439. Prepared in cooperation with the South Florida Water
Management District.
National Weather Service. 2004. National Climatic Data Center, Climate Interactive Rapid Retrieval
User System (CIRRUS) database hosted by the Southeast Regional Climate Center website.
Available: http://www.dnr.state.sc.us/pls/cirrus/cirrus.login.
Page 72 of 90
FINAL TMDL Report: Kissimmee River Basin, Lake Marian (WBID 3184), Nutrients, December 2013 Over, T.M., E.A. Murphy, T.W. Ortel, and A.L. Ishii. 2007. Comparison between NEXRAD radar and
tipping bucket gage rainfall data: A case study for DuPage County, Illinois. Proceedings, ASCE-
EWRI World Environmental and Water Resources Congress, Tampa, FL, May 2007.
Post Buckley Schuh and Jernigan, XPSoftWare, and South Florida Water Management District. 2001.
Upper Kissimmee Chain of Lakes routing model, Appendix B.
Southeast Regional Climate Center. 2010. Available: http://www.sercc.com/.
Treommer, J., M. DelCharco, and B. Lewelling. 1999. Water budget and water quality of Ward Lake,
flow and water-quality characteristics of the Braden River Estuary, and the effects of Ward Lake on
the hydrologic system, west-central Florida. U.S. Geological Survey Water-Resources
Investigations Report 98-4251. Tallahassee, FL.
URS. 2006. Model ID and acquisition TM for the Florida Department of Environmental Protection
and Center for Environmental Studies, Florida Atlantic University.
URS Greiner. 1998. Basin planning for Boggy Creek and Lake Hart watersheds, Final report.
Prepared for the Stormwater Management Department, Public Works Division, Board of County
Commissioners, Orange County, FL.
U. S. Census Bureau. 2008. Available: http://www.census.gov/ or
http://factfinder2.census.gov/faces/nav/jsf/pages/index.xhtml.
U. S. Environmental Protection Agency, April 1991. Guidance for water quality–based decisions: The
TMDL process. EPA-440/4-91-001. Washington, DC: Office of Water.
———. November 1999. Protocol for developing nutrient TMDLs. EPA841-B-99-007. Washington,
DC: Office of Water.
———. 2000. EPA BASINS technical note 6: Estimating hydrology and hydraulic parameters for
HSPF.
———. 2001. Better Assessment Science Integrating Point and Nonpoint Sources BASINS Version 3.0
user manual. Electronic file. Available: http://www.epa.gov/waterscience/basins/bsnsdocs.html.
Accessed June 2007.
Page 73 of 90
FINAL TMDL Report: Kissimmee River Basin, Lake Marian (WBID 3184), Nutrients, December 2013 ———. July 2003. 40 CFR 130.2(I), Title 40 – Protection of the Environment, Chapter I – U.S.
Environmental Protection Agency, Part 130 – Water Quality Planning and Management, U.S.
Environmental Protection Agency, Washington, D.C.
U.S. Geological Survey. 2002. Simulation of runoff and water quality for 1990 and 2008 land-use
conditions in the Reedy Creek watershed, east-central Florida. Prepared in cooperation with the
Reedy Creek Improvement District.
Wagner, R.A. 1986. Reverification of Occoquan Basin computer model: Post-audit No. 2 with 1982–
1984 monitoring data. Prepared by the Northern Virginia Planning District Commission for the
Occoquan Basin Nonpoint Pollution Management Program.
Page 74 of 90
FINAL TMDL Report: Kissimmee River Basin, Lake Marian (WBID 3184), Nutrients, December 2013
Appendices
Appendix A: Background Information on Federal and State Stormwater Programs In 1982, Florida became the first state in the country to implement statewide regulations to address the
issue of nonpoint source pollution by requiring new development and redevelopment to treat stormwater
before it is discharged. The Stormwater Rule, as authorized in Chapter 403, F.S., was established as a
technology-based program that relies on the implementation of BMPs that are designed to achieve a
specific level of treatment (i.e., performance standards) as set forth in Rule 62-40, F.A.C. In 1994, the
Department’s stormwater treatment requirements were integrated with the stormwater flood control
requirements of the state’s water management districts, along with wetland protection requirements, into
the Environmental Resource Permit (ERP) regulations.
The rule requires the state’s water management districts to establish stormwater pollutant load reduction
goals (PLRGs) and adopt them as part of a Surface Water Improvement and Management (SWIM) plan,
other watershed plan, or rule. Stormwater PLRGs are a major component of the load allocation part of a
TMDL. To date, stormwater PLRGs have been established for Tampa Bay, Lake Thonotosassa, the
Winter Haven Chain of Lakes, the Everglades, Lake Okeechobee, and Lake Apopka. To date, no PLRG
has been developed for Lake Kissimmee.
In 1987, the U.S. Congress established Section 402(p) as part of the federal Clean Water Act
Reauthorization. This section of the law amended the scope of the federal NPDES permitting program
to designate certain stormwater discharges as “point sources” of pollution. The EPA promulgated
regulations and began the implementation of the Phase I NPDES stormwater program in 1990. These
stormwater discharges include certain discharges that are associated with industrial activities designated
by specific standard industrial classification (SIC) codes, construction sites disturbing 5 or more acres of
land, and the master drainage systems of local governments with a population above 100,000, which are
better known as MS4s. However, because the master drainage systems of most local governments in
Florida are interconnected, the EPA implemented Phase I of the MS4 permitting program on a
countywide basis, which brought in all cities (incorporated areas), Chapter 298 urban water control
districts, and the FDOT throughout the 15 counties meeting the population criteria. The Department
received authorization to implement the NPDES stormwater program in 2000.
An important difference between the NPDES and the state’s stormwater/ERP programs is that the
NPDES program covers both new and existing discharges, while the other state programs focus on new
Page 75 of 90
FINAL TMDL Report: Kissimmee River Basin, Lake Marian (WBID 3184), Nutrients, December 2013 discharges. Additionally, Phase II of the NPDES Program, implemented in 2003, expands the need for
these permits to construction sites between 1 and 5 acres, and to local governments with as few as 1,000
people. While these urban stormwater discharges are now technically referred to as “point sources” for
the purpose of regulation, they are still diffuse sources of pollution that cannot be easily collected and
treated by a central treatment facility, as are other point sources of pollution such as domestic and
industrial wastewater discharges. It should be noted that all MS4 permits issued in Florida include a
reopener clause that allows permit revisions to implement TMDLs when the implementation plan is
formally adopted.
Page 76 of 90

FINAL TMDL Report: Kissimmee River Basin, Lake Marian (WBID 3184), Nutrients, December 2013
Appendix B: Electronic Copies of Measured Data and 2008 CDM Report for the Lake Marian TMDL All information gathered by CDM, and the HSPF model setup and calibration/validation, are contained
in the document, Kissimmee River Watershed TMDL Model Development Report (CDM 2008), and is
available upon request (~100 megabytes on disk). Lake Marian is included in the HSPF model project
termed UKL_Open.UCI.
The 2008 CDM report and all data used in the Lake Marian TMDL report are available upon request.
Please contact the following individual to obtain this information:
Douglas Gilbert, Environmental Manager Florida Department of Environmental Protection Water Quality Evaluation and TMDL Program Watershed Evaluation and TMDL Section 2600 Blair Stone Road, Mail Station 3555 Tallahassee, FL 32399-2400 Email: [email protected] Phone: (850) 245–8450 Fax: (850) 245–8536
Page 77 of 90
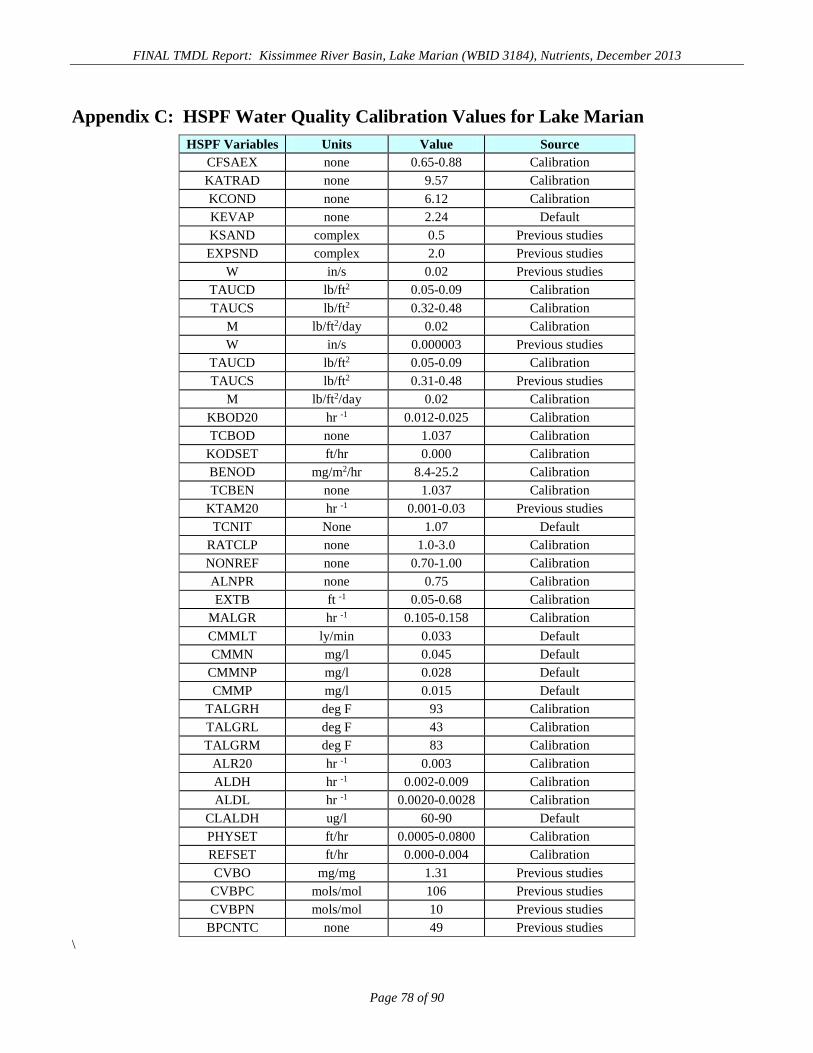
FINAL TMDL Report: Kissimmee River Basin, Lake Marian (WBID 3184), Nutrients, December 2013
Appendix C: HSPF Water Quality Calibration Values for Lake Marian HSPF Variables Units Value Source
CFSAEX none 0.65-0.88 Calibration KATRAD none 9.57 Calibration KCOND none 6.12 Calibration KEVAP none 2.24 Default KSAND complex 0.5 Previous studies EXPSND complex 2.0 Previous studies
W in/s 0.02 Previous studies TAUCD lb/ft2 0.05-0.09 Calibration TAUCS lb/ft2 0.32-0.48 Calibration
M lb/ft2/day 0.02 Calibration W in/s 0.000003 Previous studies
TAUCD lb/ft2 0.05-0.09 Calibration TAUCS lb/ft2 0.31-0.48 Previous studies
M lb/ft2/day 0.02 Calibration KBOD20 hr -1 0.012-0.025 Calibration TCBOD none 1.037 Calibration
KODSET ft/hr 0.000 Calibration BENOD mg/m2/hr 8.4-25.2 Calibration TCBEN none 1.037 Calibration
KTAM20 hr -1 0.001-0.03 Previous studies TCNIT None 1.07 Default
RATCLP none 1.0-3.0 Calibration NONREF none 0.70-1.00 Calibration ALNPR none 0.75 Calibration EXTB ft -1 0.05-0.68 Calibration
MALGR hr -1 0.105-0.158 Calibration CMMLT ly/min 0.033 Default CMMN mg/l 0.045 Default
CMMNP mg/l 0.028 Default CMMP mg/l 0.015 Default
TALGRH deg F 93 Calibration TALGRL deg F 43 Calibration TALGRM deg F 83 Calibration
ALR20 hr -1 0.003 Calibration ALDH hr -1 0.002-0.009 Calibration ALDL hr -1 0.0020-0.0028 Calibration
CLALDH ug/l 60-90 Default PHYSET ft/hr 0.0005-0.0800 Calibration REFSET ft/hr 0.000-0.004 Calibration CVBO mg/mg 1.31 Previous studies
CVBPC mols/mol 106 Previous studies CVBPN mols/mol 10 Previous studies
BPCNTC none 49 Previous studies \
Page 78 of 90
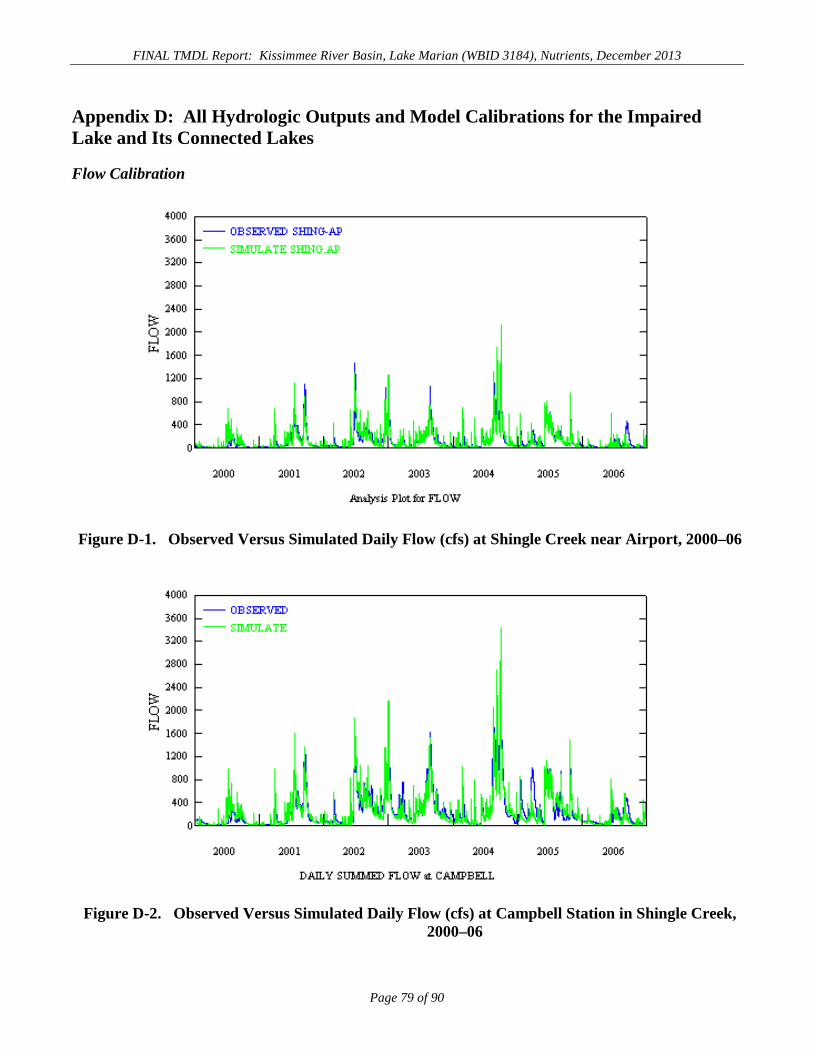
FINAL TMDL Report: Kissimmee River Basin, Lake Marian (WBID 3184), Nutrients, December 2013
Appendix D: All Hydrologic Outputs and Model Calibrations for the Impaired Lake and Its Connected Lakes
Flow Calibration
Figure D-1. Observed Versus Simulated Daily Flow (cfs) at Shingle Creek near Airport, 2000–06
Figure D-2. Observed Versus Simulated Daily Flow (cfs) at Campbell Station in Shingle Creek, 2000–06
Page 79 of 90
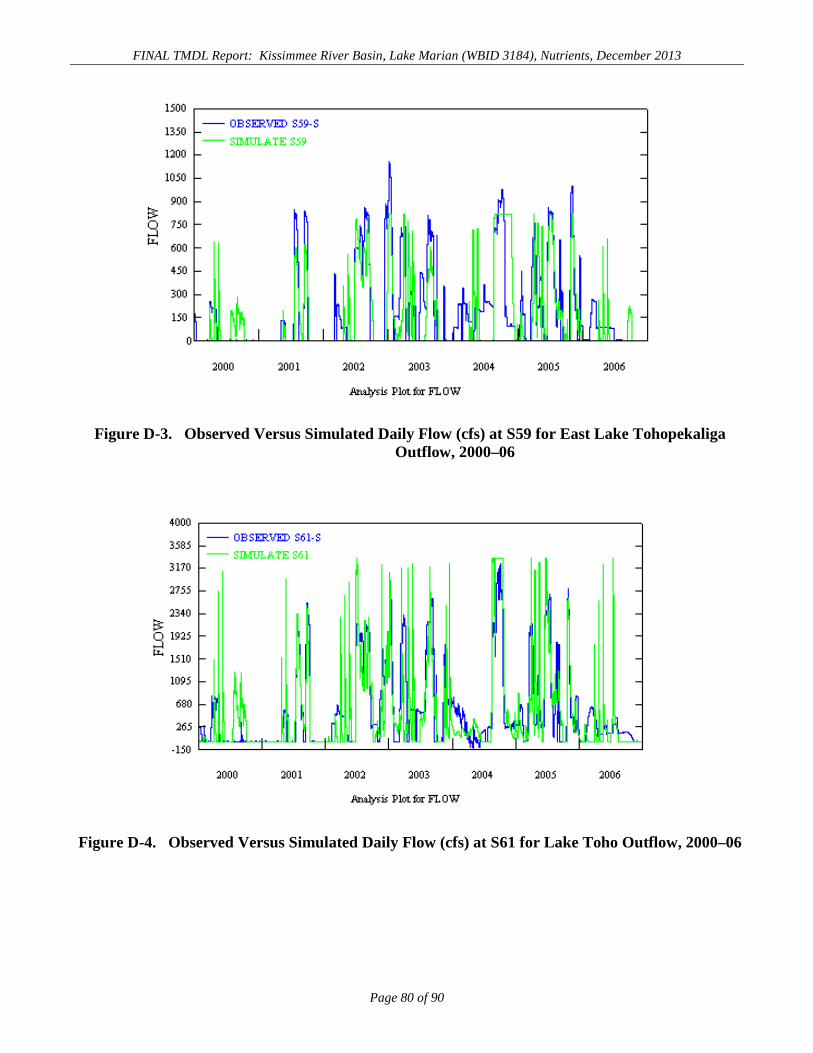
FINAL TMDL Report: Kissimmee River Basin, Lake Marian (WBID 3184), Nutrients, December 2013
Figure D-3. Observed Versus Simulated Daily Flow (cfs) at S59 for East Lake Tohopekaliga Outflow, 2000–06
Figure D-4. Observed Versus Simulated Daily Flow (cfs) at S61 for Lake Toho Outflow, 2000–06
Page 80 of 90
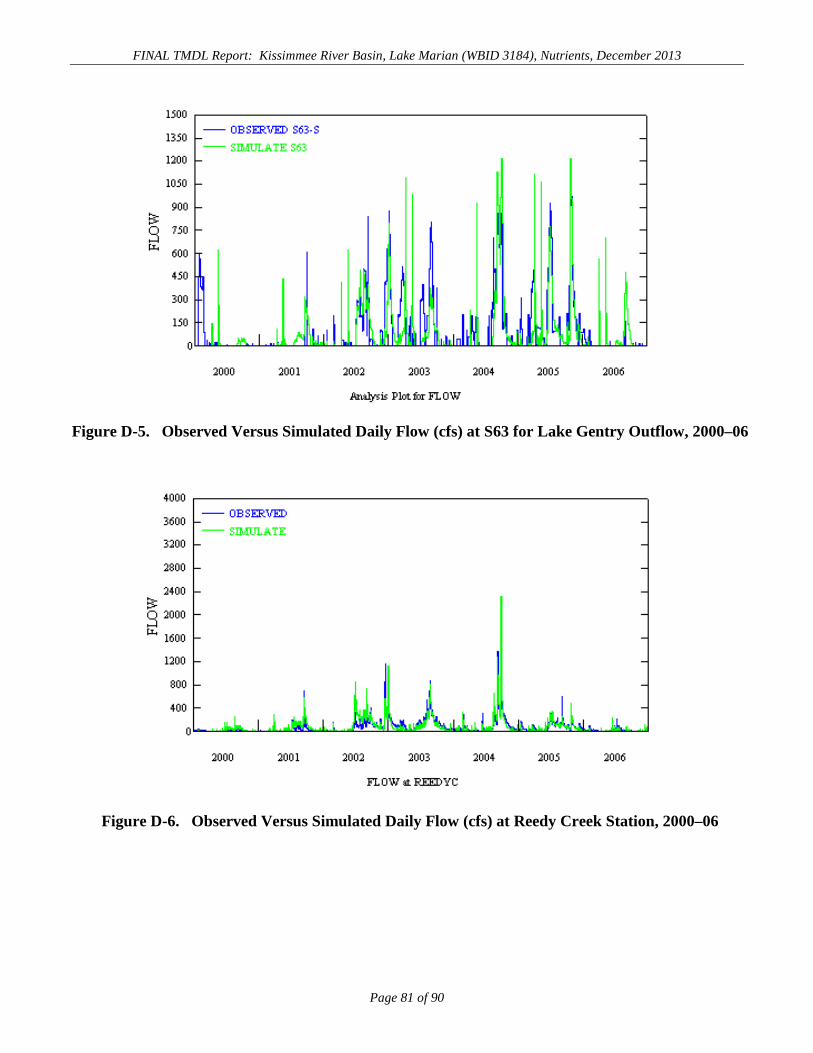
FINAL TMDL Report: Kissimmee River Basin, Lake Marian (WBID 3184), Nutrients, December 2013
Figure D-5. Observed Versus Simulated Daily Flow (cfs) at S63 for Lake Gentry Outflow, 2000–06
Figure D-6. Observed Versus Simulated Daily Flow (cfs) at Reedy Creek Station, 2000–06
Page 81 of 90
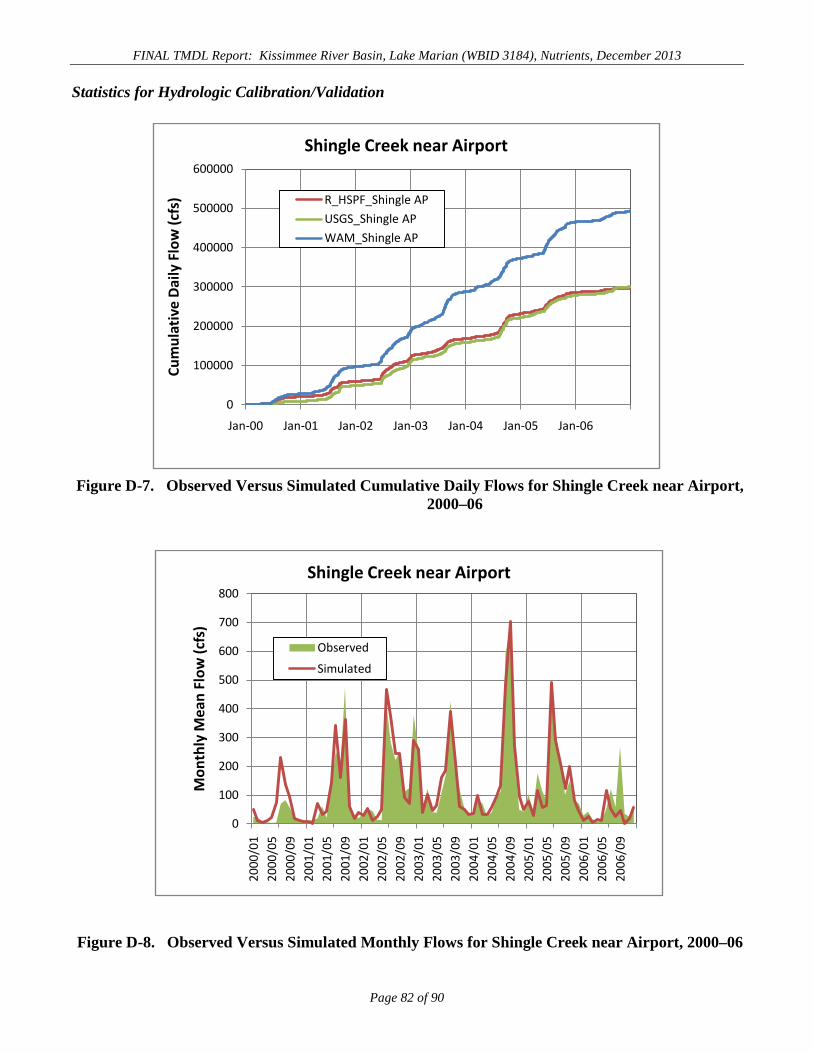
FINAL TMDL Report: Kissimmee River Basin, Lake Marian (WBID 3184), Nutrients, December 2013
Statistics for Hydrologic Calibration/Validation
Figure D-7. Observed Versus Simulated Cumulative Daily Flows for Shingle Creek near Airport, 2000–06
Figure D-8. Observed Versus Simulated Monthly Flows for Shingle Creek near Airport, 2000–06
0
100000
200000
300000
400000
500000
600000
Jan-00 Jan-01 Jan-02 Jan-03 Jan-04 Jan-05 Jan-06
Cum
ulat
ive
Daily
Flo
w (c
fs)
Shingle Creek near Airport
R_HSPF_Shingle APUSGS_Shingle APWAM_Shingle AP
0
100
200
300
400
500
600
700
800
2000
/01
2000
/05
2000
/09
2001
/01
2001
/05
2001
/09
2002
/01
2002
/05
2002
/09
2003
/01
2003
/05
2003
/09
2004
/01
2004
/05
2004
/09
2005
/01
2005
/05
2005
/09
2006
/01
2006
/05
2006
/09
Mon
thly
Mea
n Fl
ow (c
fs)
Shingle Creek near Airport
Observed
Simulated
Page 82 of 90
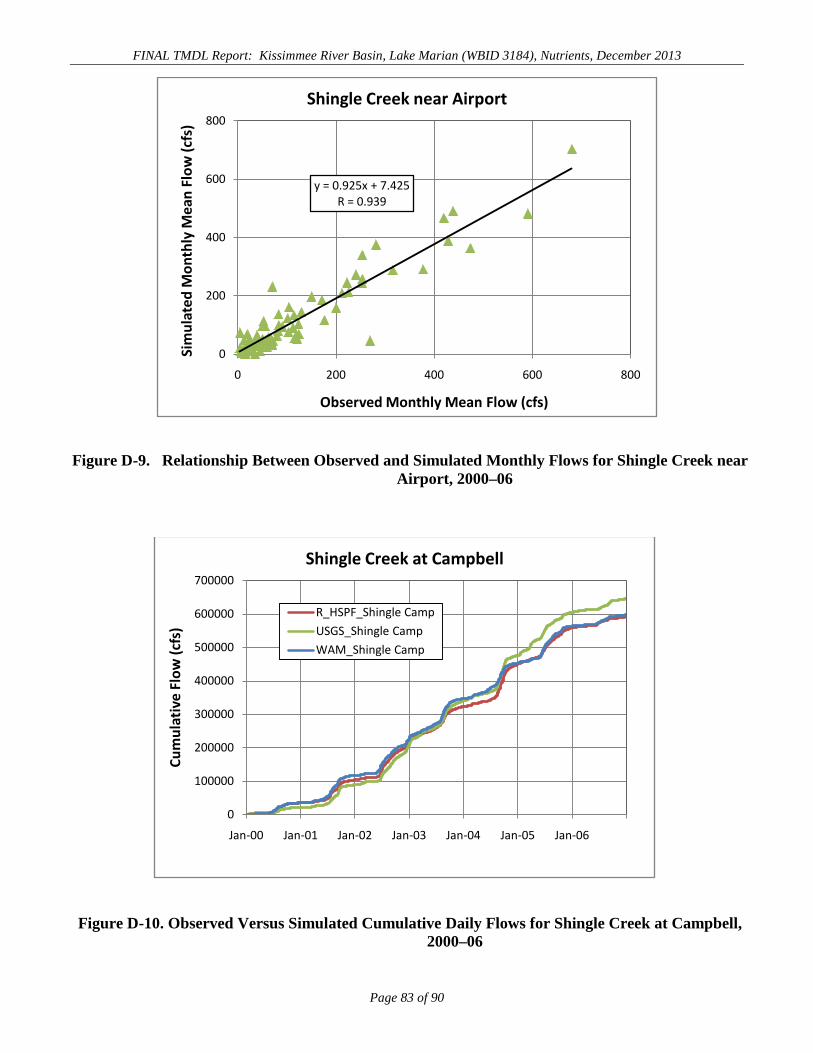
FINAL TMDL Report: Kissimmee River Basin, Lake Marian (WBID 3184), Nutrients, December 2013
Figure D-9. Relationship Between Observed and Simulated Monthly Flows for Shingle Creek near Airport, 2000–06
Figure D-10. Observed Versus Simulated Cumulative Daily Flows for Shingle Creek at Campbell, 2000–06
y = 0.925x + 7.425R = 0.939
0
200
400
600
800
0 200 400 600 800
Sim
ulat
ed M
onth
ly M
ean
Flow
(cfs
)
Observed Monthly Mean Flow (cfs)
Shingle Creek near Airport
0
100000
200000
300000
400000
500000
600000
700000
Jan-00 Jan-01 Jan-02 Jan-03 Jan-04 Jan-05 Jan-06
Cum
ulat
ive
Flow
(cfs
)
Shingle Creek at Campbell
R_HSPF_Shingle CampUSGS_Shingle CampWAM_Shingle Camp
Page 83 of 90
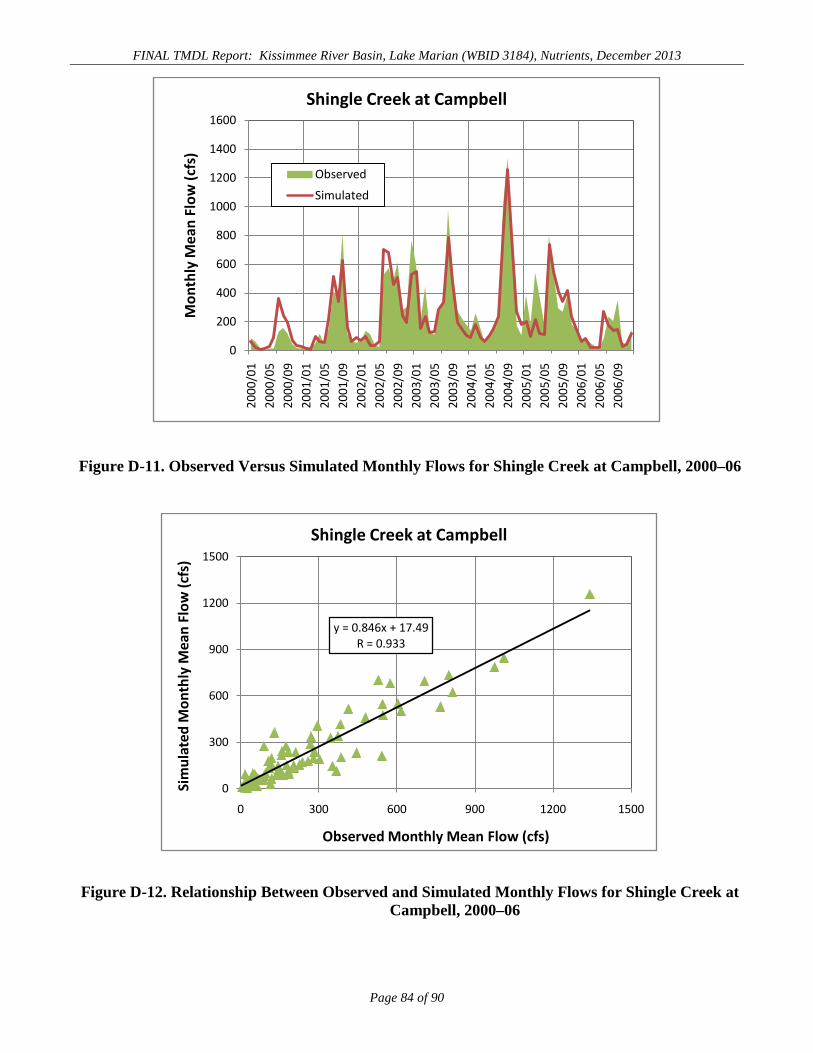
FINAL TMDL Report: Kissimmee River Basin, Lake Marian (WBID 3184), Nutrients, December 2013
Figure D-11. Observed Versus Simulated Monthly Flows for Shingle Creek at Campbell, 2000–06
Figure D-12. Relationship Between Observed and Simulated Monthly Flows for Shingle Creek at Campbell, 2000–06
0
200
400
600
800
1000
1200
1400
1600
2000
/01
2000
/05
2000
/09
2001
/01
2001
/05
2001
/09
2002
/01
2002
/05
2002
/09
2003
/01
2003
/05
2003
/09
2004
/01
2004
/05
2004
/09
2005
/01
2005
/05
2005
/09
2006
/01
2006
/05
2006
/09
Mon
thly
Mea
n Fl
ow (c
fs)
Shingle Creek at Campbell
Observed
Simulated
y = 0.846x + 17.49R = 0.933
0
300
600
900
1200
1500
0 300 600 900 1200 1500
Sim
ulat
ed M
onth
ly M
ean
Flow
(cfs
)
Observed Monthly Mean Flow (cfs)
Shingle Creek at Campbell
Page 84 of 90
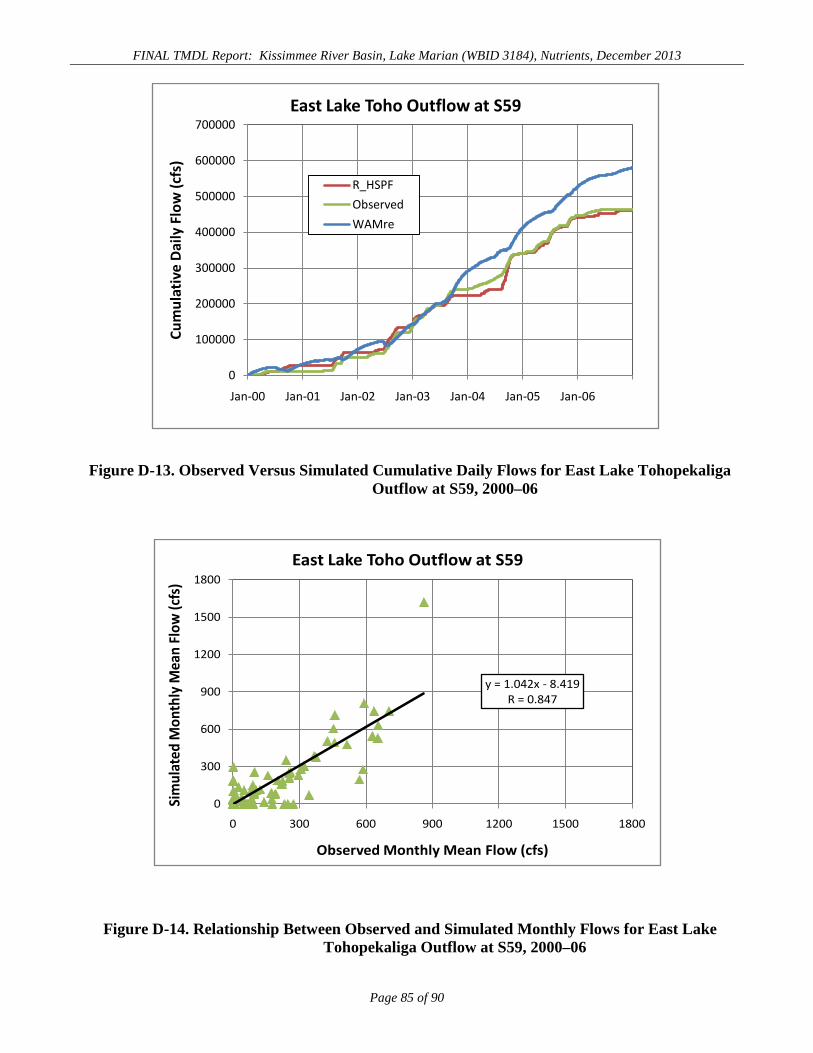
FINAL TMDL Report: Kissimmee River Basin, Lake Marian (WBID 3184), Nutrients, December 2013
Figure D-13. Observed Versus Simulated Cumulative Daily Flows for East Lake Tohopekaliga Outflow at S59, 2000–06
Figure D-14. Relationship Between Observed and Simulated Monthly Flows for East Lake Tohopekaliga Outflow at S59, 2000–06
0
100000
200000
300000
400000
500000
600000
700000
Jan-00 Jan-01 Jan-02 Jan-03 Jan-04 Jan-05 Jan-06
Cum
ulat
ive
Daily
Flo
w (c
fs)
East Lake Toho Outflow at S59
R_HSPFObservedWAMre
y = 1.042x - 8.419R = 0.847
0
300
600
900
1200
1500
1800
0 300 600 900 1200 1500 1800
Sim
ulat
ed M
onth
ly M
ean
Flow
(cfs
)
Observed Monthly Mean Flow (cfs)
East Lake Toho Outflow at S59
Page 85 of 90
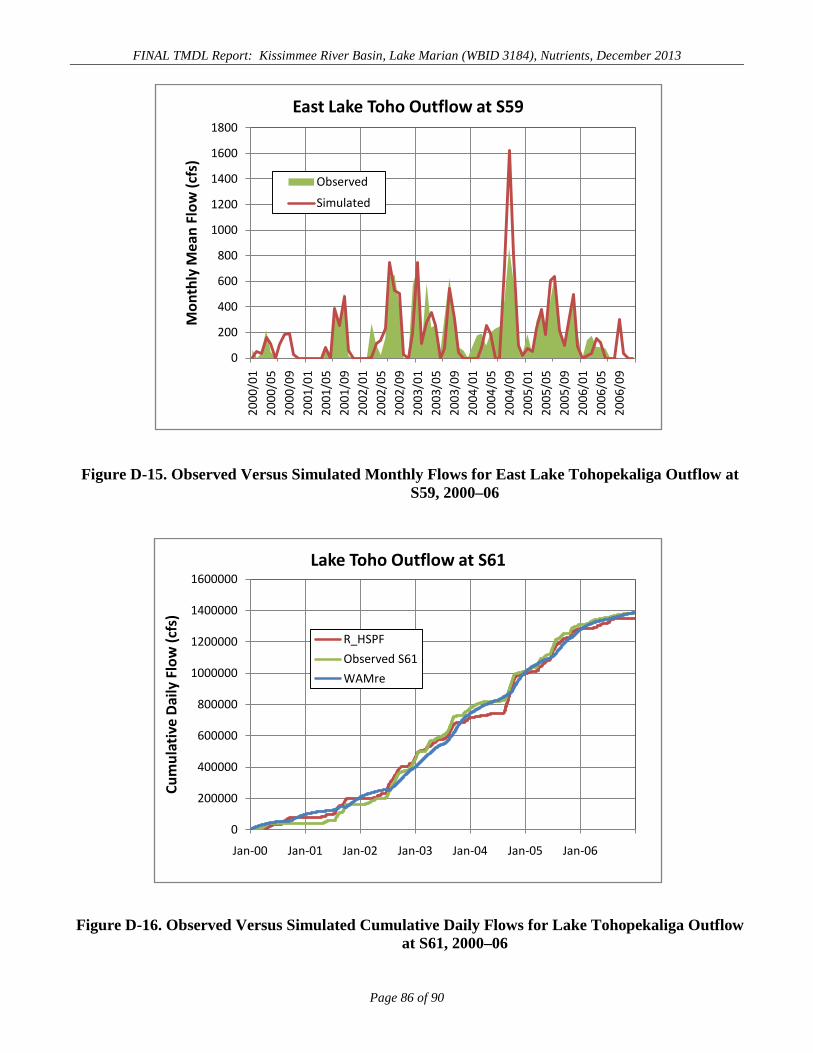
FINAL TMDL Report: Kissimmee River Basin, Lake Marian (WBID 3184), Nutrients, December 2013
Figure D-15. Observed Versus Simulated Monthly Flows for East Lake Tohopekaliga Outflow at S59, 2000–06
Figure D-16. Observed Versus Simulated Cumulative Daily Flows for Lake Tohopekaliga Outflow at S61, 2000–06
0
200
400
600
800
1000
1200
1400
1600
1800
2000
/01
2000
/05
2000
/09
2001
/01
2001
/05
2001
/09
2002
/01
2002
/05
2002
/09
2003
/01
2003
/05
2003
/09
2004
/01
2004
/05
2004
/09
2005
/01
2005
/05
2005
/09
2006
/01
2006
/05
2006
/09
Mon
thly
Mea
n Fl
ow (c
fs)
East Lake Toho Outflow at S59
Observed
Simulated
0
200000
400000
600000
800000
1000000
1200000
1400000
1600000
Jan-00 Jan-01 Jan-02 Jan-03 Jan-04 Jan-05 Jan-06
Cum
ulat
ive
Daily
Flo
w (c
fs)
Lake Toho Outflow at S61
R_HSPFObserved S61WAMre
Page 86 of 90
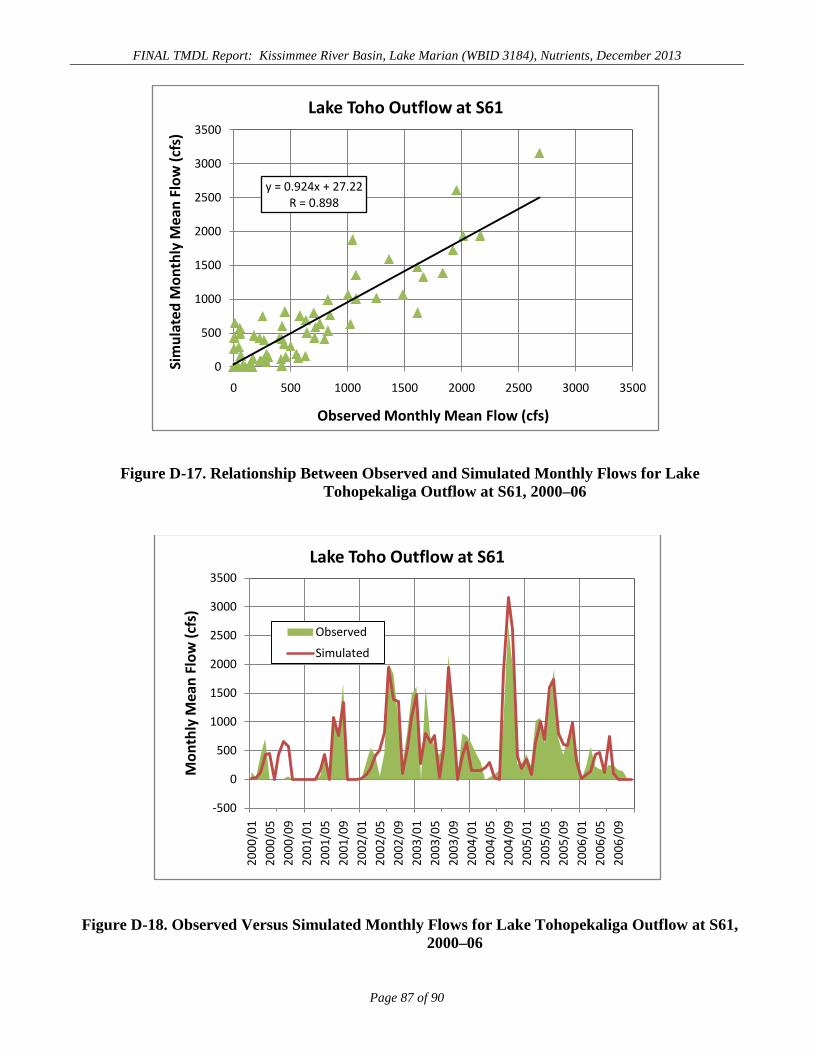
FINAL TMDL Report: Kissimmee River Basin, Lake Marian (WBID 3184), Nutrients, December 2013
Figure D-17. Relationship Between Observed and Simulated Monthly Flows for Lake Tohopekaliga Outflow at S61, 2000–06
Figure D-18. Observed Versus Simulated Monthly Flows for Lake Tohopekaliga Outflow at S61, 2000–06
y = 0.924x + 27.22R = 0.898
0
500
1000
1500
2000
2500
3000
3500
0 500 1000 1500 2000 2500 3000 3500
Sim
ulat
ed M
onth
ly M
ean
Flow
(cfs
)
Observed Monthly Mean Flow (cfs)
Lake Toho Outflow at S61
-500
0
500
1000
1500
2000
2500
3000
3500
2000
/01
2000
/05
2000
/09
2001
/01
2001
/05
2001
/09
2002
/01
2002
/05
2002
/09
2003
/01
2003
/05
2003
/09
2004
/01
2004
/05
2004
/09
2005
/01
2005
/05
2005
/09
2006
/01
2006
/05
2006
/09
Mon
thly
Mea
n Fl
ow (c
fs)
Lake Toho Outflow at S61
Observed
Simulated
Page 87 of 90
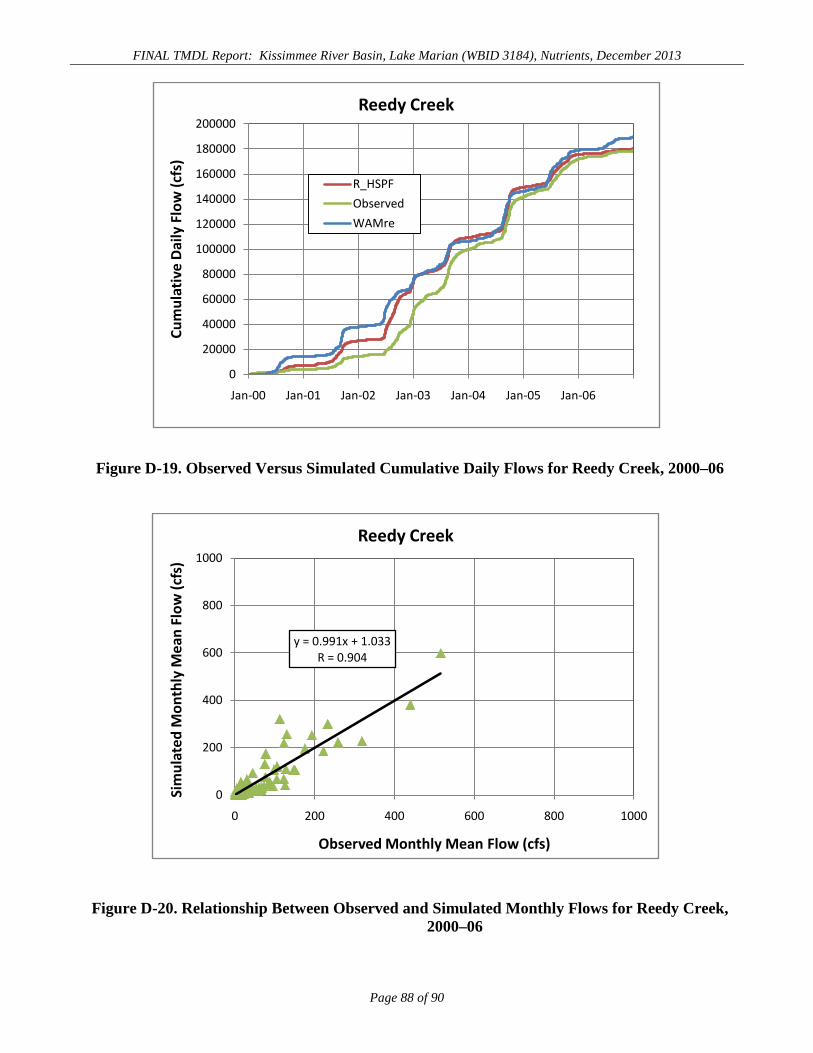
FINAL TMDL Report: Kissimmee River Basin, Lake Marian (WBID 3184), Nutrients, December 2013
Figure D-19. Observed Versus Simulated Cumulative Daily Flows for Reedy Creek, 2000–06
Figure D-20. Relationship Between Observed and Simulated Monthly Flows for Reedy Creek, 2000–06
0
20000
40000
60000
80000
100000
120000
140000
160000
180000
200000
Jan-00 Jan-01 Jan-02 Jan-03 Jan-04 Jan-05 Jan-06
Cum
ulat
ive
Daily
Flo
w (c
fs)
Reedy Creek
R_HSPFObservedWAMre
y = 0.991x + 1.033R = 0.904
0
200
400
600
800
1000
0 200 400 600 800 1000
Sim
ulat
ed M
onth
ly M
ean
Flow
(cfs
)
Observed Monthly Mean Flow (cfs)
Reedy Creek
Page 88 of 90
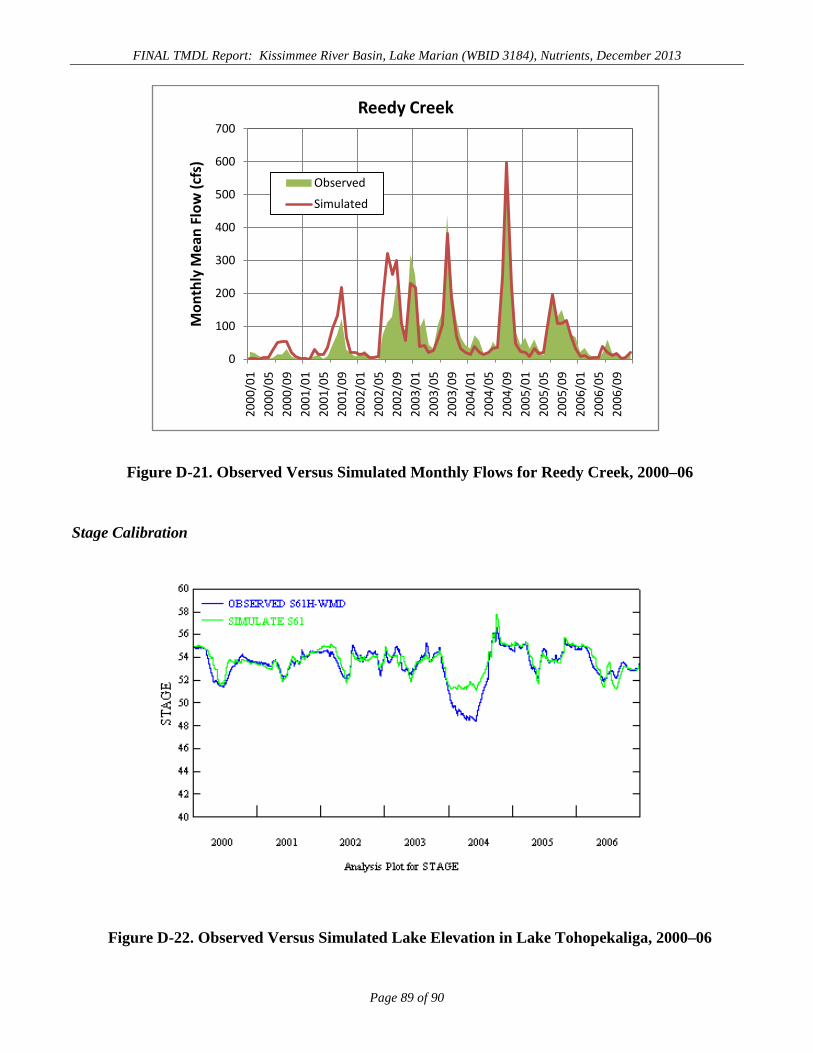
FINAL TMDL Report: Kissimmee River Basin, Lake Marian (WBID 3184), Nutrients, December 2013
Figure D-21. Observed Versus Simulated Monthly Flows for Reedy Creek, 2000–06
Stage Calibration
Figure D-22. Observed Versus Simulated Lake Elevation in Lake Tohopekaliga, 2000–06
0
100
200
300
400
500
600
700
2000
/01
2000
/05
2000
/09
2001
/01
2001
/05
2001
/09
2002
/01
2002
/05
2002
/09
2003
/01
2003
/05
2003
/09
2004
/01
2004
/05
2004
/09
2005
/01
2005
/05
2005
/09
2006
/01
2006
/05
2006
/09
Mon
thly
Mea
n Fl
ow (c
fs)
Reedy Creek
Observed
Simulated
Page 89 of 90
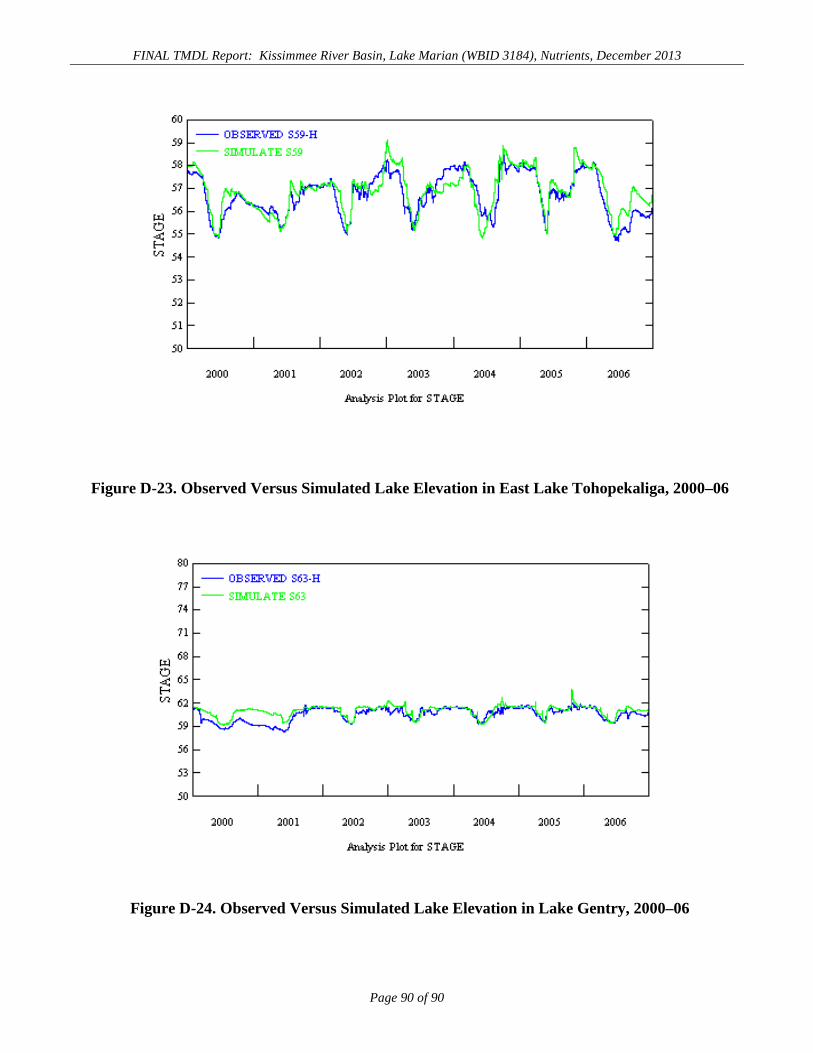
FINAL TMDL Report: Kissimmee River Basin, Lake Marian (WBID 3184), Nutrients, December 2013
Figure D-23. Observed Versus Simulated Lake Elevation in East Lake Tohopekaliga, 2000–06
Figure D-24. Observed Versus Simulated Lake Elevation in Lake Gentry, 2000–06
Page 90 of 90
Related Documents