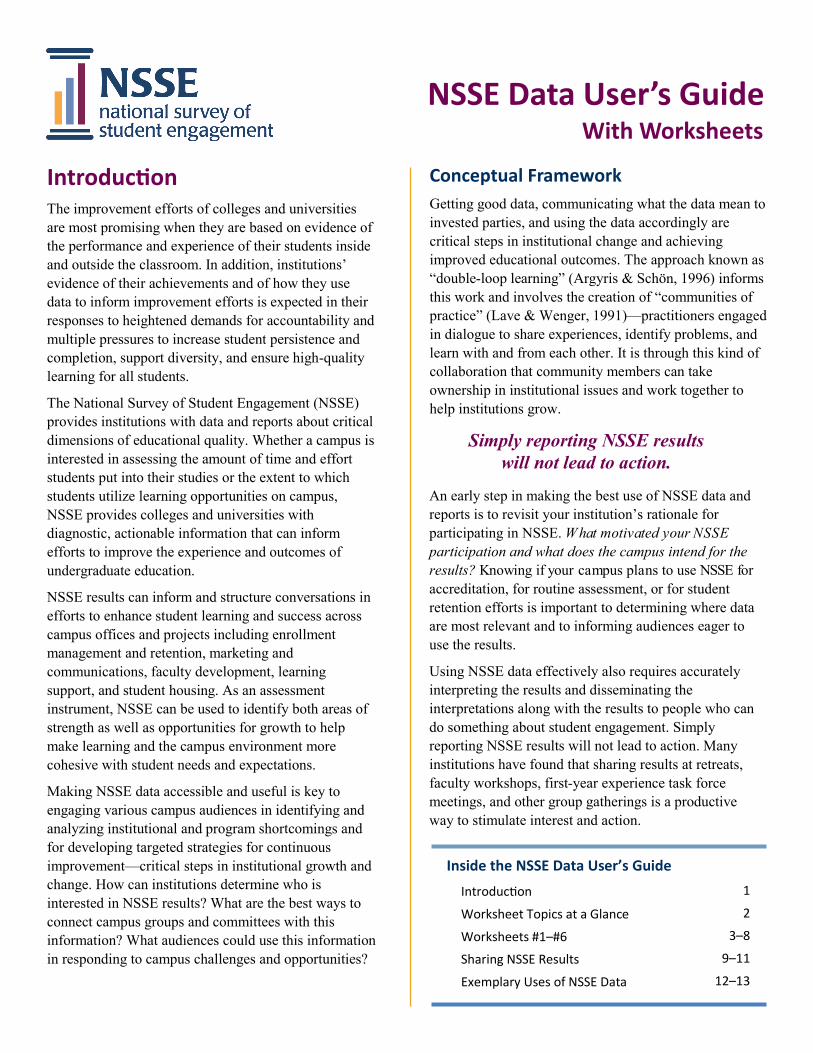
Introducon The improvement efforts of colleges and universities are most promising when they are based on evidence of the performance and experience of their students inside and outside the classroom. In addition, institutions’ evidence of their achievements and of how they use data to inform improvement efforts is expected in their responses to heightened demands for accountability and multiple pressures to increase student persistence and completion, support diversity, and ensure high-quality learning for all students. The National Survey of Student Engagement (NSSE) provides institutions with data and reports about critical dimensions of educational quality. Whether a campus is interested in assessing the amount of time and effort students put into their studies or the extent to which students utilize learning opportunities on campus, NSSE provides colleges and universities with diagnostic, actionable information that can inform efforts to improve the experience and outcomes of undergraduate education. NSSE results can inform and structure conversations in efforts to enhance student learning and success across campus offices and projects including enrollment management and retention, marketing and communications, faculty development, learning support, and student housing. As an assessment instrument, NSSE can be used to identify both areas of strength as well as opportunities for growth to help make learning and the campus environment more cohesive with student needs and expectations. Making NSSE data accessible and useful is key to engaging various campus audiences in identifying and analyzing institutional and program shortcomings and for developing targeted strategies for continuous improvement—critical steps in institutional growth and change. How can institutions determine who is interested in NSSE results? What are the best ways to connect campus groups and committees with this information? What audiences could use this information in responding to campus challenges and opportunities? Conceptual Framework Getting good data, communicating what the data mean to invested parties, and using the data accordingly are critical steps in institutional change and achieving improved educational outcomes. The approach known as “double-loop learning” (Argyris & Schön, 1996) informs this work and involves the creation of “communities of practice” (Lave & Wenger, 1991)—practitioners engaged in dialogue to share experiences, identify problems, and learn with and from each other. It is through this kind of collaboration that community members can take ownership in institutional issues and work together to help institutions grow. Inside the NSSE Data User’s Guide Introducon Worksheet Topics at a Glance Worksheets #1–#6 Sharing NSSE Results Exemplary Uses of NSSE Data An early step in making the best use of NSSE data and reports is to revisit your institution’s rationale for participating in NSSE. W hat motivated your NSSE participation and what does the campus intend for the results? Knowing if your campus plans to use NSSE for accreditation, for routine assessment, or for student retention efforts is important to determining where data are most relevant and to informing audiences eager to use the results. Using NSSE data effectively also requires accurately interpreting the results and disseminating the interpretations along with the results to people who can do something about student engagement. Simply reporting NSSE results will not lead to action. Many institutions have found that sharing results at retreats, faculty workshops, first-year experience task force meetings, and other group gatherings is a productive way to stimulate interest and action. NSSE Data User’s Guide With Worksheets 1 2 3–8 9–11 12–13 Simply reporting NSSE results will not lead to action.

Welcome message from author
This document is posted to help you gain knowledge. Please leave a comment to let me know what you think about it! Share it to your friends and learn new things together.
Transcript
Introduction The improvement efforts of colleges and universities
are most promising when they are based on evidence of
the performance and experience of their students inside
and outside the classroom. In addition, institutions’
evidence of their achievements and of how they use
data to inform improvement efforts is expected in their
responses to heightened demands for accountability and
multiple pressures to increase student persistence and
completion, support diversity, and ensure high-quality
learning for all students.
The National Survey of Student Engagement (NSSE)
provides institutions with data and reports about critical
dimensions of educational quality. Whether a campus is
interested in assessing the amount of time and effort
students put into their studies or the extent to which
students utilize learning opportunities on campus,
NSSE provides colleges and universities with
diagnostic, actionable information that can inform
efforts to improve the experience and outcomes of
undergraduate education.
NSSE results can inform and structure conversations in
efforts to enhance student learning and success across
campus offices and projects including enrollment
management and retention, marketing and
communications, faculty development, learning
support, and student housing. As an assessment
instrument, NSSE can be used to identify both areas of
strength as well as opportunities for growth to help
make learning and the campus environment more
cohesive with student needs and expectations.
Making NSSE data accessible and useful is key to
engaging various campus audiences in identifying and
analyzing institutional and program shortcomings and
for developing targeted strategies for continuous
improvement—critical steps in institutional growth and
change. How can institutions determine who is
interested in NSSE results? What are the best ways to
connect campus groups and committees with this
information? What audiences could use this information
in responding to campus challenges and opportunities?
Conceptual Framework
Getting good data, communicating what the data mean to
invested parties, and using the data accordingly are
critical steps in institutional change and achieving
improved educational outcomes. The approach known as
“double-loop learning” (Argyris & Schön, 1996) informs
this work and involves the creation of “communities of
practice” (Lave & Wenger, 1991)—practitioners engaged
in dialogue to share experiences, identify problems, and
learn with and from each other. It is through this kind of
collaboration that community members can take
ownership in institutional issues and work together to
help institutions grow.
Inside the NSSE Data User’s Guide
Introduction
Worksheet Topics at a Glance
Worksheets #1–#6
Sharing NSSE Results
Exemplary Uses of NSSE Data
An early step in making the best use of NSSE data and
reports is to revisit your institution’s rationale for
participating in NSSE. What motivated your NSSE
participation and what does the campus intend for the
results? Knowing if your campus plans to use NSSE for
accreditation, for routine assessment, or for student
retention efforts is important to determining where data
are most relevant and to informing audiences eager to
use the results.
Using NSSE data effectively also requires accurately
interpreting the results and disseminating the
interpretations along with the results to people who can
do something about student engagement. Simply
reporting NSSE results will not lead to action. Many
institutions have found that sharing results at retreats,
faculty workshops, first-year experience task force
meetings, and other group gatherings is a productive
way to stimulate interest and action.
NSSE Data User’s Guide With Worksheets
1
2
3–8
9–11
12–13
Simply reporting NSSE results
will not lead to action.
NSSE DATA USER’S GUIDE • 2
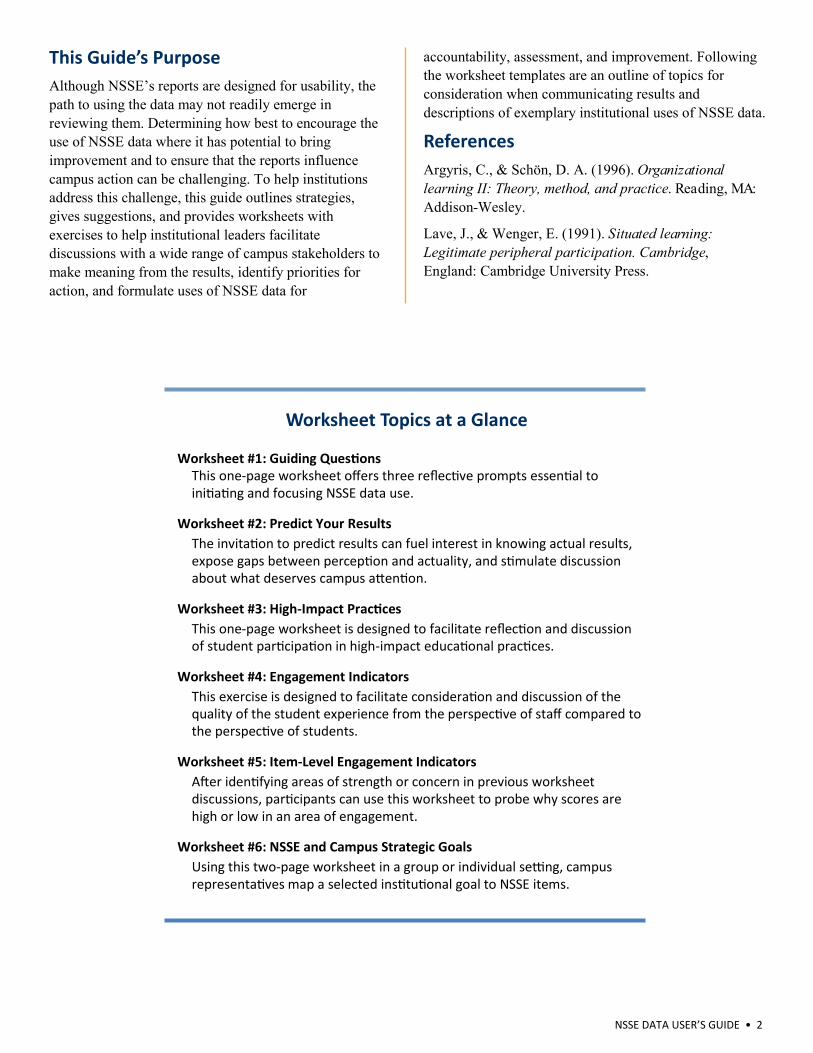
This Guide’s Purpose
Although NSSE’s reports are designed for usability, the
path to using the data may not readily emerge in
reviewing them. Determining how best to encourage the
use of NSSE data where it has potential to bring
improvement and to ensure that the reports influence
campus action can be challenging. To help institutions
address this challenge, this guide outlines strategies,
gives suggestions, and provides worksheets with
exercises to help institutional leaders facilitate
discussions with a wide range of campus stakeholders to
make meaning from the results, identify priorities for
action, and formulate uses of NSSE data for
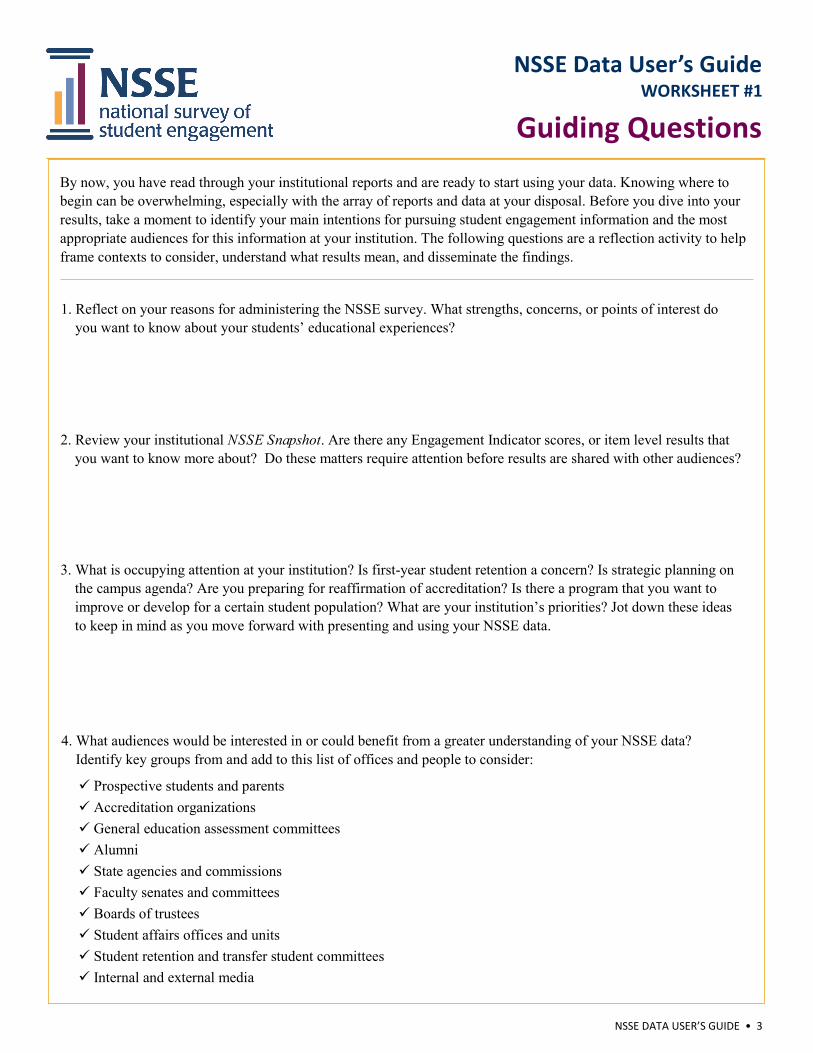
Worksheet #1: Guiding Questions This one-page worksheet offers three reflective prompts essential to initiating and focusing NSSE data use.
Worksheet #2: Predict Your Results
The invitation to predict results can fuel interest in knowing actual results, expose gaps between perception and actuality, and stimulate discussion about what deserves campus attention.
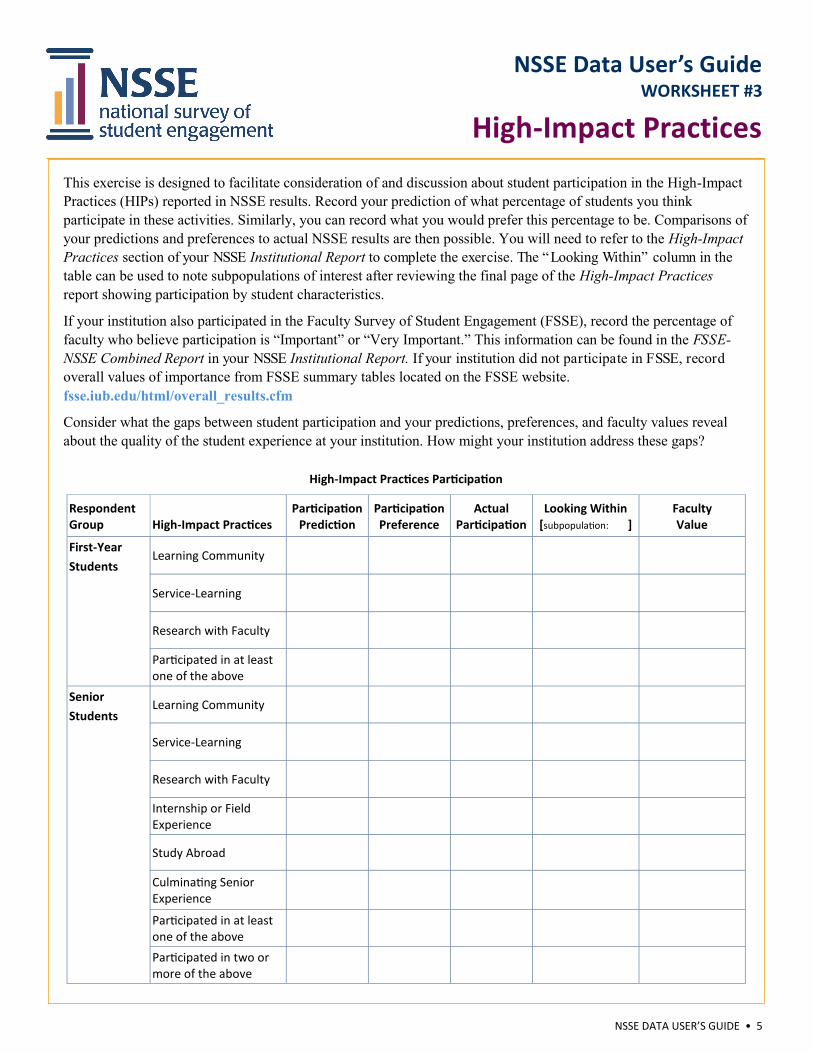
Worksheet #3: High-Impact Practices
This one-page worksheet is designed to facilitate reflection and discussion of student participation in high-impact educational practices.
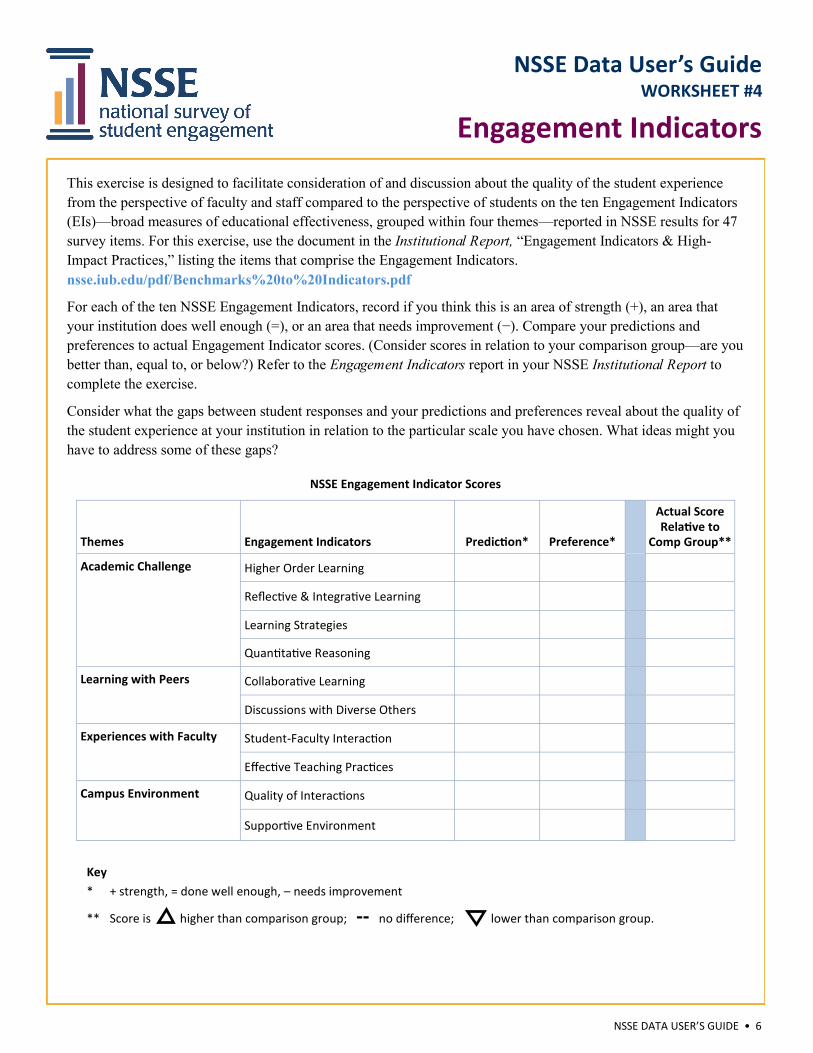
Worksheet #4: Engagement Indicators
This exercise is designed to facilitate consideration and discussion of the quality of the student experience from the perspective of staff compared to the perspective of students.
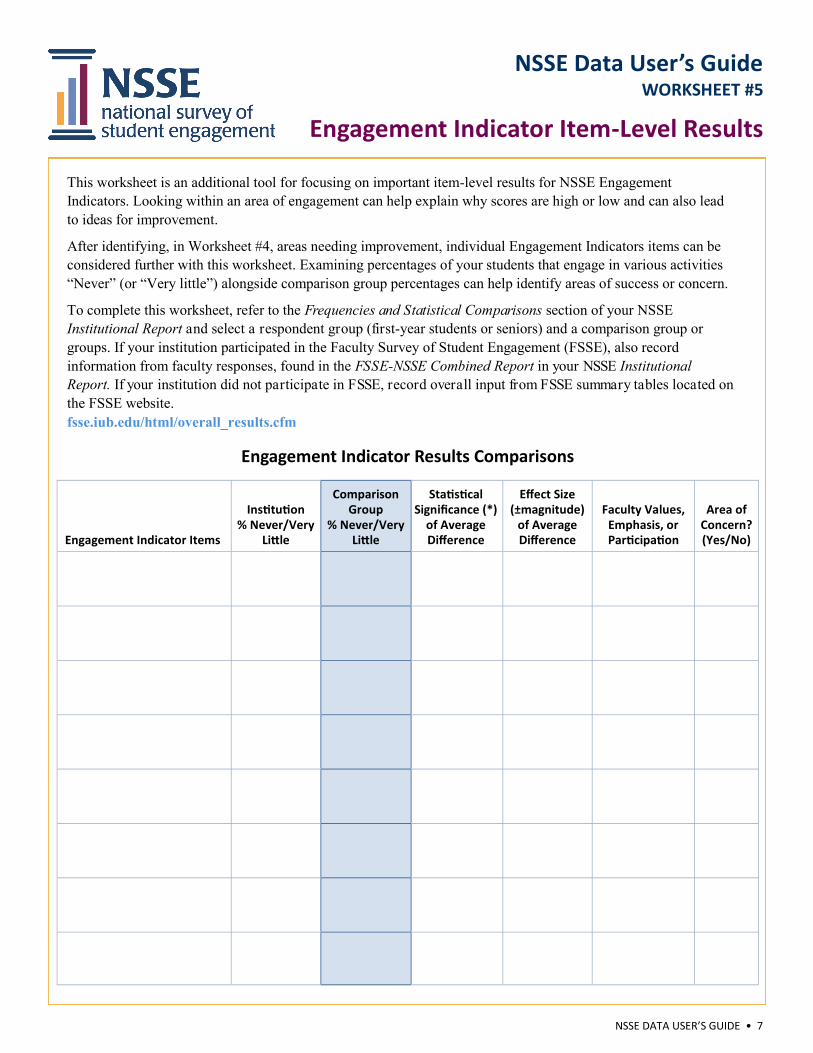
Worksheet #5: Item-Level Engagement Indicators
After identifying areas of strength or concern in previous worksheet discussions, participants can use this worksheet to probe why scores are high or low in an area of engagement.
Worksheet #6: NSSE and Campus Strategic Goals
Using this two-page worksheet in a group or individual setting, campus representatives map a selected institutional goal to NSSE items.
Worksheet Topics at a Glance
accountability, assessment, and improvement. Following
the worksheet templates are an outline of topics for
consideration when communicating results and
descriptions of exemplary institutional uses of NSSE data.
References
Argyris, C., & Schön, D. A. (1996). Organizational
learning II: Theory, method, and practice. Reading, MA:
Addison-Wesley.
Lave, J., & Wenger, E. (1991). Situated learning:
Legitimate peripheral participation. Cambridge,
England: Cambridge University Press.
NSSE DATA USER’S GUIDE • 3
NSSE Data User’s Guide WORKSHEET #1
Guiding Questions
By now, you have read through your institutional reports and are ready to start using your data. Knowing where to
begin can be overwhelming, especially with the array of reports and data at your disposal. Before you dive into your
results, take a moment to identify your main intentions for pursuing student engagement information and the most
appropriate audiences for this information at your institution. The following questions are a reflection activity to help
frame contexts to consider, understand what results mean, and disseminate the findings.
1. Reflect on your reasons for administering the NSSE survey. What strengths, concerns, or points of interest do
you want to know about your students’ educational experiences?
2. Review your institutional NSSE Snapshot. Are there any Engagement Indicator scores, or item level results that
you want to know more about? Do these matters require attention before results are shared with other audiences?
3. What is occupying attention at your institution? Is first-year student retention a concern? Is strategic planning on
the campus agenda? Are you preparing for reaffirmation of accreditation? Is there a program that you want to
improve or develop for a certain student population? What are your institution’s priorities? Jot down these ideas
to keep in mind as you move forward with presenting and using your NSSE data.
4. What audiences would be interested in or could benefit from a greater understanding of your NSSE data?
Identify key groups from and add to this list of offices and people to consider:
Prospective students and parents
Accreditation organizations
General education assessment committees
Alumni
State agencies and commissions
Faculty senates and committees
Boards of trustees
Student affairs offices and units
Student retention and transfer student committees
Internal and external media

NSSE DATA USER’S GUIDE • 4
NSSE Data User’s Guide WORKSHEET #2
Predict Your Results
What do you know about your students? Because beliefs and assumptions play a role in shaping expectations and
actions, it is helpful to account for them when trying to understand the undergraduate experience.
Items from NSSE Question #1 are in the table below. Select several items of interest, or add your own to the table.
Then, in the “Predict” column record whether you believe this is a “strength” or an infrequent experience among
your students (see the key below). Under “Prefer” indicate the level of your preference for students’ engagement in
this experience. Under “Actual” write the result for that item in the Frequency and Statistical Comparisons report.
Examine the gaps between students’ actual responses and faculty and staff predictions and preferences as a catalyst
for group discussion about the quality of the student experience.
Key
* Use “+” to identify a strength, something students do frequently, “=” to identify something a fair proportion of
students do, “–” to identify an infrequent experience.
** % “Often” or “Very Often”—Actual percentage distribution is available from the Engagement Indicators and
Frequency and Statistical Comparisons reports.
Items from Survey Question #1 [modify this table to include a dozen or so items of interest to your institution]
1. During the current school year, about how often have you done the following?
Response options: Very often, Often, Sometimes, Never Predict* Prefer* Actual %**
a. Asked questions or contributed to course discussions in other ways
b. Prepared two or more drafts of a paper or assignment before turning it in
c. Come to class without completing readings or assignments
d. Attended an art exhibit, play or other arts performance (dance, music, etc.)
e. Asked another student to help you understand course material
f. Explained course material to one or more students
g. Prepared for exams by discussing or working through course material with other students
h. Worked with other students on course projects or assignments
i. Gave a course presentation
NSSE DATA USER’S GUIDE • 5
NSSE Data User’s Guide WORKSHEET #3
High-Impact Practices
High-Impact Practices Participation
Participation Prediction
Participation Preference
Actual Participation
Looking Within [subpopulation: ]
Faculty Value
Respondent Group High-Impact Practices
First-Year
Students Learning Community
Service-Learning
Research with Faculty
Participated in at least one of the above
Senior
Students Learning Community
Service-Learning
Research with Faculty
Internship or Field Experience
Study Abroad
Culminating Senior Experience
Participated in at least one of the above
Participated in two or more of the above
This exercise is designed to facilitate consideration of and discussion about student participation in the High-Impact
Practices (HIPs) reported in NSSE results. Record your prediction of what percentage of students you think
participate in these activities. Similarly, you can record what you would prefer this percentage to be. Comparisons of
your predictions and preferences to actual NSSE results are then possible. You will need to refer to the High-Impact
Practices section of your NSSE Institutional Report to complete the exercise. The “Looking Within” column in the
table can be used to note subpopulations of interest after reviewing the final page of the High-Impact Practices
report showing participation by student characteristics.
If your institution also participated in the Faculty Survey of Student Engagement (FSSE), record the percentage of
faculty who believe participation is “Important” or “Very Important.” This information can be found in the FSSE-
NSSE Combined Report in your NSSE Institutional Report. If your institution did not participate in FSSE, record
overall values of importance from FSSE summary tables located on the FSSE website.
fsse.iub.edu/html/overall_results.cfm
Consider what the gaps between student participation and your predictions, preferences, and faculty values reveal
about the quality of the student experience at your institution. How might your institution address these gaps?
NSSE DATA USER’S GUIDE • 6
NSSE Data User’s Guide WORKSHEET #4
Engagement Indicators
NSSE Engagement Indicator Scores
Themes Engagement Indicators Prediction* Preference*
Actual Score Relative to
Comp Group**
Academic Challenge Higher Order Learning
Reflective & Integrative Learning
Learning Strategies
Quantitative Reasoning
Learning with Peers Collaborative Learning
Discussions with Diverse Others
Experiences with Faculty Student-Faculty Interaction
Effective Teaching Practices
Quality of Interactions Campus Environment
Supportive Environment
This exercise is designed to facilitate consideration of and discussion about the quality of the student experience
from the perspective of faculty and staff compared to the perspective of students on the ten Engagement Indicators
(EIs)—broad measures of educational effectiveness, grouped within four themes—reported in NSSE results for 47
survey items. For this exercise, use the document in the Institutional Report, “Engagement Indicators & High-
Impact Practices,” listing the items that comprise the Engagement Indicators.
nsse.iub.edu/pdf/Benchmarks%20to%20Indicators.pdf
For each of the ten NSSE Engagement Indicators, record if you think this is an area of strength (+), an area that
your institution does well enough (=), or an area that needs improvement (−). Compare your predictions and
preferences to actual Engagement Indicator scores. (Consider scores in relation to your comparison group—are you
better than, equal to, or below?) Refer to the Engagement Indicators report in your NSSE Institutional Report to
complete the exercise.
Consider what the gaps between student responses and your predictions and preferences reveal about the quality of
the student experience at your institution in relation to the particular scale you have chosen. What ideas might you
have to address some of these gaps?
Key
* + strength, = done well enough, – needs improvement
** Score is higher than comparison group; -- no difference; lower than comparison group.
NSSE DATA USER’S GUIDE • 7
This worksheet is an additional tool for focusing on important item-level results for NSSE Engagement
Indicators. Looking within an area of engagement can help explain why scores are high or low and can also lead
to ideas for improvement.
After identifying, in Worksheet #4, areas needing improvement, individual Engagement Indicators items can be
considered further with this worksheet. Examining percentages of your students that engage in various activities
“Never” (or “Very little”) alongside comparison group percentages can help identify areas of success or concern.
To complete this worksheet, refer to the Frequencies and Statistical Comparisons section of your NSSE
Institutional Report and select a respondent group (first-year students or seniors) and a comparison group or
groups. If your institution participated in the Faculty Survey of Student Engagement (FSSE), also record
information from faculty responses, found in the FSSE-NSSE Combined Report in your NSSE Institutional
Report. If your institution did not participate in FSSE, record overall input from FSSE summary tables located on
the FSSE website.
fsse.iub.edu/html/overall_results.cfm
Engagement Indicator Results Comparisons
Engagement Indicator Items
Institution % Never/Very
Little
Comparison Group
% Never/Very Little
Statistical Significance (*)
of Average Difference
Effect Size (±magnitude)
of Average Difference
Faculty Values, Emphasis, or Participation
Area of Concern? (Yes/No)
NSSE Data User’s Guide WORKSHEET #5
Engagement Indicator Item-Level Results
NSSE DATA USER’S GUIDE • 8
NSSE Data User’s Guide WORKSHEET #6
NSSE and Campus Strategic Goals
This worksheet is designed to facilitate conversation and discussion across faculty, staff, and administrators as
they review NSSE student response data in comparison with existing campus strategic goals. In this guided
exercise, campus representatives will familiarize themselves with the NSSE instrument, review their campus
goals, and select one to use for the activity.
Select a campus strategic goal for this activity. Keep in mind that not all strategic goals have corresponding
indicators among NSSE questions, so it may be helpful to reference the survey while selecting.
1a. Review the NSSE instrument and identify 5–6 items that most relate to your campus strategic goal.
Among these items, select 3 that you prefer a large proportion of your students to experience—in
other words, the NSSE items for which you would like the percentage of “Never” (or “Very little” )
participating to be as close to 0% as possible.
1b. Why did you select these items?
1c. Looking at the results for these items, are you surprised? Did you expect different results; if so, what
results did you expect? What activities could you do on campus to try to affect the responses?
1d. What existing campus offices, committees, student organizations, and individuals would be
interested in the responses to these items?
2a. Looking at your NSSE reports, select 3–5 items for which you would like the students at your
institution to report more participation than reported by the listed comparison group—in other
words, the NSSE items for which you would like the percentage of “Never” (or “Very little”)
participating to be lower than your comparison group’s percentage.
2b. For the items selected in question 2a, why did you select these?
2c. For the items selected in question 2a, are any of your results disappointing, surprising, or below your
expectations? Expand on this.
3. Reflecting on this worksheet, what have you learned? Who are those on your campus that you will
share these results with?
Campus strategic goal selected for this activity:
NSSE DATA USER’S GUIDE • 9
Fully participating in NSSE is more than simply joining
in the survey administration and receiving the results.
Disseminating NSSE results to relevant audiences and
committees across campus is arguably one of the most
important steps of NSSE participation. Consider the
many opportunities on your campus for sharing
NSSE results.
Data Sharing Opportunities
NSSE results can be used in many ways, including:
• assessing institutional performance
• monitoring academic standards
• providing evidence for accountability and
transparency
• informing improvement efforts
• monitoring students’ exposure to effective
educational practices
• supporting student learning and development
• developing cohort experiences for groups
of students
• facilitating student retention and engagement
• guiding staff development efforts
• managing resources, programs, and services
• fostering other stakeholder engagement
• improving internal communication
• marketing to prospective students
• communicating with alumni
The most effective uses of NSSE results take into
consideration how dissemination is most likely to
enhance education policy and practice. This involves
identifying the audiences and contexts that surround the
reporting activities.
Laying the Groundwork: Explaining the Importance of Student Engagement
NSSE results make more sense when audiences have a
basic understanding of the concept of student
engagement. Research shows that engagement—the time
and energy students devote to educationally purposeful
activities—is the best single predictor of student learning
and personal development. Higher levels of student
engagement result from certain institutional practices, the
best known set of which are the Seven Principles for Good
Practice in Undergraduate Education (A. W. Chickering &
Z. F. Gamson [1987]. AAHE Bulletin, 39[7], 3–7):
1. Encouraging student-faculty contact
2. Developing cooperation among students
3. Using active learning techniques
4. Giving prompt feedback
5. Emphasizing time on task
6. Communicating high expectations
7. Respecting diverse talents and ways of learning
Emphasizing good educational practice helps focus
faculty, staff, students, and others on the tasks and
activities associated with higher yields in desired student
learning outcomes.
Answering Questions: The NSSE Instrument and Self-Reported Data
It is important to answer any questions that may arise
regarding the validity and reliability of the NSSE survey
before introducing the data and results to the workshop
group. Staff may more readily accept the findings and
consider changes to their practice if such questions are
adequately addressed before the workshop begins.
The validity of self-reported data can be affected by the
ability of respondents to provide accurate and truthful
information in response to questions. Research shows that
people generally tend to respond accurately on questions
about their past behavior unless the questions are sensitive
or make them uncomfortable. The validity of self-reported
time estimates has also been examined. To provide survey
respondents a frame of reference, NSSE items include
specific periods of time to aid memory recall and to
reduce the distortion that may occur when respondents
remember events over time. Further research suggests that
self-reported data are valid under five conditions, all of
which NSSE was designed to satisfy:
1. The requested information is known to respondents
2. The questions are phrased clearly and unambiguously
3. The questions refer to recent activities
4. The respondents take the questions seriously
5. The questions do not threaten, embarrass, or violate
respondents’ privacy
Sharing NSSE Results
NSSE Data User’s Guide
NSSE DATA USER’S GUIDE • 10
The “halo effect”—which may account for satisfied
students inflating performance, grades, or personal gains
and efforts on surveys—appears to be fairly consistent
across student populations. Thus, although what students
report may differ somewhat from what they actually do,
this effect does not appear to advantage or disadvantage
one institution or student group compared with another.
Further information about research on self-reported data
is in the Psychometric Portfolio, available on the NSSE
website. The portfolio provides a framework for
presenting studies on the validity, reliability, and other
indicators of quality of NSSE’s data, including analysis
of data subsets defined by a variety of student and
institutional characteristics.
nsse.iub.edu/links/psychometric_portfolio
Getting Started
When new NSSE users receive their results and reports,
they may not know where to jump in, or they may first
wonder, “What are we doing well?” As you review your
NSSE reports from 2001 to 2012, we recommend starting
with your Benchmark Comparison report. This will give
you comparative information to look inside and across
your results. Second, look at the results to individual
questions that comprise each benchmark. Specifically, it
may be helpful to review the items with the greatest
frequency of “Very often” against “Never” responses. If
you are reviewing NSSE reports from 2013 or later, we
recommend starting with your Snapshot report. Sharing
this report with a wide campus audience may be a good
first step, but providing campus units or groups with more
tailored results or conducting interactive presentations
using some of the worksheets in this user’s guide may
help stimulate interest in additional results. The tips
displayed in the box below may help your data
dissemination initiatives.
Closing Thoughts
Educational improvement is the primary goal in using
NSSE. If your NSSE results are less than favorable this
year, sharing the data with appropriate institutional
stakeholders is even more important. If results are not
shared, campus administrators may remain in the dark on
crucial educational issues. For example, if NSSE results
reveal that students are not interacting with academic
advisors or faculty members as frequently as
administrators had hoped, sharing the NSSE results is an
important step in starting the change process.
For campuses that seek to exploit NSSE to its full
potential, receiving NSSE’s detailed reports and student
data files is not the end of a process. Rather, it signals the
beginning of the next phase: using NSSE results. After
data collection has concluded, the real work begins—
making meaning from the results, identifying priorities for
action, formulating concrete plans for improvement, and
implementing those plans. At whatever point in this
process your campus may be, we encourage you to take
full advantage of all that NSSE provides.
Meet with key stakeholders individually or in a small group.
Before meeting with stakeholders, be sure to send NSSE results ahead of time and ask them to bring a copy to the meeting.
Contextualize the data or compare them with previous years’ administration results.
Consider what other institutional data you can link to NSSE data.
Work with stakeholders, relevant committees, and/or departments to create specific goals and action plans using NSSE results.
Make sure that students, individuals who work in this area, and campus representatives who may have an interest in NSSE results are included in communications.
Implement the plan and monitor progress.
Progress can be monitored via focus groups, informal surveys, and interviews.
Form an “action team” (faculty and staff) to spearhead administration and promotion and to help further analyze results.
Host a lunch for a preliminary discussion of team members’ roles and expectations.
Communicating Results to Create Action for Change
NSSE DATA USER’S GUIDE • 11
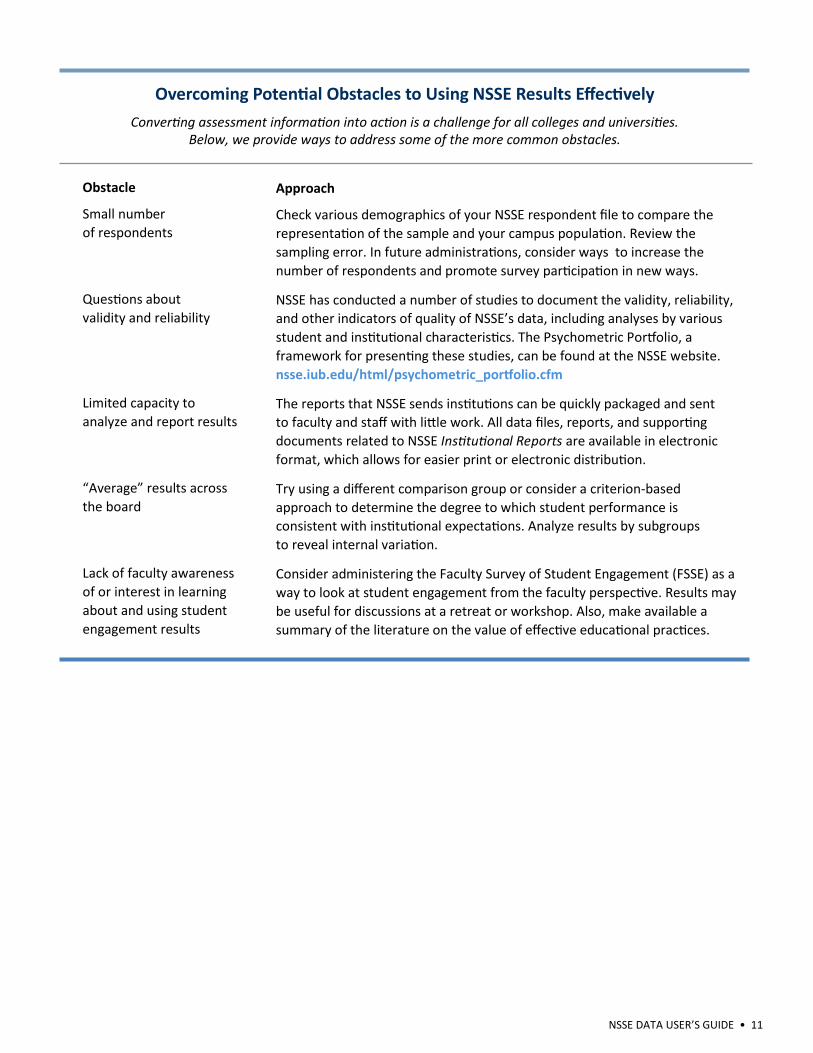
Obstacle
Small number
of respondents
Questions about
validity and reliability
Limited capacity to
analyze and report results
“Average” results across
the board
Lack of faculty awareness
of or interest in learning
about and using student
engagement results
Converting assessment information into action is a challenge for all colleges and universities.
Below, we provide ways to address some of the more common obstacles.
Approach
Check various demographics of your NSSE respondent file to compare the
representation of the sample and your campus population. Review the
sampling error. In future administrations, consider ways to increase the
number of respondents and promote survey participation in new ways.
NSSE has conducted a number of studies to document the validity, reliability,
and other indicators of quality of NSSE’s data, including analyses by various
student and institutional characteristics. The Psychometric Portfolio, a
framework for presenting these studies, can be found at the NSSE website.
nsse.iub.edu/html/psychometric_portfolio.cfm
The reports that NSSE sends institutions can be quickly packaged and sent
to faculty and staff with little work. All data files, reports, and supporting
documents related to NSSE Institutional Reports are available in electronic
format, which allows for easier print or electronic distribution.
Try using a different comparison group or consider a criterion-based
approach to determine the degree to which student performance is
consistent with institutional expectations. Analyze results by subgroups
to reveal internal variation.
Consider administering the Faculty Survey of Student Engagement (FSSE) as a
way to look at student engagement from the faculty perspective. Results may
be useful for discussions at a retreat or workshop. Also, make available a
summary of the literature on the value of effective educational practices.
Overcoming Potential Obstacles to Using NSSE Results Effectively
NSSE DATA USER’S GUIDE • 12
Exemplary Uses of NSSE Data To conclude your results-sharing session or to inspire
further campus action, you may want to illustrate the
ways other institutions have used NSSE data to improve
the quality of undergraduate education. Below are
several short examples of institutions that have had
success in using NSSE data on campus.
NSSE’s repositories of practical ideas for data use
including two volumes of Lessons from the Field, short
examples featured in the yearly Annual Results reports,
and the more than 500 institution examples in a
searchable database on the NSSE website provide
additional illustrations of using NSSE data to enhance
undergraduate education.
nsse.iub.edu/html/how_institutions_use_NSSE.cfm
Austin Peay State University Austin Peay State University presented its NSSE
findings to the university’s deans, chairs, and directors,
connecting student engagement information along with
data from the Cooperative Institutional Research
Program and Your First College Year survey. After
analyzing the responses of students majoring in
education, the results were incorporated into the self-
study prepared for the National Council for Accreditation
of Teacher Education review.
In addition, NSSE results have been considered in
freshman seminar and orientation workshops and other
first-year student initiatives. Student affairs program
directors in health services and counseling use NSSE
data to guide outreach programming. Austin Peay also
has included its NSSE results in proposals prepared for
external funding, such as Title III grants for expanding
institutional capacity to serve low-income students.
The Catholic University of America In 2009, The Catholic University of America (CUA), in
Washington, DC, launched a comprehensive assessment
plan for their newly implemented First-Year Experience
(FYE) program. Representing a substantial investment in
helping the newest members of the campus community
enter into the life of the university and improve student
retention, the FYE program at CUA is comprised of
numerous components that support student success
including a streamlined summer registration process;
first-year advising; learning communities; a weekly
FYE newsletter; increased tutoring and learning
assistance programs; and, at its core, academic and
intellectual elements. To inform the creation and
improvement of the FYE program, CUA used a range of
data including NSSE, the Classroom-Level Survey of
Student Engagement (CLASSE), advising surveys,
course and instructor evaluations, and institutional
retention data.
CUA has administered NSSE annually since 2000 and
has examined results longitudinally to assess
improvements in first-year student engagement and, in
particular, to assess the impact of implementing learning
communities and enhanced first-year courses. CUA’s
NSSE scores for student-faculty interaction increased
significantly over time and in comparison to their
Carnegie peers. For example, results demonstrated
improvements in teaching and learning in the first year,
including discussing ideas from readings with faculty
members outside of class and receiving prompt feedback
on academic performance.
Similar improvements also occurred for collaborative
learning activities such as discussing ideas with peers
outside of class and participating in community-based
projects. By combining NSSE with other assessment
results, including course and instructor evaluations,
CUA further revised the curriculum of its introductory
writing course, implemented block scheduling of
learning communities, and established an FYE reading
room. CUA concluded that assessment results supported
the incorporation of learning communities, first-year
advising, and co-curricular enhancements to the FYE,
and also indicated that further attention was needed to
the academic core of FYE. CUA plans to invest in
expanded faculty development activities and to continue
striving to make the educational experience
academically rich and personally nurturing to ensure
student success.
University of Nebraska at Kearney The University of Nebraska at Kearney (UNK) has
administered NSSE six times. Each year, the results are
reviewed by various departments and programs for
setting priorities, recruitment, assessment, and program
NSSE Data User’s Guide CONCLUSION
NSSE DATA USER’S GUIDE • 13
improvement. NSSE results have been employed in
discussions about developing a new and different
approach to general education at UNK, as faculty
examine the relative strengths and weaknesses of the
program from the student’s perspective. In addition, the
first-year experiences program and the undergraduate
research program housed in the Office of Sponsored
Programs use student engagement data to assess whether
students are benefiting from these two programs in the
intended ways.
Finally, NSSE findings have informed the university’s
strategic planning process to discern strengths,
weaknesses, opportunities, and threats from a student
perspective. As a predominantly undergraduate
residential institution, UNK considers NSSE data to be
indispensable to effective planning, and it intends to
continue using it to develop and implement action plans
based on the institutional strategic plan.
Minnesota State Colleges and Universities The Minnesota State Colleges and Universities (MnSCU)
system convened member campuses for a two-day
working conference to build upon efforts to promote
promising practices for student success—practices
aligned with the chancellor’s priorities to dramatically
increase student retention, successful transfer, and
completion of degrees. Sessions addressed high-impact
practices (learning communities, service-learning, first-
year seminars, and undergraduate research) for both state
university and two-year college student success. The goal
of the conference was to use data, including results from
NSSE and the Community College Survey of Student
Engagement (CCSSE), to inform the design of such
practices, with particular emphasis on first-year
experience courses, supplemental instruction, and
accelerated developmental education.
Each MnSCU campus team—composed of chief
academic officers, faculty, student affairs staff, equity
officers, deans, and directors of academic support—
developed their institution’s plan to scale-up promising
practices and to set target measures for increasing student
success outcomes. As a result of these conversations, best
practices in student success are being fostered across
MnSCU campuses including corequisite, accelerated, and
modularized models of developmental education;
Statways and Quantways efforts (Carnegie Foundation
for the Advancement of Teaching curriculum
development initiatives to increase student success in
mathematics); and expanded supplemental instruction,
learning communities, and first-year experience
programs. MnSCU also plans to launch a faculty-driven
process to determine shared learner outcomes for
developmental education and, through partnerships with
secondary schools and adult basic education programs,
will create a series of targeted interventions to cultivate
college readiness and foster success.
Resources for Additional Examples
How institutions use NSSE:
nsse.iub.edu/html/howInstitutionsUseNSSE.cfm
Institutional website examples:
nsse.iub.edu/html/inst_web_site_display.cfm
Related Documents