Notched Audiograms and Noise Exposure History in Older Adults DM Nondahl, MS 1 , X Shi, MS 1 , KJ Cruickshanks, PhD 1,2 , DS Dalton, MS 1 , TS Tweed, MS 1,3 , TL Wiley, PhD 4 , and LL Carmichael, MS 2 1 Department of Ophthalmology and Visual Sciences, University of Wisconsin, Madison, WI 53726-2397 2 Department of Population Health Sciences, University of Wisconsin, Madison, WI 53726-2397 3 Department of Communicative Disorders, University of Wisconsin, Madison, WI 53726-2397 4 Department of Speech & Hearing Science Arizona State University, Tempe, AZ 85287-0102 Abstract OBJECTIVE—Using data from a population-based cohort study, we compared four published algorithms for identifying notched audiograms, along with how their resulting classifications compare with noise exposure history. DESIGN—Four algorithms: 1) Coles, Lutman & Buffin (2000), 2) McBride & Williams (2001), 3) Dobie & Rabinowitz (2002), and 4) Hoffman et al. (2006) were used to identify notched audiograms. Audiometric evaluations were collected as part of the Epidemiology of Hearing Loss Study 10-year follow-up examinations, in Beaver Dam, WI (2003–2005, n=2395). Detailed noise exposure histories were collected by interview at the baseline examination (1993–95) and updated at subsequent visits. An extensive history of occupational noise exposure, participation in noisy hobbies, and firearm usage were used to evaluate consistency of the notch classifications with history of noise exposure. RESULTS—The prevalence of notched audiograms varied greatly by definition (31.7%, 25.9%, 47.2%, and 11.7% for methods 1, 2, 3, and 4, respectively). In this cohort, a history of noise exposure was common (56.2% for occupational noise, 71.7% for noisy hobbies, 13.4% for firearms, 81.2% for any of these three sources). Among participants with a notched audiogram, almost one third did not have a history of occupational noise exposure (31.4%, 33.0%, 32.5%, and 28.1% for methods 1, 2, 3, and 4, respectively) and approximately 11% did not have a history of exposure to any of the three sources of noise (11.5%, 13.6%, 10.3%, and 7.6%). Discordance was greater among women than men. CONCLUSIONS—These results suggest that there is poor agreement across existing algorithms for audiometric notches. In addition, notches can occur in the absence of a positive noise history. In the absence of an objective consensus definition of a notched audiogram, and in light of the degree of discordance in women between noise history and notches by each of these algorithms, researchers should be cautious about classifying noise-induced hearing loss by notched audiograms. Keywords noise-induced hearing loss; diagnosis; notched audiogram Corresponding author: Karen J. Cruickshanks, PhD, Departments of Ophthalmology & Visual Sciences / Population Health Sciences, University of Wisconsin, School of Medicine and Public Health, 610 Walnut Street, Room 1038, Madison, WI 53726-2397, Phone: (608) 265-4032, Fax: (608) 265-2148, [email protected]. NIH Public Access Author Manuscript Ear Hear. Author manuscript; available in PMC 2010 December 1. Published in final edited form as: Ear Hear. 2009 December ; 30(6): 696–703. doi:10.1097/AUD.0b013e3181b1d418. NIH-PA Author Manuscript NIH-PA Author Manuscript NIH-PA Author Manuscript

Welcome message from author
This document is posted to help you gain knowledge. Please leave a comment to let me know what you think about it! Share it to your friends and learn new things together.
Transcript
Notched Audiograms and Noise Exposure History in Older Adults
DM Nondahl, MS1, X Shi, MS1, KJ Cruickshanks, PhD1,2, DS Dalton, MS1, TS Tweed,MS1,3, TL Wiley, PhD4, and LL Carmichael, MS21Department of Ophthalmology and Visual Sciences, University of Wisconsin, Madison, WI53726-23972Department of Population Health Sciences, University of Wisconsin, Madison, WI 53726-23973Department of Communicative Disorders, University of Wisconsin, Madison, WI 53726-23974Department of Speech & Hearing Science Arizona State University, Tempe, AZ 85287-0102
AbstractOBJECTIVE—Using data from a population-based cohort study, we compared four publishedalgorithms for identifying notched audiograms, along with how their resulting classificationscompare with noise exposure history.
DESIGN—Four algorithms: 1) Coles, Lutman & Buffin (2000), 2) McBride & Williams (2001), 3)Dobie & Rabinowitz (2002), and 4) Hoffman et al. (2006) were used to identify notched audiograms.Audiometric evaluations were collected as part of the Epidemiology of Hearing Loss Study 10-yearfollow-up examinations, in Beaver Dam, WI (2003–2005, n=2395). Detailed noise exposure historieswere collected by interview at the baseline examination (1993–95) and updated at subsequent visits.An extensive history of occupational noise exposure, participation in noisy hobbies, and firearmusage were used to evaluate consistency of the notch classifications with history of noise exposure.
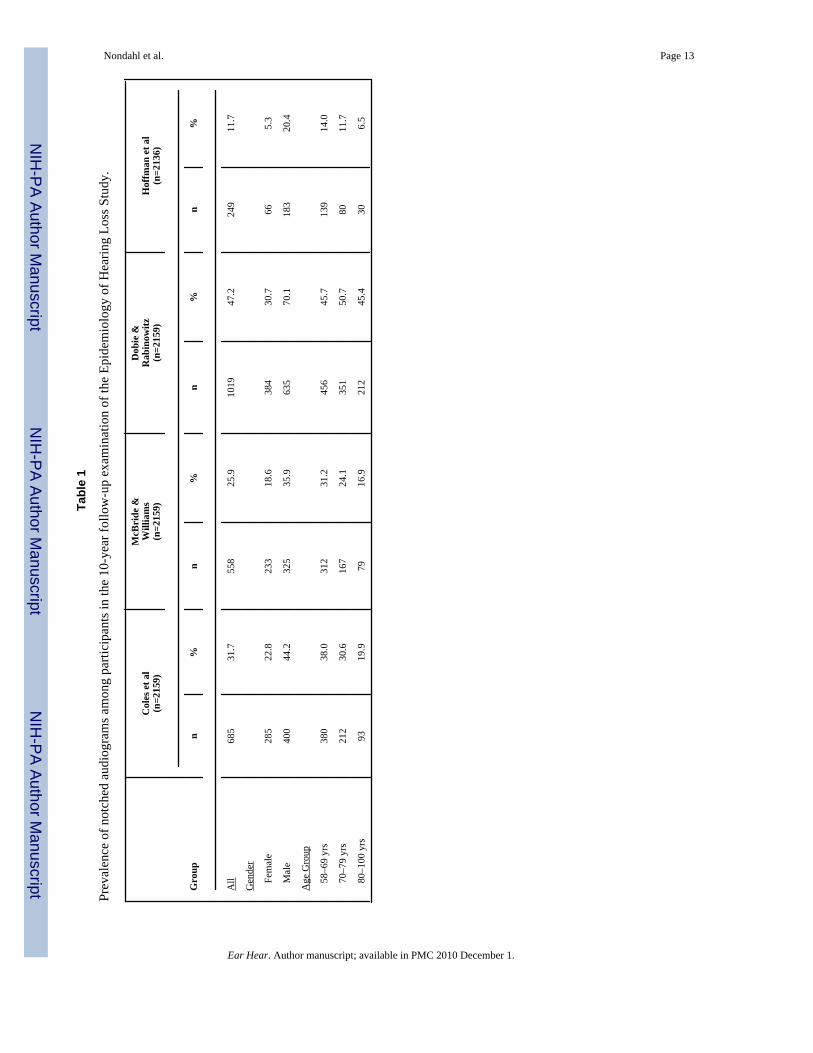
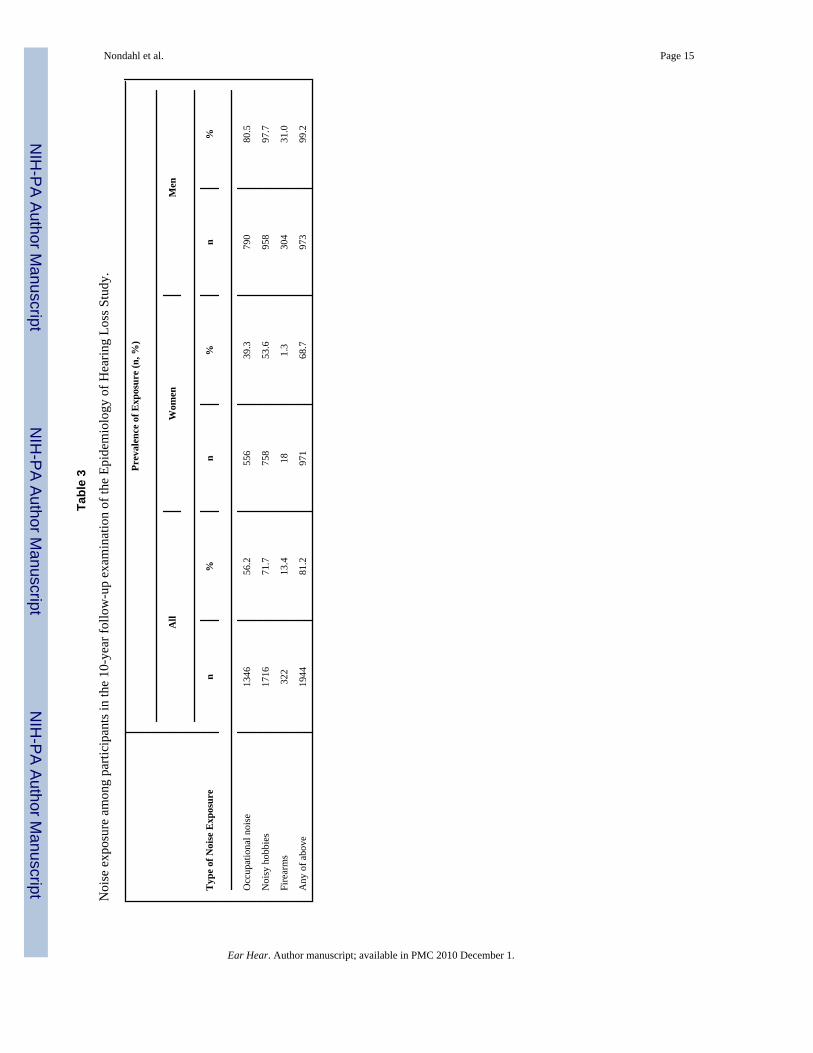
RESULTS—The prevalence of notched audiograms varied greatly by definition (31.7%, 25.9%,47.2%, and 11.7% for methods 1, 2, 3, and 4, respectively). In this cohort, a history of noise exposurewas common (56.2% for occupational noise, 71.7% for noisy hobbies, 13.4% for firearms, 81.2%for any of these three sources). Among participants with a notched audiogram, almost one third didnot have a history of occupational noise exposure (31.4%, 33.0%, 32.5%, and 28.1% for methods 1,2, 3, and 4, respectively) and approximately 11% did not have a history of exposure to any of thethree sources of noise (11.5%, 13.6%, 10.3%, and 7.6%). Discordance was greater among womenthan men.
CONCLUSIONS—These results suggest that there is poor agreement across existing algorithmsfor audiometric notches. In addition, notches can occur in the absence of a positive noise history. Inthe absence of an objective consensus definition of a notched audiogram, and in light of the degreeof discordance in women between noise history and notches by each of these algorithms, researchersshould be cautious about classifying noise-induced hearing loss by notched audiograms.
Keywordsnoise-induced hearing loss; diagnosis; notched audiogram
Corresponding author: Karen J. Cruickshanks, PhD, Departments of Ophthalmology & Visual Sciences / Population Health Sciences,University of Wisconsin, School of Medicine and Public Health, 610 Walnut Street, Room 1038, Madison, WI 53726-2397, Phone: (608)265-4032, Fax: (608) 265-2148, [email protected].
NIH Public AccessAuthor ManuscriptEar Hear. Author manuscript; available in PMC 2010 December 1.
Published in final edited form as:Ear Hear. 2009 December ; 30(6): 696–703. doi:10.1097/AUD.0b013e3181b1d418.
NIH
-PA Author Manuscript
NIH
-PA Author Manuscript
NIH
-PA Author Manuscript
IntroductionNoise-induced hearing loss (NIHL), as opposed to acute acoustic trauma, can be defined ashearing loss that develops slowly over a long period of time (several years) as the result ofexposure to continuous or intermittent loud noise (ACOEM, 2003). NIHL is a common typeof sensorineural hearing loss. However, since multiple factors can contribute to hearing loss,the exact prevalence of NIHL is unknown.
Exposure to sufficiently loud occupational noise for extended periods of time, however, canincrease the risk of developing NIHL. Many Americans are exposed to hazardous levels ofnoise in the workplace, especially in industries using noisy machinery, such as metalworking,stone cutting, woodcutting, transportation, agriculture and the military.
Non-occupational noise may also contribute to NIHL. Noisy recreational activities likewoodworking, metalworking, or the use of power tools have been associated with highfrequency hearing loss (Dalton et al, 2001). Motorcycle riding has also been associated withhearing loss (McCombe & Binnington, 1994; McCombe et al, 1995), as has the use of firearmsduring hunting or target shooting (Taylor & Williams, 1966; Prosser, Tartari, & Arslan,1988; Nondahl et al, 2000).
People with NIHL have structural damage in their cochlea (Rabinowitz, 2000; ACOEM,2003). The sensory cells in the basal portion of the cochlea concerned with the reception ofsound at 3–6 kHz are more vulnerable to damage from noise than those tuned to lower andhigher frequencies (Johnsson & Hawkins Jr, 1976). Thus the worsening of sound perceptiontypically starts in the 3–6 kHz range for people with NIHL (Gallo & Glorig, 1964; McBride& Williams, 2001). This may be reflected in the audiogram as hearing thresholds that reach amaximum between 3–6 kHz and then return toward the normal level at higher frequencies,forming a noise notch. A notched audiogram, together with a positive history of noise exposure,has been gradually accepted as a clinical sign of NIHL (McBride & Williams, 2001).
However, there is little agreement about a formal definition of a notched audiogram. In theMcBride & Williams (2001) study, three raters with experience assessing audiograms (anotolaryngologist, an audiometrician, and an occupational physician) were asked to inspect theaudiograms of 634 individuals (one audiogram for each ear) and assess whether a notch waspresent in the audiogram of either ear: a notch which, if a suitable noise history were obtained,would be attributed to noise exposure in that person. Agreement between the raters was poor:Raters 1, 2 and 3 identified 26%, 49%, and 68% of the individuals as having a notchedaudiogram, respectively. Intraclass correlations between the ratings of pairs of raters rangedfrom 0.14 to 0.52. The poor agreement among the three raters indicated visual inspection ofthe audiograms was not a reliable method for identifying notches.
Several studies have suggested algorithms to more objectively define the presence of a notchedaudiogram (Kramer & Wood, 1982; West & Evans, 1990;Coles, Lutman & Buffin, 2000;McBride & Williams, 2001; Niskar et al, 2001; Dobie & Rabinowitz, 2002; Hoffman et al,2006). Three of these (Kramer & Wood, 1982; West & Evans, 1990; Niskar et al, 2001) werecarried out among children and young adults who typically have fewer competing factorscontributing to the audiometric shape, thus making notches more easily recognized. Since thepresent study focused on older adults, these three studies were not considered further here.Validation studies as well as studies comparing algorithms among older adults are still needed.Consequently, the purpose of this study was to compare four algorithms for identifyingaudiometric notches (Coles, Lutman & Buffin (2000); McBride & Williams, 2001; Dobie &Rabinowitz, 2002; Hoffman et al, 2006) using data from a population-based cohort study ofolder adults.
Nondahl et al. Page 2
Ear Hear. Author manuscript; available in PMC 2010 December 1.
NIH
-PA Author Manuscript
NIH
-PA Author Manuscript
NIH
-PA Author Manuscript
Materials and MethodsThe Epidemiology of Hearing Loss Study (EHLS) is a population-based study of hearing lossin adults 48–92 years of age (Cruickshanks et al, 1998). During 1987–88, residents of the cityor township of Beaver Dam, Wisconsin who were 43–84 years of age (n=5,924) were identifiedthrough a private census and invited to participate in a study of age-related ocular disorders(The Beaver Dam Eye Study; 1988–90; n=4,926) (Klein et al, 1991). All those who participatedin the baseline eye examination and were alive as of March 1, 1993 were eligible to participatein the hearing study (EHLS; n=4,541). Of those eligible, 3,753 (82.6%) participated, 42.3% ofwhom were male (Cruickshanks et al, 1998). The mean age of the cohort was 65.8 years.
A five-year follow-up examination was conducted from 1998 to 2000. Of 3407 eligible, 2800participated (82.2%); 41.4% of the participants were male. The mean age at the five-yearfollow-up was 69.3 years.
A ten-year follow-up examination was conducted from 2003 to 2005. Of 2902 eligible, 2395participated (82.5%); 41.0 percent of the participants were male. The mean age at the ten-yearfollow-up was 72.7 years (range 58–100 years). The EHLS was approved by the HumanSubjects Committee of the University of Wisconsin-Madison. Informed consent was obtainedfrom each participant at the beginning of the examinations. Hearing loss data used in the currentanalyses were obtained from the 10-year follow-up examination of the EHLS study.
The examination included a questionnaire about medical history as well as noise exposure. Forhistory of occupational noise exposure, history of engaging in noisy hobbies, and history ofrecreational firearm exposure, information was gathered at the baseline examination (lifetimeup to that time), and again at the 5-year follow-up examination (past year exposure) and 10-year follow-up examination (past year exposure), and combined into three cumulative exposurevariables. A history of occupational noise exposure was considered present if the participantsreported having had a full-time job at which they spoke in a raised voice or louder in order tobe heard by another person two feet away; or having been a farmer and driven a tractor, at leasthalf the time without a cab; or having participated in any of the following activities duringmilitary service: working as a pilot or crew member on an aircraft, working as a crew memberon a tracked vehicle, working in an engine room aboard a ship, spending time on weaponsranges at least seven times a year, using grenades, mortars or shoulder-held grenade launchers,or using a weapons system requiring more than one person for operation (Popelka et al.,2000). Participants who reported doing carpentry/woodworking, metalworking, ridingmotorcycles or other noisy recreational vehicles, yard work with power tools, or using a chainsaw at least once a month (on average) for a year were classified as having participated in noisyhobbies (Dalton et al, 2001). Finally, firearm use was defined as ever hunting (and firing theirgun), or reporting target shooting at least once a month (on average) for a year (Nondahl et al,2000).
Pure-tone air conduction audiometry was conducted to determine each participant’s hearingthreshold at 0.5, 1, 2, 3, 4, 6 and 8 kHz, and bone-conduction thresholds were determined at0.5, 2 and 4 kHz. Audiometric testing was conducted in sound treated booths (IndustrialAcoustics Company, Bronx, New York) using GSI-61 audiometers (Grason-Stadler, Madison,Wisconsin) equipped with TDH-50 earphones. Insert earphones (E-A-Rtone 3A; AearoCompany, Indianapolis, Indiana) and masking were used as necessary. People unable to travelto the clinic site (34 nursing home residents, 18 group home residents, and 129 others) weretested at their place of residence using a Beltone 112 portable audiometer (Beltone ElectronicsCorp., Glenview, Illinois). All audiometric equipment complied with American NationalStandards Institute standards (ANSI, 1996; ANSI, 2004). The pure-tone audiometric testingwas done in accordance with American Speech-Language-Hearing Association guidelines
Nondahl et al. Page 3
Ear Hear. Author manuscript; available in PMC 2010 December 1.
NIH
-PA Author Manuscript
NIH
-PA Author Manuscript
NIH
-PA Author Manuscript
(ASHA, 1978). Ambient noise levels were routinely monitored at the clinic site at the BeaverDam Community Hospital and were measured at each home or nursing home visit to ensurethat testing conditions complied with American National Standards Institute standards (ANSI,1999) over the frequency range tested. Audiometers were calibrated every six months.
Four algorithms were used to identify notched audiograms. Coles, Lutman & Buffin (2000)defined a high-frequency notch as “the hearing threshold level (HTL) at 3 and/or 4 and/or 6kHz, after any due correction for earphone type, is at least 10 dB greater than at 1 or 2 kHz andat 6 or 8 kHz.” The McBride and Williams (2001) algorithm was based on narrow notches andwide notches in the audiograms. A narrow or V-shaped notch is one with only one frequencyin the depth of the notch and a wide or U-shaped notch has more than one frequency in thedepth the notch. They suggested “…the narrow notches should be at least 15 dB in depth andthat broad notches should have a depth of 20 dB, with a recovery of at least 10 dB at the highend.” (To determine depth, comparison was made with the mean of the thresholds at the nextlower and higher frequency.) In the current study, the presence of either a V-shaped or a U-shaped notch was sufficient for an audiogram to be classified as having a notch. Dobie andRabinowitz (2002) defined a Notch Index (NI), which was calculated by deducting the meanof the thresholds of 2, 3 and 4 kHz from the mean of the thresholds of 1 and 8 kHz. NI > 0 dBmay indicate the presence of a bulge or a notch. Although in that study a NI of −6 dB was thecriterion that best classified audiograms from cases and non-cases of NIHL (judged by clinicalexperts), we used the more conservative cut-point of 0 dB for our analyses. In addition, forcomparison purposes, we report results obtained when using a higher cut-point (NI > 5) topotentially improve accuracy (Dr. Robert Dobie, personal communication). Finally, Hoffmanet al.(2006) defined a notch as present when “…any threshold at 3, 4 or 6 kHz exceeds by 15decibels (dB) the average threshold in the low/middle frequencies, .5 and 1 kHz, and thethreshold at 8 kHz is at least 5 dB better (lower) than the maximum threshold at 3, 4 or 6 kHz.”
In the current study, for the Coles, Lutman & Buffin (2000), McBride & Williams (2001) andDobie and Rabinowitz (2002) algorithms, a person was considered to have a notched audiogramif a notch was identified on the audiogram of either ear. This facilitated person-levelcomparisons with history of noise exposure. The Hoffman et al. (2006) algorithm required anotch to be present on the audiograms of both ears in order for a person to be classified ashaving a notch; consequently the notch status of 23 participants with audiometric data fromonly one ear could not be determined with the Hoffman et al. algorithm. For convenience, thefour algorithms will be referred to as the Coles, McBride, Dobie, and Hoffman algorithms inthe text that follows.
Statistical analyses were carried out using the SAS System (SAS Institute, Inc., Gary, NC).Sex-specific differences in prevalence of noise exposure, prevalence of notched audiograms,and percent agreement were tested with the chi-square test for association. For some analyses,participants were divided into three age groups (58–69, 70–79, 80–100 years). Age group trendswere tested with the Mantel-Haenszel test for trend. To assess the similarity of the fouralgorithms, tetrachoric correlations were calculated and then analyzed with principalcomponents factor analysis. Multiple logistic regression models were used to assess the oddsof having a notched audiogram (as classified by the four algorithms) associated with age, sexand the three sources of noise exposure.
ResultsThe prevalence of notched audiograms varied for the four algorithms (Table 1). Using theDobie algorithm, 1019 (47.2%) participants were classified as having a notched audiogram,while the Coles, McBride and Hoffman algorithms resulted in lower prevalences of 31.7%,25.9% and 11.7%, respectively. The prevalence of notched audiograms for men was about
Nondahl et al. Page 4
Ear Hear. Author manuscript; available in PMC 2010 December 1.
NIH
-PA Author Manuscript
NIH
-PA Author Manuscript
NIH
-PA Author Manuscript
twice that of women for the Coles, McBride and Dobie algorithms, with the difference beingeven greater for the Hoffman algorithm (Chi-square test, p < 0.0001 for each algorithm). Underthe Dobie algorithm, the prevalence of notched audiograms was not associated with age, whilefor the Coles, McBride and Hoffman algorithms there was a decreasing prevalence of notcheswith age (Mantel-Haenszel test for trend, p = .70 for the Dobie algorithm, and p < .0001 forthe Coles, McBride, and Hoffman algorithms). The prevalence of notched audiograms was30.3% when using NI > 5, but the gender and age patterns remained unchanged (data notshown).
For three of the algorithms (Coles, McBride, and Dobie), participants were classified as havinga notched audiogram if either ear met the notch criteria under consideration. Asymmetry innotch status between ears was fairly high, with 71.2% (Coles), 81.7% (McBride) and 47.2%(Dobie) of participants classified as having a notched audiogram based on only one ear with anotch. If these three algorithms had required both ears to have a notch in order for the personto be classified as having a notched audiogram (as did the Hoffman algorithm), the prevalenceof notched audiograms would have decreased to 9.1% (Coles), 4.7% (McBride) and 24.9%(Dobie), closer to the 11.7% identified by the Hoffman algorithm.
Figure 1 illustrates the overlap in notch classifications among the 2136 participants who wereclassified by all four algorithms. The largest overlap between two algorithms occurred withthe Dobie and Coles algorithms, where 523 participants were classified as having a notchedaudiogram by both algorithms. Three hundred eighty-eight participants were classified ashaving a notched audiogram with the Dobie algorithm but not the other three. In contrast, noparticipants were classified as having a notched audiogram by the Hoffman algorithm alone.Out of 1246 participants classified as having a notched audiogram by at least one of thealgorithms, only 131 (10.5%) were classified as having a notched audiogram by all fouralgorithms. The audiograms of 890 participants were considered free of notches by all fouralgorithms, resulting in an overall rate of agreement of 47.8% ((131 + 890)/2136). Using NI> 5 improved overall agreement slightly to 56.7% ((115 +1097)/2136).
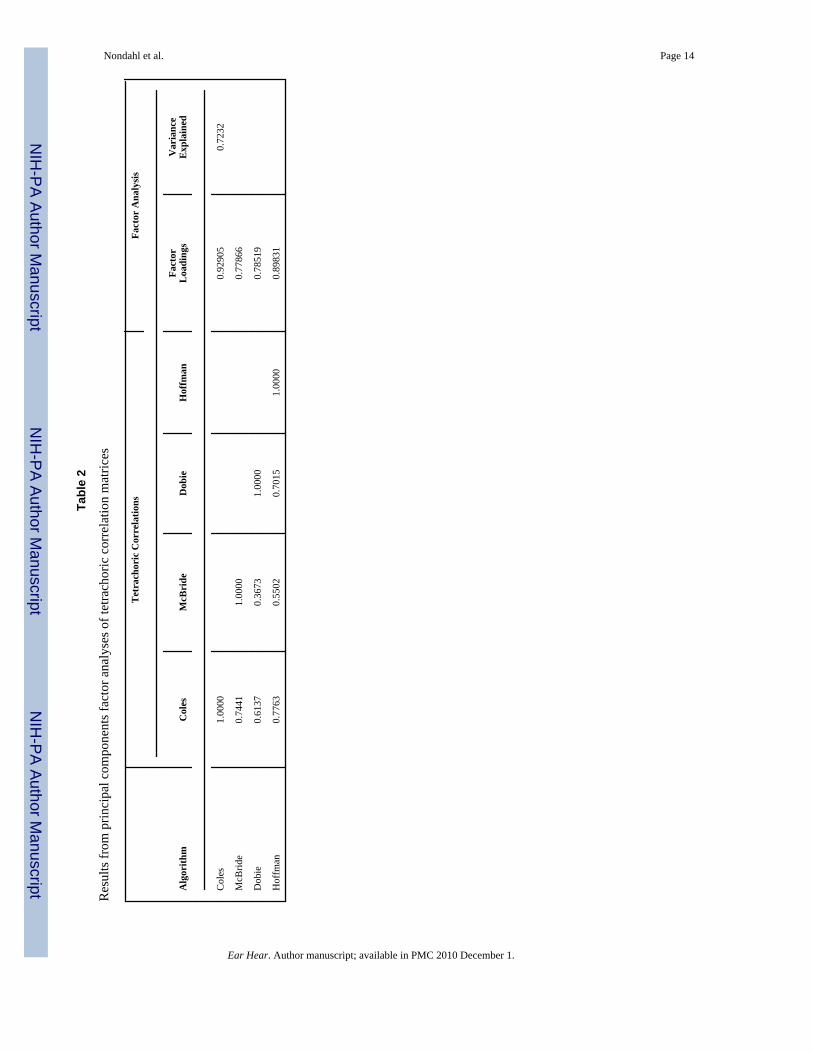
In an attempt to assess which algorithms were most similar to one another, we calculatedtetrachoric correlations for each of the six pairs of algorithms (Table 2). The correlationbetween the McBride and Dobie algorithms was lowest, while the highest correlation wasbetween the Coles and Hoffman algorithms. The tetrachoric correlations were then analyzedwith principal components factor analysis. A single factor (presumably a measure of“notchiness”) explained 72% of the variance. Although factor loadings were reasonably highfor all four algorithms, the McBride and Dobie algorithms contributed somewhat less to thefactor than the others. Using NI > 5 resulted in almost identical findings (data not shown).
In this cohort, noise exposure was common. As Table 3 shows, 56.2% of participants reportedexposure to excessive noise at their workplace, 71.7% reported participating in noisy hobbiesand 13.4% reported exposure to firearms. Overall, 81.2% reported having been exposed to atleast one of the three sources of noise. Men were more likely to have been exposed to noisethan women (p < .0001 for all four noise exposure comparisons).
Although not a focus of the present study, Receiver Operating Characteristic (ROC) curveswere generated to determine the NI cut-point that would maximize sensitivity and specificityfor each of the three types of noise exposure. The optimal cut points were > 2, > 0, and > −2for firearms, occupational noise, and noisy hobbies, respectively.
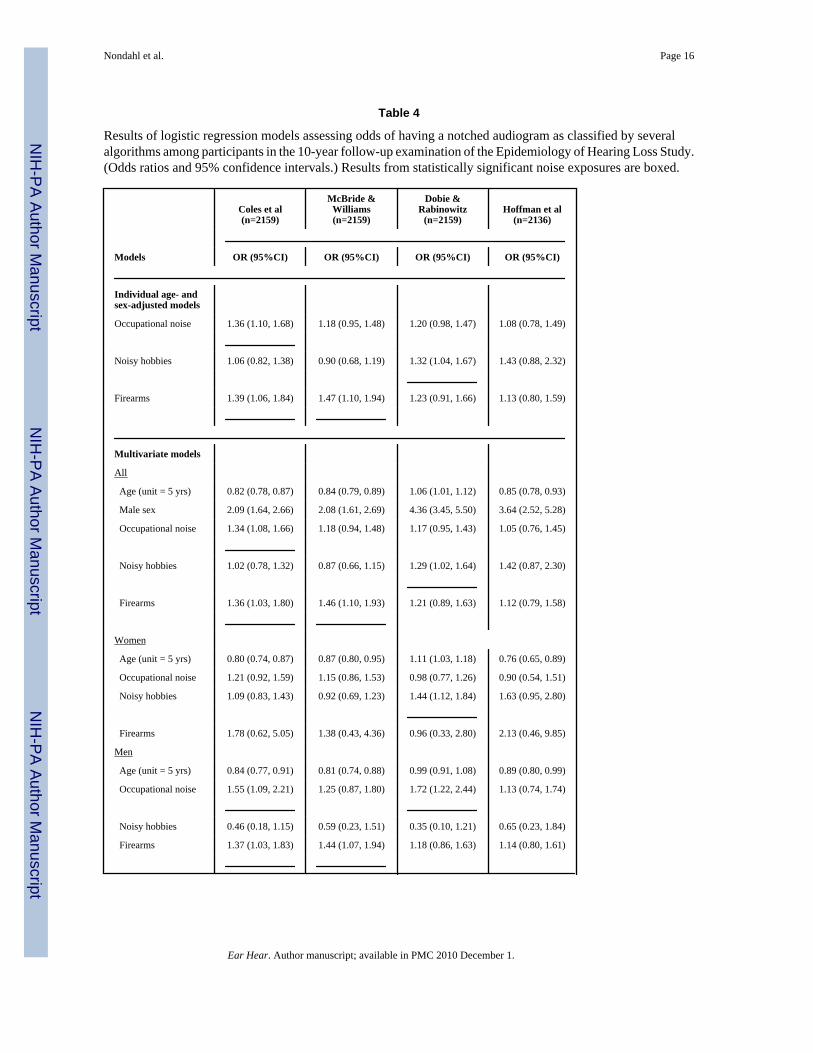
Logistic regression models were used to assess the odds of having a notched audiogramassociated with age, sex, and the three sources of noise. Table 4 shows the results of threemodels (overall, women, and men) for each of the four algorithms. Age was positivelyassociated with the NI, but was negatively associated with notches for the other three
Nondahl et al. Page 5
Ear Hear. Author manuscript; available in PMC 2010 December 1.
NIH
-PA Author Manuscript
NIH
-PA Author Manuscript
NIH
-PA Author Manuscript
algorithms. Being male was consistently associated with higher odds of having a notchedaudiogram. With the Dobie algorithm, men were more likely than women to have notchedaudiograms (Odds Ratio (OR) = 4.36, 95% Confidence Interval (CI) = 3.45, 5.50), even afteradjusting for the sources of noise exposure.
The three sources of noise exposure differed in their association with notched audiograms,depending on which algorithm was under consideration (Table 4). For example, occupationalnoise was most strongly associated with notches as defined by the Coles algorithm (OR = 1.34,95%CI = 1.08, 1.66). Noisy hobbies were only significantly associated with notches as definedby the Dobie algorithm (OR = 1.29, 95%CI 1.02, 1.64), although the Hoffman algorithm alsoproduced a suggestive but nonsignificant result (OR = 1.42, 95%CI 0.87, 2.30). Exposure tofirearms was associated with notches as defined by both the Coles (OR = 1.36, 95%CI 1.03,1.80) and the McBride (OR = 1.46, 95%CI = 1.10, 1.93) algorithms. Models that included onlyone source of noise exposure at a time (e.g., age, sex, occupational noise) demonstrated thesame relations as the combined models, suggesting that collinearity did not significantlyinfluence results of the combined models.
Gender-specific results are also shown in Table 4. For women, there was a significantassociation between having a history of noisy hobbies and having a notched audiogram asdefined by the Dobie algorithm (OR = 1.44, 95%CI 1.12, 1.84). For men, occupational noiseexposure was associated with having a notched audiogram as defined by the Coles algorithm(OR = 1.55, 95%CI 1.09,2.21) and the Dobie algorithm (OR = 1.72, 95%CI 1.22, 2.44). Alsofor men, using firearms was associated with having a notched audiogram as defined by theColes algorithm (OR = 1.37, 95%CI 1.03, 1.83) and the McBride algorithm (OR = 1.44, 95%CI 1.07, 1.94). Among men, there was no association between noisy hobbies and notches.Using NI > 5 yielded similar results (data not shown).
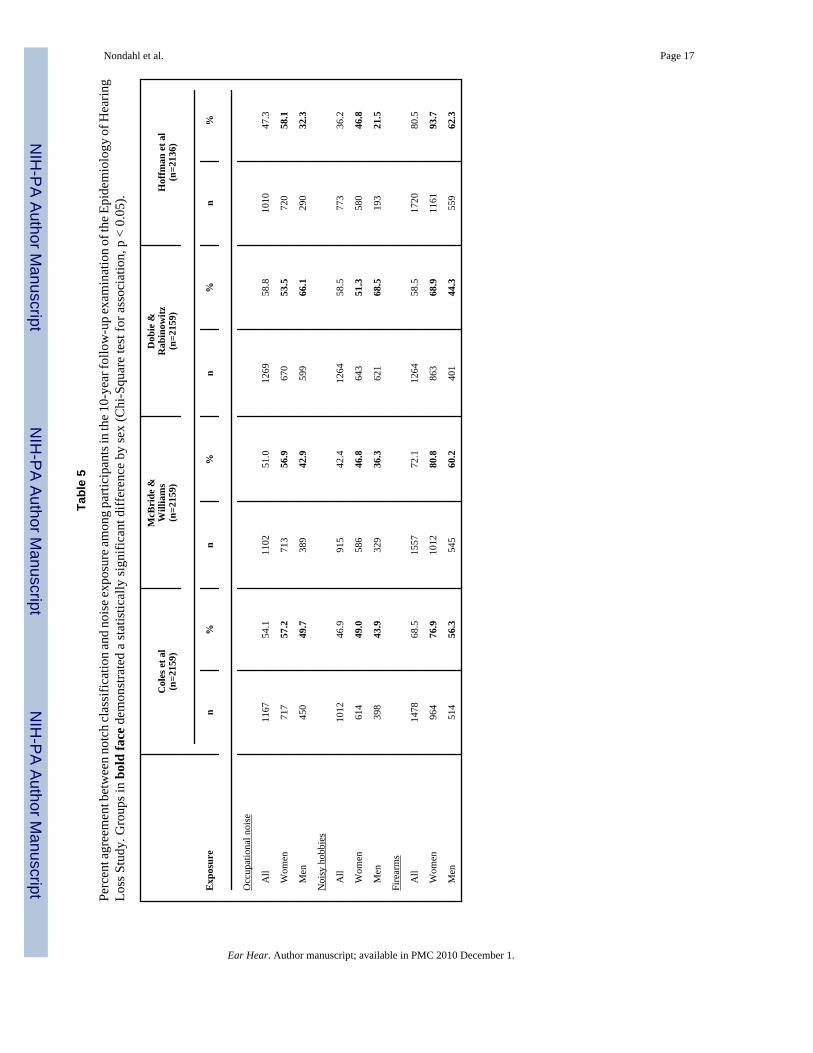
Table 5 shows the percent agreement between classification of notched audiograms and noiseexposure. Agreement was considered present if participants either: 1) were classified as havinga notched audiogram and reported a history of occupational noise exposure, or 2) wereclassified as not having a notched audiogram and did not report a history of occupational noiseexposure.
Overall, percent agreement ranged from 47.3% to 58.8% for occupational noise, 36.2% to58.5% for noisy hobbies, 58.5% to 80.5% for firearms. With the exception of firearms, percentagreement was highest for the Dobie algorithm, and lowest for the Hoffman algorithm. Theopposite was true for firearms: percent agreement was lowest for the Dobie algorithm andhighest for the Hoffman algorithm. Generally, agreement was higher for women than for men.Using NI > 5, overall agreement was similar for occupational noise (56.0%), somewhat lowerfor noisy hobbies (50.4%), and higher for firearms (71.1%) compared to using a cut point of> 0.
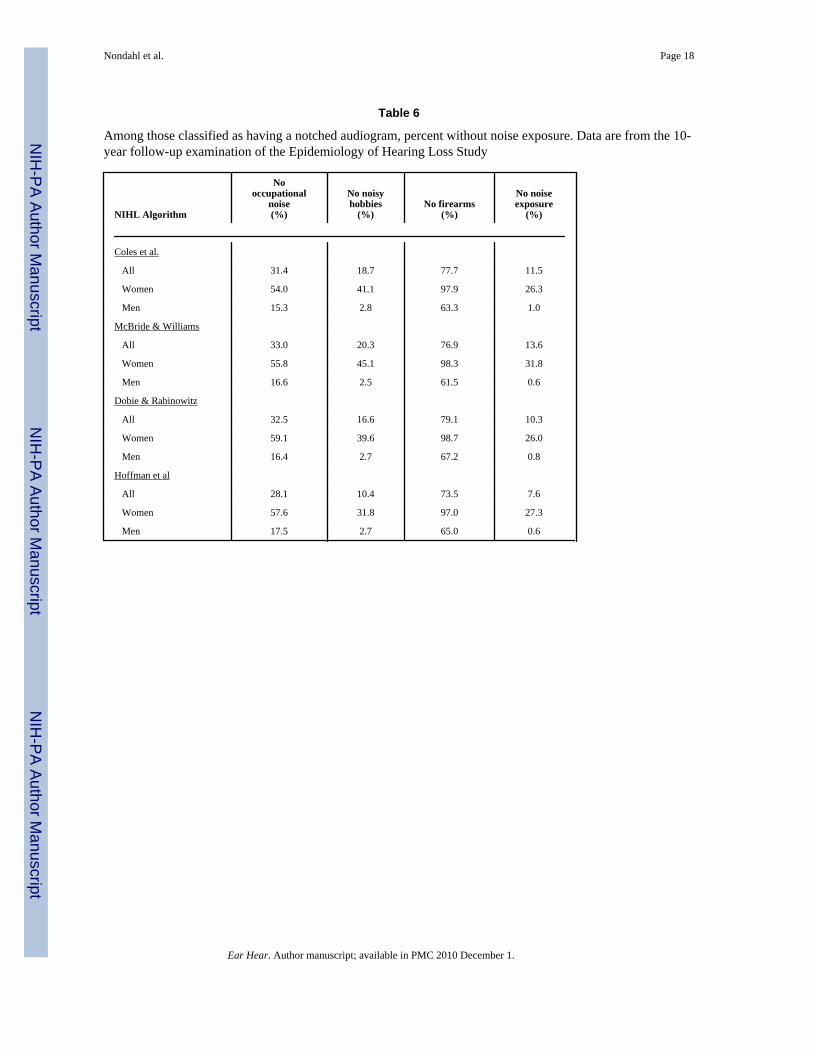
It was not uncommon for participants to be classified as having a notched audiogram by oneor more of the algorithms but not report certain noise exposures (Table 6). For example, 31.4%of those who were classified as having a notched audiogram based on the Coles algorithm didnot report occupational noise exposure, and 11.5% did not report any history of noise exposure.Similarly, 33.0%, 32.5%, and 28.1% of those classified as having a notched audiogram basedon the McBride, Dobie and Hoffman algorithms, respectively, did not report occupational noiseexposure, while 13.6%, 10.3%, and 7.6%, respectively, did not report any history of noiseexposure.
This pattern was more common for women than men (Table 6; p < 0.0001 for all sexcomparisons). Among men classified as having a notched audiogram, about 16% did not reportoccupational noise exposure (15.3%, 16.6%, 16.4%, and 17.5% for the Coles, McBride, Dobie,
Nondahl et al. Page 6
Ear Hear. Author manuscript; available in PMC 2010 December 1.
NIH
-PA Author Manuscript
NIH
-PA Author Manuscript
NIH
-PA Author Manuscript
and Hoffman algorithms, respectively), and less than 1% of men reported no noise exposurehistory (1.0%, 0.6%, 0.8% and 0.6% for the Coles, McBride, Dobie, and Hoffman algorithms,respectively). However, these percentages were much higher for women than for men. Morethan 50% of women classified as having a notched audiogram did not report a history ofoccupational noise exposure (54.0%, 55.8%, 59.1%, and 57.6% for the Coles, McBride, Dobie,and Hoffman algorithms, respectively), and more than 25% did not report any noise exposure(26.3%, 31.8%, 26.0%, and 27.3% for the Coles, McBride, Dobie, and Hoffman algorithmsrespectively). Using NI > 5 lowered the overall percentages not reporting each noise exposureby about 5% compared to using a cut point of > 0.
Because of concerns about the potential impact of over-reporting of noise exposure due to ourinclusive definitions, we repeated these analyses using more restrictive definitions foroccupational noise exposure (ever holding a fulltime job where one had to speak in a raisedvoice or louder to be heard by a person two feet away, but excluding military exposure andtractor driving) and noisy hobbies (requiring 40 or more cumulative years of participation inany of the noisy hobbies). Percent agreement improved slightly (range across algorithms of56.3–63.6% for occupational noise history and 63–64% for 40 or more years of noisy hobbies)with a corresponding increase in the percent of participants with notched audiograms who didnot report noise exposure (from 11.5% to 30.7% for the Coles, from 13.6% to 30.8% for theMcBride, from 10.3% to 30.7% for the Dobie, and from 7.6% to 26.5% for the Hoffmanalgorithms).
DiscussionThis study compared four algorithms for identifying notched audiograms with each other andwith reported history of noise exposure. There was significant disagreement in the prevalenceof notched audiograms across the four algorithms. About half of participants (47.2%) wereclassified as having a notched audiogram by the Dobie algorithm, while the Coles, McBrideand Hoffman algorithms resulted in lower prevalences of 31.7%, 25.9% and 11.7%,respectively.
The appropriate cut-point for the NI remains controversial. Dobie and Rabinowitz (2002) founda criterion of −6 dB resulted in the best agreement with consensus cases judged by clinicalexperts. More recently, Rabinowitz, et al. (2006) reported results from a small study (n=58)where 2 dB appeared to be the best criterion for classifying a set of audiograms consistentlyscored as notched or not notched by a panel of experts. In personnel communication, Dr. Dobiesuggested that NI > 5 might improve accuracy. Using a NI cut point of > 5 instead of > 0lowered the prevalence estimate from the Dobie algorithm to a level similar to that of Colesbut did not resolve the lack of agreement across algorithms. Among those classified as havinga notch by any of the algorithms (using NI > 0), only 10.5% were consistently classified ashaving notches. Using NI > 5, this proportion was similar (11.1%). ROC curves suggested thatthe optimal cut-points for the NI to maximize sensitivity and specificity ranged from −2 to 2depending on the noise source, consistent with published reports (Dobie and Rabinowitz2002; Rabinowitz et al., 2006). Regardless of the cut-point used for the NI there was substantialdisagreement in the classification of notches across algorithms.
Our results suggest the need for a standardized notch definition. This would facilitatecomparisons of research results across studies and be useful clinically when serial audiogramsare not available to detect threshold shifts after noise exposure. Observational and experimentaltranslational studies of NIHL would be greatly facilitated by a consensus, objective definition.A factor analysis of tetrachoric correlations suggested that both the Coles and the Hoffmanalgorithms may capture the concept of “notchiness” a little better than the other two algorithms.
Nondahl et al. Page 7
Ear Hear. Author manuscript; available in PMC 2010 December 1.
NIH
-PA Author Manuscript
NIH
-PA Author Manuscript
NIH
-PA Author Manuscript
Self-reported noise exposure was often associated with increased odds of having a notchedaudiogram, although some relations were not statistically significant. History of occupationalnoise and history of firearm usage were both significantly associated with increased odds ofhaving a notched audiogram as defined by the Coles algorithm, suggesting that this algorithmmay be slightly preferred for identifying notched audiograms resulting from these two majornoise exposures.
In this paper, participants were classified as having a notched audiogram if either ear met thenotch criteria when using the Coles, McBride and Dobie algorithms. This was done to facilitatea person-level comparison between being classified with “any” notch and their report of noiseexposure. Yet asymmetry in notch status between ears was fairly high and may have inflatedthe prevalence estimates. Using a two-ear approach lowered the prevalence of notchedaudiograms by these three methods closer to the 11.7% identified by the Hoffman algorithm.However, the Hoffman approach is likely to underestimate the prevalence of NIHL because itis well known that one ear may have greater noise exposure, and therefore greater damage,than the other due to the location of the noise source.
Notched audiograms were sometimes identified with no accompanying report of significantnoise exposure. While this was relatively infrequent among men (where few men did not reportnoise exposure), it was much more common among women, with more than 25% of womenwith notched audiograms not reporting any of the noise exposures, and more than 50% notreporting occupational noise exposure. Many studies of NIHL have focused on men (Brühl,Ivarsson, Toremalm, 1994; Prince, 2002; Hong, 2005; Rabinowitz et al, 2006) or were drawnfrom groups who were known to have significant noise exposure (Cooper & Owen, 1976;Brühl, Ivarsson, Toremalm, 1994; Rabinowitz et al, 2006), so findings about notchedalgorithms from those studies might not be applicable to a general population. The appearanceof notches in the absence of reported noise exposure may reflect under-reporting of noiseexposure in this study by women, suggest that exposure to noise below traditionally acceptedstandards for hazardous noise or from other unexplored noise sources may also cause notchedaudiograms, or suggest that non-noise exposures or other factors may contribute to notchedaudiograms.
In the current study, history of noise exposure was based on self-report, so it might be possiblethat participants in general underreported their noise exposure. The Epidemiology of HearingLoss Study questionnaire included an extensive occupational noise history, probing for noiseexposure in the current job, longest-held job, and any other jobs where the participant had tospeak in raised voice or louder to be heard within two feet. To avoid misclassifying exposuredue to farming, as some farmers may report only their non-farm jobs in the occupation history,separate farming questions were asked to detect noise exposure from tractors. Participants wereasked if they had every served in the military and about exposure to specific potentially noisyactivities and duties during their service. In addition to any gun use while hunting, the firearmsquestions ascertained target shooting at least once a month for one year. Neither occupationalnor firearms exposure classifications considered the use of hearing protective devices whichmay have attenuated any noise exposure. The hobby questions included woodworking,metalworking, use of chain saws, yard work with power tools and driving motorcycles andother noisy recreational vehicles. These hobbies have been shown in previous work to beassociated with high-frequency hearing loss (Dalton et al, 2001). Again, attenuating effectsfrom the use of hearing protection were not considered. While it is possible that infrequenthobby exposure (less than once a month for one year) may cause hearing damage, there is littleevidence to support this idea. Tambs et al (2006) suggest that people who know they have ahearing loss may more often remember, or even falsely recall, exposure to noise than peoplewith better hearing. Thus, it is likely that noise exposure variables in this study were biased
Nondahl et al. Page 8
Ear Hear. Author manuscript; available in PMC 2010 December 1.
NIH
-PA Author Manuscript
NIH
-PA Author Manuscript
NIH
-PA Author Manuscript
toward classifying people with infrequent, little, or no noise exposure as noise exposed ratherthan misclassifying noise exposed participants as unexposed.
To address this concern, we repeated analyses using stricter definitions for noise exposure atwork and from hobbies. Percent agreements between these noise exposure indicators andnotched audiograms improved slightly, as would be expected from reducing the number ofpeople with no notches who were considered noise exposed compared to when the moreinclusive definition was employed. However, there was a substantial increase in the percent ofparticipants with notched audiograms who were now classified as having no history of noiseexposure. Thus, the choice of an inclusive definition of potential exposure to noise had theintended effect of maximizing the number of people with notched audiograms who had positivenoise histories. These results suggest that the choice of definition of noise exposure cannotcompletely explain the low agreement with notch definitions.
The high proportion of women reporting no noise exposure (original definition) may suggestthat these questions incompletely capture important sources of leisure noise exposure in womenbut additional questions about more female-oriented exposures such as hair dryers, vacuums,and kitchen appliances did not demonstrate any association with high frequency hearing loss.(Dalton et al. 2001). These exposures are usually lower intensity and/or short duration andtherefore theoretically less likely to be associated with cochlear damage. Alternatively, onemight hypothesize that female ears are more sensitive to noise than male ears, but there is noevidence to support this notion. It appears the most likely explanation for the discordancebetween noise history and the presence of notched audiograms in women is that notchedaudiograms are an imperfect marker of NIHL.
It is possible that notches may occur because of other factors. Animal studies have suggestedthat there may be exogenous factors such as drugs, chemical agents, and smoking that maycombine in an additive or synergistic manner with noise to influence one’s susceptibility toNIHL, although there is not sufficient evidence to confirm this finding in humans (Committeeon Noise-Induced Hearing Loss, 2006). The basal section of the cochlea most commonlyassociated with hearing loss in the 3–6 kHz range (Johnsson & Hawkins Jr, 1976) may also bemore susceptible to environmental insults other than noise.
While the reliance on self-reported measures of noise exposure is a limitation of the study, thepopulation-based design is a major strength. Participants were often unaware of their hearingimpairment and results would not affect their employment or benefit status, minimizing thepotential to over-report noise exposure. Hearing was measured with standardized techniquesand algorithms were applied without knowledge of the reported noise history.
ConclusionThis study demonstrated significant disagreement among four algorithms for identifyingnotched audiograms. While the challenges of notch classification have been recognized, thisstudy demonstrates that available algorithms may not perform as expected when applied inpopulation-based studies. These results highlight the pressing need for a standardized notchdefinition to ensure study results are comparable and to enable studying preventive measures.
In addition, the presence of notched audiograms in the absence of positive noise exposurehistories supports the idea that audiometric shape is not a clear indication of the underlyingpathology or etiologic pathway. While this is generally accepted (NIH, 1990; McBride &Williams, 2001; ACOEM, 2003; Dobie, 2005), our findings suggest that non-noise factors maycontribute to a notch in an audiogram.
Nondahl et al. Page 9
Ear Hear. Author manuscript; available in PMC 2010 December 1.
NIH
-PA Author Manuscript
NIH
-PA Author Manuscript
NIH
-PA Author Manuscript
AcknowledgmentsThis research was supported by National Institutes of Health grant AG1099 (KJC)
ReferencesAmerican College of Occupational and Environmental Medicine (ACOEM). Noise-induced hearing loss.
J Occup Environ Med 2003;45(6):579–581. [PubMed: 12802210]American National Standards Institute. Specifications for Audiometers. New York, NY: ANSI; 1996.
(ANSI S3.6–1996)American National Standards Institute. Maximum Permissible Ambient Noise Levels for Audiometric
Test Rooms. New York, NY: ANSI; 1999. (ANSI S3.1–1999)American National Standards Institute. Specifications for Audiometers. New York, NY: ANSI; 2004.
(ANSI S3.6–2004)American Speech-Language-Hearing Association. Guidelines for manual pure-tone audiometry. ASHA
1978;20:297. [PubMed: 656172]Brühl P, Ivarsson A, Toremalm NG. Noise-induced hearing loss in an automobile sheet-metal pressing
plant: a retrospective investigation covering 25 years. Scand Audiol 1994;23:83–91. [PubMed:8085116]
Humes, LE.; Joellenbeck, LM.; Durch, JS., editors. Committee on Noise-Induced Hearing Loss andTinnitus Associated with Military Service from World War II to the Present. Noise and MilitaryService: Implications for Hearing Loss and Tinnitus (pp. 33–71). Institute of Medicine of the NationalAcademies. Washington, DC: The National Academies Press; 2006. Chapter 2: Noise-Induced HearingLoss.
Coles RR, Lutman ME, Buffin JT. Guidelines on the diagnosis of noise-induced hearing loss formedicolegal purposes. Clin Otolaryngol 2000;25(4):264–273. [PubMed: 10971532]
Cooper JC, Owen JH. Audiologic profile of noise-induced hearing loss. Arch Otolaryngol 1976;102:148–150. [PubMed: 1267690]
Cruickshanks KJ, Wiley TL, Tweed TS, Klein BEK, Klein R, Mares-Perlman JA, Nondahl DM.Prevalence of hearing loss in older adults in Beaver Dam, WI: the Epidemiology of Hearing LossStudy. Am J Epidemiol 1998;148:879–886. [PubMed: 9801018]
Dalton DS, Cruickshanks KJ, Wiley TL, Klein BEK, Klein R, Tweed TS. Association of leisure-timenoise exposure and hearing loss. Audiology 2001;40:1–9. [PubMed: 11296936]
Dalton DS, Cruickshanks KJ, Klein BEK, Klein R, Wiley TL, Nondahl DM. The impact of hearing losson quality of life in older adults. Gerontologist 2003;43(5):661–668. [PubMed: 14570962]
Dobie RA, Rabinowitz PM. Change in audiometric configuration helps to determine whether a standardthreshold shift is work-related. Spectrum 2002;19:17.
Dobie RA. Estimating noise-induced permanent threshold shift from audiometric shape: The ISO-1999model. Ear Hear 2005;26:630–635. [PubMed: 16377998]
Gallo R, Glorig A. Permanent threshold shift changes produced by noise exposure and aging. IndustHygiene J. 1964 May–June;
Hoffman HJ, Ko C-W, Themann CL, Dillon CF, Franks JR. Reducing noise-induced hearing loss (NIHL)to achieve U.S. Healthy People 2010 goals. Am J Epidemiol 2006;163:S122.
Hong O. Hearing loss among operating engineers in American construction industry. Int Arch OccupEnviron Health 2005;78(7):565–574. [PubMed: 16021464]
Johnsson L-G, Hawkins JE. Degeneration patterns in human ears exposed to noise. Ann Otol1976;85:725–739.
Klein R, Klein BEK, Linton KLP, De Mets DL. The Beaver Dam Eye Study: visual acuity.Ophthalmology 1991;98:1310–1315. [PubMed: 1923372]
Kramer MB, Wood D. Noise-induced hearing loss in rural schoolchildren. Scand Audiol 1982;11:279–280. [PubMed: 7163773]
McBride DI, Williams S. Characteristics of the audiometric notch as a clinical sign of noise exposure.Scand Audiol 2001;30(2):106–111. [PubMed: 11409787]
Nondahl et al. Page 10
Ear Hear. Author manuscript; available in PMC 2010 December 1.
NIH
-PA Author Manuscript
NIH
-PA Author Manuscript
NIH
-PA Author Manuscript
McCombe AW, Binnington J. Hearing loss in Grand Prix motorcyclists: occupational hazard or sportsinjury? Br J Sports Med 1994;28(1):35–37. [PubMed: 8044491]
McCombe AW, Binnington J, Davis A, Spencer H. Hearing loss and motorcyclists. J Laryngol Otol1995;109:599–604. [PubMed: 7561464]
National Institutes of Health Consensus Development Conference. Noise and hearing loss: NIHConsensus Development Conference Statement; NIH Consensus Statement; 1990 Jan 22–24. p. 1-24.
Niskar AS, Kieszak SM, Holmes AE, Esteban E, Rubin C, Brody DJ. Estimated prevalence of noise-induced hearing threshold shifts among children 6 to 19 years of age: the Third National Health andNutrition Examination Survey, 1988–1994, United States. Pediatrics 2001;108:40–43. [PubMed:11433052]
Nondahl DM, Cruickshanks KJ, Wiley TL, Klein R, Klein BEK, Tweed TS. Recreational firearm useand hearing loss. Arch Fam Med 2000;9:352–357. [PubMed: 10776364]
Popelka MM, Cruickshanks KJ, Wiley TL, Tweed TS, Klein BEK, Klein R, Nondahl DM. Moderatealcohol consumption and hearing loss: A protective effect. J Am Geriatr Soc 2000;48:1273–1278.[PubMed: 11037015]
Prince MM. Distribution of risk factors for hearing loss: Implications for evaluating risk of occupationalnoise-induced hearing loss. J Acoust Soc Am 2002;112(2):557–567. [PubMed: 12186037]
Prosser S, Tartari MC, Arslan E. Hearing loss in sports hunters exposed to occupational noise. Br J Audiol1988;22:85–91. [PubMed: 3390636]
Rabinowitz PM. Noise-induced hearing loss. Am Fam Physician 2000;61(9):2749–2756. 2759–2760.[PubMed: 10821155]
Rabinowitz PM, Galusha D, Slade MD, Dixon-Ernst C, Sircar KD, Dobie RA. Audiogram notches innoise-exposed workers. Ear Hear 2006;27:742–750. [PubMed: 17086083]
Tambs K, Hoffman HJ, Borchgrevink HM, Holmen J, Engdahl B. Hearing loss induced by occupationaland impulse noise: Results on the threshold shifts by frequencies, age and gender from the Nord-Trøndelag Hearing Loss Study. Int J Audiol 2006;45:309–317. [PubMed: 16717022]
Taylor GD, Williams E. Acoustic trauma in the sports hunter. Laryngoscope 1966;76:863–879. [PubMed:5937909]
West PD, Evans EF. Early detection of hearing damage in young listeners resulting from exposure toamplified music. Br J Audiol 1990;24:89–103. [PubMed: 2350625]
Nondahl et al. Page 11
Ear Hear. Author manuscript; available in PMC 2010 December 1.
NIH
-PA Author Manuscript
NIH
-PA Author Manuscript
NIH
-PA Author Manuscript
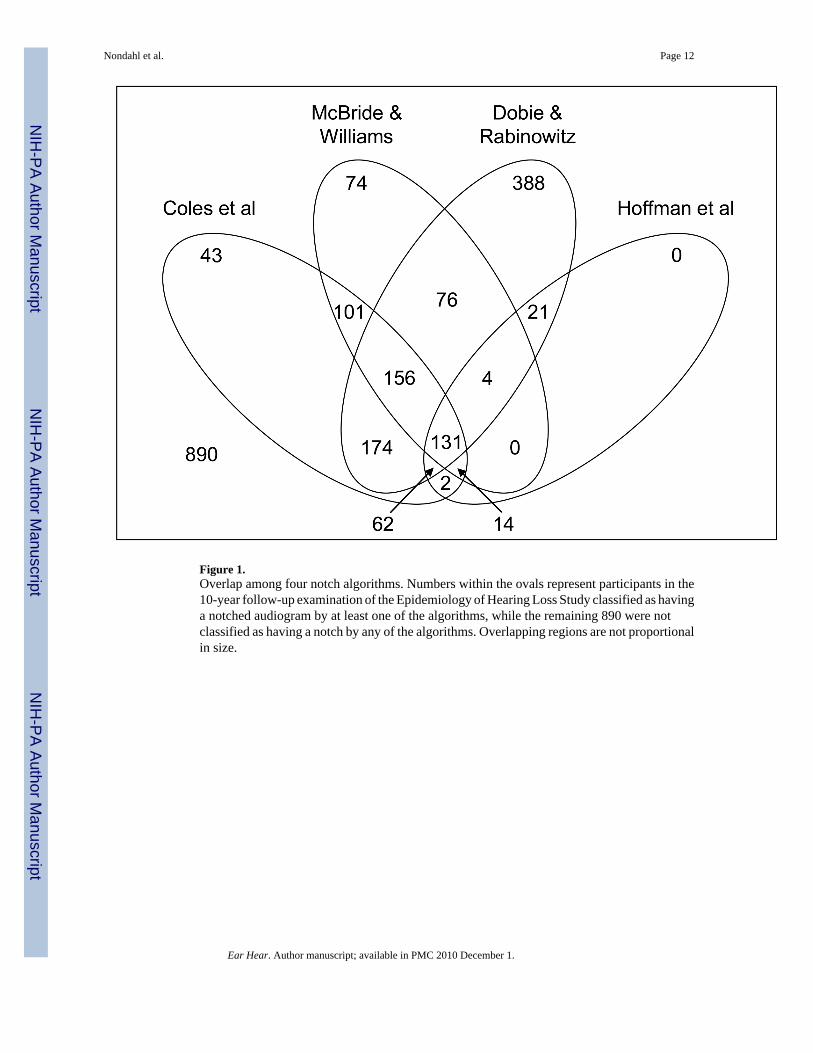
Figure 1.Overlap among four notch algorithms. Numbers within the ovals represent participants in the10-year follow-up examination of the Epidemiology of Hearing Loss Study classified as havinga notched audiogram by at least one of the algorithms, while the remaining 890 were notclassified as having a notch by any of the algorithms. Overlapping regions are not proportionalin size.
Nondahl et al. Page 12
Ear Hear. Author manuscript; available in PMC 2010 December 1.
NIH
-PA Author Manuscript
NIH
-PA Author Manuscript
NIH
-PA Author Manuscript
NIH
-PA Author Manuscript
NIH
-PA Author Manuscript
NIH
-PA Author Manuscript
Nondahl et al. Page 13
Tabl
e 1
Prev
alen
ce o
f not
ched
aud
iogr
ams a
mon
g pa
rtici
pant
s in
the
10-y
ear f
ollo
w-u
p ex
amin
atio
n of
the
Epid
emio
logy
of H
earin
g Lo
ss S
tudy
.
Gro
up
Col
es e
t al
(n=2
159)
McB
ride
&W
illia
ms
(n=2
159)
Dob
ie &
Rab
inow
itz(n
=215
9)H
offm
an e
t al
(n=2
136)
n%
n%
n%
n%
All
685
31.7
558
25.9
1019
47.2
249
11.7
Gen
der
Fe
mal
e28
522
.823
318
.638
430
.766
5.3
M
ale
400
44.2
325
35.9
635
70.1
183
20.4
Age
Gro
up
58
–69
yrs
380
38.0
312
31.2
456
45.7
139
14.0
70
–79
yrs
212
30.6
167
24.1
351
50.7
8011
.7
80
–100
yrs
9319
.979
16.9
212
45.4
306.
5
Ear Hear. Author manuscript; available in PMC 2010 December 1.
NIH
-PA Author Manuscript
NIH
-PA Author Manuscript
NIH
-PA Author Manuscript
Nondahl et al. Page 14
Tabl
e 2
Res
ults
from
prin
cipa
l com
pone
nts f
acto
r ana
lyse
s of t
etra
chor
ic c
orre
latio
n m
atric
es
Alg
orith
m
Tet
rach
oric
Cor
rela
tions
Fact
or A
naly
sis
Col
esM
cBri
deD
obie
Hof
fman
Fact
orL
oadi
ngs
Var
ianc
eE
xpla
ined
Col
es1.
0000
0.92
905
0.72
32
McB
ride
0.74
411.
0000
0.77
866
Dob
ie0.
6137
0.36
731.
0000
0.78
519
Hof
fman
0.77
630.
5502
0.70
151.
0000
0.89
831
Ear Hear. Author manuscript; available in PMC 2010 December 1.
NIH
-PA Author Manuscript
NIH
-PA Author Manuscript
NIH
-PA Author Manuscript
Nondahl et al. Page 15
Tabl
e 3
Noi
se e
xpos
ure
amon
g pa
rtici
pant
s in
the
10-y
ear f
ollo
w-u
p ex
amin
atio
n of
the
Epid
emio
logy
of H
earin
g Lo
ss S
tudy
.
Typ
e of
Noi
se E
xpos
ure
Prev
alen
ce o
f Exp
osur
e (n
, %)
All
Wom
enM
en
n%
n%
n%
Occ
upat
iona
l noi
se13
4656
.255
639
.379
080
.5
Noi
sy h
obbi
es17
1671
.775
853
.695
897
.7
Fire
arm
s32
213
.418
1.3
304
31.0
Any
of a
bove
1944
81.2
971
68.7
973
99.2
Ear Hear. Author manuscript; available in PMC 2010 December 1.
NIH
-PA Author Manuscript
NIH
-PA Author Manuscript
NIH
-PA Author Manuscript
Nondahl et al. Page 16
Table 4
Results of logistic regression models assessing odds of having a notched audiogram as classified by severalalgorithms among participants in the 10-year follow-up examination of the Epidemiology of Hearing Loss Study.(Odds ratios and 95% confidence intervals.) Results from statistically significant noise exposures are boxed.
Models
Coles et al(n=2159)
McBride &Williams(n=2159)
Dobie &Rabinowitz
(n=2159)Hoffman et al
(n=2136)
OR (95%CI) OR (95%CI) OR (95%CI) OR (95%CI)
Individual age- andsex-adjusted models
Occupational noise 1.36 (1.10, 1.68) 1.18 (0.95, 1.48) 1.20 (0.98, 1.47) 1.08 (0.78, 1.49)
Noisy hobbies 1.06 (0.82, 1.38) 0.90 (0.68, 1.19) 1.32 (1.04, 1.67) 1.43 (0.88, 2.32)
Firearms 1.39 (1.06, 1.84) 1.47 (1.10, 1.94) 1.23 (0.91, 1.66) 1.13 (0.80, 1.59)
Multivariate models
All
Age (unit = 5 yrs) 0.82 (0.78, 0.87) 0.84 (0.79, 0.89) 1.06 (1.01, 1.12) 0.85 (0.78, 0.93)
Male sex 2.09 (1.64, 2.66) 2.08 (1.61, 2.69) 4.36 (3.45, 5.50) 3.64 (2.52, 5.28)
Occupational noise 1.34 (1.08, 1.66) 1.18 (0.94, 1.48) 1.17 (0.95, 1.43) 1.05 (0.76, 1.45)
Noisy hobbies 1.02 (0.78, 1.32) 0.87 (0.66, 1.15) 1.29 (1.02, 1.64) 1.42 (0.87, 2.30)
Firearms 1.36 (1.03, 1.80) 1.46 (1.10, 1.93) 1.21 (0.89, 1.63) 1.12 (0.79, 1.58)
Women
Age (unit = 5 yrs) 0.80 (0.74, 0.87) 0.87 (0.80, 0.95) 1.11 (1.03, 1.18) 0.76 (0.65, 0.89)
Occupational noise 1.21 (0.92, 1.59) 1.15 (0.86, 1.53) 0.98 (0.77, 1.26) 0.90 (0.54, 1.51)
Noisy hobbies 1.09 (0.83, 1.43) 0.92 (0.69, 1.23) 1.44 (1.12, 1.84) 1.63 (0.95, 2.80)
Firearms 1.78 (0.62, 5.05) 1.38 (0.43, 4.36) 0.96 (0.33, 2.80) 2.13 (0.46, 9.85)
Men
Age (unit = 5 yrs) 0.84 (0.77, 0.91) 0.81 (0.74, 0.88) 0.99 (0.91, 1.08) 0.89 (0.80, 0.99)
Occupational noise 1.55 (1.09, 2.21) 1.25 (0.87, 1.80) 1.72 (1.22, 2.44) 1.13 (0.74, 1.74)
Noisy hobbies 0.46 (0.18, 1.15) 0.59 (0.23, 1.51) 0.35 (0.10, 1.21) 0.65 (0.23, 1.84)
Firearms 1.37 (1.03, 1.83) 1.44 (1.07, 1.94) 1.18 (0.86, 1.63) 1.14 (0.80, 1.61)
Ear Hear. Author manuscript; available in PMC 2010 December 1.
NIH
-PA Author Manuscript
NIH
-PA Author Manuscript
NIH
-PA Author Manuscript
Nondahl et al. Page 17
Tabl
e 5
Perc
ent a
gree
men
t bet
wee
n no
tch
clas
sific
atio
n an
d no
ise e
xpos
ure a
mon
g pa
rtici
pant
s in
the 1
0-ye
ar fo
llow
-up
exam
inat
ion
of th
e Epi
dem
iolo
gy o
f Hea
ring
Loss
Stu
dy. G
roup
s in
bold
face
dem
onst
rate
d a
stat
istic
ally
sign
ifica
nt d
iffer
ence
by
sex
(Chi
-Squ
are
test
for a
ssoc
iatio
n, p
< 0
.05)
.
Exp
osur
e
Col
es e
t al
(n=2
159)
McB
ride
&W
illia
ms
(n=2
159)
Dob
ie &
Rab
inow
itz(n
=215
9)H
offm
an e
t al
(n=2
136)
n%
n%
n%
n%
Occ
upat
iona
l noi
se
A
ll11
6754
.111
0251
.012
6958
.810
1047
.3
W
omen
717
57.2
713
56.9
670
53.5
720
58.1
M
en45
049
.738
942
.959
966
.129
032
.3
Noi
sy h
obbi
es
A
ll10
1246
.991
542
.412
6458
.577
336
.2
W
omen
614
49.0
586
46.8
643
51.3
580
46.8
M
en39
843
.932
936
.362
168
.519
321
.5
Fire
arm
s
A
ll14
7868
.515
5772
.112
6458
.517
2080
.5
W
omen
964
76.9
1012
80.8
863
68.9
1161
93.7
M
en51
456
.354
560
.240
144
.355
962
.3
Ear Hear. Author manuscript; available in PMC 2010 December 1.
NIH
-PA Author Manuscript
NIH
-PA Author Manuscript
NIH
-PA Author Manuscript
Nondahl et al. Page 18
Table 6
Among those classified as having a notched audiogram, percent without noise exposure. Data are from the 10-year follow-up examination of the Epidemiology of Hearing Loss Study
NIHL Algorithm
Nooccupational
noise(%)
No noisyhobbies
(%)No firearms
(%)
No noiseexposure
(%)
Coles et al.
All 31.4 18.7 77.7 11.5
Women 54.0 41.1 97.9 26.3
Men 15.3 2.8 63.3 1.0
McBride & Williams
All 33.0 20.3 76.9 13.6
Women 55.8 45.1 98.3 31.8
Men 16.6 2.5 61.5 0.6
Dobie & Rabinowitz
All 32.5 16.6 79.1 10.3
Women 59.1 39.6 98.7 26.0
Men 16.4 2.7 67.2 0.8
Hoffman et al
All 28.1 10.4 73.5 7.6
Women 57.6 31.8 97.0 27.3
Men 17.5 2.7 65.0 0.6
Ear Hear. Author manuscript; available in PMC 2010 December 1.
Related Documents