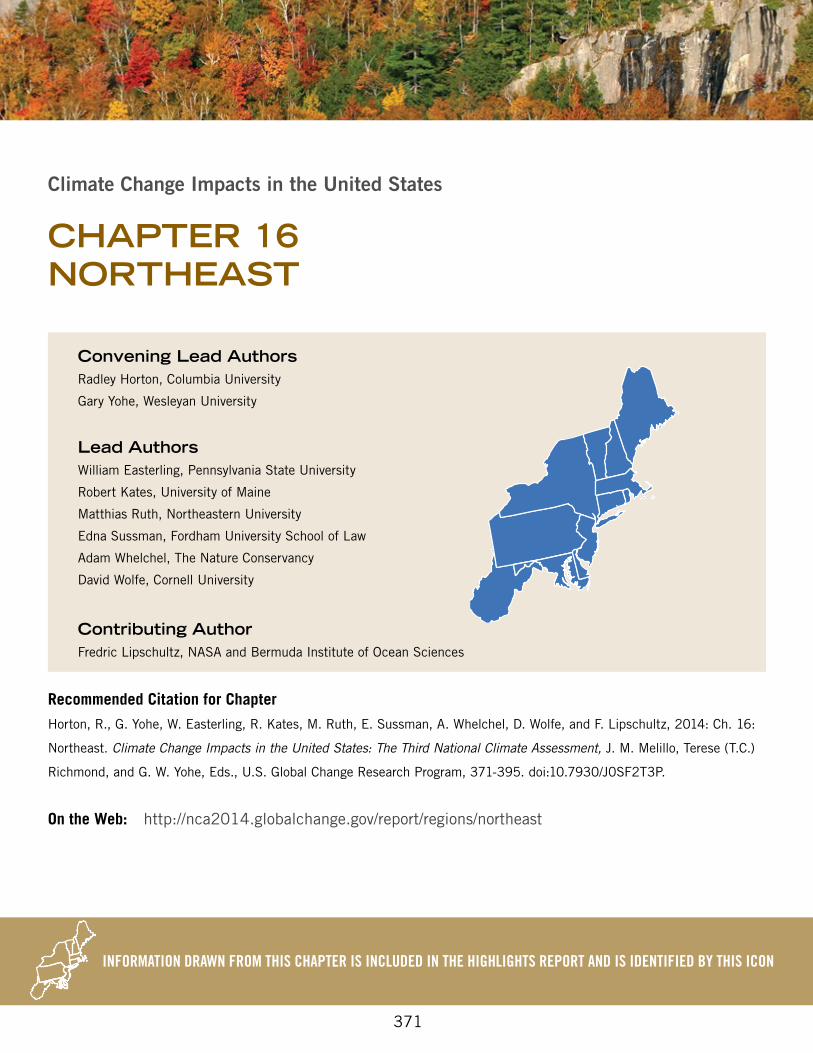
Climate Change Impacts in the United States CHAPTER 16 NORTHEAST INFORMATION DRAWN FROM THIS CHAPTER IS INCLUDED IN THE HIGHLIGHTS REPORT AND IS IDENTIFIED BY THIS ICON Recommended Citation for Chapter Horton, R., G. Yohe, W. Easterling, R. Kates, M. Ruth, E. Sussman, A. Whelchel, D. Wolfe, and F. Lipschultz, 2014: Ch. 16: Northeast. Climate Change Impacts in the United States: The Third National Climate Assessment, J. M. Melillo, Terese (T.C.) Richmond, and G. W. Yohe, Eds., U.S. Global Change Research Program, 371-395. doi:10.7930/J0SF2T3P. On the Web: http://nca2014.globalchange.gov/report/regions/northeast Convening Lead Authors Radley Horton, Columbia University Gary Yohe, Wesleyan University Lead Authors William Easterling, Pennsylvania State University Robert Kates, University of Maine Matthias Ruth, Northeastern University Edna Sussman, Fordham University School of Law Adam Whelchel, The Nature Conservancy David Wolfe, Cornell University Contributing Author Fredric Lipschultz, NASA and Bermuda Institute of Ocean Sciences 371

Welcome message from author
This document is posted to help you gain knowledge. Please leave a comment to let me know what you think about it! Share it to your friends and learn new things together.
Transcript
Climate Change Impacts in the United States
CHAPTER 16NORTHEAST
INFORMATION DRAWN FROM THIS CHAPTER IS INCLUDED IN THE HIGHLIGHTS REPORT AND IS IDENTIFIED BY THIS ICON
Recommended Citation for Chapter
Horton, R., G. Yohe, W. Easterling, R. Kates, M. Ruth, E. Sussman, A. Whelchel, D. Wolfe, and F. Lipschultz, 2014: Ch. 16:
Northeast. Climate Change Impacts in the United States: The Third National Climate Assessment, J. M. Melillo, Terese (T.C.)
Richmond, and G. W. Yohe, Eds., U.S. Global Change Research Program, 371-395. doi:10.7930/J0SF2T3P.
On the Web: http://nca2014.globalchange.gov/report/regions/northeast
Convening Lead Authors
Radley Horton, Columbia University
Gary Yohe, Wesleyan University
Lead AuthorsWilliam Easterling, Pennsylvania State University
Robert Kates, University of Maine
Matthias Ruth, Northeastern University
Edna Sussman, Fordham University School of Law
Adam Whelchel, The Nature Conservancy
David Wolfe, Cornell University
Contributing AuthorFredric Lipschultz, NASA and Bermuda Institute of Ocean Sciences
371
372 CLIMATE CHANGE IMPACTS IN THE UNITED STATES
Key Messages
NORTHEAST161. Heat waves, coastal flooding, and river flooding will pose a growing challenge to the
region’s environmental, social, and economic systems. This will increase the vulnerability of the region’s residents, especially its most disadvantaged populations.
2. Infrastructure will be increasingly compromised by climate-related hazards, including sea level rise, coastal flooding, and intense precipitation events.
3. Agriculture, fisheries, and ecosystems will be increasingly compromised over the next century by climate change impacts. Farmers can explore new crop options, but these adaptations are not cost- or risk-free. Moreover, adaptive capacity, which varies throughout the region, could be overwhelmed by a changing climate.
4. While a majority of states and a rapidly growing number of municipalities have begun to incorporate the risk of climate change into their planning activities, implementation of adaptation measures is still at early stages.
Sixty-four million people are concentrated in the Northeast. The high-density urban coastal corridor from Washington, D.C., north to Boston is one of the most developed environments in the world. It contains a massive, complex, and long-standing network of supporting infrastructure. The region is home to one of the world’s leading financial centers, the nation’s capi-tal, and many defining cultural and historical landmarks.
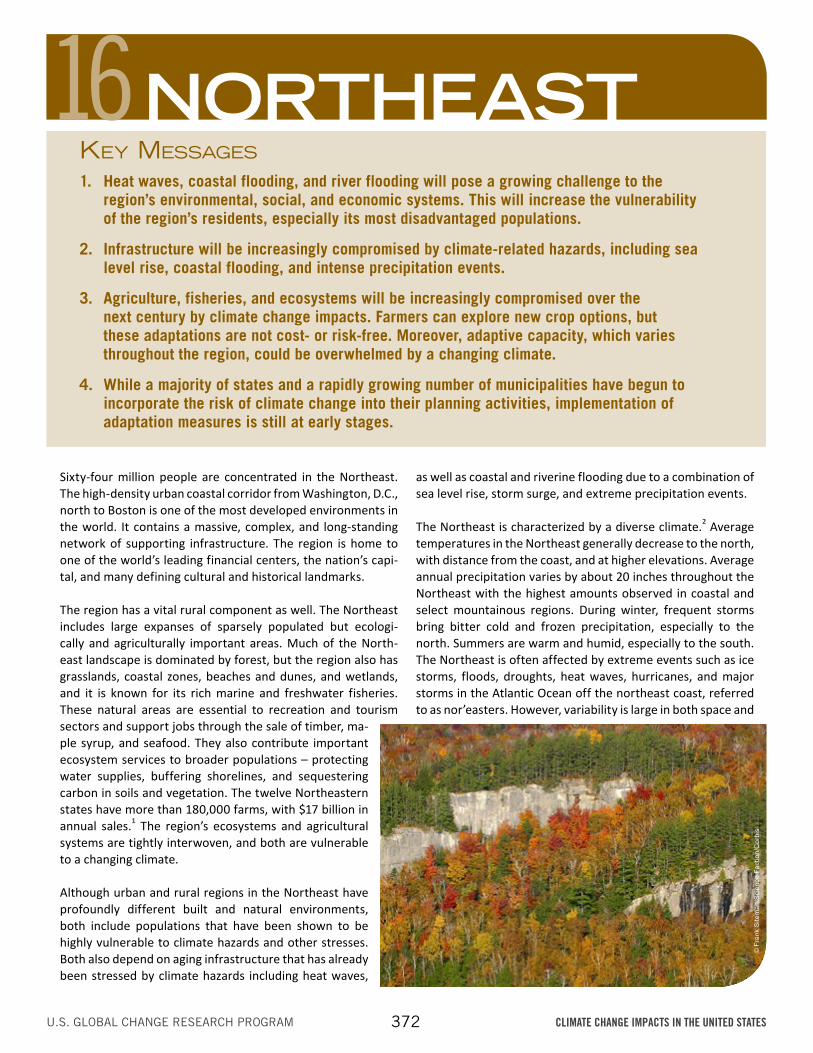
The region has a vital rural component as well. The Northeast includes large expanses of sparsely populated but ecologi-cally and agriculturally important areas. Much of the North-east landscape is dominated by forest, but the region also has grasslands, coastal zones, beaches and dunes, and wetlands, and it is known for its rich marine and freshwater fisheries. These natural areas are essential to recreation and tourism sectors and support jobs through the sale of timber, ma-ple syrup, and seafood. They also contribute important ecosystem services to broader populations – protecting water supplies, buffering shorelines, and sequestering carbon in soils and vegetation. The twelve Northeastern states have more than 180,000 farms, with $17 billion in annual sales.1 The region’s ecosystems and agricultural systems are tightly interwoven, and both are vulnerable to a changing climate.
Although urban and rural regions in the Northeast have profoundly different built and natural environments, both include populations that have been shown to be highly vulnerable to climate hazards and other stresses. Both also depend on aging infrastructure that has already been stressed by climate hazards including heat waves,
as well as coastal and riverine flooding due to a combination of sea level rise, storm surge, and extreme precipitation events.
The Northeast is characterized by a diverse climate.2 Average temperatures in the Northeast generally decrease to the north, with distance from the coast, and at higher elevations. Average annual precipitation varies by about 20 inches throughout the Northeast with the highest amounts observed in coastal and select mountainous regions. During winter, frequent storms bring bitter cold and frozen precipitation, especially to the north. Summers are warm and humid, especially to the south. The Northeast is often affected by extreme events such as ice storms, floods, droughts, heat waves, hurricanes, and major storms in the Atlantic Ocean off the northeast coast, referred to as nor’easters. However, variability is large in both space and
© F
rank
Site
man
/Sci
ence
Fac
tion/
Cor
bis
373 CLIMATE CHANGE IMPACTS IN THE UNITED STATES
16: NORTHEAST
time. For example, parts of southern New England that experienced heavy snows in the cold season of 2010-2011 experienced little snow during the cold season of 2011-2012. Of course, even a season with low totals can feature costly extreme events; snowfall during a 2011 pre-Halloween storm that hit most of the Northeast, when many trees were still in leaf, knocked out power for up to 10 days for thousands of households.
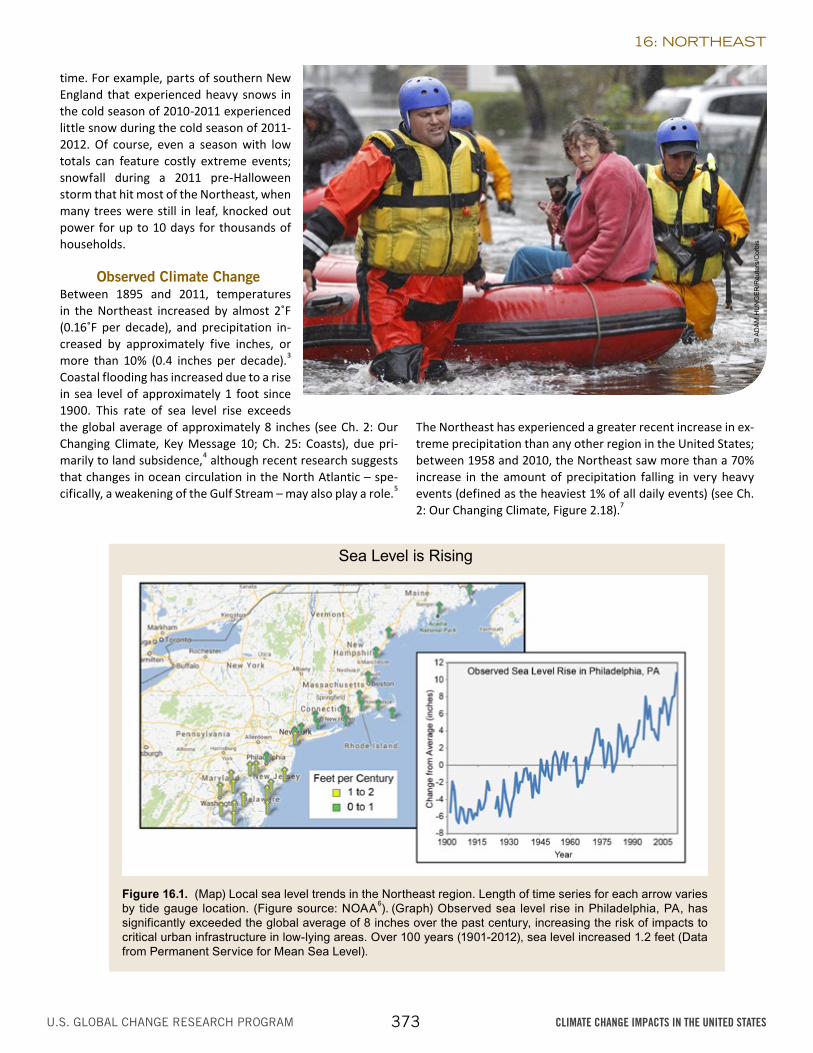
Observed Climate ChangeBetween 1895 and 2011, temperatures in the Northeast increased by almost 2˚F (0.16˚F per decade), and precipitation in-creased by approximately five inches, or more than 10% (0.4 inches per decade).3 Coastal flooding has increased due to a rise in sea level of approximately 1 foot since 1900. This rate of sea level rise exceeds the global average of approximately 8 inches (see Ch. 2: Our Changing Climate, Key Message 10; Ch. 25: Coasts), due pri-marily to land subsidence,4 although recent research suggests that changes in ocean circulation in the North Atlantic – spe-cifically, a weakening of the Gulf Stream – may also play a role.5
The Northeast has experienced a greater recent increase in ex-treme precipitation than any other region in the United States; between 1958 and 2010, the Northeast saw more than a 70% increase in the amount of precipitation falling in very heavy events (defined as the heaviest 1% of all daily events) (see Ch. 2: Our Changing Climate, Figure 2.18).7
© A
DA
M H
UN
GE
R/R
eute
rs/C
orbi
s
Sea Level is Rising
Figure 16.1. (Map) Local sea level trends in the Northeast region. Length of time series for each arrow varies by tide gauge location. (Figure source: NOAA6). (Graph) Observed sea level rise in Philadelphia, PA, has significantly exceeded the global average of 8 inches over the past century, increasing the risk of impacts to critical urban infrastructure in low-lying areas. Over 100 years (1901-2012), sea level increased 1.2 feet (Data from Permanent Service for Mean Sea Level).
374 CLIMATE CHANGE IMPACTS IN THE UNITED STATES
16: NORTHEAST
Projected Climate ChangeAs in other areas, the amount of warming in the Northeast will be highly dependent on global emissions of heat-trapping gases. If emissions continue to increase (as in the A2 scenario), warming of 4.5F° to 10°F is projected by the 2080s; if global emissions were reduced substantially (as in the B1 scenario), projected warming ranges from about 3°F to 6°F by the 2080s.3
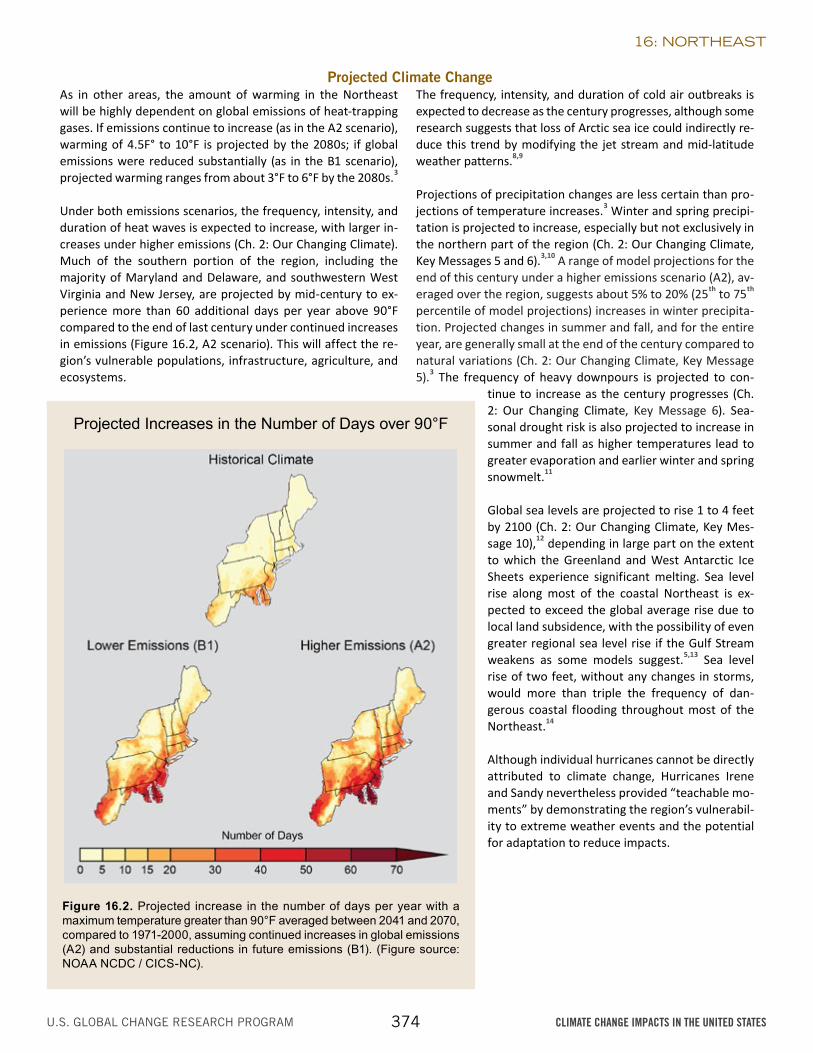
Under both emissions scenarios, the frequency, intensity, and duration of heat waves is expected to increase, with larger in-creases under higher emissions (Ch. 2: Our Changing Climate). Much of the southern portion of the region, including the majority of Maryland and Delaware, and southwestern West Virginia and New Jersey, are projected by mid-century to ex-perience more than 60 additional days per year above 90°F compared to the end of last century under continued increases in emissions (Figure 16.2, A2 scenario). This will affect the re-gion’s vulnerable populations, infrastructure, agriculture, and ecosystems.
The frequency, intensity, and duration of cold air outbreaks is expected to decrease as the century progresses, although some research suggests that loss of Arctic sea ice could indirectly re-duce this trend by modifying the jet stream and mid-latitude weather patterns.8,9
Projections of precipitation changes are less certain than pro-jections of temperature increases.3 Winter and spring precipi-tation is projected to increase, especially but not exclusively in the northern part of the region (Ch. 2: Our Changing Climate, Key Messages 5 and 6).3,10 A range of model projections for the end of this century under a higher emissions scenario (A2), av-eraged over the region, suggests about 5% to 20% (25th to 75th percentile of model projections) increases in winter precipita-tion. Projected changes in summer and fall, and for the entire year, are generally small at the end of the century compared to natural variations (Ch. 2: Our Changing Climate, Key Message 5).3 The frequency of heavy downpours is projected to con-
tinue to increase as the century progresses (Ch. 2: Our Changing Climate, Key Message 6). Sea-sonal drought risk is also projected to increase in summer and fall as higher temperatures lead to greater evaporation and earlier winter and spring snowmelt.11
Global sea levels are projected to rise 1 to 4 feet by 2100 (Ch. 2: Our Changing Climate, Key Mes-sage 10),12 depending in large part on the extent to which the Greenland and West Antarctic Ice Sheets experience significant melting. Sea level rise along most of the coastal Northeast is ex-pected to exceed the global average rise due to local land subsidence, with the possibility of even greater regional sea level rise if the Gulf Stream weakens as some models suggest.5,13 Sea level rise of two feet, without any changes in storms, would more than triple the frequency of dan-gerous coastal flooding throughout most of the Northeast.14
Although individual hurricanes cannot be directly attributed to climate change, Hurricanes Irene and Sandy nevertheless provided “teachable mo-ments” by demonstrating the region’s vulnerabil-ity to extreme weather events and the potential for adaptation to reduce impacts.
Projected Increases in the Number of Days over 90°F
Figure 16.2. Projected increase in the number of days per year with a maximum temperature greater than 90°F averaged between 2041 and 2070, compared to 1971-2000, assuming continued increases in global emissions (A2) and substantial reductions in future emissions (B1). (Figure source: NOAA NCDC / CICS-NC).
375 CLIMATE CHANGE IMPACTS IN THE UNITED STATES
16: NORTHEAST
Two recent events contrast existing vulnerability to extreme events: Hurricane Irene, which produced a broad swath of very heavy rain (greater than five inches in total and sometimes two to three inches per hour in some locations) from southern Maryland to northern Vermont from August 27 to 29, 2011; and Hurricane Sandy, which caused massive coastal damage from storm surge and flooding along the Northeast coast from October 28 to 30, 2012.
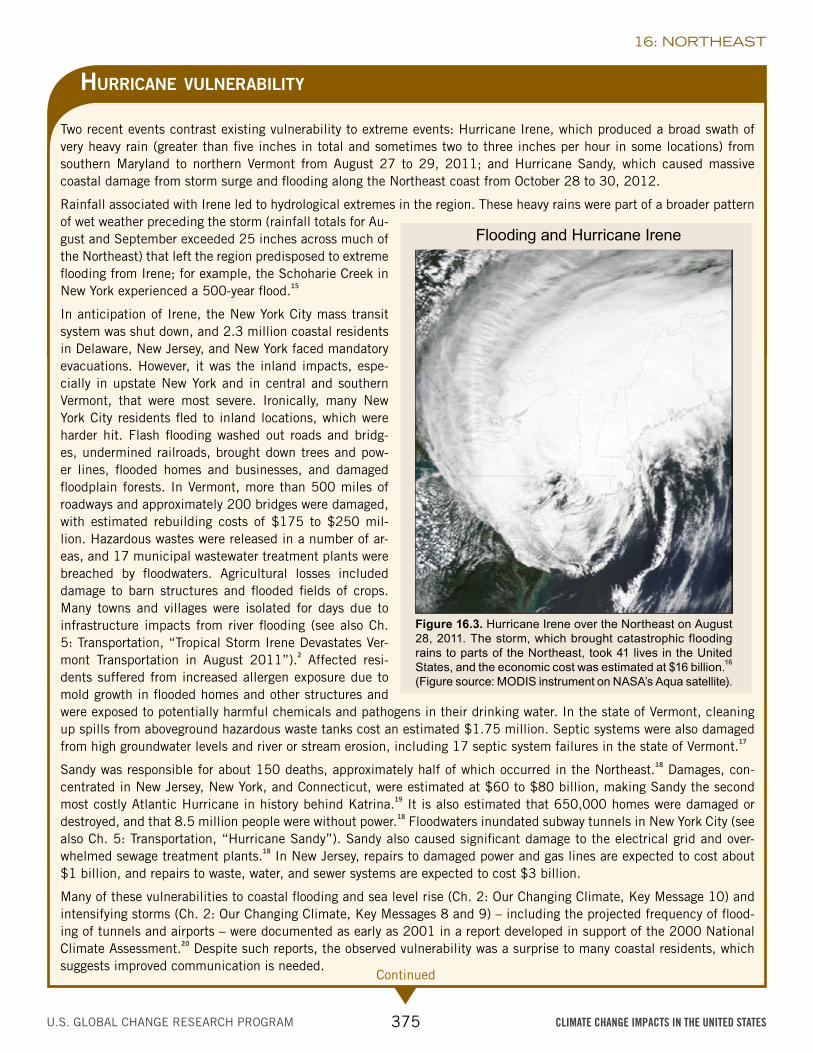
Rainfall associated with Irene led to hydrological extremes in the region. These heavy rains were part of a broader pattern of wet weather preceding the storm (rainfall totals for Au-gust and September exceeded 25 inches across much of the Northeast) that left the region predisposed to extreme flooding from Irene; for example, the Schoharie Creek in New York experienced a 500-year flood.15
In anticipation of Irene, the New York City mass transit system was shut down, and 2.3 million coastal residents in Delaware, New Jersey, and New York faced mandatory evacuations. However, it was the inland impacts, espe-cially in upstate New York and in central and southern Vermont, that were most severe. Ironically, many New York City residents fled to inland locations, which were harder hit. Flash flooding washed out roads and bridg-es, undermined railroads, brought down trees and pow-er lines, flooded homes and businesses, and damaged floodplain forests. In Vermont, more than 500 miles of roadways and approximately 200 bridges were damaged, with estimated rebuilding costs of $175 to $250 mil-lion. Hazardous wastes were released in a number of ar-eas, and 17 municipal wastewater treatment plants were breached by floodwaters. Agricultural losses included damage to barn structures and flooded fields of crops. Many towns and villages were isolated for days due to infrastructure impacts from river flooding (see also Ch. 5: Transportation, “Tropical Storm Irene Devastates Ver-mont Transportation in August 2011”).2 Affected resi-dents suffered from increased allergen exposure due to mold growth in flooded homes and other structures and were exposed to potentially harmful chemicals and pathogens in their drinking water. In the state of Vermont, cleaning up spills from aboveground hazardous waste tanks cost an estimated $1.75 million. Septic systems were also damaged from high groundwater levels and river or stream erosion, including 17 septic system failures in the state of Vermont.17
Sandy was responsible for about 150 deaths, approximately half of which occurred in the Northeast.18 Damages, con-centrated in New Jersey, New York, and Connecticut, were estimated at $60 to $80 billion, making Sandy the second most costly Atlantic Hurricane in history behind Katrina.19 It is also estimated that 650,000 homes were damaged or destroyed, and that 8.5 million people were without power.18 Floodwaters inundated subway tunnels in New York City (see also Ch. 5: Transportation, “Hurricane Sandy”). Sandy also caused significant damage to the electrical grid and over-whelmed sewage treatment plants.18 In New Jersey, repairs to damaged power and gas lines are expected to cost about $1 billion, and repairs to waste, water, and sewer systems are expected to cost $3 billion.
Many of these vulnerabilities to coastal flooding and sea level rise (Ch. 2: Our Changing Climate, Key Message 10) and intensifying storms (Ch. 2: Our Changing Climate, Key Messages 8 and 9) – including the projected frequency of flood-ing of tunnels and airports – were documented as early as 2001 in a report developed in support of the 2000 National Climate Assessment.20 Despite such reports, the observed vulnerability was a surprise to many coastal residents, which suggests improved communication is needed.
Flooding and Hurricane Irene
Figure 16.3. Hurricane Irene over the Northeast on August 28, 2011. The storm, which brought catastrophic flooding rains to parts of the Northeast, took 41 lives in the United States, and the economic cost was estimated at $16 billion.16 (Figure source: MODIS instrument on NASA’s Aqua satellite).
Hurricane vulnerability
Continued
376 CLIMATE CHANGE IMPACTS IN THE UNITED STATES
16: NORTHEAST
Over the last decade, cities, states, and agencies in the New York metropolitan region took steps to reduce their vulnerability to coastal storms.21 In 2008, New York City convened a scientific body of experts – the New York City Panel on Climate Change (NPCC) – and formed a Climate Adaptation Task Force comprised of approximately 40 agencies, private sector compa-nies, and regional groups. A process, approach, and tools for climate change adaptation were developed and documented in New York City11,22 and New York State.23 In 2012, the NPCC and Climate Adaptation Task Force were codified into New York City law, a key step towards institutionalizing climate science, impact, and adaptation assessment into long-term planning.24
These initiatives led to adaptation efforts, including elevating infrastructure, restoring green spaces, and developing evacuation plans that helped reduce dam-age and save lives during Irene and Sandy (also see discussion of Hurricane Sandy in Ch. 11: Urban). As rebuilding and recovery advances,24 decision-mak-ing based on current and projected risks from such events by a full set of stakeholders and participants in the entire Northeast could dramatically improve re-silience across the region.
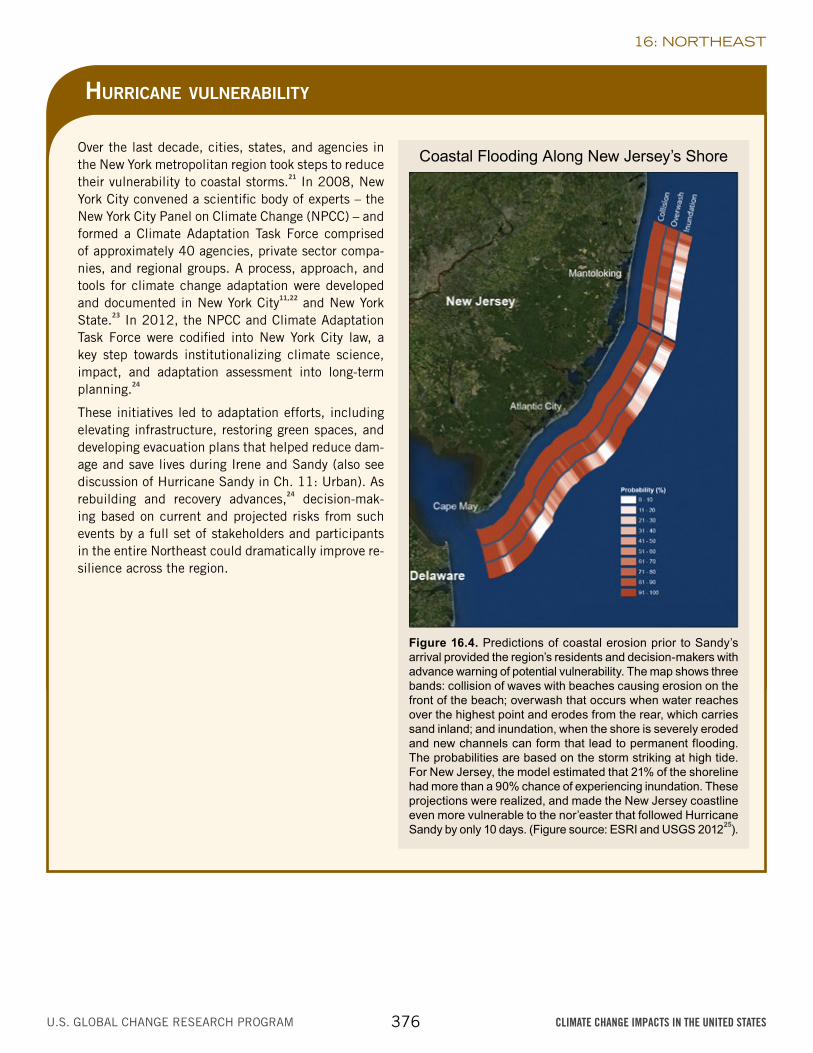
Coastal Flooding Along New Jersey’s Shore
Figure 16.4. Predictions of coastal erosion prior to Sandy’s arrival provided the region’s residents and decision-makers with advance warning of potential vulnerability. The map shows three bands: collision of waves with beaches causing erosion on the front of the beach; overwash that occurs when water reaches over the highest point and erodes from the rear, which carries sand inland; and inundation, when the shore is severely eroded and new channels can form that lead to permanent flooding. The probabilities are based on the storm striking at high tide. For New Jersey, the model estimated that 21% of the shoreline had more than a 90% chance of experiencing inundation. These projections were realized, and made the New Jersey coastline even more vulnerable to the nor’easter that followed Hurricane Sandy by only 10 days. (Figure source: ESRI and USGS 201225).
Hurricane vulnerability
377 CLIMATE CHANGE IMPACTS IN THE UNITED STATES
16: NORTHEAST
Key Message 1: Climate Risks to People
Heat waves, coastal flooding, and river flooding will pose a growing challenge to the region’s environmental, social, and economic systems. This will increase the vulnerability of the
region’s residents, especially its most disadvantaged populations.
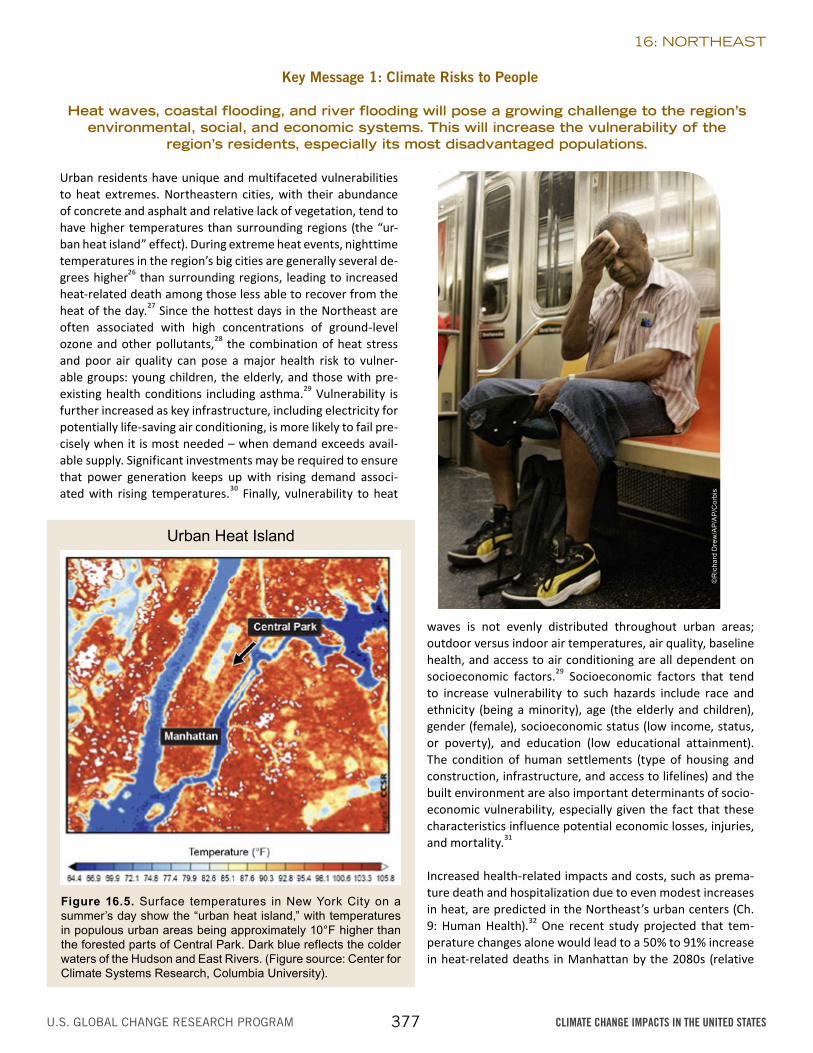
Urban residents have unique and multifaceted vulnerabilities to heat extremes. Northeastern cities, with their abundance of concrete and asphalt and relative lack of vegetation, tend to have higher temperatures than surrounding regions (the “ur-ban heat island” effect). During extreme heat events, nighttime temperatures in the region’s big cities are generally several de-grees higher26 than surrounding regions, leading to increased heat-related death among those less able to recover from the heat of the day.27 Since the hottest days in the Northeast are often associated with high concentrations of ground-level ozone and other pollutants,28 the combination of heat stress and poor air quality can pose a major health risk to vulner-able groups: young children, the elderly, and those with pre-existing health conditions including asthma.29 Vulnerability is further increased as key infrastructure, including electricity for potentially life-saving air conditioning, is more likely to fail pre-cisely when it is most needed – when demand exceeds avail-able supply. Significant investments may be required to ensure that power generation keeps up with rising demand associ-ated with rising temperatures.30 Finally, vulnerability to heat
waves is not evenly distributed throughout urban areas; outdoor versus indoor air temperatures, air quality, baseline health, and access to air conditioning are all dependent on socioeconomic factors.29 Socioeconomic factors that tend to increase vulnerability to such hazards include race and ethnicity (being a minority), age (the elderly and children), gender (female), socioeconomic status (low income, status, or poverty), and education (low educational attainment). The condition of human settlements (type of housing and construction, infrastructure, and access to lifelines) and the built environment are also important determinants of socio-economic vulnerability, especially given the fact that these characteristics influence potential economic losses, injuries, and mortality.31
Increased health-related impacts and costs, such as prema-ture death and hospitalization due to even modest increases in heat, are predicted in the Northeast’s urban centers (Ch. 9: Human Health).32 One recent study projected that tem-perature changes alone would lead to a 50% to 91% increase in heat-related deaths in Manhattan by the 2080s (relative
Urban Heat Island
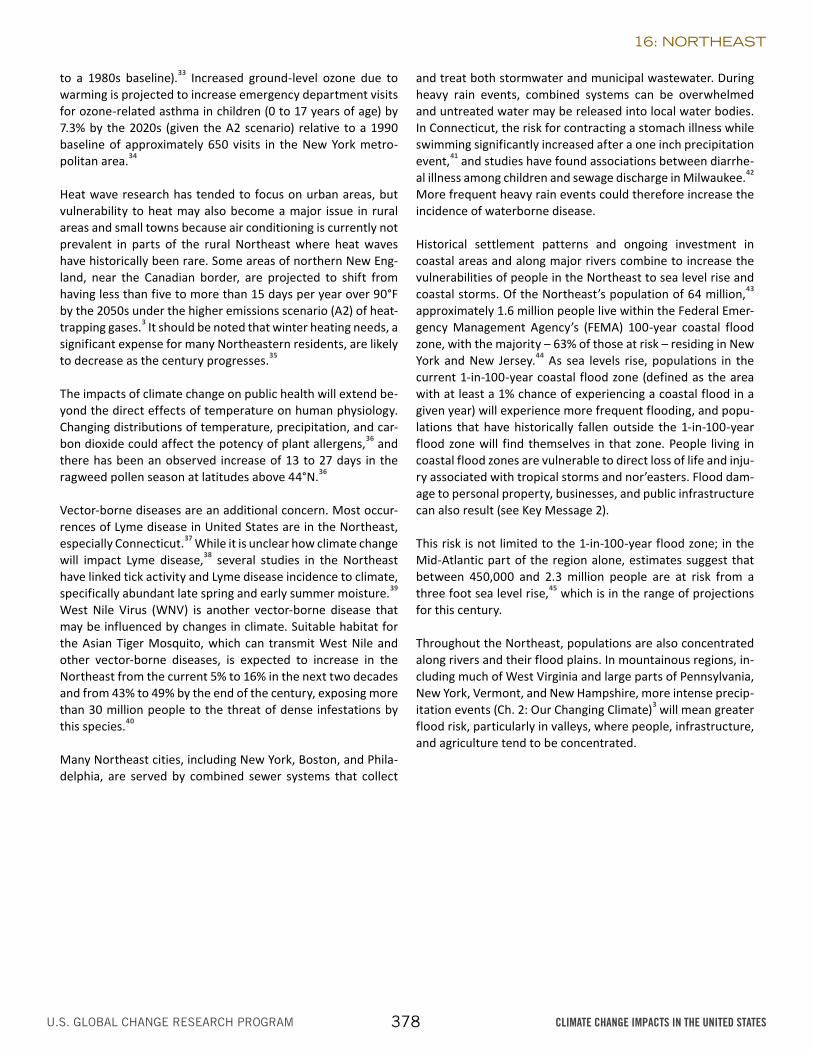
Figure 16.5. Surface temperatures in New York City on a summer’s day show the “urban heat island,” with temperatures in populous urban areas being approximately 10°F higher than the forested parts of Central Park. Dark blue reflects the colder waters of the Hudson and East Rivers. (Figure source: Center for Climate Systems Research, Columbia University).
©R
icha
rd D
rew
/AP/
AP/
Cor
bis
378 CLIMATE CHANGE IMPACTS IN THE UNITED STATES
16: NORTHEAST
to a 1980s baseline).33 Increased ground-level ozone due to warming is projected to increase emergency department visits for ozone-related asthma in children (0 to 17 years of age) by 7.3% by the 2020s (given the A2 scenario) relative to a 1990 baseline of approximately 650 visits in the New York metro-politan area.34
Heat wave research has tended to focus on urban areas, but vulnerability to heat may also become a major issue in rural areas and small towns because air conditioning is currently not prevalent in parts of the rural Northeast where heat waves have historically been rare. Some areas of northern New Eng-land, near the Canadian border, are projected to shift from having less than five to more than 15 days per year over 90°F by the 2050s under the higher emissions scenario (A2) of heat-trapping gases.3 It should be noted that winter heating needs, a significant expense for many Northeastern residents, are likely to decrease as the century progresses.35
The impacts of climate change on public health will extend be-yond the direct effects of temperature on human physiology. Changing distributions of temperature, precipitation, and car-bon dioxide could affect the potency of plant allergens,36 and there has been an observed increase of 13 to 27 days in the ragweed pollen season at latitudes above 44°N.36
Vector-borne diseases are an additional concern. Most occur-rences of Lyme disease in United States are in the Northeast, especially Connecticut.37 While it is unclear how climate change will impact Lyme disease,38 several studies in the Northeast have linked tick activity and Lyme disease incidence to climate, specifically abundant late spring and early summer moisture.39 West Nile Virus (WNV) is another vector-borne disease that may be influenced by changes in climate. Suitable habitat for the Asian Tiger Mosquito, which can transmit West Nile and other vector-borne diseases, is expected to increase in the Northeast from the current 5% to 16% in the next two decades and from 43% to 49% by the end of the century, exposing more than 30 million people to the threat of dense infestations by this species.40
Many Northeast cities, including New York, Boston, and Phila-delphia, are served by combined sewer systems that collect
and treat both stormwater and municipal wastewater. During heavy rain events, combined systems can be overwhelmed and untreated water may be released into local water bodies. In Connecticut, the risk for contracting a stomach illness while swimming significantly increased after a one inch precipitation event,41 and studies have found associations between diarrhe-al illness among children and sewage discharge in Milwaukee.42 More frequent heavy rain events could therefore increase the incidence of waterborne disease.
Historical settlement patterns and ongoing investment in coastal areas and along major rivers combine to increase the vulnerabilities of people in the Northeast to sea level rise and coastal storms. Of the Northeast’s population of 64 million,43 approximately 1.6 million people live within the Federal Emer-gency Management Agency’s (FEMA) 100-year coastal flood zone, with the majority – 63% of those at risk – residing in New York and New Jersey.44 As sea levels rise, populations in the current 1-in-100-year coastal flood zone (defined as the area with at least a 1% chance of experiencing a coastal flood in a given year) will experience more frequent flooding, and popu-lations that have historically fallen outside the 1-in-100-year flood zone will find themselves in that zone. People living in coastal flood zones are vulnerable to direct loss of life and inju-ry associated with tropical storms and nor’easters. Flood dam-age to personal property, businesses, and public infrastructure can also result (see Key Message 2).
This risk is not limited to the 1-in-100-year flood zone; in the Mid-Atlantic part of the region alone, estimates suggest that between 450,000 and 2.3 million people are at risk from a three foot sea level rise,45 which is in the range of projections for this century.
Throughout the Northeast, populations are also concentrated along rivers and their flood plains. In mountainous regions, in-cluding much of West Virginia and large parts of Pennsylvania, New York, Vermont, and New Hampshire, more intense precip-itation events (Ch. 2: Our Changing Climate)3 will mean greater flood risk, particularly in valleys, where people, infrastructure, and agriculture tend to be concentrated.
379 CLIMATE CHANGE IMPACTS IN THE UNITED STATES
16: NORTHEAST
Key Message 2: Stressed Infrastructure
Infrastructure will be increasingly compromised by climate-related hazards, including sea level rise, coastal flooding, and intense precipitation events.
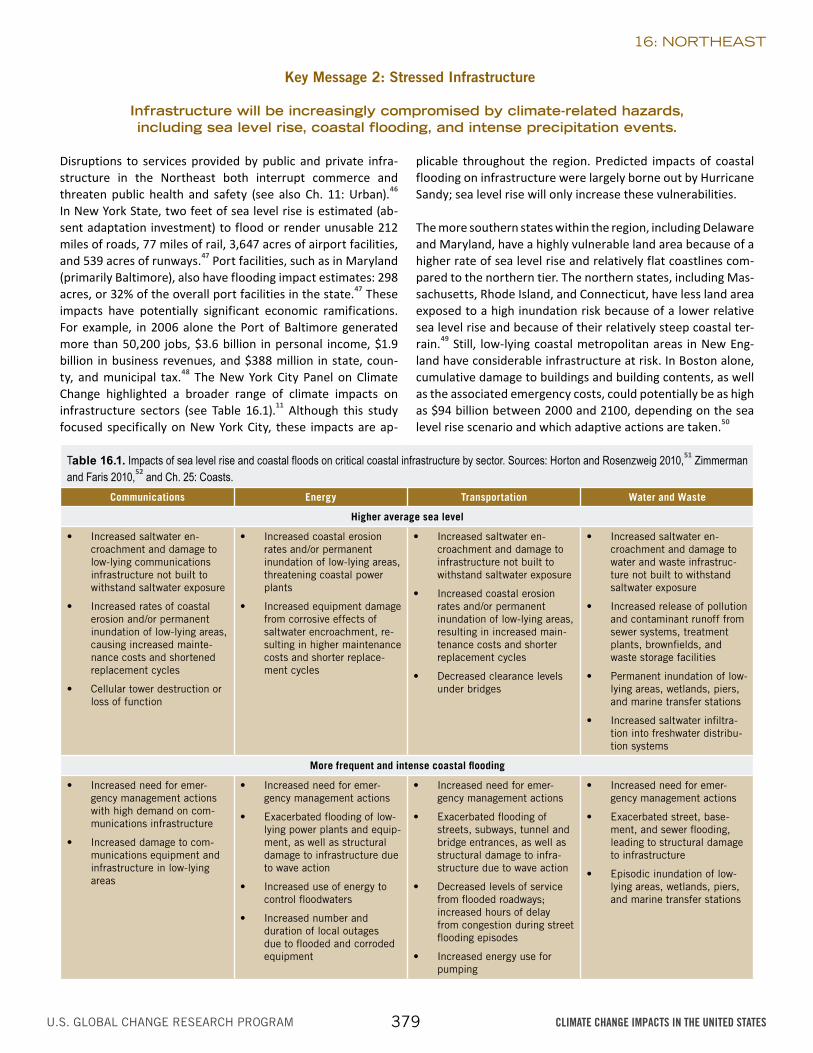
Disruptions to services provided by public and private infra-structure in the Northeast both interrupt commerce and threaten public health and safety (see also Ch. 11: Urban).46 In New York State, two feet of sea level rise is estimated (ab-sent adaptation investment) to flood or render unusable 212 miles of roads, 77 miles of rail, 3,647 acres of airport facilities, and 539 acres of runways.47 Port facilities, such as in Maryland (primarily Baltimore), also have flooding impact estimates: 298 acres, or 32% of the overall port facilities in the state.47 These impacts have potentially significant economic ramifications. For example, in 2006 alone the Port of Baltimore generated more than 50,200 jobs, $3.6 billion in personal income, $1.9 billion in business revenues, and $388 million in state, coun-ty, and municipal tax.48 The New York City Panel on Climate Change highlighted a broader range of climate impacts on infrastructure sectors (see Table 16.1).11 Although this study focused specifically on New York City, these impacts are ap-
plicable throughout the region. Predicted impacts of coastal flooding on infrastructure were largely borne out by Hurricane Sandy; sea level rise will only increase these vulnerabilities.
The more southern states within the region, including Delaware and Maryland, have a highly vulnerable land area because of a higher rate of sea level rise and relatively flat coastlines com-pared to the northern tier. The northern states, including Mas-sachusetts, Rhode Island, and Connecticut, have less land area exposed to a high inundation risk because of a lower relative sea level rise and because of their relatively steep coastal ter-rain.49 Still, low-lying coastal metropolitan areas in New Eng-land have considerable infrastructure at risk. In Boston alone, cumulative damage to buildings and building contents, as well as the associated emergency costs, could potentially be as high as $94 billion between 2000 and 2100, depending on the sea level rise scenario and which adaptive actions are taken.50
Table 16.1. Impacts of sea level rise and coastal floods on critical coastal infrastructure by sector. Sources: Horton and Rosenzweig 2010,51 Zimmerman and Faris 2010,52 and Ch. 25: Coasts.
Communications Energy Transportation Water and Waste
Higher average sea level
• Increased saltwater en-croachment and damage to low-lying communications infrastructure not built to withstand saltwater exposure
• Increased rates of coastal erosion and/or permanent inundation of low-lying areas, causing increased mainte-nance costs and shortened replacement cycles
• Cellular tower destruction or loss of function
• Increased coastal erosion rates and/or permanent inundation of low-lying areas, threatening coastal power plants
• Increased equipment damage from corrosive effects of saltwater encroachment, re-sulting in higher maintenance costs and shorter replace-ment cycles
• Increased saltwater en-croachment and damage to infrastructure not built to withstand saltwater exposure
• Increased coastal erosion rates and/or permanent inundation of low-lying areas, resulting in increased main-tenance costs and shorter replacement cycles
• Decreased clearance levels under bridges
• Increased saltwater en-croachment and damage to water and waste infrastruc-ture not built to withstand saltwater exposure
• Increased release of pollution and contaminant runoff from sewer systems, treatment plants, brownfields, and waste storage facilities
• Permanent inundation of low-lying areas, wetlands, piers, and marine transfer stations
• Increased saltwater infiltra-tion into freshwater distribu-tion systems
More frequent and intense coastal flooding
• Increased need for emer-gency management actions with high demand on com-munications infrastructure
• Increased damage to com-munications equipment and infrastructure in low-lying areas
• Increased need for emer-gency management actions
• Exacerbated flooding of low-lying power plants and equip-ment, as well as structural damage to infrastructure due to wave action
• Increased use of energy to control floodwaters
• Increased number and duration of local outages due to flooded and corroded equipment
• Increased need for emer-gency management actions
• Exacerbated flooding of streets, subways, tunnel and bridge entrances, as well as structural damage to infra-structure due to wave action
• Decreased levels of service from flooded roadways; increased hours of delay from congestion during street flooding episodes
• Increased energy use for pumping
• Increased need for emer-gency management actions
• Exacerbated street, base-ment, and sewer flooding, leading to structural damage to infrastructure
• Episodic inundation of low-lying areas, wetlands, piers, and marine transfer stations
380 CLIMATE CHANGE IMPACTS IN THE UNITED STATES
16: NORTHEAST
In the transportation sector (see also Ch. 5: Transportation), many of the region’s key highways (including I-95) and rail sys-tems (including Amtrak and commuter rail networks) span ar-eas that are prone to coastal flooding. In addition to temporary service disruptions, storm surge flooding can severely under-mine or disable critical infrastructure along coasts, including subway systems, wastewater treatment plants, and electrical
substations. Saltwater corrosion can damage sensitive and critical electrical equipment, such as electrical substations for energy distribution and signal equipment for rail systems; corrosion also accelerates rust damage on rail lines. Saltwater also threatens groundwater supplies and damages wastewater treatment plants.
Key Message 3: Agricultural and Ecosystem Impacts
Agriculture, fisheries, and ecosystems will be increasingly compromised over the next century by climate change impacts. Farmers can explore new crop options, but these adaptations are
not cost- or risk-free. Moreover, adaptive capacity, which varies throughout the region, could be overwhelmed by a changing climate.
Farmers in the Northeast are already experiencing conse-quences of climate change. In addition to direct crop damage from increasingly intense precipitation events, wet springs can delay planting for grain and vegetables in New York, for example, and subsequently delay harvest dates and reduce yields.53 This is an issue for agriculture nationally,54 but is par-ticularly acute for the Northeast, where heavy rainfall events have increased more than in any other region of the country (Ch. 2: Our Changing Climate, Key Message 6).7 In the future, farmers may also face too little water in summer to meet in-creased crop water demand as summers become hotter and growing seasons lengthen.55,56 Increased frequency of summer heat stress is also projected, which can negatively affect crop yields and milk production.57
Despite a trend toward warmer winters, the risk of frost and freeze damage continues, and has paradoxically increased over the past decade (see also Ch. 8: Ecosystems). These risks are exacerbated for perennial crops in years with variable winter temperatures. For example, midwinter-freeze damage cost wine grape growers in the Finger Lakes region of New York mil-lions of dollars in losses in the winters of 2003 and 2004.58 This was likely due to de-hardening of the vines during an unusually
warm December, which increased susceptibility to cold dam-age just prior to a subsequent hard freeze. Another avenue for cold damage, even in a relatively warm winter, is when there is an extended warm period in late winter or early spring caus-ing premature leaf-out or bloom, followed by a damaging frost event, as occurred throughout the Northeast in 200759 and again in 2012 when apple, grape, cherry, and other fruit crops were hard hit.60
Increased weed and pest pressure associated with longer growing seasons and warmer winters will be an increasingly im-portant challenge; there are already examples of earlier arrival and increased populations of some insect pests such as corn earworm.57 Furthermore, many of the most aggressive weeds, such as kudzu, benefit more than crop plants from higher at-mospheric carbon dioxide, and become more resistant to her-bicide control.61 Many weeds respond better than most cash crops to increasing carbon dioxide concentrations, particularly “invasive” weeds with the so-called C3 photosynthetic path-way, and with rapid and expansive growth patterns, including large allocations of below-ground biomass, such as roots.62 Re-search also suggests that glyphosate (for example, Roundup), the most widely-used herbicide in the United States, loses its
NO
AA
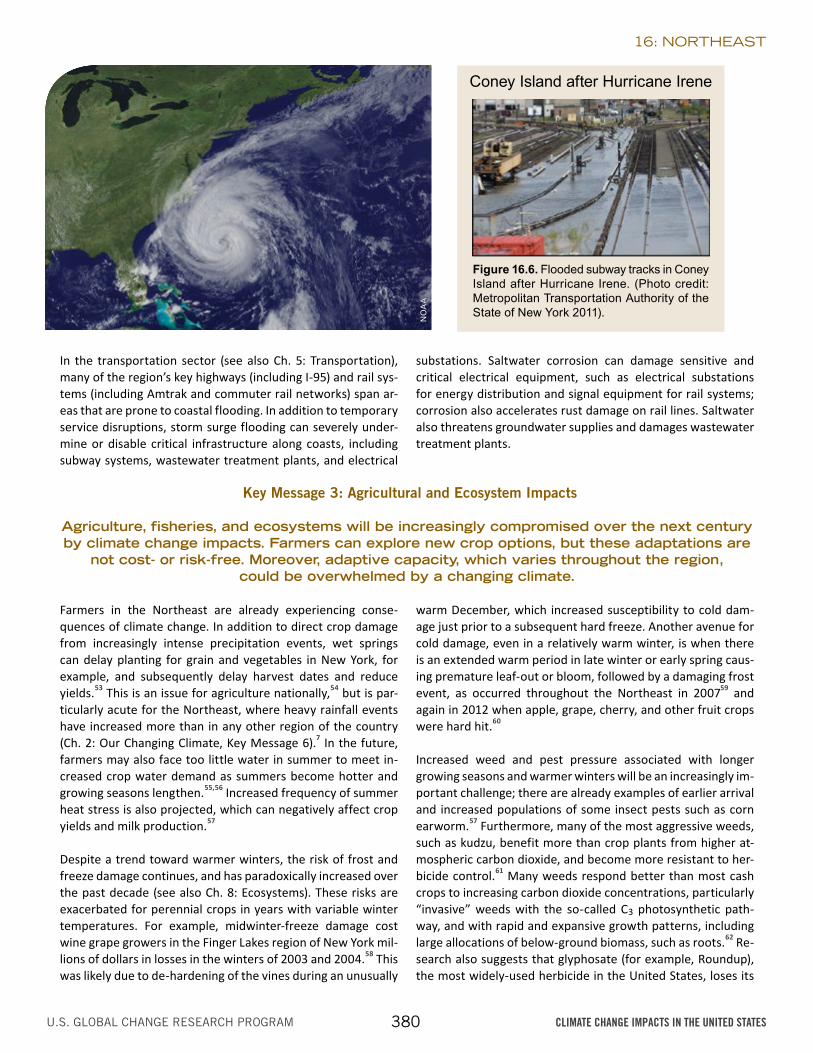
Coney Island after Hurricane Irene
Figure 16.6. Flooded subway tracks in Coney Island after Hurricane Irene. (Photo credit: Metropolitan Transportation Authority of the State of New York 2011).
381 CLIMATE CHANGE IMPACTS IN THE UNITED STATES
16: NORTHEAST
efficacy on weeds grown at the increased carbon dioxide levels likely to occur in the coming decades.63 To date, all weed/crop competition studies where the photosynthetic pathway is the same for both species favor weed growth over crop growth as carbon dioxide is increased.61
Effects of rising temperatures on the Northeast’s ecosystems have already been clearly observed (see also Ch. 8: Ecosys-tems). Further, changes in species distribution by elevation are occurring; a Vermont study found an upslope shift of 299 to 390 feet in the boundary between northern hardwoods and boreal forest on the western slopes of the Green Mountains between 1964 and 2004.64 Wildflowers65 and woody peren-nials are blooming earlier 66 and migratory birds are arriving sooner.67 Because species differ in their ability to adjust, asyn-chronies (like a mismatch between key food source availability and migration patterns) can develop, increasing species and ecosystem vulnerability. Several bird species have expanded their ranges northward68 as have some invasive insect species, such as the hemlock woolly adelgid,69 which has devastated hemlock trees. Warmer winters and less snow cover in recent years have contributed to increased deer populations70 that degrade forest understory vegetation.71
As ocean temperatures continue to rise, the range of suitable habitat for many commercially important fish and shellfish species is projected to shift northward. For example, cod and lobster fisheries south of Cape Cod are projected to have sig-nificant declines.72 Although suitable habitats will be shrinking for some species (such as coldwater fish like brook trout) and expanding for others (such as warmwater fish like bass), it is difficult to predict what proportion of species will be able to
move or adapt as their optimum climate zones shift.73 As each species responds uniquely to climate change, disruptions of im-portant species interactions (plants and pollinators; predators and prey) can be expected. For example, it is uncertain what forms of vegetation will move into the Adirondack Mountains when the suitable habitat for spruce-fir forests disappears.74 Increased productivity of some northern hardwood trees in the Northeast is projected (due to longer growing seasons and assuming a significant benefit from higher atmospheric carbon dioxide), but summer drought and other extreme events may offset potential productivity increases.75 Range shifts in tra-ditional foods gathered from the forests by Native American communities, such as Wabanaki berries in the Northeast, can have negative health and cultural impacts (Ch. 12: Indigenous Peoples).76
In contrast, many insect pests, pathogens, and invasive plants like kudzu appear to be highly and positively responsive to re-cent and projected climate change.77 Their expansion will lead to an overall loss of biodiversity, function, and resilience of some ecosystems.
The Northeast’s coastal ecosystems and the species that in-habit them are highly vulnerable to rising seas (see also Ch. 25: Coasts, Key Message 4). Beach and dune erosion, both a cause and effect of coastal flooding, is also a major issue in the Northeast.78,79 Since the early 1800s, there has been an estimated 39% decrease in marsh coverage in coastal New England; in the metropolitan Boston area, marsh coverage is estimated to be less than 20% of its late 1700s value.80 Impervi-ous urban surfaces and coastal barriers such as seawalls limit the ability of marshes to expand inland as sea levels rise.81
The Chesapeake Bay is the largest U.S. estuary, with a drainage basin that extends over six states. It is a critical and highly integrated natural and economic system threatened by changing land-use patterns and a changing climate – including sea level rise, higher temperatures, and more intense precipitation events. The ecosystem has a central role in the economy, including providing sources of food for people and the region’s other inhabitants, and cooling water for the energy sector. It also provides critical ecosystem services.
As sea levels rise, the Chesapeake Bay region is expected to experience an increase in coastal flooding and drowning of estuarine wetlands. The lower Chesapeake Bay is especially at risk due to high rates of sinking land (known as subsidence).82 Climate change and sea level rise are also likely to cause a number of ecological impacts, including declining water quality and clarity, increases in harmful algae and low oxygen (hypoxia) events, decreases in a number of species including eelgrass and seagrass beds, and changing interactions among trophic levels (positions in the food chain) leading to an increase in subtropical fish and shellfish species in the bay.83
tHe cHesapeake bay
382 CLIMATE CHANGE IMPACTS IN THE UNITED STATES
16: NORTHEAST
Key Message 4: Planning and Adaptation
While a majority of states and a rapidly growing number of municipalities have begun to incorporate the risk of climate change into their planning activities, implementation
of adaptation measures is still at early stages.
Of the 12 states in the Northeast, 11 have developed adapta-tion plans for several sectors and 10 have released, or plan to release, statewide adaptation plans.84 Given the interconnect-edness of climate change impacts and adaptation, multi-state coordination could help to ensure that information is shared efficiently and that emissions reduction and adaptation strate-gies do not operate at cross-purposes.
Local and state governments in the Northeast have been leaders and incubators in utilizing legal and regulatory op-portunities to foster climate change policies.85 The Regional Greenhouse Gas Initiative (RGGI) was the first market-based regulatory program in the U.S. aimed at reducing greenhouse gas emissions; it is a cooperative effort among nine northeast-ern states.86 Massachusetts became the first state to officially incorporate climate change impacts into its environmental review procedures by adopting legislation that directs agen-
cies to “consider reasonably foreseeable climate change impacts, including additional greenhouse gas emissions, and effects, such as predicted sea level rise.”87 In addition, Maine, Massachusetts, and Rhode Island have each adopted some form of “rolling easement” to ensure that wetlands or dunes migrate inland as sea level rises and re-duce the risk of loss of life and property.45
Northeast cities have employed a variety of mechanisms to respond to climate change, in-cluding land-use planning, provisions to protect infrastructure, regulations related to the design and construction of buildings, and emergency preparation, response, and recovery.91 While significant progress has been made, local gov-ernments still face limitations of legal authority, geographic jurisdiction, and resource constraints that could be addressed through effective en-gagement and support from higher levels of gov-ernment.
Keene, New Hampshire, has been a pilot com-munity for ICLEI’s Climate Resilient Communities program for adaptation planning92 – a process implemented through innovative community en-gagement methods.93 The Cape Cod Commission is another example in New England; the Com-mission has drafted model ordinances to help communities incorporate climate into zoning decision-making. Farther south, New York City has taken numerous steps to implement PlaNYC, a far-reaching sustainability plan for the city, in-cluding amending the construction code and the zoning laws and the implementation of measures focused on developing adaptation strategies to protect the City’s public and private infrastruc-ture from the effects of climate change;24 some major investments in protection have even been conceptualized.
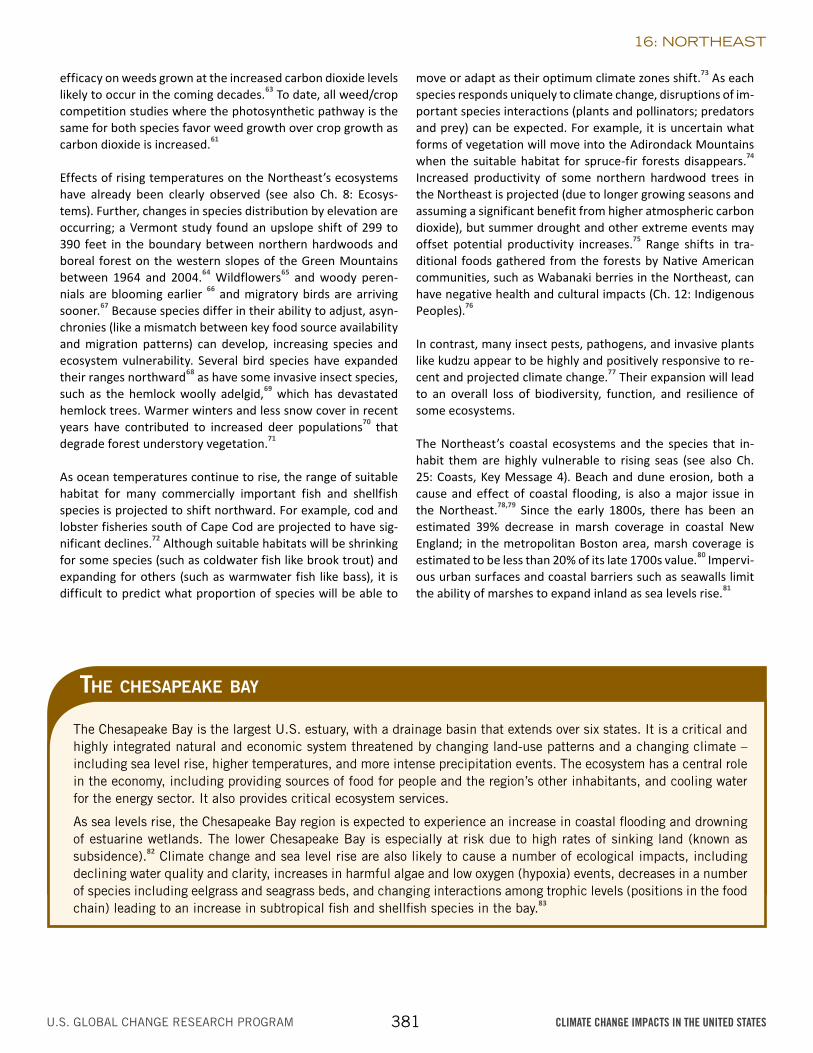
Connecticut Coastline and Expanding Salt Marshes
Figure 16.7. The Nature Conservancy’s adaptation decision-support tool (www.coastalresilience.org)88 depicts building-level impacts due to inundation (developed land cover, yellow areas) and potential marsh advancement zones (undeveloped land cover – currently forest, grass, and agriculture – blue areas) using downscaled sea level rise projections (52 inches by 2080s depicted) along the Connecticut and New York coasts. (Figure source: Ferdaña et al. 2010,90 Beck et al. 201389).
383 CLIMATE CHANGE IMPACTS IN THE UNITED STATES
16: NORTHEAST
One widely used adaptation-planning template is the eight-step iterative approach developed by the New York City Panel on Climate Change; it was highlighted in the contribution of the National Academy of Science’s Adaptation Panel to America’s Climate Choices and adopted by the Committee on America’s Climate Choices. It describes a procedure that decision-makers at all levels can use to design a flexible adaptation pathway to address infrastructure and other response issues through in-ventory and assessment of risk. The key, with respect to infra-structure, is to link adaptation strategies with capital improve-ment cycles and adjustment of plans to incorporate emerging climate projections11,94 – but the insights are far more general than that (see the Adaptation Panel Report95).
In most cases, adaptation requires information and tools coupled to a decision-support process steered by strong lead-ership, and there are a growing number of examples in the Northeast. At the smaller, municipal scale, coastal pilot proj-ects in Maryland,96 Delaware,97 New York, and Connecticut90 are underway.
Research and outreach efforts are underway in the region to help farmers find ways to cope with a rapidly changing climate,
take advantage of a longer growing season, and reduce green-house gas emissions,56,98 but unequal access to capital and information for strategic adaptation and mitigation remain a challenge. Financial barriers can constrain farmer adaptation.99 Even relatively straightforward adaptations such as chang-ing varieties are not always a low-cost option. Seed for new stress-tolerant varieties is sometimes expensive or regionally unavailable, and new varieties often require investments in new planting equipment or require adjustment in a wide range of farming practices. Investment in irrigation and drainage systems are relatively expensive options, and a challenge for farmers will be determining when the frequency of yield losses due to summer water deficits or flooding has or will become frequent enough to warrant such capital investments.
Regional activities in the Northeast are also being linked to fed-eral efforts. For example, NASA’s Agency-wide Climate Adap-tation Science Investigator Workgroup (CASI) brings together NASA facilities managers with NASA climate scientists in local Climate Resilience Workshops. This approach was in evidence at the Goddard Space Flight Center in Maryland, where scien-tists helped institutional managers address energy and storm-water management vulnerabilities.
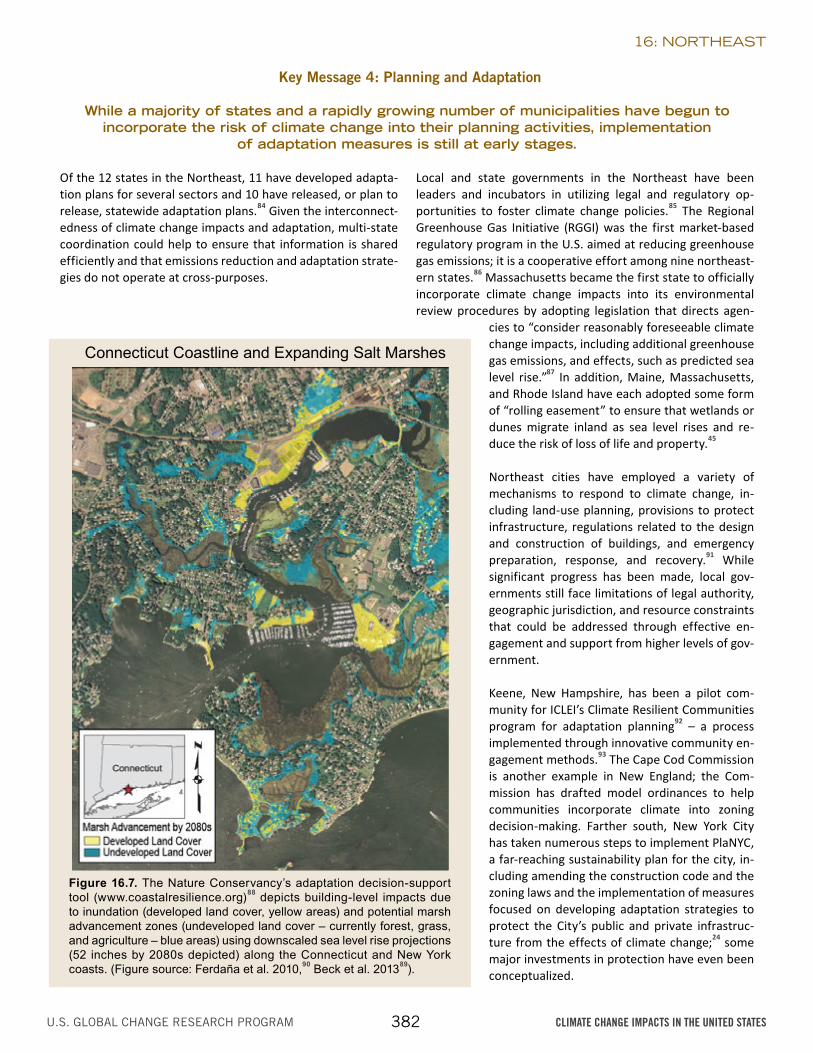
Storm Surge Barrier
Figure 16.8. Conceptual design of a storm surge barrier in New York City. (Figure source: Jansen and Dircke 2009).
384 CLIMATE CHANGE IMPACTS IN THE UNITED STATES
16: NORTHEAST
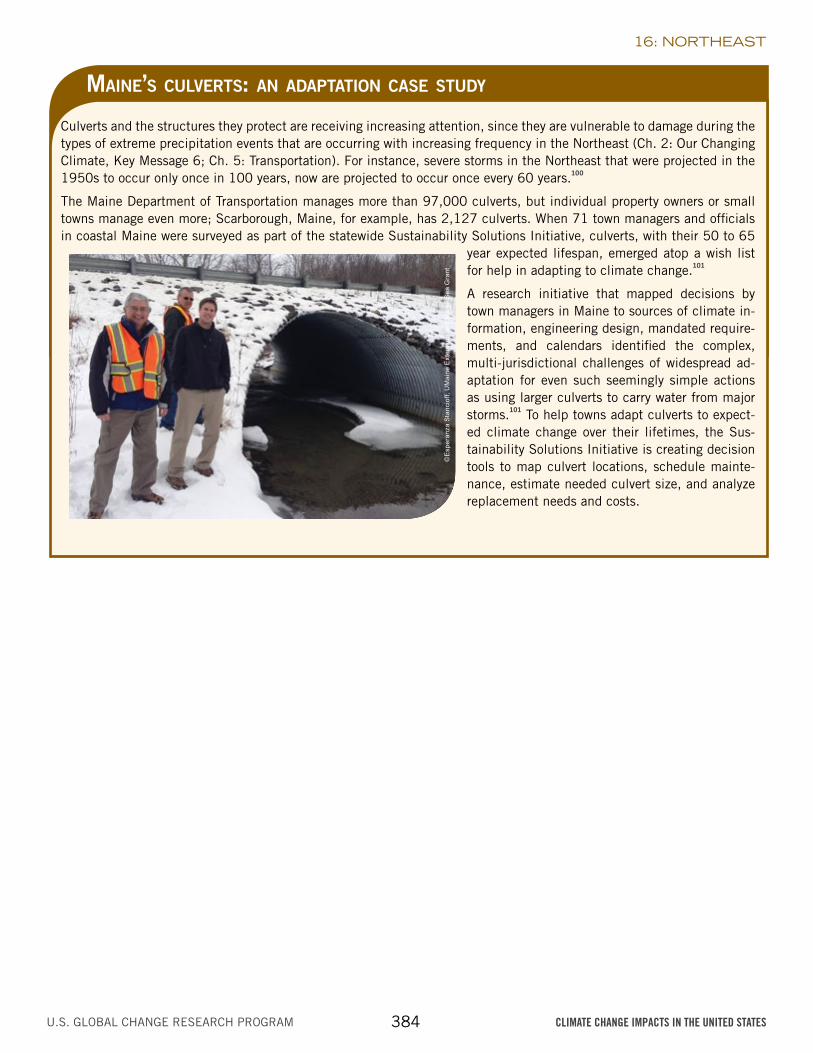
Maine’s culverts: an adaptation case study
Culverts and the structures they protect are receiving increasing attention, since they are vulnerable to damage during the types of extreme precipitation events that are occurring with increasing frequency in the Northeast (Ch. 2: Our Changing Climate, Key Message 6; Ch. 5: Transportation). For instance, severe storms in the Northeast that were projected in the 1950s to occur only once in 100 years, now are projected to occur once every 60 years.100
The Maine Department of Transportation manages more than 97,000 culverts, but individual property owners or small towns manage even more; Scarborough, Maine, for example, has 2,127 culverts. When 71 town managers and officials in coastal Maine were surveyed as part of the statewide Sustainability Solutions Initiative, culverts, with their 50 to 65
year expected lifespan, emerged atop a wish list for help in adapting to climate change.101
A research initiative that mapped decisions by town managers in Maine to sources of climate in-formation, engineering design, mandated require-ments, and calendars identified the complex, multi-jurisdictional challenges of widespread ad-aptation for even such seemingly simple actions as using larger culverts to carry water from major storms.101 To help towns adapt culverts to expect-ed climate change over their lifetimes, the Sus-tainability Solutions Initiative is creating decision tools to map culvert locations, schedule mainte-nance, estimate needed culvert size, and analyze replacement needs and costs.
©E
sper
anza
Sta
ncio
ff, U
Mai
ne E
xten
sion
and
Mai
ne S
ea G
rant
385 CLIMATE CHANGE IMPACTS IN THE UNITED STATES
16: NORTHEAST
RefeRences
1. USDA, 2009: United States Summary and State Data. In 2007 Census of Agriculture, Vol. 1, Geographic Area Series, Part 51. AC-07-A-51., 739 pp., U.S. Department of Agriculture, Washington, D.C. [Available online at http://www.agcensus.usda.gov/Publications/2007/Full_Report/usv1.pdf]
2. Horton, R., W. Solecki, and C. Rosenzweig, 2012: Climate Change in the Northeast: A Sourcebook. Draft Technical Input Report prepared for the U.S. National Climate Assessment. [Available online at http://downloads.usgcrp.gov/NCA/Activities/nca_ne_full_report_v2.pdf]
3. Kunkel, K. E., L. E. Stevens, S. E. Stevens, L. Sun, E. Janssen, D. Wuebbles, J. Rennells, A. DeGaetano, and J. G. Dobson, 2013: Regional Climate Trends and Scenarios for the U.S. National Climate Assessment: Part 1. Climate of the Northeast U.S. NOAA Technical Report NESDIS 142-1. 87 pp., National Oceanic and Atmospheric Administration, National Environmental Satellite, Data, and Information Service, Washington, D.C. [Available online at http://www.nesdis.noaa.gov/technical_reports/NOA A _ NESDIS _Tech_ Repor t _142-1-Cl imate_of_the_Northeast_U.S.pdf]
4. Church, J. A., P. L. Woodworth, T. Aarup, and W. S. Wilson, 2010: Understanding Sea-Level Rise And Variability. Blackwell Publishing, Ltd.
5. Sallenger, A. H., K. S. Doran, and P. A. Howd, 2012: Hotspot of accelerated sea-level rise on the Atlantic coast of North America. Nature Climate Change, 2, 884-888, doi:10.1038/nclimate1597. [Available online at http://www.cityofboston.gov/Images_Documents/Hotspot%20of%20accelerated%20sea-level%20rise%20-%20USGS%206-25-12_tcm3-33215.pdf]
6. NOAA, cited 2013: Sea Level Trends. National Oceanic and Atmospheric Administration, National Ocean Service. [Available online at http://tidesandcurrents.noaa.gov/sltrends/sltrends.shtml]
7. Groisman, P. Y., R. W. Knight, and O. G. Zolina, 2013: Recent trends in regional and global intense precipitation patterns. Climate Vulnerability, R. A. Pielke, Sr., Ed., Academic Press, 25-55.
8. Francis, J. A., and S. J. Vavrus, 2012: Evidence linking Arctic amplification to extreme weather in mid-latitudes. Geophysical Research Letters, 39, L06801, doi:10.1029/2012GL051000. [Available online at http://onlinelibrary.wiley.com/doi/10.1029/2012GL051000/pdf]
9. Liu, J., J. A. Curry, H. Wang, M. Song, and R. M. Horton, 2012: Impact of declining Arctic sea ice on winter snowfall. Proceedings of the National Academy of Sciences, 109, 4074-4079, doi:10.1073/pnas.1114910109. [Available online at http://www.pnas.org/content/109/11/4074.full.pdf+html]
10. Karl, T. R., J. T. Melillo, and T. C. Peterson, Eds., 2009: Global Climate Change Impacts in the United States. Cambridge University Press, 189 pp. [Available online at http://downloads.globalchange.gov/usimpacts/pdfs/climate-impacts-report.pdf ]
11. NPCC, 2010: Climate Change Adaptation in New York City: Building a Risk Management Response: New York City Panel on Climate Change 2009 Report. Vol. 1196, C. Rosenzweig, and W. Solecki, Eds. Wiley-Blackwell, 328 pp. [Available online at http://onlinelibrary.wiley.com/doi/10.1111/nyas.2010.1196.issue-1/issuetoc]
12. Parris, A., P. Bromirski, V. Burkett, D. Cayan, M. Culver, J. Hall, R. Horton, K. Knuuti, R. Moss, J. Obeysekera, A. Sallenger, and J. Weiss, 2012: Global Sea Level Rise Scenarios for the United States National Climate Assessment. NOAA Tech Memo OAR CPO-1, 37 pp., National Oceanic and Atmospheric Administration, Silver Spring, MD. [Available online at http://scenarios.globalchange.gov/sites/default/files/NOAA_SLR_r3_0.pdf ]
13. Yin, J., M. E. Schlesinger, and R. J. Stouffer, 2009: Model projections of rapid sea-level rise on the northeast coast of the United States. Nature Geoscience, 2, 262-266, doi:10.1038/ngeo462.
14. Horton, R. M., V. Gornitz, D. A. Bader, A. C. Ruane, R. Goldberg, and C. Rosenzweig, 2011: Climate hazard assessment for stakeholder adaptation planning in New York City. Journal of Applied Meteorolog y and Climatolog y, 50, 2247-2266, doi:10.1175/2011JAMC2521.1. [Available online at http://journals.ametsoc.org/doi/abs/10.1175/2011JAMC2521.1]
Tebaldi, C., B. H. Strauss, and C. E. Zervas, 2012: Modelling sea level rise impacts on storm surges along US coasts. Environmental Research Letters, 7, 014032, doi:10.1088/1748-9326/7/1/014032.
15. Gazoorian, C., 2012: How extreme was Irene? A comparison of the 2011, 1996, 1987 floods along the Schoharie Creek. Proceedings of the 2012 Mohawk Watershed Symposium, Union College, Schenectady, NY, March 16, 2012, J. M. H. Cockburn, and J. I. Garver, Eds., 17-22. [Available online at http://minerva.union.edu/garverj/mws/MWS_2012_Abstract_Volume.pdf]
16: NORTHEASTRefeRences
386 CLIMATE CHANGE IMPACTS IN THE UNITED STATES
16. Avila, L. A., and J. Cangliaosi, 2011: Tropical Cyclone Report (AL092011): Hurricane Irene, 45 pp., National Hurricane Center. [Available online at http://www.nhc.noaa.gov/data/tcr/AL092011_Irene.pdf]
17. Pealer, S., 2012: Lessons from Irene: Building resiliency as we rebuild, 8 pp., Vermont Agency of Natural Resources. [Available online at http://www.anr.state.vt.us/anr/climatechange/Pubs/Irene_Facts.pdf]
18. Blake, E. S., T. B. Kimberlain, R. J. Berg, J. P. Cangialosi, and J. L. Beven, II 2013: Tropical Cyclone Report: Hurricane Sandy. (AL182012) 22 – 29 October 2012, 157 pp., National Oceanic and Atmospheric Administration, National Hurricane Center [Available online at http://www.nhc.noaa.gov/data/tcr/AL182012_Sandy.pdf]
19. NOAA, cited 2013: Billion Dollar Weather/Climate Disasters, List of Events. National Oceanic and Atmospheric Administration [Available online at http://www.ncdc.noaa.gov/billions/events]
20. Rosenzweig, C., and W. D. Solecki, 2001: Climate Change and a Global City: The Potential Consequences of Climate Variability and Change – Metro East Coast. Columbia Earth Institute.
21. MTA, 2007: August 8, 2007 Storm Report, 115 pp., Metropolitan Transportation Authority, New York, New York. [Available online at http://www.mta.info/mta/pdf/storm_report_2007.pdf]
NYCDEP, 2008: The NYCDEP Climate Change Program, 102 pp., New York City Department of Environmental Protection., New York, NY. [Available online at http://www.nyc.gov/html/dep/pdf/climate/climate_complete.pdf]
22. City of New York, 2011: Inventory of New York City Greenhouse Gas Emissions. J. Dickinson, and A. Tenorio, Eds., 36 pp., Mayor’s Office of Long-term Planning and Sustainability, New York, New York. [Available online at http://nytelecom.vo.llnwd.net/o15/agencies/planyc2030/pdf/greenhousegas_2011.pdf]
23. Rosenzweig, C., W. D. Solecki, R. Blake, M. Bowman, C. Faris, V. Gornitz, R. Horton, K. Jacob, A. LeBlanc, R. Leichenko, M. Linkin, D. Major, M. O’Grady, L. Patrick, E. Sussman, G. Yohe, and R. Zimmerman, 2011: Developing coastal adaptation to climate change in the New York City infrastructure-shed: Process, approach, tools, and strategies. Climatic Change, 106, 93-127, doi:10.1007/s10584-010-0002-8. [Available online at http://www.ccrun.org/sites/ccrun/files/attached_files/2011_Rosenzweig_etal.pdf]
24. City of New York, 2013: PlaNYC - A Stronger, More Resilient New York, 445 pp., New York City Special Initiative for Rebuilding and Resiliency, New York, New York. [Available online at http://www.nyc.gov/html/sirr/html/report/report.shtml]
25. USGS: Coastal Change Hazards: Hurricanes and Extreme Storms. U.S. Geological Survey, St. Petersburg Coastal and Marine Science Center. [Available online at http://coastal.er.usgs.gov/hurricanes/sandy/coastal-change/]
26. Gaffin, S. R., C. Rosenzweig, R. Khanbilvardi, L. Parshall, S. Mahani, H. Glickman, R. Goldberg, R. Blake, R. B. Slosberg, and D. Hillel, 2008: Variations in New York City’s urban heat island strength over time and space. Theoretical and Applied Climatolog y, 94, 1-11, doi:10.1007/s00704-007-0368-3.
27. Semenza, J. C., C. H. Rubin, K. H. Falter, J. D. Selanikio, W. D. Flanders, H. L. Howe, and J. L. Wilhelm, 1996: Heat-related deaths during the July 1995 heat wave in Chicago. New England Journal of Medicine, 335, 84-90, doi:10.1056/NEJM199607113350203. [Available online at http://www.nejm.org/doi/pdf/10.1056/NEJM199607113350203]
28. Patz, J. A., 2000: Climate change and health: New research challenges. Ecosystem Health, 6, 52-58, doi:10.1046/j.1526-0992.2000.00006.x.
29. Solecki, W., L. Tryhorn, A. DeGaetano, and D. Major, 2011: Ch. 2: Vulnerability and adaptation. Responding to Climate Change in New York State: The ClimAID Integrated Assessment for Effective Climate Change Adaptation in New York State, C. Rosenzweig, W. Solecki, A. DeGaetano, M. O’Grady, S. Hassol, and P. Grabhorn, Eds., Blackwell Publishing, 50-62. [Available online at http://www.nyserda.ny.gov/-/media/Files/Publ icat ions/Research/Environmental/EMEP/cl imaid/11-18-response-to-cl imate-change-in-nys-chapter2.ashx]
30. Amato, A. D., M. Ruth, P. Kirshen, and J. Horwitz, 2005: Regional energy demand responses to climate change: Methodology and application to the Commonwealth of Massachusetts. Climatic Change, 71, 175-201, doi:10.1007/s10584-005-5931-2.
Ruth, M., and A. C. Lin, 2006: Regional energy demand and adaptations to climate change: Methodology and application to the state of Maryland, USA. Energ y Policy, 34, 2820-2833, doi:10.1016/j.enpol.2005.04.016.
31. Cutter, S. L., B. J. Boruff, and W. L. Shirley, 2003: Social vulnerability to environmental hazards. Social Science Quarterly, 84, 242-261, doi:10.1111/1540-6237.8402002.
32. Anderson, G. B., and M. L. Bell, 2012: Lights out: Impact of the August 2003 power outage on mortality in New York, NY. Epidemiolog y, 23, 189-193, doi:10.1097/EDE.0b013e318245c61c.
EPA, 2006: Excessive Heat Events Guidebook. EPA 430-B-06-005, 60 pp., U.S. Environmental Protection Agency, Washington, D.C. [Available online at http://www.epa.gov/heatisld/about/pdf/EHEguide_final.pdf ]
16: NORTHEASTRefeRences
387 CLIMATE CHANGE IMPACTS IN THE UNITED STATES
Huang, C., A. G. Barnett, X. Wang, P. Vaneckova, G. FitzGerald, and S. Tong, 2011: Projecting future heat-related mortality under climate change scenarios: A systematic review. Environmental Health Perspectives, 119, 1681-1690, doi:10.1289/Ehp.1103456. [Available online at http://ehp.niehs.nih.gov/wp-content/uploads/119/12/ehp.1103456.pdf]
Knowlton, K., B. Lynn, R. A. Goldberg, C. Rosenzweig, C. Hogrefe, J. K. Rosenthal, and P. L. Kinney, 2007: Projecting heat-related mortality impacts under a changing climate in the New York City region. American Journal of Public Health, 97, 2028-2034, doi:10.2105/Ajph.2006.102947. [Available online at http://ajph.aphapublications.org/doi/pdf/10.2105/AJPH.2006.102947]
33. Li, T., R. M. Horton, and P. L. Kinney, 2013: Projections of seasonal patterns in temperature-related deaths for Manhattan, New York. Nature Climate Change, 3, 717-721, doi:10.1038/nclimate1902.
34. Sheffield, P. E., J. L. Carr, P. L. Kinney, and K. Knowlton, 2011: Modeling of regional climate change effects on ground-level ozone and childhood asthma. American Journal of Preventive Medicine, 41, 251-257, doi:10.1016/j.amepre.2011.04.017. [Available online at http://download.journals.elsevierhealth.com/pdfs/journals/0749-3797/PIIS0749379711003461.pdf]
35. Hammer, S. A., L. Parshall, R. Leichenko, P. Vancura, and M. Panero, 2011: Ch. 8: Energy. Responding to Climate Change in New York State: The ClimAID Integrated Assessment for Effective Climate Change Adaptation in New York State, C. Rosenzweig, W. Solecki, A. DeGaetano, M. O’Grady, S. Hassol, and P. Grabhorn, Eds., New York State Energy Research and Development Authority (NYSERDA), 225-298. [Available online at www.nyserda.ny.gov/climaid]
36. Ziska, L., K. Knowlton, C. Rogers, D. Dalan, N. Tierney, M. A. Elder, W. Filley, J. Shropshire, L. B. Ford, C. Hedberg, P. Fleetwood, K. T. Hovanky, T. Kavanaugh, G. Fulford, R. F. Vrtis, J. A. Patz, J. Portnoy, F. Coates, L. Bielory, and D. Frenz, 2011: Recent warming by latitude associated with increased length of ragweed pollen season in central North America. Proceedings of the National Academy of Sciences, 108, 4248-4251, doi:10.1073/pnas.1014107108. [Available online at http://www.pnas.org/content/108/10/4248.full.pdf+html]
37. Bacon, R. M., K. J. Kugeler, and P. S. Mead, 2008: Surveillance for Lyme disease--United States, 1992-2006. Morbidity and Mortality Weekly Report, 57, 1-9. [Available online at http://www.cdc.gov/MMWR/PREVIEW/MMWRHTML/ss5710a1.htm]
38. Brownstein, J. S., T. R. Holford, and D. Fish, 2005: Effect of climate change on Lyme disease risk in North America. EcoHealth, 2, 38-46, doi:10.1007/s10393-004-0139-x.
39. McCabe, G. J., and J. E. Bunnell, 2004: Precipitation and the occurrence of Lyme disease in the northeastern United States. Vector-Borne and Zoonotic Diseases, 4, 143-148, doi:10.1089/1530366041210765.
Subak, S., 2003: Effects of climate on variability in Lyme disease incidence in the northeastern United States. American Journal of Epidemiolog y, 157, 531-538, doi:10.1093/aje/kwg014. [Available online at http://aje.oxfordjournals.org/content/157/6/531.full.pdf+html]
40. Rochlin, I., D. V. Ninivaggi, M. L. Hutchinson, and A. Farajollahi, 2013: Climate change and range expansion of the Asian tiger mosquito (Aedes albopictus) in northeastern USA: Implications for public health practitioners. PLoS ONE, 8, e60874, doi:10.1371/journal.pone.0060874. [Available online at http://www.plosone.org/article/info%3Adoi%2F10.1371%2Fjournal.pone.0060874]
41. Kuntz, J., and R. Murray, 2009: Predictability of swimming prohibitions by observational parameters: A proactive public health policy, Stamford, Connecticut, 1989-2004. Journal of Environmental Health, 72, 17-22.
42. Redman, R. L., C. A. Nenn, D. Eastwood, and M. H. Gorelick, 2007: Pediatric emergency department visits for diarrheal illness increased after release of undertreated sewage. Pediatrics, 120, e1472-e1475, doi:10.1542/peds.2007-0283. [Available online at http://www.pediatricsdigest.mobi/content/120/6/e1472.ful l.pdf+html]
43. U.S. Census Bureau, cited 2012: United States Census 2010. [Available online at http://www.census.gov/2010census/]
44. Crowell, M., K. Coulton, C. Johnson, J. Westcott, D. Bellomo, S. Edelman, and E. Hirsch, 2010: An estimate of the U.S. population living in 100-Year coastal flood hazard areas. Journal of Coastal Research 262, 201-211, doi:10.2112/JCOASTRES-D-09-00076.1.
45. CCSP, 2009: Coastal Sensitivity to Sea-Level Rise: A Focus on the Mid-Atlantic Region. A Report by the U.S. Climate Change Science Program and the Subcommittee on Global Change Research. J. G. Titus, K. E. Anderson, D. R. Cahoon, D. B. Gesch, S. K. Gill, B. T. Gutierrez, E. R. Thieler, and S. J. Williams, Eds. U.S. Environmental Protection Agency, 320 pp. [Available online at http://downloads.globalchange.gov/sap/sap4-1/sap4-1-final-report-all.pdf ]
46. ASCE, cited 2013: Report Card for America’s Infrastructure. American Society of Civil Engineers. [Available online at http://www.infrastructurereportcard.org/]
16: NORTHEASTRefeRences
388 CLIMATE CHANGE IMPACTS IN THE UNITED STATES
47. DOT, 2008: The Potential Impacts of Global Sea Level Rise on Transportation Infrastructure – Part 1: Methodology. Center for Climate Change and Environmental Forecasting, U.S. Department of Transportation, Washington, D.C. [Available online at http://climate.dot.gov/impacts-adaptations/pdf/entire.pdf ]
48. Maryland Port Administration, 2008: The Economic Impacts of the Port of Baltimore, 39 pp., Martin Associates, Lancaster, PA. [Available online at http://mpa.maryland.gov/_media/client/planning/EconomicImpactReport-revisedJan’08.pdf]
49. Wu, S.-Y., R. Najjar, and J. Siewert, 2009: Potential impacts of sea-level rise on the Mid- and Upper-Atlantic Region of the United States. Climatic Change, 95, 121-138, doi:10.1007/s10584-008-9522-x.
50. Kirshen, P., C. Watson, E. Douglas, A. Gontz, J. Lee, and Y. Tian, 2008: Coastal flooding in the Northeastern United States due to climate change. Mitigation and Adaptation Strategies for Global Change, 13, 437-451, doi:10.1007/s11027-007-9130-5.
51. Horton, R., C. Rosenzweig, V. Gornitz, D. Bader, and M. O’Grady, 2010: Climate risk information. Annals of the New York Academy of Sciences, 1196, 147-228, doi:10.1111/j.1749-6632.2010.05323.x. [Available online at http://onlinelibrary.wiley.com/doi/10.1111/j.1749-6632.2009.05320.x/abstract]
52. Zimmerman, R., and C. Faris, 2010: Infrastructure impacts and adaptation challenges. Annals of the New York Academy of Sciences, 1196, 63-86, doi:10.1111/j.1749-6632.2009.05318.x.
53. Freidline, A., 2011: Rain cuts early volume, delays summer harvest. The Packer, July 15, 2011. The Packer/Vance Publishing Corp. [Available online at http://www.thepacker.com/fruit-vegetable-news/shipping-profiles/Rain-cuts-early-volume-delays-summer-harvest-125642283.html]
54. Hatfield, J. L., K. J. Boote, B. A. Kimball, L. H. Ziska, R. C. Izaurralde, D. Ort, A. M. Thomson, and D. Wolfe, 2011: Climate impacts on agriculture: Implications for crop production. Agronomy Journal, 103, 351-370, doi:10.2134/agronj2010.0303.
55. Hayhoe, K., C. P. Wake, T. G. Huntington, L. Luo, M. D. Schwartz, J. Sheffield, E. Wood, B. Anderson, J. Bradbury, A. DeGaetano, T. Troy, and D. Wolfe, 2007: Past and future changes in climate and hydrological indicators in the US Northeast. Climate Dynamics, 28, 381-407, doi:10.1007/s00382-006-0187-8.
56. Wolfe, D. W., J. Comstock, A. Lakso, L. Chase, W. Fry, C. Petzoldt, R. Leichenko, and P. Vancura, 2011: Ch. 7: Agriculture. Responding to Climate Change in New York State: The ClimAID Integrated Assessment for Effective Climate Change Adaptation in New York State, C. Rosenzweig, W. Solecki, A. DeGaetano, M. O’Grady, S. Hassol, and P. Grabhorn, Eds., Blackwell Publishing, 217-254. [Available online at http://www.nyserda.ny.gov/~/media/Files/Publications/Research/Environmental/EMEP/climaid/11-18-response-to-climate-change-in-nys-chapter6.ashx]
57. Wolfe, D. W., L. Ziska, C. Petzoldt, A. Seaman, L. Chase, and K. Hayhoe, 2008: Projected change in climate thresholds in the Northeastern U.S.: Implications for crops, pests, livestock, and farmers. Mitigation and Adaptation Strategies for Global Change, 13, 555-575, doi:10.1007/s11027-007-9125-2.
58. Levin, M. D., 2005: Finger Lakes freezes devastate vineyards. Wines and Vines.
59. Gu, L., P. J. Hanson, W. Mac Post, D. P. Kaiser, B. Yang, R. Nemani, S. G. Pallardy, and T. Meyers, 2008: The 2007 eastern US spring freezes: Increased cold damage in a warming world? BioScience, 58, 253-262, doi:10.1641/b580311. [Available online at http://www.jstor.org/stable/10.1641/B580311]
60. Halloran, A., 2012: Growing Uncertainties: Climate change is forcing farmers in the Northeast to rethink their seasonal strategies. Metroland News, May 17, 2012. [Available online at http://metroland.net/2012/05/17/growing-uncertainties/]
61. Ziska, L. H., and G. B. Runion, 2007: Future weed, pest, and disease problems for plants. Agroecosystems in a Changing Climate P. C. D. Newton, R. A. Carran, G. R. Edwards, and P. A. Niklaus, Eds., CRC Press, 261-287.
62. Ziska, L. H., and K. George, 2004: Rising carbon dioxide and invasive, noxious plants: Potential threats and consequences. World Resource Review, 16, 427-447. [Available online at http://omar.arsnet.usda.gov/SP2UserFiles/ad_hoc/12755100FullTextPublicationspdf/Publications/ziska/potentialthreats.pdf ]
63. Ziska, L. H., J. R. Teasdale, and J. A. Bunce, 1999: Future atmospheric carbon dioxide may increase tolerance to glyphosate. Weed Science, 47, 608-615.
64. Beckage, B., B. Osborne, D. G. Gavin, C. Pucko, T. Siccama, and T. Perkins, 2008: A rapid upward shift of a forest ecotone during 40 years of warming in the Green Mountains of Vermont. Proceedings of the National Academy of Sciences, 105, 4197-4202, doi:10.1073/pnas.0708921105.
16: NORTHEASTRefeRences
389 CLIMATE CHANGE IMPACTS IN THE UNITED STATES
65. Abu-Asab, M. S., P. M. Peterson, S. G. Shetler, and S. S. Orli, 2001: Earlier plant flowering in spring as a response to global warming in the Washington, DC, area. Biodiversity and Conservation, 10, 597-612, doi:10.1023/A:1016667125469.
66. Primack, D., C. Imbres, R. B. Primack, A. J. Miller-Rushing, and P. Del Tredici, 2004: Herbarium specimens demonstrate earlier flowering times in response to warming in Boston. American Journal of Botany, 91, 1260-1264, doi:10.3732/ajb.91.8.1260. [Available online at http://www.amjbot.org/content/91/8/1260.full.pdf+html]
Wolfe, D. W., M. D. Schwartz, A. N. Lakso, Y. Otsuki, R. M. Pool, and N. J. Shaulis, 2005: Climate change and shifts in spring phenology of three horticultural woody perennials in northeastern USA. International Journal of Biometeorolog y, 49, 303-309, doi:10.1007/s00484-004-0248-9.
67. Butler, C. J., 2003: The disproportionate effect of global warming on the arrival dates of short-distance migratory birds in North America. Ibis, 145, 484-495, doi:10.1046/j.1474-919X.2003.00193.x.
68. Rodenhouse, N. L., L. M. Christenson, D. Parry, and L. E. Green, 2009: Climate change effects on native fauna of northeastern forests Canadian Journal of Forest Research, 39, 249-263, doi:10.1139/X08-160. [Available online at http://www.nrcresearchpress.com/doi/pdf/10.1139/X08-160]
69. Paradis, A., J. Elkinton, K. Hayhoe, and J. Buonaccorsi, 2008: Role of winter temperature and climate change on the survival and future range expansion of the hemlock woolly adelgid (Adelges tsugae) in eastern North America. Mitigation and Adaptation Strategies for Global Change, 13, 541-554, doi:10.1007/s11027-007-9127-0. [Available online at http://www.northeastclimateimpacts.org/pdf/miti/paradis_et_al.pdf ]
70. Wolfe, D. W., J. Comstock, H. Menninger, D. Weinstein, K. Sullivan, C. Kraft, B. Chabot, P. Curtis, R. Leichenko, and P. Vancura, 2011: Ch. 6: Ecosystems. Responding to Climate Change in New York State: The ClimAID Integrated Assessment for Effective Climate Change Adaptation in New York State, C. Rosenzweig, W. Solecki, A. DeGaetano, M. O’Grady, S. Hassol, and P. Grabhorn, Eds., Blackwell Publishing, 164-216. [Available online at http://www.nyserda.ny.gov/~/media/Files/Publications/Research/Environmental/EMEP/climaid/11-18-response-to-climate-change-in-nys-chapter6.ashx]
71. Stromayer, K. A. K., and R. J. Warren, 1997: Are overabundant deer herds in the eastern United States creating alternative stable states in forest plant communities? Wildlife Society Bulletin, 25, 227-234. [Available online at http://www.jstor.org/stable/3783436]
72. Fogarty, M., L. Incze, K. Hayhoe, D. Mountain, and J. Manning, 2008: Potential climate change impacts on Atlantic cod (Gadus morhua) off the northeastern USA. Mitigation and Adaptation Strategies for Global Change, 13, 453-466, doi:10.1007/s11027-007-9131-4.
Frumhoff , P. C., J. J. McCarthy, J. M. Melillo, S. C. Moser, and D. J. Wuebbles, 2007: Ch. 3: Marine impacts. Confronting Climate Change in the U.S. Northeast: Science, Impacts, and Solutions. Synthesis Report of the Northeast Climate Impacts Assessment (NECIA), Union of Concerned Scientists 39-46. [Available online at http://www.climatechoices.org/assets/documents/cl imatechoices/confront ing-cl imate-change-in-the-u-s-northeast.pdf]
73. Jenkins, J., 2010: Climate Change in the Adirondacks: The Path to Sustainability. Cornell University Press, 200 pp.
74. Iverson, L., A. Prasad, and S. Matthews, 2008: Modeling potential climate change impacts on the trees of the northeastern United States. Mitigation and Adaptation Strategies for Global Change, 13, 487-516, doi:10.1007/s11027-007-9129-y.
75. Mohan, J. E., R. M. Cox, and L. R. Iverson, 2009: Composition and carbon dynamics of forests in northeastern North America in a future, warmer world. Canadian Journal of Forest Research, 39, 213-230, doi:10.1139/X08-185.
76. Lynn, K., J. Daigle, J. Hoffman, F. Lake, N. Michelle, D. Ranco, C. Viles, G. Voggesser, and P. Williams, 2013: The impacts of climate change on tribal traditional foods. Climatic Change, 120, 545-556, doi:10.1007/s10584-013-0736-1.
77. Dukes, J. S., J. Pontius, D. Orwig, J. R. Garnas, V. L. Rodgers, N. Brazee, B. Cooke, K. A. Theoharides, E. E. Stange, R. Harrington, J. Ehrenfeld, J. Gurevitch, M. Lerdau, K. Stinson, R. Wick, and M. Ayres, 2009: Responses of insect pests, pathogens, and invasive plant species to climate change in the forests of northeastern North America: What can we predict? Canadian Journal of Forest Research, 39, 231-248, doi:10.1139/X08-171. [Available online at http://www.nrcresearchpress.com/doi/pdf/10.1139/X08-171]
78. Buonaiuto, F., L. Patrick, V. Gornitz, E. Hartig, R. Leichenko, J. Stedinger, J. Tanski, P. Vancura, and J. Waldman, 2011: Ch. 15: Coastal zones. Responding to Climate Change in New York State: The ClimAID Integrated Assessment for Effective Climate Change Adaptation in New York State, C. Rosenzweig, W. Solecki, A. DeGaetano, M. O’Grady, S. Hassol, and P. Grabhorn, Eds., Blackwell Publishing, 649.
79. Gornitz, V., S. Couch, and E. K. Hartig, 2001: Impacts of sea level rise in the New York City metropolitan area. Global and Planetary Change, 32, 61-88, doi:10.1016/S0921-8181(01)00150-3.
16: NORTHEASTRefeRences
390 CLIMATE CHANGE IMPACTS IN THE UNITED STATES
80. Gedan, K. B., B. R. Silliman, and M. D. Bertness, 2009: Centuries of human-driven change in salt marsh ecosystems. Annual Review of Marine Science, 1, 117-141, doi:10.1146/annurev.marine.010908.163930.
81. Nicholls, R. J., and A. Cazenave, 2010: Sea-level rise and its impact on coastal zones. Science, 328, 1517-1520, doi:10.1126/science.1185782.
Nicholls, R. J., P. P. Wong, V. R. Burkett, J. O. Codignotto, J. E. Hay, R. F. McLean, S. Ragoonaden, and C. D. Woodroffe, 2007: Ch. 6: Coastal systems and low-lying areas. Climate Change 2007: Impacts, Adaptations and Vulnerability. Contribution of Working Group II to the Fourth Assessment Report of the Intergovernmental Panel on Climate Change, M. L. Parry, O. F. Canziani, J. P. Palutikof, P. J. Van der Linden, and C. E. Hanson, Eds., Cambridge University Press, 316-356. [Available online at http://ro.uow.edu.au/cgi/viewcontent.cgi?article=1192&context=scipapers]
Scavia, D., J. C. Field, D. F. Boesch, R. W. Buddemeier, V. Burkett, D. R. Cayan, M. Fogarty, M. A. Harwell, R. W. Howarth, C. Mason, D. J. Reed, T. C. Royer, A. H. Sallenger, and J. G. Titus, 2002: Climate change impacts on U.S. coastal and marine ecosystems. Estuaries, 25, 149-164, doi:10.1007/BF02691304. [Available online at http://www.jstor.org/stable/1353306]
Titus, J. G., D. E. Hudgens, D. L. Trescott, M. Craghan, W. H. Nuckols, C. H. Hershner, J. M. Kassakian, C. J. Linn, P. G. Merritt, T. M. McCue, J. F. O’Connell, J. Tanski, and J. Wang, 2009: State and local governments plan for development of most land vulnerable to rising sea level along the US Atlantic coast. Environmental Research Letters, 4, doi:10.1088/1748-9326/4/4/044008.
82. Boon, J. D., J. M. Brubaker, and D. R. Forrest, 2010: Chesapeake Bay Land Subsidence and Sea Level Change: An Evaluation of Past and Present Trends and Future Outlook. Special Report No. 425 in Applied Marine Science and Ocean Engineering. Virginia Institute of Marine Science, Gloucester Point, Virginia. [Available online at http://web.vims.edu/GreyLit/VIMS/sramsoe425.pdf]
83. Najjar, R. G., C. R. Pyke, M. B. Adams, D. Breitburg, C. Hershner, M. Kemp, R. Howarth, M. R. Mulholland, M. Paolisso, D. Secor, K. Sellner, D. Wardrop, and R. Wood, 2010: Potential climate-change impacts on the Chesapeake Bay. Estuarine, Coastal and Shelf Science, 86, 1-20, doi:10.1016/j.ecss.2009.09.026.
84. Georgetown Climate Center, cited 2012: State and Local Adaptation Plans. [Available online at http://georgetownclimate.org/node/3324]
85. Sussman, E., 2008: Reshaping municipal and county laws to foster green building, energy efficiency, and renewable energy. NYU Environmental Law Journal, 16, 1.
86. RGGI, 2012: Annual Report on the Market for RGGI CO2 Allowances: 2011, 40 pp., Potomac Economics. [Available online at www.rggi.org/docs/MM_2011_Annual_Report.pdf]
87. State of Massachusetts, cited 2012: Massachusetts General Laws, Part I, Title III, Ch. 30, Section 61. [Available online at http://www.malegislature.gov/Laws/GeneralLaws/PartI/TitleIII/Chapter30/Section61]
88. The Nature Conservancy, cited 2012: A Global Network for Coastal Resilience. Coastal Resilience. [Available online at http://www.coastalresilience.org]
89. Beck, M. W., B. Gilmer, Z. Ferdaña, G. T. Raber, C. C. Shepard, I. Meliane, J. D. Stone, A. W. Whelchel, M. Hoover, and S. Newkirk, 2013: Ch. 6: Increasing the resilience of human and natural communities to coastal hazards: Supporting decisions in New York and Connecticut. The Role of Ecosystems in Disaster Risk Reduction, F. G. Renaud, K. Sudmeier-Rieux, and M. Estrella, Eds., United Nations University press, 140-163.
90. Ferdaña, Z., S. Newkirk, A. W. Whelchel, B. Gilmer, and M. W. Beck, 2010: Ch. 6: Adapting to climate change: Building interactive decision support to meet management objectives for coastal conservation and hazard mitigation on Long Island, New York, USA. Building Resilience to Climate Change: Ecosystem-Based Adaptation and Lessons From the Field, Á. Andrade Pérez, B. Herrera Fernández, and R. Cazzolla Gatti, Eds., IUCN, International Union for Conservation of Nature, 73-87. [Available online at http://data.iucn.org/dbtw-wpd/edocs/2010-050.pdf]
91. Wilbanks, T., S. Fernandez, G. Backus, P. Garcia, K. Jonietz, P. Kirshen, M. Savonis, B. Solecki, and L. Toole, 2012: Climate Change and Infrastructure, Urban Systems, and Vulnerabilities. Technical Report to the U.S. Department of Energy in Support of the National Climate Assessment, 119 pp., Oak Ridge National Laboratory. U.S Department of Energy, Office of Science, Oak Ridge, TN. [Available online at http://www.esd.ornl.gov/eess/Infrastructure.pdf]
92. Sussman, E., 2009: Case study: Climate change adaptation planning guidance for local governments in the United States. Sustainable Development Law & Policy, 9, 11.
93. Engert, M., 2010: What’s in your tool box? Creative community outreach processes refurbish existing tools, American Bar Association Section of Environment Energy and Resources. Alternative Dispute Resolution Committee Newsletter, 9. [Available online at http://apps.americanbar.org/environ/committees/adr/newsletter/may10/ADR_May10.pdf]
16: NORTHEASTRefeRences
391 CLIMATE CHANGE IMPACTS IN THE UNITED STATES
94. New York State, 2011: Responding to Climate Change in New York State: The ClimAID Integrated Assessment for Effective Climate Change Adaptation in New York State. Vol. 1244, Blackwell Publishing, 649 pp. [Available online at http://onlinelibrary.wiley.com/doi/10.1111/j.1749-6632.2011.06331.x/pdf ]
95. NRC, 2010: Adapting to Impacts of Climate Change. America’s Climate Choices: Report of the Panel on Adapting to the Impacts of Climate Change. National Research Council. The National Academies Press, 292 pp. [Available online at http://www.nap.edu/catalog.php?record_id=12783]
96. Cole, W. D., 2008: Sea level rise: Technical guidance for Dorchester County Maryland Eastern Shore Resource Conservation and Development Council, 55 pp., Maryland Eastern Shore Resource Conservation & Development Council, Annapolis, MD. [Available online at http://www.dnr.state.md.us/dnrnews/pdfs/Dorchester.pdf]
Maryland Department of Natural Resources, 2008: Ch. 5: Phase I: Sea level rise and coastal storms. Report of the Maryland commission on climate change adaptation and response working group. Comprehensive Strateg y for Reducing Maryland’s Vulnerability to Climate Change, Maryland Department of Natural Resources, Maryland Department of Planning, 32. [Available online at http://www.mde.state.md.us/assets/document/Air/ClimateChange/Chapter5.pdf]
97. Delaware Coastal Programs, 2011: Preparing for Sea Level Rise: Development of a Sea level Rise Initiative. Sea Level Rise Initiative Project Compendium. [Available online at http://www.dnrec.delaware.gov/coastal/Documents/SeaLevelRise/SLRCompSept2011.pdf]
98. Wolfe, D. W., J. Beem-Miller, L. Chambliss, and A. Chatrchyan, 2011: Climate Change Facts: Farm Energy, Carbon, and Greenhouse Gases, 4 pp., Cornell Climate Change Program Work Team. [Available online at http://files.campus.edublogs.org/blogs.cornell.edu/dist/8/90/files/2009/09/farm_energy-zhts0p.pdf ]
99. Adger, W. N., S. Agrawala, M. M. Q. Mirza, C. Conde, K. O’Brien, J. Pulhin, R. Pulwarty, B. Smit, and K. Takahashi, 2007: Ch. 17: Assessment of adaptation practices, options, constraints and capacity. Climate Change 2007: Impacts, Adaptation and Vulnerability. Contribution of Working Group II to the Fourth Assessment Report of the Intergovernmental Panel on Climate Change, M. L. Parry, O. F. Canziani, J. P. Palutikof, P. J. van der Linden, and C. E. Hanson, Eds., Cambridge University Press, 717-743.
Wolfe, D. W., 2012: Ch. 2: Climate change solutions from the agronomy perspective. Handbook of Climate Change and Agroecosystems: Global and Regional Aspects and Implications, D. Hillel, and C. Rosenzweig, Eds., Imperial College Press, 11-30.
100. DeGaetano, A. T., 2009: Time-dependent changes in extreme-precipitation return-period amounts in the continental United States. Journal of Applied Meteorolog y and Climatolog y, 48, 2086-2099, doi:10.1175/2009jamc2179.1. [Available online at http://journals.ametsoc.org/doi/pdf/10.1175/2009JAMC2179.1]
101. Jain, S., E. Stancioff, and A. Gray, cited 2012: Coastal Climate Adaptation in Maine’s Coastal Communities: Governance Mapping for Culvert Management. [Available online at http://umaine.edu/maineclimatenews/archives/spring-2012/coastal-climate-adaptation-in-maines-coastal-communities/]
102. Lenton, T., A. Footitt, and A. Dlugolecki, 2009: Major Tipping Points in the Earth’s Climate System and Consequences for the Insurance Sector, 89 pp., World Wide Fund for Nature, Gland, Switzerland and Munich, Germany. [Available online at http://assets.worldwildlife.org/publications/386/files/original/Major_Tipping_Points_in_the_Earth’s_Climate_System_and_Consequences_for_the_Insurance_Sector.pdf?1345749585]
103. NPCC, 2009: Climate Risk Information, 74 pp., New York City Panel on Climate Change. [Available online at http://www.nyc.gov/html/om/pdf/2009/NPCC_CRI.pdf]
392 CLIMATE CHANGE IMPACTS IN THE UNITED STATES
16: NORTHEAST
SUPPLEMENTAL MATERIALTRACEABLE ACCOUNTS
Process for Developing Key Messages: Results of the Northeast Regional Climate assessment workshop that was held on November 17-18, 2011, at Columbia University, with approximately 60 attendees, were critically important in our assessment. The workshop was the beginning of the process that led to the foundational Technical Input Report (TIR).
2 That 313-
page report consisted of seven chapters by 13 lead authors and more than 60 authors in total. Public and private citizens or insti-tutions who service and anticipate a role in maintaining support for vulnerable populations in Northeast cities and communities indicated that they are making plans to judge the demand for ad-aptation services. These stakeholder interactions were surveyed and engaged in the preparation of this chapter. We are confident that the TIR authors made a vigorous attempt to engage various agencies at the state level and non-governmental organizations (NGOs) that have broader perspectives.
The author team engaged in multiple technical discussions via teleconferences, which included careful review of the foundational TIR
2 and approximately 50 additional technical inputs provided
by the public, as well as the other published literature and profes-sional judgment. Discussions were followed by expert deliberation of draft key messages by the authors and targeted consultation with additional experts by the lead author of each key message.
Key message #1 Traceable accounT
Heat waves, coastal flooding, and river flooding will pose a growing challenge to the region’s envi-ronmental, social, and economic systems. This will increase the vulnerability of the region’s residents, especially its most disadvantaged populations.
Description of evidence baseThe key message and supporting text summarizes extensive evidence documented in the Northeast Technical Input Report.
2
Nearly 50 Technical Input reports, on a wide range of topics, were also received and reviewed as part of the Federal Register Notice solicitation for public input.
Numerous peer-reviewed publications (including many that are not cited) describe increasing hazards associated with sea level rise and storm surge, heat waves, and intense precipitation and river
flooding for the Northeast. For sea level rise (SLR), the authors relied on the NCA SLR scenario
12 and research by the authors
on the topic (for example, Horton et al. 201051
). Recent work26
summarizes the literature on heat islands and extreme events. For a recent study on climate in the Northeast,
3 the authors worked
closely with the region’s state climatologists on both the climatol-ogy and projections.
The authors also considered many recent peer-reviewed publica-tions
29,32,34,44 that describe how human vulnerabilities to climate
hazards in the region can be increased by socioeconomic and other factors. Evaluating coupled multi-system vulnerabilities is an emerging field; as a result, additional sources including white papers
3 have informed this key message as well.
To capture key issues, concerns, and opportunities in the region, various regional assessments were also consulted, such as PlaNYC (http://www.nyc.gov/html/planyc2030) and Boston’s Climate Plan (http://www.cityofboston.gov/Images_Documents/A%20Cli-mate%20of%20Progress%20-%20CAP%20Update%202011_tcm3-25020.pdf).
New information and remaining uncertaintiesImportant new evidence (cited above) confirmed many of the find-ings from a prior Northeast assessment
10 (see http://nca2009.
globalchange.gov/northeast).
The evidence included results from improved models and updated observational data (for example, Liu et al. 2012; Parris et al. 2012; Sallenger et al. 2012
5,9,12). The current assessment includ-
ed insights from stakeholders collected in a series of distributed engagement meetings that confirm its relevance and significance for local decision-makers; examples include a Northeast Listening Session in West Virginia, a kickoff meeting in New York City, and New York City Panel on Climate Change meetings.
There is wide diversity of impacts across the region driven by both exposure and sensitivity that are location and socioeconomic con-text specific. Future vulnerability will be influenced by changes in demography, economics, and policies (development and climate driven) that are difficult to predict and dependent on international and national considerations. Another uncertainty is the potential
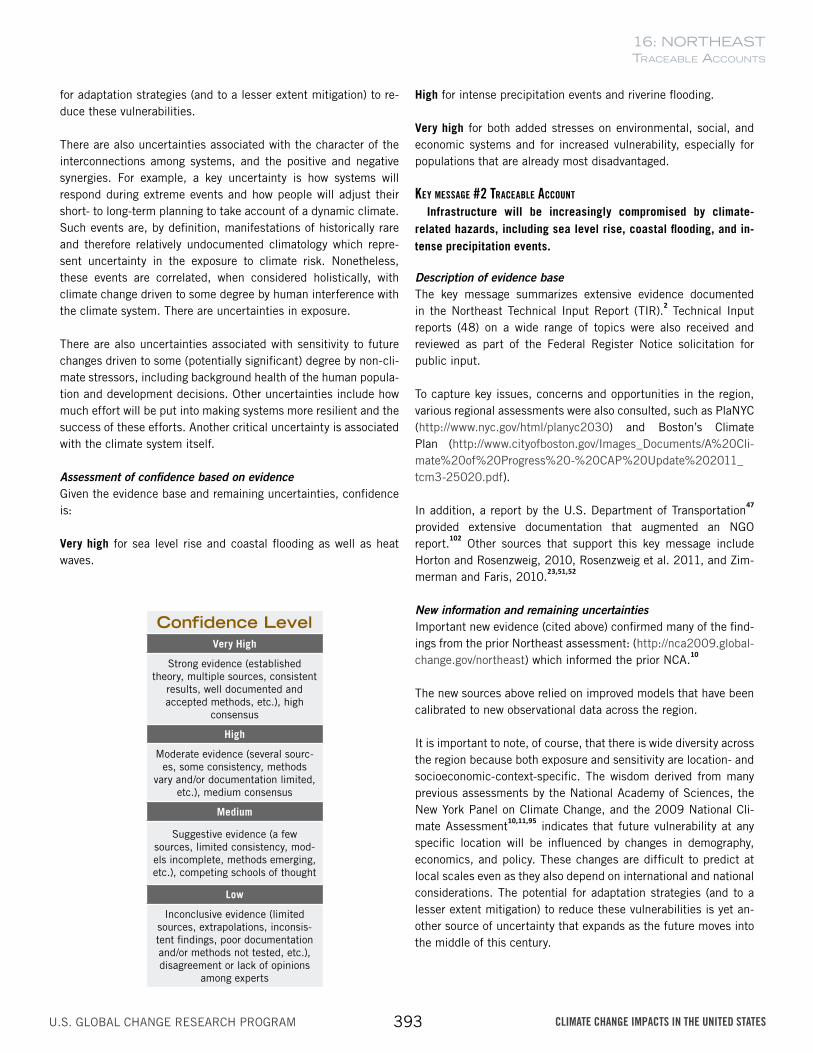
16: NORTHEASTTRaceable accounTs
393 CLIMATE CHANGE IMPACTS IN THE UNITED STATES
for adaptation strategies (and to a lesser extent mitigation) to re-duce these vulnerabilities.
There are also uncertainties associated with the character of the interconnections among systems, and the positive and negative synergies. For example, a key uncertainty is how systems will respond during extreme events and how people will adjust their short- to long-term planning to take account of a dynamic climate. Such events are, by definition, manifestations of historically rare and therefore relatively undocumented climatology which repre-sent uncertainty in the exposure to climate risk. Nonetheless, these events are correlated, when considered holistically, with climate change driven to some degree by human interference with the climate system. There are uncertainties in exposure.
There are also uncertainties associated with sensitivity to future changes driven to some (potentially significant) degree by non-cli-mate stressors, including background health of the human popula-tion and development decisions. Other uncertainties include how much effort will be put into making systems more resilient and the success of these efforts. Another critical uncertainty is associated with the climate system itself.
Assessment of confidence based on evidence Given the evidence base and remaining uncertainties, confidence is:
Very high for sea level rise and coastal flooding as well as heat waves.
High for intense precipitation events and riverine flooding.
Very high for both added stresses on environmental, social, and economic systems and for increased vulnerability, especially for populations that are already most disadvantaged.
Key message #2 Traceable accounT
Infrastructure will be increasingly compromised by climate-related hazards, including sea level rise, coastal flooding, and in-tense precipitation events.
Description of evidence baseThe key message summarizes extensive evidence documented in the Northeast Technical Input Report (TIR).
2 Technical Input
reports (48) on a wide range of topics were also received and reviewed as part of the Federal Register Notice solicitation for public input.
To capture key issues, concerns and opportunities in the region, various regional assessments were also consulted, such as PlaNYC (http://www.nyc.gov/html/planyc2030) and Boston’s Climate Plan (http://www.cityofboston.gov/Images_Documents/A%20Cli-mate%20of%20Progress%20-%20CAP%20Update%202011_tcm3-25020.pdf).
In addition, a report by the U.S. Department of Transportation47
provided extensive documentation that augmented an NGO report.
102 Other sources that support this key message include
Horton and Rosenzweig, 2010, Rosenzweig et al. 2011, and Zim-merman and Faris, 2010.
23,51,52
New information and remaining uncertaintiesImportant new evidence (cited above) confirmed many of the find-ings from the prior Northeast assessment: (http://nca2009.global-change.gov/northeast) which informed the prior NCA.
10
The new sources above relied on improved models that have been calibrated to new observational data across the region.
It is important to note, of course, that there is wide diversity across the region because both exposure and sensitivity are location- and socioeconomic-context-specific. The wisdom derived from many previous assessments by the National Academy of Sciences, the New York Panel on Climate Change, and the 2009 National Cli-mate Assessment
10,11,95 indicates that future vulnerability at any
specific location will be influenced by changes in demography, economics, and policy. These changes are difficult to predict at local scales even as they also depend on international and national considerations. The potential for adaptation strategies (and to a lesser extent mitigation) to reduce these vulnerabilities is yet an-other source of uncertainty that expands as the future moves into the middle of this century.
Confidence LevelVery High
Strong evidence (established theory, multiple sources, consistent
results, well documented and accepted methods, etc.), high
consensus
High
Moderate evidence (several sourc-es, some consistency, methods
vary and/or documentation limited, etc.), medium consensus
Medium
Suggestive evidence (a few sources, limited consistency, mod-els incomplete, methods emerging, etc.), competing schools of thought
Low
Inconclusive evidence (limited sources, extrapolations, inconsis-tent findings, poor documentation and/or methods not tested, etc.), disagreement or lack of opinions
among experts
16: NORTHEASTTRaceable accounTs
394 CLIMATE CHANGE IMPACTS IN THE UNITED STATES
Assessment of confidence based on evidence We have very high confidence in projected sea level rise and increased coastal flooding, and high confidence for increased intense precipitation events. This assessment of confidence is based on our review of the literature and submitted input and has been defended internally and externally in conversation with local decision-makers and representatives of interested NGOs, as well as the extensive interactions with stakeholders across the region reported in the Northeast TIR.
2
Very high confidence that infrastructure will be increasingly com-promised, based on the clear evidence of impacts on current in-frastructure from hazards such as Hurricane Irene, and from the huge deficit of needed renewal identified by a diverse engineering community.
46
Key message #3 Traceable accounT
Agriculture, fisheries, and ecosystems will be in-creasingly compromised over the next century by climate change impacts. Farmers can explore new crop options, but these adaptations are not cost- or risk-free. Moreover, adaptive capacity, which varies throughout the region, could be overwhelmed by a changing climate.
Description of evidence baseThe key message summarizes extensive evidence documented in the Northeast Technical Input Report.
2 Technical Input reports
(48) on a wide range of topics were also received and reviewed as part of the Federal Register Notice solicitation for public input. The Traceable Account for Key Message 1 provides the evidence base on sea level rise, flooding, and precipitation.
Various regional assessments were also consulted to capture key issues, concerns and opportunities in the region with particular focus on managed (agriculture and fisheries) and unmanaged (ecosystems) systems (for example, Buonaiuto et al. 2011; Wolfe et al. 2011
56,70,78).
Species and ecosystem vulnerability have been well documented historically in numerous peer-reviewed papers in addition to the ones cited in the TIR.
2 There have also been many examples of im-
pacts on agriculture of climate variability and change in the North-east (for example, Wolfe et al. 2008
57). Most note that there is
potential for significant benefits associated with climate changes to partially offset expected negative outcomes for these managed systems (for example, Hatfield et al. 2011
54)
New information and remaining uncertaintiesImportant new evidence (cited above, plus Najjar et. al. 2010,
83
for example) confirmed many of the findings from the prior North-east assessment (http://nca2009.globalchange.gov/northeast) which informed the 2009 NCA.
10
These new sources also relied on improved models that have been calibrated to new observational data across the region.
Agriculture, fisheries, and ecosystems in the Northeast are strong-ly linked to climate change and to other changes occurring outside the region and beyond the boundaries of the United States. These changes can influence the price of crops and agricultural inputs such as fertilizer, for example, as well as the abundance of eco-system and agricultural pests and the abundance and range of fish stocks. Other uncertainties include imprecise understandings of how complex ecosystems will respond to climate- and non-climate-induced changes and the extent to which organisms may be able to adapt to a changing climate.
Assessment of confidence based on evidence Based on our assessment, we have very high confidence for cli-mate impacts (especially sea level rise and storm surge) on eco-systems; and we have high confidence for climate impacts on agriculture (reduced to some degree, compared to our level of confidence about ecosystems, by uncertainty about the efficacy and implementation of adaptation options). Confidence in fisher-ies changes is high since confidence in both ocean warming and fish sensitivity to temperature is high.
Key message #4 Traceable accounT
While a majority of states and a rapidly growing number of municipalities have begun to incorporate the risk of climate change into their planning activi-ties, implementation of adaptation measures is still at early stages.
Description of evidence baseThe key message relies heavily on extensive evidence documented in the Northeast Technical Input Report (TIR).
2 Technical Input
reports (48) on a wide range of topics were also received and reviewed as part of the Federal Register Notice solicitation for public input. Many of the key references cited in the TIR reflected experiences and processes developed in iterative stakeholder en-gagement concerning risk management
94,103 that have been heav-
ily cited and employed in new venues – local communities like Keane (NH) and New York City, for example.
Various regional assessments were also consulted to capture key issues, concerns and opportunities in the region (for example, for Delaware, Maine, Maryland, and Long Island, NY). In addition, there have been agency and government white paper reports de-scribing proposed adaptation strategies based on climate impact assessments.
11,90 We discovered that 10 of the 12 states in the
Northeast have statewide adaptation plans in place or under de-velopment (many plans can be found at: http://georgetownclimate.org/node/3324).
16: NORTHEASTTRaceable accounTs
395 CLIMATE CHANGE IMPACTS IN THE UNITED STATES
New information and remaining uncertaintiesThat most Northeast states have begun to plan for adaptation is a matter of record. That few adaptation plans have been imple-mented is confirmed in Technical Inputs submitted to the National Climate Assessment process as well as prior assessments (http://nca2009.globalchange.gov/northeast), which informed the 2009 NCA.
10
Key uncertainties looking forward include: 1) the extent to which proposed adaptation strategies will be implemented given a range of factors including competing demands and limited funding; 2) the role of the private sector and individual action in adaptation, roles which can be difficult to document; 3) the extent of the federal role in adaptation planning and implementation; and 4) how changes in technology and the world economy may change the feasibility of specific adaptation strategies.
11
Assessment of confidence based on evidence This Key Message is simply a statement of observed fact, so con-fidence language is not applicable.
Related Documents