infrastructure-intelligence.com kut.org Transportation Policy Brief #3 North Carolina’s Strategic Mobility Plan TxDOT 0-6581-Task 19-3 Project Directors: Leigh B. Boske, Ph.D., Professor, Lyndon B. Johnson School of Public Affairs, The University of Texas at Austin Robert Harrison, Deputy Director, Center for Transportation Research, The University of Texas at Austin

Welcome message from author
This document is posted to help you gain knowledge. Please leave a comment to let me know what you think about it! Share it to your friends and learn new things together.
Transcript
infr
astr
uctu
re-in
telli
genc
e.co
mku
t.org
Transportation Policy Brief #3
North Carolina’sStrategic Mobility Plan
TxDOT 0-6581-Task 19-3
Project Directors:
Leigh B. Boske, Ph.D., Professor, Lyndon B. Johnson School of Public Affairs,The University of Texas at Austin
Robert Harrison, Deputy Director, Center for Transportation Research, The University of Texas at Austin
Transportation Policy Brief #3
North Carolina’s Strategic Mobility Formula

ii
iii
POLICY RESEARCH PROJECT PARTICIPANTS Students:
• Gregory Conte, B.S. (Hospitality Administration), Boston University; M.S. (Intelligence and National Security Studies), The University of Texas at El Paso
• Jane Santa Cruz, B.A. (History), B.A. (Spanish), Hendrix College • Paul Gainey, B.S., (American Politics and Law), United States Naval Academy • Miranda Hoff, B.A. (Government and Latin), The University of Texas at Austin • Corey Howell, B.A. (Government), The University of Texas at Austin • Salima Hakim Khan, B.A. (Business Administration), Institute of Business Administration,
Karachi, Pakistan • Kyle McNew, B.A. (English Literature), Penn State University • Kevin Merrill, B.S. (Political Science), Texas A&M University • John Montgomery, B.A. (Government and History), The University of Texas at Austin • Benjamin Moriarty, B.A. (Journalism and Psychology), University of Massachusetts
Amherst • Vivek Nath, B.S. (Electrical Engineering), Georgia Institute of Technology • Hector Rojas, B.A. (Anthropology), The University of Nevada Las Vegas • Vance Roper, B.A. (Political Science), Saint Edwards University • Jacob E. Thayer, B. A. (Political Science), The George Washington University • Tiffany Wu, B.S. (Chemical Engineering), The University of Texas at Austin • Wu Zheng, B.S. (Computer Science), B.A. (Physics), The University of Texas at Austin;
M.S. (Computer Science), The University of Texas at Austin
Project Directors: • Leigh B. Boske, Ph.D., Professor, Lyndon B. Johnson School of Public Affairs, The
University of Texas at Austin • Robert Harrison, Deputy Director, Center for Transportation Research, The University of
Texas at Austin

iv
v
TABLE OF CONTENTS
Foreword ........................................................................................................................................ vii
Acknowledgements ....................................................................................................................... viii
Executive Summary ......................................................................................................................... 1
Background ..................................................................................................................................... 1
Key Policy Issues.............................................................................................................................. 2
Development of Prioritization Method ....................................................................................... 2
Method of Prioritization .............................................................................................................. 3
Method of Funding ...................................................................................................................... 4
Lessons Learned .............................................................................................................................. 6
Participation by All Related Parties ............................................................................................. 7
Competing Modes of Transportation .......................................................................................... 7
Economic Development .............................................................................................................. 8
Relevance to Texas .......................................................................................................................... 8
Physical Similarities ..................................................................................................................... 9
Political Similarities ...................................................................................................................... 9
Economic Similarities ................................................................................................................. 10
What Texas is Doing Now .......................................................................................................... 10
Bibliography .................................................................................................................................. 11
Appendix 1: Contacts .................................................................................................................... 13
Appendix 2: NCDOT Transportation Modes and Tiers ................................................................. 15
Appendix 3: NCDOT Modes of Transportation Scoring Criteria ................................................... 17
Appendix 4: NCDOT Funding Breakdown ..................................................................................... 31
Appendix 5: Prioritization 3.0 Schedule ........................................................................................ 33
Appendix 6: Texas Department of Transportation Funding Streams ........................................... 35
Appendix 7: Unified Transportation Plan Funding/Project Relationships .................................... 37

vi
vii
FOREWORD
The Lyndon B. Johnson School of Public Affairs, The University of Texas at Austin, has established interdisciplinary research on policy problems as the core of its educational program. A major part of this program is the nine-month policy research project (PRP), in the course of which two or more faculty members from different disciplines direct the research of 10 to 20 graduate students of diverse backgrounds on a policy issue of concern to a government or nonprofit agency.
During the 2013–2014 academic year, the Texas Department of Transportation (TxDOT) funded, through the Center of Transportation Research (CTR), a policy research project addressing seven key policy issues.
The research team interacted with TxDOT officials throughout the course of the academic year. Overall direction and guidance was provided by Mr. Phil Wilson, former Executive Director of TxDOT. Mr. Wilson participated in an October 10, 2013 workshop to determine the scope of the study. As a consequence, the following policy issues were selected for study:
• Air Transportation and Logistics • Autonomous Vehicles in Texas • North Carolina’s Strategic Mobility Formula • Oregon’s Voluntary Road User Charge Program • Potential Use of Highway Rights-of-Way for Oil and Natural Gas Pipelines • State Energy Severance Taxes and Comparative Tax Revenues • U.S.-Mexico Transportation and Logistics The findings of each policy issue are presented within the context of separate
transportation policy briefs. This particular policy brief, “North Carolina’s Strategic Mobility Formula,” was researched and written by Jacob Thayer and Tiffany Wu.
The following template was also approved for each of the above-mentioned briefs: • Executive Summary • Background • Key Issues • Lessons Learned • Relevance to Texas • Appendices
viii
ACKNOWLEDGEMENTS
This policy research project would not have been possible without the generous contributions of assistance from numerous individuals and organizations. Useful contacts are provided in Appendix 1 of each policy brief. As previously mentioned, overall direction and guidance was provided by Mr. Phil Wilson, TxDOT’s former Executive Director. We are also indebted to the following TxDOT officials for participating in weekly class presentations or scheduled interviews, sharing information and data, and suggesting useful contacts:
• John Barton, P.E., Deputy Executive Director/Chief Engineer • James Bass, Chief Financial Officer • Oliver “Jay” Bond, Legislative Liaison, State Legislative Affairs Office • Jessica Butler, Unified Transportation Program Coordinator • Shannon Crum, Ph.D., Director, Research and Technology Implementation Office • Will Etheredge, Financial Analyst, Finance Division • David Fulton, Director, Aviation Division • Jerry Haddican, J.D., Director, State Legislative Affairs Office • Caroline Mays, Freight Planning Branch Manager • Peggy Thurin, Systems Planning Branch Manager • Lanny Wadle, Deputy Director, Finance Division • Marc Williams, P.E., Director of Planning
1
EXECUTIVE SUMMARY
In 2013, the North Carolina Department of Transportation (NCDOT), in partnership with the North Carolina General Assembly, took a unique and innovative approach to prioritization. NCDOT structured the Strategic Mobility Formula (SMF) with the end goal that all modes of transportation would compete for the same pool of money. NCDOT defines these modes of transportation as highway, passenger rail, freight rail, ferry, aviation, public transportation, and pedestrian/bicycle. NCDOT has worked with the North Carolina General Assembly since 2009 to base their prioritization on quantitative data rather than qualitative measures. They produced prioritization methods P1.0 and P2.0 in 2009 and 2011, respectively, and are currently on the third iteration of the prioritization methodology, P3.0, which contains the SMF. The SMF is projected to increase the number of new projects NCDOT can work on in a ten-year period from 175 to 260 (which is an increase of 175,000 jobs to 240,000) and will go into full effect in 2015.
Each potential NCDOT project receives a score based on criteria created by a work group set up by NCDOT, and then NCDOT ranks the projects based on these scores. NCDOT funds these projects in accordance with House Bill 817, also known as the Strategic Transportation Investment Bill. This law states that the SMF will receive funding via the state Highway Trust Fund and federal funds with exceptions and conditions. The amount of funds available to the SMF is approximately 6% of NCDOT’s total funds. The concept for the next stage of prioritization, or P4.0, is to have all modes under one formula competing for funding, rather than using the separate formulas they will use under P3.0. Since both Texas and North Carolina are facing growing population and decreasing revenue, TxDOT should identify any lessons that can be learned from NCDOT’s innovative approach to prioritization.
BACKGROUND
The North Carolina Department of Transportation (NCDOT) originated with the State Highway Commission, formed in 1915. Today’s NCDOT came into being in 1979. North Carolina has one of the largest state highway systems in the United States with over 80,214 miles in the system.1 The State of North Carolina owns and maintains that mileage, while cities maintain the other roads. The state has only one county road. NCDOT geographically administers its system through seven geographic regions. Each region is then subdivided into two divisions.
This massive road system places a burden on the state, especially in tough economic times, such as the recession from which the nation is currently emerging. In some respects, North Carolina’s political climate is similar to that of Texas. The state legislature tends to be conservative and, therefore, is hesitant to raise or implement new taxes.
North Carolina is also rapidly growing. CNNMoney compiled a list of the ten-fastest-growing U.S. cities in the decade from 2000 to 2010.2 Charlotte and Raleigh were number one
1 Hartgen et al., 2013. 2 Christie, 2012.
2
and two on the list, respectively. Charlotte, a transportation hub, experienced a population growth of 65% in that decade. The city is now the second-largest financial hub in the country, after New York City. Raleigh, an anchor city of the “Research Triangle” along with Durham and Chapel Hill, grew 63%; the technology sector is important in this part of the state. In addition, both cities have enjoyed growth as burgeoning retirement communities.
Considering the need to provide transit options to support the growth while reducing expenses (given the lack of political will to increase tax- or fee-based revenue), NCDOT created the Strategic Mobility Formula (SMF). It replaces two previous prioritization methods (P1.0 from 2009 and P2.0 from 2011) which initiated the shift to prioritizing specific types of projects or modes of transportation based on congestion relief and other factors. While funding constraints exist for highway and non-highway projects, this is the first attempt at including other modes of transportation into NCDOT’s prioritization method. NCDOT hopes to prove that data-driven prioritization is the optimal way to fund capital projects.3 In the future, they seek to finalize good index rubrics for allocating funds to projects by 2015, and then create a multivariable formula that encapsulates all modes of transportation into one funding scheme by 2017. Additionally, they seek to have the General Assembly free up the restrictions even more, so that an even greater percentage of funds can flow through the formula.
KEY POLICY ISSUES
NCDOT publishes and implements a new project prioritization methodology every two years. The most recent is the SMF, also known as the Strategic Transportation Initiative (STI). The Strategic Transportation Investments Bill (House Bill 817) details the scoring criteria and available funding for the SMF. NCDOT assisted the Assembly in creating House Bill 817 in order to elevate the use of the criteria.4
DEVELOPMENT OF PRIORITIZATION METHOD
As stated earlier, prioritization began in North Carolina in 2009 with their P1.0 structure. Newly inaugurated Governor Beverly Purdue’s Executive Order Number 2 prompted the effort to move toward data-driven decisions.5 NCDOT’s first prioritization scheme focused primarily on highway projects. Index scoring led the decision-making process; however, at the time this process relied on qualitative methods, rather than quantitative.
The highway projects were chosen based on a mix of these three attributes: quantitative (volume-to-capacity ratios, crash rates, and pavement condition ratings, etc.), qualitative (top-25 priorities of each metropolitan planning organization [MPO], rural transportation planning organization [RPO], and division), and multimodal characteristic (e.g., a hub that allowed more than one transportation option). 6 Statewide, regional, and sub-regional stakeholders
3 Patel et al., 2013. 4 Patel et al., 2013. 5 North Carolina Department of Transportation, 2010. 6 Ibid.
3
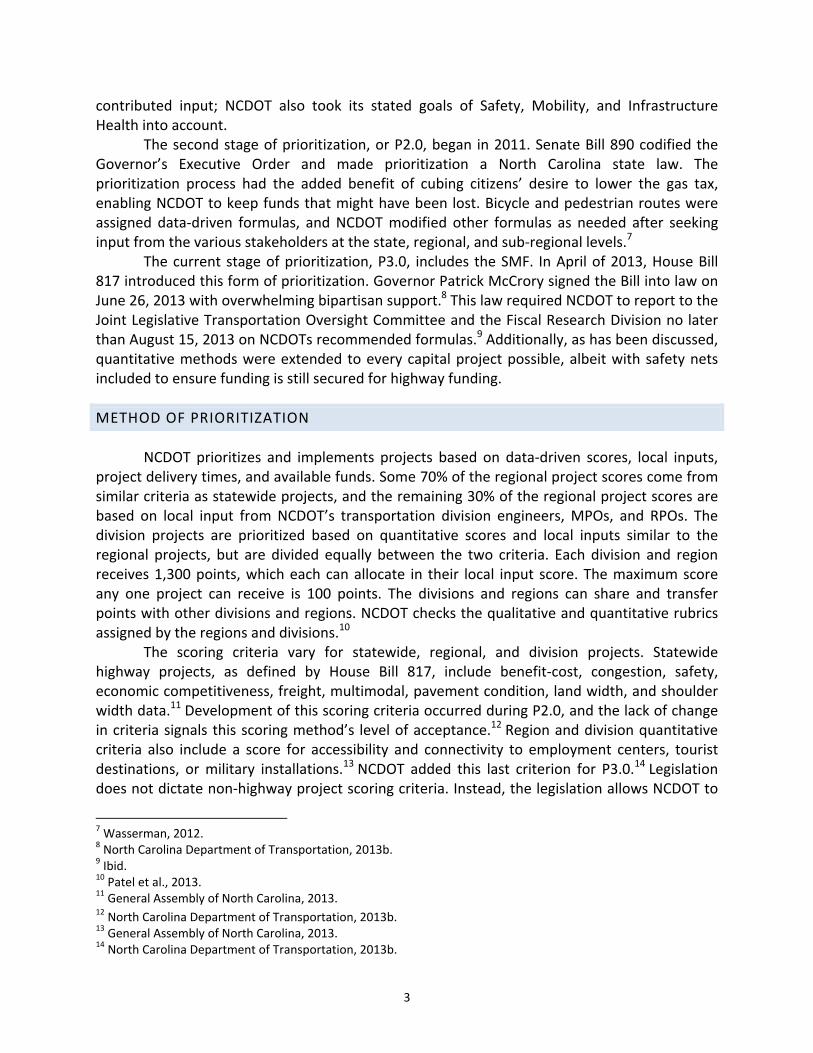
contributed input; NCDOT also took its stated goals of Safety, Mobility, and Infrastructure Health into account.
The second stage of prioritization, or P2.0, began in 2011. Senate Bill 890 codified the Governor’s Executive Order and made prioritization a North Carolina state law. The prioritization process had the added benefit of cubing citizens’ desire to lower the gas tax, enabling NCDOT to keep funds that might have been lost. Bicycle and pedestrian routes were assigned data-driven formulas, and NCDOT modified other formulas as needed after seeking input from the various stakeholders at the state, regional, and sub-regional levels.7
The current stage of prioritization, P3.0, includes the SMF. In April of 2013, House Bill 817 introduced this form of prioritization. Governor Patrick McCrory signed the Bill into law on June 26, 2013 with overwhelming bipartisan support.8 This law required NCDOT to report to the Joint Legislative Transportation Oversight Committee and the Fiscal Research Division no later than August 15, 2013 on NCDOTs recommended formulas.9 Additionally, as has been discussed, quantitative methods were extended to every capital project possible, albeit with safety nets included to ensure funding is still secured for highway funding.
METHOD OF PRIORITIZATION
NCDOT prioritizes and implements projects based on data-driven scores, local inputs, project delivery times, and available funds. Some 70% of the regional project scores come from similar criteria as statewide projects, and the remaining 30% of the regional project scores are based on local input from NCDOT’s transportation division engineers, MPOs, and RPOs. The division projects are prioritized based on quantitative scores and local inputs similar to the regional projects, but are divided equally between the two criteria. Each division and region receives 1,300 points, which each can allocate in their local input score. The maximum score any one project can receive is 100 points. The divisions and regions can share and transfer points with other divisions and regions. NCDOT checks the qualitative and quantitative rubrics assigned by the regions and divisions.10
The scoring criteria vary for statewide, regional, and division projects. Statewide highway projects, as defined by House Bill 817, include benefit-cost, congestion, safety, economic competitiveness, freight, multimodal, pavement condition, land width, and shoulder width data.11 Development of this scoring criteria occurred during P2.0, and the lack of change in criteria signals this scoring method’s level of acceptance.12 Region and division quantitative criteria also include a score for accessibility and connectivity to employment centers, tourist destinations, or military installations.13 NCDOT added this last criterion for P3.0.14 Legislation does not dictate non-highway project scoring criteria. Instead, the legislation allows NCDOT to
7 Wasserman, 2012. 8 North Carolina Department of Transportation, 2013b. 9 Ibid. 10 Patel et al., 2013. 11 General Assembly of North Carolina, 2013. 12 North Carolina Department of Transportation, 2013b. 13 General Assembly of North Carolina, 2013. 14 North Carolina Department of Transportation, 2013b.
4
create the prioritization method contingent on the requirement that the scores are based on at least four quantitative criteria. Appendix 3 shows the scoring weights for each mode of transportation.
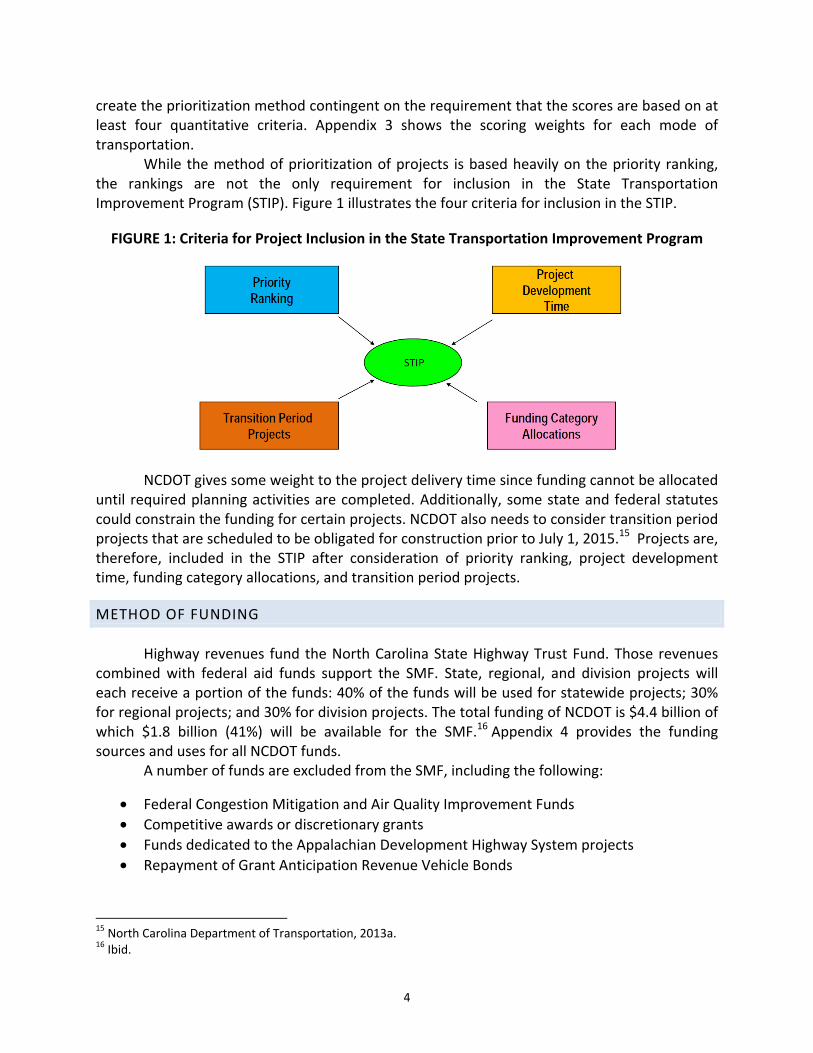
While the method of prioritization of projects is based heavily on the priority ranking, the rankings are not the only requirement for inclusion in the State Transportation Improvement Program (STIP). Figure 1 illustrates the four criteria for inclusion in the STIP.
FIGURE 1: Criteria for Project Inclusion in the State Transportation Improvement Program
NCDOT gives some weight to the project delivery time since funding cannot be allocated until required planning activities are completed. Additionally, some state and federal statutes could constrain the funding for certain projects. NCDOT also needs to consider transition period projects that are scheduled to be obligated for construction prior to July 1, 2015.15 Projects are, therefore, included in the STIP after consideration of priority ranking, project development time, funding category allocations, and transition period projects.
METHOD OF FUNDING
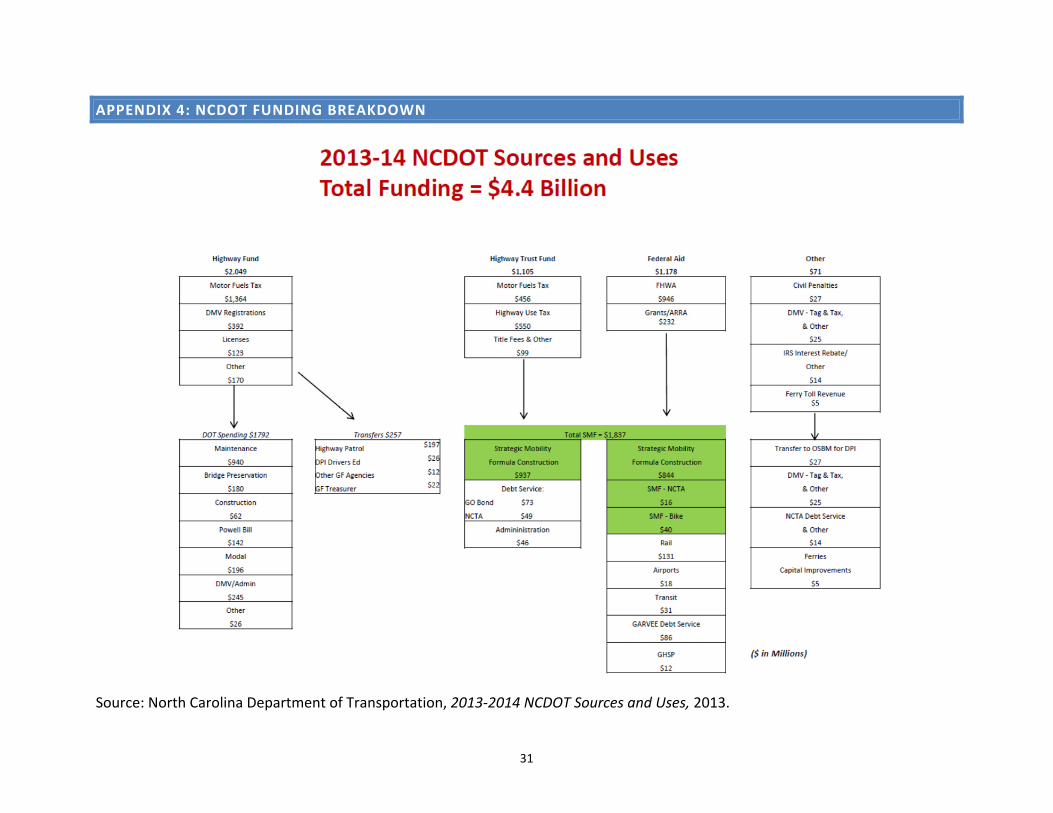
Highway revenues fund the North Carolina State Highway Trust Fund. Those revenues combined with federal aid funds support the SMF. State, regional, and division projects will each receive a portion of the funds: 40% of the funds will be used for statewide projects; 30% for regional projects; and 30% for division projects. The total funding of NCDOT is $4.4 billion of which $1.8 billion (41%) will be available for the SMF.16 Appendix 4 provides the funding sources and uses for all NCDOT funds.
A number of funds are excluded from the SMF, including the following:
• Federal Congestion Mitigation and Air Quality Improvement Funds • Competitive awards or discretionary grants • Funds dedicated to the Appalachian Development Highway System projects • Repayment of Grant Anticipation Revenue Vehicle Bonds
15 North Carolina Department of Transportation, 2013a. 16 Ibid.
5
• Funds already obligated for projects that are scheduled for construction as of April 1, 2013
Additionally, a number of projects that rely on federal programs or have alternative prioritization criteria are not included in the quantitative criteria detailed in the SMF but compete for the same funds. These projects fall under the following federal programs or conditions:
• Federal Surface Transportation Program • Federal Transportation Alternatives • Federal Railway-Highway Crossings Program • Federal funds for municipal roads • Time-critical job creation opportunities17
Projects with alternate prioritization criteria include the following:
• Bridge replacement • Interstate maintenance • Highway safety improvement projects
The bridge replacement program already has another prioritization methodology in place and dedicated funds. The interstate maintenance program also has dedicated funds and touches every highway in a ten-year period. Spot safety is defined by federally-approved safety spot programs.18
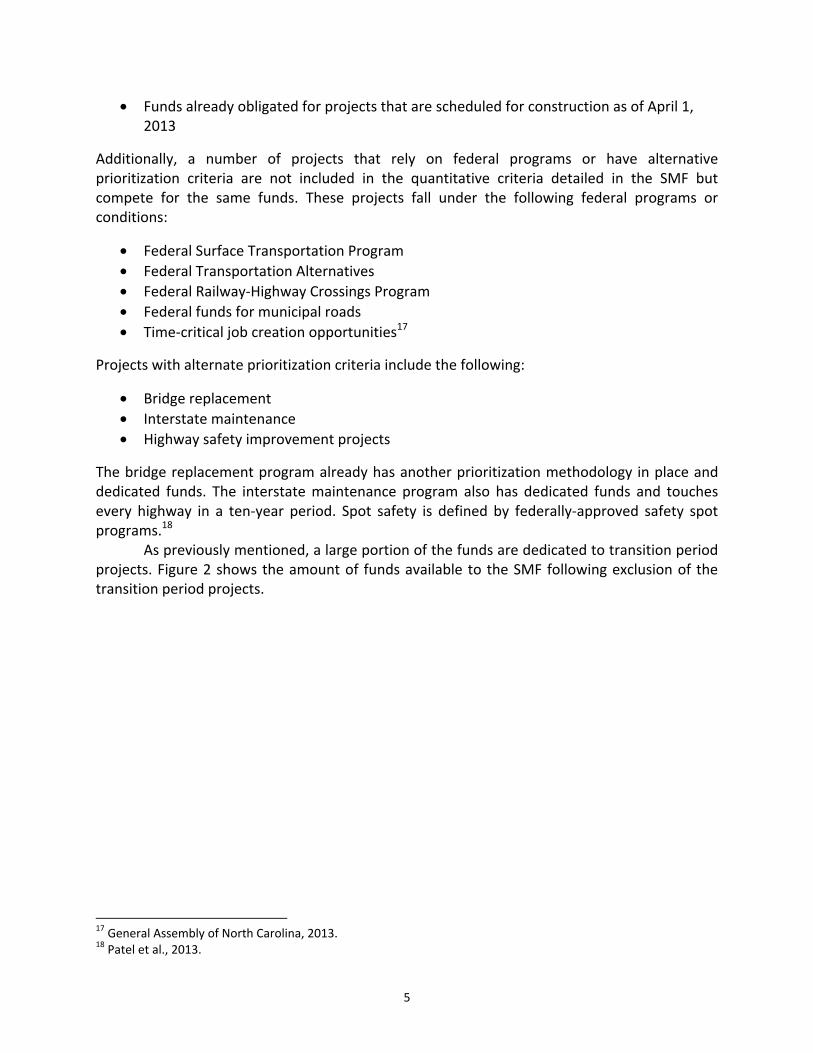
As previously mentioned, a large portion of the funds are dedicated to transition period projects. Figure 2 shows the amount of funds available to the SMF following exclusion of the transition period projects.
17 General Assembly of North Carolina, 2013. 18 Patel et al., 2013.
6
FIGURE 2: Funding for the Strategic Mobility Formula and Transition Period Projects
Committed funds will slowly dissipate through the years, allowing more projects to enter prioritization according to the new ranking scheme.
House Bill 817 dictates funding caps for individual projects and variance caps for funding groups. One cap requires funds for any one statewide project shall not exceed 10% of projected funds over a five-year period.19 The variance of funding distribution is dictated as follows:
• State, region, and division fund percentage variance must be less than 5% over a five-year period
• Among each region or division, variance must be less than 10% over a five-year period20
The purpose of these caps is to prevent unfair and drastic changes of the allocation of funds.
LESSONS LEARNED
Through the implementation of the strategic prioritization process, NCDOT has accumulated knowledge to successfully and continually improve their prioritization process. This portion of the paper focuses on the lessons learned for encouraging participation, comparing all modes of transportation, and including economic development in the prioritization process.
19 General Assembly of North Carolina, 2013. 20 Ibid.
7
PARTICIPATION BY ALL RELATED PARTIES
NCDOT attributes the success of the introduction of P3.0 to its work group, whose main purpose was to develop methods for project submittal and scoring. The original work group included local planners, but slowly grew to 25 members with representatives from MPOs, RPOs, advocacy groups, NCDOT staff, the Federal Highway Administration, and legislative research staff.21 The frequency of meetings increased from monthly (starting in May 2012) to weekly as more interests and responsibilities grew as well.22 The work group used a consensus approach, rather than a voting approach, to balance its members’ various interests and issued a memorandum of understanding (MOU) after each meeting. Despite differences of opinion, the work group was satisfied overall with the meetings and their results. One potential pitfall that NCDOT is conscious of is the possible attack on the data collected and used for its scoring criteria. NCDOT officials believe the best way to combat the possible criticism of its data is to be as transparent as possible.23 The work group has published each of its MOUs, and NCDOT will publish the final scores for each of the projects.
COMPETING MODES OF TRANSPORTATION
One major goal of the SMF is for all modes of transportation to compete based on one prioritization method. However, the work group quickly discovered a lack of precedent for this approach and had to consider options that allow all modes to compete for funding fairly. Thus, the SMF separates the modes into six separate formulas with varying scoring criteria. NCDOT plans to incorporate all modes of transportation into one formula in the future.24 One option originally considered was to require no normalization and to prioritize based solely on the scores produced by the formulas. On the state level, the work group decided this was adequate since very few modes of transportation actually compete. On the regional and division levels, relying solely on the scores was a weak form of comparison since many more modes of transportation were competing for funds, all with separate scoring criteria.25
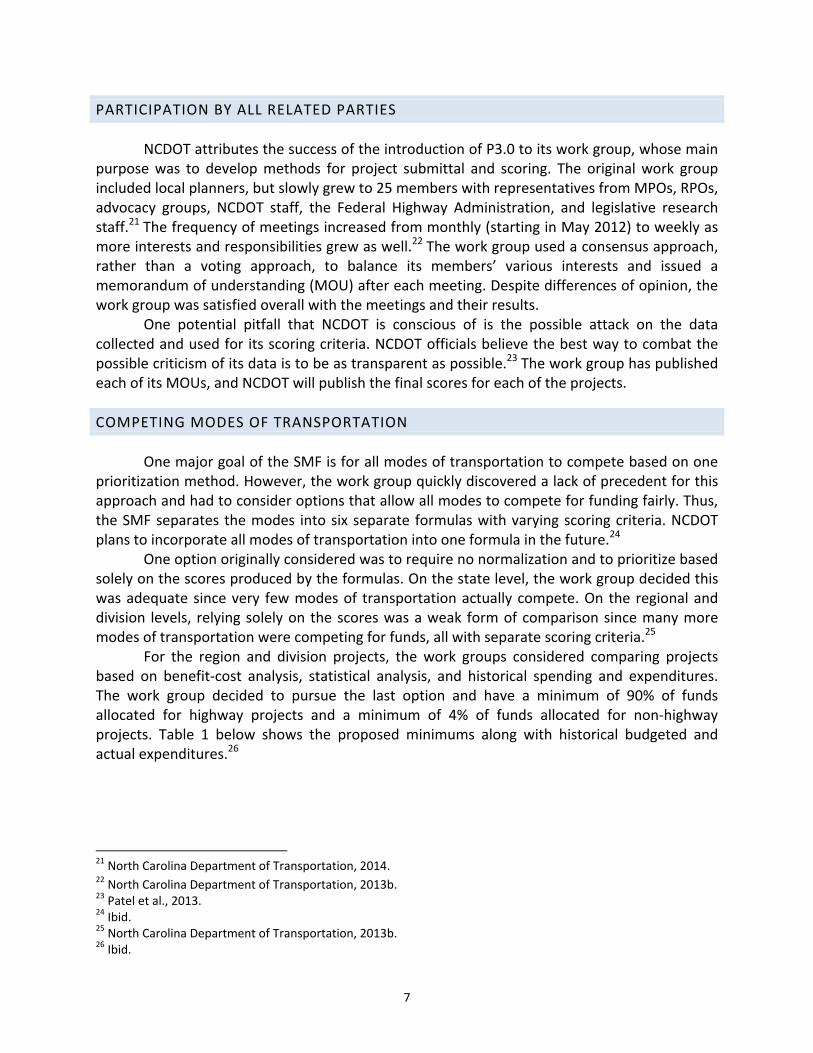
For the region and division projects, the work groups considered comparing projects based on benefit-cost analysis, statistical analysis, and historical spending and expenditures. The work group decided to pursue the last option and have a minimum of 90% of funds allocated for highway projects and a minimum of 4% of funds allocated for non-highway projects. Table 1 below shows the proposed minimums along with historical budgeted and actual expenditures.26
21 North Carolina Department of Transportation, 2014. 22 North Carolina Department of Transportation, 2013b. 23 Patel et al., 2013. 24 Ibid. 25 North Carolina Department of Transportation, 2013b. 26 Ibid.
8
TABLE 1: Proposed Minimum Funding Allocation for Regional and Division Projects
The scores from the SMF will then inform the prioritization of the projects within highway and non-highway modes of transportations. The work group suggested NCDOT pursue statistical analysis for implementation into P4.0. NCDOT plans to request an independent consultant to help them implement the normalization procedure based on statistical analysis.27
ECONOMIC DEVELOPMENT
NCDOT incorporates economic development into the SMF through an economic competitiveness criterion that is included in the highway project scoring. The economic competitiveness score is based on expected economic outcomes (not on current data). These economic outcomes are determined from Transportation Research Economic Development Impact System (TREDIS), which is an economic impact model. While TREDIS cannot predict the exact outcome, the industry recognizes TREDIS nationally as a reliable model. The work group did not increase the weight of economic competitiveness above 10% since it is based on predictive analysis. However, they are willing to increase it to 20% should NCDOT require it.28
NCDOT equally considers the change in gross domestic product (GDP) and job creation in its final score for economic competitiveness. The baseline GDP is calculated using Bureau of Labor Statistics data and is compared with Moody’s economic model, which projects the economy 30 years out by inputting expected travel-time savings, project location, and freight traffic. NCDOT only considers long-term employment effects in the scoring criteria although TREDIS measures both short-term and long-term employment impacts. 29
RELEVANCE TO TEXAS
Considering other states’ initiatives and policies, the foremost question to ask throughout the process is “Can that work here?” While Texas and North Carolina differ in some ways, they do share many similarities.
27 Ibid. 28 North Carolina Department of Transportation, n.d. 29 Ibid.
9
PHYSICAL SIMILARITIES
Both states have large state-controlled highway systems to operate and interstates that are major thoroughfares for long-distance travel and freight movement (north and south movement along the Eastern Seaboard in North Carolina, and transnational movement in Texas). Both also have coastlines with significant port operations, and hub airports for major airlines. NCDOT maintains 80,214 miles of highway (as of 2008).30 TxDOT oversees and maintains 80,212 miles of highway (as of 2008).31
POLITICAL SIMILARITIES
The governors of both states are Republican, and in both state legislatures, the Republican Party has a strong majority in both houses. Hence, both tend to be conservative and hesitant to raise taxes and fees, or create new ones, which can have a detrimental impact on the construction and maintenance of the state highway systems. With rates held in place for years, while operating costs rise, there is a strain on the highway system.
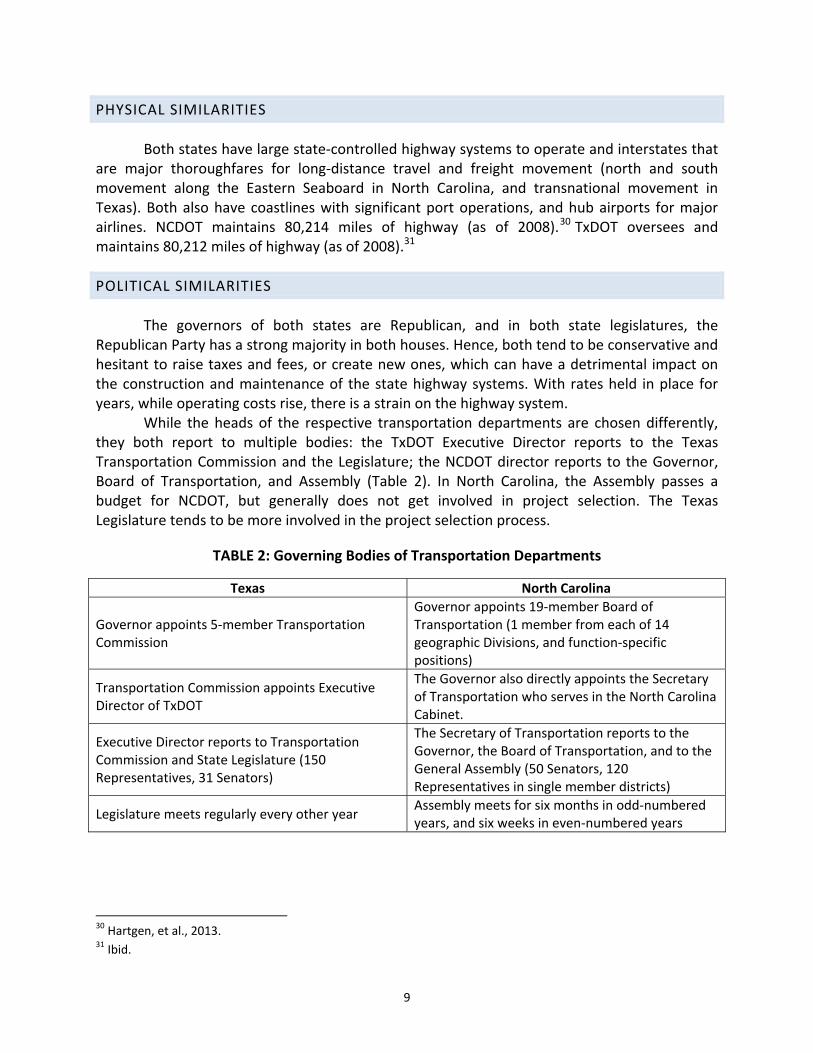
While the heads of the respective transportation departments are chosen differently, they both report to multiple bodies: the TxDOT Executive Director reports to the Texas Transportation Commission and the Legislature; the NCDOT director reports to the Governor, Board of Transportation, and Assembly (Table 2). In North Carolina, the Assembly passes a budget for NCDOT, but generally does not get involved in project selection. The Texas Legislature tends to be more involved in the project selection process.
TABLE 2: Governing Bodies of Transportation Departments
Texas North Carolina
Governor appoints 5-member Transportation Commission
Governor appoints 19-member Board of Transportation (1 member from each of 14 geographic Divisions, and function-specific positions)
Transportation Commission appoints Executive Director of TxDOT
The Governor also directly appoints the Secretary of Transportation who serves in the North Carolina Cabinet.
Executive Director reports to Transportation Commission and State Legislature (150 Representatives, 31 Senators)
The Secretary of Transportation reports to the Governor, the Board of Transportation, and to the General Assembly (50 Senators, 120 Representatives in single member districts)
Legislature meets regularly every other year Assembly meets for six months in odd-numbered years, and six weeks in even-numbered years
30 Hartgen, et al., 2013. 31 Ibid.
10
ECONOMIC SIMILARITIES
Both states have a burgeoning economy. Two North Carolina cities (Charlotte and Raleigh) held the first two positions in CNN’s top-ten list of cities that grew over 30% from 2000 to 2010.32 Three Texas cities are on the list (Austin, McAllen, and San Antonio).33 The technology sector is an important part of the economy in both Raleigh and Austin. Transportation agencies can tap into the talent provided by the companies, universities, and other locally based organizations to find creative ways to improve transportation planning and make the implementation process most efficient.
The diversity of economies is also similar in both states. North Carolina and Texas both have metropolitan areas with more than one million residents, but also have very rural areas, and consequently must create transportation plans that can encompass urban, suburban, and rural needs.
WHAT TEXAS IS DOING NOW
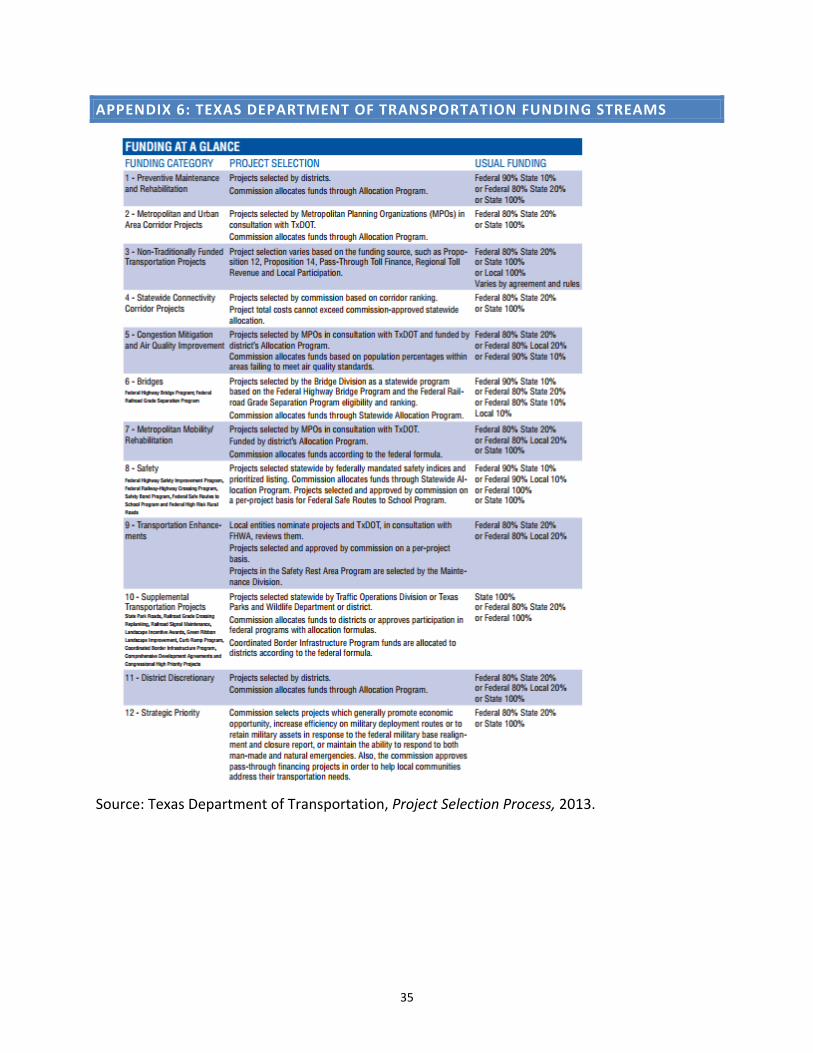
TxDOT funds its projects through 12 categories (included in Appendix 6: Texas Department of Transportation Funding Streams).34 Unlike NCDOT’s direct funding into modes of transportation, TxDOT funds through topical categories. The Texas Legislature also directly funds projects as witnessed by Rider 42, whereas the North Carolina General Assembly leaves project selection to NCDOT.35
TxDOT structures its prioritization in five tiers:
• 2-Year Letting Schedule • Statewide Transportation Improvement Program (4 years) • Unified Transportation Plan (10 years) • Metropolitan Transportation & Rural Transportation Plans (20 years) • Statewide Long-Range Transportation Plan (24 years)
Within this prioritization scheme, the Unified Transportation Plan (UTP) most closely resembles North Carolina’s SMF. The UTP contains some prioritization via a point system to assign points to projects. The scoring is based on three broad categories: Project Need, Funding Availability, and Project Readiness (with a slight advantage given to Project Need).
Texas could benefit from learning about the SMF, though the lessons learned will not be fully realized until the new SMF reaches full implementation in 2015. Once the method is implemented and feedback is provided from a variety of stakeholders, the SMF can be better analyzed for its ability to successfully achieve the desired goals.
32 Christie, 2012. 33 Ibid. 34 Texas Department of Transportation, 2013. 35 Lomax, 2013.
11
BIBLIOGRAPHY
Christie, Les. 10 Fastest Growing US Cities. 2012. http://money.cnn.com/galleries/2012/real_estate/1204/gallery.US-Cities/index.html
General Assembly of North Carolina. House Bill 817 Ratified Bill. 2013. http://www.ncleg.net/Sessions/2013/Bills/House/PDF/H817v9.pdf.
Hartgen, David and Ravi Karanam. 16th Annual Report on the Performance of State Highway Systems. Reason Foundation, 2007.
Hartgen, David T., M. Gregory Fields, and Elizabeth San Jose. 20th Annual Report on the Performance of State Highway Systems. Reason Foundation, 2013.
Lomax, Tim. Rider 42 & Texas Mobility Needs. Presentation, Mobility Investment Priorities, 2013.
North Carolina Department of Transportation. 2013-2014 NCDOT Sources and Uses. 2013. http://www.ncdot.gov/download/about/finance/2014BudgetSourcesUses.pdf
North Carolina Department of Transportation. "A Briefing Paper on Use of Economic Competitiveness in P3.0." n.d.
North Carolina Department of Transportation. "North Carolina Department of Transportation’s Strategic Prioritization Process." North Carolina Department of Transportation. June 2, 2010. https://connect.ncdot.gov/projects/planning/Planning%20Document%20Library/Prioritization%201.0%20Summary.pdf
North Carolina Department of Transportation. Policy to Projects. 2012. http://www.ncdot.gov/download/performance/ncdot_2012_policy_to_projects_web_draft.pdf
North Carolina Department of Transportation. "Report to the JLTOC." NCDOT. 2013. https://connect.ncdot.gov/projects/planning/MPORPODocuments/Report%20to%20the%20JLTOC.pdf
North Carolina Department of Transportation. Strategic Transportation Investments. 2014. https://connect.ncdot.gov/projects/planning/MPORPODocuments/STI_GeneralPresentation_updated%203-3-14.pdf
Patel, Alpesh, Susan Pulliam, and Don Voelker. Interview by Tiffany Wu and Jacob Thayer. Strategic Prioritization Office and Strategic Planning Office of NCDOT, 2013.
Texas Department of Transportation. 2014 UTP Public Meeting. Presentation, Austin: Texas Department of Transportation, 2013.
12
North Carolina Department of Transportation. Project Selection Process. Educational Series, Austin: Texas Department of Transportation, 2013.
Wasserman, David. "North Carolina’s Transportation Reform: Prioritization, Outreach, and Reality." North Carolina Department of Transportation, 2012. https://connect.ncdot.gov/projects/planning/Planning%20Document%20Library/Prioritization%202.0%20Presentation%20-%20July%202012.pdf
13
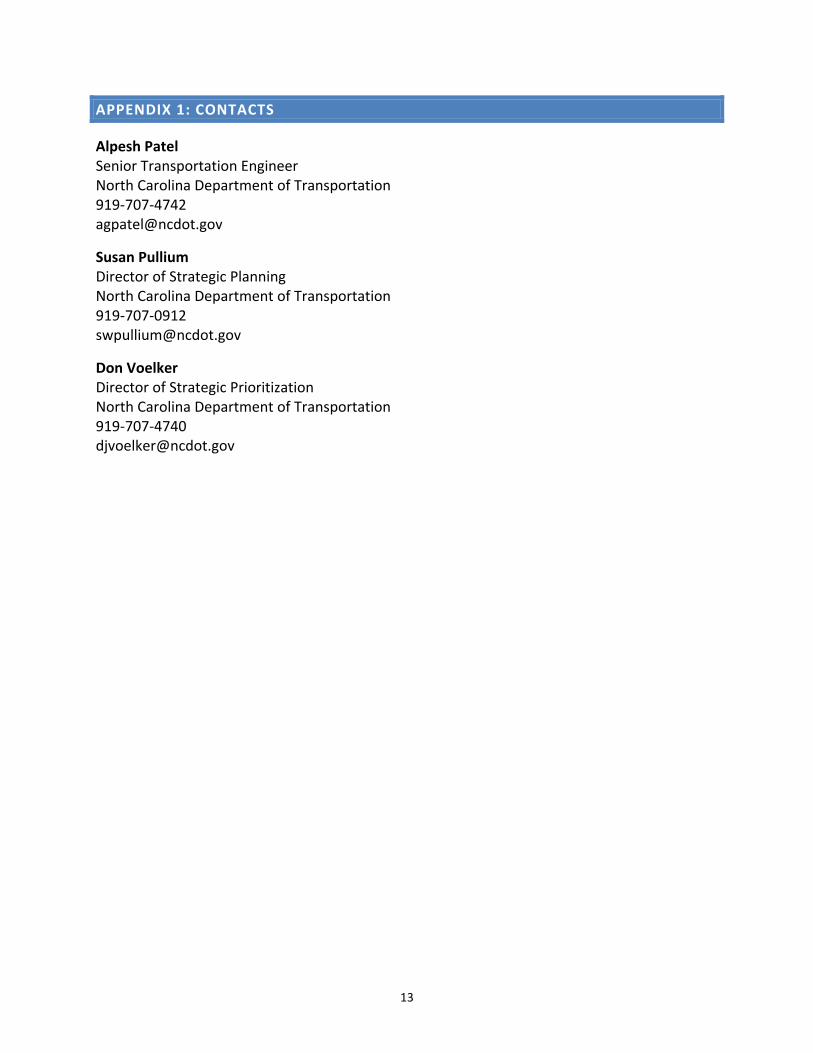
APPENDIX 1: CONTACTS
Alpesh Patel Senior Transportation Engineer North Carolina Department of Transportation 919-707-4742 [email protected]
Susan Pullium Director of Strategic Planning North Carolina Department of Transportation 919-707-0912 [email protected]
Don Voelker Director of Strategic Prioritization North Carolina Department of Transportation 919-707-4740 [email protected]

14
15
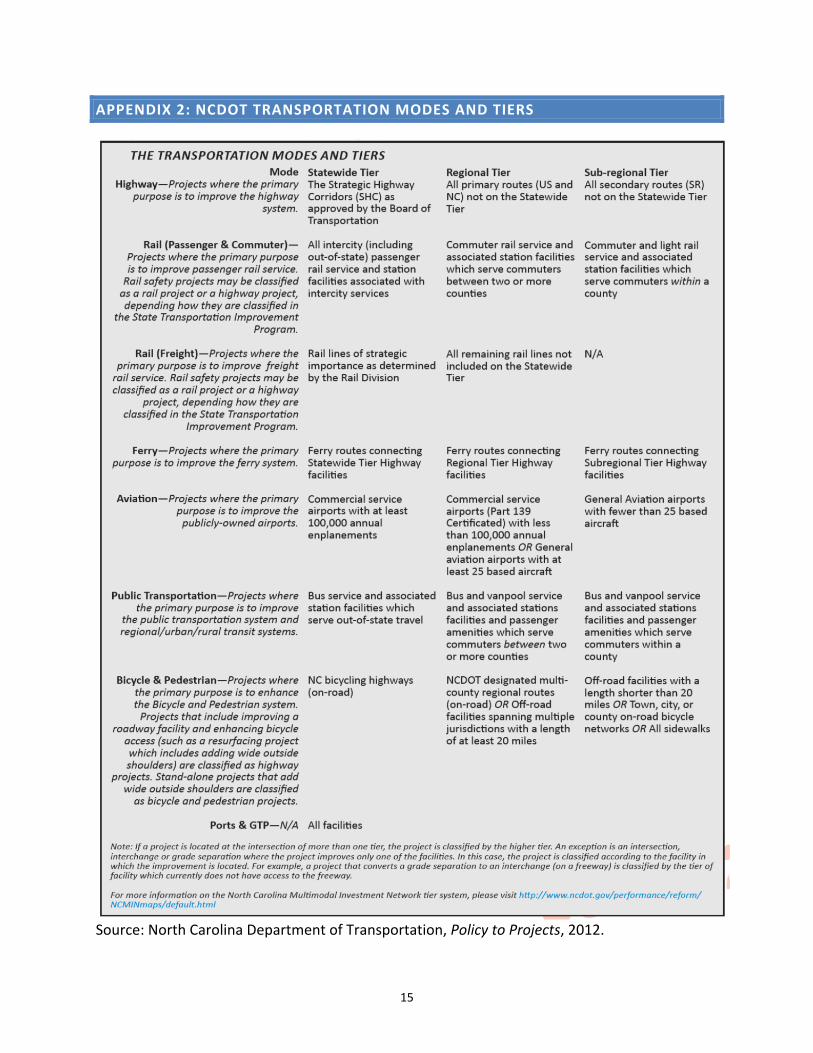
APPENDIX 2: NCDOT TRANSPORTATION MODES AND TIERS
Source: North Carolina Department of Transportation, Policy to Projects, 2012.

16
17
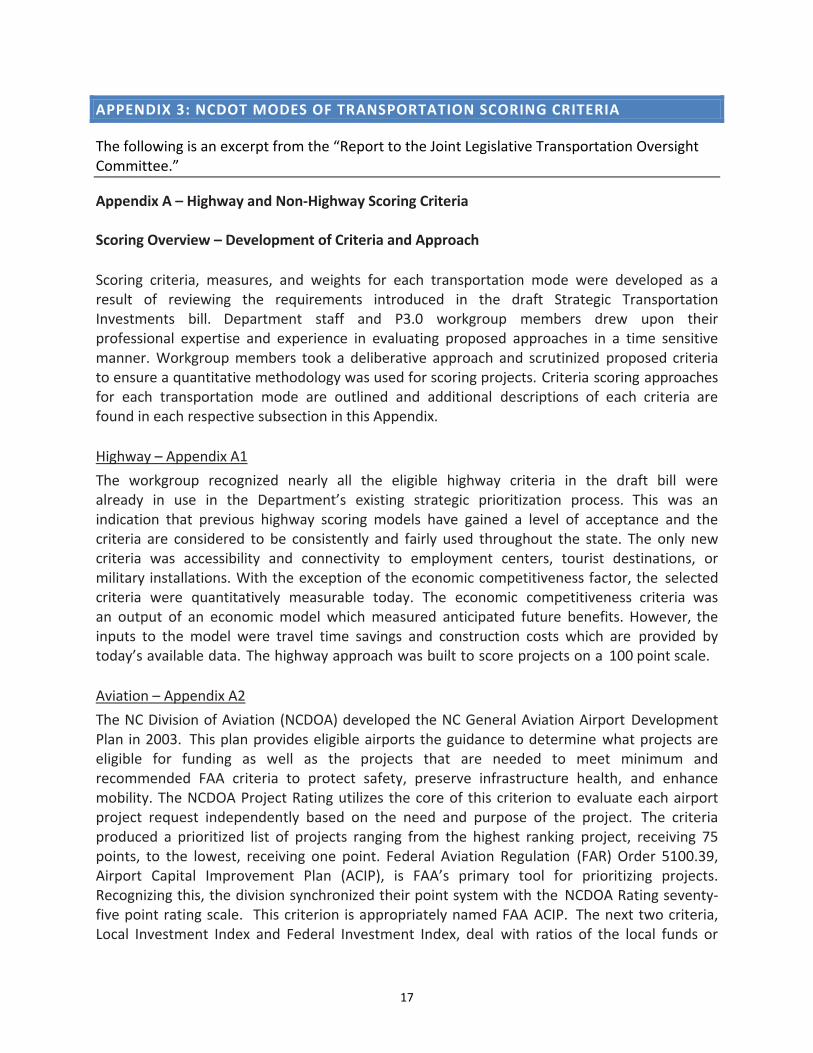
APPENDIX 3: NCDOT MODES OF TRANSPORTATION SCORING CRITERIA
The following is an excerpt from the “Report to the Joint Legislative Transportation Oversight Committee.”
Appendix A – Highway and Non-Highway Scoring Criteria Scoring Overview – Development of Criteria and Approach Scoring criteria, measures, and weights for each transportation mode were developed as a result of reviewing the requirements introduced in the draft Strategic Transportation Investments bill. Department staff and P3.0 workgroup members drew upon their professional expertise and experience in evaluating proposed approaches in a time sensitive manner. Workgroup members took a deliberative approach and scrutinized proposed criteria to ensure a quantitative methodology was used for scoring projects. Criteria scoring approaches for each transportation mode are outlined and additional descriptions of each criteria are found in each respective subsection in this Appendix. Highway – Appendix A1 The workgroup recognized nearly all the eligible highway criteria in the draft bill were already in use in the Department’s existing strategic prioritization process. This was an indication that previous highway scoring models have gained a level of acceptance and the criteria are considered to be consistently and fairly used throughout the state. The only new criteria was accessibility and connectivity to employment centers, tourist destinations, or military installations. With the exception of the economic competitiveness factor, the selected criteria were quantitatively measurable today. The economic competitiveness criteria was an output of an economic model which measured anticipated future benefits. However, the inputs to the model were travel time savings and construction costs which are provided by today’s available data. The highway approach was built to score projects on a 100 point scale. Aviation – Appendix A2 The NC Division of Aviation (NCDOA) developed the NC General Aviation Airport Development Plan in 2003. This plan provides eligible airports the guidance to determine what projects are eligible for funding as well as the projects that are needed to meet minimum and recommended FAA criteria to protect safety, preserve infrastructure health, and enhance mobility. The NCDOA Project Rating utilizes the core of this criterion to evaluate each airport project request independently based on the need and purpose of the project. The criteria produced a prioritized list of projects ranging from the highest ranking project, receiving 75 points, to the lowest, receiving one point. Federal Aviation Regulation (FAR) Order 5100.39, Airport Capital Improvement Plan (ACIP), is FAA’s primary tool for prioritizing projects. Recognizing this, the division synchronized their point system with the NCDOA Rating seventy-five point rating scale. This criterion is appropriately named FAA ACIP. The next two criteria, Local Investment Index and Federal Investment Index, deal with ratios of the local funds or
18
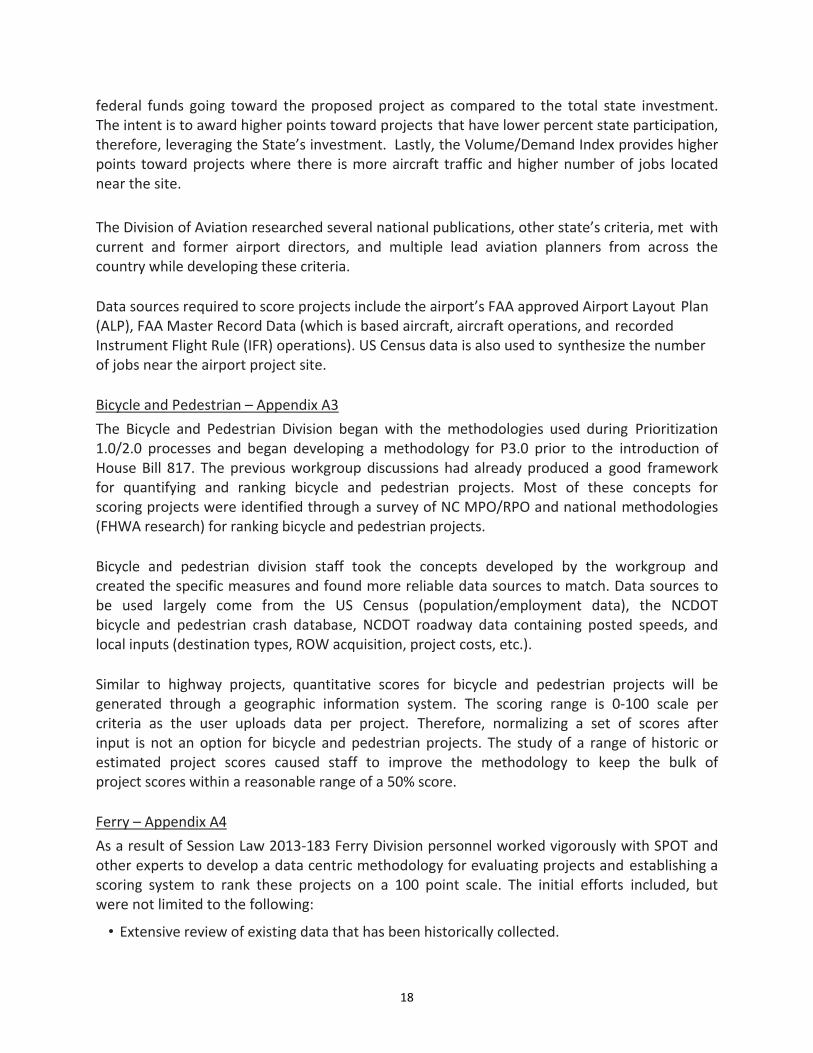
federal funds going toward the proposed project as compared to the total state investment. The intent is to award higher points toward projects that have lower percent state participation, therefore, leveraging the State’s investment. Lastly, the Volume/Demand Index provides higher points toward projects where there is more aircraft traffic and higher number of jobs located near the site. The Division of Aviation researched several national publications, other state’s criteria, met with current and former airport directors, and multiple lead aviation planners from across the country while developing these criteria. Data sources required to score projects include the airport’s FAA approved Airport Layout Plan (ALP), FAA Master Record Data (which is based aircraft, aircraft operations, and recorded Instrument Flight Rule (IFR) operations). US Census data is also used to synthesize the number of jobs near the airport project site. Bicycle and Pedestrian – Appendix A3 The Bicycle and Pedestrian Division began with the methodologies used during Prioritization 1.0/2.0 processes and began developing a methodology for P3.0 prior to the introduction of House Bill 817. The previous workgroup discussions had already produced a good framework for quantifying and ranking bicycle and pedestrian projects. Most of these concepts for scoring projects were identified through a survey of NC MPO/RPO and national methodologies (FHWA research) for ranking bicycle and pedestrian projects. Bicycle and pedestrian division staff took the concepts developed by the workgroup and created the specific measures and found more reliable data sources to match. Data sources to be used largely come from the US Census (population/employment data), the NCDOT bicycle and pedestrian crash database, NCDOT roadway data containing posted speeds, and local inputs (destination types, ROW acquisition, project costs, etc.). Similar to highway projects, quantitative scores for bicycle and pedestrian projects will be generated through a geographic information system. The scoring range is 0-100 scale per criteria as the user uploads data per project. Therefore, normalizing a set of scores after input is not an option for bicycle and pedestrian projects. The study of a range of historic or estimated project scores caused staff to improve the methodology to keep the bulk of project scores within a reasonable range of a 50% score. Ferry – Appendix A4 As a result of Session Law 2013-183 Ferry Division personnel worked vigorously with SPOT and other experts to develop a data centric methodology for evaluating projects and establishing a scoring system to rank these projects on a 100 point scale. The initial efforts included, but were not limited to the following:
• Extensive review of existing data that has been historically collected.
19
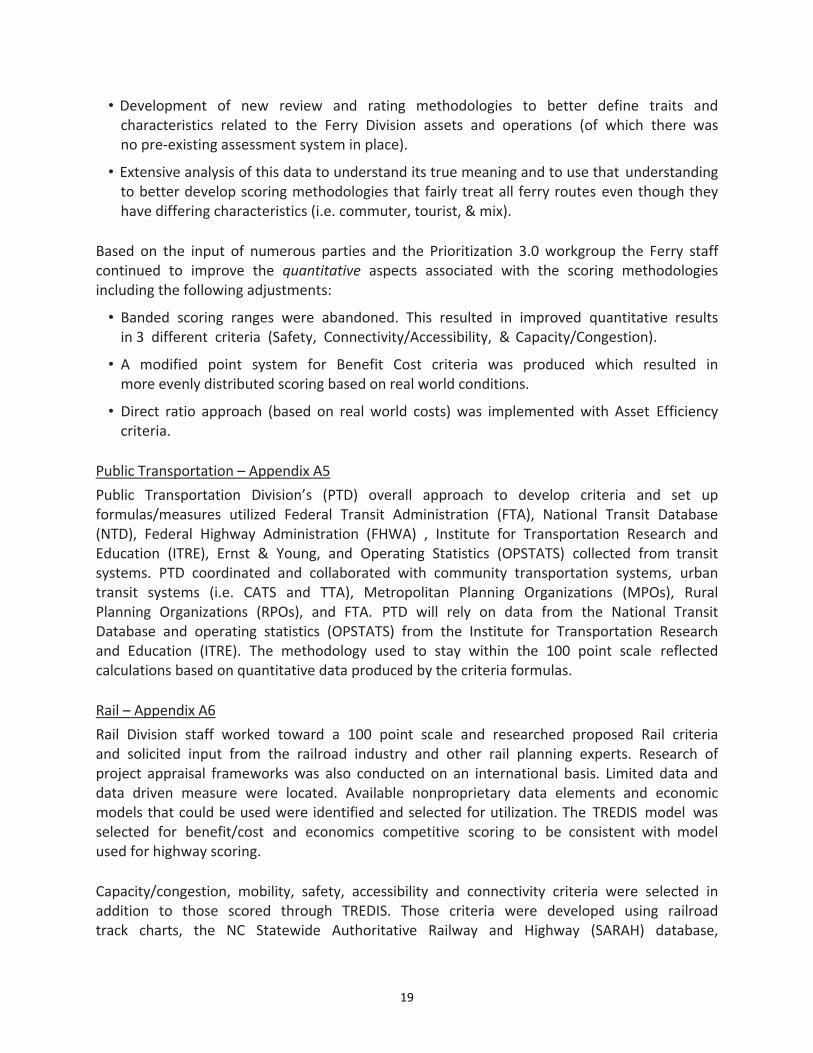
• Development of new review and rating methodologies to better define traits and characteristics related to the Ferry Division assets and operations (of which there was no pre-existing assessment system in place).
• Extensive analysis of this data to understand its true meaning and to use that understanding to better develop scoring methodologies that fairly treat all ferry routes even though they have differing characteristics (i.e. commuter, tourist, & mix).
Based on the input of numerous parties and the Prioritization 3.0 workgroup the Ferry staff continued to improve the quantitative aspects associated with the scoring methodologies including the following adjustments:
• Banded scoring ranges were abandoned. This resulted in improved quantitative results in 3 different criteria (Safety, Connectivity/Accessibility, & Capacity/Congestion).
• A modified point system for Benefit Cost criteria was produced which resulted in more evenly distributed scoring based on real world conditions.
• Direct ratio approach (based on real world costs) was implemented with Asset Efficiency criteria.
Public Transportation – Appendix A5 Public Transportation Division’s (PTD) overall approach to develop criteria and set up formulas/measures utilized Federal Transit Administration (FTA), National Transit Database (NTD), Federal Highway Administration (FHWA) , Institute for Transportation Research and Education (ITRE), Ernst & Young, and Operating Statistics (OPSTATS) collected from transit systems. PTD coordinated and collaborated with community transportation systems, urban transit systems (i.e. CATS and TTA), Metropolitan Planning Organizations (MPOs), Rural Planning Organizations (RPOs), and FTA. PTD will rely on data from the National Transit Database and operating statistics (OPSTATS) from the Institute for Transportation Research and Education (ITRE). The methodology used to stay within the 100 point scale reflected calculations based on quantitative data produced by the criteria formulas. Rail – Appendix A6 Rail Division staff worked toward a 100 point scale and researched proposed Rail criteria and solicited input from the railroad industry and other rail planning experts. Research of project appraisal frameworks was also conducted on an international basis. Limited data and data driven measure were located. Available nonproprietary data elements and economic models that could be used were identified and selected for utilization. The TREDIS model was selected for benefit/cost and economics competitive scoring to be consistent with model used for highway scoring. Capacity/congestion, mobility, safety, accessibility and connectivity criteria were selected in addition to those scored through TREDIS. Those criteria were developed using railroad track charts, the NC Statewide Authoritative Railway and Highway (SARAH) database,
20
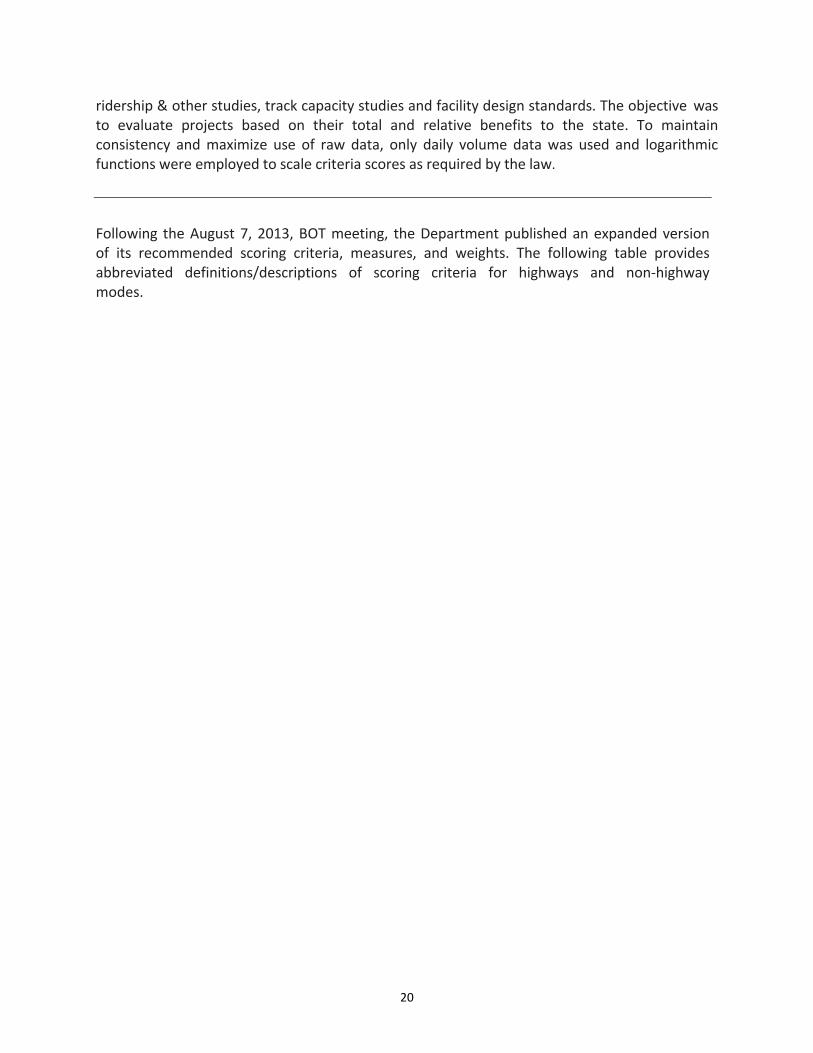
ridership & other studies, track capacity studies and facility design standards. The objective was to evaluate projects based on their total and relative benefits to the state. To maintain consistency and maximize use of raw data, only daily volume data was used and logarithmic functions were employed to scale criteria scores as required by the law. Following the August 7, 2013, BOT meeting, the Department published an expanded version of its recommended scoring criteria, measures, and weights. The following table provides abbreviated definitions/descriptions of scoring criteria for highways and non-highway modes.
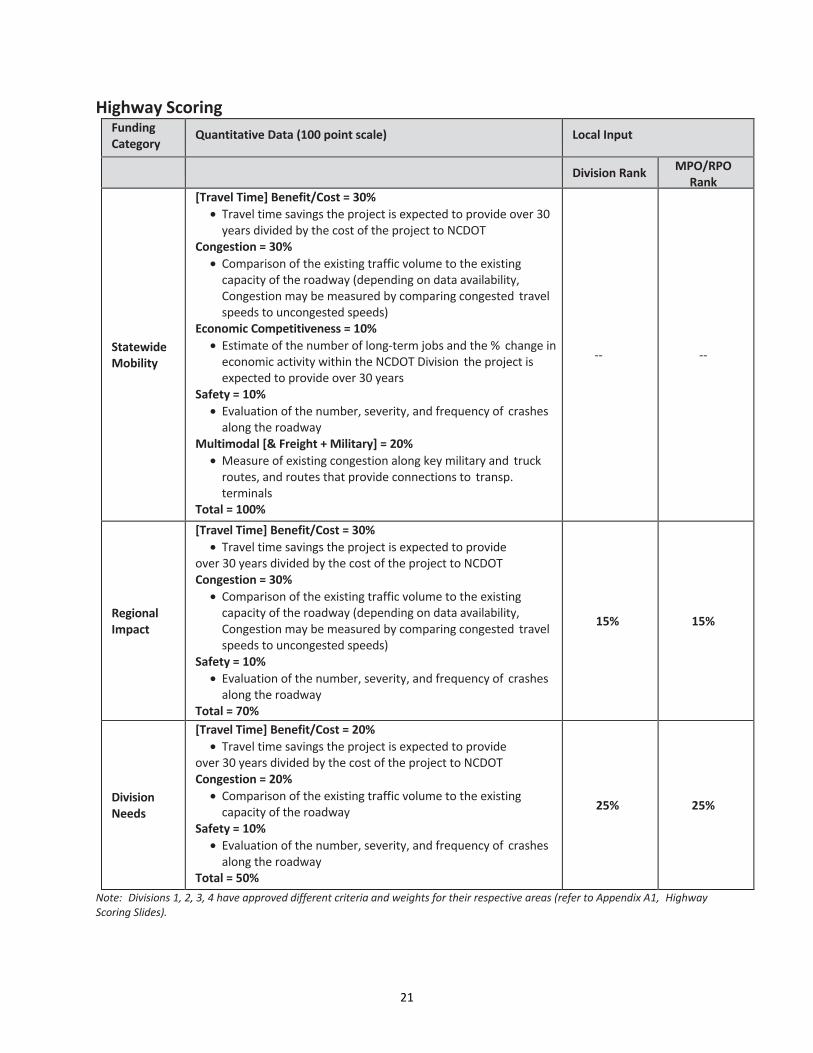
21
Highway Scoring Funding Category
Quantitative Data (100 point scale) Local Input
Division Rank MPO/RPORank
Statewide Mobility
[Travel Time] Benefit/Cost = 30%• Travel time savings the project is expected to provide over 30
years divided by the cost of the project to NCDOT Congestion = 30%
• Comparison of the existing traffic volume to the existing capacity of the roadway (depending on data availability, Congestion may be measured by comparing congested travel speeds to uncongested speeds)
Economic Competitiveness = 10% • Estimate of the number of long-term jobs and the % change in
economic activity within the NCDOT Division the project is expected to provide over 30 years
Safety = 10% • Evaluation of the number, severity, and frequency of crashes
along the roadway Multimodal [& Freight + Military] = 20%
• Measure of existing congestion along key military and truck routes, and routes that provide connections to transp. terminals
Total = 100%
-- --
Regional Impact
[Travel Time] Benefit/Cost = 30%• Travel time savings the project is expected to provide
over 30 years divided by the cost of the project to NCDOT Congestion = 30%
• Comparison of the existing traffic volume to the existing capacity of the roadway (depending on data availability, Congestion may be measured by comparing congested travel speeds to uncongested speeds)
Safety = 10% • Evaluation of the number, severity, and frequency of crashes
along the roadway Total = 70%
15% 15%
Division Needs
[Travel Time] Benefit/Cost = 20%• Travel time savings the project is expected to provide
over 30 years divided by the cost of the project to NCDOT Congestion = 20%
• Comparison of the existing traffic volume to the existing capacity of the roadway
Safety = 10% • Evaluation of the number, severity, and frequency of crashes
along the roadway Total = 50%
25% 25%
Note: Divisions 1, 2, 3, 4 have approved different criteria and weights for their respective areas (refer to Appendix A1, Highway Scoring Slides).
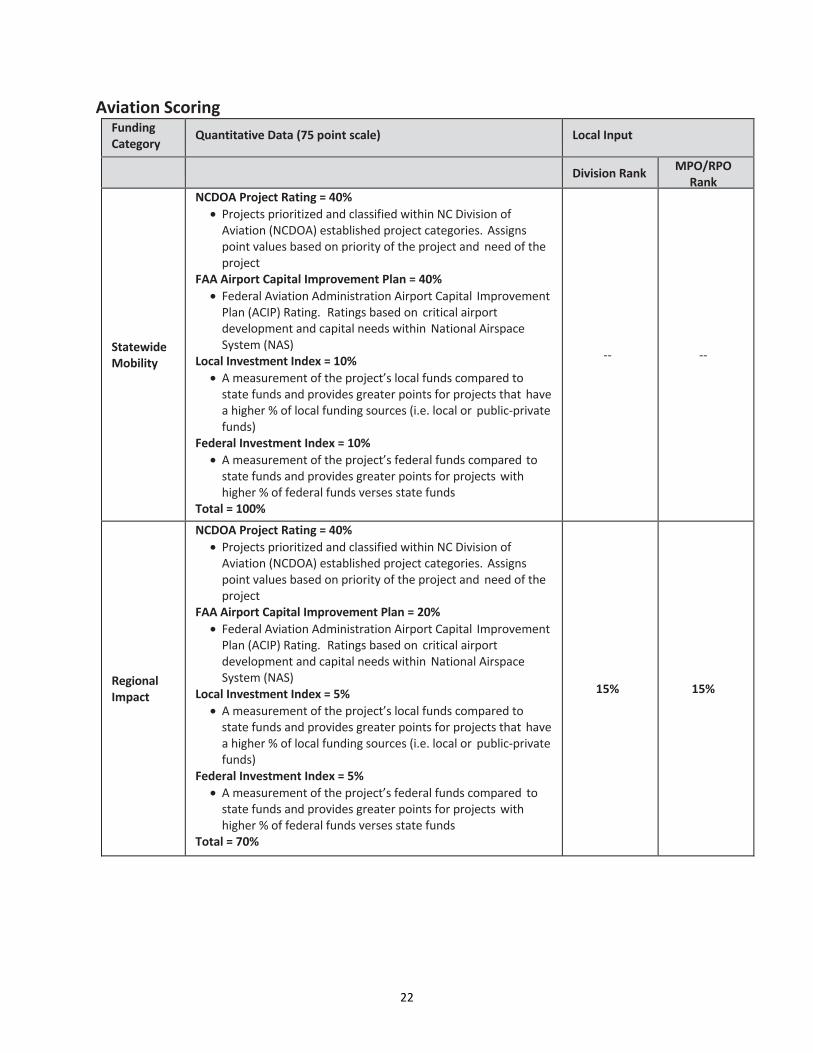
22
Aviation Scoring Funding Category
Quantitative Data (75 point scale) Local Input
Division Rank MPO/RPORank
Statewide Mobility
NCDOA Project Rating = 40%• Projects prioritized and classified within NC Division of
Aviation (NCDOA) established project categories. Assigns point values based on priority of the project and need of the project
FAA Airport Capital Improvement Plan = 40% • Federal Aviation Administration Airport Capital Improvement
Plan (ACIP) Rating. Ratings based on critical airport development and capital needs within National Airspace System (NAS)
Local Investment Index = 10% • A measurement of the project’s local funds compared to
state funds and provides greater points for projects that have a higher % of local funding sources (i.e. local or public-private funds)
Federal Investment Index = 10% • A measurement of the project’s federal funds compared to
state funds and provides greater points for projects with higher % of federal funds verses state funds
Total = 100%
-- --
Regional Impact
NCDOA Project Rating = 40%• Projects prioritized and classified within NC Division of
Aviation (NCDOA) established project categories. Assigns point values based on priority of the project and need of the project
FAA Airport Capital Improvement Plan = 20% • Federal Aviation Administration Airport Capital Improvement
Plan (ACIP) Rating. Ratings based on critical airport development and capital needs within National Airspace System (NAS)
Local Investment Index = 5% • A measurement of the project’s local funds compared to
state funds and provides greater points for projects that have a higher % of local funding sources (i.e. local or public-private funds)
Federal Investment Index = 5% • A measurement of the project’s federal funds compared to
state funds and provides greater points for projects with higher % of federal funds verses state funds
Total = 70%
15% 15%
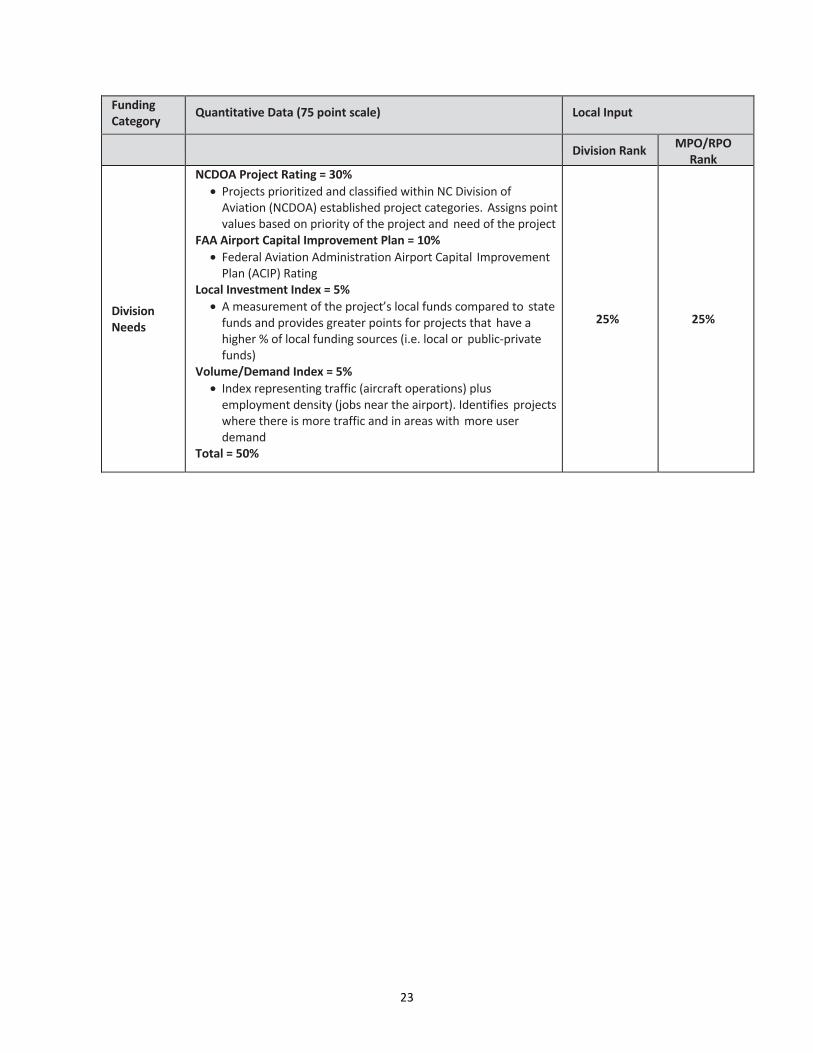
23
Funding Category
Quantitative Data (75 point scale) Local Input
Division Rank MPO/RPORank
Division Needs
NCDOA Project Rating = 30%• Projects prioritized and classified within NC Division of
Aviation (NCDOA) established project categories. Assigns point values based on priority of the project and need of the project
FAA Airport Capital Improvement Plan = 10% • Federal Aviation Administration Airport Capital Improvement
Plan (ACIP) Rating Local Investment Index = 5%
• A measurement of the project’s local funds compared to state funds and provides greater points for projects that have a higher % of local funding sources (i.e. local or public-private funds)
Volume/Demand Index = 5% • Index representing traffic (aircraft operations) plus
employment density (jobs near the airport). Identifies projects where there is more traffic and in areas with more user demand
Total = 50%
25% 25%
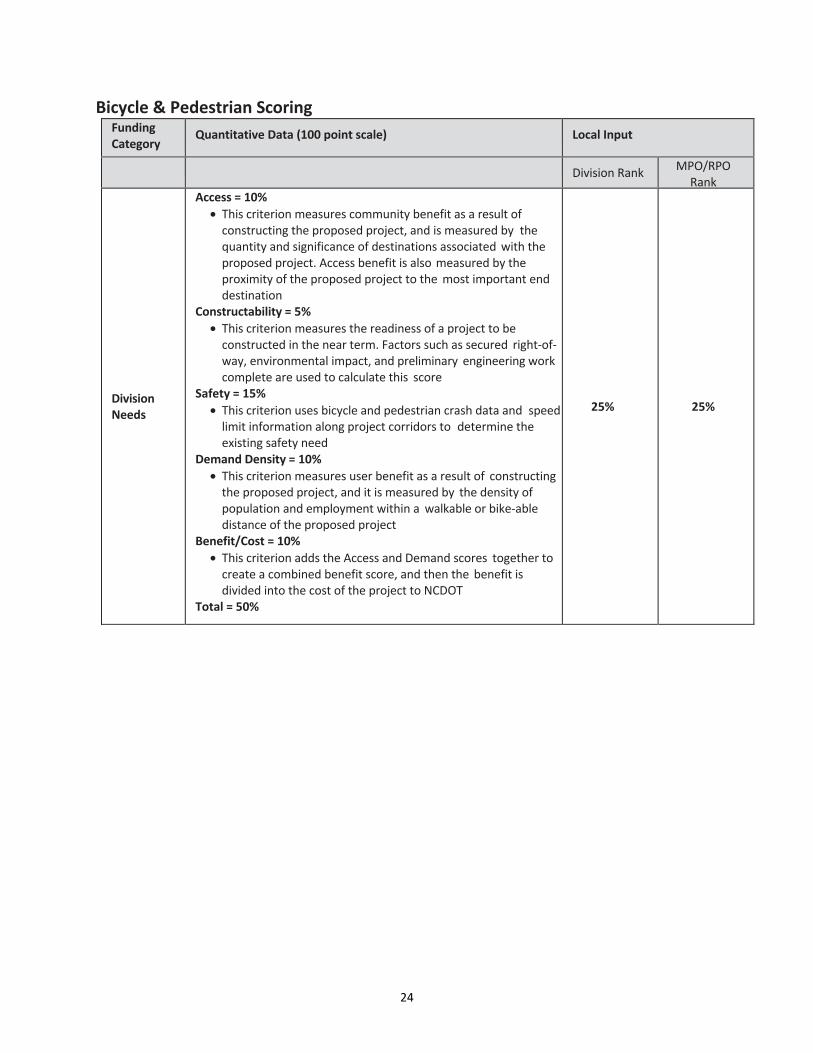
24
Bicycle & Pedestrian Scoring Funding Category
Quantitative Data (100 point scale) Local Input
Division Rank MPO/RPORank
Division Needs
Access = 10% • This criterion measures community benefit as a result of
constructing the proposed project, and is measured by the quantity and significance of destinations associated with the proposed project. Access benefit is also measured by the proximity of the proposed project to the most important end destination
Constructability = 5% • This criterion measures the readiness of a project to be
constructed in the near term. Factors such as secured right-of-way, environmental impact, and preliminary engineering work complete are used to calculate this score
Safety = 15% • This criterion uses bicycle and pedestrian crash data and speed
limit information along project corridors to determine the existing safety need
Demand Density = 10% • This criterion measures user benefit as a result of constructing
the proposed project, and it is measured by the density of population and employment within a walkable or bike-able distance of the proposed project
Benefit/Cost = 10% • This criterion adds the Access and Demand scores together to
create a combined benefit score, and then the benefit is divided into the cost of the project to NCDOT
Total = 50%
25% 25%
25
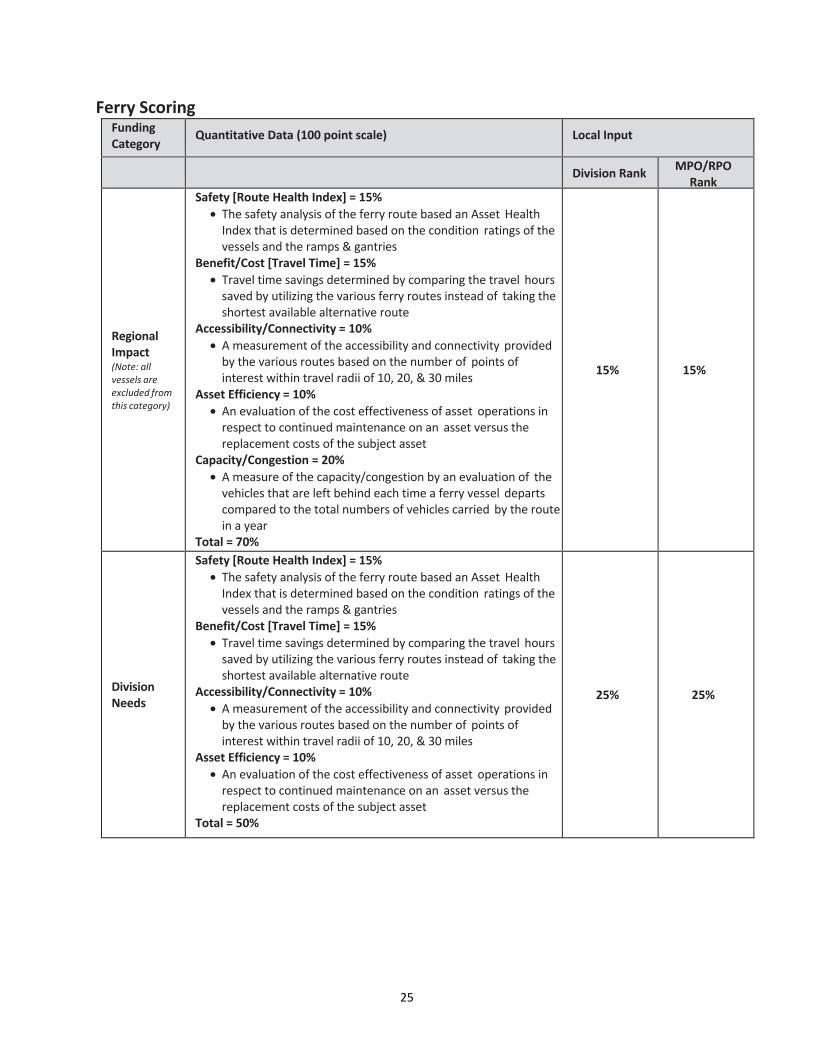
Ferry Scoring Funding Category
Quantitative Data (100 point scale) Local Input
Division Rank MPO/RPORank
Regional Impact (Note: all vessels are excluded from this category)
Safety [Route Health Index] = 15%• The safety analysis of the ferry route based an Asset Health
Index that is determined based on the condition ratings of the vessels and the ramps & gantries
Benefit/Cost [Travel Time] = 15% • Travel time savings determined by comparing the travel hours
saved by utilizing the various ferry routes instead of taking the shortest available alternative route
Accessibility/Connectivity = 10% • A measurement of the accessibility and connectivity provided
by the various routes based on the number of points of interest within travel radii of 10, 20, & 30 miles
Asset Efficiency = 10% • An evaluation of the cost effectiveness of asset operations in
respect to continued maintenance on an asset versus the replacement costs of the subject asset
Capacity/Congestion = 20% • A measure of the capacity/congestion by an evaluation of the
vehicles that are left behind each time a ferry vessel departs compared to the total numbers of vehicles carried by the route in a year
Total = 70%
15% 15%
Division Needs
Safety [Route Health Index] = 15%• The safety analysis of the ferry route based an Asset Health
Index that is determined based on the condition ratings of the vessels and the ramps & gantries
Benefit/Cost [Travel Time] = 15% • Travel time savings determined by comparing the travel hours
saved by utilizing the various ferry routes instead of taking the shortest available alternative route
Accessibility/Connectivity = 10% • A measurement of the accessibility and connectivity provided
by the various routes based on the number of points of interest within travel radii of 10, 20, & 30 miles
Asset Efficiency = 10% • An evaluation of the cost effectiveness of asset operations in
respect to continued maintenance on an asset versus the replacement costs of the subject asset
Total = 50%
25% 25%
26
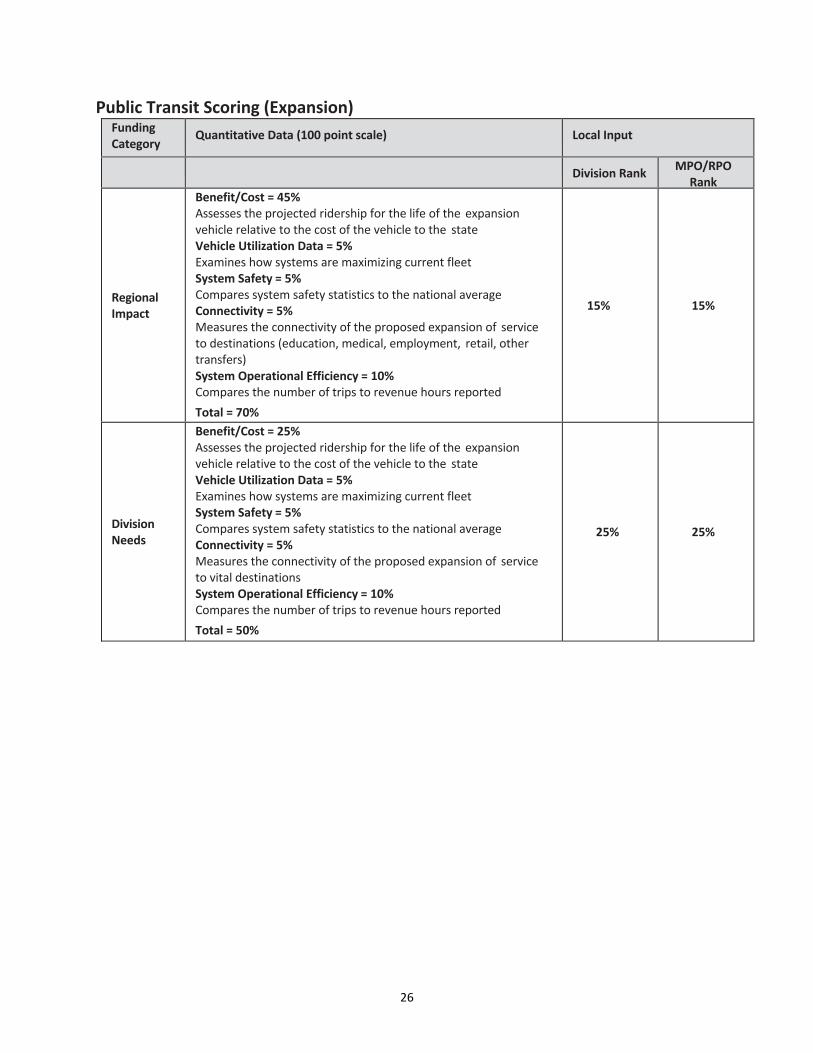
Public Transit Scoring (Expansion) Funding Category
Quantitative Data (100 point scale) Local Input
Division Rank MPO/RPORank
Regional Impact
Benefit/Cost = 45% Assesses the projected ridership for the life of the expansion vehicle relative to the cost of the vehicle to the state Vehicle Utilization Data = 5% Examines how systems are maximizing current fleet System Safety = 5% Compares system safety statistics to the national average Connectivity = 5% Measures the connectivity of the proposed expansion of service to destinations (education, medical, employment, retail, other transfers) System Operational Efficiency = 10% Compares the number of trips to revenue hours reported Total = 70%
15% 15%
Division Needs
Benefit/Cost = 25% Assesses the projected ridership for the life of the expansion vehicle relative to the cost of the vehicle to the state Vehicle Utilization Data = 5% Examines how systems are maximizing current fleet System Safety = 5% Compares system safety statistics to the national average Connectivity = 5% Measures the connectivity of the proposed expansion of service to vital destinations System Operational Efficiency = 10% Compares the number of trips to revenue hours reported Total = 50%
25% 25%
27
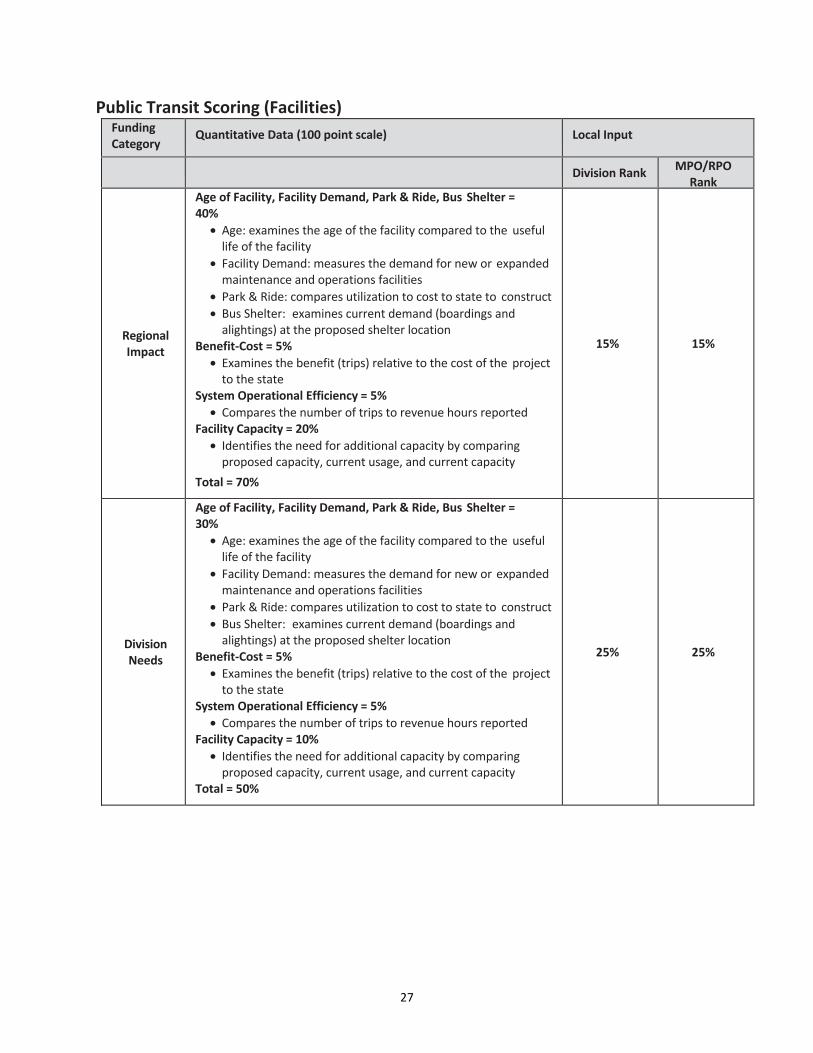
Public Transit Scoring (Facilities) Funding Category
Quantitative Data (100 point scale) Local Input
Division Rank MPO/RPORank
Regional Impact
Age of Facility, Facility Demand, Park & Ride, Bus Shelter = 40%
• Age: examines the age of the facility compared to the useful life of the facility
• Facility Demand: measures the demand for new or expanded maintenance and operations facilities
• Park & Ride: compares utilization to cost to state to construct • Bus Shelter: examines current demand (boardings and
alightings) at the proposed shelter location Benefit-Cost = 5%
• Examines the benefit (trips) relative to the cost of the project to the state
System Operational Efficiency = 5% • Compares the number of trips to revenue hours reported
Facility Capacity = 20% • Identifies the need for additional capacity by comparing
proposed capacity, current usage, and current capacity Total = 70%
15% 15%
Division Needs
Age of Facility, Facility Demand, Park & Ride, Bus Shelter = 30%
• Age: examines the age of the facility compared to the useful life of the facility
• Facility Demand: measures the demand for new or expanded maintenance and operations facilities
• Park & Ride: compares utilization to cost to state to construct • Bus Shelter: examines current demand (boardings and
alightings) at the proposed shelter location Benefit-Cost = 5%
• Examines the benefit (trips) relative to the cost of the project to the state
System Operational Efficiency = 5% • Compares the number of trips to revenue hours reported
Facility Capacity = 10% • Identifies the need for additional capacity by comparing
proposed capacity, current usage, and current capacity Total = 50%
25% 25%
28
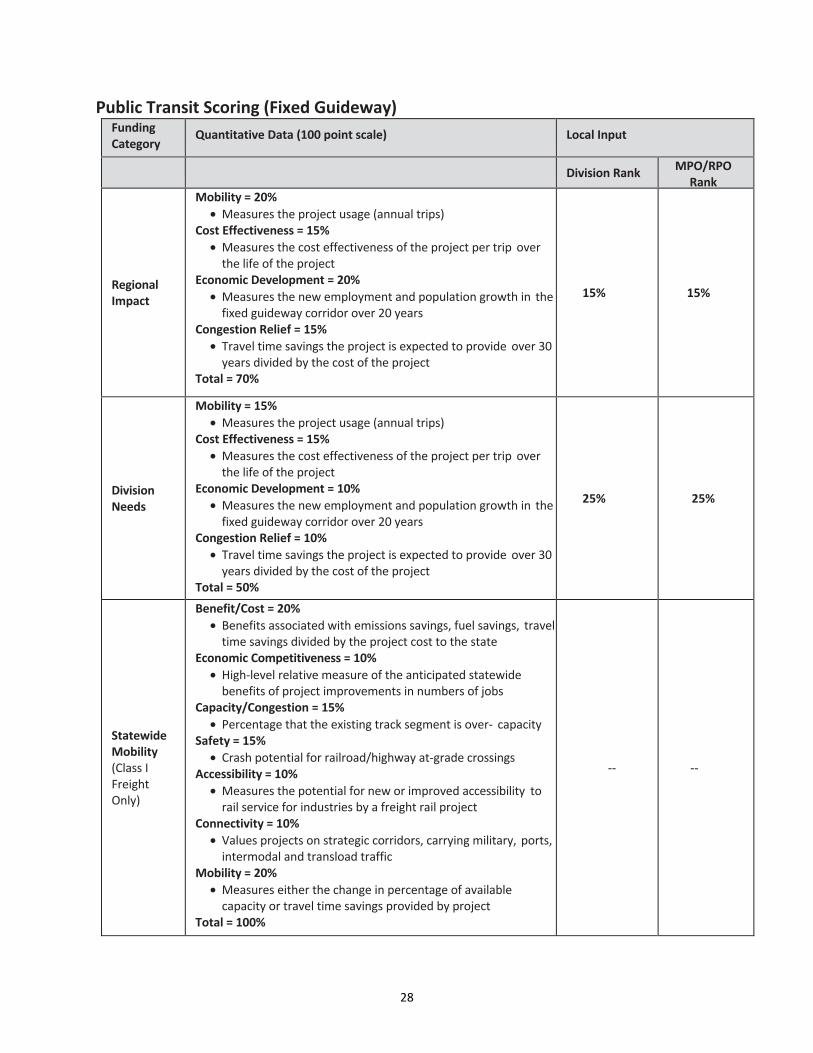
Public Transit Scoring (Fixed Guideway) Funding Category
Quantitative Data (100 point scale) Local Input
Division Rank MPO/RPORank
Regional Impact
Mobility = 20% • Measures the project usage (annual trips)
Cost Effectiveness = 15% • Measures the cost effectiveness of the project per trip over
the life of the project Economic Development = 20%
• Measures the new employment and population growth in the fixed guideway corridor over 20 years
Congestion Relief = 15% • Travel time savings the project is expected to provide over 30
years divided by the cost of the project Total = 70%
15% 15%
Division Needs
Mobility = 15% • Measures the project usage (annual trips)
Cost Effectiveness = 15% • Measures the cost effectiveness of the project per trip over
the life of the project Economic Development = 10%
• Measures the new employment and population growth in the fixed guideway corridor over 20 years
Congestion Relief = 10% • Travel time savings the project is expected to provide over 30
years divided by the cost of the project Total = 50%
25% 25%
Statewide Mobility (Class I Freight Only)
Benefit/Cost = 20% • Benefits associated with emissions savings, fuel savings, travel
time savings divided by the project cost to the state Economic Competitiveness = 10%
• High-level relative measure of the anticipated statewide benefits of project improvements in numbers of jobs
Capacity/Congestion = 15% • Percentage that the existing track segment is over- capacity
Safety = 15% • Crash potential for railroad/highway at-grade crossings
Accessibility = 10% • Measures the potential for new or improved accessibility to
rail service for industries by a freight rail project Connectivity = 10%
• Values projects on strategic corridors, carrying military, ports, intermodal and transload traffic
Mobility = 20% • Measures either the change in percentage of available
capacity or travel time savings provided by project Total = 100%
-- --
29
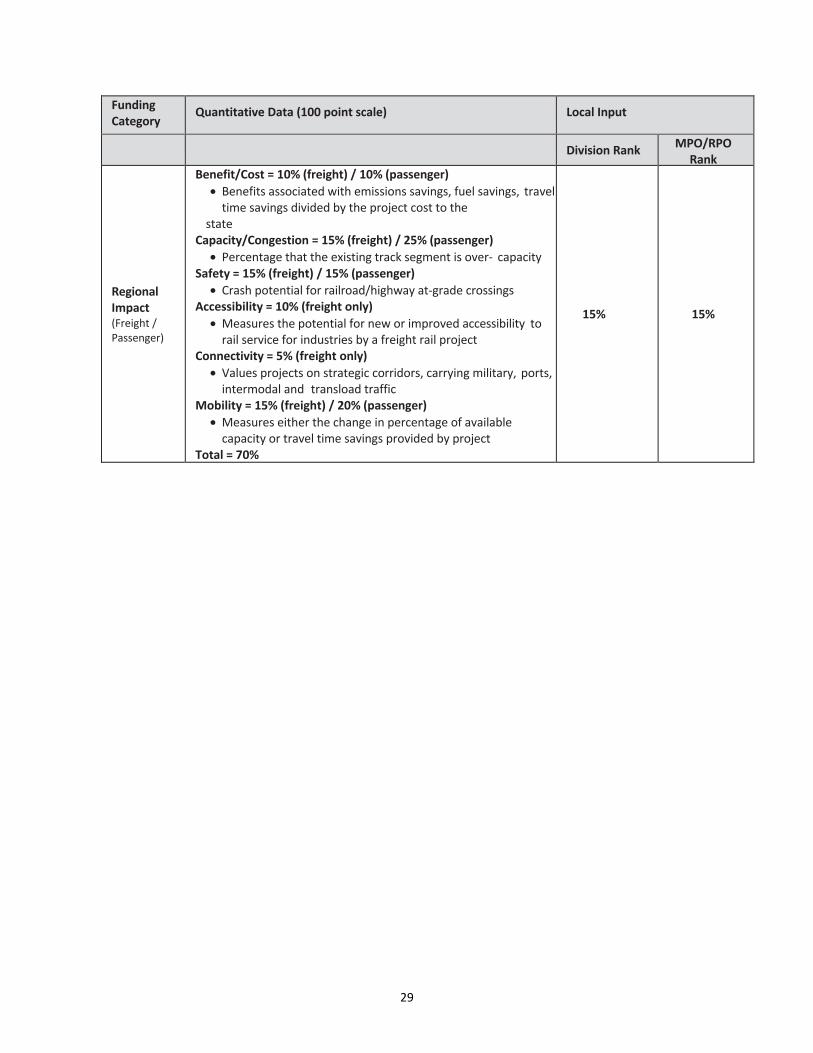
Funding Category
Quantitative Data (100 point scale) Local Input
Division Rank MPO/RPORank
Regional Impact (Freight / Passenger)
Benefit/Cost = 10% (freight) / 10% (passenger)• Benefits associated with emissions savings, fuel savings, travel
time savings divided by the project cost to the state
Capacity/Congestion = 15% (freight) / 25% (passenger) • Percentage that the existing track segment is over- capacity
Safety = 15% (freight) / 15% (passenger) • Crash potential for railroad/highway at-grade crossings
Accessibility = 10% (freight only) • Measures the potential for new or improved accessibility to
rail service for industries by a freight rail project Connectivity = 5% (freight only)
• Values projects on strategic corridors, carrying military, ports,intermodal and transload traffic
Mobility = 15% (freight) / 20% (passenger) • Measures either the change in percentage of available
capacity or travel time savings provided by project Total = 70%
15% 15%

30
31
APPENDIX 4: NCDOT FUNDING BREAKDOWN
Source: North Carolina Department of Transportation, 2013-2014 NCDOT Sources and Uses, 2013.

32
33
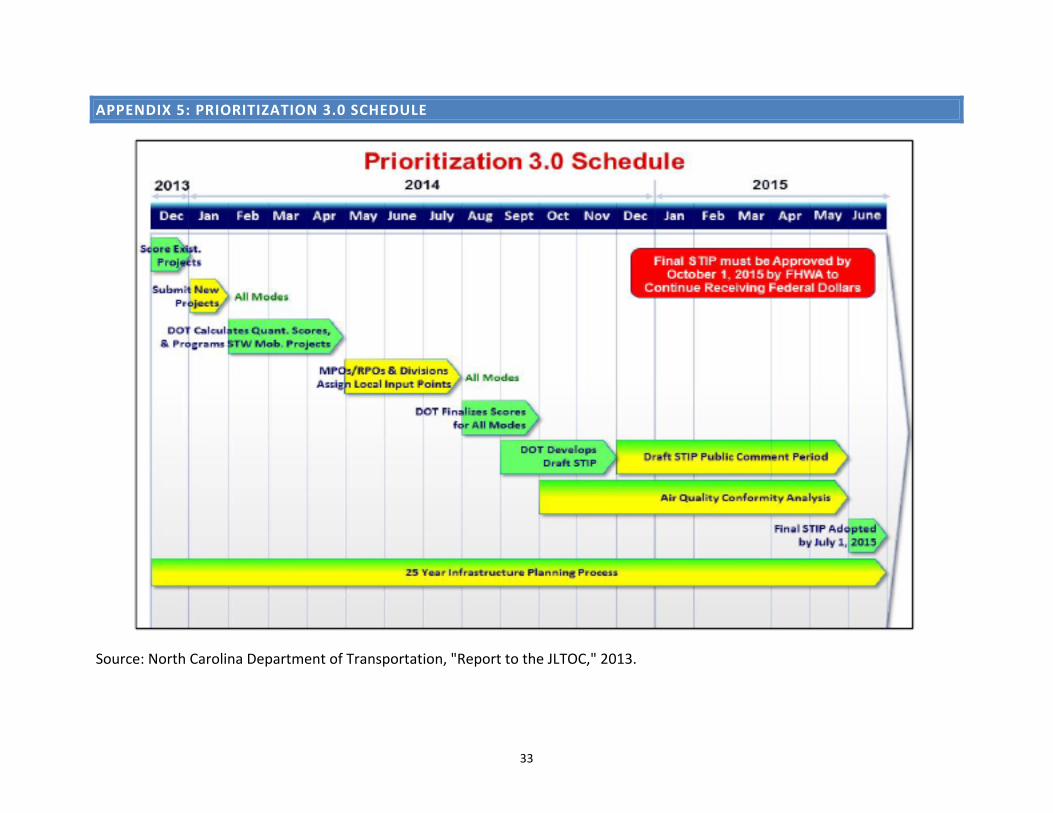
APPENDIX 5: PRIORITIZATION 3.0 SCHEDULE
Source: North Carolina Department of Transportation, "Report to the JLTOC," 2013.

34
35
APPENDIX 6: TEXAS DEPARTMENT OF TRANSPORTATION FUNDING STREAMS
Source: Texas Department of Transportation, Project Selection Process, 2013.

36
37
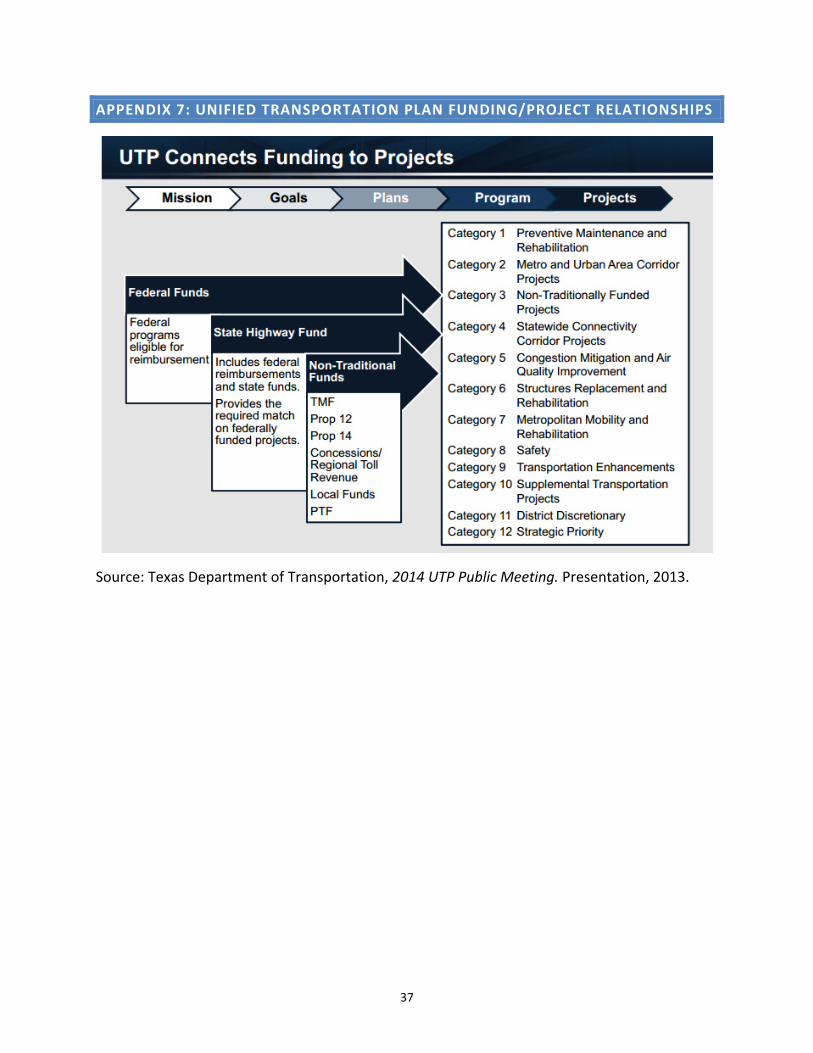
APPENDIX 7: UNIFIED TRANSPORTATION PLAN FUNDING/PROJECT RELATIONSHIPS
Source: Texas Department of Transportation, 2014 UTP Public Meeting. Presentation, 2013.
Related Documents