NIIT Technologies Financial Results Analysis May 05, 2010 Q4 ’10 Results-Web 1 Financial Year 2009-10 &Q4

Welcome message from author
This document is posted to help you gain knowledge. Please leave a comment to let me know what you think about it! Share it to your friends and learn new things together.
Transcript
NIIT Technologies Financial Results Analysis
May 05, 2010 Q4 ’10 Results-Web 1
Financial Year 2009-10 &Q4
Outline• Highlights
– For the Quarter– For the Year– Business Highlights for the quarter– Acknowledgements
• Financial Statements– Income Statement– Balance Sheet
May 05, 2010 Q4 ’10 Results-Web 2
• Business Analysis– Revenue Cuts– Order Intake– Top clients– People Resources
• Shareholding Pattern
Highlights for the Quarter
• Consolidated Revenues at Rs 2392mn– Up 4% QoQ, Up 5% YoY– Volume growth 7% QoQ, Currency loss 3% QoQ
• Operating profits at Rs 529Mn– Up 4% QoQ , Up 31% YoY, – Operating Margins at 22%, up 7 bps QoQ, up 432 YoY
May 05, 2010 Q4 ’10 Results-Web 3
• Net Profits at Rs 413Mn– Up 17% QoQ , Up 57% YoY; – Net Margins at 17%
• Fresh order intake of $124mn
Highlights for the Financial Year• Consolidated Revenues at Rs 9137 Mn
• Down 7% • Revenue loss on account of hedging 560 Mn
• Operating Profits at Rs 1888 Mn • Up 7%• Operating Margins at 21%, Up 266 bps
• Net Profits at Rs1264 Mn
May 05, 2010 Q4 ’10 Results-Web 4
• Net Profits at Rs1264 Mn • Up 10% • Net Margins at 14% • EPS at Rs 21.51
• Board recommends 70 % dividend
Business Highlights for the Quarter• BFSI down 2% YoY, Contributes 42% (LQ 44%)
– 3% volume growth QoQ but 4% impact of currency fall.– New Insurance customer added in Europe
• Transport up 16% YoY, Contributes 31% (LQ 34%)– New client added in APAC– Strategic partnership with SATS for Cargo ground handling solutions.
• Retail & Man. down 21% YoY, Contributes 10% (LQ 9%)
May 05, 2010 Q4 ’10 Results-Web 5
• Retail & Man. down 21% YoY, Contributes 10% (LQ 9%)– Pick up in Manufacturing from existing clients.
• Govt. assumes significant 8% share– 228 cr turnkey engagement with BSF
Acknowledgements during the YearDuring the Quarter
• Ranked amongst top 7 service providers in Gartner’s Industry research report in 2010 “ Seven Vendors Dominate the European Market for General Insurance Policy Administration Systems”
• Amongst the top 50 IT Innovators for the year 2009 by NASSCOM
• NIIT GIS received the Best Software Company of the Year award 2009–2010 at the Map India 2010 Conference
• Received the Award for “Innovation in Career Development,” from the Global HR Excellence Awards at the Global HRD Congress 2010
During the Year
• Ranked Number 1 in the Data Monitor Black Book of Outsourcing 2009 Travel Industry survey for the
6
• Ranked Number 1 in the Data Monitor Black Book of Outsourcing 2009 Travel Industry survey for the second consecutive year
• Ranked amongst the Best 5 Companies in Air Transportation by The International Association of Outsourcing Professionals (IAOP) in its The Global Outsourcing 100 listing for the year 2009
• Ranked among the Best 20 Industry leaders in Financial Services (Insurance and Banking) by The International Association of Outsourcing Professionals (IAOP) in its The Global Outsourcing 100 listing for the year 2009
• Ranked amongst the Top 20 Best Managed Outsourcing Vendors by the 2009 Black Book of Outsourcing
• Ranked amongst India’s 500 Best Performing Companies by demonstrating exceptional innovation and perseverance by Inc. India for the year 2009
Q4' 10 Results - BoardMay 05, 2010
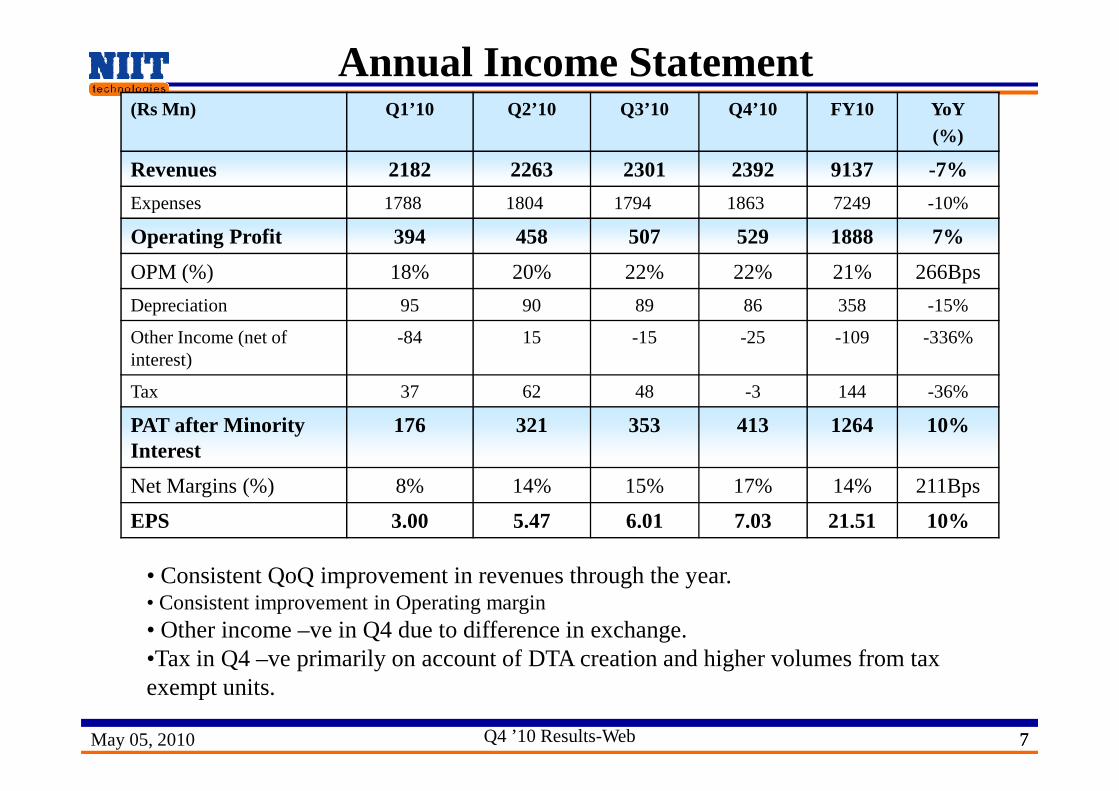
Annual Income Statement (Rs Mn) Q1’10 Q2’10 Q3’10 Q4’10 FY10 YoY
(%)
Revenues 2182 2263 2301 2392 9137 -7%
Expenses 1788 1804 1794 1863 7249 -10%
Operating Profit 394 458 507 529 1888 7%
OPM (%) 18% 20% 22% 22% 21% 266Bps
Depreciation 95 90 89 86 358 -15%
Other Income (net of interest)
-84 15 -15 -25 -109 -336%
Tax 37 62 48 -3 144 -36%
May 05, 2010 Q4 ’10 Results-Web 77
Tax 37 62 48 -3 144 -36%
PAT after Minority Interest
176 321 353 413 1264 10%
Net Margins (%) 8% 14% 15% 17% 14% 211Bps
EPS 3.00 5.47 6.01 7.03 21.51 10%
• Consistent QoQ improvement in revenues through the year.• Consistent improvement in Operating margin • Other income –ve in Q4 due to difference in exchange.•Tax in Q4 –ve primarily on account of DTA creation and higher volumes from tax exempt units.
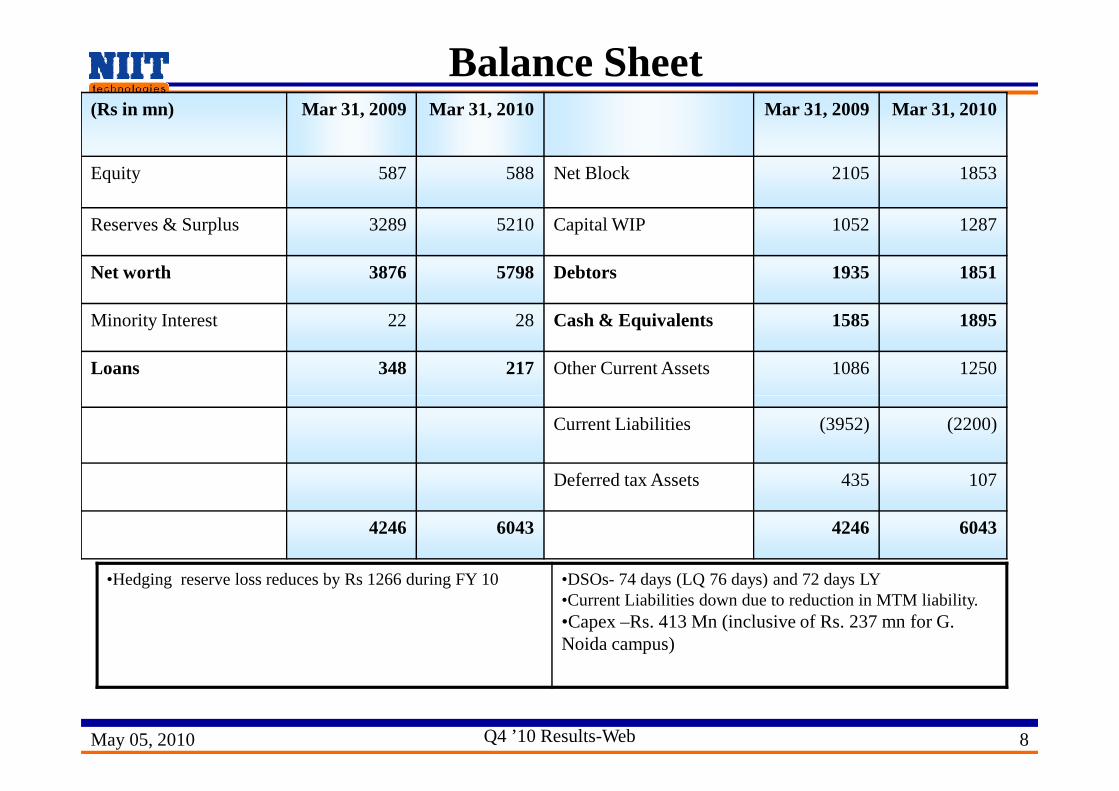
Balance Sheet(Rs in mn) Mar 31, 2009 Mar 31, 2010 Mar 31, 2009 Mar 31, 2010
Equity 587 588 Net Block 2105 1853
Reserves & Surplus 3289 5210 Capital WIP 1052 1287
Net worth 3876 5798 Debtors 1935 1851
Minority Interest 22 28 Cash & Equivalents 1585 1895
Loans 348 217 Other Current Assets 1086 1250
May 05, 2010 Q4 ’10 Results-Web 8
Current Liabilities (3952) (2200)
Deferred tax Assets 435 107
4246 6043 4246 6043
•Hedging reserve loss reduces by Rs 1266 during FY 10 •DSOs- 74 days (LQ 76 days) and 72 days LY•Current Liabilities down due to reduction in MTM liability.•Capex –Rs. 413 Mn (inclusive of Rs. 237 mn for G. Noida campus)
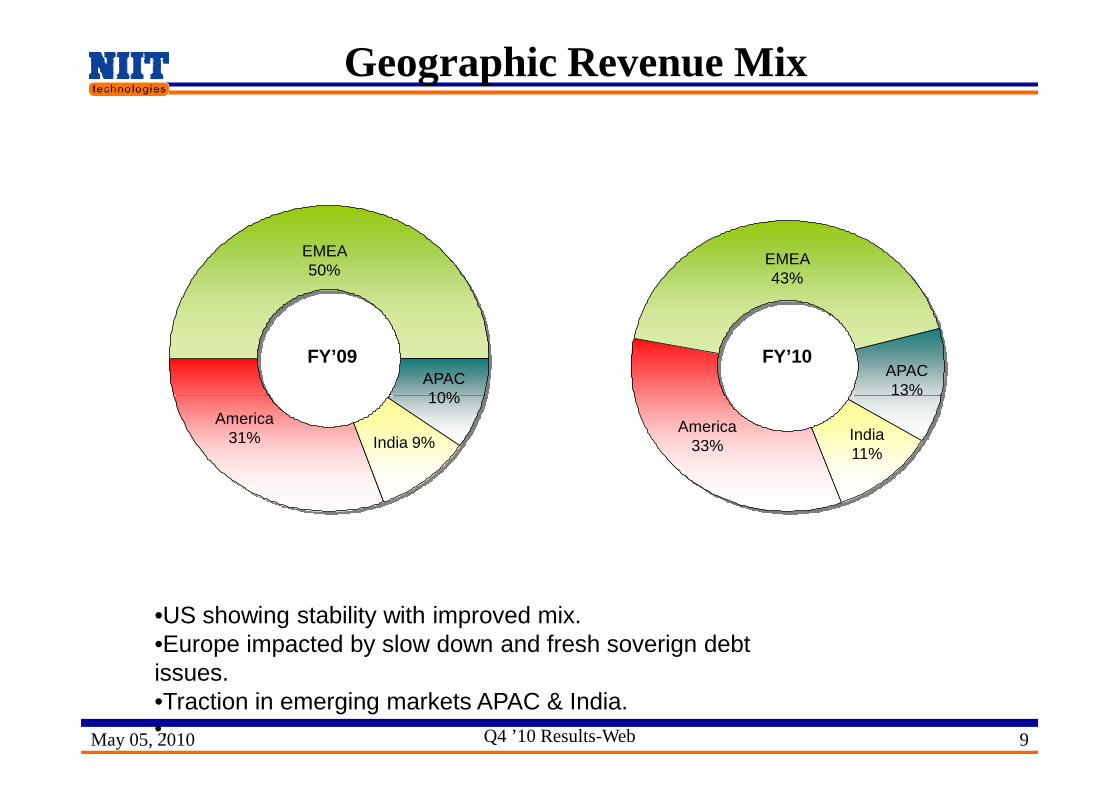
Geographic Revenue Mix
FY’09
EMEA 50%
APAC 10%
EMEA 43%
APAC 13%
FY’10
May 05, 2010 Q4 ’10 Results-Web 9
10%
India 9%
America 31%
13%
America 33%
India 11%
•US showing stability with improved mix.•Europe impacted by slow down and fresh soverign debt issues.•Traction in emerging markets APAC & India.•.
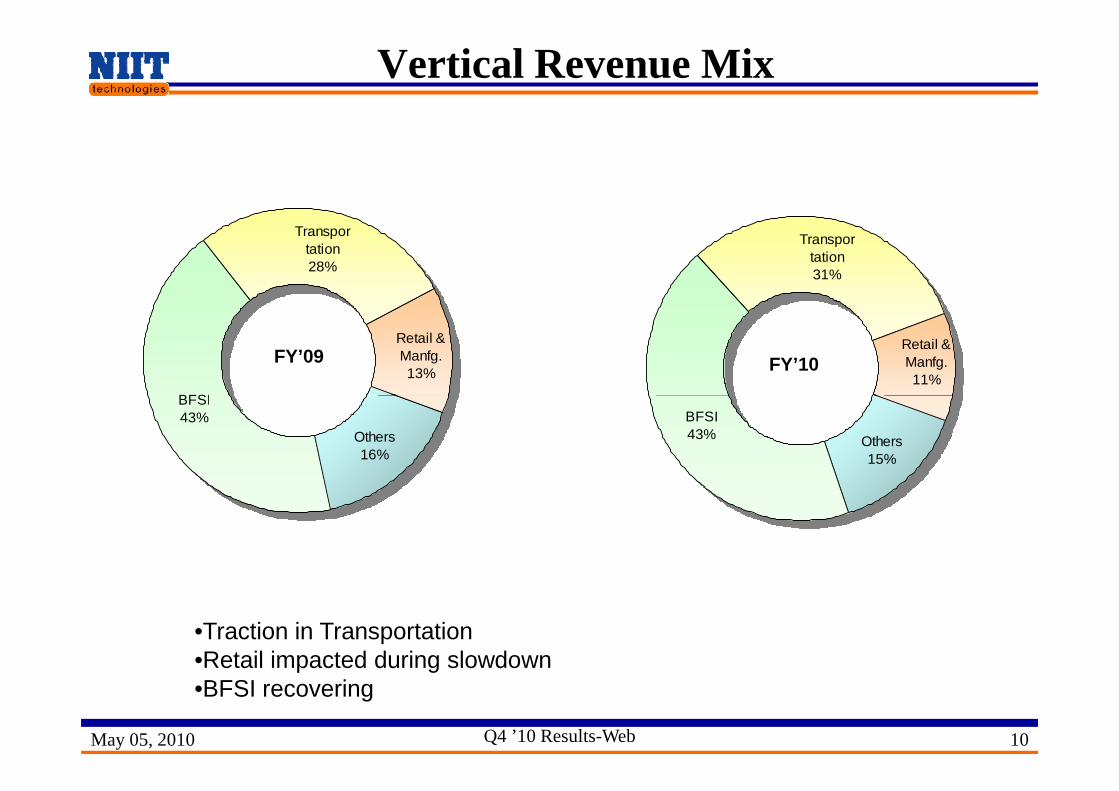
Vertical Revenue Mix
Transportation28%
Retail & Manfg.13%
BFSI
FY’09
Transportation31%
Retail & Manfg.11%
FY’10
May 05, 2010 Q4 ’10 Results-Web 10
BFSI43%
Others16%
•Traction in Transportation•Retail impacted during slowdown•BFSI recovering
BFSI43% Others
15%
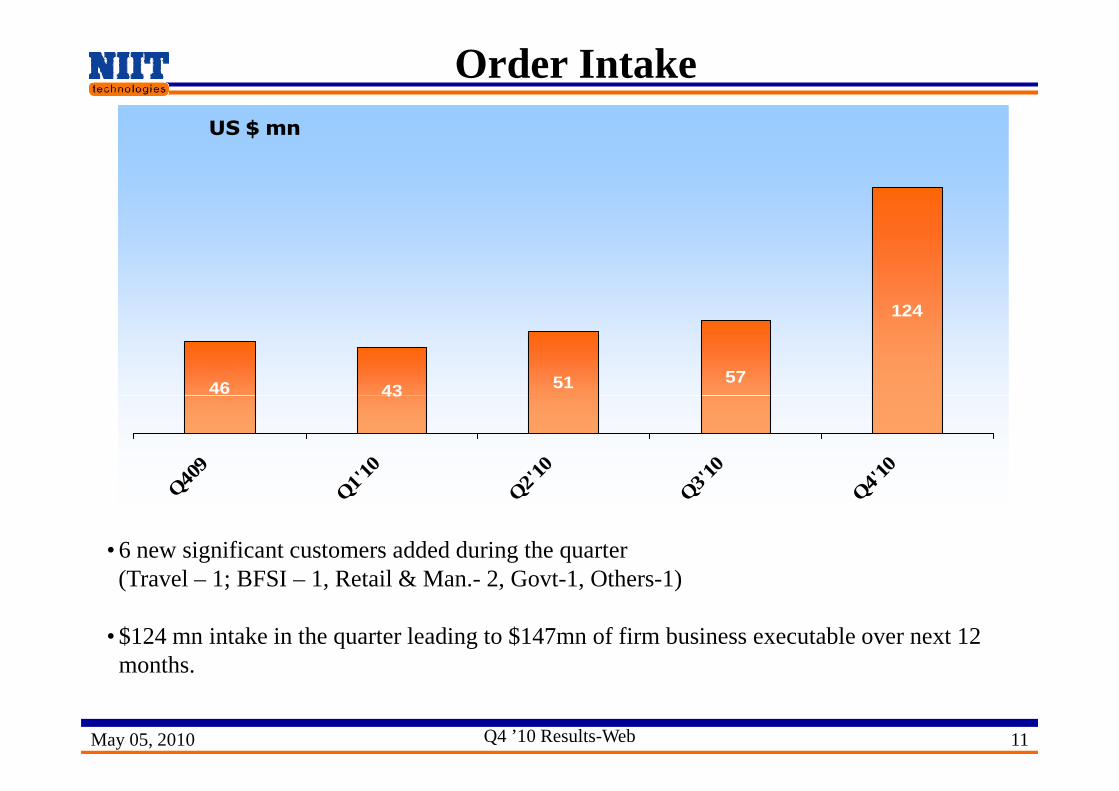
Order IntakeUS $ mn
46 43 51 57
124
May 05, 2010 Q4 ’10 Results-Web 11
46 43
Q409
Q1'10
Q2'10
Q3'10
Q4'10
• 6 new significant customers added during the quarter(Travel – 1; BFSI – 1, Retail & Man.- 2, Govt-1, Others-1)
• $124 mn intake in the quarter leading to $147mn of firm business executable over next 12 months.
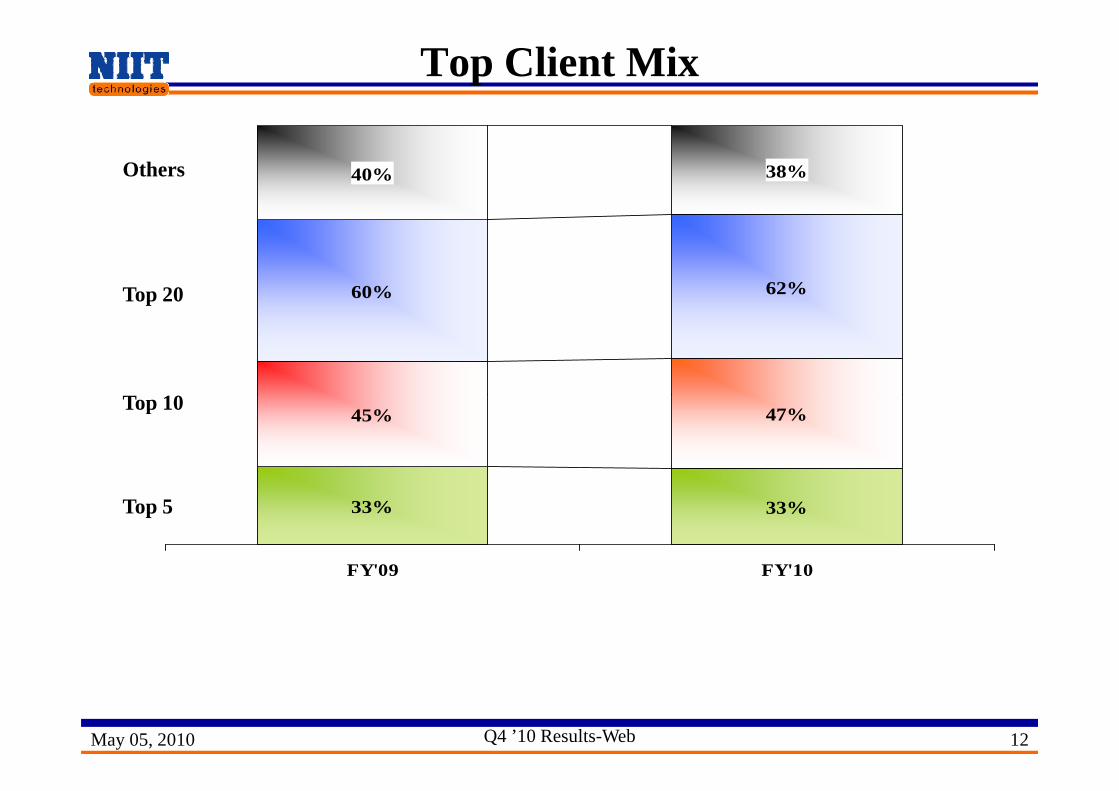
Top Client Mix
60% 62%
38%40%
Top 10
Top 20
Others
May 05, 2010 Q4 ’10 Results-Web 12
33% 33%
45% 47%
FY'09 FY'10
Top 10
Top 5
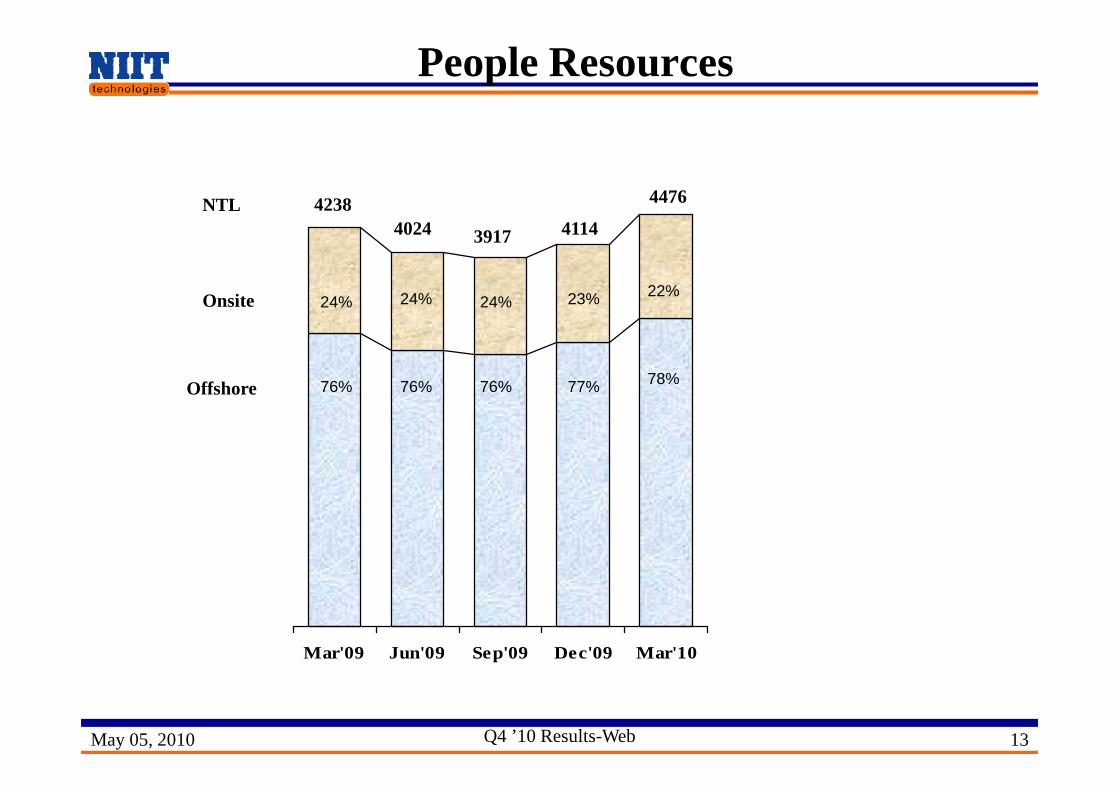
People Resources
Onsite
Offshore
NTL 42384024 3917 4114
4476
24% 24% 24% 23% 22%
76% 76% 76% 77% 78%
May 05, 2010 Q4 ’10 Results-Web 13
Offshore
Mar'09 Jun'09 Sep'09 Dec'09 Mar'10
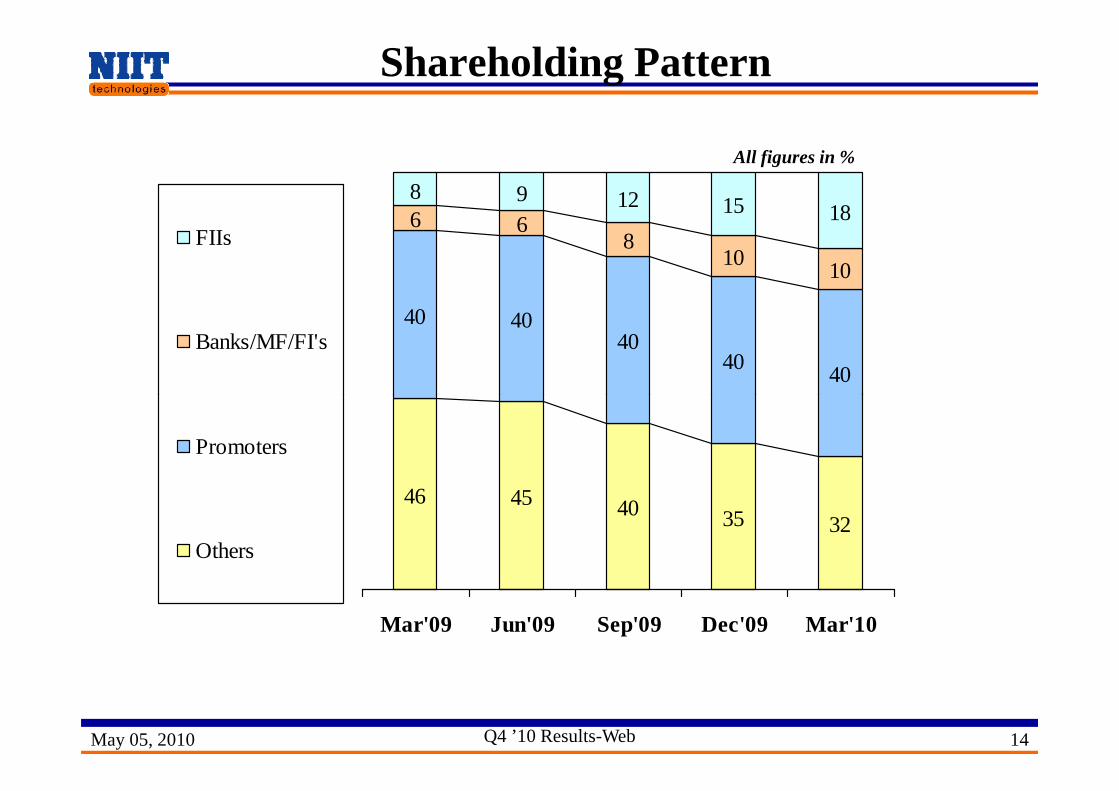
Shareholding Pattern
40 4040
4040
6 68
1010
8 9 12 15 18FIIs
Banks/MF/FI's
All figures in %
May 05, 2010 Q4 ’10 Results-Web 14
46 45 40 35 32
Mar'09 Jun'09 Sep'09 Dec'09 Mar'10
Promoters
Others
Thank You
May 05, 2010 Q4 ’10 Results-Web 15
Related Documents