Next Generation Water Loss Tools_2014 Next Generation Water Loss Tools - AWWA’s New & Improving Tools and Publications for Water Loss Control Will J. Jernigan, PE Director of Water Efficiency Cavanaugh & Associates, PA 37 Montford Ave, Ste 201 Asheville, NC 28801 [email protected] Abstract The American Water Works Association (AWWA) promotes water efficiency for drinking water utilities via a number of initiatives including water conservation, proper water pricing, water loss control and other approaches. While AWWA’s guidance was relatively limited prior to the year 2000, it has greatly accelerated its efforts in the past 15 years and now offers extensive guidance and tools to water utilities, with a number of these being available at no charge. During the period of 2013-2014 AWWA and the Water Research Foundation (WRF) have been particularly active in creating and updating tools and research, and the period of 2014 through early 2015 will see the release of a number of new and updated tools that will greatly assist water utilities, consultants, regulatory agencies and manufacturers in better managing the significant issue of water and revenue loss in water systems. These tools include: Publication of the 4 th edition of the guidance manual, M36: Water Audits and Loss Control Programs Release of Version 5.0 of the AWWA Free Water Audit Software© (free tool) Release of initial version of the Leakage Component Analysis Tool© by the Water Research Foundation (free tool) A synopsis of the capabilities of these tools will be provided, noting the improvements that each bring to the drinking water industry. Additionally, several reports from the Water Research Foundation will be highlighted. Instructions will be provided to the conference attendees on the means to obtain these tools and how to immediately apply them. Related web informational resources will also be referenced. This presentation will be valuable to attendees by offering a useful “go-to” guide to the latest of the water loss control tools and publications to will greatly assist utility personnel in controlling water loss. Introduction The science of water loss accounting and control dates back 2000 years, to the Roman Empire. Julius Frontinius was appointed Water Commissioner of Rome in 57 A.D. He dedicated his career to trying to balance inflows and outflows coming from their sources via the aqueducts. Unfortunately, he took into account only the cross-sectional area of the flow, and neglected to factor in velocity and he died a frustrated man, never having solved it. Fast forward 2000 years, the science of water loss accounting and control has advanced considerably, most notably in the last 15 to 20 years. The American Water Works Association (AWWA) and Water Research Foundation (WRF) have been actively developing practices and tools for the management of water loss in North America. This paper is intended to provide a review of the cutting edge tools that are available, including one that is yet to be released. Each of the tools described below are provided to help North American water utilities gain a better understanding of their losses, and to guide the effective management of those losses.

Welcome message from author
This document is posted to help you gain knowledge. Please leave a comment to let me know what you think about it! Share it to your friends and learn new things together.
Transcript
Next Generation Water Loss Tools_2014
Next Generation Water Loss Tools - AWWA’s New & Improving Tools and Publications for Water Loss Control
Will J. Jernigan, PE
Director of Water Efficiency Cavanaugh & Associates, PA
37 Montford Ave, Ste 201 Asheville, NC 28801
Abstract
The American Water Works Association (AWWA) promotes water efficiency for drinking water utilities via a number of initiatives including water conservation, proper water pricing, water loss control and other approaches. While AWWA’s guidance was relatively limited prior to the year 2000, it has greatly accelerated its efforts in the past 15 years and now offers extensive guidance and tools to water utilities, with a number of these being available at no charge. During the period of 2013-2014 AWWA and the Water Research Foundation (WRF) have been particularly active in creating and updating tools and research, and the period of 2014 through early 2015 will see the release of a number of new and updated tools that will greatly assist water utilities, consultants, regulatory agencies and manufacturers in better managing the significant issue of water and revenue loss in water systems. These tools include:
Publication of the 4th edition of the guidance manual, M36: Water Audits and Loss
Control Programs
Release of Version 5.0 of the AWWA Free Water Audit Software© (free tool)
Release of initial version of the Leakage Component Analysis Tool© by the Water
Research Foundation (free tool)
A synopsis of the capabilities of these tools will be provided, noting the improvements that each bring to the drinking water industry. Additionally, several reports from the Water Research Foundation will be highlighted. Instructions will be provided to the conference attendees on the means to obtain these tools and how to immediately apply them. Related web informational resources will also be referenced. This presentation will be valuable to attendees by offering a useful “go-to” guide to the latest of the water loss control tools and publications to will greatly assist utility personnel in controlling water loss.
Introduction The science of water loss accounting and control dates back 2000 years, to the Roman Empire. Julius Frontinius was appointed Water Commissioner of Rome in 57 A.D. He dedicated his career to trying to balance inflows and outflows coming from their sources via the aqueducts. Unfortunately, he took into account only the cross-sectional area of the flow, and neglected to factor in velocity and he died a frustrated man, never having solved it. Fast forward 2000 years, the science of water loss accounting and control has advanced considerably, most notably in the last 15 to 20 years. The American Water Works Association (AWWA) and Water Research Foundation (WRF) have been actively developing practices and tools for the management of water loss in North America. This paper is intended to provide a review of the cutting edge tools that are available, including one that is yet to be released. Each of the tools described below are provided to help North American water utilities gain a better understanding of their losses, and to guide the effective management of those losses.
Next Generation Water Loss Tools_2014
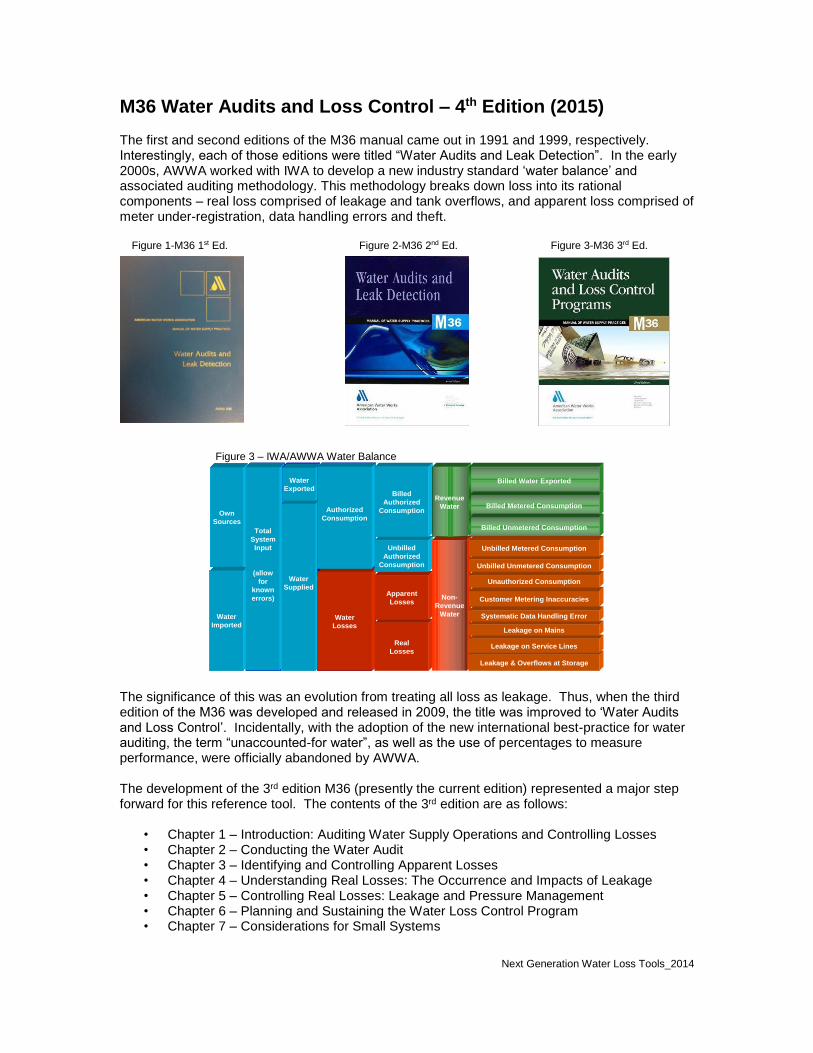
M36 Water Audits and Loss Control – 4th Edition (2015) The first and second editions of the M36 manual came out in 1991 and 1999, respectively. Interestingly, each of those editions were titled “Water Audits and Leak Detection”. In the early 2000s, AWWA worked with IWA to develop a new industry standard ‘water balance’ and associated auditing methodology. This methodology breaks down loss into its rational components – real loss comprised of leakage and tank overflows, and apparent loss comprised of meter under-registration, data handling errors and theft. Figure 1-M36 1st Ed. Figure 2-M36 2nd Ed. Figure 3-M36 3rd Ed.
Figure 3 – IWA/AWWA Water Balance
The significance of this was an evolution from treating all loss as leakage. Thus, when the third edition of the M36 was developed and released in 2009, the title was improved to ‘Water Audits and Loss Control’. Incidentally, with the adoption of the new international best-practice for water auditing, the term “unaccounted-for water”, as well as the use of percentages to measure performance, were officially abandoned by AWWA. The development of the 3rd edition M36 (presently the current edition) represented a major step forward for this reference tool. The contents of the 3rd edition are as follows:
• Chapter 1 – Introduction: Auditing Water Supply Operations and Controlling Losses • Chapter 2 – Conducting the Water Audit • Chapter 3 – Identifying and Controlling Apparent Losses • Chapter 4 – Understanding Real Losses: The Occurrence and Impacts of Leakage • Chapter 5 – Controlling Real Losses: Leakage and Pressure Management • Chapter 6 – Planning and Sustaining the Water Loss Control Program • Chapter 7 – Considerations for Small Systems
Water
Imported
Own
Sources
Total
System
Input
( allow
for
known
errors )
Total
System
Input
(allow
for
known
errors)
Water
Supplied
Water
Exported
Water
Supplied
Water
Exported
Water
Losses
Authorized
Consumption
Water
Imported
Own
Sources
Total
System
Input
( allow
for
known
errors )
Water
Imported
Own
Sources
Total
System
Input
( allow
for
known
errors )
Total
System
Input
(allow
for
known
errors)
Water
Supplied
Water
Exported
Water
Supplied
Water
Exported
Water
Losses
Authorized
Consumption
Water
Losses
Authorized
Consumption
Real
Losses
Apparent
Losses
Unbilled
Authorized
Consumption
Billed
Authorized
Consumption
Non-
Revenue
Water
Revenue
Water
Leakage & Overflows at Storage
Billed Unmetered Consumption
Billed Metered Consumption
Billed Water Exported
Leakage on Service Lines
Leakage on Mains
Customer Metering Inaccuracies
Unauthorized Consumption
Unbilled Unmetered Consumption
Unbilled Metered Consumption
Systematic Data Handling Error
Next Generation Water Loss Tools_2014
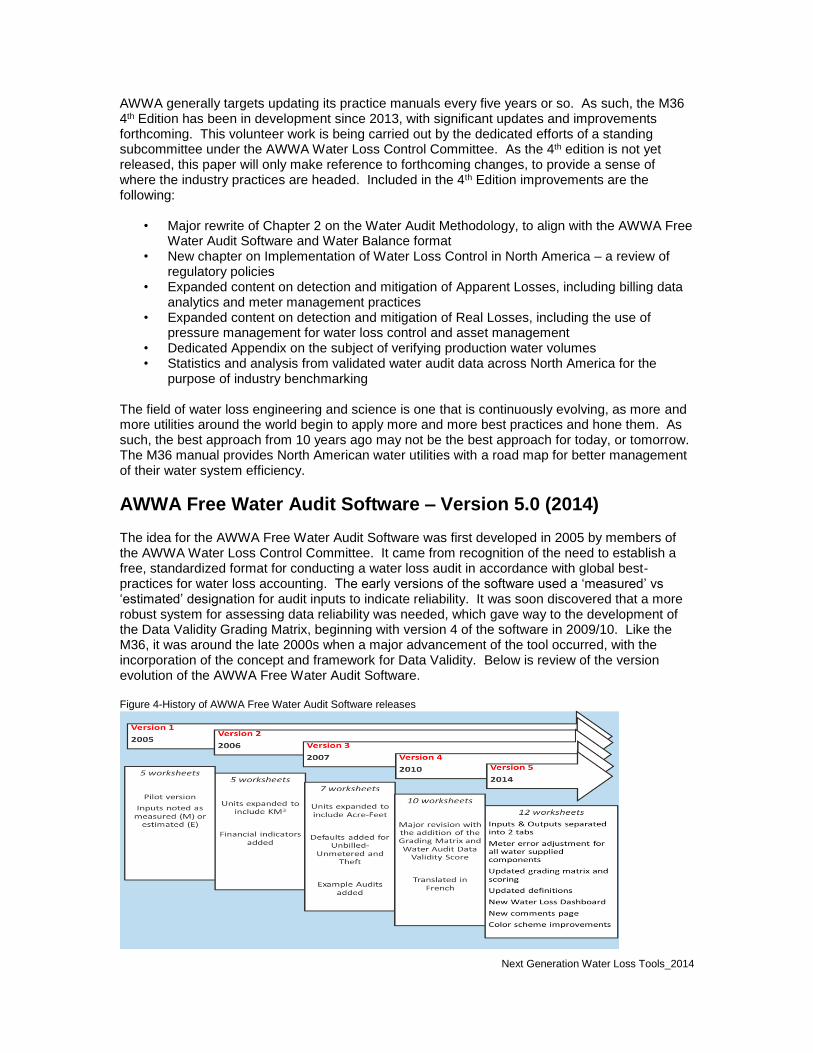
AWWA generally targets updating its practice manuals every five years or so. As such, the M36 4th Edition has been in development since 2013, with significant updates and improvements forthcoming. This volunteer work is being carried out by the dedicated efforts of a standing subcommittee under the AWWA Water Loss Control Committee. As the 4th edition is not yet released, this paper will only make reference to forthcoming changes, to provide a sense of where the industry practices are headed. Included in the 4th Edition improvements are the following:
• Major rewrite of Chapter 2 on the Water Audit Methodology, to align with the AWWA Free Water Audit Software and Water Balance format
• New chapter on Implementation of Water Loss Control in North America – a review of regulatory policies
• Expanded content on detection and mitigation of Apparent Losses, including billing data analytics and meter management practices
• Expanded content on detection and mitigation of Real Losses, including the use of pressure management for water loss control and asset management
• Dedicated Appendix on the subject of verifying production water volumes • Statistics and analysis from validated water audit data across North America for the
purpose of industry benchmarking The field of water loss engineering and science is one that is continuously evolving, as more and more utilities around the world begin to apply more and more best practices and hone them. As such, the best approach from 10 years ago may not be the best approach for today, or tomorrow. The M36 manual provides North American water utilities with a road map for better management of their water system efficiency.
AWWA Free Water Audit Software – Version 5.0 (2014) The idea for the AWWA Free Water Audit Software was first developed in 2005 by members of the AWWA Water Loss Control Committee. It came from recognition of the need to establish a free, standardized format for conducting a water loss audit in accordance with global best-practices for water loss accounting. The early versions of the software used a ‘measured’ vs ‘estimated’ designation for audit inputs to indicate reliability. It was soon discovered that a more robust system for assessing data reliability was needed, which gave way to the development of the Data Validity Grading Matrix, beginning with version 4 of the software in 2009/10. Like the M36, it was around the late 2000s when a major advancement of the tool occurred, with the incorporation of the concept and framework for Data Validity. Below is review of the version evolution of the AWWA Free Water Audit Software. Figure 4-History of AWWA Free Water Audit Software releases
Next Generation Water Loss Tools_2014
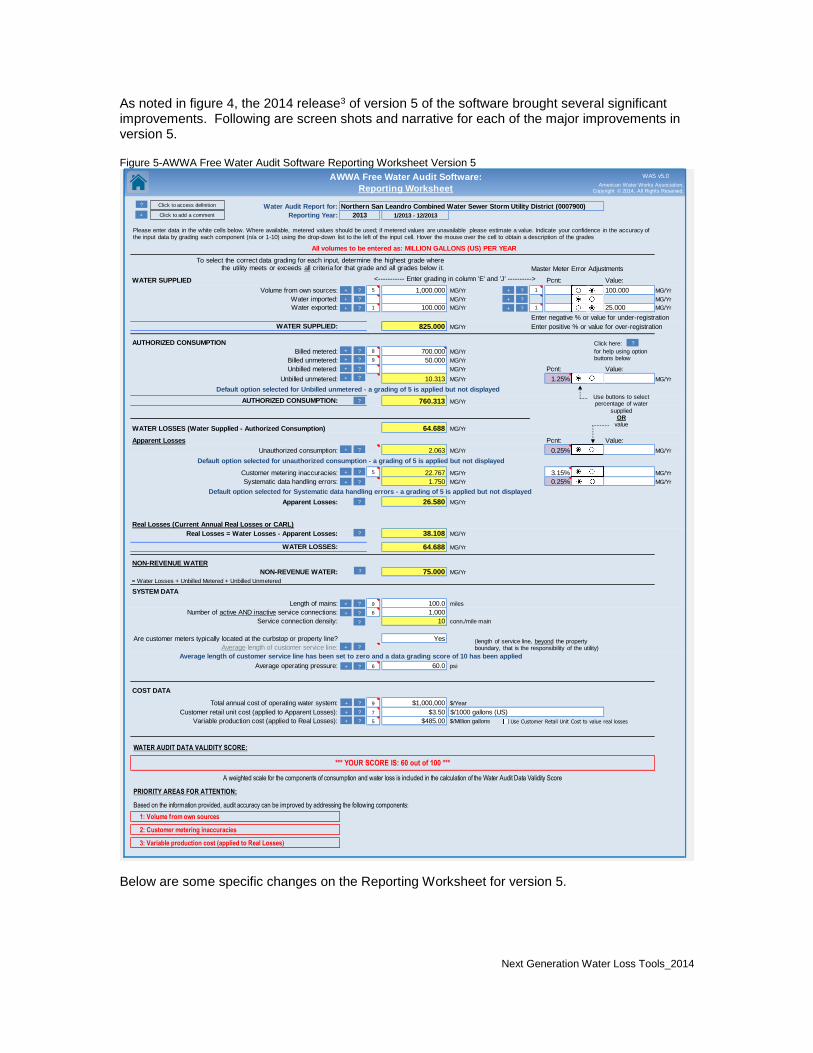
As noted in figure 4, the 2014 release3 of version 5 of the software brought several significant improvements. Following are screen shots and narrative for each of the major improvements in version 5. Figure 5-AWWA Free Water Audit Software Reporting Worksheet Version 5
Water Audit Report for:
Reporting Year:
All volumes to be entered as: MILLION GALLONS (US) PER YEAR
Master Meter Error Adjustments
WATER SUPPLIED Pcnt: Value:
Volume from own sources: 5 1,000.000 MG/Yr 1 MG/Yr
Water imported: MG/Yr MG/Yr
Water exported: 1 100.000 MG/Yr 1 MG/Yr
Enter negative % or value for under-registration
WATER SUPPLIED: 825.000 MG/Yr Enter positive % or value for over-registration.
AUTHORIZED CONSUMPTION
Billed metered: 8 700.000 MG/Yr
Billed unmetered: 9 50.000 MG/Yr
Unbilled metered: MG/Yr Pcnt: Value:
Unbilled unmetered: 10.313 MG/Yr 1.25% MG/Yr24061
AUTHORIZED CONSUMPTION: 760.313 MG/Yr
WATER LOSSES (Water Supplied - Authorized Consumption) 64.688 MG/Yr
Apparent Losses Pcnt: Value:
Unauthorized consumption: 2.063 MG/Yr 0.25% MG/Yr
Customer metering inaccuracies: 5 22.767 MG/Yr 3.15% MG/Yr
Systematic data handling errors: 1.750 MG/Yr 0.25% MG/Yr
Apparent Losses: 26.580 MG/Yr
Real Losses (Current Annual Real Losses or CARL)
Real Losses = Water Losses - Apparent Losses: 38.108 MG/Yr
WATER LOSSES: 64.688 MG/Yr
NON-REVENUE WATER
NON-REVENUE WATER: 75.000 MG/Yr
= Water Losses + Unbilled Metered + Unbilled Unmetered
SYSTEM DATA
Length of mains: 9 100.0 miles
Number of active AND inactive service connections: 6 1,000
Service connection density: 10 conn./mile main
Yes
Average length of customer service line: ft
Average operating pressure: 6 60.0 psi
COST DATA
Total annual cost of operating water system: 9 $1,000,000 $/Year
Customer retail unit cost (applied to Apparent Losses): 7 $3.50
Variable production cost (applied to Real Losses): 5 $485.00 $/Million gallons
WATER AUDIT DATA VALIDITY SCORE:
PRIORITY AREAS FOR ATTENTION:
1: Volume from own sources
2: Customer metering inaccuracies
3: Variable production cost (applied to Real Losses)
Based on the information provided, audit accuracy can be improved by addressing the following components:
$/1000 gallons (US)
<----------- Enter grading in column 'E' and 'J' ---------->
Default option selected for unauthorized consumption - a grading of 5 is applied but not displayed
*** YOUR SCORE IS: 60 out of 100 ***
A weighted scale for the components of consumption and water loss is included in the calculation of the Water Audit Data Validity Score
100.000
25.000
Default option selected for Systematic data handling errors - a grading of 5 is applied but not displayed
Average length of customer service line has been set to zero and a data grading score of 10 has been applied
Are customer meters typically located at the curbstop or property line?
AWWA Free Water Audit Software:
Reporting Worksheet
Default option selected for Unbilled unmetered - a grading of 5 is applied but not displayed
2013 1/2013 - 12/2013
Northern San Leandro Combined Water Sewer Storm Utility District (0007900)
?
?
?
?
?
? Click to access definition
?
?
?
?
?
?
Please enter data in the white cells below. Where available, metered values should be used; if metered values are unavailable please estimate a value. Indicate your confidence in the accuracy of the input data by grading each component (n/a or 1-10) using the drop-down list to the left of the input cell. Hover the mouse over the cell to obtain a description of the grades
?
?
?
?
?
?
(length of service line, beyond the property boundary, that is the responsibility of the utility)
Use buttons to selectpercentage of water
suppliedOR
value
?Click here:
for help using option buttons below
?
?
?
?
+
+ Click to add a comment
WAS v5.0
+
+
+
+
+
+
American Water Works Association.Copyright © 2014, All Rights Reserved.
?
?
?
+
+
+
+
+
+
+
+
+
+
+
+
+ Use Customer Retail Unit Cost to value real losses
?
To select the correct data grading for each input, determine the highest grade where the utility meets or exceeds all criteria for that grade and all grades below it.
Below are some specific changes on the Reporting Worksheet for version 5.
Next Generation Water Loss Tools_2014
Figure 6-Water Supplied Inputs on the Reporting Worksheet
Water Audit Report for:
Reporting Year:
All volumes to be entered as: MILLION GALLONS (US) PER YEAR
Master Meter Error Adjustments
WATER SUPPLIED Pcnt: Value:
Volume from own sources: 5 1,000.000 MG/Yr 1 MG/Yr
Water imported: MG/Yr MG/Yr
Water exported: 1 100.000 MG/Yr 9 MG/Yr
Enter negative % or value for under-registration
WATER SUPPLIED: 825.000 MG/Yr Enter positive % or value for over-registration.
AUTHORIZED CONSUMPTION
Billed metered: 8 700.000 MG/Yr
Billed unmetered: 9 50.000 MG/Yr
Unbilled metered: MG/Yr Pcnt: Value:
Unbilled unmetered: 9 10.313 MG/Yr 1.25% MG/Yr24061
AUTHORIZED CONSUMPTION: 760.313 MG/Yr
WATER LOSSES (Water Supplied - Authorized Consumption) 64.688 MG/Yr
Apparent Losses Pcnt: Value:
Unauthorized consumption: 10 3.000 MG/Yr 0.25% MG/Yr
Customer metering inaccuracies: 5 7.071 MG/Yr 1.00% MG/Yr
Systematic data handling errors: 4 5.000 MG/Yr 0.25% MG/Yr
Apparent Losses: 15.071 MG/Yr
Real Losses (Current Annual Real Losses or CARL)
Real Losses = Water Losses - Apparent Losses: 49.617 MG/Yr
WATER LOSSES: 64.688 MG/Yr
NON-REVENUE WATER
NON-REVENUE WATER: 75.000 MG/Yr
= Water Losses + Unbilled Metered + Unbilled Unmetered
SYSTEM DATA
Length of mains: 7 100.0 miles
Number of active AND inactive service connections: 6 1,000
Service connection density: 10 conn./mile main
Yes
Average length of customer service line: ft
Average operating pressure: 6 60.0 psi
COST DATA
Total annual cost of operating water system: 5 $1,000,000 $/Year
Customer retail unit cost (applied to Apparent Losses): 7 $3.50
Variable production cost (applied to Real Losses): 7 $3,000.00 $/Million gallons
WATER AUDIT DATA VALIDITY SCORE:
PRIORITY AREAS FOR ATTENTION:
1: Volume from own sources
2: Customer metering inaccuracies
3: Total annual cost of operating water system
Based on the information provided, audit accuracy can be improved by addressing the following components:
$/1000 gallons (US)
100.000
<----------- Enter grading in column 'E' and 'J' ---------->
Unauthorized consumption volume entered is greater than the recommended default value
5.000
*** YOUR SCORE IS: 60 out of 100 ***
A weighted scale for the components of consumption and water loss is included in the calculation of the Water Audit Data Validity Score
100.000
3.000
25.000
Average length of customer service line has been set to zero and a data grading score of 10 has been applied
Are customer meters typically located at the curbstop or property line?
AWWA Free Water Audit Software:
Reporting Worksheet
Default option selected for Unbilled unmetered - a grading of 5 is applied but not displayed
1.000
2013 1/2013 - 12/2013
Northern San Leandro Combined Water Sewer Storm Utility District (0007900)
?
?
?
?
?
? Click to access definition
?
?
?
?
?
?
Please enter data in the white cells below. Where available, metered values should be used; if metered values are unavailable please estimate a value. Indicate your confidence in the accuracy of the input data by grading each component (n/a or 1-10) using the drop-down list to the left of the input cell. Hover the mouse over the cell to obtain a description of the grades
?
?
?
?
?
?
(length of service line, beyond the property boundary, that is the responsibility of the utility)
Use buttons to selectpercentage of water
suppliedOR
value
?Click here:
for help using option buttons below
?
?
?
?
+
+ Click to add a comment
WAS v5.0
+
+
+
+
+
+
American Water Works Association.Copyright © 2014, All Rights Reserved.
?
?
?
+
+
+
+
+
+
+
+
+
+
+
+
+ Use Customer Retail Unit Cost to value real losses
?
To select the correct data grading for each input, determine the highest grade where the utility meets or exceeds all criteria for that grade and all grades below it.
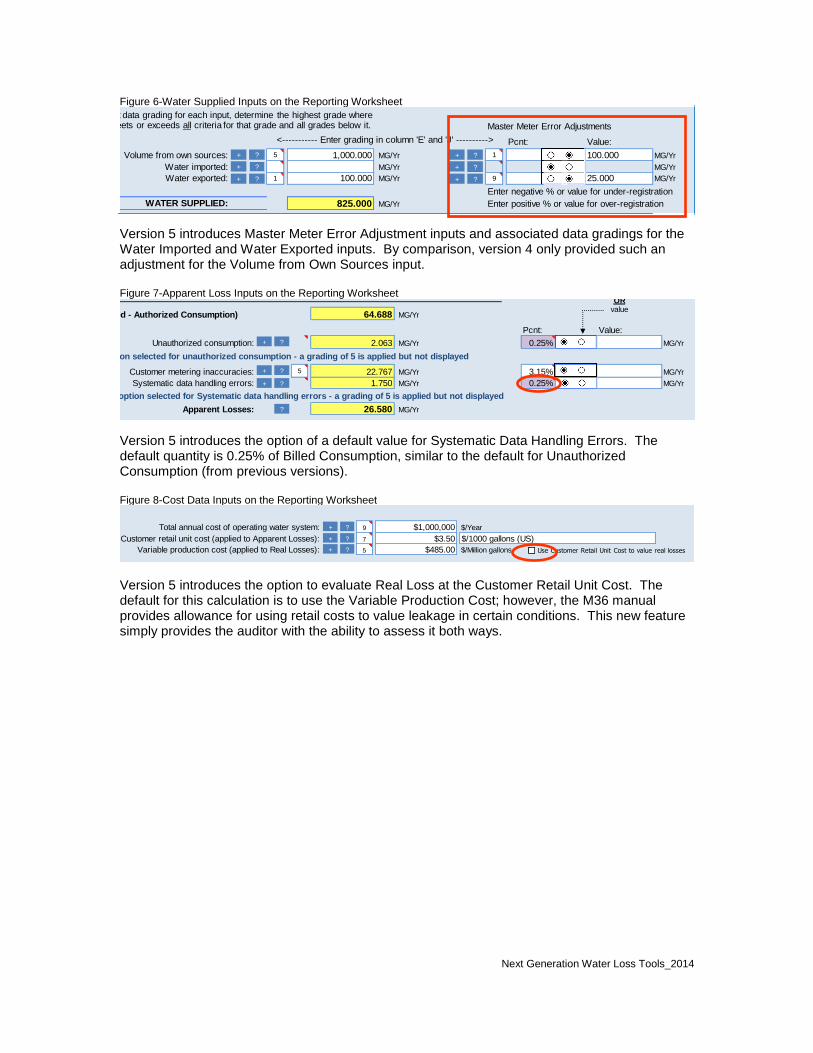
Version 5 introduces Master Meter Error Adjustment inputs and associated data gradings for the Water Imported and Water Exported inputs. By comparison, version 4 only provided such an adjustment for the Volume from Own Sources input. Figure 7-Apparent Loss Inputs on the Reporting Worksheet
Water Audit Report for:
Reporting Year:
All volumes to be entered as: MILLION GALLONS (US) PER YEAR
Master Meter Error Adjustments
WATER SUPPLIED Pcnt: Value:
Volume from own sources: 5 1,000.000 MG/Yr 1 MG/Yr
Water imported: MG/Yr MG/Yr
Water exported: 1 100.000 MG/Yr 1 MG/Yr
Enter negative % or value for under-registration
WATER SUPPLIED: 825.000 MG/Yr Enter positive % or value for over-registration.
AUTHORIZED CONSUMPTION
Billed metered: 8 700.000 MG/Yr
Billed unmetered: 9 50.000 MG/Yr
Unbilled metered: MG/Yr Pcnt: Value:
Unbilled unmetered: 10.313 MG/Yr 1.25% MG/Yr24061
AUTHORIZED CONSUMPTION: 760.313 MG/Yr
WATER LOSSES (Water Supplied - Authorized Consumption) 64.688 MG/Yr
Apparent Losses Pcnt: Value:
Unauthorized consumption: 2.063 MG/Yr 0.25% MG/Yr
Customer metering inaccuracies: 5 22.767 MG/Yr 3.15% MG/Yr
Systematic data handling errors: 1.750 MG/Yr 0.25% MG/Yr
Apparent Losses: 26.580 MG/Yr
Real Losses (Current Annual Real Losses or CARL)
Real Losses = Water Losses - Apparent Losses: 38.108 MG/Yr
WATER LOSSES: 64.688 MG/Yr
NON-REVENUE WATER
NON-REVENUE WATER: 75.000 MG/Yr
= Water Losses + Unbilled Metered + Unbilled Unmetered
SYSTEM DATA
Length of mains: 9 100.0 miles
Number of active AND inactive service connections: 6 1,000
Service connection density: 10 conn./mile main
Yes
Average length of customer service line: ft
Average operating pressure: 6 60.0 psi
COST DATA
Total annual cost of operating water system: 9 $1,000,000 $/Year
Customer retail unit cost (applied to Apparent Losses): 7 $3.50
Variable production cost (applied to Real Losses): 5 $485.00 $/Million gallons
WATER AUDIT DATA VALIDITY SCORE:
PRIORITY AREAS FOR ATTENTION:
1: Volume from own sources
2: Customer metering inaccuracies
3: Variable production cost (applied to Real Losses)
Based on the information provided, audit accuracy can be improved by addressing the following components:
$/1000 gallons (US)
<----------- Enter grading in column 'E' and 'J' ---------->
Default option selected for unauthorized consumption - a grading of 5 is applied but not displayed
*** YOUR SCORE IS: 60 out of 100 ***
A weighted scale for the components of consumption and water loss is included in the calculation of the Water Audit Data Validity Score
100.000
25.000
Default option selected for Systematic data handling errors - a grading of 5 is applied but not displayed
Average length of customer service line has been set to zero and a data grading score of 10 has been applied
Are customer meters typically located at the curbstop or property line?
AWWA Free Water Audit Software:
Reporting Worksheet
Default option selected for Unbilled unmetered - a grading of 5 is applied but not displayed
2013 1/2013 - 12/2013
Northern San Leandro Combined Water Sewer Storm Utility District (0007900)
?
?
?
?
?
? Click to access definition
?
?
?
?
?
?
Please enter data in the white cells below. Where available, metered values should be used; if metered values are unavailable please estimate a value. Indicate your confidence in the accuracy of the input data by grading each component (n/a or 1-10) using the drop-down list to the left of the input cell. Hover the mouse over the cell to obtain a description of the grades
?
?
?
?
?
?
(length of service line, beyond the property boundary, that is the responsibility of the utility)
Use buttons to selectpercentage of water
suppliedOR
value
?Click here:
for help using option buttons below
?
?
?
?
+
+ Click to add a comment
WAS v5.0
+
+
+
+
+
+
American Water Works Association.Copyright © 2014, All Rights Reserved.
?
?
?
+
+
+
+
+
+
+
+
+
+
+
+
+ Use Customer Retail Unit Cost to value real losses
?
To select the correct data grading for each input, determine the highest grade where the utility meets or exceeds all criteria for that grade and all grades below it.
Version 5 introduces the option of a default value for Systematic Data Handling Errors. The default quantity is 0.25% of Billed Consumption, similar to the default for Unauthorized Consumption (from previous versions). Figure 8-Cost Data Inputs on the Reporting Worksheet
Water Audit Report for:
Reporting Year:
All volumes to be entered as: MILLION GALLONS (US) PER YEAR
Master Meter Error Adjustments
WATER SUPPLIED Pcnt: Value:
Volume from own sources: 5 1,000.000 MG/Yr 1 MG/Yr
Water imported: MG/Yr MG/Yr
Water exported: 1 100.000 MG/Yr 1 MG/Yr
Enter negative % or value for under-registration
WATER SUPPLIED: 825.000 MG/Yr Enter positive % or value for over-registration.
AUTHORIZED CONSUMPTION
Billed metered: 8 700.000 MG/Yr
Billed unmetered: 9 50.000 MG/Yr
Unbilled metered: MG/Yr Pcnt: Value:
Unbilled unmetered: 10.313 MG/Yr 1.25% MG/Yr24061
AUTHORIZED CONSUMPTION: 760.313 MG/Yr
WATER LOSSES (Water Supplied - Authorized Consumption) 64.688 MG/Yr
Apparent Losses Pcnt: Value:
Unauthorized consumption: 2.063 MG/Yr 0.25% MG/Yr
Customer metering inaccuracies: 5 22.767 MG/Yr 3.15% MG/Yr
Systematic data handling errors: 1.750 MG/Yr 0.25% MG/Yr
Apparent Losses: 26.580 MG/Yr
Real Losses (Current Annual Real Losses or CARL)
Real Losses = Water Losses - Apparent Losses: 38.108 MG/Yr
WATER LOSSES: 64.688 MG/Yr
NON-REVENUE WATER
NON-REVENUE WATER: 75.000 MG/Yr
= Water Losses + Unbilled Metered + Unbilled Unmetered
SYSTEM DATA
Length of mains: 9 100.0 miles
Number of active AND inactive service connections: 6 1,000
Service connection density: 10 conn./mile main
Yes
Average length of customer service line: ft
Average operating pressure: 6 60.0 psi
COST DATA
Total annual cost of operating water system: 9 $1,000,000 $/Year
Customer retail unit cost (applied to Apparent Losses): 7 $3.50
Variable production cost (applied to Real Losses): 5 $485.00 $/Million gallons
WATER AUDIT DATA VALIDITY SCORE:
PRIORITY AREAS FOR ATTENTION:
1: Volume from own sources
2: Customer metering inaccuracies
3: Variable production cost (applied to Real Losses)
Based on the information provided, audit accuracy can be improved by addressing the following components:
$/1000 gallons (US)
<----------- Enter grading in column 'E' and 'J' ---------->
Default option selected for unauthorized consumption - a grading of 5 is applied but not displayed
*** YOUR SCORE IS: 60 out of 100 ***
A weighted scale for the components of consumption and water loss is included in the calculation of the Water Audit Data Validity Score
100.000
25.000
Default option selected for Systematic data handling errors - a grading of 5 is applied but not displayed
Average length of customer service line has been set to zero and a data grading score of 10 has been applied
Are customer meters typically located at the curbstop or property line?
AWWA Free Water Audit Software:
Reporting Worksheet
Default option selected for Unbilled unmetered - a grading of 5 is applied but not displayed
2013 1/2013 - 12/2013
Northern San Leandro Combined Water Sewer Storm Utility District (0007900)
?
?
?
?
?
? Click to access definition
?
?
?
?
?
?
Please enter data in the white cells below. Where available, metered values should be used; if metered values are unavailable please estimate a value. Indicate your confidence in the accuracy of the input data by grading each component (n/a or 1-10) using the drop-down list to the left of the input cell. Hover the mouse over the cell to obtain a description of the grades
?
?
?
?
?
?
(length of service line, beyond the property boundary, that is the responsibility of the utility)
Use buttons to selectpercentage of water
suppliedOR
value
?Click here:
for help using option buttons below
?
?
?
?
+
+ Click to add a comment
WAS v5.0
+
+
+
+
+
+
American Water Works Association.Copyright © 2014, All Rights Reserved.
?
?
?
+
+
+
+
+
+
+
+
+
+
+
+
+ Use Customer Retail Unit Cost to value real losses
?
To select the correct data grading for each input, determine the highest grade where the utility meets or exceeds all criteria for that grade and all grades below it.
Version 5 introduces the option to evaluate Real Loss at the Customer Retail Unit Cost. The default for this calculation is to use the Variable Production Cost; however, the M36 manual provides allowance for using retail costs to value leakage in certain conditions. This new feature simply provides the auditor with the ability to assess it both ways.
Next Generation Water Loss Tools_2014
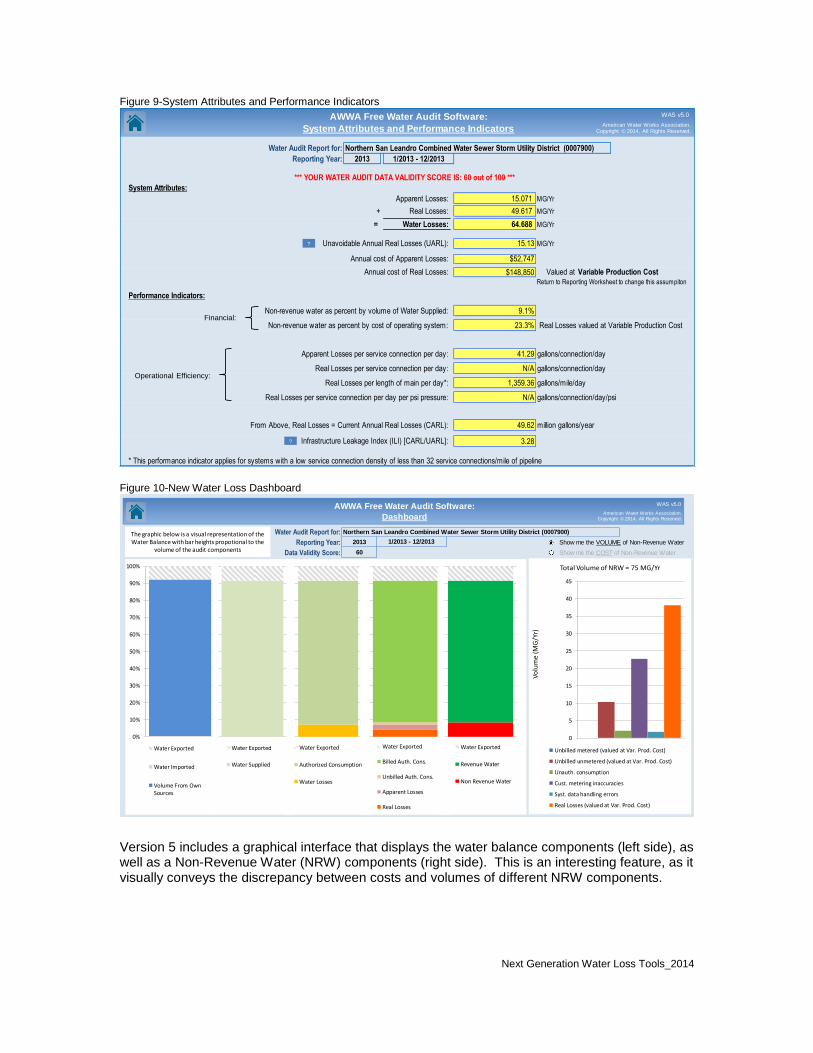
Figure 9-System Attributes and Performance Indicators
Water Audit Report for: Northern San Leandro Combined Water Sewer Storm Utility District (0007900)
Reporting Year:
System Attributes:
Apparent Losses: 15.071 MG/Yr
+ Real Losses: 49.617 MG/Yr
= Water Losses: 64.688 MG/Yr
Unavoidable Annual Real Losses (UARL): 15.13 MG/Yr
Annual cost of Apparent Losses: $52,747
Annual cost of Real Losses: $148,850 Valued at Variable Production Cost
Performance Indicators:
Non-revenue water as percent by volume of Water Supplied: 9.1%
Non-revenue water as percent by cost of operating system: 23.3% Real Losses valued at Variable Production Cost
Apparent Losses per service connection per day: 41.29 gallons/connection/day
Real Losses per service connection per day: N/A gallons/connection/day
Real Losses per length of main per day*: 1,359.36 gallons/mile/day
Real Losses per service connection per day per psi pressure: N/A gallons/connection/day/psi
From Above, Real Losses = Current Annual Real Losses (CARL): 49.62 million gallons/year
3.28
* This performance indicator applies for systems with a low service connection density of less than 32 service connections/mile of pipeline
Infrastructure Leakage Index (ILI) [CARL/UARL]:
2013 1/2013 - 12/2013
Return to Reporting Worksheet to change this assumpiton
AWWA Free Water Audit Software:
System Attributes and Performance Indicators
*** YOUR WATER AUDIT DATA VALIDITY SCORE IS: 60 out of 100 ***
?
?
American Water Works Association.Copyright © 2014, All Rights Reserved.
WAS v5.0
Financial:
Operational Efficiency:
Figure 10-New Water Loss Dashboard
Water Audit Report for:
Reporting Year: 2013 Show me the VOLUME of Non-Revenue Water
Data Validity Score: 60 Show me the COST of Non-Revenue Water
AWWA Free Water Audit Software:
Dashboard
1/2013 - 12/2013
Northern San Leandro Combined Water Sewer Storm Utility District (0007900)
0
5
10
15
20
25
30
35
40
45
Volu
me
(MG
/Yr)
Total Volume of NRW = 75 MG/Yr
Unbilled metered (valued at Var. Prod. Cost)
Unbilled unmetered (valued at Var. Prod. Cost)
Unauth. consumption
Cust. metering inaccuracies
Syst. data handling errors
Real Losses (valued at Var. Prod. Cost)
WAS v5.0
American Water Works Association.Copyright © 2014, All Rights Reserved.
Water Exported
Authorized Consumption
Water Losses
0%
10%
20%
30%
40%
50%
60%
70%
80%
90%
100%
Water Exported
Water Imported
Volume From OwnSources
Water Exported
Billed Auth. Cons.
Unbilled Auth. Cons.
Apparent Losses
Real Losses
Water Exported
Revenue Water
Non Revenue Water
The graphic below is a visual representation of the Water Balance with bar heights propotional to the
volume of the audit components
Water Exported
Water Supplied
Version 5 includes a graphical interface that displays the water balance components (left side), as well as a Non-Revenue Water (NRW) components (right side). This is an interesting feature, as it visually conveys the discrepancy between costs and volumes of different NRW components.
Next Generation Water Loss Tools_2014
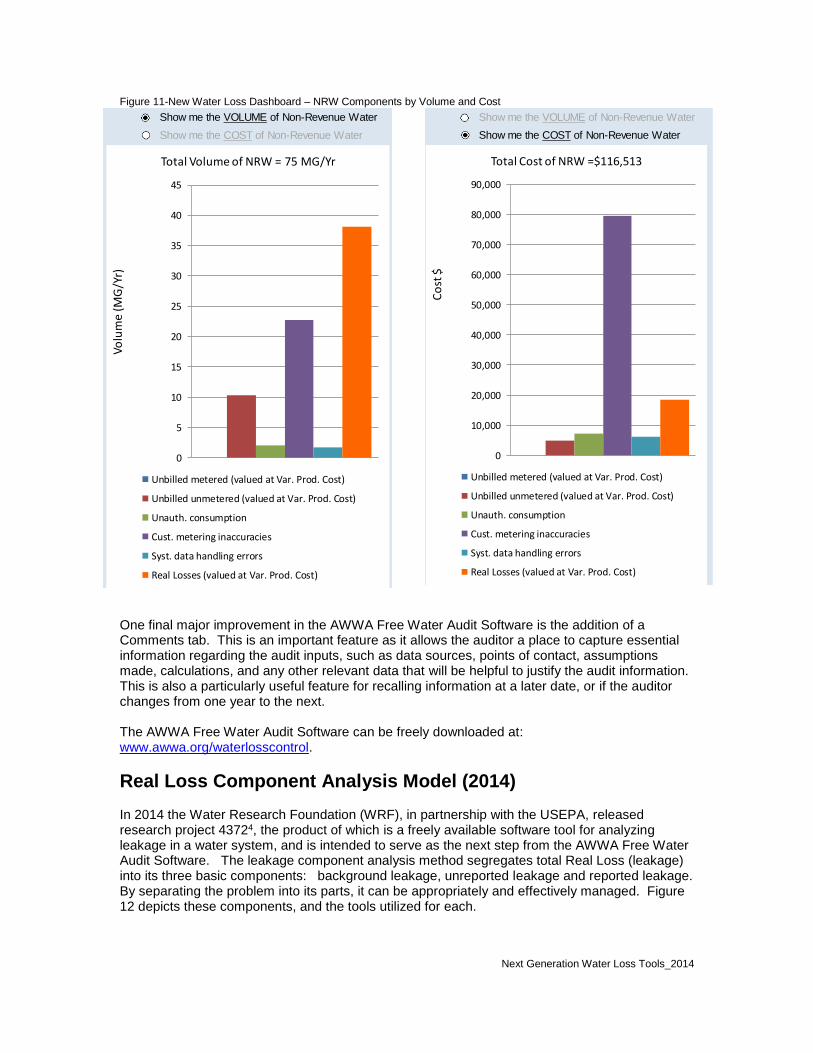
Figure 11-New Water Loss Dashboard – NRW Components by Volume and Cost
One final major improvement in the AWWA Free Water Audit Software is the addition of a Comments tab. This is an important feature as it allows the auditor a place to capture essential information regarding the audit inputs, such as data sources, points of contact, assumptions made, calculations, and any other relevant data that will be helpful to justify the audit information. This is also a particularly useful feature for recalling information at a later date, or if the auditor changes from one year to the next. The AWWA Free Water Audit Software can be freely downloaded at: www.awwa.org/waterlosscontrol.
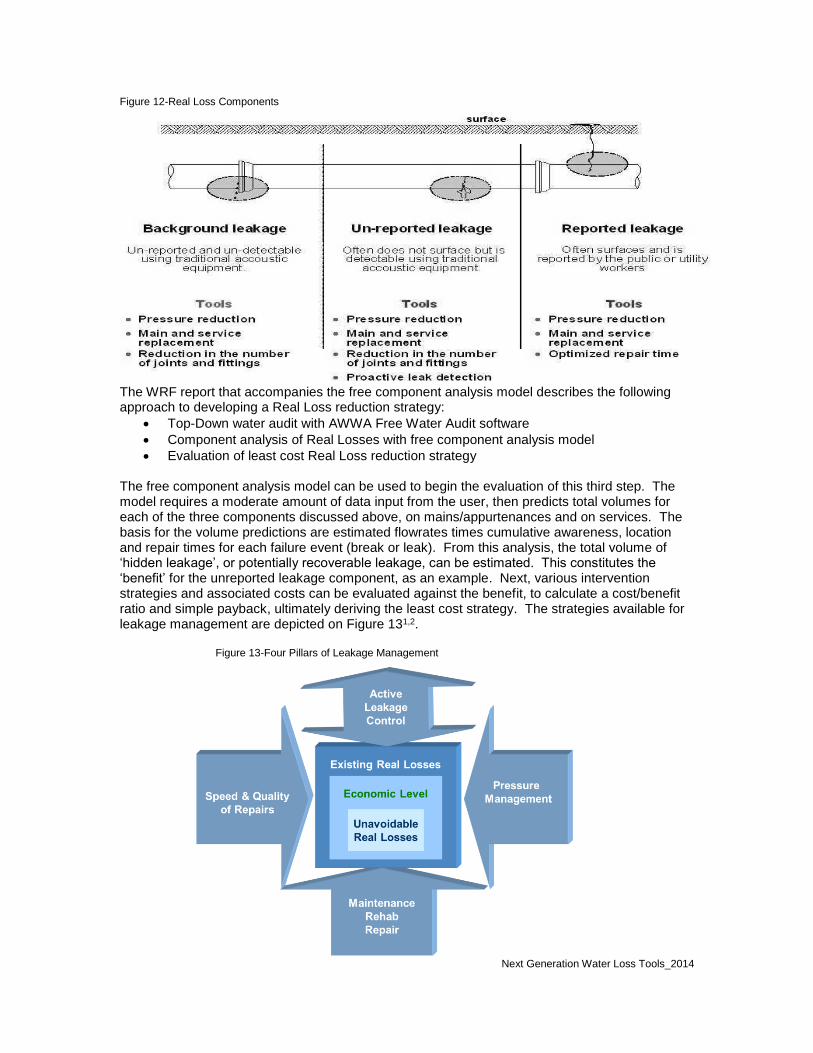
Real Loss Component Analysis Model (2014) In 2014 the Water Research Foundation (WRF), in partnership with the USEPA, released research project 43724, the product of which is a freely available software tool for analyzing leakage in a water system, and is intended to serve as the next step from the AWWA Free Water Audit Software. The leakage component analysis method segregates total Real Loss (leakage) into its three basic components: background leakage, unreported leakage and reported leakage. By separating the problem into its parts, it can be appropriately and effectively managed. Figure 12 depicts these components, and the tools utilized for each.
Water Audit Report for:
Reporting Year: 2013 Show me the VOLUME of Non-Revenue Water
Data Validity Score: 60 Show me the COST of Non-Revenue Water
AWWA Free Water Audit Software:
Dashboard
1/2013 - 12/2013
Northern San Leandro Combined Water Sewer Storm Utility District (0007900)
0
10,000
20,000
30,000
40,000
50,000
60,000
70,000
80,000
90,000
Co
st $
Total Cost of NRW =$116,513
Unbilled metered (valued at Var. Prod. Cost)
Unbilled unmetered (valued at Var. Prod. Cost)
Unauth. consumption
Cust. metering inaccuracies
Syst. data handling errors
Real Losses (valued at Var. Prod. Cost)
WAS v5.0
American Water Works Association.Copyright © 2014, All Rights Reserved.
Water Exported
Authorized Consumption
Water Losses
0%
10%
20%
30%
40%
50%
60%
70%
80%
90%
100%
Water Exported
Water Imported
Volume From OwnSources
Water Exported
Billed Auth. Cons.
Unbilled Auth. Cons.
Apparent Losses
Real Losses
Water Exported
Revenue Water
Non Revenue Water
The graphic below is a visual representation of the Water Balance with bar heights propotional to the
volume of the audit components
Water Exported
Water Supplied
Water Audit Report for:
Reporting Year: 2013 Show me the VOLUME of Non-Revenue Water
Data Validity Score: 60 Show me the COST of Non-Revenue Water
AWWA Free Water Audit Software:
Dashboard
1/2013 - 12/2013
Northern San Leandro Combined Water Sewer Storm Utility District (0007900)
0
5
10
15
20
25
30
35
40
45
Volu
me
(MG
/Yr)
Total Volume of NRW = 75 MG/Yr
Unbilled metered (valued at Var. Prod. Cost)
Unbilled unmetered (valued at Var. Prod. Cost)
Unauth. consumption
Cust. metering inaccuracies
Syst. data handling errors
Real Losses (valued at Var. Prod. Cost)
WAS v5.0
American Water Works Association.Copyright © 2014, All Rights Reserved.
Water Exported
Authorized Consumption
Water Losses
0%
10%
20%
30%
40%
50%
60%
70%
80%
90%
100%
Water Exported
Water Imported
Volume From OwnSources
Water Exported
Billed Auth. Cons.
Unbilled Auth. Cons.
Apparent Losses
Real Losses
Water Exported
Revenue Water
Non Revenue Water
The graphic below is a visual representation of the Water Balance with bar heights propotional to the
volume of the audit components
Water Exported
Water Supplied
Next Generation Water Loss Tools_2014
Figure 12-Real Loss Components
The WRF report that accompanies the free component analysis model describes the following approach to developing a Real Loss reduction strategy:
Top-Down water audit with AWWA Free Water Audit software
Component analysis of Real Losses with free component analysis model
Evaluation of least cost Real Loss reduction strategy The free component analysis model can be used to begin the evaluation of this third step. The model requires a moderate amount of data input from the user, then predicts total volumes for each of the three components discussed above, on mains/appurtenances and on services. The basis for the volume predictions are estimated flowrates times cumulative awareness, location and repair times for each failure event (break or leak). From this analysis, the total volume of ‘hidden leakage’, or potentially recoverable leakage, can be estimated. This constitutes the ‘benefit’ for the unreported leakage component, as an example. Next, various intervention strategies and associated costs can be evaluated against the benefit, to calculate a cost/benefit ratio and simple payback, ultimately deriving the least cost strategy. The strategies available for leakage management are depicted on Figure 131,2.
Figure 13-Four Pillars of Leakage Management
Next Generation Water Loss Tools_2014
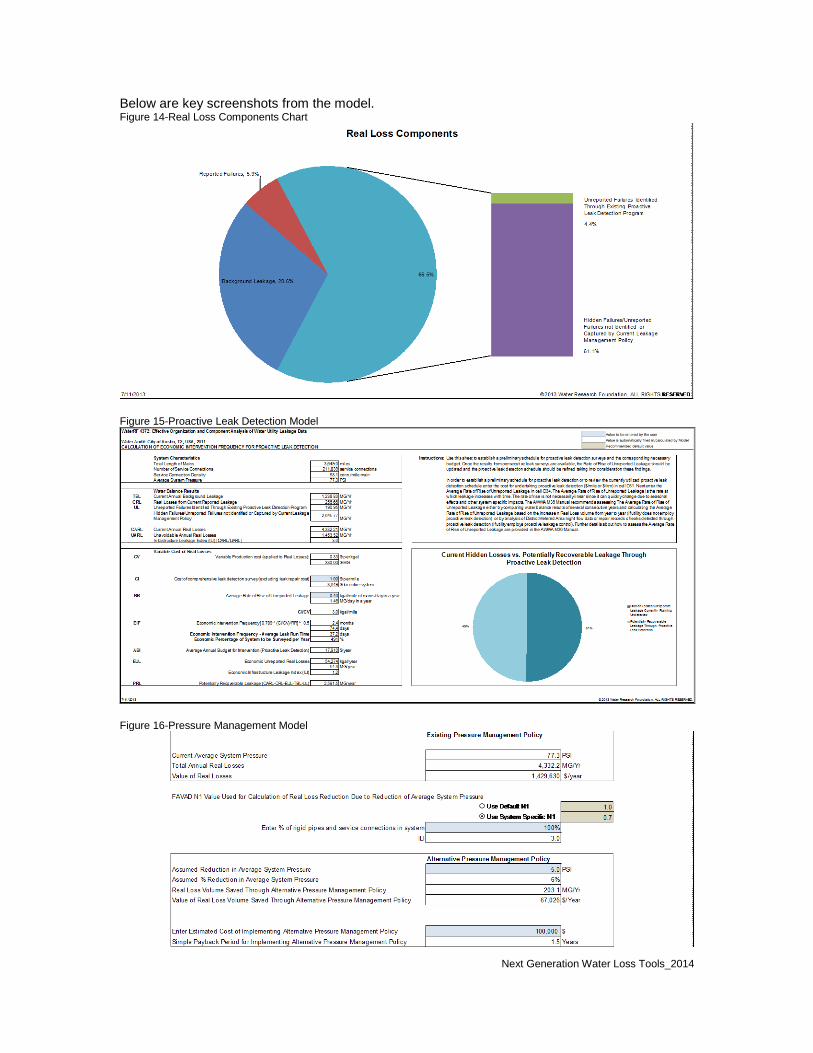
Below are key screenshots from the model. Figure 14-Real Loss Components Chart
Figure 15-Proactive Leak Detection Model
Figure 16-Pressure Management Model
Next Generation Water Loss Tools_2014
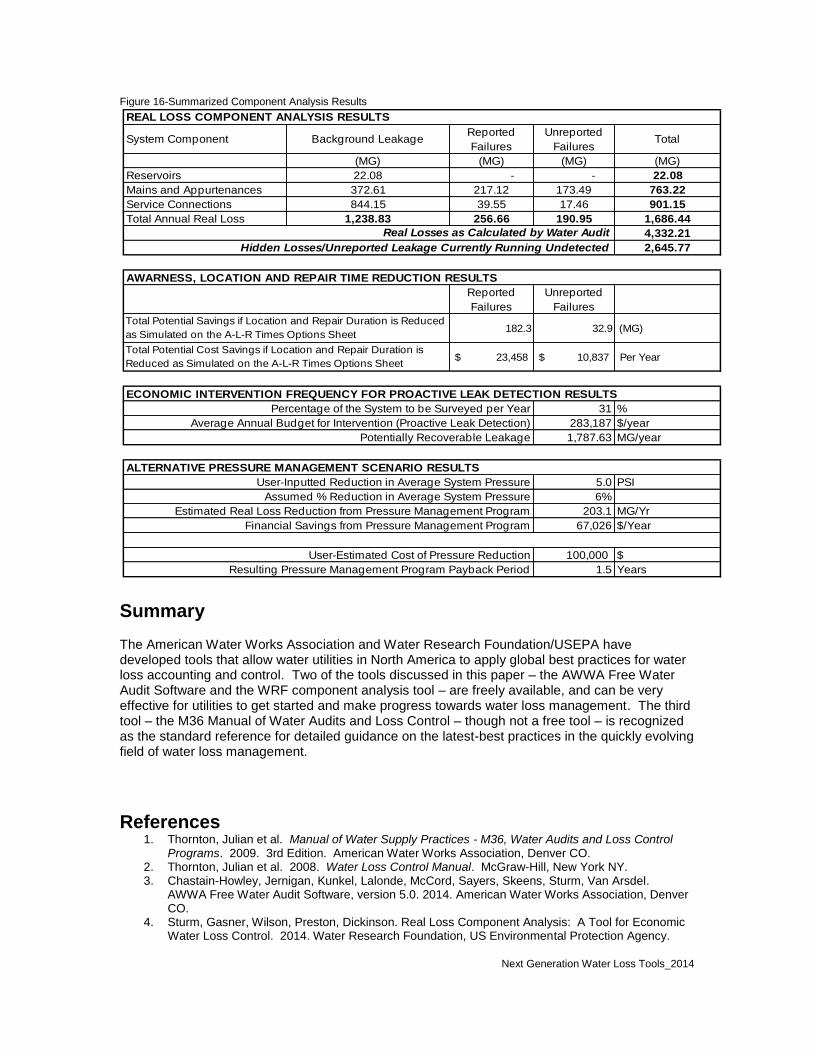
Figure 16-Summarized Component Analysis Results
WaterRF 4372: Effective Organization and Component Analysis of Water Utility Leakage Data
WaterRF 4372 COMPONENT ANALYSIS MODEL SUMMARY
10.3%
3.0%
$4,376,956
$1,429,630
13.7 gal/service conn/day
56.0 gal/service conn/day
N/A gal/mi/day
0.7 gal/service conn/day/psi
1,453.52 MG/Yr
4,332.21 MG/Yr
3.0
System Component Background LeakageReported
Failures
Unreported
FailuresTotal
(MG) (MG) (MG) (MG)
Reservoirs 22.08 - - 22.08
Mains and Appurtenances 372.61 217.12 173.49 763.22
Service Connections 844.15 39.55 17.46 901.15
Total Annual Real Loss 1,238.83 256.66 190.95 1,686.44
4,332.21
2,645.77
AWARNESS, LOCATION AND REPAIR TIME REDUCTION RESULTS
Reported
Failures
Unreported
Failures
182.3 32.9 (MG)
23,458$ 10,837$ Per Year
ECONOMIC INTERVENTION FREQUENCY FOR PROACTIVE LEAK DETECTION RESULTS
31 %
283,187 $/year
1,787.63 MG/year
5.0 PSI
6%
203.1 MG/Yr
67,026 $/Year
100,000 $
1.5 Years
©2013 Water Research Foundation. ALL RIGHTS RESERVED.
Current Annual Real Losses (CARL):
Real Losses as Calculated by Water Audit
Hidden Losses/Unreported Leakage Currently Running Undetected
Total Potential Cost Savings if Location and Repair Duration is
Reduced as Simulated on the A-L-R Times Options Sheet
7/11/2013
Infrastructure Leakage Index (ILI) [CARL/UARL]:
REAL LOSS COMPONENT ANALYSIS RESULTS
Total Potential Savings if Location and Repair Duration is Reduced
as Simulated on the A-L-R Times Options Sheet
Percentage of the System to be Surveyed per Year
Average Annual Budget for Intervention (Proactive Leak Detection)
User-Estimated Cost of Pressure Reduction
Resulting Pressure Management Program Payback Period
Assumed % Reduction in Average System Pressure
Estimated Real Loss Reduction from Pressure Management Program
Financial Savings from Pressure Management Program
ALTERNATIVE PRESSURE MANAGEMENT SCENARIO RESULTS
Potentially Recoverable Leakage
User-Inputted Reduction in Average System Pressure
Real Losses per length of main per day:
Real Losses per service connection per day per 1787.62743734595 pressure:
Apparent Losses per service connection per day:
Unavoidable Annual Real Losses (UARL):
Water Audit: City of Austin, TX, USA, 2011
Real Losses per service connection per day* :
As the input data is filled into the model, this sheet will populate with the results and recommendations from the
Real Losses Component Analysis, A-L-R Times, Economic Intervention and Pressure Management tabs. The
performance indicators from the AWWA Free Water Audit Software have been added to show a brief review of the
performance the system being analyzed
Annual cost of Real Losses:
Operational Efficiency
WATER AUDIT PERFORMANCE INDICATORS
Financial
Non-revenue water as percent by volume of water supplied:
Non-revenue water as percent by cost of operating system:
Annual cost of Apparent Losses:
Summary The American Water Works Association and Water Research Foundation/USEPA have developed tools that allow water utilities in North America to apply global best practices for water loss accounting and control. Two of the tools discussed in this paper – the AWWA Free Water Audit Software and the WRF component analysis tool – are freely available, and can be very effective for utilities to get started and make progress towards water loss management. The third tool – the M36 Manual of Water Audits and Loss Control – though not a free tool – is recognized as the standard reference for detailed guidance on the latest-best practices in the quickly evolving field of water loss management.
References
1. Thornton, Julian et al. Manual of Water Supply Practices - M36, Water Audits and Loss Control Programs. 2009. 3rd Edition. American Water Works Association, Denver CO.
2. Thornton, Julian et al. 2008. Water Loss Control Manual. McGraw-Hill, New York NY. 3. Chastain-Howley, Jernigan, Kunkel, Lalonde, McCord, Sayers, Skeens, Sturm, Van Arsdel.
AWWA Free Water Audit Software, version 5.0. 2014. American Water Works Association, Denver CO.
4. Sturm, Gasner, Wilson, Preston, Dickinson. Real Loss Component Analysis: A Tool for Economic Water Loss Control. 2014. Water Research Foundation, US Environmental Protection Agency.
Related Documents