http://www.uel.ac.uk/psychology/staff/virginialam/ National Identity, Knowledge about Countries Intergroup Attitudes, Competitiveness and Sport Participation of Newham Pupils in the Run-up to the 2012 Olympics: Baseline Study A Non-technical Report for Schools UEL Psychology & Institute for Research in Child Development Principal Investigator: Virginia Lam

Welcome message from author
This document is posted to help you gain knowledge. Please leave a comment to let me know what you think about it! Share it to your friends and learn new things together.
Transcript
http://www.uel.ac.uk/psychology/staff/virginialam/
National Identity, Knowledge about Countries
Intergroup Attitudes, Competitiveness and
Sport Participation of Newham Pupils in the
Run-up to the 2012 Olympics: Baseline Study
A Non-technical Report for Schools
UEL Psychology &
Institute for Research in Child Development
Principal Investigator: Virginia Lam
http://www.uel.ac.uk/psychology/staff/virginialam/
Acknowledgements:
This study would not be possible without the support by the children and staff
of participating schools; our thanks go to all headteachers for endorsing the fieldwork
to take place in their schools, teachers and other staff for organising the classes, and
pupils for being so helpful, patient and inspiring in our tasks so far.
Foreword:
This study, the first part of a three-year project, was funded by the University
of East London’s (UEL) Research and Development Support unit. The project was
borne out of the idea that momentous historical national events, such as the 2012
Olympics, may have lasting and significant impacts on children’s self-development,
such as their sense of identity, knowledge about other countries, understanding of
people from those countries and of course, their sport participation and competitive
attitude, as a result of the exposure to a large-scale international sporting occasion.
This is likely to be particularly pertinent to those from the multicultural communities in
Newham, where most of the 2012 Games will be hosted. Indeed, the ‘Olympic effect’
was already felt when we approached the Newham schools by Summer Term 2011,
when they were hosting Olympics-themed events and receiving sportsmen/women.
We were extremely grateful that the staff and pupils were able to accommodate our
visits among their busy schedules across that Summer Term, and the Autumn Term
of 2011-2012. The purpose of our work was to establish baseline (or ‘pre-Olympics’)
measures. This report summarises some of our key findings, in a non-technical way,
from the schools in Newham alone where over 400 pupils completed all the tasks.
As we count down to the Olympics on our doorstep this summer, we also look
forward to re-visiting schools that took part in our baseline after the Games (planned
for the Autumn Term 2012-2013) to explore whether and how the Olympic effect may
have impacted on the pupils.
I hope you will enjoy reading this report and perhaps sharing with the pupils.
Considering that this research investigates and celebrates a salient aspect of child
development, if you would like me, or a member of the research group, to come to
your school to perform a visual presentation of our study to your staff and/or pupils,
please contact me at the details below, and we would be delighted to disseminate.
Meanwhile, if any member of staff or children would like to give their comments or
raise any questions about this study, please feel free to contact us; as researchers
we appreciate input and feedback given by the ‘stakeholders’ of our work; i.e., any
school, child, parent and community group that give their time to help us.
Virginia Lam, PhD CPsychol (Principal Investigator)
This report was prepared and produced by/in:
School of Psychology, University of East London, The Green, Stratford, LONDON
E15 4LZ. Tel. (Dr Lam): 020 8223 2817 / 07731 780 996 / email: [email protected]
http://www.uel.ac.uk/psychology/staff/virginialam/
Background
The ‘Olympic’ Backdrop
The Olympics are seen as significant national events by the countries chosen
to host them. The 2012 Games in London are no exception, and given the economic
investments and the historical prestige of the occasion, it is important to ensure that
we examined all potentially positive effects of the games. One potential legacy is the
role that the 2012 Olympics may play in shaping and enhancing a sense of national
identity in children of Great Britain. To cite the statement of the most prolific writer in
this aspect of development, Professor Martyn Barrett—many major historical events,
such as large-scale national sporting events, are seen as salient ‘emblems’ that can
“embody the national group’s collective memories and serve as a reminder to group
members of what they share…providing a sense of group cohesion and belonging
that might otherwise be lacking..." (Barrett, 2005; p. 260). The event and its media
coverage can emphasise or ‘concretise’ (through sport) the concept of ‘Britishness’
and draw together a collective identity across diverse groups in East London.
On British Identity
This theoretical starting point about the potential impact of significant national
events on national identity is of interest not only to academics, but also to the public
and practitioners. Not many realise that as a highly diverse society, English children
(Barrett, 1996) and adults (Condor, 1996) see being ‘British’ as a highly unimportant
part of their identity. Nationality is seen as less important than their gender, age, city
and the ‘supra-national’ concept of ‘English’ by 6-12-year-olds (Barrett et al., 2003).
Furthermore, British children show relatively less knowledge about foreign countries
compared to children from most other European countries, such as Dutch (Johoda &
Woerdenbagch, 1982) and Italian children (Barrett & Farroni, 1996).
Interestingly, the strength of British identity and quantity of knowledge about
countries vary as a function of children’s demographics, including ethnicity, gender
(Lam & Smith, 2009), socioeconomic class (Rutland, 1998) and geographical (urban
versus rural) or civic (home counties versus capitals) context (Bourchier et al., 2002).
Boys, white and urban (particularly London) children report a stronger British identity
whilst minority and urban children have greater knowledge about other countries.
Children’s national identity and knowledge are often accompanied by feelings
(affect) about those countries and their people, which usually exist by age 5-6 years
(Barrett et al., 2003). However, strong favouritism towards their own national group is
not prevalent among British children (Barrett, 2007). Similarly, actual ‘dislike’ towards
specific foreign nation states or national groups is rare, except for those regarded as
‘traditional enemies’, such as the Germans (Barrett et al., 2003). Children derive their
ideas about the groups about whom they have value-laden attitudes from a variety of
sources, particularly the media (Barrett, 2005). Without these sources, children may
be unbiased against (or indifferent towards) other countries and their people.
http://www.uel.ac.uk/psychology/staff/virginialam/
Identity and Sport
Surprisingly little work has studied the link between national identity and sport,
if many scholars, including British (Maguire, 2011), have discussed it. Ten years ago
at the Nation and Sport conference it was argued (Wright, 2001) that “…sport played
at all levels can contribute to our sense of national identity…in this context pride can
be defended as an appropriate emotion, which can enhance sport as a human good
and enrich our experience, whether we are watching or participating”. Further, “sport
enjoyment can be “intensified and inspired by the national dimension”. Playing or just
spectating can enhance the sense of pride in one’s country, and knowing that one is
playing for or backing one’s country can also enhance one’s enjoyment in that sport.
Dutch sociologists Vermeulen and Verweel (2009) explain that this enhancement is
particularly strong in team sport in that social cohesion is promoted by bonding and
bridging ‘social capital’ (benefits enabled by social interaction) between members to
generate reciprocal contact and trust, what they refer to as ‘identity works’.
Meanwhile, research shows that sport participation varies as a function of the
young person’s ethnicity (Burdsey, 2006), culture (Tsang et al., 2005) or social class
(Seabra et al., 2008; Vandendriessche et al., 2012). The sports played or spectated
(football versus cricket, for example) by Asian youths are tied to their national-ethnic
(English versus pan-Asian) identity, and East Asian youths have more goal-oriented
motivation (versus enjoyment) to sport than European pupils. Lower-SES pupils, not
surprisingly, play less sport altogether than their middle-class counterparts.
Identity and Competitiveness
Closely linked to sport is competitiveness, and most sports involve an element
of competition. The area of identity to which this is relevant is the attitudinal aspects;
affect or feelings towards other countries or people, particularly when they represent
the ‘competitors’ in this context. Under normal (non-competitive) conditions, contact
between groups can reduce prejudice towards the out-group (the group of which one
is not a member), which includes refugees, and other-ethnic and disabled individuals
(Cameron et al., 2006, 2007, 2011). However, if intergroup contact takes place under
conditions where competition or threat (rather than cooperation or shared identity) is
salient or perceived, negative attitudes can be created or worsen according to many
prominent social psychologists (Brown & Hewstone, 2005; Pettigrew et al., 2011).
Australian child psychologist Drew Nesdale (2001, 2003, 20007) reasons that
children do not necessarily dislike their out-groups, but only under certain conditions,
one of which being perceived threat or competition from out-groups. In experiments,
it has been shown that under conditions of (real or potential) competition or conflict,
children see members from their own group (in-group) as more similar to themselves
and prefer them over those from an out-group. However, children differ in how much
they tend to see others as competitors or events as competitive, not least by gender
—boys tend to show a greater competitive attitude (Hibbard & Buhrmester, 2010).
http://www.uel.ac.uk/psychology/staff/virginialam/
This Project
It is clear that the various aspects of children’s identity and group attitudes are
intrinsically linked to other areas important for their growth and development, such as
sport participation and competitiveness. It is also anticipated that as a significant life-
changing national event, the upcoming London Olympics will impact on these areas.
This event offers a highly unique and valuable backdrop against which any potential
positive (or even negative) changes may occur to these areas among the young that
live nearby the event. Such changes may include a (short to medium term) ‘boost’ in
their collective sense of national (British) identity, knowledge about foreign countries
(through largely the greater media exposure but possibly also through the increase in
opportunities for direct observation and contact during the Olympics) and as a result,
more favourable attitudes towards them.
At the same time, Olympic Games are also essentially a large-scale and high-
profile competitive sporting occasion and hence (depending on a child’s competitive
attitude; how competitively they view the events) certain children’s attitudes towards
other countries and people (the ‘out-groups’) may worsen. Furthermore, exposure to
sport (and a greater variety of sport activities) is and has been greater (both directly
and indirectly through school and the media) in this past year and the current period.
It is likely that sport participation will have increased as a result of the occasion. It is
also possible that children’s increasing sense of British identity is closely tied to their
(greater) sport participation since this period, considering the discussed relationship
between national identity and sport participation. Finally, different children will have
experienced this period and developed differently; national identity as well as sport
participation and competitiveness by themselves differ by children’s demographics
(such as gender, ethnicity and social class) as reviewed above.
This ‘Olympic’ project is aimed at investigating the above potential outcomes
resulting from the Games on local children and adolescents. To this end, we tested
pupils in several Newham schools in the year before the Olympics (2011) measuring
their level of: identification with Britain and with their respective ethnicity; knowledge
about Britain and other countries (from three continents; see next section); attitudes
towards people from Britain and the other countries; sport participation; competitive
attitude. We also asked them questions regarding how they perceived the Olympics.
These levels serve as the ‘pre-Olympic’ baseline measures and the pattern of which
in some 400 Newham pupils who completed the task are presented in this report, so
that schools have an idea ‘where’ their pupils are at in terms of their national identity,
knowledge, group attitudes, sport participation and competitiveness.
It is our objective to re-visit the schools with the aim of measuring their ‘post-
Olympic’ levels in Autumn Term of 2012, thus the months immediately following the
summer Olympics, from the same pupils that took part in this baseline study in 2011.
This way, we will be in a position to explore the impact that the Olympics would have
made on those measures.
http://www.uel.ac.uk/psychology/staff/virginialam/
Fieldwork in Newham
The sample
We talked to close to 500 pupils from six state schools (four primary and two
secondary) in Newham Borough, all within 3 miles from the Olympic site in Stratford.
Due to various reasons (e.g., shortage of time, incomplete responses) the resultant
sample consisted of 401 who completed the tasks. We purposefully tested year 1s,
year 4s, year 7s and year 10s to explore age differences. Of the sample of 401, 25%
(102) were aged 5-6 (year 1), 32% (130) 8-9 (year 4), 20% (80) 11-12, and 22% (89)
14-15 (year 10) at the time of testing (Summer Term 2011-2; Autumn Term 2012-3).
There was a roughly equal gender split (48% male vs. 52% female) and the
extremely ethnic diverse sample consisted of (according to Census 2011’s criteria):
25% (100) ‘white’, 30% (119) ‘black’, 37% (150) ‘Asian’ and 8% (32) ‘mixed race’. Of
the white sub-sample, two-thirds were ‘other white European’ (with more Lithuanians
than other sub-groups), with the rest being ‘white English, Scottish, Irish and Welsh’.
The majority (65%) of the black sub-sample was of African descent; the others were
Caribbean and ‘other black’) and about half of the Asian sub-sample self-categorised
as Bangladeshi (the others Pakistani, Indian and ‘other Asian’). The sample reported
speaking over 40 languages apart from English, with the most spoken being Bengali,
followed by Urdu, Tamil and Lithuanian. Around 63% were British-born (47% of white
vs. 70% black, 68% Asian, 75% mixed race/other), with those foreign-born reporting
that they had lived in Britain between one and fifteen (the average was five) years.
Table 1. Sample age/year group, ethnic and socio-economic demographics
Age (years) % Ethnicity (Census) % SES (WHO) %
5-6 (year 1) 25.4 White 24.9 Lower 44.6
8-9 (year 4) 32.4 Black 29.7 Middle 39.8
11-12 (year 7) 20.0 Asian 37.4 Higher 16.6
14-15 (year 10) 22.2 Mixed/other 8.0
We asked children a few questions which indicate their socio-economic status
(SES) in the form of family affluence as this aspect of their lives could influence their
identity and sport participation not least (as reviewed in the last section). A set of four
short and simple questions which children from 5 years can comprehend and answer
together make up what is called the ‘family affluence scale’ (FAS), devised by World
Health Organisation (Currie et al., 2008; v. II). Such classifications have shown very
high associations with GDP, wealth and health status in the large-scale studies cited.
The four questions ask children about their family/home situation: Do they have their
own bedroom (score 0-1); Does their home have a computer with internet connection
(0-1); How many cars\vehicles does their family own (0-2); How many times has their
family gone on holiday in the last year (0-3). The aggregate scale (0-7) enables most
samples to be split into three SES (West et al., 2010): lower (0-3) 45% (175); middle
(4-5) 39% (152); higher (6-7) 17% (65); in the current sample. It is worth noting that
more Asian pupils (23% vs. 10-15%) fell into the higher SES than the other groups.
http://www.uel.ac.uk/psychology/staff/virginialam/
Research Materials
We ran the same set of materials with all the pupils tested; the only difference
lay in whether questions and answers were asked and given by the researchers and
children verbally in a one-to-one interview format (in the case of primary schools) or
whether adolescents wrote their answers in a booklet themselves in a questionnaire
format (secondary schools). The format can influence completion rates together with
pupils’ age (a lower proportion of the Year 7 pupils returned completed booklets than
the older Year 10s in this sample). A sample of the materials (primary in Appendix A;
secondary in Appendix B) is attached to this report.
Apart from asking for demographic information above, our research materials
were an amalgamation of standardised measures adapted from published work that
had tried and tested them over the last 10 years (so that we could obtain statistically
reliable datasets). These items and scales measured: British identity; ethnic identity;
knowledge about Britain and foreign countries; attitudes to people from the countries
(the ‘Britishness’ Centenary Project; by Barrett, 2000; reviewed in 2005, 2007, 2011);
sport participation (SportsLinx Project; Taylor et al., 2004); and competitive attitudes
(Hibbard & Buhrmester, 2010; adapted Rychman’s, 1990, for use with adolescents).
As the measures involved multiple-choice and scaled materials, with younger
(primary) pupils, props (such as cards and drawings; see below for examples) were
used to help their engagement. All pupils were shown a world map and flags for the
knowledge of country questions (geographical knowledge: location of countries; and
emblematic knowledge: national flags). Apart from Britain, the foreign countries were
France, Germany, United States of America, India and China—these were selected,
from a larger range, after our pilot study using open-ended questions had found that
children knew relatively more about them while at the same time they were relatively
salient countries across different continents.
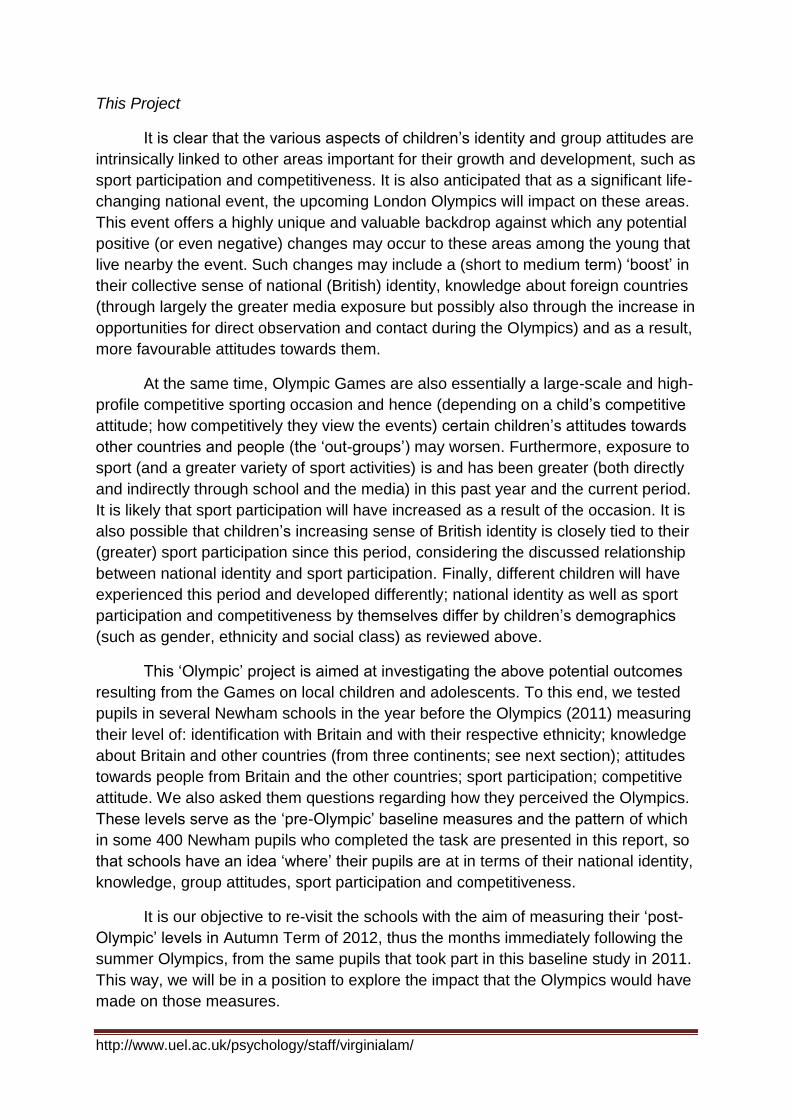
Examples of word cards used with primary-aged children for the measure ‘relatively
subjective importance of self-descriptors’:
Q: “You could use many things to describe yourself, such as…, but if you could only
choose one of these four descriptions to describe yourself because it was the most
important to you, which one would it be?”
Q: “Which one is the next most important?”
Q: “Which one is the next most important?”
[Take away card once selected for each question and tick in booklet; scale 1-4.]
8-year-old English British Girl
http://www.uel.ac.uk/psychology/staff/virginialam/
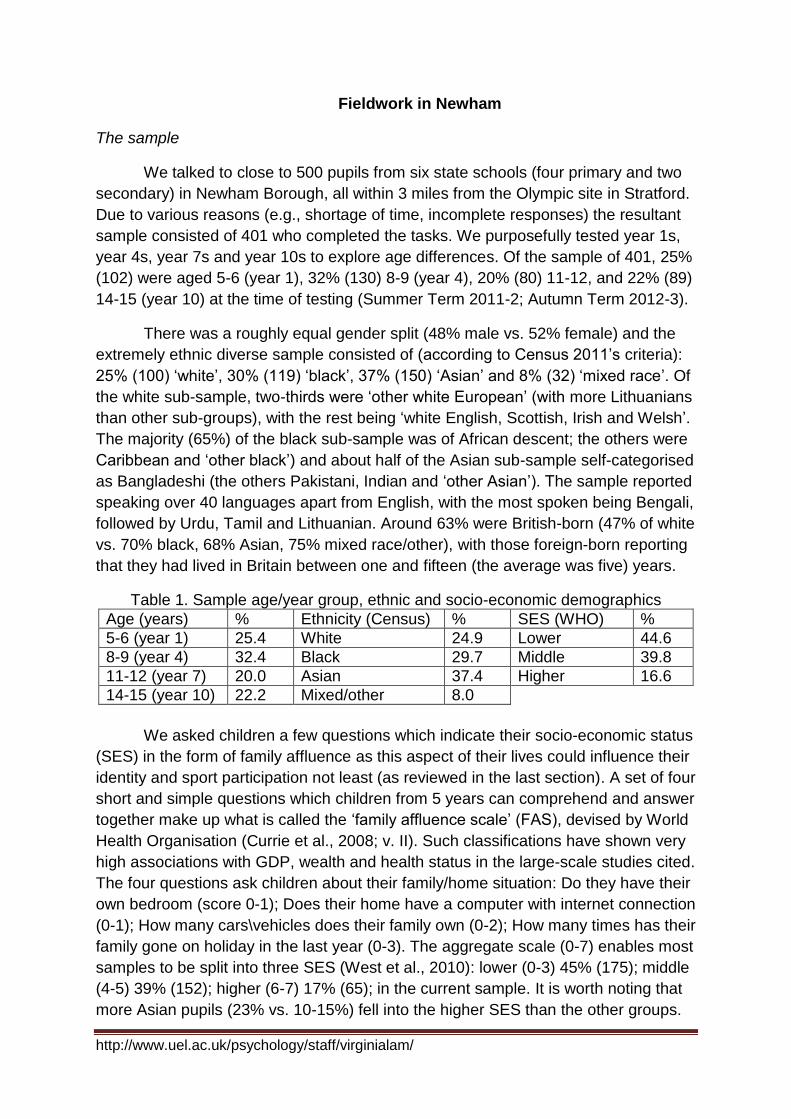
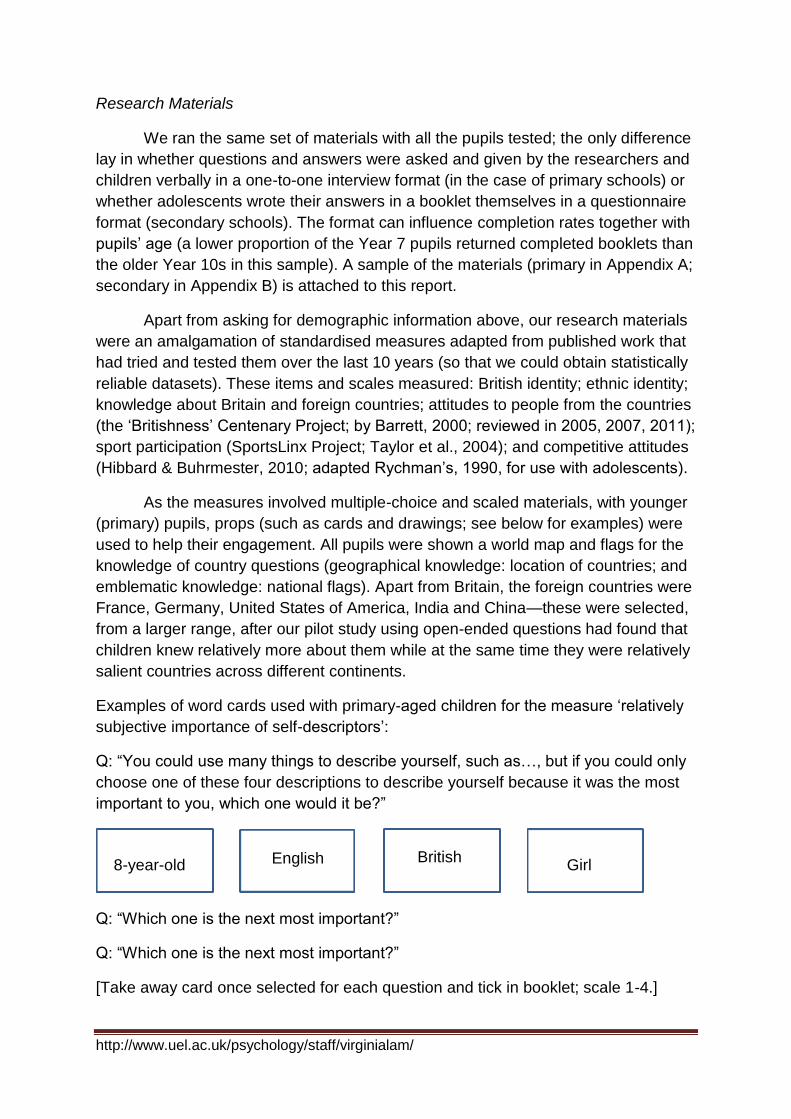
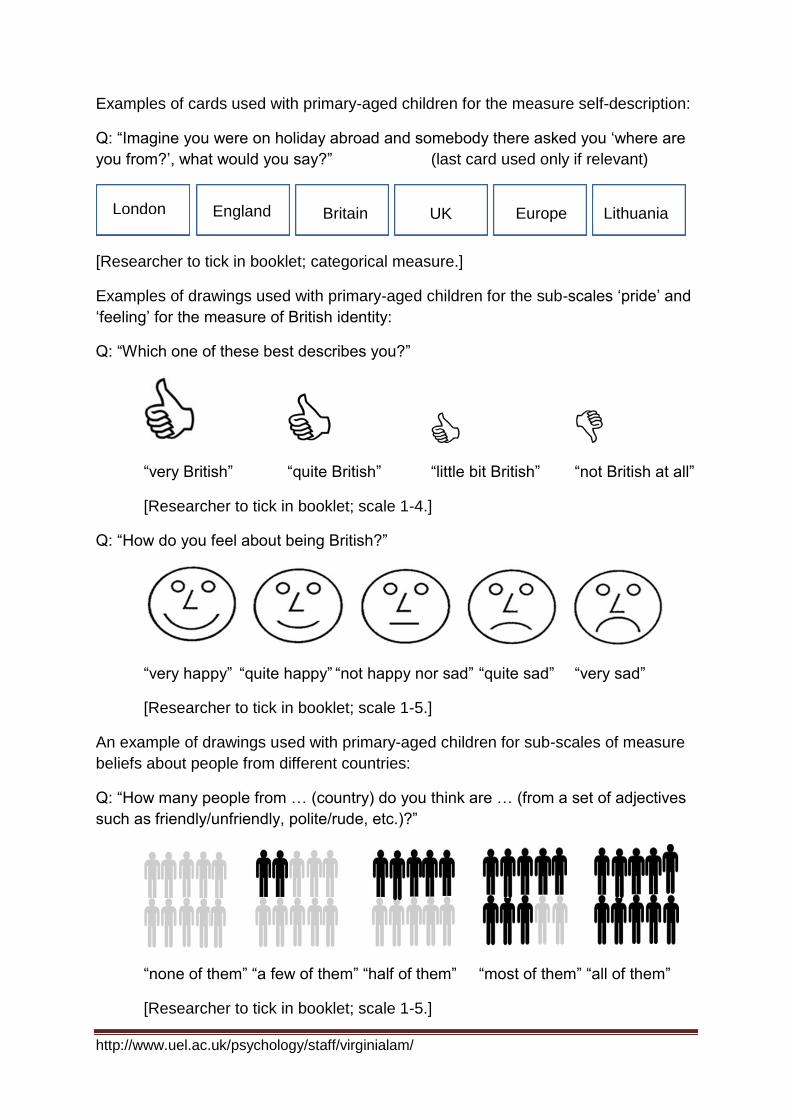
Examples of cards used with primary-aged children for the measure self-description:
Q: “Imagine you were on holiday abroad and somebody there asked you ‘where are
you from?’, what would you say?” (last card used only if relevant)
[Researcher to tick in booklet; categorical measure.]
Examples of drawings used with primary-aged children for the sub-scales ‘pride’ and
‘feeling’ for the measure of British identity:
Q: “Which one of these best describes you?”
“very British” “quite British” “little bit British” “not British at all”
[Researcher to tick in booklet; scale 1-4.]
Q: “How do you feel about being British?”
“very happy” “quite happy” “not happy nor sad” “quite sad” “very sad”
[Researcher to tick in booklet; scale 1-5.]
An example of drawings used with primary-aged children for sub-scales of measure
beliefs about people from different countries:
Q: “How many people from … (country) do you think are … (from a set of adjectives
such as friendly/unfriendly, polite/rude, etc.)?”
“none of them” “a few of them” “half of them” “most of them” “all of them”
[Researcher to tick in booklet; scale 1-5.]
London England Britain UK Europe Lithuania
http://www.uel.ac.uk/psychology/staff/virginialam/
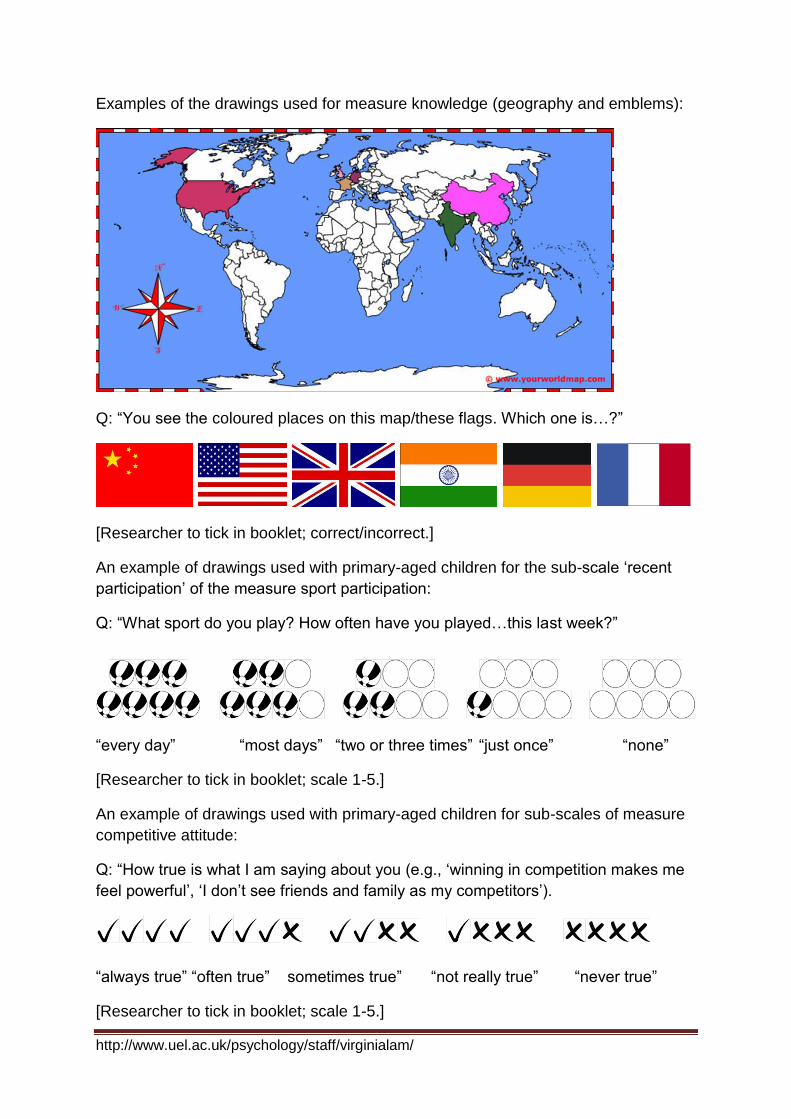
Examples of the drawings used for measure knowledge (geography and emblems):
Q: “You see the coloured places on this map/these flags. Which one is…?”
[Researcher to tick in booklet; correct/incorrect.]
An example of drawings used with primary-aged children for the sub-scale ‘recent
participation’ of the measure sport participation:
Q: “What sport do you play? How often have you played…this last week?”
“every day” “most days” “two or three times” “just once” “none”
[Researcher to tick in booklet; scale 1-5.]
An example of drawings used with primary-aged children for sub-scales of measure
competitive attitude:
Q: “How true is what I am saying about you (e.g., ‘winning in competition makes me
feel powerful’, ‘I don’t see friends and family as my competitors’).
“always true” “often true” sometimes true” “not really true” “never true”
[Researcher to tick in booklet; scale 1-5.]
http://www.uel.ac.uk/psychology/staff/virginialam/
Results
Relative Subjective Importance of: British/Ethnicity/Gender/Age
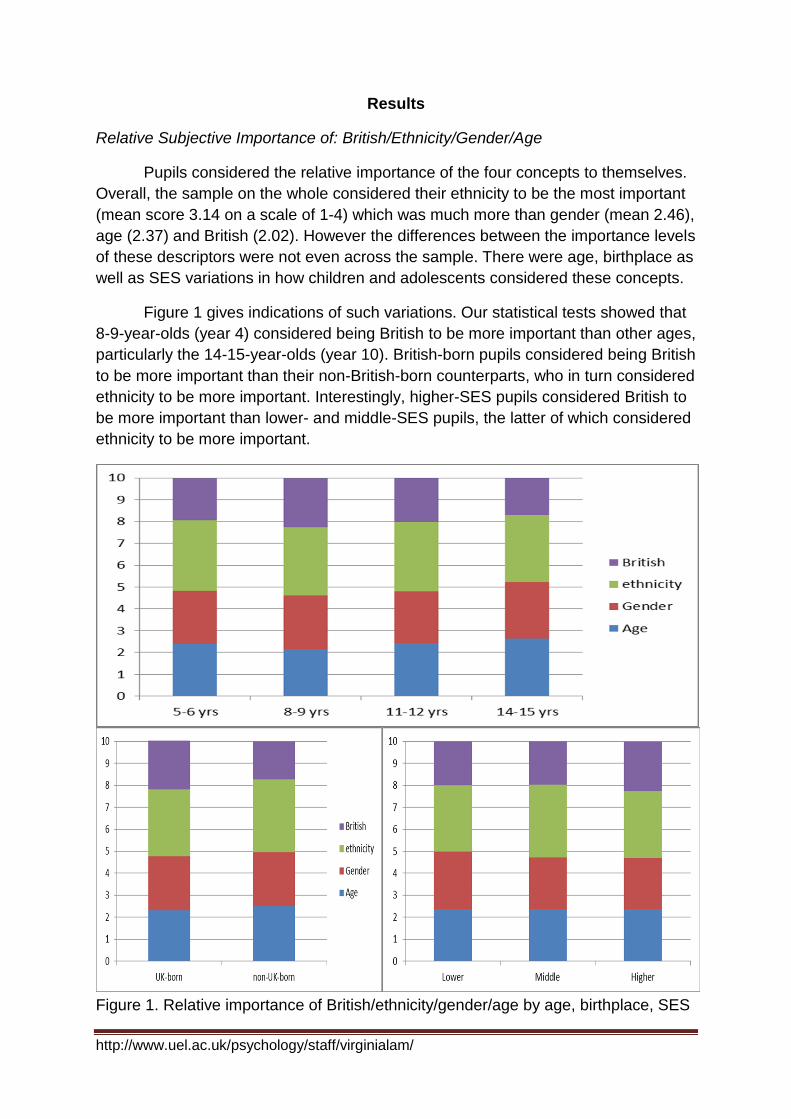
Pupils considered the relative importance of the four concepts to themselves.
Overall, the sample on the whole considered their ethnicity to be the most important
(mean score 3.14 on a scale of 1-4) which was much more than gender (mean 2.46),
age (2.37) and British (2.02). However the differences between the importance levels
of these descriptors were not even across the sample. There were age, birthplace as
well as SES variations in how children and adolescents considered these concepts.
Figure 1 gives indications of such variations. Our statistical tests showed that
8-9-year-olds (year 4) considered being British to be more important than other ages,
particularly the 14-15-year-olds (year 10). British-born pupils considered being British
to be more important than their non-British-born counterparts, who in turn considered
ethnicity to be more important. Interestingly, higher-SES pupils considered British to
be more important than lower- and middle-SES pupils, the latter of which considered
ethnicity to be more important.
Figure 1. Relative importance of British/ethnicity/gender/age by age, birthplace, SES
http://www.uel.ac.uk/psychology/staff/virginialam/
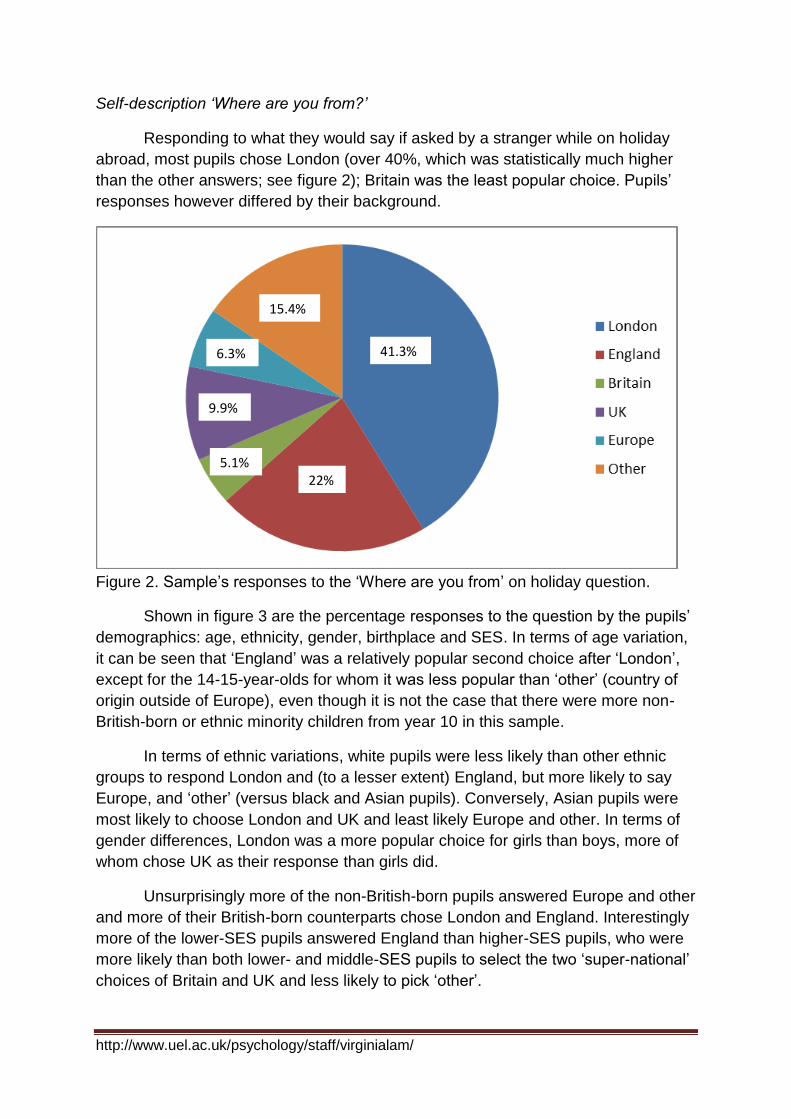
Self-description ‘Where are you from?’
Responding to what they would say if asked by a stranger while on holiday
abroad, most pupils chose London (over 40%, which was statistically much higher
than the other answers; see figure 2); Britain was the least popular choice. Pupils’
responses however differed by their background.
Figure 2. Sample’s responses to the ‘Where are you from’ on holiday question.
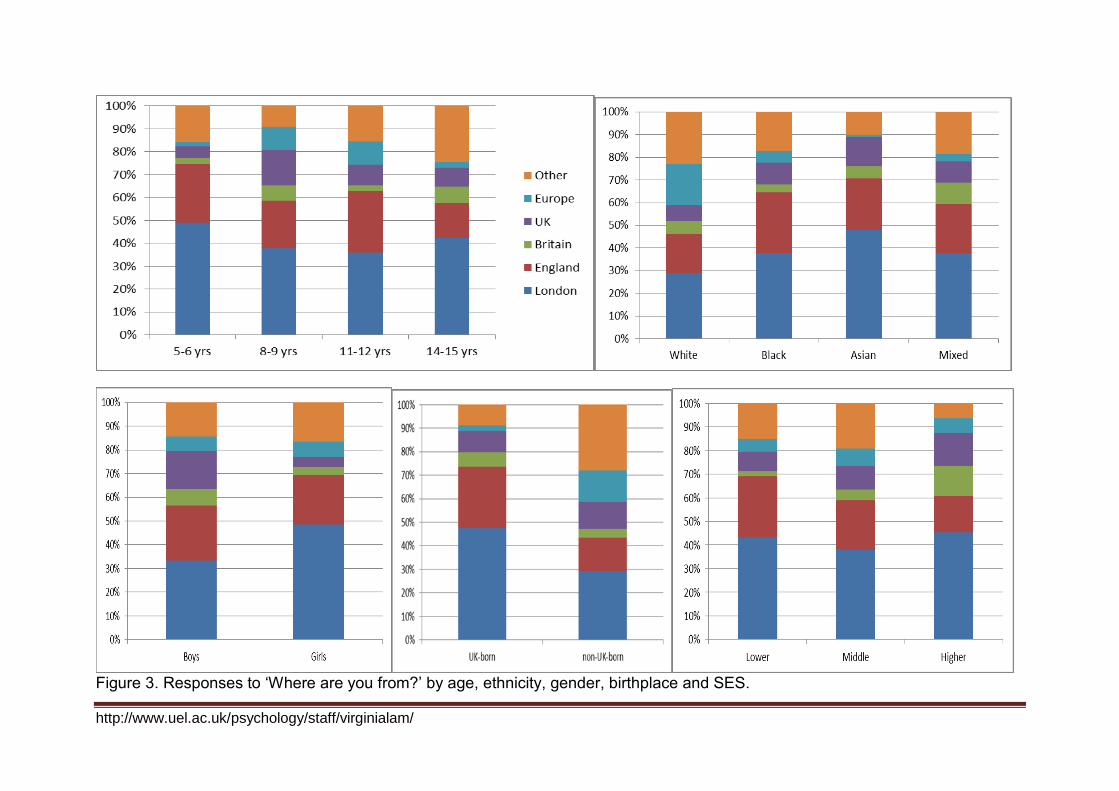
Shown in figure 3 are the percentage responses to the question by the pupils’
demographics: age, ethnicity, gender, birthplace and SES. In terms of age variation,
it can be seen that ‘England’ was a relatively popular second choice after ‘London’,
except for the 14-15-year-olds for whom it was less popular than ‘other’ (country of
origin outside of Europe), even though it is not the case that there were more non-
British-born or ethnic minority children from year 10 in this sample.
In terms of ethnic variations, white pupils were less likely than other ethnic
groups to respond London and (to a lesser extent) England, but more likely to say
Europe, and ‘other’ (versus black and Asian pupils). Conversely, Asian pupils were
most likely to choose London and UK and least likely Europe and other. In terms of
gender differences, London was a more popular choice for girls than boys, more of
whom chose UK as their response than girls did.
Unsurprisingly more of the non-British-born pupils answered Europe and other
and more of their British-born counterparts chose London and England. Interestingly
more of the lower-SES pupils answered England than higher-SES pupils, who were
more likely than both lower- and middle-SES pupils to select the two ‘super-national’
choices of Britain and UK and less likely to pick ‘other’.
41.3%
15.4%
22%
6.3%
9.9%
5.1%
http://www.uel.ac.uk/psychology/staff/virginialam/
Figure 3. Responses to ‘Where are you from?’ by age, ethnicity, gender, birthplace and SES.
http://www.uel.ac.uk/psychology/staff/virginialam/
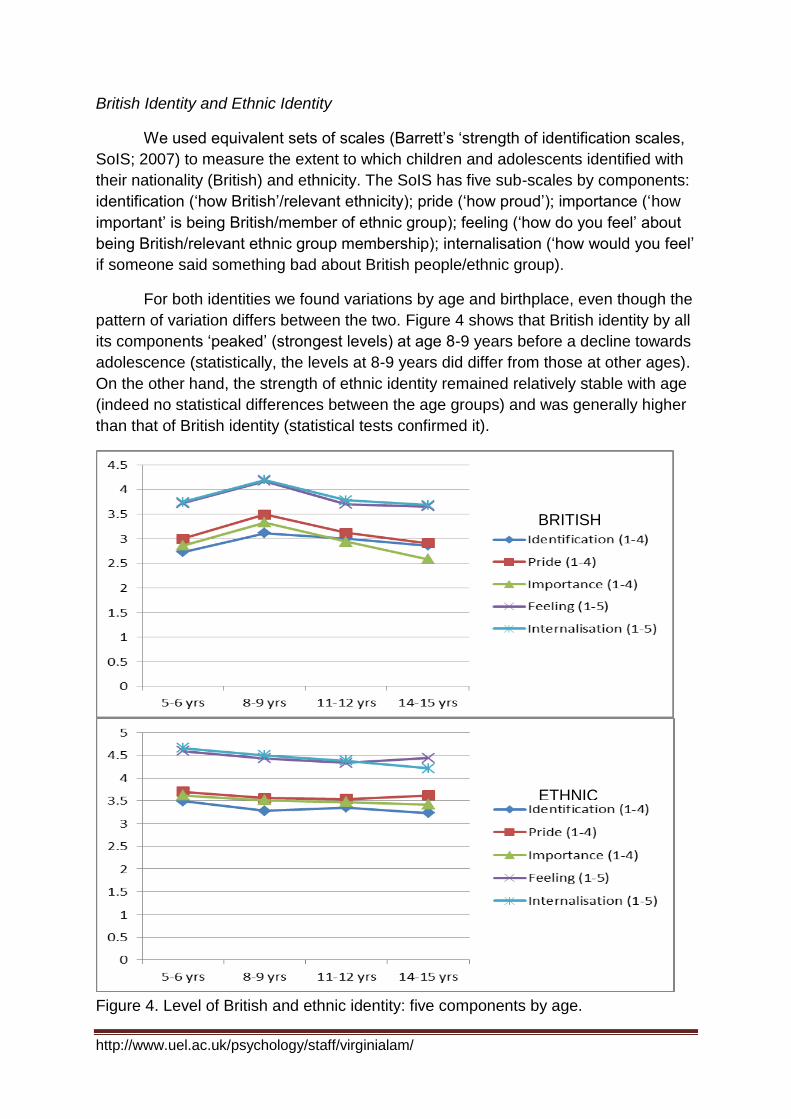
British Identity and Ethnic Identity
We used equivalent sets of scales (Barrett’s ‘strength of identification scales,
SoIS; 2007) to measure the extent to which children and adolescents identified with
their nationality (British) and ethnicity. The SoIS has five sub-scales by components:
identification (‘how British’/relevant ethnicity); pride (‘how proud’); importance (‘how
important’ is being British/member of ethnic group); feeling (‘how do you feel’ about
being British/relevant ethnic group membership); internalisation (‘how would you feel’
if someone said something bad about British people/ethnic group).
For both identities we found variations by age and birthplace, even though the
pattern of variation differs between the two. Figure 4 shows that British identity by all
its components ‘peaked’ (strongest levels) at age 8-9 years before a decline towards
adolescence (statistically, the levels at 8-9 years did differ from those at other ages).
On the other hand, the strength of ethnic identity remained relatively stable with age
(indeed no statistical differences between the age groups) and was generally higher
than that of British identity (statistical tests confirmed it).
Figure 4. Level of British and ethnic identity: five components by age.
BRITISH
ETHNIC
http://www.uel.ac.uk/psychology/staff/virginialam/
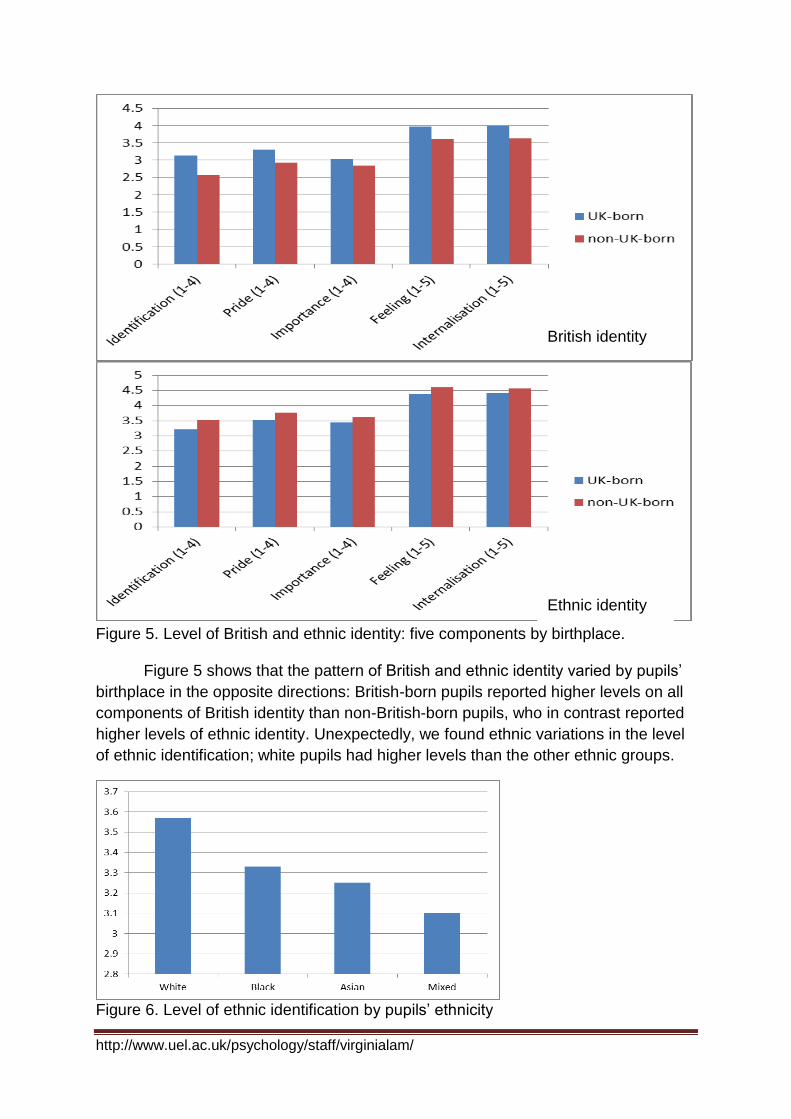
Figure 5. Level of British and ethnic identity: five components by birthplace.
Figure 5 shows that the pattern of British and ethnic identity varied by pupils’
birthplace in the opposite directions: British-born pupils reported higher levels on all
components of British identity than non-British-born pupils, who in contrast reported
higher levels of ethnic identity. Unexpectedly, we found ethnic variations in the level
of ethnic identification; white pupils had higher levels than the other ethnic groups.
Figure 6. Level of ethnic identification by pupils’ ethnicity
British identity
Ethnic identity
http://www.uel.ac.uk/psychology/staff/virginialam/
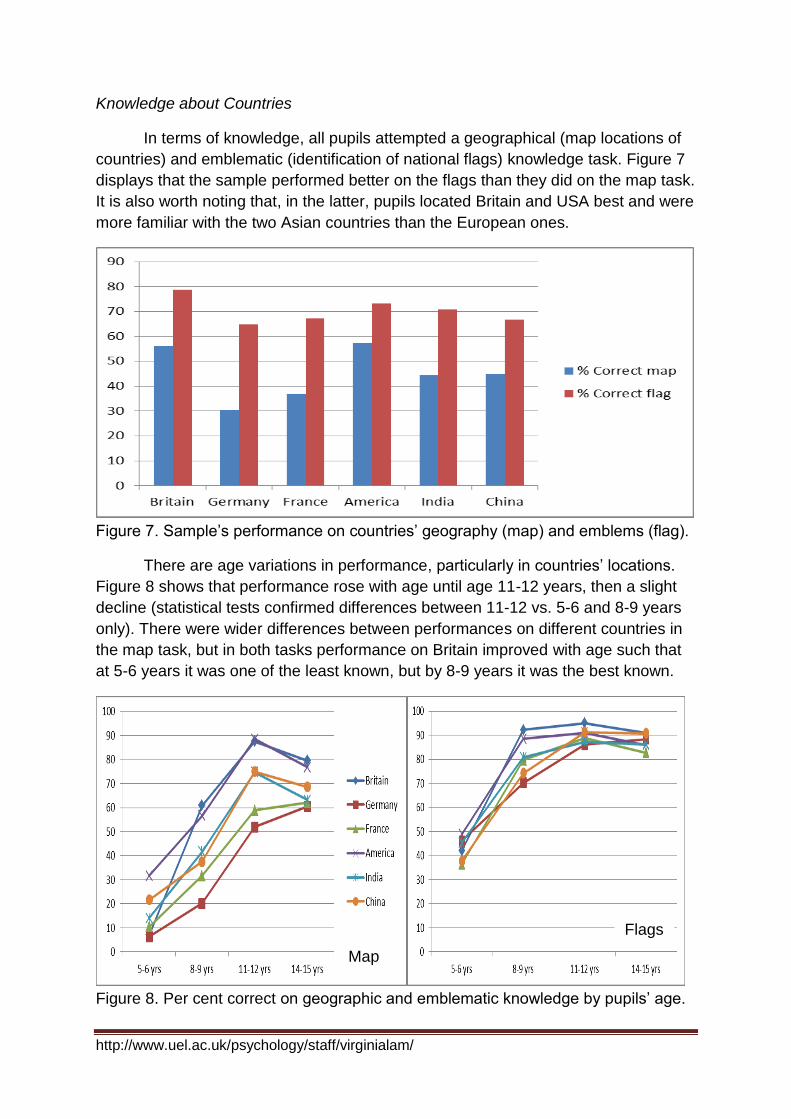
Knowledge about Countries
In terms of knowledge, all pupils attempted a geographical (map locations of
countries) and emblematic (identification of national flags) knowledge task. Figure 7
displays that the sample performed better on the flags than they did on the map task.
It is also worth noting that, in the latter, pupils located Britain and USA best and were
more familiar with the two Asian countries than the European ones.
Figure 7. Sample’s performance on countries’ geography (map) and emblems (flag).
There are age variations in performance, particularly in countries’ locations.
Figure 8 shows that performance rose with age until age 11-12 years, then a slight
decline (statistical tests confirmed differences between 11-12 vs. 5-6 and 8-9 years
only). There were wider differences between performances on different countries in
the map task, but in both tasks performance on Britain improved with age such that
at 5-6 years it was one of the least known, but by 8-9 years it was the best known.
Figure 8. Per cent correct on geographic and emblematic knowledge by pupils’ age.
Map
Flags
http://www.uel.ac.uk/psychology/staff/virginialam/
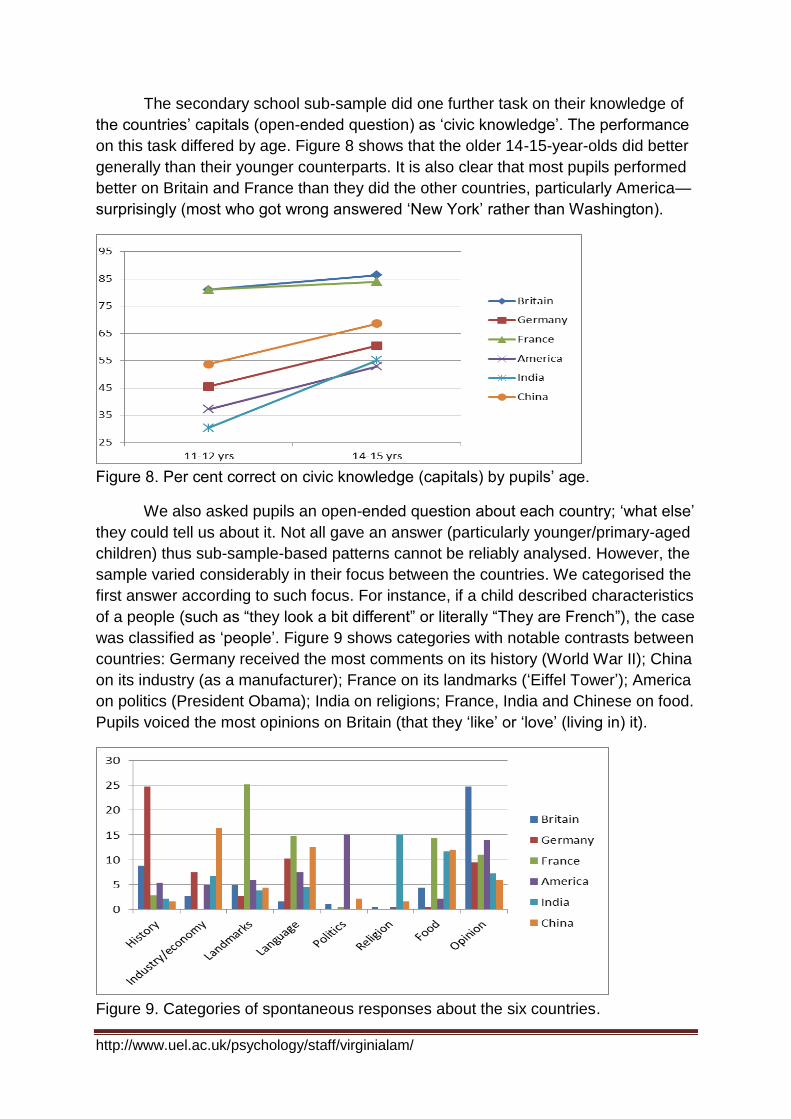
The secondary school sub-sample did one further task on their knowledge of
the countries’ capitals (open-ended question) as ‘civic knowledge’. The performance
on this task differed by age. Figure 8 shows that the older 14-15-year-olds did better
generally than their younger counterparts. It is also clear that most pupils performed
better on Britain and France than they did the other countries, particularly America—
surprisingly (most who got wrong answered ‘New York’ rather than Washington).
Figure 8. Per cent correct on civic knowledge (capitals) by pupils’ age.
We also asked pupils an open-ended question about each country; ‘what else’
they could tell us about it. Not all gave an answer (particularly younger/primary-aged
children) thus sub-sample-based patterns cannot be reliably analysed. However, the
sample varied considerably in their focus between the countries. We categorised the
first answer according to such focus. For instance, if a child described characteristics
of a people (such as “they look a bit different” or literally “They are French”), the case
was classified as ‘people’. Figure 9 shows categories with notable contrasts between
countries: Germany received the most comments on its history (World War II); China
on its industry (as a manufacturer); France on its landmarks (‘Eiffel Tower’); America
on politics (President Obama); India on religions; France, India and Chinese on food.
Pupils voiced the most opinions on Britain (that they ‘like’ or ‘love’ (living in) it).
Figure 9. Categories of spontaneous responses about the six countries.
http://www.uel.ac.uk/psychology/staff/virginialam/
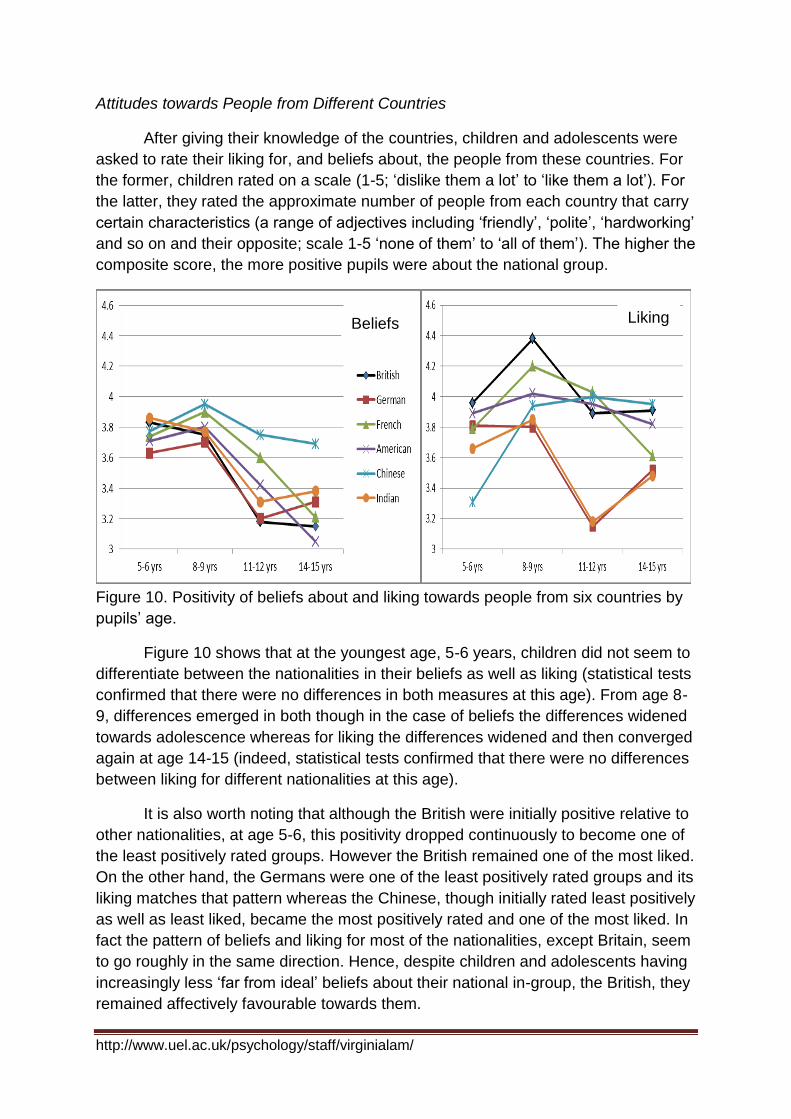
Attitudes towards People from Different Countries
After giving their knowledge of the countries, children and adolescents were
asked to rate their liking for, and beliefs about, the people from these countries. For
the former, children rated on a scale (1-5; ‘dislike them a lot’ to ‘like them a lot’). For
the latter, they rated the approximate number of people from each country that carry
certain characteristics (a range of adjectives including ‘friendly’, ‘polite’, ‘hardworking’
and so on and their opposite; scale 1-5 ‘none of them’ to ‘all of them’). The higher the
composite score, the more positive pupils were about the national group.
Figure 10. Positivity of beliefs about and liking towards people from six countries by
pupils’ age.
Figure 10 shows that at the youngest age, 5-6 years, children did not seem to
differentiate between the nationalities in their beliefs as well as liking (statistical tests
confirmed that there were no differences in both measures at this age). From age 8-
9, differences emerged in both though in the case of beliefs the differences widened
towards adolescence whereas for liking the differences widened and then converged
again at age 14-15 (indeed, statistical tests confirmed that there were no differences
between liking for different nationalities at this age).
It is also worth noting that although the British were initially positive relative to
other nationalities, at age 5-6, this positivity dropped continuously to become one of
the least positively rated groups. However the British remained one of the most liked.
On the other hand, the Germans were one of the least positively rated groups and its
liking matches that pattern whereas the Chinese, though initially rated least positively
as well as least liked, became the most positively rated and one of the most liked. In
fact the pattern of beliefs and liking for most of the nationalities, except Britain, seem
to go roughly in the same direction. Hence, despite children and adolescents having
increasingly less ‘far from ideal’ beliefs about their national in-group, the British, they
remained affectively favourable towards them.
Beliefs Liking
http://www.uel.ac.uk/psychology/staff/virginialam/
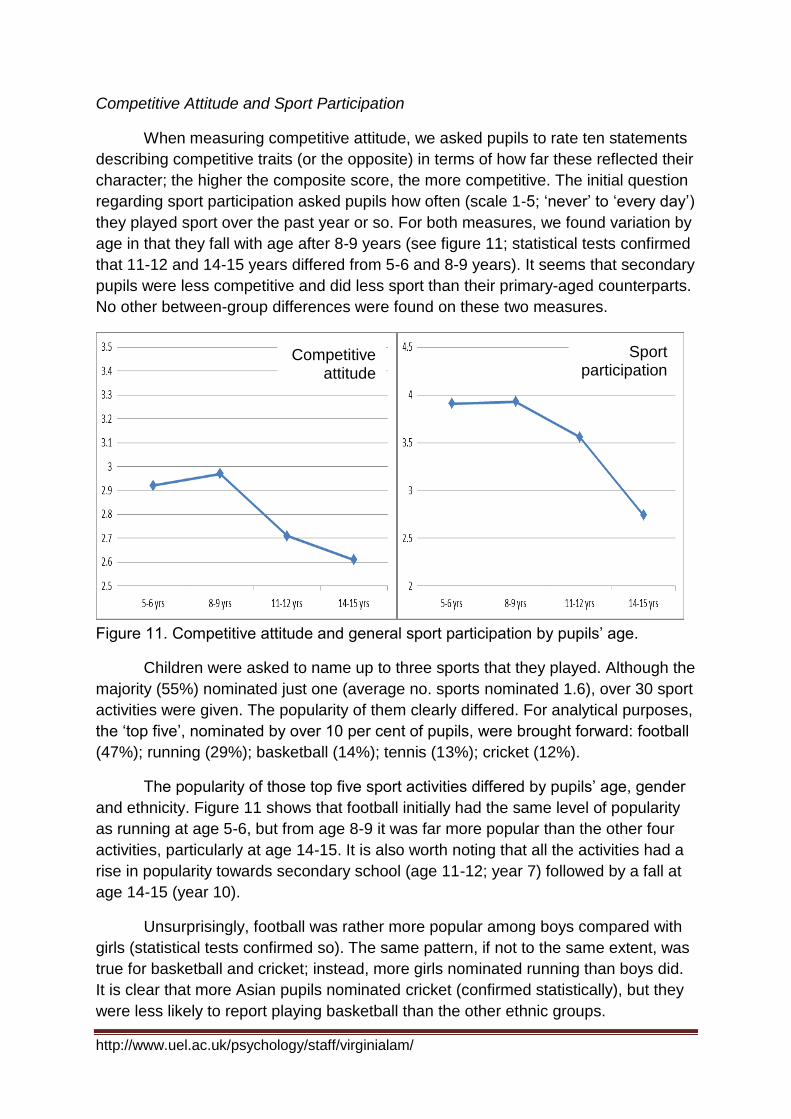
Competitive Attitude and Sport Participation
When measuring competitive attitude, we asked pupils to rate ten statements
describing competitive traits (or the opposite) in terms of how far these reflected their
character; the higher the composite score, the more competitive. The initial question
regarding sport participation asked pupils how often (scale 1-5; ‘never’ to ‘every day’)
they played sport over the past year or so. For both measures, we found variation by
age in that they fall with age after 8-9 years (see figure 11; statistical tests confirmed
that 11-12 and 14-15 years differed from 5-6 and 8-9 years). It seems that secondary
pupils were less competitive and did less sport than their primary-aged counterparts.
No other between-group differences were found on these two measures.
Figure 11. Competitive attitude and general sport participation by pupils’ age.
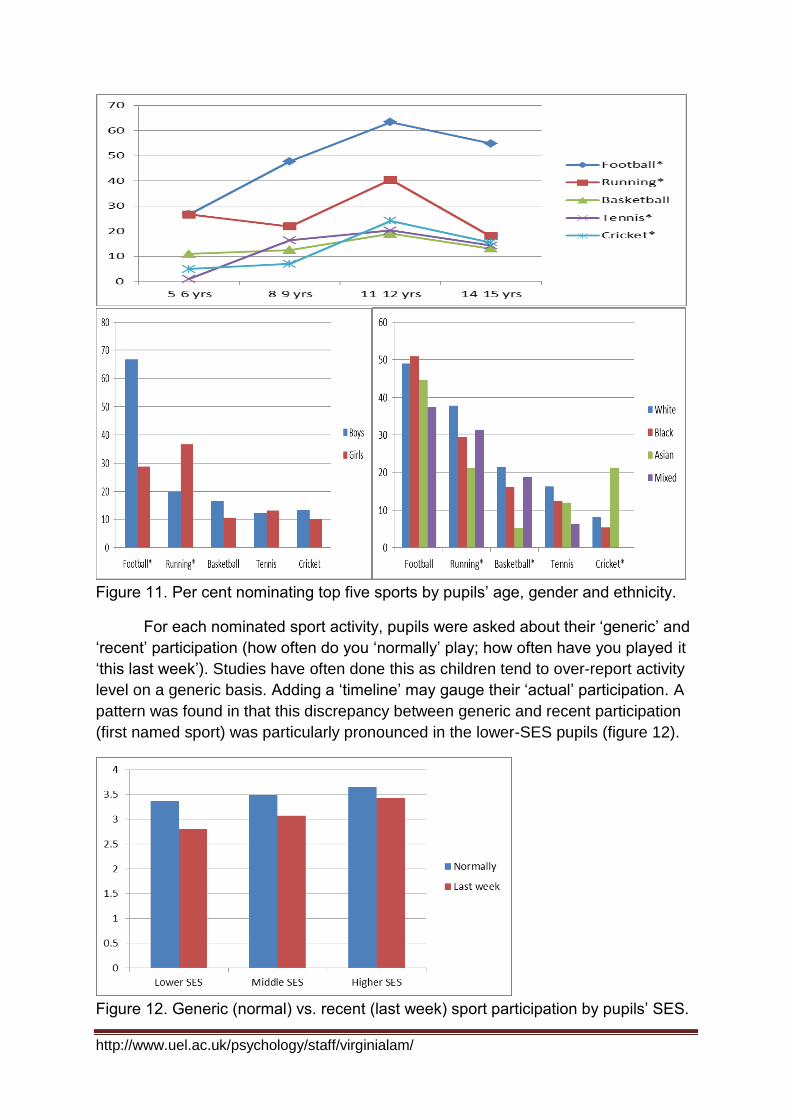
Children were asked to name up to three sports that they played. Although the
majority (55%) nominated just one (average no. sports nominated 1.6), over 30 sport
activities were given. The popularity of them clearly differed. For analytical purposes,
the ‘top five’, nominated by over 10 per cent of pupils, were brought forward: football
(47%); running (29%); basketball (14%); tennis (13%); cricket (12%).
The popularity of those top five sport activities differed by pupils’ age, gender
and ethnicity. Figure 11 shows that football initially had the same level of popularity
as running at age 5-6, but from age 8-9 it was far more popular than the other four
activities, particularly at age 14-15. It is also worth noting that all the activities had a
rise in popularity towards secondary school (age 11-12; year 7) followed by a fall at
age 14-15 (year 10).
Unsurprisingly, football was rather more popular among boys compared with
girls (statistical tests confirmed so). The same pattern, if not to the same extent, was
true for basketball and cricket; instead, more girls nominated running than boys did.
It is clear that more Asian pupils nominated cricket (confirmed statistically), but they
were less likely to report playing basketball than the other ethnic groups.
Competitive attitude
Sport participation
http://www.uel.ac.uk/psychology/staff/virginialam/
Figure 11. Per cent nominating top five sports by pupils’ age, gender and ethnicity.
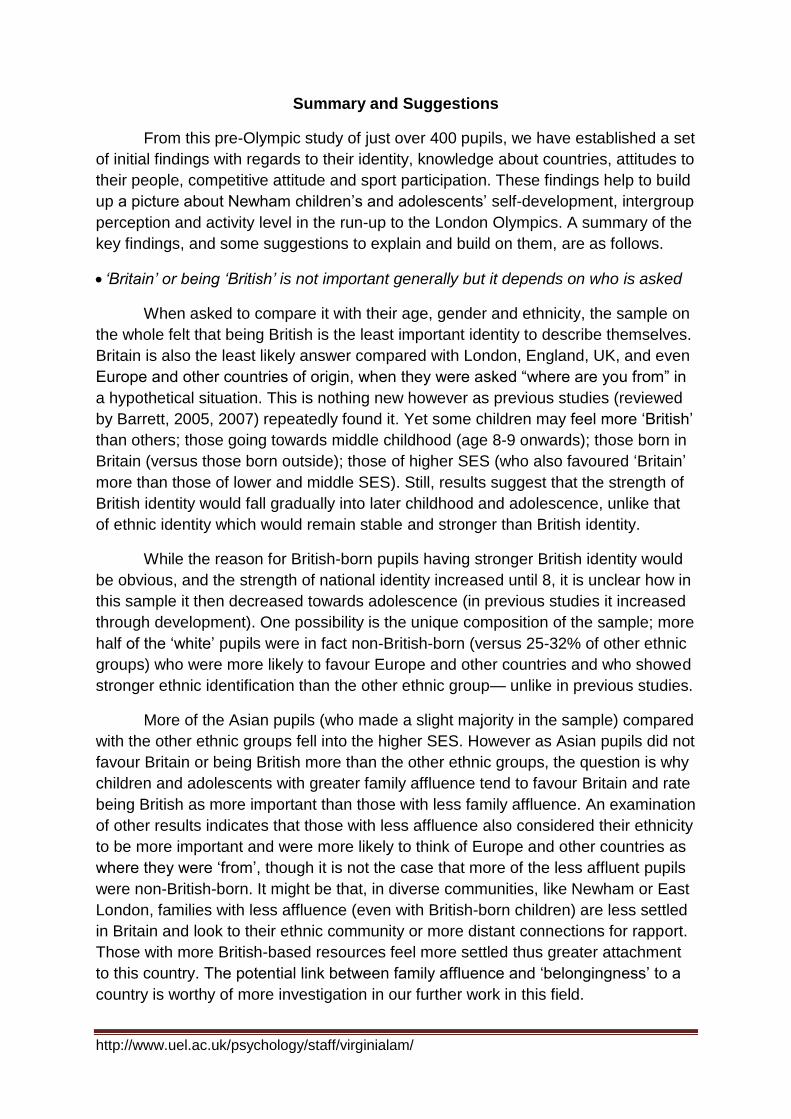
For each nominated sport activity, pupils were asked about their ‘generic’ and
‘recent’ participation (how often do you ‘normally’ play; how often have you played it
‘this last week’). Studies have often done this as children tend to over-report activity
level on a generic basis. Adding a ‘timeline’ may gauge their ‘actual’ participation. A
pattern was found in that this discrepancy between generic and recent participation
(first named sport) was particularly pronounced in the lower-SES pupils (figure 12).
Figure 12. Generic (normal) vs. recent (last week) sport participation by pupils’ SES.
http://www.uel.ac.uk/psychology/staff/virginialam/
Summary and Suggestions
From this pre-Olympic study of just over 400 pupils, we have established a set
of initial findings with regards to their identity, knowledge about countries, attitudes to
their people, competitive attitude and sport participation. These findings help to build
up a picture about Newham children’s and adolescents’ self-development, intergroup
perception and activity level in the run-up to the London Olympics. A summary of the
key findings, and some suggestions to explain and build on them, are as follows.
‘Britain’ or being ‘British’ is not important generally but it depends on who is asked
When asked to compare it with their age, gender and ethnicity, the sample on
the whole felt that being British is the least important identity to describe themselves.
Britain is also the least likely answer compared with London, England, UK, and even
Europe and other countries of origin, when they were asked “where are you from” in
a hypothetical situation. This is nothing new however as previous studies (reviewed
by Barrett, 2005, 2007) repeatedly found it. Yet some children may feel more ‘British’
than others; those going towards middle childhood (age 8-9 onwards); those born in
Britain (versus those born outside); those of higher SES (who also favoured ‘Britain’
more than those of lower and middle SES). Still, results suggest that the strength of
British identity would fall gradually into later childhood and adolescence, unlike that
of ethnic identity which would remain stable and stronger than British identity.
While the reason for British-born pupils having stronger British identity would
be obvious, and the strength of national identity increased until 8, it is unclear how in
this sample it then decreased towards adolescence (in previous studies it increased
through development). One possibility is the unique composition of the sample; more
half of the ‘white’ pupils were in fact non-British-born (versus 25-32% of other ethnic
groups) who were more likely to favour Europe and other countries and who showed
stronger ethnic identification than the other ethnic group— unlike in previous studies.
More of the Asian pupils (who made a slight majority in the sample) compared
with the other ethnic groups fell into the higher SES. However as Asian pupils did not
favour Britain or being British more than the other ethnic groups, the question is why
children and adolescents with greater family affluence tend to favour Britain and rate
being British as more important than those with less family affluence. An examination
of other results indicates that those with less affluence also considered their ethnicity
to be more important and were more likely to think of Europe and other countries as
where they were ‘from’, though it is not the case that more of the less affluent pupils
were non-British-born. It might be that, in diverse communities, like Newham or East
London, families with less affluence (even with British-born children) are less settled
in Britain and look to their ethnic community or more distant connections for rapport.
Those with more British-based resources feel more settled thus greater attachment
to this country. The potential link between family affluence and ‘belongingness’ to a
country is worthy of more investigation in our further work in this field.
http://www.uel.ac.uk/psychology/staff/virginialam/
Children know America as well as they do Britain, just not its capital! They learn a
lot in early secondary school but stop there and take in popular media information
In terms of geographic (map locations of countries) and emblematic (national
flags) knowledge the pupils did perform nearly as well on America as they did Britain.
On the civic (capitals) knowledge however they performed second worst on America
as many assumed that its capital was New York; this could be because they receive
more information through the media about this city as a commercial hub of the USA.
Pupils also performed better on the flags than the map task, possibly as geographic
information in the form of spatial representations is acquired later and presents more
challenge as it involves abstract thinking (representing space and distance on a two
dimensional plane) learnt through education (versus the vivid symbols such as flags
to which they might have greater exposure. Knowledge of capitals, nevertheless, got
better with age; 14-15-year-olds performed better than 11-12-year-olds, in particular
on other countries, perhaps a result of learning from school as well as other sources.
There was a gradual increase in both geographic and emblematic knowledge
with age until 11-12 years (year 7); however it halted there (and in some cases even
fell towards 14-15 years; year 10). It might be that, as above discussed, pupils learn
about other countries in school, but the increase in knowledge holds only as long as
they take the relevant subjects (Geography and History are compulsory until year 9).
It would be worth investigating more systematically the link between such knowledge
and engagement with those subjects.
Finally, from pupils’ spontaneous comments to what else they knew about the
countries, it seems that children and adolescents tend to focus on what they acquire,
likely from the media, ‘stereotypic’ information about countries, their people, practice
and history. These are highly well-known information that one would imagine adults
would also volunteer if asked and suggest that, like adults, children and adolescents
tend to absorb the most salient, or high-profile, information from their environment.
Young children do not think and feel differently about different nationalities but start
by late childhood and will like their own more even if they don’t think highly of them
The results show that, on both positivity of beliefs and liking, the youngest age
group, 5-6-year-olds, did not differ in their responses they gave to different countries.
Then from 8-9 years, different patterns emerged from the two measures. Whilst their
beliefs and liking tended to go in the same direction for most nationalities (the more
positive pupils’ beliefs were about a group the more they liked them), it did not apply
to the British. Beliefs about them became less positive with age, but they remained
one of the most liked group. The preference for the national ‘in-group’ over others is
in line with that in other studies (Barrett, 2005, 2007) have found, if the preference in
this study is in fact to a lesser extent. Promisingly, though the oldest adolescents had
similar liking for the different nationalities (i.e., lack of preference or prejudice) even
though they held different beliefs about them.
http://www.uel.ac.uk/psychology/staff/virginialam/
As children get older, they become less competitive and do less sport even though
they do a greater variety but that depends on their gender, ethnicity and affluence
In terms of their competitive attitude and sport participation in general, pupils
in the secondary ages (particularly the 14-15-year group) reported lower levels than
their younger primary-age counterparts. This pattern is not new (Taylor et al., 2004);
school-life becomes more academic as older children go up the years through their
education working towards public examinations and qualifications, leaving less time
for playing sport. The fall in competitive attitude may be partly to do with an increase
in social desirability (it is undesirable to be seen as competitive), or a genuine fall in
general competitiveness as abilities and interests diverge. It would be fascinating to
investigate further links between generic and specific (e.g., sporting) competitiveness
and sport participation.
Despite the lower level of participation, the variety of sport activities seems to
increase with age; more of the secondary-aged pupils reported engagement with the
‘top five’ sports than their primary-aged counterparts. However, reported participation
among the five is highly uneven by secondary school; at first, running was as popular
as football at age 5-6, but from 8-9 years football became considerably more so than
the other activities and by 14-15 years it was two to three times more popular as any
other activity. While this suggests the overwhelming popularity of football as the key
national sport, the trend might not apply to all children; not least girls were much less
involved with football than boys were, and they also reportedly played less basketball
and cricket than boys did. Some ethnic groups may also be partial to some activities
over others; Asian pupils reported far more participation in cricket, which goes in line
with the popularity of this sport in and its international prestige tied to these children’s
and adolescents’ ancestry in the Indian sub-continent.
A less promising outlook is the finding that pupils with lower family affluence
had the greatest discrepancy between their levels of ‘general’ reported participation
and recent ‘actual’ participation in sport. Although this discrepancy applied to all SES
groups (children tend to over-report on sport participation as it is a desirable trait—
they would like to play sport), its greater extent among the lower strata may indicate
that children and adolescents with fewer family-income-related resources get to play
less sport in reality than they would like to or assume that they do. More investigation
is required to explore the nature and causes of this discrepancy in certain sectors of
the community as this would be of interest to schools, sport clubs, children’s services
and councils, as providers of sport and physical activities and facilities for the young,
considering the importance of access to these resources for their well-being.
http://www.uel.ac.uk/psychology/staff/virginialam/
Looking to the Future—After the London Olympics
This study, as a baseline study, has drawn up a picture of the development in
some of Newham’s pupils in terms of their identity, knowledge, group understanding
in relation to countries, and in their sport participation and competitive attitude, in the
year running up to the 2012 Olympics. Looking ahead to the event on our doorsteps,
it offers a highly unique opportunity to explore whether such a national phenomenon
that is happening at such a close proximity to this community will make an impact on
the pupils. Seeing that Britain and being British has been relatively unimportant, will
this high-profile national event raise their salience? Will the pupils learn more about
their own and foreign countries through this event? Will they have more favourable
beliefs about and liking towards other nations because of this or will it be the reverse
with the Olympics being a competitive event? Then will their competitive attitude see
an increase? Will their sport participation also see an increase as a result?
The follow-up study of this project will give us the unprecedented opportunity
to examine answers to the above questions, which reflect the potentially long-lasting
impact of the Games on children’s and adolescents’ psychological development and
physical well-being. As schools around the Olympic sites and capital prepare for this
event in their various ways, we look forward to capturing this phenomenon and how
it may impact on the young of its nearby communities.
References
Barrett, M. & Farroni, T. (1996). English and Italian children’s knowledge of Europe. Developmental Psychology, 14, 257-273.
Barrett, M. (2002, September). Children’s views of Britain and Britishness in 2001. Keynote address presented to the Annual conference of the BPS Developmental Psychology section, University of Sussex.
Barrett, M. (2005). Children’s understanding of, feelings about, countries and national grups. In M. Barrett & E. Buchanan-Barrow (Eds.), Children’s understanding of society: Studies in developmental psychology (pp. 251-285). Hove: Psychology Press.
Barrett, M. (2007). Children’s knowledge, beliefs and feelings about nations and national groups (Ed.). London: Psychology Press.
Barrett, M., Wilson, H., & Lyons, E. (2003). The development of national identity and social identity processes: Do social identity theory and self-categorisation theory provide useful heuristic frameworks for developmental research? In M. Bennett & F. Sani (Eds.), The development of the social self (pp. 159-188). Hove: Psychology Press.
Bourchier, A., Barrett, M., & Lyons, E. (2002). The predictors of children’s geographical knowledge of other countries. Journal of Environmental Psychology, 22, 79-94
Brown, R. & Hewstone, M. (2005). An integrative theory of intergroup contact. In Zanna, M. P. (Ed.), Advances in Experimental Psychology (pp. 255-343). San Diego: Elsevier Academic Press.
Burdsey, D. (2006). ‘If I ever play football, dad, can I play for England or India? British Asians, sport and diasporic national identities. Sociology Online, 40(1), 11-28.
Cameron, L., Rutland, A., & Adam, R. (2007). Promoting children’s positive intergroup attitudes towards stigmatized groups: extended contact and multiple classification skills training. International Journal of Behavioral Development, 31(5), 454-466.
Cameron, L., Rutland, A., Brown, R., & Douch, R. (2006). Changing children’s intergroup attitudes toward refugees: testing different models of extended contact. Child Development, 77(5), 1208-1219.
http://www.uel.ac.uk/psychology/staff/virginialam/
Cameron, L., Rutland, A., Hossain, R., & Petley, R. (2011). When and why does extended contact work? The role of high quality direct contact and group norms in the development of positive ethnic intergroup attitudes among children. Group Processes & Intergroup Relations, 14(2), 193-206.
Condor, S. (1996). Unimagined community? Some social psychological issues concerning English national identity. In G. Breakwell & E. Lyons (Eds), Changing European identities: some psychological analyses of social change (pp. 41-68). Oxford: Butterworth-Heinemann.
Currie, C., Mochob, M., Boyce, W., Holsteind, B., Torsheime, T., & Richterf, M. (2008). Research health inequalities in adolescents: the development of the health behaviour in school-aged children (HBSC) family affluence scale. Social Science and Medicine, 66(6), 1429-1436.
Hibbard, D. R., Duhrmester, D. (2010). Competitiveness, gender and adjustment among adolescents. Sex Roles, 63(5-6), 412-424.
Johoda, G. & Woerdenbagch, A. (1982). Awareness of supra-national grouping among Dutch and Scottish children and adolescents. European Journal of Political Research, 10, 305-312.
Lam, V. & Smith, G. (2009). African and Caribbean adolescents in Britain: ethnic identity and Britishness. Ethnic and Racial Studies, 32, 1248-1270.
Maguire, J. A. (2011). Globalization, sport and national identities. Sport in Society, 14(7-8), 978-993.
Nesdale, D. (2001). The development of prejudice in children. In M. A. Augostinos & K. Y. Reynolds (Eds.), Understanding of prejudice, racism, and social conflict (pp. 57-73). London: Sage.
Nesdale, D., Griffiths, J. A., Durkin, K., & Maass, A. (2007). Effects of group membership, intergroup competition and out-group ethnicity on children’s ratings of in-group and out-group similarity and positivity. British Journal of Developmental Psychology, 25(4), 359-373.
Nesdale, D., Maass, A., Griffiths, J., & Durkin, K. (2003). Effects of ingroup and out-group ethnicity on children’s attitudes towards members of the ingroup and out-group. British Journal of Developmental Psychology, 21(2), 177-192.
Office for National Statistics (2011). The 2011 Census. In the Directgov website: http://2011.census.gov.uk/. Last accessed: 20 July, 2011.
Pettigrew, T. F., Tropp, L. R., Wagner, U., & Christ, O. (2011). Recent advances in intergroup contact theory. Journal of Intercultural Relations, 35(3), 271-280.
Rutland, A. (1998). The development of national prejudice, in-group favouritism and self-stereotypes in British children. British Journal of Social psychology, 38, 55-70.
Ryckman, R. M., Hammer, M., Kaczor, L. M., & Gold, J. A. (1996). Construction of a personal development competitiveness attitude scale. Journal of Personality Assessment, 66(2), 374-385.Seabra et al., (2008).
Seabra, A. F., Mendonca, M. M., Thomis, M. A., Peters, T. J., & Maia, J. A. (2008). Associations between sport participation, demographic and socio-cultural factors in Portuguese children and adolescents. European Journal of Public Health, 18(1), 25-30.
Taylor, S., Hackett, A., Stratton, G., & Lamb, L. (2004). SportsLinx: Improving the health and fitness of Liverpool’s youth. Education and Health, 22(1), 11-15.
Tsang, C. K. E., Szabo, A.,, Soos, I., & Bute, P. (2005). A study of cultural differences in motivational orientations towards sport participation of junior secondary school children in four cultures. Journal of Physical Education and Recreation, 11(1), 44-50.
Vandendriessch, J. B., Vandorpe, B. F. R., Vaeyens, R., Malina, R. M., Lefevre, J., Lenoir, M., & Philippaerts, R. M. (2012). Variation in sport participation, fitness and motor coordination with socioeconomic status among Flemish children. Pediatric Exercise Science, 24(1), 113-128.
Vermeulen, J. & Verweel, P. (2009). Participation in sport: bonding and bridging as identity work. Sport in Society, 12(9), 1206-1219.
Wright, L. (2001). Sport, national identity and national pride. Sociology of Sport Online, 4, 17.
Related Documents