1 New Shared Mobility: Literature Search on Current Travel Demand Models and Data Reporting Requested by LaKeda Huckabay, Division of Research, Innovation and System Information Produced by Ms. Lee Provost, P.E., M.S., DRISI March 11, 2016 The Caltrans Division of Research, Innovation and System Information (DRISI) receives and evaluates numerous research problem statements for funding every year. DRISI conducts Preliminary Investigations on these problem statements to better scope and prioritize the proposed research in light of existing credible work on the topics nationally and internationally. Online and print sources for Preliminary Investigations include the National Cooperative Highway Research Program (NCHRP) and other Transportation Research Board (TRB) programs, the American Association of State Highway and Transportation Officials (AASHTO), the research and practices of other transportation agencies, and related academic and industry research. The views and conclusions in cited works, while generally peer reviewed or published by authoritative sources, may not be accepted without qualification by all experts in the field. The contents of this document reflect the views of the authors, who are responsible for the facts and accuracy of the data presented herein. The contents do not necessarily reflect the official views or policies of the California Department of Transportation, the State of California, or the Federal Highway Administration. This document does not constitute a standard, specification, or regulation. No part of this publication should be construed as an endorsement for a commercial product, manufacturer, contractor, or consultant. Any trade names or photos of commercial products appearing in this publication are for clarity only. Table of Contents Executive Summary ................................................................................................................. 2 Background ............................................................................................................................ 2 Summary of Findings .............................................................................................................. 2 Gaps in Findings ..................................................................................................................... 4 Next Steps .............................................................................................................................. 4 Literature Search – Detailed Findings .................................................................................... 5 Key Word Search.................................................................................................................... 5 Google Search - Uber, Lyft Data Sharing, Ride Sharing ...................................................... 5 Google Search - Connected or Automated Vehicles Uber, Lyft............................................ 8 TRID - Transportation Research Board ............................................................................... 9 RITA- Bureau Transportation Statistics...............................................................................10 Caltrans Source: 2010-2012 California Household Travel Survey......................................11 Shared Mobility-UC Berkeley TSRC ...................................................................................13 AASHTO – Caltrans Shared Mobility ..................................................................................14 Caltrans Smart Mobility Preliminary Investigation ...............................................................17 FHWA – Planning Tools .....................................................................................................17 Appendix 1: Definition of Terms ............................................................................................19 What is Shared Mobility? ....................................................................................................19 What is Dynamic Ridesharing? ...........................................................................................20 What is Ridesourcing? ........................................................................................................21 What is Connected/ Automated Vehicles? ..........................................................................22 What is Sketch Planning Tools? .........................................................................................23 Travel Demand Models- Sketch Tool ..................................................................................24 Appendix 2: Draft Problem Statement ..................................................................................26 Appendix 3: Shared Mobility White Paper .............................................................................28

Welcome message from author
This document is posted to help you gain knowledge. Please leave a comment to let me know what you think about it! Share it to your friends and learn new things together.
Transcript
1
New Shared Mobility: Literature Search on Current Travel Demand Models and Data Reporting
Requested by
LaKeda Huckabay, Division of Research, Innovation and System Information Produced by
Ms. Lee Provost, P.E., M.S., DRISI March 11, 2016
The Caltrans Division of Research, Innovation and System Information (DRISI) receives and evaluates numerous research problem statements for funding every year. DRISI conducts Preliminary Investigations on these problem statements to better scope and prioritize the proposed research in light of existing credible work on the topics nationally and internationally. Online and print sources for Preliminary Investigations include the National Cooperative Highway Research Program (NCHRP) and other Transportation Research Board (TRB) programs, the American Association of State Highway and Transportation Officials (AASHTO), the research and practices of other transportation agencies, and related academic and industry research. The views and conclusions in cited works, while generally peer reviewed or published by authoritative sources, may not be accepted without qualification by all experts in the field. The contents of this document reflect the views of the authors, who are responsible for the facts and accuracy of the data presented herein. The contents do not necessarily reflect the official views or policies of the California Department of Transportation, the State of California, or the Federal Highway Administration. This document does not constitute a standard, specification, or regulation. No part of this publication should be construed as an endorsement for a commercial product, manufacturer, contractor, or consultant. Any trade names or photos of commercial products appearing in this publication are for clarity only.
Table of Contents
Executive Summary ................................................................................................................. 2 Background ............................................................................................................................ 2 Summary of Findings .............................................................................................................. 2 Gaps in Findings ..................................................................................................................... 4 Next Steps .............................................................................................................................. 4
Literature Search – Detailed Findings .................................................................................... 5 Key Word Search .................................................................................................................... 5
Google Search - Uber, Lyft Data Sharing, Ride Sharing ...................................................... 5 Google Search - Connected or Automated Vehicles Uber, Lyft ............................................ 8 TRID - Transportation Research Board ............................................................................... 9 RITA- Bureau Transportation Statistics ...............................................................................10 Caltrans Source: 2010-2012 California Household Travel Survey......................................11 Shared Mobility-UC Berkeley TSRC ...................................................................................13 AASHTO – Caltrans Shared Mobility ..................................................................................14 Caltrans Smart Mobility Preliminary Investigation ...............................................................17 FHWA – Planning Tools .....................................................................................................17
Appendix 1: Definition of Terms ............................................................................................19 What is Shared Mobility? ....................................................................................................19 What is Dynamic Ridesharing? ...........................................................................................20 What is Ridesourcing? ........................................................................................................21 What is Connected/ Automated Vehicles? ..........................................................................22 What is Sketch Planning Tools? .........................................................................................23 Travel Demand Models- Sketch Tool ..................................................................................24
Appendix 2: Draft Problem Statement ..................................................................................26
Appendix 3: Shared Mobility White Paper .............................................................................28
2
Executive Summary
Background
Caltrans has been involved with recent workshops and conferences that include current topics such as shared mobility, transportation infrastructure funding, smart growth, integrated land use planning, autonomous and connected/shared vehicle travel, sustainability- all that communicate and lay out Caltrans’ vision of an integrated, multimodal, economical and sustainable transportation for California (CA). Caltrans’ new Vision statement, based on a new strategic plan (business model), calls for Caltrans to “Provide a safe, sustainable, integrated and efficient transportation system to enhance California’s economy and livability”. But how can new travel demand technology and shared mobility (sharing transportation vehicles by the public) be addressed and also fit into the Caltrans business model? How can these changes in communication technology (such as use of smartphones and autonomous vehicles), fit into the existing transportation networks, reporting systems and transportation planning tools? Smart phones and shared mobility have recently changed the mode of travel (car, bike, transit, etc.) piece of pie to now include ridesourcing. Urban ridesharing companies –ridesourcing- otherwise called TNC’s – the transportation network companies -such as Uber or Lyft- are replacing part of the taxicab’s and other shared modes of travel by use of a smartphone to summon their services (referred to as on-demand services). Shared autonomous (self-driving) vehicles (SAV’s) merge the concepts of on-demand services. General Motors and Lyft are teaming up to create a national network of self-driving cars. Do these future travel modes help Caltrans achieve its goal to reduce greenhouse gas emissions, while also incorporate efficiency and mobility for travelers in CA? Or does it just replace another source of private car options, carpooling/vanpooling or taxis- and actually increase cars on the road and produce more greenhouse gas emissions? In general, 75% of people drive alone and 25% use other modes (transit, bike/walk, and vanpool/carpool). Do these newer modes of travel fit into this 25% shown in the current federal and state travel surveys, such as the U.S. Census Bureau, Bureau of Transportation Studies or the Caltrans Household Survey? Does this new shared mobility only fit into the regional short distance travel models and not the longer distanced inter-regional models? There are many questions to the new sources of shared mobility (bikesharing, ridesharing, carpooling, Uber, Lyft, etc.) that current transportation planning tools may not yet address, especially in the short trip urban areas. This preliminary investigation looks into these various questions to see if any new land use planning tools incorporate shared mobility. Also, a literature search was conducted on various newer shared mobility terms and travel mode reporting data sources.
Summary of Findings
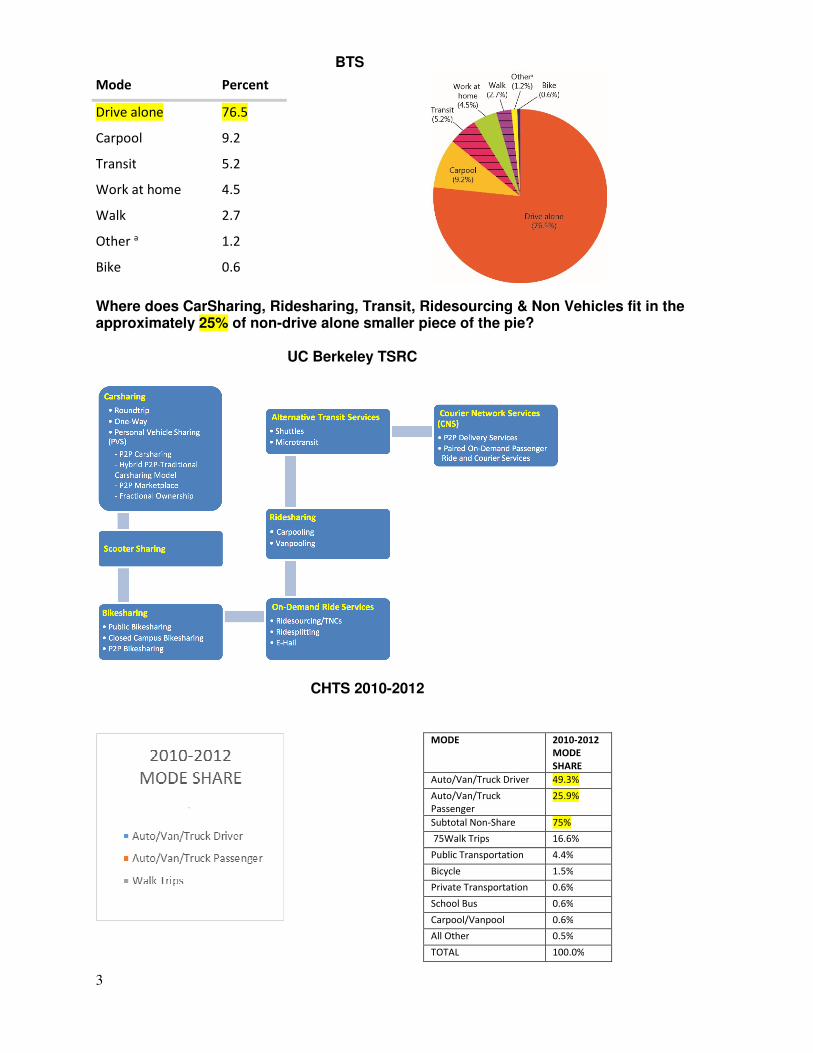
There are 3 (three) main sources of transportation statistics related to mode share (shared mobility):
1. Bureau of Transportation Studies (BTS) 2. Transportation Sustainability Research Center at UC Berkeley, CA (TSRC) 3. Caltrans 2010-2012 California Household Travel Survey (CHTS)
However, newer shared mobility as a mode share is not yet reported.
3
BTS
Mode Percent
Drive alone 76.5
Carpool 9.2
Transit 5.2
Work at home 4.5
Walk 2.7
Other a 1.2
Bike 0.6
Where does CarSharing, Ridesharing, Transit, Ridesourcing & Non Vehicles fit in the approximately 25% of non-drive alone smaller piece of the pie?
UC Berkeley TSRC
CHTS 2010-2012
MODE 2010-2012
MODE
SHARE
Auto/Van/Truck Driver 49.3%
Auto/Van/Truck
Passenger
25.9%
Subtotal Non-Share 75%
75Walk Trips 16.6%
Public Transportation 4.4%
Bicycle 1.5%
Private Transportation 0.6%
School Bus 0.6%
Carpool/Vanpool 0.6%
All Other 0.5%
TOTAL 100.0%
4
Gaps in Findings
Although there were many conferences by transportation organizations, universities, and some research work associated with this topic, there were no findings that any organization has yet incorporated new shared mobility into their data reporting, nor was there a tool or measure ready for use. As new data is collected, the newer travel mode share will need to add/include Ridesourcing (Uber, Lyft, etc.) amongst CarSharing, Transit, Courier Services, Bike/Walk and any other of the 25% of travel that does not use a personal vehicle. The Caltrans CA Household Travel Survey (CHTS) is starting again for 2016-2017, and will include shared mobility in their survey. This will help forecast regional and interregional travel demand models to forecast household travel behavior statewide. The CHTS data will also be used to develop and calibrate regional travel demand models to forecast greenhouse gas emissions (GHG). This may fill in the gap needed for shared mobility data.
Next Steps
Caltrans may want to read the various conferences and papers referred to in this Preliminary Investigation to gain more insight in what has been discussed for future transportation planning and reporting. Caltrans may also want to contact and interview researchers who are involved in planning tool model development and step-by-step tools that will integrate shared modes of travel in their reporting. Regional vs. interregional travel, that is, short term travel vs. traveling distances over 100 miles, may be the distinction between those who use new shared mobility. Newer travel modes such as bike sharing, Uber and Lyft are mainly used in urban areas; whereas, carpooling and vanpooling can be used for longer travel distances. These travel models need to be built upon data. The main question is how to capture this shared mobility data? Perhaps surveying the travelling public, asking “How often do you take Uber, Lyft or bike share?”, then build the travel demand modeling on top of that new survey data collected and data that already exists. The Caltrans CA Household Travel Survey (CHTS) is starting again for 2016-2017, and will include shared mobility in their survey. This survey will help develop regional and interregional travel demand models to forecast household travel behavior statewide and greenhouse gas emissions (GHG).
5
Literature Search – Detailed Findings
Key Word Search
Shared Mobility Modeling, Travel Demand Modeling, Land Use Sketch Tools, Sketch Planning Tools, Shared Mobility Sketch Tools, Shared Mobility, Connected and Automated Vehicle Services, Uber, Lyft, Google, Shared Autonomous Vehicles, Dynamic Ride Sharing Website Searches: Google, TRID, AASHTO, FHWA, BTS, RITA, UCTC, UCD, UCB and others.
Google Search - Uber, Lyft Data Sharing, Ride Sharing
Uber, Lyft, Sidecar try carpool service- Uber, Sidecar, Lyft experiment with carpooling By Carolyn Said Updated 5:58 pm, Wednesday, August 6, 2014 http://www.sfgate.com/technology/article/Uber-Lyft-Sidecar-try-carpool-service-5672983.php Ride services Lyft, left, Uber and Sidecar will offer carpools to passengers in San Francisco. They will match riders with others going the same way. Smartphone ride services Lyft, UberX and Sidecar are tackling a long-sought green goal: make carpooling a viable alternative to owning a car. All three companies are launching on-demand carpool options that will let passengers share rides - and costs - with other people going the same way. All are initially trying out the services in San Francisco, where they are based and have thousands of riders and drivers. With costs averaging 30 to 40 percent less than solo rides, the shared services may compete with public transit as well as car ownership. "Instead of public transit, we're building what we call personal transit," said Lyft co-founder and CEO Logan Green. The company elaborated in a blog post: "This is a transit system with infinite routes - and it becomes stronger, more affordable, and more efficient the more it's used." The benefits of fewer cars on the road are obvious: less congestion, fewer emissions, cheaper costs, reduced parking hassles. But carpools have never become widespread for a variety of reasons. People don't like to wait. People don't like to commit to exact commute times. And people don't like to share space with strangers. "These services have reached a level of demand and popularity that may address one of the largest obstacles to real-time ride-sharing: having enough supply to meet demand," said Susan Shaheen, co-director of the UC Berkeley Transportation Sustainability Research Center. "There's the potential to expand their platforms for greater social benefit. It's an exciting development." $5 per trip?- John Zimmer, Lyft co-founder and CEO, said many shared rides might cost $5 - for a trip from downtown to the Mission District, for instance. "That (price) would attract a whole new socioeconomic demographic," Shaheen said. Lyft got its start in 2007 as a carpooling service for long-distance shared rides, called Zimride. Two years ago it adopted the current Lyft model of paid solo rides, primarily intra-city, by community drivers in their own cars. "We planted the seeds with supply and demand," said co-founder and CEO Logan Green. "Lyft Line is our biggest step in bringing down prices. ... We've been thinking about this ever since we launched Lyft. We always intended to do it."
6
The carpool options, like the services themselves, are limited to people with smartphones and credit cards. Those on the wrong side of the digital divide, and those who don't use banks, are left out. Disabled activists already criticize the ride companies for a lack of accessible vehicles. "The services may need to be modified to address the needs of other populations," Shaheen said. But overall, she said, the development may be "the recipe to get people to get into cars with strangers and to carpool more." "If you couple (these existing services) with a discounted fare through ride-matching, then it becomes more efficient on multiple levels: more cost-effective, higher level of occupancy, higher passenger’s miles, reduced emissions per traveler and fuel savings," she said. UC Berkeley Transportation Sustainability Research Center- Link Results http://www.sfgate.com/search/?action=search&channel=technology&inlineLink=1&searchindex=gsa&query=%22UC+Berkeley+Transportation+Sustainability+Research+Center%22 Several different articles about ride sharing quoting Susan Shaheen…. SideCar Expand Service to Deliver Packages as well as People http://www.sfgate.com/business/article/Sidecar-expands-service-to-deliver-packages-as-6071623.php Combining deliveries with passenger rides makes a lot of sense, said Susan Shaheen, co-director of UC Berkeley’s Transportation Sustainability Research Center. “Its cars are already in motion from Point A to B,” she said. “It’s already increasing the efficiency of the number of passengers in the vehicle” with the carpool option. Although it’s been around longer, Sidecar is much smaller than market leaders Uber and Lyft. Its $40 million in venture capital is dwarfed by Uber’s multibillions and Lyft’s hundreds of millions. Rideshare Passenger Demographics (INFOGRAPHIC)- Vugo Footprint- Ridesharing Advertising http://www.govugo.com/rideshare-passenger-demographics/ For some time, ridesharing companies like Uber, Lyft and others in the on-demand transportation industry have made broad statements about who they believe is choosing to travel via app. Now, thanks to a comprehensive ridesharing working paper from the University of California Transportation Center and Vugo’s own internal data, we now we have research-based demographics on passengers of Uber and Lyft that allows us to better understand rideshare passengers; who they are, where they are most likely to travel and what purchasing decisions they are making after exiting a ridesharing vehicle. According to our sources, the typical rideshare passenger is:
• Young (25-34). While riders’ ages span from 15 to 55 and up, approximately 57% of all rideshare passengers fall in the 25-34 category. And riders aged 45 and greater only make up 7% of the total rideshare passengers. This results in ridesharing skewing heavily toward a younger audience.
• Male. Male riders make up 60% of the rideshare passenger population. • Educated. More than 80% of all ridesharing passengers hold a bachelor’s degree or
higher. • Affluent. At least 56% of all rideshare passengers reported a household income of
$71,000 or higher, with nearly 40% of all passengers making at least $100,000. Rideshare airport trips:
7
• Home (Residential Addresses)
• Workplaces • Tourist destinations • Restaurants
• Bars • Airports • Retail stores • Fitness clubs
• Doctors’ offices and hospitals
• Bus and transit stations
Ride Share Tips http://ridesharetips.com/maps/ News & advice for riders & drivers of Uber, Lyft, etc. Business Management http://ridesharetips.com/category/business-2/ Uber is making a push into the business travel market. Yesterday, the company announced its Uber for business program, which includes integrating expense management with Concur. What Lyft/Uber Drivers Make per Ride https://twitter.com/ridesharetips?ref_src=twsrc^tfw Google Maps and Apple Maps- Smartphone Apps http://www.nytimes.com/2014/11/13/technology/personaltech/the-map-apps-that-move-you-in-the-right-direction.html?_r=0 Ride-sharing companies one step closer to picking up passengers at Sky Harbor By Ben Margiott | Cronkite News | POSTED: Feb 22, 2016 https://cronkitenews.azpbs.org/2016/02/22/ridesharing-companies-one-step-closer-to-picking-up-passengers-at-airport/ The proposal that would allow ride-sharing companies like Uber and Lyft to pick up passengers at the airport cleared another hurdle Thursday afternoon. The controversial measure, which would drastically alter the airport’s fee structure for ground transportation, was barely approved in a 5-4 vote by the Phoenix Aviation Advisory Board. Uber and Lyft are already permitted to drop off passengers on Sky Harbor Boulevard, but if the measure passes the Phoenix City Council later this spring, those services could pick up passengers too. Board members claimed the revamp was a much-needed overhaul of an outdated and unfair policy for some companies. “We surveyed the top-20 U.S. airports in the nation and Sky Harbor is the only airport that has yet to modernize our ground transportation policy,” Chad Makovsky, assistant aviation director, said. “Some commercial operators are paying fees that specifically subsidize the operation of other competing businesses.” Uber and Lyft would be new operators under the policy, meaning their per-trip fee would immediately jump up to $4 — existing operators would be phased into the seat-based fee plan. But off-site airport parking services argued their $6 per-trip fee would put them out of business, thereby eliminating around 200 jobs between the different companies. “(The $6 fee) doesn’t sound like a lot but if you consider the number of trips we do every year, it would total for us about $400,000 per year which is absolutely catastrophic to my business,” David Warren, owner of Blue Sky Airport parking, said. Lyft https://www.lyft.com/
8
Rides in Minutes. Wherever you’re headed, count on Lyft for rides in minutes. The Lyft app matches you with local drivers at the tap of a button. Just request and go. Uber https://www.uber.com/ Uber is the smartest way to get around. One tap and a car comes directly to you. Your driver knows exactly where to go. And payment is completely cashless.
Google Search - Connected or Automated Vehicles Uber, Lyft
GM and Lyft Are Building a Network of Self-Driving Cars By Alex Davis, Transportation, Wired Jan 4, 2016 http://www.wired.com/2016/01/gm-and-lyft-are-building-a-network-of-self-driving-cars/ General Motors and Lyft are teaming up to create a national network of self-driving cars, the companies jointly announced this morning. Selling one car to every person with the money to buy one is no longer viable. GM will invest $500 million in Lyft and take a seat on the ride-sharing startup’s board of directors. It will also become a preferred provider of cars for short-term use to Lyft drivers. It’s a natural partnership, the two say: Lyft knows all about getting people into cars they don’t own, and GM’s been working on autonomous technology for about a decade. What’s key here is that this partnership shows GM is serious about moving beyond the era of the personal, human-driven automobile. “We see the future of personal mobility as connected, seamless and autonomous,” says GM President Dan Ammann. “With GM and Lyft working together, we believe we can successfully implement this vision more rapidly.” GM, like all car manufacturers, needs to move past the old ways. As this new age of “mobility” dawns, selling one car to every person with the money to buy one is no longer viable. Our roads are too crowded, our air too polluted. Better options are on the way, thanks to technologies like automated driving and smartphones that connect passengers with drivers. New players are entering the industry, like Lyft, Uber, Google, and, reportedly, Apple. Ride Sharing: Uber Expands Autonomous Vehicle Research with Tech Center Roads and Bridges Magazine Transportation Management News February 16, 2016 http://www.roadsbridges.com/ride-sharing-uber-expands-autonomous-vehicle-research-tech-center Uber Uber will expand its advanced technologies center in Pittsburgh to further research and develop autonomous vehicle technology. "Self-driving technology has the potential to drastically cut down on accidents and congestion while making transportation even more affordable and convenient for everyone," said Uber's John Bares. The advanced technology center is a partnership with Carnegie Mellon University focuses on autonomous vehicle technology in addition to mapping and safety-related technology. Uber will break ground on the project in the coming months. The company said it is working with local leaders to finalize the project’s details and will work with them to develop roadways on the site. Trend: Driverless Cars:
9
http://www.roadsbridges.com/new-poll-according-new-study-driverless-cars-one-being-developed-google-might-actually-increase New poll: According to a new study, driverless cars like the one being developed by Google might actually increase energy use and traffic because people who now take public transit will make the switch. Do you agree? According to a new study, driverless cars like the one being developed by Google might actually increase energy use and traffic because people who now take public transit will make the switch. Do you agree? As of 2-29-16 Roads and Bridges website reports: Yes 50% No 33% Since I have not seen this technology in action yet it’s hard to say. 17%
TRID - Transportation Research Board
Title: Adoption of Shared Autonomous Vehicles--A Hybrid Choice Modeling Approach Based on a Stated-Choice Survey Accession Number: 01590221 http://amonline.trb.org/ Transportation Research Board Annual Meeting 2016 Paper #16-2257 Abstract: Shared autonomous vehicles (SAVs) merge the concepts of conventional carsharing and taxi services with self-driving vehicles and could provide inexpensive mobility on-demand services. In addition, SAVs may facilitate the implementation of dynamic ride-sharing (DRS) schemes. A stated choice survey was conducted and analyzed, using an integrated choice and latent variable model to identify the characteristics of potential users of SAVs with and without DRS. The results indicate that service attributes may be critical determinants of SAV use and DRS acceptance. SAVs are more likely to be selected by young travelers and a strong relationship between the set of modes, which an individual frequently uses, and the propensity to choose SAVs is revealed. Policy implications with regard to how policy-makers should address SAVs to realize their environmental and societal benefits are derived. The results suggest that SAVs may be a major game changer in the mobility industry. Supplemental Notes: This paper was sponsored by TRB committee AP020 Standing Committee on Emerging and Innovative Public Transport and Technologies. Alternate title: Adoption of Shared Autonomous Vehicles: Hybrid Choice Modeling Approach Based on Stated-Choice Survey. Title: The Future of Fully Automated Vehicles: Opportunities for Vehicle- and Ride-Sharing, with Cost and Emissions Savings Accession Number:01538222 http://swutc.tamu.edu/pub...reports/600451-00081-1.pdf http://library.ctr.utexas...spx?q=(catalog.ID=(32930)) Abstract: Fully automated or autonomous vehicles (AVs) hold great promise for the future of transportation. By 2020 Google, auto manufacturers and other technology providers intend to introduce self-driving cars to the public with either limited or fully autonomous capabilities. AVs may be able to save the U.S. economy up to $37.7 billion in comprehensive costs from safety, mobility and parking improvements at the 10% market penetration, and potentially up to $447.1 billion with 90% market penetration. Even with only 10% market share, over 1,000 lives could be saved annually. However, realizing these potential benefits while avoiding potential pitfalls requires more than just technology advancements: significant barriers to a successful rollout include AV costs, liability, security, and privacy. Once fully self-driving vehicles can safely and
10
legally drive unoccupied on U.S. streets, a new transportation mode for personal travel looks set to arrive. This new mode is the shared automated vehicle (SAV), combining on-demand service with self-driving capabilities. This work simulates a fleet of SAVs operating within the city of Austin, using Austin’s transportation network and travel demand flows. This model incorporates dynamic ride-sharing (DRS), allowing two or more travelers with similar origins, destinations and departure times to share a ride. Model results indicate that each SAV could replace around 10 conventionally-owned household vehicles while serving over 56,000 person-trips. SAVs’ ability to relocate while unoccupied between serving one traveler and the next may cause an increase of 4-8% more travel; however, DRS can result in reduced overall vehicle-miles traveled (VMT), given enough SAV-using travelers willing to ride-share. SAVs should produce favorable emissions outcomes, with an estimated 16% less energy use and 48% lower volatile organic compound (VOC) emissions, per person-trip formerly served by a household vehicle. Supplemental Notes: This document was sponsored by the U.S. Department of Transportation, University Transportation Centers Program. Project Title: Anticipating Long-Term Energy and GHG Emissions Impacts of Autonomous Vehicles.
RITA- Bureau Transportation Statistics
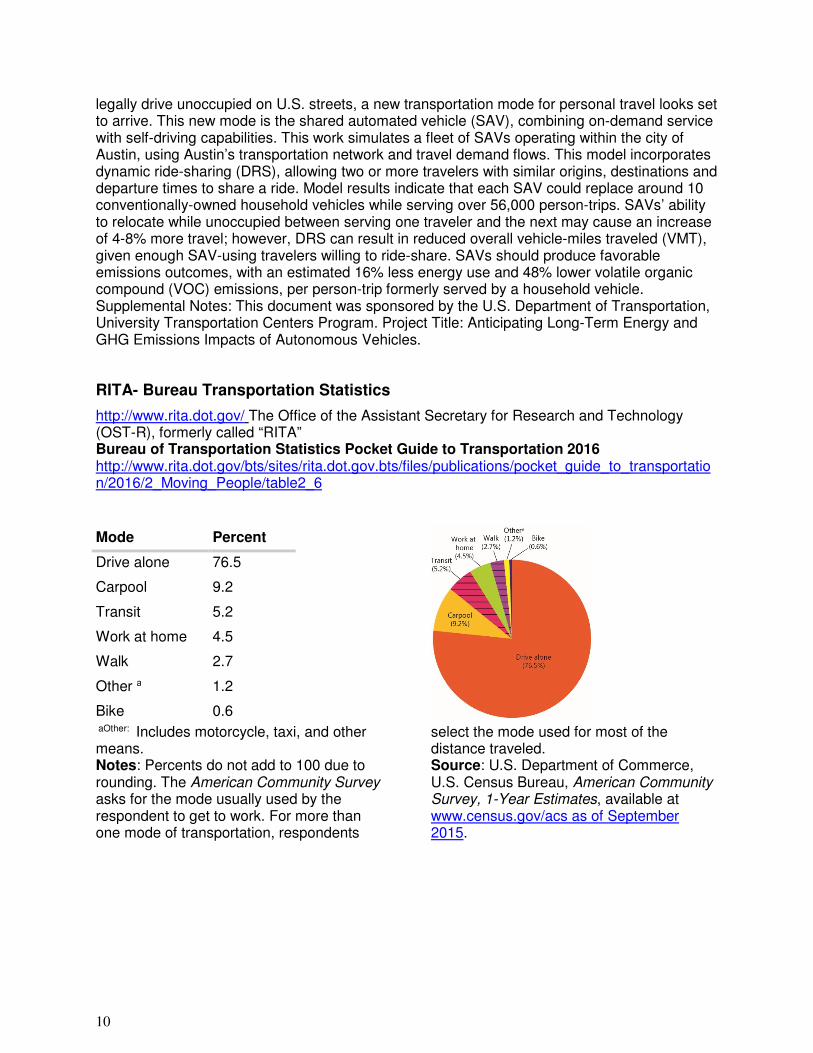
http://www.rita.dot.gov/ The Office of the Assistant Secretary for Research and Technology (OST-R), formerly called “RITA” Bureau of Transportation Statistics Pocket Guide to Transportation 2016 http://www.rita.dot.gov/bts/sites/rita.dot.gov.bts/files/publications/pocket_guide_to_transportation/2016/2_Moving_People/table2_6
Mode Percent
Drive alone 76.5
Carpool 9.2
Transit 5.2
Work at home 4.5
Walk 2.7
Other a 1.2
Bike 0.6 aOther: Includes motorcycle, taxi, and other means. Notes: Percents do not add to 100 due to rounding. The American Community Survey asks for the mode usually used by the respondent to get to work. For more than one mode of transportation, respondents
select the mode used for most of the distance traveled. Source: U.S. Department of Commerce, U.S. Census Bureau, American Community Survey, 1-Year Estimates, available at www.census.gov/acs as of September 2015.
11
BTS Pocket Guide to Transportation 2016 - Uses 2014 statistics: Mode of travel for passenger miles travelled Section 2-3 has light duty, motorcycles, truck and bus. Commuter not listed. Trip by Mode Section 2-5 has: private vehicle, bus, rail, walk, bike, air, other. No shared vehicles or carpooling listed. For transportation greenhouse gas emissions (GHG) Section 7-5 the biggest polluter at 85% is highways. For household expenses Section 5-4, transportation is second highest expense 17% next to housing 33%.
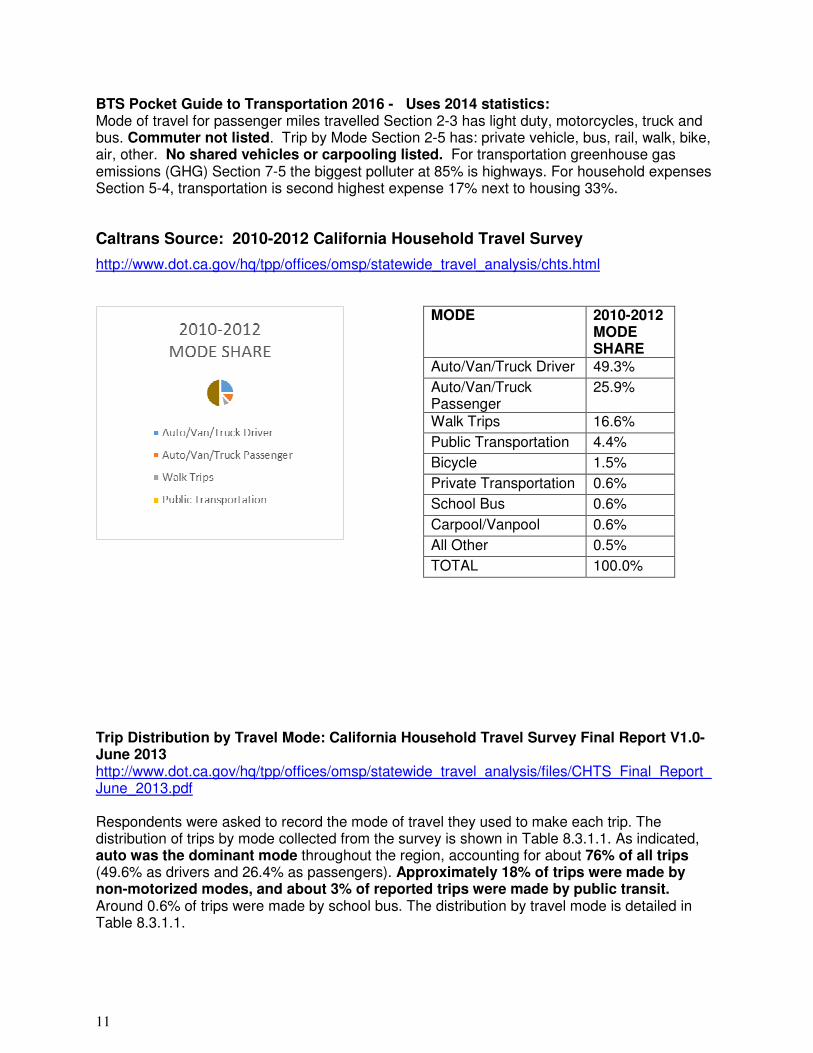
Caltrans Source: 2010-2012 California Household Travel Survey
http://www.dot.ca.gov/hq/tpp/offices/omsp/statewide_travel_analysis/chts.html
MODE 2010-2012 MODE SHARE
Auto/Van/Truck Driver 49.3%
Auto/Van/Truck Passenger
25.9%
Walk Trips 16.6%
Public Transportation 4.4%
Bicycle 1.5%
Private Transportation 0.6%
School Bus 0.6%
Carpool/Vanpool 0.6%
All Other 0.5%
TOTAL 100.0%
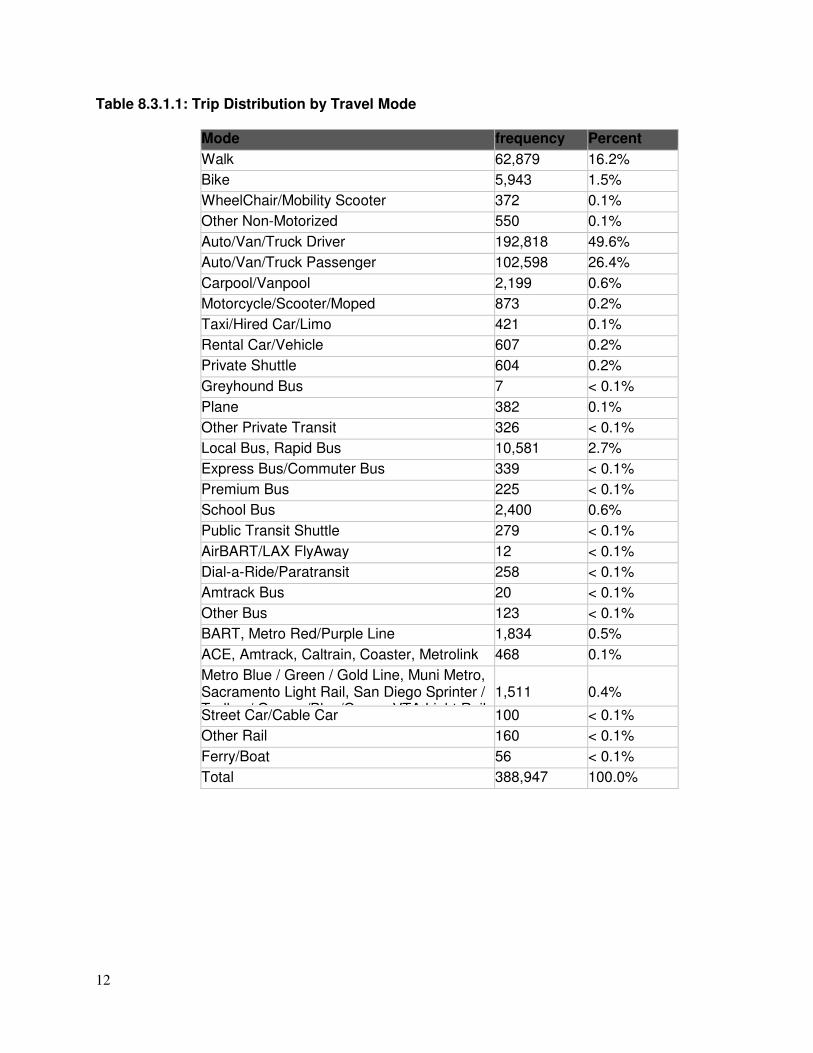
Trip Distribution by Travel Mode: California Household Travel Survey Final Report V1.0- June 2013 http://www.dot.ca.gov/hq/tpp/offices/omsp/statewide_travel_analysis/files/CHTS_Final_Report_June_2013.pdf Respondents were asked to record the mode of travel they used to make each trip. The distribution of trips by mode collected from the survey is shown in Table 8.3.1.1. As indicated, auto was the dominant mode throughout the region, accounting for about 76% of all trips (49.6% as drivers and 26.4% as passengers). Approximately 18% of trips were made by non-motorized modes, and about 3% of reported trips were made by public transit. Around 0.6% of trips were made by school bus. The distribution by travel mode is detailed in Table 8.3.1.1.
12
Table 8.3.1.1: Trip Distribution by Travel Mode
Mode frequency Percent
Walk 62,879 16.2%
Bike 5,943 1.5%
WheelChair/Mobility Scooter 372 0.1%
Other Non-Motorized 550 0.1%
Auto/Van/Truck Driver 192,818 49.6%
Auto/Van/Truck Passenger 102,598 26.4%
Carpool/Vanpool 2,199 0.6%
Motorcycle/Scooter/Moped 873 0.2%
Taxi/Hired Car/Limo 421 0.1%
Rental Car/Vehicle 607 0.2%
Private Shuttle 604 0.2%
Greyhound Bus 7 < 0.1%
Plane 382 0.1%
Other Private Transit 326 < 0.1%
Local Bus, Rapid Bus 10,581 2.7%
Express Bus/Commuter Bus 339 < 0.1%
Premium Bus 225 < 0.1%
School Bus 2,400 0.6%
Public Transit Shuttle 279 < 0.1%
AirBART/LAX FlyAway 12 < 0.1%
Dial-a-Ride/Paratransit 258 < 0.1%
Amtrack Bus 20 < 0.1%
Other Bus 123 < 0.1%
BART, Metro Red/Purple Line 1,834 0.5%
ACE, Amtrack, Caltrain, Coaster, Metrolink 468 0.1%
Metro Blue / Green / Gold Line, Muni Metro, Sacramento Light Rail, San Diego Sprinter / Trolley / Orange/Blue/Green, VTA Light Rail
1,511
0.4%
Street Car/Cable Car 100 < 0.1%
Other Rail 160 < 0.1%
Ferry/Boat 56 < 0.1%
Total 388,947 100.0%
13
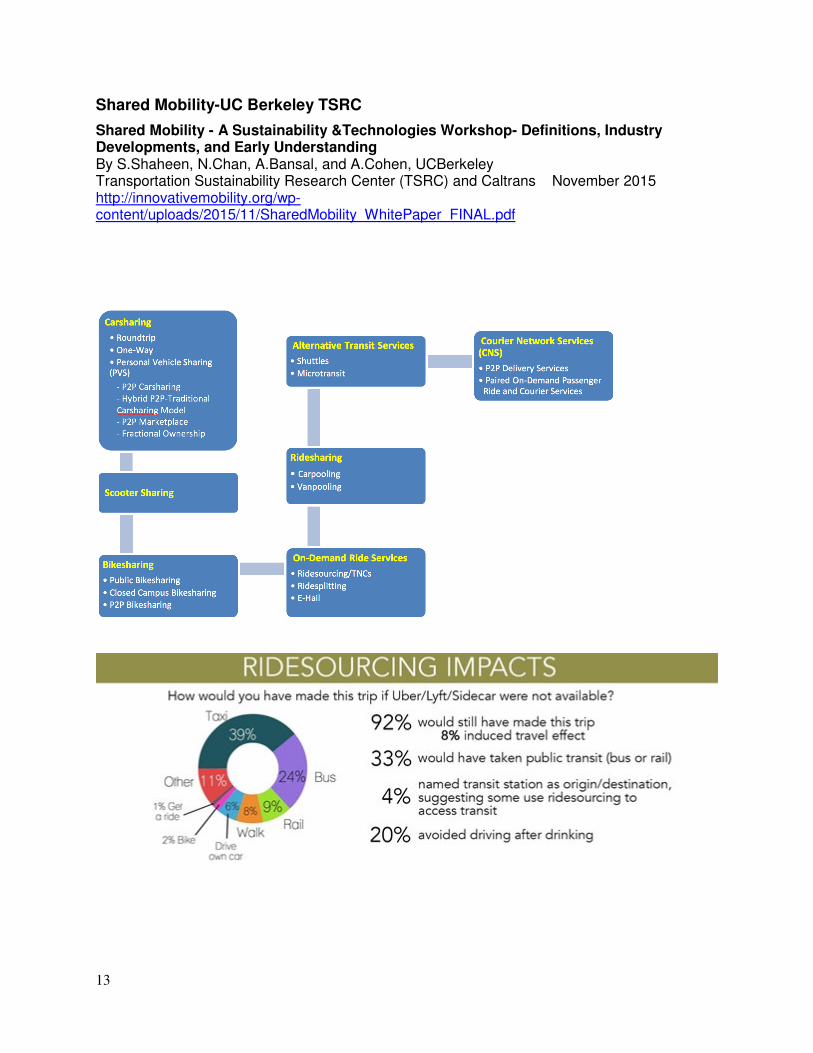
Shared Mobility-UC Berkeley TSRC
Shared Mobility - A Sustainability &Technologies Workshop- Definitions, Industry Developments, and Early Understanding By S.Shaheen, N.Chan, A.Bansal, and A.Cohen, UCBerkeley Transportation Sustainability Research Center (TSRC) and Caltrans November 2015 http://innovativemobility.org/wp-content/uploads/2015/11/SharedMobility_WhitePaper_FINAL.pdf
14
AASHTO – Caltrans Shared Mobility
Center for Environmental Excellence by AASHTO- Energy/Greenhouse Gas Emissions- Case Studies http://environment.transportation.org/environmental_topics/energy_greenhouse/case_studies.aspx California Caltrans Works to Advance 'Smart Mobility' Approach Since 2010, the California Department of Transportation has been working to implement a new vision for integrating transportation and land use decisions that promises to combine a range of familiar solutions taking hold across the nation: smart growth, livability, context sensitive design, transit-oriented development, complete streets, and sustainability. Caltrans’ “Smart Mobility 2010” framework was developed to ensure that the state’s transportation investments achieve balanced outcomes for mobility, environmental protection, social equity, and economic growth – all backed by specific performance measures. Caltrans describes the concept as follows: “Smart Mobility moves people and freight while enhancing California’s economic, environmental, and human resources by emphasizing: convenient and safe multi-modal travel, speed suitability, accessibility, management of the circulation network, and efficient use of land.” Developed using a smart growth program grant from the Environmental Protection Agency, the framework establishes six Smart Mobility principles to be applied based on specified place-types, each with its own set of performance measures. The six principles are:
• location efficiency, • reliable mobility, • health and safety,
• environmental stewardship, • social equity, and • robust economy.
Under the Smart Mobility approach, transportation planning and design would be conducted based on seven newly established place-types: urban centers, close-in compact communities, compact communities, suburban areas, rural and agricultural lands, protected lands, and special use areas. For each place type, performance measures would be targeted to align with the principles. Types of performance measures include the following: Support for sustainable growth; transit mode share; accessibility and connectivity; Multi-modal travel mobility, reliability, service quality, safety; design and speed suitability; Pedestrian and bicycle mode share; climate and energy conservation; Emissions reduction; equitable distribution of impacts; Equitable distribution of access and mobility; congestion effects on productivity; Efficient use of system resources; network performance optimization; And return on investment.
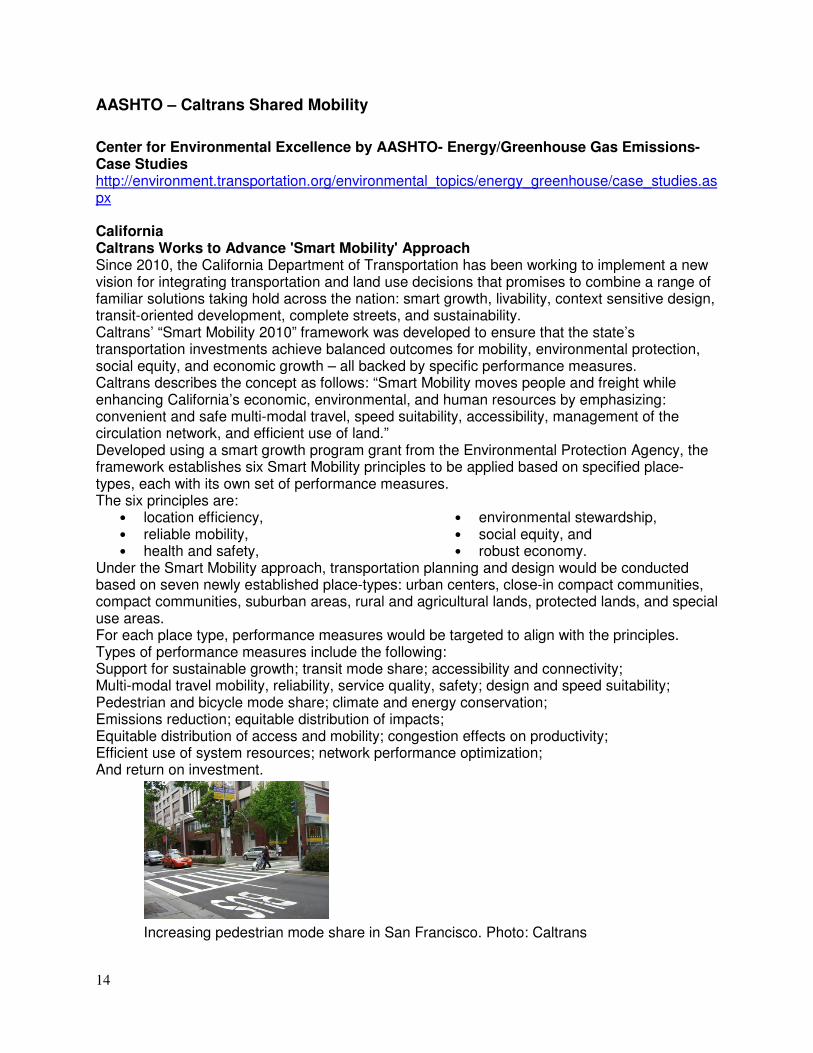
Increasing pedestrian mode share in San Francisco. Photo: Caltrans
15
Interregional Blueprint Process The plan also calls for a “transformed state transportation planning process” developed through a multimodal “Interregional Blueprint” process, incorporating transportation and land use planning efforts underway by regional and metropolitan planning organizations in the state. California is subject to some of the nation’s most ambitious environmental and sustainability goals, including the landmark Global Warming Solutions Act (AB 32), under which the state must reduce greenhouse gas emissions to 1990 levels by 2020. In addition, Senate Bill 375, enacted in 2008, requires regional targets for reducing greenhouse gas emissions from passenger vehicles. SB 375 – which has been touted as a possible national model for transportation planning – establishes a process and incentives for the creation of integrated regional land use, housing and transportation plans called “sustainable communities strategies.” Building on these regional efforts, SB 391 passed in October of 2009, requires that the California Transportation Plan prepared by Caltrans identify the statewide multimodal transportation system that will achieve the state’s climate change goals. The California Interregional Blueprint, a statewide land use-transportation plan will integrate the state’s various modal plans and incorporate individual blueprints developed by regions across the state. Caltrans currently administers the California Regional Blueprint Planning Program for regional transportation planning agencies to conduct comprehensive scenario planning, bringing together a range of stakeholders to develop preferred long-range growth scenarios. The Interregional Blueprint will incorporate the Smart Mobility principles and improve modeling and data gathering, serving as the foundation for the next update of the California Transportation Plan. The Interregional Blueprint planning process is underway. Next Steps A number of short-term actions will be undertaken between 2012 and 2014 to develop and test approaches to implement the Smart Mobility principles and performance measures. These include applying the framework in separate planning efforts in the northern and southern portions of the state. The agency plans to document these efforts and develop a “how-to” guide for implementation. The vision for using the framework is described by Caltrans as follows:
• find your place type; • forecast transportation needs; • apply Smart Mobility principles;
• assess Smart Mobility Performance; • prioritize transportation investments; • achieve Smart Mobility.
Additional Efforts Other efforts include a Caltrans-funded study, Improved Data and Tools for Integrated Land Use-Transportation Planning in California, which was completed in October 2012. Over a three-year period, the project team collected and analyzed data on land use-travel relationships at more than 200,000 locations in most of California. The project provided a final report as well as analytical tools for use in “sketch”-planning tools, which local and regional agencies use to assist in developing scenarios, and travel demand forecasting models, which are commonly used to analyze resulting scenarios. These products will be helpful to regional agencies in their Blueprint and sustainable community strategies and regional transportation planning, and to local governments for their planning efforts. Another significant Caltrans effort has been implementation of its complete streets directive. Caltrans also has completed a survey, “Smart Mobility: A Survey of Current Practice and Related Research,” that looks at federal, state and regional activities to assess the current state of the practice of sustainability-oriented planning and performance measurement For additional information on the framework, link to the Smart Mobility page on the Caltrans website or contact Chris Ratekin, senior transportation planner with Caltrans, at [email protected]. Information on the planning process may be accessed at http://www.californiainterregionalblueprint.org/
16
Summary White Paper: AASHTO Conference on 21st Century Mobility for Freight and Passenger Transportation Salt Lake City, Utah July 2015 http://scoe.transportation.org/Documents/21st%20Century%20Mobility%20Summary%20White%20Paper%20FINAL%2010-15-15.pdf Executive Summary
• In July 2015, AASHTO’s Standing Committees on Environment, Planning, Public Transportation, and the Subcommittee on Highway Transport held a joint meeting in Salt Lake City, Utah, to capitalize on the overlapping focus areas between environmental, planning, public transportation, and freight professionals at the state departments of transportation (DOTs).
• The meeting focused on the opportunities and challenges facing transportation agencies into the 21st Century. Wide-ranging topics of discussion included technology issues, such as connected vehicle adoption and deployment; automated road and vehicle systems; programs to capture data from stationary sensors, mobile devices, and connected vehicles; digital mapping; ride-sharing services and technologies; and technologies for online payment of transit fares and parking fees.
• Sessions included discussions of how transportation can prepare for and take advantage of these “disruptive” technologies, as well as how agencies can meet ongoing responsibilities such as performance management and environmental mandates.
• The meeting, which opened with a panel of state DOT executives who lead the four AASHTO committees, brought together state DOT representatives from across the U.S. to discuss key takeaways and action items to foster cross-modal collaboration into the future.
• Some of the key takeaways are outlined below. • Technology changes are coming “at warp speed”; DOTs need to take steps now to be
engaged and prepared. • Smart phone applications are “low-hanging fruit” that can facilitate services including
transit, truck inspections, navigation, and safety. • DOTs need to focus on their people: prepare future generations by focusing on
workforce development, new skill sets, and focusing on strengths of individuals. • DOTs need to transition their role to support the needs of communities. • Disruptive technologies will force DOTs to break down silos between modes and funding
streams. • Transportation agencies’ “customers” are changing: people are using the system
differently. • DOTs are beginning to address the policy and legal issues presented by new
technologies, but most have not fully achieved the needed organizational and cultural changes.
• The needed cultural shift is starting to show up as DOTs change their vision statements to focus on the needs of communities.
• As technologies advance, a number of public policy and legal issues – such as licensing – remain to be sorted out.
• DOTs should partner with all stakeholders including the private sector and academia, to help address challenges from disruptive technologies.
• The transportation sector needs to focus on public transportation, in addition to individual connected or autonomous vehicles, to meet mobility challenges.
• Highway agencies need to learn from other sectors who have faced similar challenges with technology– such as the railroad industry.
17
• Questions remain over how to share data among the public and private sector and individuals – the solution must be “good for the many.”
• New technologies bring new safety and security concerns that will require a “zero-fail’ mentality: 100 percent reliability.
• DOTs will need to reconsider design standards and traditional approaches for data gathering in light of emerging technologies.
• Pilot projects and test beds are needed to help advance new technologies. • Agencies need to focus on how best to measure performance, including project-level
performance, multi-modal performance, and organizational performance. To access presentations and the conference agenda link here: http://scoe.transportation.org/Documents/AASHTO%20Conference%20on%2021st%20Century%20Mobility%202015/Draft_AASHTO%20Conference%20on%2021st%20Century%20Mobility_Agenda_Presentations%20081315.pdf AASHTO Conference Breakout 3: Opportunity Cost of Not Investing in Transportation Infrastructure 11:00 a.m.–12:30 p.m. Day 3—Wednesday, July 8th, 2015 Moderator: Katie Benouar, Caltrans Format: Panel Presentations This session will assess how a lack of current investment in transportation infrastructure will impact the future of transportation and the economy. AASHTO Conference Breakout: Connected/Autonomous Vehicles Town Hall—Part I: Technology Overview Panel 1:00 p.m.–2:30 p.m. Thursday, July 9th, 2015 Moderator: Matthew Garrett, Director, Oregon DOT and SCOE Chair This session will provide an opportunity for attendees to hear about the various deployment scenarios for both connected and autonomous vehicles. Participants will hear from states that are considering these potential deployment scenarios through legislative or policy changes, those that are engaged in technological efforts, and Federal agencies that are addressing the imminent deployment of vehicle advancements
Caltrans Smart Mobility Preliminary Investigation
Smart Mobility: A survey of Current Practice and Related Research By CTC & Associates April 2012 for Caltrans Division of Research & Innovation http://www.dot.ca.gov/hq/tpp/offices/ocp/smf_files/SMF_PI_4-25-12.pdf This research preliminary investigation examines the completed and ongoing domestic and international research and investigates federal, state and regional activities to assess the current state of the practice of sustainability-orientated planning and performance measurement. It has a section on Tools and Measures siting some reports in 2010 and 2011 but most are for sustainability, not necessarily for shared mobility travel demand modelling.
FHWA – Planning Tools
Planning Processes, Planning Tools – FHWA Website http://www.fhwa.dot.gov/planning/processes/tools/
18
Planning Tools GIS in Transportation Highway Economic Requirements System State Version (HERS/ST) - a computer model that predicts the investment required to achieve certain highway system performance levels. HERS/ST uses engineering standards to identify highway deficiencies and applies economic criteria to select the most cost-effective mix of highway system improvements. Influence of Transportation Infrastructure on Land Use - (PDF format 146 KB) This document describes the development decision-making process from the private sector perspective, as well as the role that local and regional government entities play in the process. It provides a framework for understanding the relative importance of transportation accessibility, describes the role of local and regional government actions and policies, and outlines the private developer's decision-making process.
• National Highway Planning Network (NHPN) - A geospatial network database of major highways in the United States. It is used for highway performance analysis and planning at a regional and national scale.
• Planning & Environment Linkages Implementation Resources • TELUS - This state-of-the-practice software is helping MPOs and DOTs improve their
transportation planning. • Tool Kit for Integrating Land Use and Transportation Decision-Making (2012) • Transportation Analysis Simulation System (TRANSIMS) - a set of transportation and air
quality analysis and forecasting tools developed to create an integrated regional transportation system analysis environment.
Archives • Toolbox for Regional Policy Analysis Report (2000) - This web-interactive report
describes analytical methods for testing the regional impacts of transportation and land use policies.
19
Appendix 1: Definition of Terms
What is Shared Mobility?
Shared Mobility- A Sustainability & Technologies Workshop UC Berkeley Transportation Sustainability Research Center and Caltrans – November 2015 http://innovativemobility.org/?page_id=955 Several Definitions given including a glossary of terms on page 20. Includes Carsharing, Bikesharing, Courier Network Services, Ridesharing and Ridesourcing. Susan Shaheen ,PhD, UC Berkeley Transportation Sustainability Research Center Draft Problem Statement to Caltrans October 13, 2015 Shared mobility–the shared use of a vehicle, bicycle, or other low-speed mode–is an innovative transport strategy that enables short-term access to transportation modes on an “as-needed” basis. It includes carsharing; personal vehicle sharing (peer-to-peer carsharing and fractional ownership); bikesharing; scooter sharing; shuttle services; microtransit; ridesharing; e-Hail (taxis); and ridesourcing/transportation network companies (TNCs) (also known as ride-hailing). It can also include courier network services (CNS) or flexible goods delivery, which provide for-hire delivery services using an online application or platform (such as a website or smartphone app) to connect couriers using their personal vehicles, bicycles, or scooters with freight (e.g., packages, food). Shared Mobility: Definitions, Industry Developments, and Early Understanding Bikesharing, Carsharing, On-Demand Ride Services, Ridesharing, Shared-Use Mobility Authors: Susan Shaheen, Nelson Chan, Apaar Bansal, Adam Cohen November 2015 http://innovativemobility.org/?project=shared-mobility-definitions-industry-developments-and-early-understanding Shared mobility – the shared use of a vehicle, bicycle, or other mode – is an innovative transportation strategy that enables users to gain short-term access to transportation modes on an “as-needed” basis. The term shared mobility includes various forms of carsharing, bikesharing, ridesharing (carpooling and vanpooling), and on-demand ride services. It can also include alternative transit services, such as paratransit, shuttles, and private transit services, called microtransit, which can supplement fixed-route bus and rail services. With many new options for mobility emerging, so have the smartphone “apps” that aggregate these options and optimize routes for travelers. In addition to innovative travel modes, new ways of transporting and delivering goods have emerged. These “courier network services” have the potential to change the nature of the package and food delivery industry. Shared mobility has had a transformative impact on many global cities by enhancing transportation accessibility, while simultaneously reducing driving and personal vehicle ownership.
20
Shared-Use Mobility Center Chicago, Il and Los Angeles, Ca. http://sharedusemobilitycenter.org/what-is-shared-mobility/ Shared-use mobility comprises transportation services that are shared among users, including traditional public transit; taxis and limos; bikesharing; carsharing (round-trip, one-way, and personal vehicle sharing); ridesharing (car-pooling, van-pooling); ride-sourcing; scooter sharing; shuttle services; neighborhood jitneys; and commercial delivery vehicles providing flexible goods movement. The Shared-Use Mobility Center (SUMC) is a public-interest organization working to foster collaboration in shared mobility (including bikesharing, carsharing, ridesharing and more) and help connect the growing industry with transit agencies, cities and communities across the nation. Through piloting programs, conducting new research and providing advice and expertise to cities and regions, SUMC hopes to extend the benefits of shared mobility for all. Shared Mobility, Inc. Buffalo, NY http://www.sharedmobility.org/#!past-work/c1tsl We believe in advancing innovative transportation services that focus on a shared model to service neglected communities and smaller more challenging markets by overcoming policy barriers and perfecting mobility systems through technology and industry best practices. From ride sharing companies like Lyft and Uber to traditional car sharing and bike sharing systems, Shared Mobility Systems are transportation networks that focus on shared commodities as the focal point to improve mobility. These networks aggregate transportation options for users, complement public transit and ideally provides cross-communication between all modes. We strive to prove that Shared Mobility Systems can be utilized by all communities.
What is Dynamic Ridesharing?
FHWA Power Point https://www.fhwa.dot.gov/ipd/pdfs/revenue/resources/webinars/webinar_congestion_pricing_072811.pdf Social Networking and Smart Phone driven
• Fully on demand & real-time • Pick up anywhere along route • Driver utilizes traveler information for real-time decision to car pool • Rider connects with driver through smart phone and GPS location
Why is Dynamic Ridesharing Important to the Government? •Reduces vehicle-miles traveled, leading to: –Congestion mitigation –Carbon and air-pollutant emissions cuts –New infrastructure expenditure reductions •Potential to provide socially-necessary transportation –Senior citizens, dial-a-ride, college students More efficient use of current infrastructure –Numerous possibilities for an increasingly connected world •Person throughput focus vs. vehicle throughput
21
Dynamic Ridesharing Definition http://dynamicridesharing.org/ Dynamic: The basic criterion is this: can matches be made via cell phone or mobile device. A system that facilitates the ability of drivers and passengers to make one-time ride matches close to their departure time, with sufficient convenience and flexibility to be used on a daily basis. Dynamic Ridesharing or Carpooling Difference- Wikipedia https://en.wikipedia.org/wiki/Real-time_ridesharing Real-time ridesharing (also known as instant ridesharing, dynamic ridesharing, ad-hoc ridesharing, on-demand ridesharing, and dynamic carpooling) is a service that arranges one-time shared rides on very short notice.[1] This type of carpooling generally makes use of three recent technological advances:[2]
• GPS navigation devices to determine a driver's route and arrange the shared ride • Smartphones for a traveler to request a ride from wherever they happen to be • Social networks to establish trust and accountability between drivers and passengers
These elements are coordinated through a network service, which can instantaneously handle the driver payments and match rides using an optimization algorithm. Like carpooling, real-time ridesharing is promoted as a way to better utilize the empty seats in most passenger cars, thus lowering fuel usage and transport costs. It can serve areas not covered by a public transit system and act as a transit feeder service. Ridesharing is also capable of serving one-time trips, not only recurrent commute trips or scheduled trips.[3] In the early 2010s, several transportation network companies were introduced that were advertised as ridesharing, but in fact dispatched commercial operators similar to a taxi service. Transportation experts have called these services "ridesourcing" to clarify that drivers do not share a destination with their passengers; the app simply outsources rides to commercial drivers.[4] Examples of these "ridesourcing" companies are Uber, Lyft and Haxi. "Ridesharing" has been controversial, variously criticized as lacking adequate regulation, insurance, licensure, and training. One of the main ridesharing firms, Uber, was banned in Berlin and a number of other European cities.[5] Opposition may also come from taxi companies and public transit operators,[3] because they are seen as alternatives.[6]
What is Ridesourcing?
Shared Mobility – A Sustainability & Technologies Workshop Definitions, Industry Developments and Early Understanding Authors: Susan Shaheen, Nelson Chan, Apaar Bansal, Adam Cohen November 2015 http://innovativemobility.org/wp-content/uploads/2015/11/SharedMobility_WhitePaper_FINAL.pdf Ridesourcing/ Transportation Network Company (TNC) Services Ridesourcing or TNC services use smartphone apps to connect community drivers with passengers. There are various terms used for this emerging transportation option including: ridesourcing, TNCs, ride-‐hailing, and ride--‐booking. Examples of for--‐hire vehicle services include taxis, Lyft, Sidecar, UberX, as well as specialized services such as Lift Hero and Shuddle (described below). As of August 2015, Lyft was operating in 60 U.S. cities with over
22
100,000 drivers, and Uber was operating in 59 countries in over 310 cities with approximately 162,000 drivers. Sidecar operates in approximately 10 U.S. cities. In the San Francisco Bay Area, UberX charges $3.20 as a base fare (including a “Safe Rides fee”), $0.26 per minute, and $1.30 per mile during non--‐surge times. Also in the Bay Area, Lyft charges a base fare of $3.80 (includes a “Trust and Safety fee”), $0.27perminute, and $1.35permile. In San Francisco, Sidecar charges a base fare of $3.00, $0.23 per minute, and $1.13 per mile. The prices mentioned are during non--‐peak or surge times—prices usually go up during periods of high demand to incentivize more drivers to take ride requests. Lift Hero is a specialized for-hire service that targets the disabled population on older adults. The drivers are specially trained in care for such users. It costs $25 per hour and $1 per mile.
What is Connected/ Automated Vehicles?
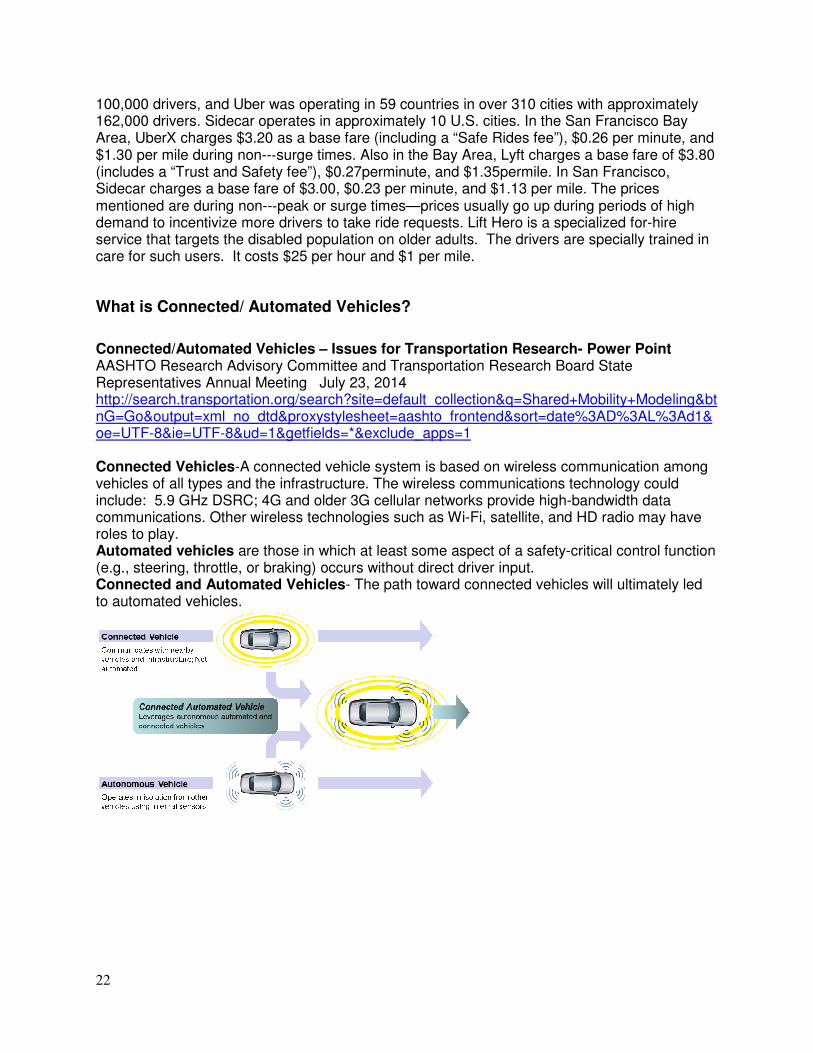
Connected/Automated Vehicles – Issues for Transportation Research- Power Point AASHTO Research Advisory Committee and Transportation Research Board State Representatives Annual Meeting July 23, 2014 http://search.transportation.org/search?site=default_collection&q=Shared+Mobility+Modeling&btnG=Go&output=xml_no_dtd&proxystylesheet=aashto_frontend&sort=date%3AD%3AL%3Ad1&oe=UTF-8&ie=UTF-8&ud=1&getfields=*&exclude_apps=1 Connected Vehicles-A connected vehicle system is based on wireless communication among vehicles of all types and the infrastructure. The wireless communications technology could include: 5.9 GHz DSRC; 4G and older 3G cellular networks provide high-bandwidth data communications. Other wireless technologies such as Wi-Fi, satellite, and HD radio may have roles to play. Automated vehicles are those in which at least some aspect of a safety-critical control function (e.g., steering, throttle, or braking) occurs without direct driver input. Connected and Automated Vehicles- The path toward connected vehicles will ultimately led to automated vehicles.
23
Summary White Paper: AASHTO Conference on 21st Century Mobility for Freight and Passenger Transportation December 2015 - Conference held in Salt Lake City, Utah July 2015 http://scoe.transportation.org/Documents/21st%20Century%20Mobility%20Summary%20White%20Paper%20FINAL%2010-15-15.pdf Looking to the future, the Transportation Research Board plans to be more integrated, more comprehensive, and better able to meet the needs of state departments of transportation, TRB Executive Director Neil Pedersen told conference participants on July 8. Pedersen spoke about the need for continued investment in transportation research and development and he urged DOT leaders and staff in the environment, planning, public transportation, and highway transport disciplines to take advantage of what TRB has to offer. Connected and Automated Vehicles The issue of connected and automated vehicles has become a “hot topic” at TRB, prompting a number of sessions at the annual meeting and plans for additional conferences. The topic touches on multiple disciplines within AASHTO, Pedersen said. For instance, there is the consideration of the impacts of automated and connected vehicles during the planning process, including land use impacts and travel demand. Undoubtedly, there will be impacts on transit as well. Concerning freight, there are significant connected vehicle developments such as the mobilization of “truck trains” using Peloton Technology’s vehicle-to-vehicle communications. (See the Opening Plenary and Autonomous and Connected Vehicle Town Hall for additional information.) NCHRP 20-24, Task 98 created a research roadmap with regard to connected vehicles, and $2 million has been set aside within the NCHRP for research on the topic, of which only $770,000 has been allocated to date. Pedersen requested that attendees provide quality research ideas on which this funding can be used. A symposium on automated vehicles was held in July, and NCHRP 20-102 will be using the outcomes to designate more funding on the topic.
What is Sketch Planning Tools?
Montana Transportation and Land Use http://www.mdt.mt.gov/research/toolkit/m1/tatools/tat/sp.shtml What is sketch planning? Sketch planning tools are used to produce general order-of-magnitude estimates of transportation and land use demand and impacts. These tools are generally easier to implement and less costly than sophisticated software packages used to conduct in-depth engineering analysis. Often, they are spreadsheet-based or GIS-based techniques that apply the similar concepts to aggregated or generalized data. Because of their flexibility, these tools are often developed by agency staff or consultants for a specific project. Sketch planning is often used as an alternative to developing complex travel demand models for forecasting future travel demand. These may be spreadsheet-based or GIS-based. In either case, the spreadsheet, or GIS program, is used to simulate and forecast future traffic flows. A spreadsheet-based post-processor can work in conjunction with a travel demand model to estimate traffic on local roadways, forecast traffic patterns and diversion for smaller-scale development proposals, and identify travel markets that may be ripe for transit and non-motorized travel.
24
Who implements sketch planning? Rural and growing areas are most likely to apply sketch-planning software tools or methodologies as opposed to complex travel demand models. Development and implementation of a spreadsheet - or GIS-based travel demand models is far less costly and time-consuming than development of a traditional four-step travel demand model. The required software is more widely available and level of expertise and input data needed to develop and maintain such a model is substantially lower. Simplified development and application of these tools for impact analysis are possible by using transferable parameters from national guides such as the ITE Trip Generation Manual and NCHRP Report 365. This manual is a must have for transportation professionals conducting site impact studies, determining on-site circulation patterns, performing access management studies, determining traffic signal timing, and conducting environmental assessments.
Travel Demand Models- Sketch Tool
Improved Data and Tools for Integrated Land Use-Transportation Planning in California Nathaniel Roth, Urban Land Use and Transportation Center (ULTRANS), University of California, Davis August 28, 2012 http://ultrans.its.ucdavis.edu/projects/improved-data-and-tools-integrated-land-use-transportation-planning-california Overview: Effective land use-transportation planning requires the ability to estimate potential benefits and impacts of various choices, including those regarding “smart growth” and “sustainable communities” strategies (such as urban infill, mixed-use, transit-oriented development, complete streets, etc.). Up-to-date California-specific data on built environment-travel relationships allows decision-makers to consider the potential effects of transportation infrastructure and land use investment choices in a consistent and supportable way. The primary goal of this project was to obtain and analyze available data on quantitative relationships between the built environments and travel in various parts of California, and to incorporate the results into software tools available for use in local and regional integrated land use-transportation scenario planning processes. The following statement is appended to the beginning of all of the modules prepared as a result of the “Improved Data and Tools for Integrated Land Use-Transportation Planning in California”. It describes the intended use and discourages uses outside of its intended scope. This is a land use-transportation scenario comparison tool. It conducts a "sketch" level analysis of land use and transportation relationships using "7 Ds": density (or intensity), diversity (mixture of uses), distance to transit, design (# of street intersections), destination (location within a metropolitan area), demographics, and development scale. It assesses how a proposed scenario differs from an established or "base case" scenario, comparing them on built environment metrics such as the number and types of jobs and households, densities, and the mix of land uses. The tool also compares scenarios regarding travel behavior, and - depending on the scale of the project - can provide estimates of vehicle miles traveled (VMT). This tool can be used at a jurisdictional or regional level for comparing different scenarios and evaluating consistency with large-scale plans (e.g., Sustainable Communities Strategies, General Plans, or large specific plans). It can also be used to compare alternatives for large-scale land use-transportation plans and projects.
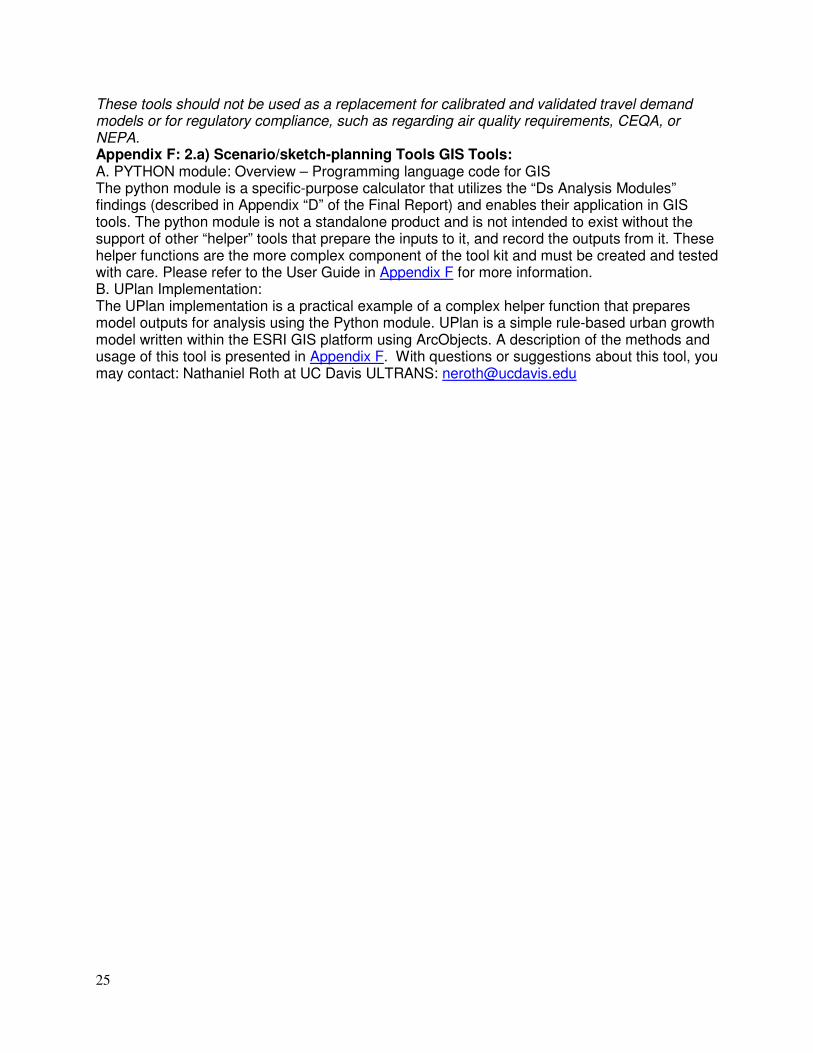
25
These tools should not be used as a replacement for calibrated and validated travel demand models or for regulatory compliance, such as regarding air quality requirements, CEQA, or NEPA. Appendix F: 2.a) Scenario/sketch-planning Tools GIS Tools: A. PYTHON module: Overview – Programming language code for GIS The python module is a specific-purpose calculator that utilizes the “Ds Analysis Modules” findings (described in Appendix “D” of the Final Report) and enables their application in GIS tools. The python module is not a standalone product and is not intended to exist without the support of other “helper” tools that prepare the inputs to it, and record the outputs from it. These helper functions are the more complex component of the tool kit and must be created and tested with care. Please refer to the User Guide in Appendix F for more information. B. UPlan Implementation: The UPlan implementation is a practical example of a complex helper function that prepares model outputs for analysis using the Python module. UPlan is a simple rule-based urban growth model written within the ESRI GIS platform using ArcObjects. A description of the methods and usage of this tool is presented in Appendix F. With questions or suggestions about this tool, you may contact: Nathaniel Roth at UC Davis ULTRANS: [email protected]
26
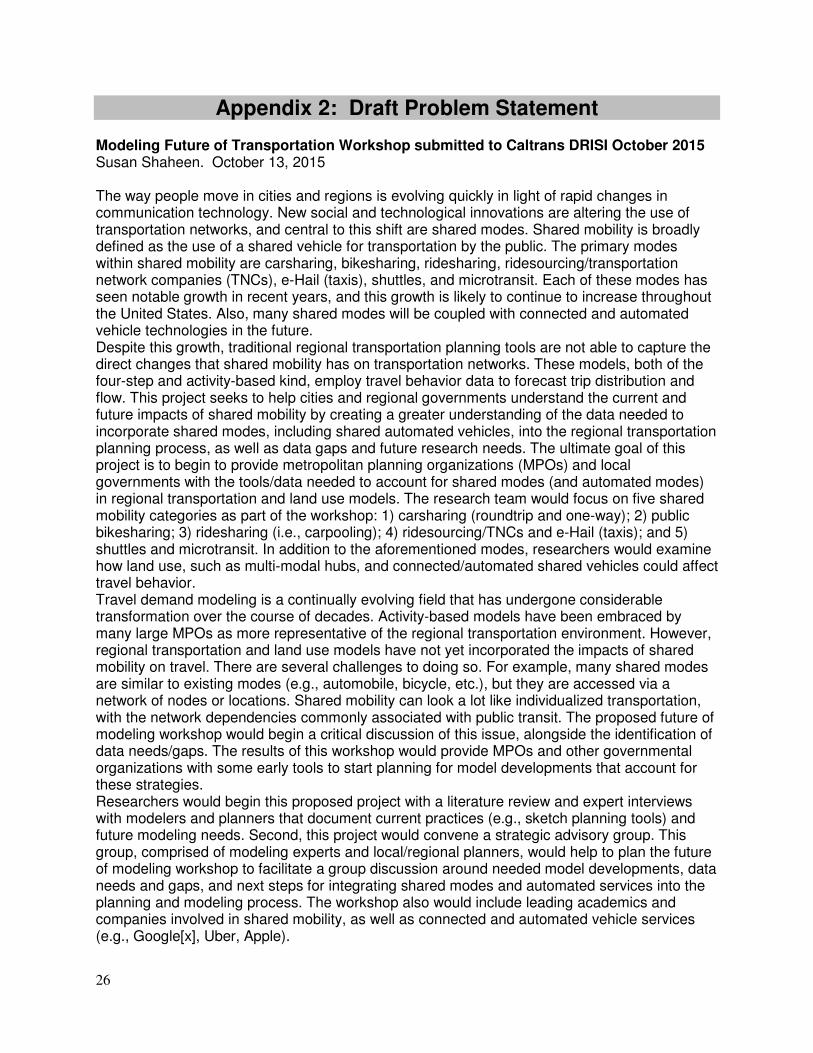
Appendix 2: Draft Problem Statement Modeling Future of Transportation Workshop submitted to Caltrans DRISI October 2015 Susan Shaheen. October 13, 2015 The way people move in cities and regions is evolving quickly in light of rapid changes in communication technology. New social and technological innovations are altering the use of transportation networks, and central to this shift are shared modes. Shared mobility is broadly defined as the use of a shared vehicle for transportation by the public. The primary modes within shared mobility are carsharing, bikesharing, ridesharing, ridesourcing/transportation network companies (TNCs), e-Hail (taxis), shuttles, and microtransit. Each of these modes has seen notable growth in recent years, and this growth is likely to continue to increase throughout the United States. Also, many shared modes will be coupled with connected and automated vehicle technologies in the future. Despite this growth, traditional regional transportation planning tools are not able to capture the direct changes that shared mobility has on transportation networks. These models, both of the four-step and activity-based kind, employ travel behavior data to forecast trip distribution and flow. This project seeks to help cities and regional governments understand the current and future impacts of shared mobility by creating a greater understanding of the data needed to incorporate shared modes, including shared automated vehicles, into the regional transportation planning process, as well as data gaps and future research needs. The ultimate goal of this project is to begin to provide metropolitan planning organizations (MPOs) and local governments with the tools/data needed to account for shared modes (and automated modes) in regional transportation and land use models. The research team would focus on five shared mobility categories as part of the workshop: 1) carsharing (roundtrip and one-way); 2) public bikesharing; 3) ridesharing (i.e., carpooling); 4) ridesourcing/TNCs and e-Hail (taxis); and 5) shuttles and microtransit. In addition to the aforementioned modes, researchers would examine how land use, such as multi-modal hubs, and connected/automated shared vehicles could affect travel behavior. Travel demand modeling is a continually evolving field that has undergone considerable transformation over the course of decades. Activity-based models have been embraced by many large MPOs as more representative of the regional transportation environment. However, regional transportation and land use models have not yet incorporated the impacts of shared mobility on travel. There are several challenges to doing so. For example, many shared modes are similar to existing modes (e.g., automobile, bicycle, etc.), but they are accessed via a network of nodes or locations. Shared mobility can look a lot like individualized transportation, with the network dependencies commonly associated with public transit. The proposed future of modeling workshop would begin a critical discussion of this issue, alongside the identification of data needs/gaps. The results of this workshop would provide MPOs and other governmental organizations with some early tools to start planning for model developments that account for these strategies. Researchers would begin this proposed project with a literature review and expert interviews with modelers and planners that document current practices (e.g., sketch planning tools) and future modeling needs. Second, this project would convene a strategic advisory group. This group, comprised of modeling experts and local/regional planners, would help to plan the future of modeling workshop to facilitate a group discussion around needed model developments, data needs and gaps, and next steps for integrating shared modes and automated services into the planning and modeling process. The workshop also would include leading academics and companies involved in shared mobility, as well as connected and automated vehicle services (e.g., Google[x], Uber, Apple).

27
Key outcomes/deliverables from this project would include: 1) a guide to integrating shared modes into the regional modeling process (e.g., a step-by-step process that regional/local governmental bodies could reference in updating their models and defining data needs); 2) a one-day workshop and synopsis; and 3) a webinar that disseminates the results of this effort with modelers/planners across the State and nation, along with presentations through conferences and local government networks throughout the State. Timeline: 12 months
28
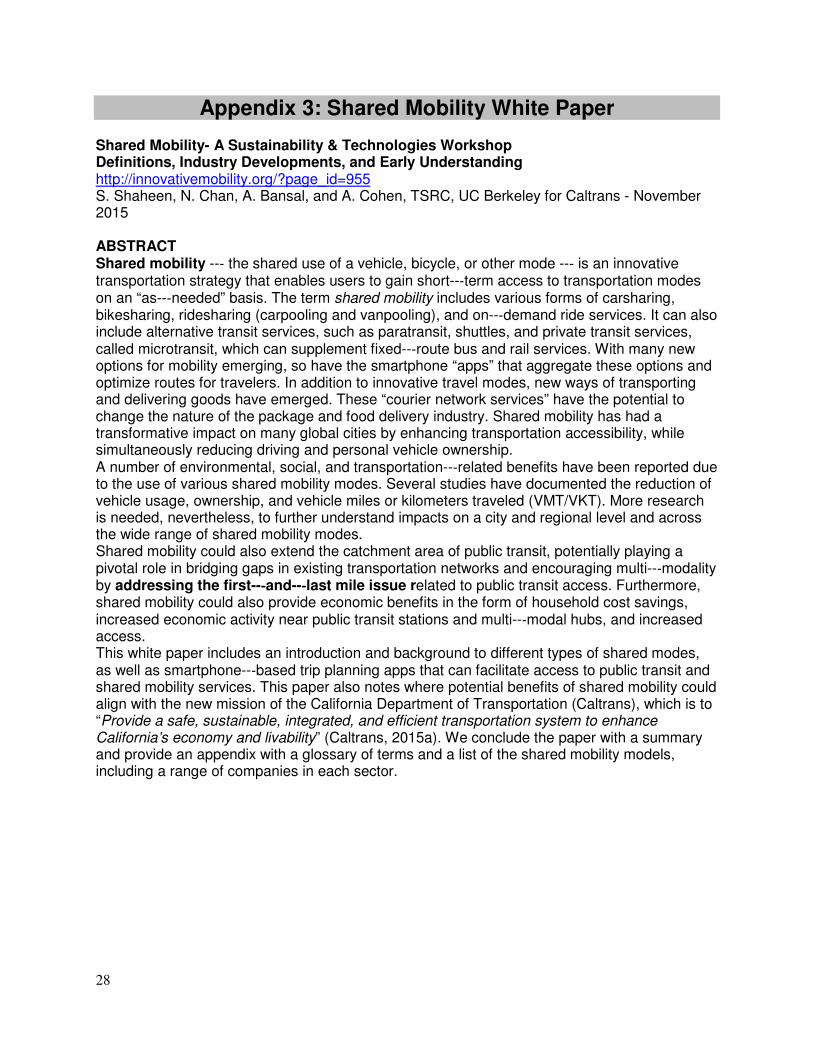
Appendix 3: Shared Mobility White Paper Shared Mobility- A Sustainability & Technologies Workshop Definitions, Industry Developments, and Early Understanding http://innovativemobility.org/?page_id=955 S. Shaheen, N. Chan, A. Bansal, and A. Cohen, TSRC, UC Berkeley for Caltrans - November 2015 ABSTRACT Shared mobility --‐ the shared use of a vehicle, bicycle, or other mode --‐ is an innovative transportation strategy that enables users to gain short--‐term access to transportation modes on an “as--‐needed” basis. The term shared mobility includes various forms of carsharing, bikesharing, ridesharing (carpooling and vanpooling), and on--‐demand ride services. It can also include alternative transit services, such as paratransit, shuttles, and private transit services, called microtransit, which can supplement fixed--‐route bus and rail services. With many new options for mobility emerging, so have the smartphone “apps” that aggregate these options and optimize routes for travelers. In addition to innovative travel modes, new ways of transporting and delivering goods have emerged. These “courier network services” have the potential to change the nature of the package and food delivery industry. Shared mobility has had a transformative impact on many global cities by enhancing transportation accessibility, while simultaneously reducing driving and personal vehicle ownership. A number of environmental, social, and transportation--‐related benefits have been reported due to the use of various shared mobility modes. Several studies have documented the reduction of vehicle usage, ownership, and vehicle miles or kilometers traveled (VMT/VKT). More research is needed, nevertheless, to further understand impacts on a city and regional level and across the wide range of shared mobility modes. Shared mobility could also extend the catchment area of public transit, potentially playing a pivotal role in bridging gaps in existing transportation networks and encouraging multi--‐modality by addressing the first--‐‐‐‐and--‐‐‐‐last mile issue related to public transit access. Furthermore, shared mobility could also provide economic benefits in the form of household cost savings, increased economic activity near public transit stations and multi--‐modal hubs, and increased access. This white paper includes an introduction and background to different types of shared modes, as well as smartphone--‐based trip planning apps that can facilitate access to public transit and shared mobility services. This paper also notes where potential benefits of shared mobility could align with the new mission of the California Department of Transportation (Caltrans), which is to “Provide a safe, sustainable, integrated, and efficient transportation system to enhance California’s economy and livability” (Caltrans, 2015a). We conclude the paper with a summary and provide an appendix with a glossary of terms and a list of the shared mobility models, including a range of companies in each sector.
Preliminary Investigation
Caltrans Division of Research, Innovation and System Information
For Caltrans Internal Use ONLY
INTRODUCTION Traditionally in the United States, transportation options have emphasized personal vehicles and to a lesser extent other modes, such as public transit, bicycles, and taxis. Recent innovations in the sharing economy (a developing phenomenon around renting and borrowing goods and services rather than owning them) and information technology have expanded transportation and ownership models, spawning new businesses and changing how individuals plan and execute trips. Travelers can now hail a private driver and vehicle (e.g., Lyft and Uber); rent a car or bicycle for a short trip (e.g., Zipcar and Bay Area Bike Share); ride a shuttle on--‐demand (e.g., Bridj, Chariot, Via); and have groceries or takeout food delivered in someone’s personal vehicle (e.g., Postmates and Sidecar Deliveries)—all using the Internet and smartphones. These innovative transportation services are expanding at a time when agencies, such as state Departments of Transportation (DOTs) and regional Metropolitan Planning Organizations (MPOs), are increasingly focused on improving system efficiency and mitigating the negative environmental impacts of transportation. The California Department of Transportation (Caltrans) is already responding to new mandates for efficient use of existing transportation infrastructure and reduction of negative environmental impacts. For example, Caltrans’ Strategic Management Plan (SMP) 2015--‐2020 states that its new mission statement is to “Provide a safe, sustainable, integrated, and efficient transportation system to enhance California’s economy and livability” (Caltrans, 2015a). In particular, the SMP Goal 3, titled “Sustainability, Livability and Economy,” identifies measurable targets to help Caltrans achieve its mission. By 2020, Caltrans hopes to triple California’s bicycle mode share, double both pedestrian and public transit mode shares, and lower both vehicle miles traveled (VMT) and greenhouse gas (GHG) emissions by 15 percent each. Meeting these targets may require not only enhancing traditional transportation systems that govern public transit and private vehicle use but also planning for and recognizing the role of shared mobility as an innovative strategy in transportation planning and operations. As part of SMP Goal 3, Caltrans must develop an accessibility and livability score as performance metrics by December 2016. The accessibility score will be determined by considering access to multi--‐modal options in relation to housing, jobs, etc. The livability score considers quality of life, environmental justice, and localized emissions. Percentage increases in the use of bicycling, walking, and public transit are also key performance metrics for the Department. Other related performance measures include reductions in VMT and GHGs. Furthermore, the role of sustainable transportation in corridor system master plans for all State routes is another performance measure, which must be completed by 2017. By 2020, the top 25 corridor system management plans must be finalized. It is worth exploring what role shared mobility could play in meeting the targets set in the SMP Goal 3 and whether shared mobility could be more directly tied to many of the State’s energy and environmental policies including: AB 32 (California’s Global Warming Solutions Act) and SB 375 (Sustainable Communities and Climate Protection Act). Definition Shared mobility is the shared use of a vehicle, bicycle, or other low--‐speed mode that enables users to have short--‐term access to transportation modes on an “as--‐needed” basis. Shared mobility includes carsharing; personal vehicle sharing (including peer--‐to--‐peer/P2P carsharing and fractional ownership); bikesharing; scooter sharing; shuttle services; carpooling and vanpooling; ridesourcing/transportation network companies (TNCs)—also known as ride--‐hailing; microtransit; and courier network services (CNS). Many studies have documented the
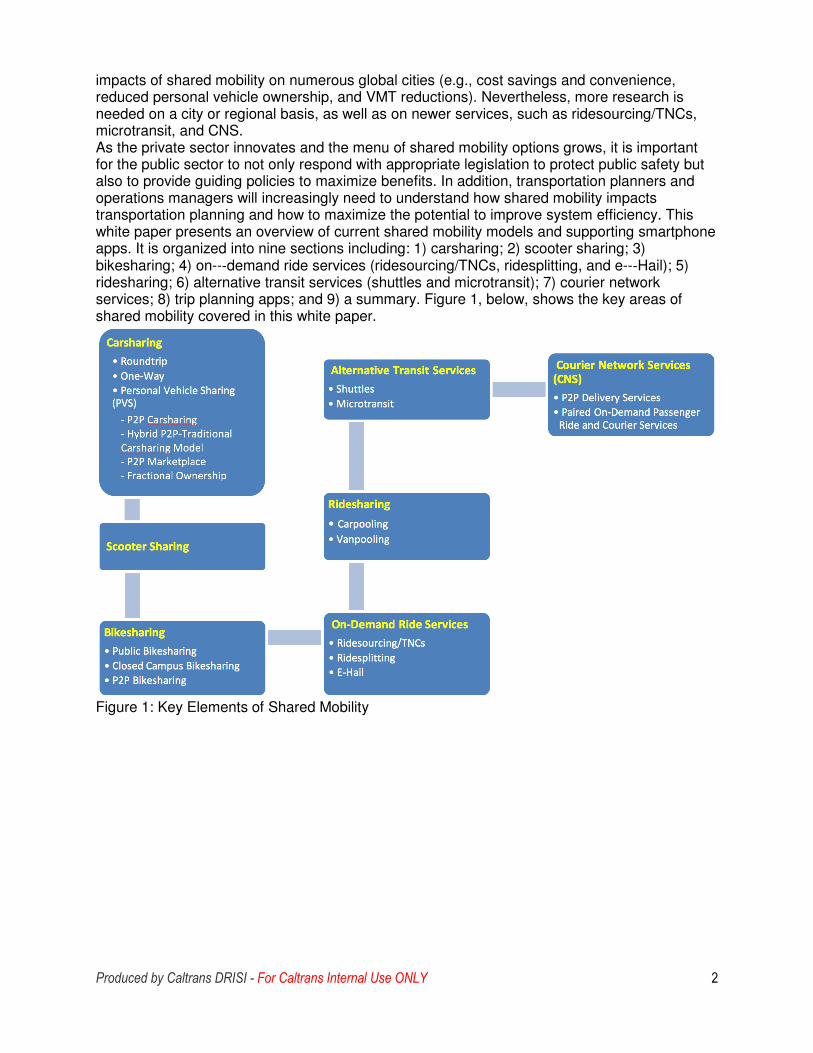
Produced by Caltrans DRISI - For Caltrans Internal Use ONLY 2
impacts of shared mobility on numerous global cities (e.g., cost savings and convenience, reduced personal vehicle ownership, and VMT reductions). Nevertheless, more research is needed on a city or regional basis, as well as on newer services, such as ridesourcing/TNCs, microtransit, and CNS. As the private sector innovates and the menu of shared mobility options grows, it is important for the public sector to not only respond with appropriate legislation to protect public safety but also to provide guiding policies to maximize benefits. In addition, transportation planners and operations managers will increasingly need to understand how shared mobility impacts transportation planning and how to maximize the potential to improve system efficiency. This white paper presents an overview of current shared mobility models and supporting smartphone apps. It is organized into nine sections including: 1) carsharing; 2) scooter sharing; 3) bikesharing; 4) on--‐demand ride services (ridesourcing/TNCs, ridesplitting, and e--‐Hail); 5) ridesharing; 6) alternative transit services (shuttles and microtransit); 7) courier network services; 8) trip planning apps; and 9) a summary. Figure 1, below, shows the key areas of shared mobility covered in this white paper.
Figure 1: Key Elements of Shared Mobility
Related Documents


![EV Shared Mobility Literature Review and State of Playevsharedmobility.org/wp-content/uploads/2018/09/EV-Shared...of-Pla… · 2030 [6]. Additionally, the state of Washington has](https://static.cupdf.com/doc/110x72/5f2d8f04bbb6515e026ca741/ev-shared-mobility-literature-review-and-state-of-2030-6-additionally-the-state.jpg)