NEONATAL & PEDIATRIC ECG BASICS & RHYTHM INTERPRETATION VIKAS KOHLI MD FAAP FACC SENIOR CONSULATANT PEDIATRIC CARDIOLOGY APOLLO HOSPITAL MOB: 9891362233 ECG FAX LINE: 011-26941746

Welcome message from author
This document is posted to help you gain knowledge. Please leave a comment to let me know what you think about it! Share it to your friends and learn new things together.
Transcript
NEONATAL & PEDIATRIC ECG
BASICS
&
RHYTHM INTERPRETATION
VIKAS KOHLI MD FAAP FACC
SENIOR CONSULATANT
PEDIATRIC CARDIOLOGY
APOLLO HOSPITAL
MOB: 9891362233
ECG FAX LINE: 011-26941746
THE BASICS: GRAPH PAPER TIMINGS ETC
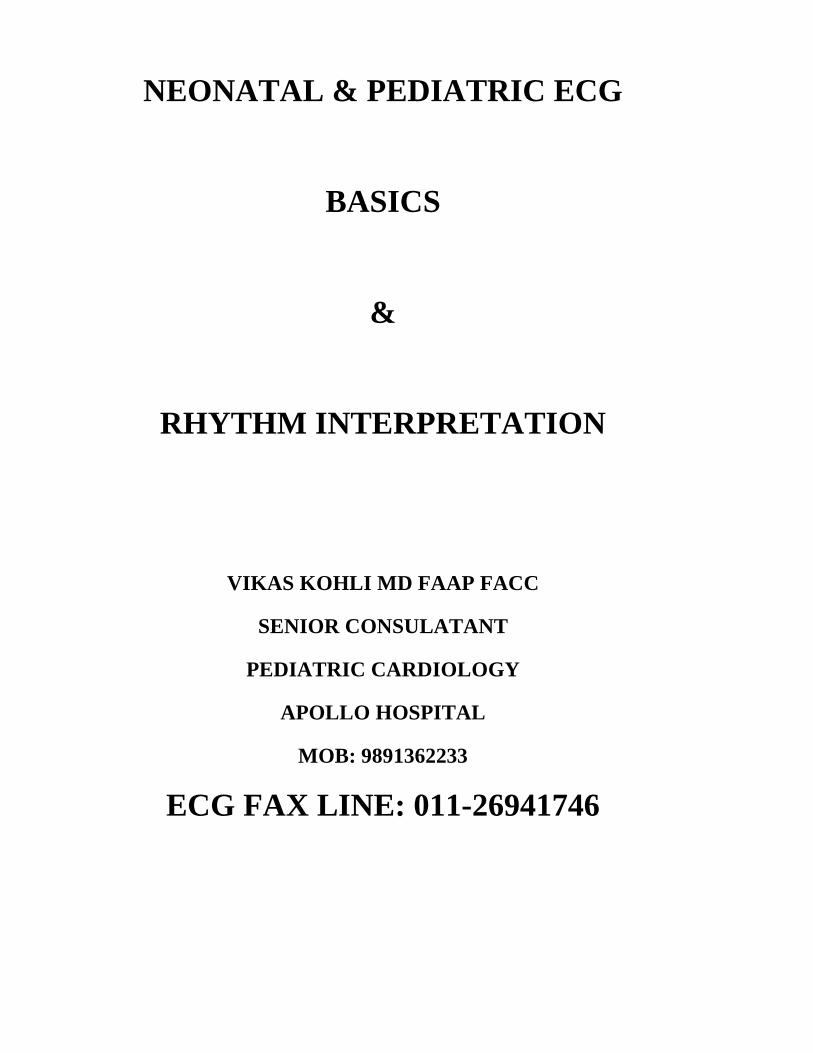
The graph paper that the ECG records on is standardized to run at 25mm/second, and is marked at 1 second intervals on the top and bottom.
The horizontal axis correlates the length of each electrical event with its duration in time. Each small block (defined by lighter lines) on the horizontal axis represents 0.04 seconds. Five small blocks (shown by heavy lines) is a large block, and represents 0.20 seconds.
The vertical axis on the monitor strip measures the amplitude (electrical voltage) in millimeters (mm). Each small block, as illustrated, is 1mm high. Each large block represents 5mm.
WHAT EACH WAVE REPRESENTS
P WAVE: Atrial depolarization
Q wave : Septal depolarization
RS Wave: Ventricular depolarization
T wave: Ventricular repolarization
RATE DETERMINATION
Method III - Sequence Method
Gives an approximate heart rate through simple waveform observation.
Procedure
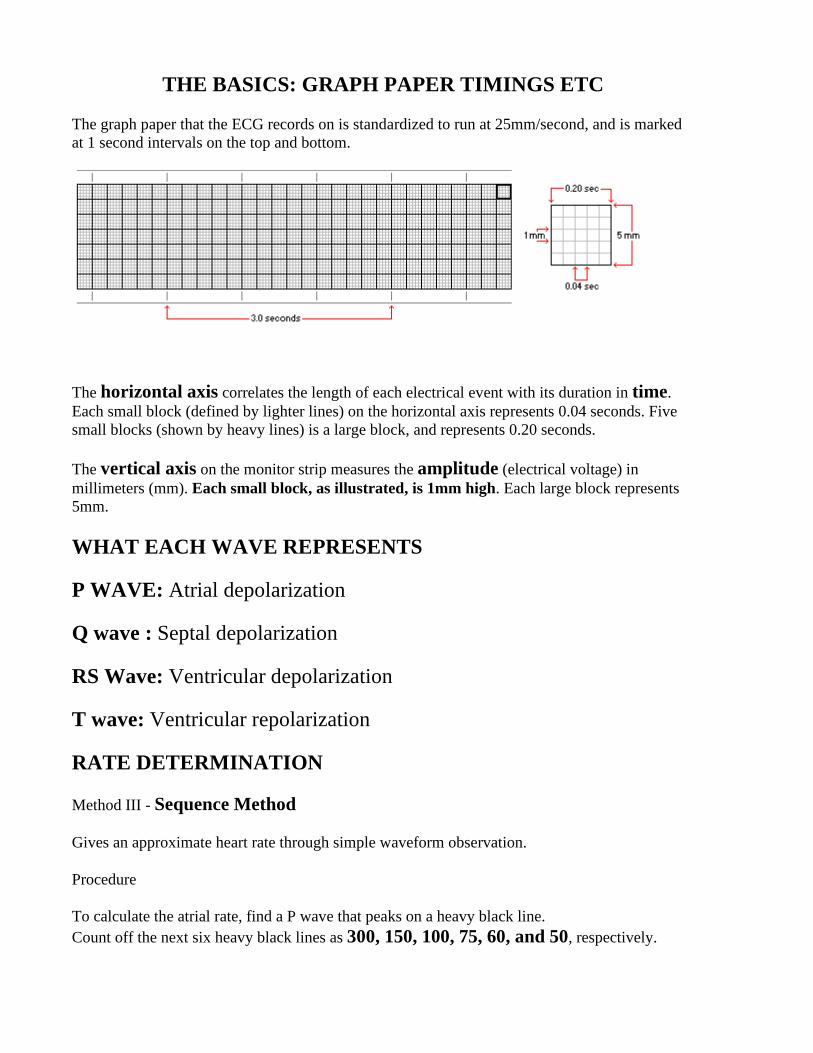
To calculate the atrial rate, find a P wave that peaks on a heavy black line. Count off the next six heavy black lines as 300, 150, 100, 75, 60, and 50, respectively.
Find the heavy black line on which the next P wave peaks. The number assigned to this line is the estimated atrial rate. Calculate the ventricular rate by repeating the above calculation, using the R wave instead of the P wave.
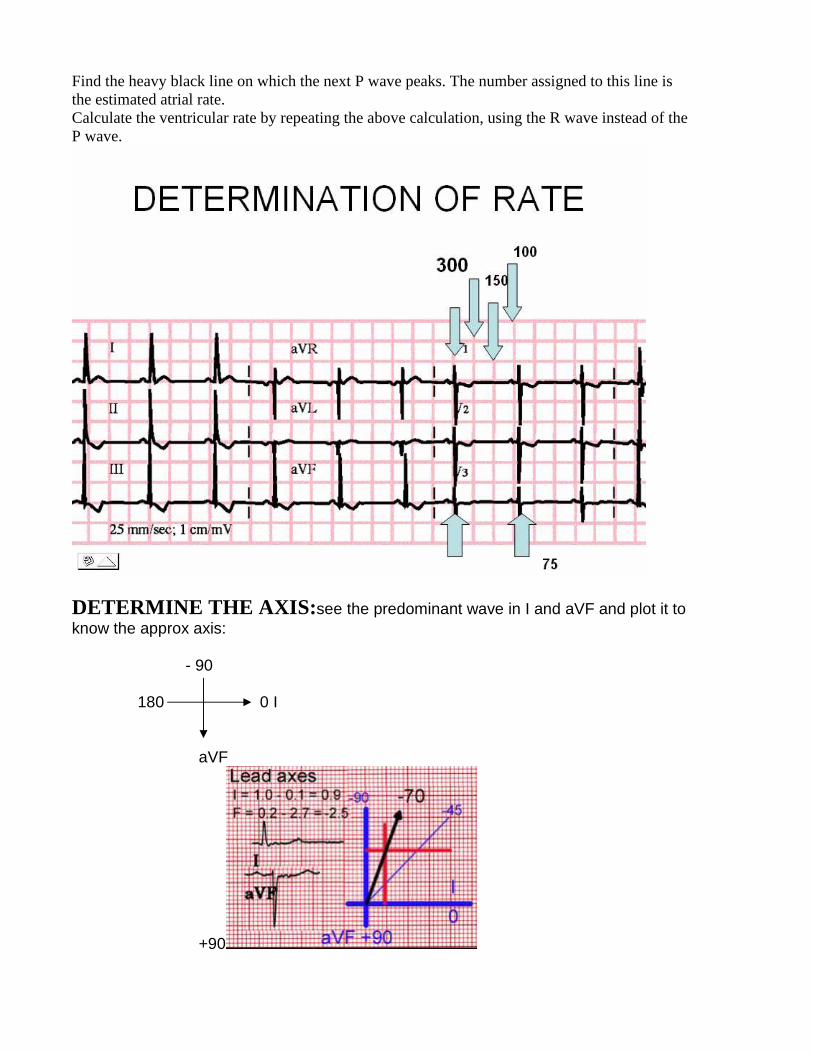
DETERMINE THE AXIS: see the predominant wave in I and aVF and plot it to know the approx axis:
- 90 180 0 I
aVF
+90
LEFT AXIS
DEVIATION
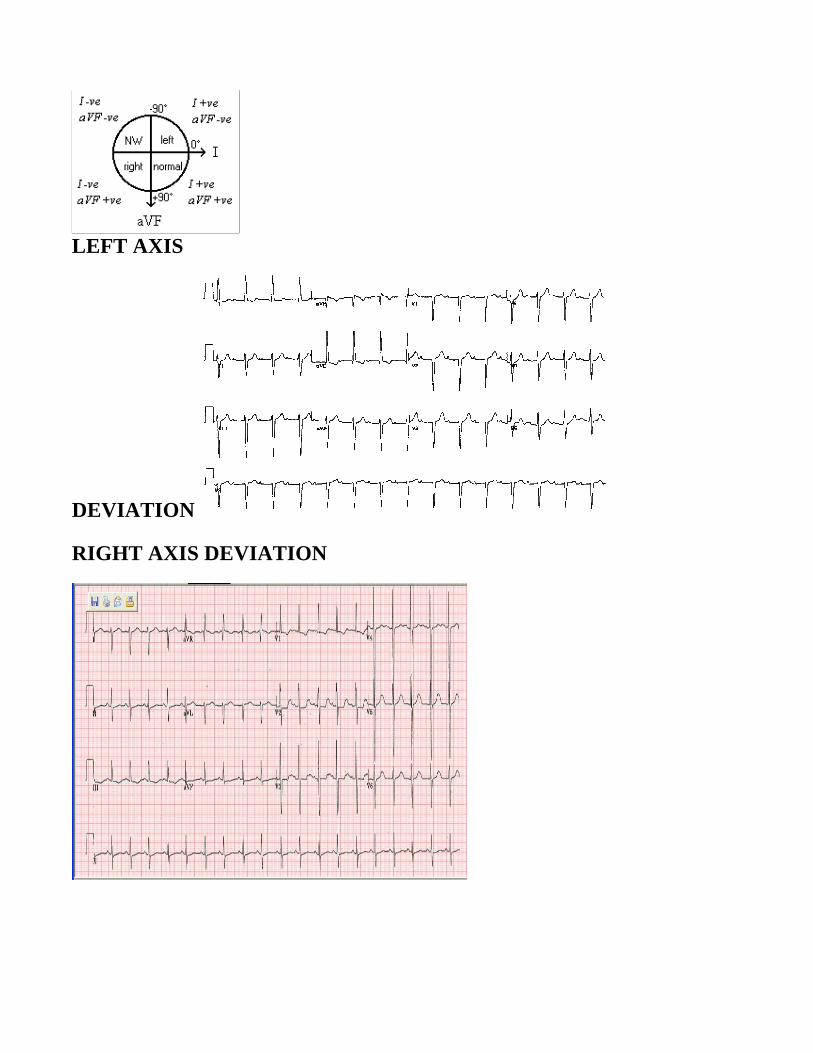
RIGHT AXIS DEVIATION
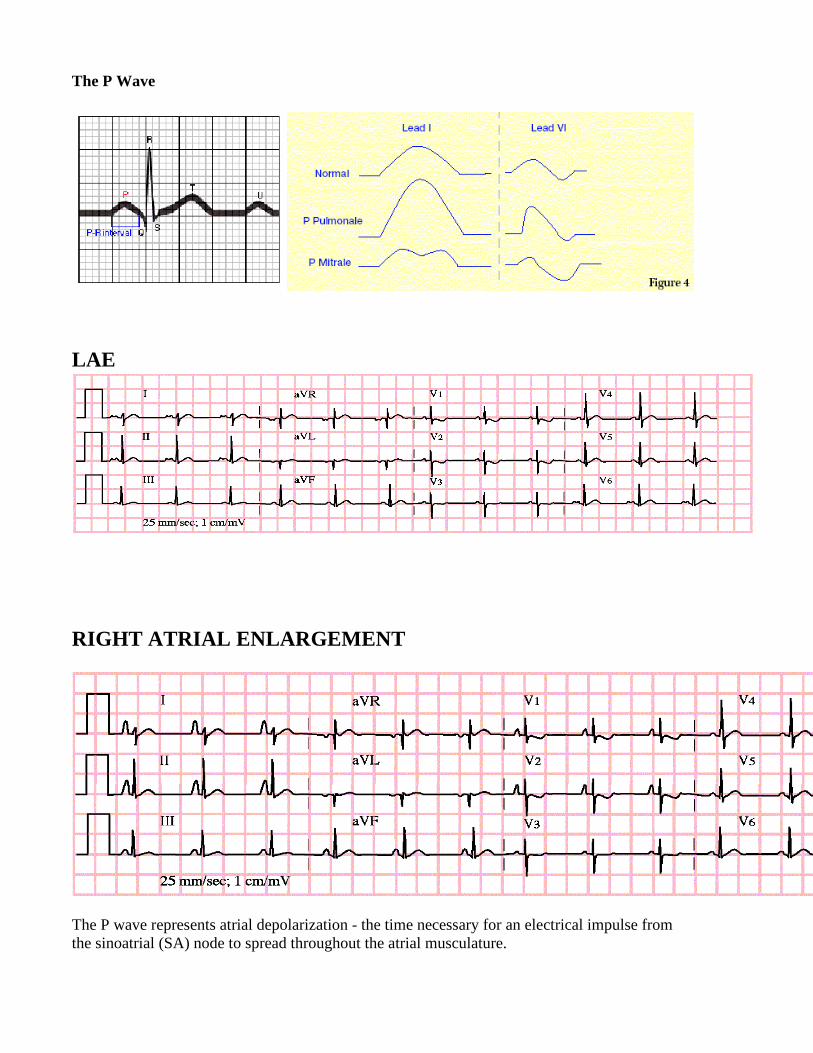
The P Wave
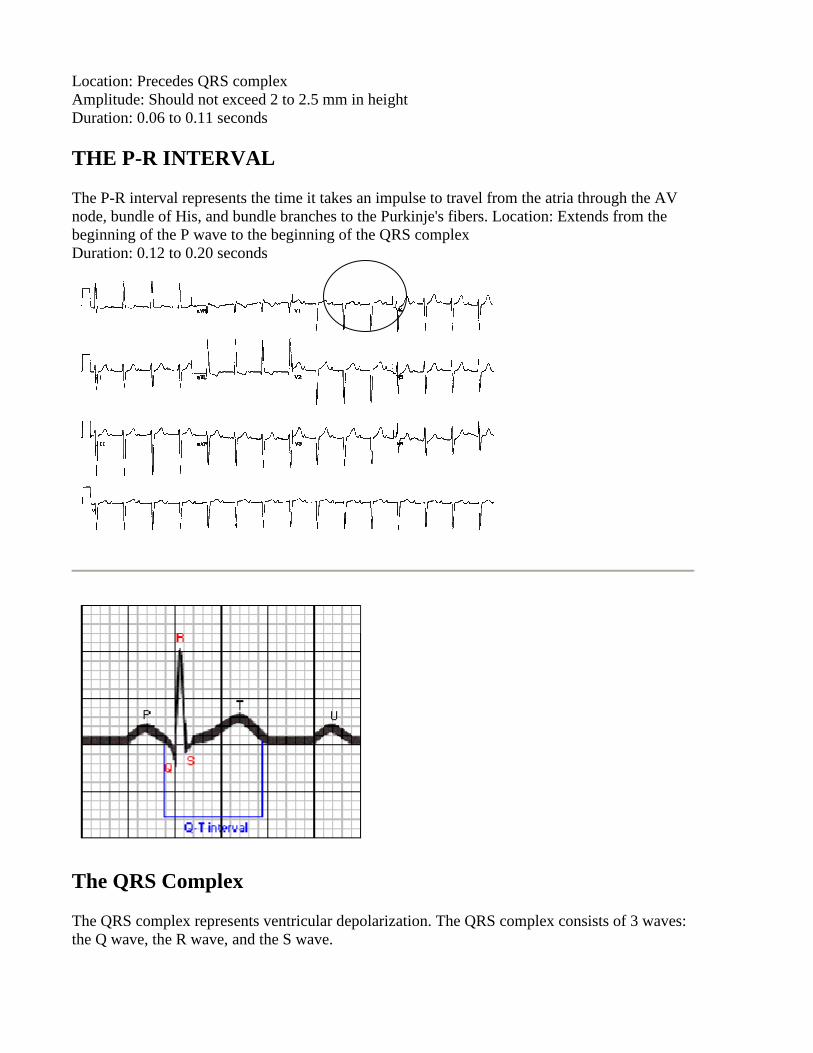
LAE
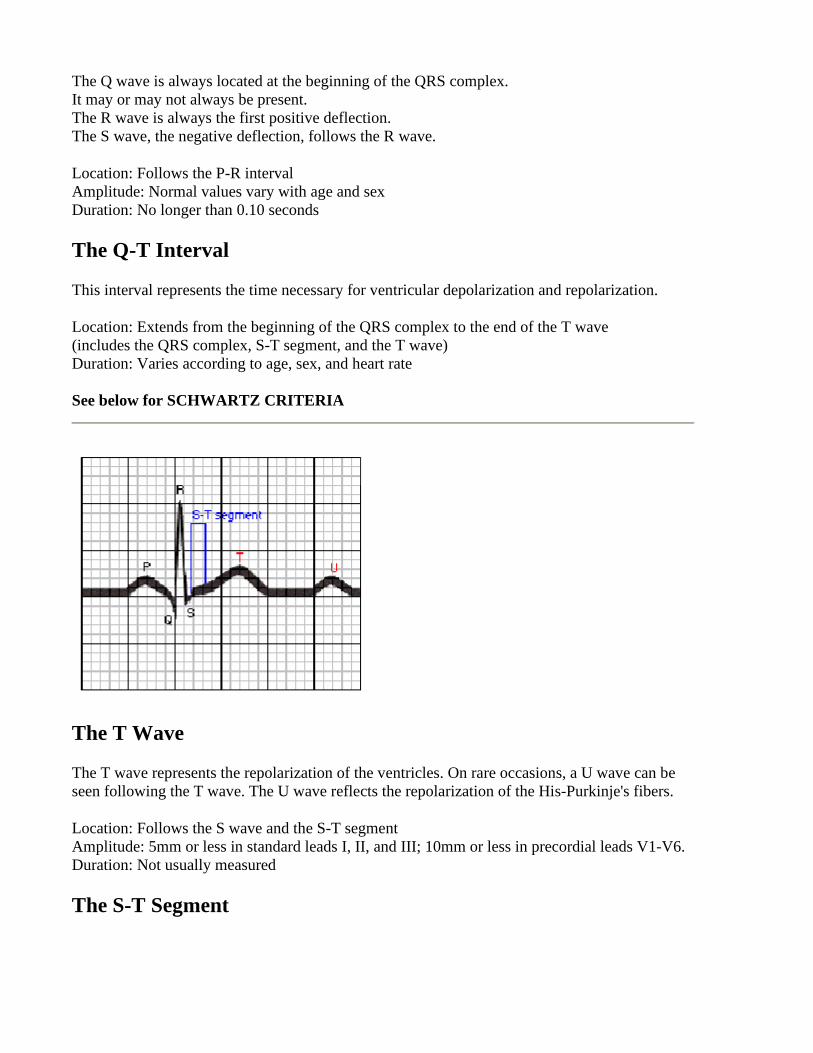
RIGHT ATRIAL ENLARGEMENT
The P wave represents atrial depolarization - the time necessary for an electrical impulse from the sinoatrial (SA) node to spread throughout the atrial musculature.
Location: Precedes QRS complex Amplitude: Should not exceed 2 to 2.5 mm in height Duration: 0.06 to 0.11 seconds
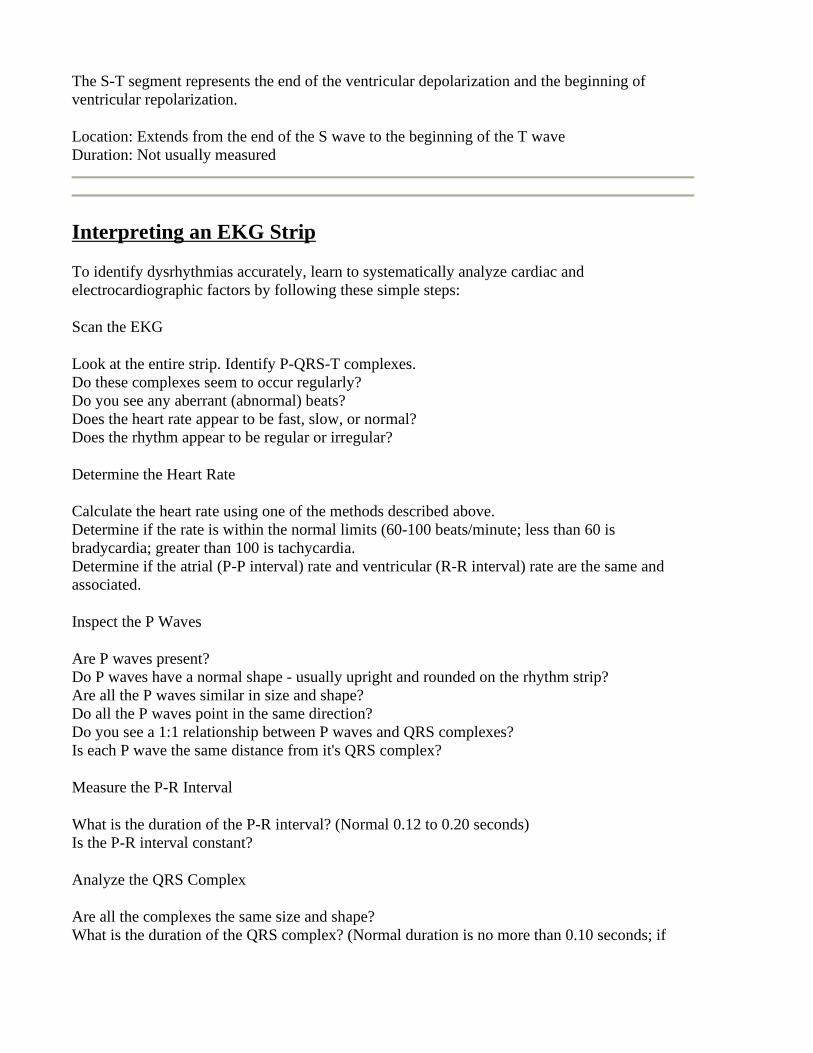
THE P-R INTERVAL
The P-R interval represents the time it takes an impulse to travel from the atria through the AV node, bundle of His, and bundle branches to the Purkinje's fibers. Location: Extends from the beginning of the P wave to the beginning of the QRS complex Duration: 0.12 to 0.20 seconds
The QRS Complex
The QRS complex represents ventricular depolarization. The QRS complex consists of 3 waves: the Q wave, the R wave, and the S wave.
The Q wave is always located at the beginning of the QRS complex. It may or may not always be present. The R wave is always the first positive deflection. The S wave, the negative deflection, follows the R wave.
Location: Follows the P-R interval Amplitude: Normal values vary with age and sex Duration: No longer than 0.10 seconds
The Q-T Interval
This interval represents the time necessary for ventricular depolarization and repolarization.
Location: Extends from the beginning of the QRS complex to the end of the T wave (includes the QRS complex, S-T segment, and the T wave) Duration: Varies according to age, sex, and heart rate See below for SCHWARTZ CRITERIA
The T Wave
The T wave represents the repolarization of the ventricles. On rare occasions, a U wave can be seen following the T wave. The U wave reflects the repolarization of the His-Purkinje's fibers.
Location: Follows the S wave and the S-T segment Amplitude: 5mm or less in standard leads I, II, and III; 10mm or less in precordial leads V1-V6. Duration: Not usually measured
The S-T Segment
The S-T segment represents the end of the ventricular depolarization and the beginning of ventricular repolarization.
Location: Extends from the end of the S wave to the beginning of the T wave Duration: Not usually measured
Interpreting an EKG Strip
To identify dysrhythmias accurately, learn to systematically analyze cardiac and electrocardiographic factors by following these simple steps:
Scan the EKG
Look at the entire strip. Identify P-QRS-T complexes. Do these complexes seem to occur regularly? Do you see any aberrant (abnormal) beats? Does the heart rate appear to be fast, slow, or normal? Does the rhythm appear to be regular or irregular?
Determine the Heart Rate
Calculate the heart rate using one of the methods described above. Determine if the rate is within the normal limits (60-100 beats/minute; less than 60 is bradycardia; greater than 100 is tachycardia. Determine if the atrial (P-P interval) rate and ventricular (R-R interval) rate are the same and associated.
Inspect the P Waves
Are P waves present? Do P waves have a normal shape - usually upright and rounded on the rhythm strip? Are all the P waves similar in size and shape? Do all the P waves point in the same direction? Do you see a 1:1 relationship between P waves and QRS complexes? Is each P wave the same distance from it's QRS complex?
Measure the P-R Interval
What is the duration of the P-R interval? (Normal 0.12 to 0.20 seconds) Is the P-R interval constant?
Analyze the QRS Complex
Are all the complexes the same size and shape? What is the duration of the QRS complex? (Normal duration is no more than 0.10 seconds; if
greater, it indicates a Bundle Branch Block (BBB)) Are all the QRS complexes the same distance from the T waves that follow them? Do all the QRS complexes point in the same direction? Are any QRS complexes present that appear different from the other QRS complexes on the strip? If so, measure and describe each one individually.
Observe the S-T Segment
Is the S-T segment on the baseline or is it above or below it? Could a P wave be hidden in the S-T segment?
Inspect the T Wave
Are T waves present? Do all the T waves have the same size and shape? Could a P wave be hidden in the T wave? Do the T waves point in the same direction as the associated QRS complex?
Determine U Wave Presence
Are U waves present?
Analyze any Aberrant and Premature Contractions
Where do they originate? Atria, AV node, or ventricle? Are they premature contractions, escape beats? Is a compensatory or noncompensatory pause present? How often do they occur?
Death-Producing Arrhythmias
These dysrhythmias are lethal and require immediate resuscitation in order to prevent death or permanent physical damage to the body.
• 1. Rate: o Look at the rate first.. o You can use the blocks on the strip to count.. (0.20 secs). 1 block between QRS
complexes is 300 beats a min, 2 blocks is 150, 3 is 100, then 75, 60, 50.. � Rate over 100 = tachycardia � Rate under 60 = bradycardia
• 2. Rhythm: o Next look at the rhythm,
� A regular rhythm =normal rhythm or a brady or tachy as above. � A regular rhythm with irregular beats = premature beats (either PAC's or
PVC's)
� An irregularly irregular rhythm = chaotic rhythm, often Atrial fibrillation or Ventricular Fibrillation, or frequent multifocal PVC's.
• 3. P wave: o Is there a P wave before each QRS? o Is there only one P wave per QRS? o Is it always the same configuration? o Is the distance between the P and the QRS constant? o Is the distance between a P and a QRS is .10 to .20 seconds? o P waves not present:
� No P, Narrow QRS, normal or slow, Regular = Junctional � No P, Narrow QRS, fast or slow, Irregular = Atrial fib � No P, Wide QRS, Slow, Regular= idioventricular � No P, Wide QRS Fast, basically Regular =V Tach
o 1 P per QRS � 1 P wave, Narrow QRS, Regular, normal rate = NSR � 1 P wave present but with different configurations: = wandering pacer
o 1 P wave longer than .20sec: � P with every QRS= 1st degree AV Block. � PR constant with dropped QRS's= 2nd degree heart Block � with progressive PR prolongation =2nd degree AV Block, Wenkebach
(type I) � No relationship between P's and QRS's = 3rd degree AV block
o More than 1 P wave: � irregularly irregular = Atrial Fib � Many P's same configuration, Regular = Atrial flutter (P Rate often 300
and QRS rate might be 150 (2:1), or 100 (3:1)) � P's grouped with regular R to R's = 2nd degree Block, type 11 � Increasing PR intervals, Basically regular with dropped QRS's =2nd
degree block type 1, Wenkebach � No relationship between P's and QRS's = 3rd degree Block, Complete
Heart Block
• 4. QRS: o Narrow or wide(.06 .10)? o Regular? o Rate o P wave preceding each QRS? o Narrow
� Narrow,Regular, fast, P with every QRS = sinus Tachy, rate greater than 150= SVT (Supraventricular Ventricular Tachycardia)
� Narrow, Regular, slow, P with every QRS = sinus Brady o Mixed narrow and wide
� Mixed narrow and wide, regular wide beats =unifocal PVC's � Mixed narrow and wide, irregular wide beats = multifocal PVC's
o Wide � Wide, Regular, slow or normal rate, P per QRS = BBB � Wide,regular, fast, P per QRS = ST or SVT with aberrancy
� Wide, regular, with no relationship between P and QRS =3rd degree AVBlock
� Wide, regular, slow =idioventricular � Wide, regular, Fast = V Tach
• 5. QT/T wave abnormality: o ST depression = myocardial ischemia o ST elevation = myocardial injury o Prolonged QT with flat T waves = hypokalemiaAVBlock o Early Peaked T waves = hyperkalemia.
• 6. No P's or QRS's (as an afterthought): o Completely irratic = V fib o Straight line = asystole
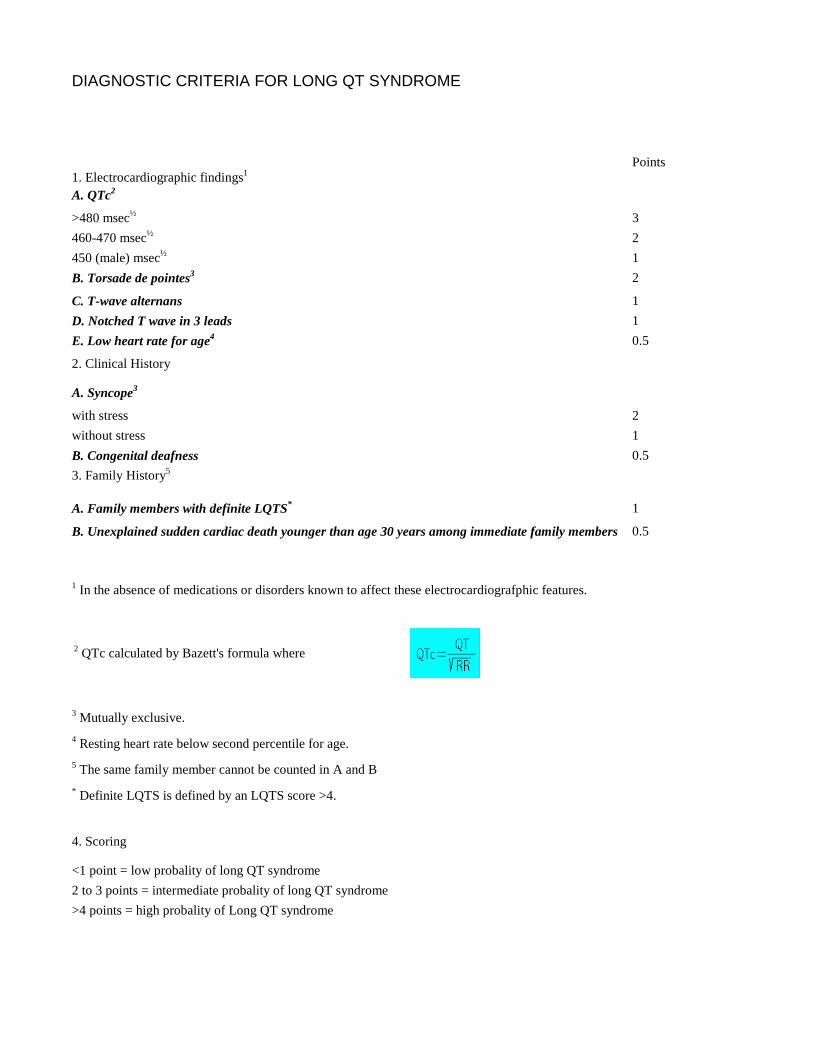
DIAGNOSTIC CRITERIA FOR LONG QT SYNDROME
Criteria For Long QT Syndrome (1993) 1. Electrocardiographic findings1
Points
A. QTc2
>480 msec½ 3
460-470 msec½ 2
450 (male) msec½ 1
B. Torsade de pointes3 2
C. T-wave alternans 1
D. Notched T wave in 3 leads 1
E. Low heart rate for age4 0.5
2. Clinical History
A. Syncope3
with stress 2
without stress 1
B. Congenital deafness 0.5
3. Family History5
A. Family members with definite LQTS* 1
B. Unexplained sudden cardiac death younger than age 30 years among immediate family members 0.5
1 In the absence of medications or disorders known to affect these electrocardiografphic features.
2 QTc calculated by Bazett's formula where
3 Mutually exclusive.
4 Resting heart rate below second percentile for age.
5 The same family member cannot be counted in A and B
* Definite LQTS is defined by an LQTS score >4.
4. Scoring
<1 point = low probality of long QT syndrome
2 to 3 points = intermediate probality of long QT syndrome
>4 points = high probality of Long QT syndrome
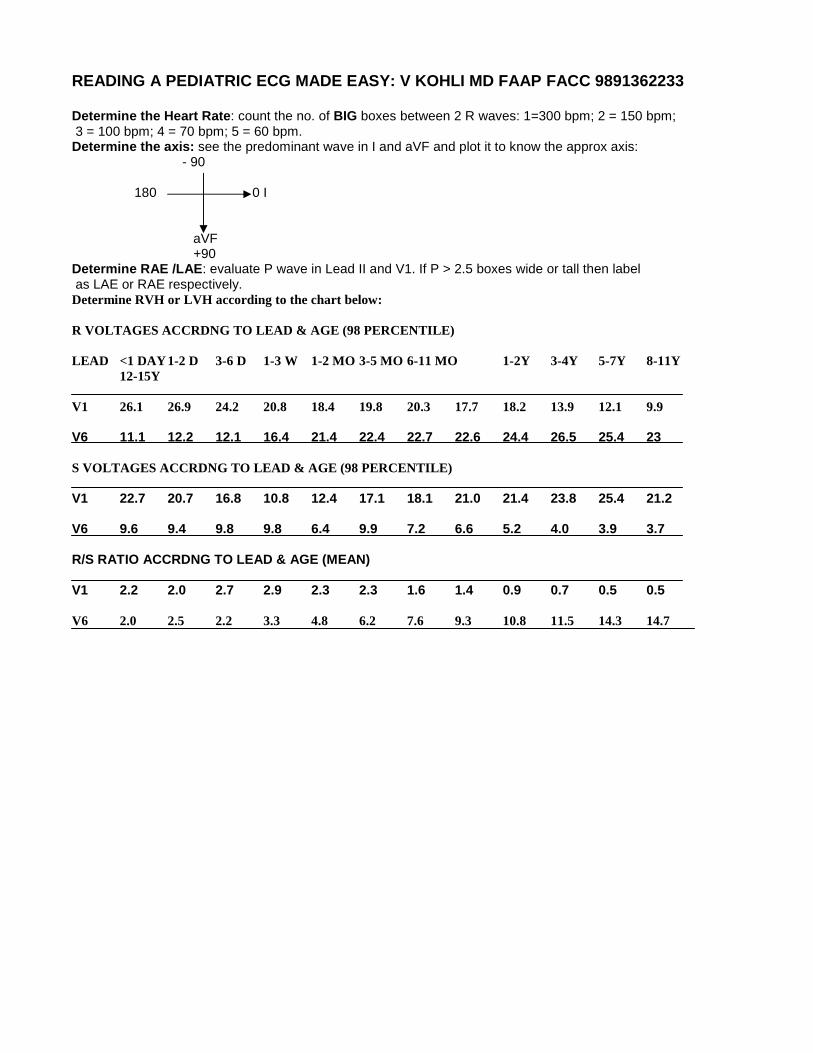
READING A PEDIATRIC ECG MADE EASY: V KOHLI MD FAAP FACC 9891362233 Determine the Heart Rate: count the no. of BIG boxes between 2 R waves: 1=300 bpm; 2 = 150 bpm; 3 = 100 bpm; 4 = 70 bpm; 5 = 60 bpm. Determine the axis: see the predominant wave in I and aVF and plot it to know the approx axis:
- 90 180 0 I
aVF +90 Determine RAE /LAE: evaluate P wave in Lead II and V1. If P > 2.5 boxes wide or tall then label as LAE or RAE respectively. Determine RVH or LVH according to the chart below: R VOLTAGES ACCRDNG TO LEAD & AGE (98 PERCENTILE) LEAD <1 DAY 1-2 D 3-6 D 1-3 W 1-2 MO 3-5 MO 6-11 MO 1-2Y 3-4Y 5-7Y 8-11Y 12-15Y V1 26.1 26.9 24.2 20.8 18.4 19.8 20.3 17.7 18.2 13.9 12.1 9.9 V6 11.1 12.2 12.1 16.4 21.4 22.4 22.7 22.6 24.4 26.5 25.4 23 S VOLTAGES ACCRDNG TO LEAD & AGE (98 PERCENTILE) V1 22.7 20.7 16.8 10.8 12.4 17.1 18.1 21.0 21.4 23.8 25.4 21.2 V6 9.6 9.4 9.8 9.8 6.4 9.9 7.2 6.6 5.2 4.0 3.9 3.7 R/S RATIO ACCRDNG TO LEAD & AGE (MEAN) V1 2.2 2.0 2.7 2.9 2.3 2.3 1.6 1.4 0.9 0.7 0.5 0.5 V6 2.0 2.5 2.2 3.3 4.8 6.2 7.6 9.3 10.8 11.5 14.3 14.7
Related Documents