HAL Id: hal-00501932 https://hal.archives-ouvertes.fr/hal-00501932 Submitted on 13 Jul 2010 HAL is a multi-disciplinary open access archive for the deposit and dissemination of sci- entific research documents, whether they are pub- lished or not. The documents may come from teaching and research institutions in France or abroad, or from public or private research centers. L’archive ouverte pluridisciplinaire HAL, est destinée au dépôt et à la diffusion de documents scientifiques de niveau recherche, publiés ou non, émanant des établissements d’enseignement et de recherche français ou étrangers, des laboratoires publics ou privés. Near–field dispersion of Produced Formation Water (PFW) in the Adriatic Sea: an integrated numerical - chemical approach D. Cianelli, L. Manfra, E. Zambianchi, C. Maggi, A. Cappiello, G. Famiglini, M. Mannozzi, A.M. Cicero To cite this version: D. Cianelli, L. Manfra, E. Zambianchi, C. Maggi, A. Cappiello, et al.. Near–field dispersion of Pro- duced Formation Water (PFW) in the Adriatic Sea: an integrated numerical - chemical approach. Marine Environmental Research, Elsevier, 2008, 65 (4), pp.325. 10.1016/j.marenvres.2007.12.001. hal-00501932

Welcome message from author
This document is posted to help you gain knowledge. Please leave a comment to let me know what you think about it! Share it to your friends and learn new things together.
Transcript

HAL Id: hal-00501932https://hal.archives-ouvertes.fr/hal-00501932
Submitted on 13 Jul 2010
HAL is a multi-disciplinary open accessarchive for the deposit and dissemination of sci-entific research documents, whether they are pub-lished or not. The documents may come fromteaching and research institutions in France orabroad, or from public or private research centers.
L’archive ouverte pluridisciplinaire HAL, estdestinée au dépôt et à la diffusion de documentsscientifiques de niveau recherche, publiés ou non,émanant des établissements d’enseignement et derecherche français ou étrangers, des laboratoirespublics ou privés.
Near–field dispersion of Produced Formation Water(PFW) in the Adriatic Sea: an integrated numerical -
chemical approachD. Cianelli, L. Manfra, E. Zambianchi, C. Maggi, A. Cappiello, G. Famiglini,
M. Mannozzi, A.M. Cicero
To cite this version:D. Cianelli, L. Manfra, E. Zambianchi, C. Maggi, A. Cappiello, et al.. Near–field dispersion of Pro-duced Formation Water (PFW) in the Adriatic Sea: an integrated numerical - chemical approach.Marine Environmental Research, Elsevier, 2008, 65 (4), pp.325. �10.1016/j.marenvres.2007.12.001�.�hal-00501932�

Accepted Manuscript
Near–field dispersion of Produced Formation Water (PFW) in the Adriatic Sea:
an integrated numerical - chemical approach
D. Cianelli, L. Manfra, E. Zambianchi, C. Maggi, A. Cappiello, G. Famiglini,
M. Mannozzi, A.M. Cicero
PII: S0141-1136(08)00002-0
DOI: 10.1016/j.marenvres.2007.12.001
Reference: MERE 3160
To appear in: Marine Environmental Research
Received Date: 8 May 2007
Revised Date: 20 December 2007
Accepted Date: 28 December 2007
Please cite this article as: Cianelli, D., Manfra, L., Zambianchi, E., Maggi, C., Cappiello, A., Famiglini, G.,
Mannozzi, M., Cicero, A.M., Near–field dispersion of Produced Formation Water (PFW) in the Adriatic Sea: an
integrated numerical - chemical approach, Marine Environmental Research (2008), doi: 10.1016/j.marenvres.
2007.12.001
This is a PDF file of an unedited manuscript that has been accepted for publication. As a service to our customers
we are providing this early version of the manuscript. The manuscript will undergo copyediting, typesetting, and
review of the resulting proof before it is published in its final form. Please note that during the production process
errors may be discovered which could affect the content, and all legal disclaimers that apply to the journal pertain.

ACCEPTED MANUSCRIPT
1
Near–field dispersion of Produced Formation Water (PFW) 1
in the Adriatic Sea: an integrated numerical - chemical approach 2
3
D. Cianelli1,2*, L. Manfra1,3, E. Zambianchi1, C. Maggi3, A. Cappiello4, 4
G. Famiglini4, M. Mannozzi3, A. M. Cicero3 5
6
7 1 Department of Environmental Sciences, University of Naples “Parthenope”, Italy 8
2 AMRA - Center of Competence for Analysis and Monitoring of Environmental Risk, 9
Naples, Italy 10 3 I.C.R.A.M. - Central Institute for Applied Marine Research, Rome, Italy 11 4 Istitute of Chemical Sciences “F. Bruner”, University of Urbino, Italy 12
13
14
15
*Corresponding author 16
Daniela Cianelli, PhD 17
University of Naples “Parthenope” 18
Department of Environmental Sciences 19
Centro Direzionale di Napoli, Isola C4 20
80143 – NAPOLI 21
Italy 22
23
e-mail: [email protected] 24
phone: +39 081 5476580 25
fax: +39 081 5513679 26

ACCEPTED MANUSCRIPT
2
Abstract 1
Produced formation waters (PFWs), a by-product of both oil and gas extraction, are separated 2
from hydrocarbons onboard oil platforms and then discharged into the sea through submarine 3
outfalls. The dispersion of PFWs into the environment may have a potential impact on marine 4
ecosystems. We reproduce the initial PFW-seawater mixing process by means of the UM3 5
model applied to offshore natural gas platforms currently active in the Northern Adriatic Sea 6
(Mediterranean Sea). Chemical analyses lead to the identification of a chemical tracer 7
(diethylene glycol) which enables us to follow the fate of PFWs into receiving waters. The 8
numerical simulations are realized in different seasonal conditions using both measured 9
oceanographic data and tracer concentrations. The numerical results show the spatial and 10
temporal plume development in different stratification and ambient current conditions. The 11
analytical approach measures concentrations of the diethylene glycol at a maximum sampling 12
distance of 25 m. The results show a good agreement between field observations and model 13
predictions in the near-field area. The integration of numerical results with chemical analyses 14
also provides new insight to plan and optimize PFW monitoring and discharge. 15
16
17
Keywords: Produced Formation Waters, Dispersion, Modelling, Chemical tracer analysis, 18
Adriatic Sea, Environmental Monitoring 19

ACCEPTED MANUSCRIPT
3
1. Introduction 1
A number of offshore natural gas (CH4) extraction platforms are currently active in the 2
Adriatic Sea (Mediterranean Sea). During production, Produced Formation Water (PFW), a 3
by-product of both oil and gas extraction originated from water naturally present in geological 4
formations (Formation Water) and water injected in the oil field (Process Water) to maintain 5
reservoir pressure (Henderson et al., 1999), is brought to the surface. PFW contains inorganic 6
compounds (i.e. trace metals), volatile aromatic compounds (benzene, toluene, ethylbenzene, 7
xylenes), semivolatile substances (i.e. naphthalene, phenanthrene, dibenzothiophene), 8
phenols, organic acids and additives (Manfra et al., 2007). PFW is separated from the 9
hydrocarbons on the platforms and then discharged into the sea, where potential effects on 10
biota may occur (Neff et al., 2002; Osenberg et al., 1992; Grant and Briggs, 2002; Cicero et 11
al., 2003; Trabucco et al, 2006). This makes the investigation of the physical and chemical 12
characteristics of PFWs extremely important from the environmental standpoint. 13
After discharge, PFWs may be affected by several different processes, such as dispersion 14
into the sea, volatilization towards the atmosphere and settling at the bottom. In particular, the 15
first main process occurring immediately after discharge is the mixing of the PFW plume with 16
the ambient fluid which determines an immediate PFW dilution and the reduction of its 17
concentration in the sea water (e.g. Baumgartner et al., 1994). 18
In the last decade relevant works published on PFW dispersion (e.g., Berry and Wells, 19
2004; Nedwed et al., 2004) showed the importance of using numerical methods to investigate 20
the fate of PFWs discharged in coastal areas. Washburn et al. (1999) demonstrated, by means 21
of a field and modeling study around a diffuser located in California, that a factor controlling 22
the exposure of organisms to PFWs around the discharge location is the depth of the plume in 23
the water column which, in turn, is modulated by seasonal stratification. Realistic calculations 24
of the fate of the PFW components after discharge and different tools for estimation of 25

ACCEPTED MANUSCRIPT
4
environmental exposures at various levels of contaminant have also been developed (Sabeur 1
and Tyler, 2004; Neff et al., 2006; Durell et al., 2006). Moreover chemical tracer studies have 2
been recognized as an efficient method to accurately describe PFW pathways into the sea as 3
well as to predict concentrations of both drilling mud and produced water in detail (Smith et 4
al., 2004). Applying a combination of oceanographic techniques and chemical assessment 5
methods on the Australian Shallow Water Ecosystem, Burns et al. (1999) suggested that fast 6
rates of dispersion and degradation processes may prevent any long-term contamination in the 7
sandy sediments. 8
The few studies carried out on this topic for the North Adriatic area pointed out that the 9
short term influence of the natural gas platform structures on surrounding sediments is related 10
more to the installation phase than to the subsequent extraction phase (Fabi et al., 2005). 11
Metal (Zn and As) accumulation (Cicero et al., 2003; Manfra et al., 2007) in sediments and 12
mussels (Mytilus galloprovincialis), as well as influences on benthic communities (Trabucco 13
et al., 2006), have been observed at locations very close to the platforms. On the other hand 14
no literature is available, to our knowledge, on the identification of PFWs in the 15
Mediterranean Sea by means of chemical tracers and the use of numerical models to 16
investigate the near field dispersion of PWFs in the Adriatic area. 17
18
In this paper we present the results of an integrated numerical-chemical approach 19
developed to investigate the initial mixing of the PFWs discharged from three offshore natural 20
gas platforms located in the Northern Adriatic Sea. Our research is primarily conceived to 21
relate field and laboratory observations with the near field dilution processes through a 22
numerical process study. The present study introduces a multidisciplinary methodology for 23
the estimation of the presently available monitoring protocol efficiency, as well as the 24
potential effects induced on marine systems by PFW discharges in the Adriatic Sea. 25
ACCEPTED MANUSCRIPT
5
A typical method to reconstruct the path of the PFW into the sea consists of adding tracer 1
dyes to the effluent before the discharge (Roldão et al., 1998; Carvalho et al., 2002). The 2
restrictive regulations of offshore platforms often make this approach impractical. In the 3
present work, in order to follow the PFW plume within the marine environment and 4
investigate its dispersion, we analyzed the PFWs' chemical composition and identified some 5
possible chemical tracers of these effluents. We assessed the concentrations of the main 6
groups of compounds typical of produced waters originating from natural gas platforms. 7
Metal concentrations were often under detection limits, while the volatile and semivolatile 8
aromatic hydrocarbons have not always been quantifiable. For polycyclic aromatic 9
hydrocarbons, it was difficult to separate the platform and anthropic contributions. On the 10
basis of these analyses, two chemical additives, diethylene glycol and toluene 11
hydrossibutilate, proved to be the most suitable tracers of the PFWs (Manfra, 2006). 12
We here report the data relative to the diethylene glycol (DEG), which provided the best 13
affordable chemical tracer among the investigated substances. DEG is an additive used on 14
offshore gas platforms to prevent the hydrate formation during the gas-water separation 15
process and to inhibit corrosion events (Ballantyne et al., 2005; Ferrari and Giannuzzi, 2005). 16
The estimate of DEG concentrations in both PFW and seawater samples collected at different 17
distances from the platforms led us to select DEG as PFW tracer. This choice also takes into 18
account that the DEG presence in seawater is exclusively attributable to the PFW discharge 19
and that it is miscible in water, thus allowing tracing of the PFW plume (Weyerhaeuser, 20
2005). Moreover it is worth noting that the competent authorities permit the addition of high 21
DEG concentrations (maximum values of 3500 ppm) to PFWs and these may be easily 22
tracked in the seawater. 23
In this work we focus on the entrainment and initial dilution processes that have been 24
reproduced in the regions of our three platforms by means of the UM3 (Three Dimensional 25

ACCEPTED MANUSCRIPT
6
Update Merge) numerical model widely and successfully applied (Baumgartner et al., 1994; 1
Frick et al., 2002) by the US Environmental Protection Agency to simulate the near field 2
mixing. The overall study area, the northern Adriatic Sea, is a shelf zone, characterized by 3
depths less than 200 m, where the circulation system shows a relevant seasonal variability 4
(e.g. Artegiani et al., 1997a-b). As previous theoretical and experimental studies demonstrated 5
(Wu et al., 1994; Petrenko et al., 1998), stratification and current variability around the 6
discharge location are critical for the effluent dispersion. Our simulations are realized in 7
different seasonal conditions (summer and winter) using as model input historical current data 8
and density profiles of the receiving water body as well as the actual outfall pipe 9
characteristics. Measured concentrations of the DEG tracer represent another numerical input. 10
Model results are designed to describe the initial dilution phase of the plume and the extent 11
to which water column stratification and ambient currents affect its dynamics. These results 12
are compared with those of the chemical analyses relative to the tracer concentrations 13
observed in the receiving waters. 14
Using oceanographic observations to reproduce the ambient conditions and initial 15
concentrations of the chemical tracer in the PFW, the UM3 model has proven to be able to 16
predict the initial dilution of the PFW from the three investigated platforms in the Adriatic 17
Sea. The integrated approach has allowed us to evaluate the temporal and spatial distribution 18
of the effluent and has provided suggestions to plan and optimize the PFW discharge 19
protocols as well as the monitoring strategy. 20
21
2. Materials and methods 22
2.1. Field data 23
In this work we consider three platforms located in the northwestern Adriatic Sea (Fig. 1) 24
As mentioned above, this portion of the basin is characterized by a very wide and shallow 25

ACCEPTED MANUSCRIPT
7
continental shelf, and the overall main current in the area is represented by the Western 1
Adriatic Current (WAC), a southeastward coastal current flowing along the Italian coast 2
(Falco et al., 2000) 3
The water column depth at the platforms ranges between 18 and 120 m (Table I); the 4
PFWs are discharged from a single port outfall pipe oriented downward at the depths from 3 5
m above the sea surface to 12 m depth (Table 1). 6
The data utilized in this study come from two monitoring surveys carried out in the 7
summer of 2005 and 2006 (Manfra, 2006): the PFWs were sampled on all three gas platforms 8
(1, 2 and 3 hereinafter) and marine surface water samples were collected during PFW 9
discharge in six stations at increasing distance from the discharge source (0 m - close to the 10
platform – 5 m, 10 m, 15 m, 20 m and 25 m) after a qualitative estimate of the ambient 11
current direction. In the case of platforms 2 and 3, at the farthest station (25 m) subsurface 12
samples were also collected at discrete depths (0 m, 4 m, 8 m, 12 m; at platform 3 also 16 m) 13
in the water column. The samples were stored in dark glass bottles to inhibit photochemical 14
activity and saturated with mercury cloride to inhibit bacterial activity, then were refrigerated 15
at 4°C. 16
A characterization of the dynamic environment in which the PFWs are discharged was also 17
carried out; hydrological data were collected on a number of oceanographic cruises carried 18
out during spring and summer seasons starting in April 2001 through August 2003 (ICRAM, 19
2002, 2003 and 2004). Temperature and conductivity were measured by an Idronaut Ocean 20
Seven 316 CTD sonde at a distance of 50 m from the platform. Hydrographic data for the 21
winter season have been drawn from the Dartmouth Adriatic Data Base 22
(http://thayer.dartmouth.edu/other/adriatic/databanks/hydrography/hydrography.html) in the 23
form of seasonal average stratification at the platform locations. 24
Surface currents have been derived from historical surface Lagrangian drifter 25
ACCEPTED MANUSCRIPT
8
measurements in the Adriatic Sea from 1994 to 1996 (Falco et al., 2000) (Fig 1). They 1
indicate current values in a range from a minimum of 3 cm s-1 to a maximum of 18 cm s-1 2
(Table I) with a southeastward prevailing direction in the area of the platforms, corresponding 3
to the above mentioned WAC. These data were complemented with ADCP data collected 4
between May 1995 and February 1996 (Ursella and Ga�i�, 2001). Current speeds were 5
considered as uniform with depth down to two meters above the bottom (a typical order of 6
magnitude for the logarithmic bottom boundary layer thickness in both shelf and deep ocean; 7
see Nakata, 1981; Gust and Weatherly, 1985), where the profile assumed a logarithmic shape 8
and a no slip condition was applied. 9
Figure 1 approximate location 10
Table I approximate location 11
12
2.2. Chemical analyses 13
For DEG analysis, the samples were preconcentrated by an off-line solid phase extraction 14
technique (SPE), which provides a concentration factor of about 500 and avoids problems 15
connected to the different salinity of the samples (Cappiello et al., 2007). Each sample was 16
introduced into a cartridge packed with 200 mg of ISOLUTE ENV+, an adsorbent material 17
suitable for polar compounds (International Sorbent Technology, Glamorgan, UK). The 18
cartridge was conditioned beforehand with 15 ml of acetone and then with 10 ml of deionized 19
water. 100 ml of each sample was forced through the cartridges at a flow rate of 5 ml min-1. 20
DEG was eluted with 8 ml of acetone. The extract was evaporated to a volume of 200 µl 21
under a gentle stream of nitrogen and 200 µl of deionized water were then added; finally, after 22
a complete evaporation of the acetone, DEG remained dissolved in 200 µl of water. 23
The extract was introduced into the mass spectrometer (Hewlett-Packard 5989A) using a 24
Direct-EI, LC-MS interface in Flow Injection Analysis (FIA) mode (Cappiello et al., 2002). 25
The Direct-EI interface shows several advantages in this specific application: high specificity, 26

ACCEPTED MANUSCRIPT
9
very low influence of the mobile phase and matrix composition (Choi et al., 2001; Reemtsma, 1
2001). In particular, residues of salts in the extracts do not affect mass spectral response. 2
Identification of DEG was obtained in Selected Ion Monitoring analysis (SIM) using three 3
characteristic ions (m/z 45, 75 and 76). M/z 75 signal was used in quantitation experiments. 4
The limit of detection (LOD) of the method, expressed as the minimum concentration of 5
the DEG that can be detected in the sample, was 31 µg l-1. The percentage of recovery for this 6
method was 65.0 ± 16.3 % (Cappiello et al., 2007) but further studies are currently in progress 7
in order to improve the sensitivity of method. 8
9
2.3. UM3 model 10
The near field dilution is the initial mixing process of an effluent discharged into the sea, 11
due to the combined effects of momentum and buoyancy and acting close to the effluent 12
diffuser (Baumgartner et al., 1994). 13
In the present work the dispersion of a PFW plume in the near field has been simulated by 14
means of the UM3 (Three-dimensional Updated Merge) model specifically conceived for 15
single and multi-port submerged discharges (Baumgartner et al., 1994; Frick et al., 2002) and 16
included in the EPA interface PLUMES (http://www.epa.gov/ceampubl/swater/vplume). 17
Compared with other models for the near field mixing, UM3 provides a good prediction of the 18
initial dilution processes for both waste-water (Carvalho et al., 2002) and PFWs discharges 19
(Roberts and Tian, 2004); moreover, strictly dealing with produced water discharges, UM3 20
has proven to accurately reproduce the observed dilutions (Roberts and Tian, 2004). 21
UM3 is a three-dimensional Lagrangian model that quantifies entrainment, the process by 22
which ambient fluid is incorporated into a plume, by applying both the Taylor entrainment (or 23
shear) and the projected-area-entrainment (PAE) (or forced) hypotheses (e.g. Winiarski and 24
Frick, 1976). The equations for conservation of mass, momentum and energy are computed at 25

ACCEPTED MANUSCRIPT
10
each time step along the plume trajectory. 1
The dilution process may be considered the outcome of entrainment; it may be enhanced or 2
inhibited by outfall pipe, ambient fluid and effluent properties (Baumgartner et al., 1994) 3
which the UM3 model takes into account as model inputs. In particular, the model considers 4
the diameter and the orientation of the port as well as the depth of discharge as the outfall pipe 5
features which may affect the effluent velocity and the plume trajectory. 6
The receiving ambient fluid properties are described by means of vertical profiles of 7
density, which is the main variable affecting plume buoyancy. The effluent and the ambient 8
density typically differ and the entrainment process tends to cancel this difference; when an 9
equilibrium condition is reached (s.c. neutral buoyancy level, or trap level) the initial mixing 10
process terminates. The current velocity and direction close to the point of discharge are also 11
important features affecting plume dynamics. The former parameter may increase the shear 12
between plume and ambient fluid thus contributing to the production of turbulence that 13
directly influences the dilution; the second mainly acts on the plume trajectory (Frick et al., 14
2002). The current profile used in our computations was obtained as described above, in the 15
section on “Field data”. 16
The UM3 model provides output parameters useful to evaluate the space and time 17
evolution of the effluent. The PFW dilution is parameterized through the mass dilution factor 18
(Sa), which is the ratio between the effluent concentration and the cross sectional average 19
concentration in the plume. For a round shaped outfall, the densimetric Froude number 20
(Brandsma et al., 1992), which provides an estimate of the relative importance of momentum 21
and buoyancy in driving the initial mixing, is defined as: 22
23
1) 24 25 26 27
e
eagD
UFr
ρρρ −
= 0
ACCEPTED MANUSCRIPT
11
1 2
where D is the outfall pipe port diameter, �a the ambient density at depth of the port, �e the 3
effluent density and g is gravity. U0 represents the effluent outflow velocity and is given by: 4
5
6 2) 7
8 9
with q is the volume flux at outfall pipe port. 10
In order to characterize the stability of the water column at discharge depth we 11
approximate, for each platform, the classic formulation of the Brunt-Väisälä frequency N 12
13
14 3) 15
16
17
as in Washburn et al. (1998): 18
19
4) 20 21
22
where ρref represents the ambient fluid density at the depth of the discharge and z∆∆ρ is the 23
vertical density gradient in correspondence of the outfall depth. N is computed by finite 24
differencing the measured density profile in a vertical range of 4 m centred around the depth 25
of discharge. 26
27
3. Results and discussion 28
The numerical and chemical results on PFWs discharged by three gas platforms are here 29
20
4Dq
U⋅
=π
21
���
�
���
�
∂∂−=
zg
Nref
ρρ
21
���
�
���
�
∆∆−=
zg
Nref
ρρ

ACCEPTED MANUSCRIPT
12
discussed. In this work, the PFW characteristics from the offshore gas platforms have been 1
used to run three numerical simulations in summer conditions (see Table II); in this case, as 2
input data we considered the tracer concentration (DEG) measured in sea water (platform 1) 3
and in the effluent (platform 2 and 3). The field current and water mass circulation of the 4
Northern Adriatic Sea present a marked seasonal variability (e.g. Artegiani et al., 1997a-b) 5
which may affect the PFW dispersion. To evaluate the role of stratification on the plume 6
dynamics we also simulate a winter PFW discharge from the three platforms (see Table II) 7
using the same effluent characteristics as in the summer case (average flow, temperature and 8
salinity) and the total PFW concentration. We also compare the vertical DEG profile 9
measured at 25 m from the source with the dilution and path of the plume predicted by the 10
near field model. 11
The chemical results are presented in Figure 2 and Figure 4, while the output data of the 12
UM3 model are summarized in Table II and Figures 3 – 5. 13
Figure 2 approximate location, Table II approximate location 14
15
Platform 1 16
The average effluent flow is approximately 27400 l d-1; the PFW outfall pipe is located 3 m 17
above the surface so that, immediately after the discharge, the PFW sinks into the water 18
column. In the proximity of the platform, the surface DEG content was nearly one third of the 19
initial value (Fig. 2); a surface concentration decrease is observed at 5 m from the discharge 20
point, after which surface DEG values display an increasing trend until the farthest 21
measurement station. 22
The UM3 model simulates the plume trajectory only from outfalls located below the sea 23
surface; here we consider that the plume starts to spread at 2 m depth below the surface, after 24
the initial sinking of the discharged PFW and the effect of air entrainment owing to the impact 25
with the water surface. The initial DEG value used here as input concentration to the UM3 26
ACCEPTED MANUSCRIPT
13
refers to the surface concentration detected at 5 m from the source. 1
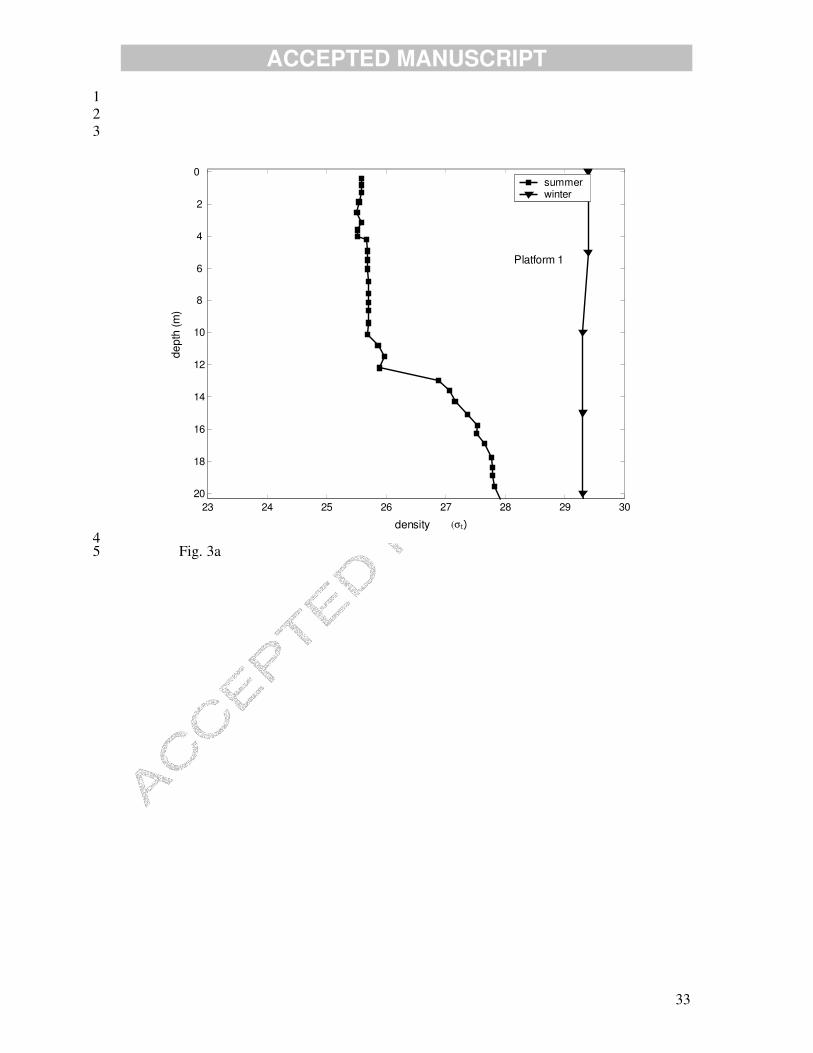
The measured hydrological structure of the water column in the summer shows a 2
pycnocline (Fig. 3a) at ~12 m, whereas the surface layer, influenced by the PFW discharge, 3
appears homogeneously mixed. A first sinking phase of the effluent induces the low DEG 4
concentrations detected at the surface, close to the PFW source. On the other hand, effluent 5
and ambient water show different densities (23.95 and 25.75 σt respectively) which explain 6
the resurfacing of the plume at ~14 m from the PFW source (Fig. 3b) and the consequent 7
increase in the surface measured concentration at 15, 20 and 25 m. 8
In spite of the high effluent flow (Table I), the mixing condition of the surface layer, along 9
with the swift currents associated with the platform location (17 cm s-1), determine a rapid 10
initial dilution (Sa = 175 after 1.5 mins) of the DEG tracer. 11
At the simulated discharge depth (2 m) the summer and winter Brunt-Vaisala frequency 12
values are comparable (Table II), even though winter intense mixing leads to a fully 13
homogeneous density profile (Fig. 3a). In the winter season the increased density difference 14
between effluent and ambient water (Table 2) affects plume dynamics both decreasing the 15
extent of initial mixing zone (Fig. 3b) and quickening the initial dilution process (Sa = 170 in 16
60 s). 17
Figure 3 a-b approximate location 18
Figure 4 approximate location 19
20
Platform 2 21
The PFW showed high initial DEG concentration (9600 µg l-1) whereas values about four-22
five times lower than the initial concentration were recorded in ambient water samples. The 23
outfall is located at 9 m depth and the discharged volume is relatively small (about 11000 l d-24
1); at 25 m from the source, the DEG surface value is lower than that recorded at 8 m depth 25
(2460 µg l-1; Fig. 4). 26

ACCEPTED MANUSCRIPT
14
Under summer stratification (Fig. 5a) and low ambient current conditions (the measured 1
surface value is 3 cm s-1), a negative buoyancy is far more relevant (Fr = 0.66). As reported in 2
Table II, the PFW is characterized by a density greater than the receiving water at the port 3
depth, which causes an initial sinking in the water column down to ~ 10 m depth (Fig. 5b). At 4
the end of the initial mixing phase the plume, not much diluted (Sa = 55), remains close to the 5
source point and approximately at the depth where the highest concentrations of DEG have 6
been observed (Fig. 4 and 5b). The comparison between field and model data suggests that 7
the plume is trapped into a narrow layer centered at the discharge depth; the initial dilution 8
terminates very rapidly, developing within only 2.5 m from the source in slightly more than 9
one minute. After the near field dilution, vertical diffusivity processes may affect the plume 10
path determining the maximum DEG concentration observed at 8 m depth; however it is 11
worth to underline that discretised sampling strategy does not allow to reconstruct the vertical 12
DEG profile in detail. 13
A completely different situation is found in simulating the water column winter mixing, 14
when a low stability condition (N = 0.15) occurs at the discharge depth. The PFW plume is 15
lighter than the receiving water, shows a Froude number (0.06) with positive buoyancy and 16
rises to ~ 8 m depth (Fig. 5b). Current conditions being equal, the intense winter mixing 17
determines a significant increase of the initial dilution extent and time (Table II). 18
Figure 5 a-b approximate location 19
20
Platform 3 21
High DEG concentration (13000 µg l-1) was measured in the discharged fluid, while in 22
seawater surface samples values about one order of magnitude lower than the initial 23
concentration were detected (Fig. 2). The DEG vertical profile (Fig. 4), similarly to platform 24
2, displays the maximum value (2810 µg l-1) at 8 m sampling depth along the water column 25
ACCEPTED MANUSCRIPT
15
even though the PFW source is located at 12 m depth and the volume of discharged effluent is 1
low (about 8200 l d-1). 2
During summer, the ambient conditions of platform 3 discharge are similar to those of 3
platform 2 in terms of low current (4 cm s-1) and water column stability (N = 0.33) (see also 4
Fig. 6a.). A positive buoyancy (Fr = 0.15) leads the plume to slightly rise to ~11.5 m, where 5
the trap level is reached (Fig. 6b). At the end of the initial mixing phase the dilution has 6
reached the value of 74 at ~15 m horizontal distance from the source. In this case the initial 7
dilution process ends in approximately 7 minutes. The model results indicate an initial plume 8
rising in the near field region, after which additional dilution may occur reducing the PFW 9
density and sustaining its further rising in the water column, in agreement with the 8 m 10
maximum DEG concentration measured at 25 m distance. 11
Modifying the water column stratification (Fig. 6a) yields an increase in the density 12
difference between effluent and receiving water (σt are 24.8 and 26.5 respectively). The 13
plume shows positive buoyancy and immediately after the discharge starts to rise in the water 14
column reaching the trap level at ~ 11 m depth (Fig. 5b). The low stability of the water 15
column acts to drastically decrease the time dilution and to enhance Sa. It is worth noting that 16
the initial mixing zone extension around the discharge point is less than 7 m. 17
Figure 6a-b approximate location 18
19
Even with the limitations due to the unavailable vertical discretization when it comes from 20
water sampling, the comparison between chemical analyses and numerical simulations 21
showed a good agreement, pointing out the presence of a limited layer within which the 22
plume spreads and evolves. In particular, both outcomes indicate that the plume mainly 23
develops within a layer 2 to 4 meters thick, centered at the discharge depth. Moreover, as in 24
previous experimental studies carried out in similar conditions (e.g. Robert and Tian, 2004), 25
the platforms discharging in the water column in low current conditions are characterized by a 26

ACCEPTED MANUSCRIPT
16
near field dilution occurring within 15 m or less from the outfall. It is worth underlining that 1
the UM3 model only simulates the initial dilution phase of the plume, whereas the PFW can 2
also be found in the sea at distances further from the source, where far field processes play a 3
significant role; this is the case here, as shown by the chemical analyses. 4
Since DEG is exclusively attributable to PFW discharge, it is miscible in seawater, is easily 5
measured and can be added to PFW in concentrations as high as 3500 mg l-1, it provides a 6
very convenient chemical tracer of PFWs originating from gas platforms. However, the 7
results have shown that the DEG traceability varies according to the discharge position and 8
the PFW density. 9
All effluent features being the same, the plume dynamics within the water column appears 10
strongly modulated by the seasonal stratification for all modelled current speeds. During 11
summer, the N frequency values are typically greater than in winter, thus indicating a high 12
level of stability at discharge depth. The periods of high stratification also influence the trap 13
level depth of the plume (see Platforms 2 and 3) which is deeper in the summer. In winter 14
conditions, when intense mixing fosters the rise of the plume in the water column, an opposite 15
situation occurs for all the investigated platforms. 16
As suggested by previous studies (e.g Frick et al., 2002), for horizontal outfalls densimetric 17
Froude numbers less than 1.0 tipically indicate a fluid so buoyant to rise to the top of the 18
discharge port; in this case ambient fluid may flow into the outfall under the plume. Recent 19
technologies (involving the adoption of special valves) have been developed to prevent this 20
problem by increasing the Froude number via a reduction of the port cross-sectional area in 21
low flow situations (e.g Frick et al., 2002). In this work we only treat platforms with vertical 22
outfall pipes operating in weak current conditions, for which Froude number values less than 23
1.0 indicate that the plumes are dominated by the buoyancy effect (Frick et al., 2004). In our 24
numerical experiments, Fr values less than 1 in both unstratified and stratified scenarios also 25
ACCEPTED MANUSCRIPT
17
point out that stratification conditions have a more relevant effect in controlling the plume 1
dilution compared to the current field. 2
Another consequence of the variability in stratification is that the near-field dilution 3
parameter Sa may be highly variable. When the water column is highly stable in summer, the 4
plume is mixed over a smaller region of the water column (Table II), resulting in lower values 5
of Sa. For periods of weaker stratification in winter, the plume mixes over a larger zone of the 6
water column and Sa increases. A particular situation occurs when the discharge mainly 7
develops in the surface mixed layer (Platform 1). In this case the effect of the high currents 8
(17 cm s-1) is clearly predominant with respect to the water column stability, the winter 9
mixing only affecting the time required for the initial dilution and the plume horizontal extent. 10
The initial dilution times resulting from our integrated study are also consistent with 11
observed toxicological data (ICRAM, 2006; Manfra, 2006) revealing low or null toxic effects 12
in the water column close to the Adriatic platforms (stations sampled close to the source and 13
at 25 m, 50 m and 500 m distances). The time required to complete the initial dilution 14
(between 60 and 400 s) allows even the organisms entrained in the plume to be exposed to 15
rapidly decreasing concentrations of pollutants. 16
17
4. Conclusions 18
An integrated numerical-chemical approach has been used to investigate the near-field 19
dispersion of the produced formation waters discharged from three offshore natural gas 20
platforms operating in the northern Adriatic Sea. 21
The chemical approach is an analytical procedure which gives accurate concentrations of 22
the single compounds present in PFWs. The observed quantities of a selected contaminant 23
(DEG) have been integrated in the UM3 model allowing a comprehensive description of the 24
initial dilution path and time scales of the PFWs. In addition, measurements of currents and 25
ACCEPTED MANUSCRIPT
18
ambient density stratification have been used, representing another model input necessary to 1
assess the role of the physical constraints on the effluent dynamics. 2
All the simulations have been performed neglecting the loss of material contained in the 3
PFWs through removal or degradation processes and assuming a current field uniform with 4
depth, therefore our results may be considered a worst case of PFWs discharge. A good 5
agreement between field chemical data and modelling prediction is obtained even though the 6
comparison is only restricted to the near-field process. Future efforts will investigate times 7
and spatial scales of the far field region. 8
Results show that the plume behaviour is highly influenced by the thermal stratification 9
observed during the summer season, while no effect of the detected DEG concentrations on 10
the effluent density is clearly visible. In the case of submerged discharges, under stratified 11
conditions, the plume appears mainly trapped around the outfall pipe depth and the dilution 12
parameter Sa is relatively low (less than 80), while the presence of weak currents exerts little 13
influence on it. In unstratified conditions the effluent rises in the water column and the 14
dilution significantly increases to more than 130. In agreement with several dispersion/fate 15
models of produced water (Neff, 2002; Nedwed et al., 2004; Berry and Wells, 2004; Smith et 16
al., 2004; Durell et al., 2006) also in our cases the initial dilution processes are very rapid, the 17
fast PFWs dispersion times (< 7 min) causing negligible or no-toxic effects on the marine 18
organisms (ICRAM, 2006; Manfra et al., 2007). 19
In recent years the importance of assessing the influence of the PFWs discharge on the 20
marine environment has been recognized, and monitoring programmes have been successfully 21
developed (Maggi et al., 2007). Our integrated numerical-chemical approach may represent a 22
suitable tool providing advice to optimize both the monitoring activities and the industry 23
discharge practices. 24
For example, the present work clearly shows that under strong stratification conditions the 25

ACCEPTED MANUSCRIPT
19
effluent mainly develops its path around the discharge depth. Our results suggest that an 1
improvement of monitoring programmes is needed, for example to plan more samplings along 2
the water column starting close to the platform and up to 1 km from the source. Since the 3
water column stability has a relevant role on plume dynamics, it could also be useful to 4
schedule field measurements during the winter season. 5
Another relevant result achieved in the present work is that the highest effluent 6
concentrations, within the near-field zone, are found with strong stratification and low current 7
speed. Discharging higher volumes of effluent during the winter period could be a good 8
practice, as it would promote the dilution in the near-field. 9
Such indications may be essential to support decision makers in their efforts to mitigate the 10
impacts of the offshore platform operations on the marine ecosystems. Integrated chemical-11
numerical approaches could also be employed by the regulatory authorities (Frick et al., 2000) 12
- as usually done, e.g. by the US Environmental Protection Agency - to establish the extent of 13
the initial dilution zone (ZID). Even though many definitions exist (Roberts, 1996; Jirka et al., 14
2004), the ZID may be typically considered as a mixing zone around the discharge point 15
where ambient concentrations may exceed surface water quality standards but acutely toxic 16
conditions must be prevented. The initial dilution zone may be established by the authorities, 17
for example to protect local marine resources (Larsen, 2000); an integrated approach can be 18
used to assess the seasonal extent of the mixing zone, by taking into account the effluent flow, 19
the local current field and the concentration acceptable for the key organisms. 20
21
22
23
24
25
ACCEPTED MANUSCRIPT
20
Acknowledgements 1
The authors acknowledge comments by the three anonymous Reviewers and F.Bignami. This 2
research has been carried out as the result of a reciprocal agreement between the University of 3
Naples Parthenope and the Central Institute for Applied Marine Research (ICRAM). This 4
work was partly funded by the QUAMACO Project (Plan of activity of knowledge of coastal 5
marine environment) and by the EU Interreg III B Archimed CORI (Prevention and 6
Management of Sea Originated Risk to the Coastal Zone) project. 7
ACCEPTED MANUSCRIPT
21
������������������������������������������������1
Artegiani, A., Bregant, D., Paschini, E., Pinardi, N., Raicich, F., Russo, A., 1997. The 2
Adriatic Sea General Circulation. Part I: Air–Sea Interactions and Water Mass Structure. 3
Journal of Physical Oceanography, 27, 1492–1514. 4
Artegiani, A., Bregant, D., Paschini, E., Pinardi, N., Raicich, F., Russo, A., 1997. The 5
Adriatic Sea General Circulation. Part II: Baroclinic Circulation Structure. Journal of Physical 6
Oceanography, 27, 1515–1532. 7
Ballantyne, B., Snellings, W. M., 2005. Developmental toxicity study with diethylene 8
glycol dosed by gavage to CD rats and CD-1 mice. Food and Chemical Toxicology, 43, 1637-9
1646. 10
Baumgartner, D. J., Frick, W. E., Roberts, P. J. W., 1994. Dilution models for effluent 11
discharges (Third Edition). Pacific Ecosystems Branch, ERL-N, EPA/600/R-94/086, 12
Newport,OR. 13
Berry, J. A., Wells, P. G., 2004. Integrated fate modeling for exposure assessment of 14
produced water on the Sable Island Bank (Scotian Shelf, Canada). Environmental Toxicology 15
and Chemistry, 23, 2483-2493. 16
Brandsma, M. G., Smith, J. P., O'Reilly, J. E., Ayers, R. C. J., Holmquist, A. L., 1992. 17
Modeling offshore discharges of produced water. In J. P. Ray and F. R. Engelhart, Produced 18
Water: Technological/Environmental Issues and Solutions (pp. 59-71). New York: Plenum 19
Press. 20
Burns, K. A., Codi, S., Furnas, M., Heggie, D., Holdway, D., King, B., McAllister, F., 21
1999. Dispersion and Fate of Produced Formation Water Constituents in an Australian 22
Northwest Shelf Shallow Water Ecosystem. Marine Pollution Bulletin, 38, 593-603. 23

ACCEPTED MANUSCRIPT
22
Cappiello, A., Famiglini, G., Mangani, F., Palma, P., 2002. A simple approach for coupling 1
liquid chromatography and electron ionization mass spectrometry. Journal of the American 2
Society for Mass Spectrometry, 13, 265-273. 3
Cappiello, A., Famiglini, G., Palma, P., Pierini, E., Trufelli, H., Maggi, C., Manfra, L., 4
Mannozzi, M., 2007. Application of NANOFIA-MS to determine diethylene glicol in 5
produced formation water and seawater samples (Adriatic Sea). Chemosphere, 69, 554-560. 6
Carvalho, J. L. B., Roberts, P. J. W., Roldão, J., 2002. Field Observations of Ipanema 7
Beach Outfall. Journal of Hydraulic Engineering, 128, 151-160. 8
Choi, B. K., Hercules, D. M., Gusev, A. I., 2001. LC-MS/MS signal suppression effects in 9
the analysis of pesticides in complex environmental matrices. Fresenius Journal of Analytical 10
Chemistry, 369, 370-377. 11
Cicero, A. M., Di Mento, R., Gabellini, M., Maggi, C., Trabucco, B., Astorri, M., Ferraro, 12
M., 2003. Monitoring of environmental impact resulting from offshore oil and gas 13
installations in the Adriatic Sea: preliminary evaluations. Annali di Chimica, 93, 701-705. 14
Durell, G., Utvik, T. R., Johnsen, S., Frost, T., Neff, J., 2006. Oil well produced water 15
discharges to the North Sea. Part I: Comparison of deployed mussels (Mytilus edulis), semi-16
permeable membrane devices, and the DREAM model predictions to estimate the dispersion 17
of polycyclic aromatic hydrocarbons. Marine Environmental Research, 62, 194–223. 18
Fabi, G., Ausili, S., Campanelli, A., De Biasi, A. M., Fornasiero, P., Grati, F., Grilli, F., 19
Marini, M., Panfili, M., Paschini, E., Puletti, M., Scarcella, G., Spagnolo, A., 2005. Methods 20
of assessing the ecological impact of gas platforms in the Adriatic Sea: two different 21
scenarios. Congreso International de Ciencia y Tecnologia Marina, Madrid. 22
Falco, P., Griffa, A., Poulain, P., Zambianchi, E., 2000. Transport properties in the Adriatic 23
Sea as deduced from drifter data. Journal of Physical Oceanography, 30, 2055-2071. 24

ACCEPTED MANUSCRIPT
23
Ferrari, L. A., Giannuzzi, L., 2005. Clinical parameters, postmortem analysis and 1
estimation of lethal dose in victims of a massive intoxication with diethylene glycol. Forensic 2
Science International, 153, 45-51. 3
Frick, W. E., Baumgartner, D. J., Davis, L. R., Lung, W.-S., Roberts, P. J. W., 2000. 4
Modeling consistency, model quality, and fostering continued improvement. Int'l Conference 5
Marine Waste Water Discharges, Genoa, Italy. 6
Frick, W. E., Roberts, P. J. W., Davis, L. R., Keyes, J., Baumgartner, D. J., George, K. P., 7
2002. Dilution models for effluent discharges, 4th Edition, Visual Plumes. Ecosystems 8
Research Div., NERL,U.S. EPA, EPA/600/R-03/025, Athens, GA. 9
Frick, W. E., 2004. Visual Plumes mixing zone modeling software. Environmental 10
Modelling & Software, 19, 645–654. 11
Galos, C., 2000. DADB Dartmouth Adriatic Sea DataBase - Seasonal Temperature, 12
Salinity and Density Anomaly. Dartmouth College. 13
http://www.epa.gov/ceampubl/swater/vplume. 14
Grant, A., Briggs, D., 2002. Toxicity of sediments from around a North Sea oil platform: 15
are metals or hydrocarbons responsible for ecological impacts. Marine Environmental 16
Research, 53, 95-116. 17
Gust, G., Weatherly, G. L., 1985. Velocities, turbulence, and skin friction in a deep-sea 18
logarithmic layer. Journal of Geophysical Research, 90, 4779-4792. 19
Henderson, B., Grigson, S. J. W., Johnson, P., Roddie, B. D., 1999. Potential impact of 20
production chemical on the toxicity of produced water discharges from North Sea oil 21
platforms. Marine Pollution Bulletin, 38, 1141-1151. 22
ICRAM, Aprile 2002. Relazioni primo anno di attività di monitoraggio. CD-ROM ICRAM 23
Central Institute for Applied Marine Research. Roma, Italy. 24

ACCEPTED MANUSCRIPT
24
ICRAM, Luglio 2003. Relazioni secondo anno di attività di monitoraggio. CD-ROM 1
ICRAM Central Institute for Applied Marine Research. Roma, Italy. 2
ICRAM, Settembre 2004. Relazioni terzo anno di attività di monitoraggio. CD-ROM 3
ICRAM Central Institute for Applied Marine Research. Roma, Italy. 4
ICRAM, 2006. Monitoraggio sperimentale integrativo per lo studio degli effetti potenziali 5
a seguito dello sversamento in mare delle acque di strato da piattaforme off-shore. ICRAM 6
Central Institute for Applied Marine Research, Rome, Italy. 7
Jirka, G. H., Bleninger, T., Burrows, R., Larsen, T., 2004. Environmental Quality 8
Standards in the EC-Water Framework Directive: Consequences for Water Pollution Control 9
for Point Sources. E-WAter Electronic Journal of the European Water Association (EWA), 1, 10
1-20. 11
Larsen, T., 2000. Necessity of Initial Dilution for Sea Outfall Diffusers in Respect to the 12
European Directive on Municipal Discharges. International Conference on Marine Waste 13
Water Discharges, Genova , Italy. 14
Maggi, C., Trabucco, B., Mannozz, i. M., Di Mento, R., Gabellini, M., Manfra, L., Nonnis, 15
O., Virno Lamberti, C., Cicero, A. M., 2007. A methodological approach to study the 16
environmental impact of oil and gas offshore platforms. Rapp. Comm. int. Mer Médit., 38, 17
Monaco. 18
Manfra, L., 2006, Dispersione in mare delle acque di produzione e valutazione 19
ecotossicologica degli effetti indotti, Ph.D. Thesis. Università degli Studi di Napoli Federico 20
II, Napoli, Italy. 21
Manfra, L., Moltedo, G., Virno Lamberti, C., Maggi, C., Finoia, M. G., Gabellini, M., 22
Giuliani, S., Onorati, F., Di Mento, R., Cicero, A. M., 2007. Metal content and toxicity of 23
produced formation water (PFW): study of the possible effects of the discharge on marine 24
environment. Archives of Environmental Contamination and Toxicology, 53, 183 –190. 25

ACCEPTED MANUSCRIPT
25
Nakata, K., 1981. Observation of the bottom boundary layer on the continental shelf. 1
Journal of Oceanography, 37, 94-98. 2
Nedwed, T. J., Smith, J. P., Brandsma, M. G., 2004. Verification of the OOC mud and 3
produced water discharge model using lab-scale plume behaviour experiments. 4
Environmental Modeling & Software, 19, 655-670. 5
Neff, J. M., 2002. Bioaccumulation in Marine Organisms. Effects of Contaminants from 6
Oil Well Produced Water (pp. 452). Amsterdam: Elsevier Science. 7
Neff, J. M., Johnsen, S., Frost, T. K., Utvik, T. I. R., Durell, G. S., 2006. Oil well produced 8
water discharges to the North Sea. Part II: Comparison of deployed mussels (Mytilus edulis) 9
and the DREAM model to predict ecological risk. Marine Environmental Research, 62, 224–10
246. 11
Osenberg, C. W., Schmitt, R. J., Holbrook, S. J., Canestro, D., 1992. Spatial scale of 12
ecological effects associated with an open coast discharge of produced water. In J. P. Ray and 13
F. R. Engelhart, Produced Water Technological/Environmental Issues and Solutions (pp. 387-14
402). New York: Plenum Press. 15
Petrenko, A. A., Jones, B. H., Dickey, T. D., 1998. Shape and near-Þeld dilution of the 16
Sand Island sewage plume observations compared to model results. Journal of Hydraulic 17
Engineering, 124, 565-571. 18
Reemtsma, T., 2001. The use of liquid chromatography-atmospheric pressure ionization-19
mass spectrometry in water analysis - Part II: Obstacles. Trends in Analytical Chemistry, 20, 20
533-542. 21
Roberts, P. J. W., 1996. Sea Outfalls. In P. Vijay Singh and H. Willi Hager, Environmental 22
Hydraulics (pp. 436). The Netherlands: Kluwer Academic Publishers. 23
Roberts, P. J. W., Tian, X., 2004. New Experimental Techniques for Validation of Marine 24
Discharge Models. Environmental Modeling & Software, 19, 691-699. 25
ACCEPTED MANUSCRIPT
26
Roldão, J., Pecly, J., Valentini, E., Leal, L., 1998. Evaluation of sewage outfalls by using 1
tracer techniques combined with oceanographic measurements. In C. A. BREBBIA, 2
Environmental Coastal Regions (pp. 456). United Kingdom: Wessex Institute of Technology 3
Press. 4
Sabeur, Z. A., Tyler, A. O., 2004. Validation and application of the PROTEUS model for 5
the physical dispersion, geochemistry and biological impacts of produced waters. 6
Environmental Modelling and Software, 19, 717-726. 7
Smith, J. P., Brandsma, M. G., Nedwed, T. J., 2004. Field verification of the Offshore 8
Operators Committee (OOC) Mud and Produced Water Discharge Model. Environmental 9
Modelling & Software, 19, 739–749. 10
Trabucco, B., Cicero, A. M., Gabellini, M., Virno Lamberti, C., Di Mento, R., Bacci, T., 11
Moltedo, G., Tommassetti, P., Panfili, M., Marusso, V., Cornello, M., 2006. Study of the soft 12
bottom macrozoobenthic community around an offshore platform central Adriatic sea. 13
Biologia Marina Mediterranea, 13, 659-662. 14
Ursella, L., Gacic, M., 2001. Use of the Acoustic Doppler Current Profiler (ADCP) in the 15
study of the circulation of the Adriatic Sea. Annales Geophysicae, 19, 1183-1193. 16
USEPA, 2003. Visual Plumes CD, CD. Center for Exposure Assessment Modeling, 17
Ecosystems Research Division, Athens, GA. 18
Washburn, L., Stone, S., MacIntyre, S., 1999. Dispersion of produced water in a coastal 19
environment and its biological implications. Continental Shelf Research, 19, 57-78. 20
Weyerhaeuser Company, 2005. Water-Base Flexographic Ink, Material Safety Data Sheet 21
MSDS. Number 135 - WC 379-01, 22
Winiarski, L. D., Frick, W. E., 1976. Cooling tower plume model.USEPA Ecological 23
Research Series. USEPA, EPA-600/3-76-100, Corvallis,Oregon. 24
ACCEPTED MANUSCRIPT
27
Wu, Y., Washburn, L., Jones, B. H., 1994. Buoyant plume dispersion in a coastal 1
environment: Evolving plume structure and dynamics. Continental Shelf Research, 14, 1001-2
1023. 3
4
ACCEPTED MANUSCRIPT
28
Figure captions 1
2
Figure 1 – Adriatic Sea: surface velocity fields as deduced by Lagrangian Drifters (adapted 3
from Falco et al., 2000) and platform positions. 4
Figure 2 – DEG concentrations observed at the sea surface at increasing distances from the 5
three platforms. 6
Figure 3 – a. Summer and winter density profiles close to Platform 1. b. Plume vertical 7
section vs. horizontal distance from the discharge location in summer and winter conditions. 8
The path of the plume is described by means of its centerline (cln) and boundaries (bnd). 9
Figure 4 - Profiles of DEG concentrations detected along the water column at 25 m from 10
Platforms 2 and 3. 11
Figure 5 – a. Summer and winter density profiles close to Platform 2. b. Plume vertical 12
section vs horizontal distance from discharge location in summer and winter conditions. The 13
path of the plume is described by means of its centerline (cln) and boundaries (bnd). 14
Figure 6 – a. Summer and winter density profiles close to Platform 3. b. Plume vertical 15
section vs. horizontal distance from discharge location in summer and winter conditions. The 16
path of the plume is described by means of its centerline (cln) and boundaries (bnd). 17

ACCEPTED MANUSCRIPT
29
1 Table I 2 Field data and input model values 3
Platform Distance
from the coast
Average effluent
flow
Port diameter
Water column depth
Diffuser Depth
Sampling distances
from diffuser
Sampling depths
Surface current speed
Effluent salinity
Effluent temperature
Initial DEG conc.
(Km) (l d-1) (m) (m) (m) (m) (m) (cm s-1) (g kg-1) (°C) (µµµµg l-1)
1 36 27400 0.45 116 3* 0,5,10,15,20,25 - 17 35 23 2040 2 15 11000 0.45 18 9 0,5,10,15,20,25 0,4,8,12 3 37.6 20 9600 3 21 8200 0.45 23 12 0,5,10,15,20,25 0,4,8,12,16 4 35.2 20.5 13000
* Outfall located above sea surface 4 5 6 7 8 9 10 11 12 13 14 15 16 17 18 19 20 21 22 23 24 25 26

ACCEPTED MANUSCRIPT
30
1 2 Table II 3 Output model values 4
Platform Length of
initial mixing zone
Trap level depth
Plume thickness
Froude number
Effluent density
Ambient density
N Frequency
Depth Max
rise/fall
Near field dilution
Sa
Initial Dilution
time
(m) (m) (m) (σσσσt) (σσσσt) (rad s-1) (m) (s) Summer DEG
1 15.0 Surface 0.5 0.16 23.95 25.75 0.0758 surface 175 90 2 2.3 9.8 1.4 0. 66 26.73 24.80 0.3380 10.0 55 70 3 14.8 11.5 1.3 0.15 24.80 25.02 0.3326 11.3 74 400
Winter PFW
1 10.0 Surface 1.2 0.09 23.95 29.00 0.0919 surface 170 60 2 6.8 7.8 1.7 0.06 26.73 27.78 0.1539 7.5 135 185 3 6.7 10.8 2.2 0.03 24.80 26.50 0.2323 10.5 200 150
5

ACCEPTED MANUSCRIPT
31
1 2 3
4 5 6
Longitude (E)
Latit
ude
(N)
Longitude (E)
Latit
ude
(N)
7 8
Fig. 1 9 10 11 12 13 14 15 16
17 18
19 20 21

ACCEPTED MANUSCRIPT
32
1 2 3 4 5 6 7 8 9
0 5 10 15 20 250
500
1000
1500
2000
2500
3000
horizontal surface distance from the source (m)
obse
rved
DE
G c
once
ntra
tions
Platform 1Platform 2Platform 3
10 Fig. 2 11 12 13 14 15 16 17 18 19 20 21 22 23 24 25
26 27
28
( µ������
ACCEPTED MANUSCRIPT
33
1 2 3
23 24 25 26 27 28 29 3020
18
16
14
12
10
8
6
4
2
0
density
dept
h (m
)summerwinter
Platform 1
4 Fig. 3a 5
(σ��

ACCEPTED MANUSCRIPT
34
0 2 4 6 8 10 12 14 16 188
7
6
5
4
3
2
1
0
horizontal distance from the source (m)
dept
h (m
)
cln summerbnd summercln winterbnd winter
Platform 1
1 Fig. 3b 2
3 4 5 6 7 8 9
ACCEPTED MANUSCRIPT
35
0 500 1000 1500 2000 2500 3000 3500 4000 4500 5000
16
14
12
10
8
6
4
2
0
DEG concentrations at 25 m from the source
dept
h (
m)
Platform 2Platform 3
1 Fig. 4 2
3 4 5 6 7 8 9 10 11 12 13 14 15 16 17 18 19 20
21 22
23
(µ������

ACCEPTED MANUSCRIPT
36
23 24 25 26 27 28 29 3020
18
16
14
12
10
8
6
4
2
0
density
dept
h (m
)
summerwinter
Platform 2
1 Fig. 5a 2
0 1 2 3 4 5 6 7 8 9 1013
12
11
10
9
8
7
6
5
horizontal distance from the source (m)
dept
h (m
)
cln summerbnd summercln winterbnd winter
Platform 2
3 Fig. 5b 4
(σ��

ACCEPTED MANUSCRIPT
37
23 24 25 26 27 28 29 3020
18
16
14
12
10
8
6
4
2
0
density
dept
h (m
)
summerwinter
Platform 3
1 Fig. 6a 2
0 2 4 6 8 10 12 14 16 1815
14
13
12
11
10
9
8
7
horizontal distance from the source (m)
dept
h (m
)
cln summerbnd summercln winterbnd winter
Platform 3
3 Fig. 6b 4
(σ��
Related Documents