NBER WORKING PAPER SERIES WHAT IS SOCIAL CAPITAL? THE DETERMINANTS OF TRUST AND TRUSTWORTHINESS Edward L. Glaeser David Laibson Jose A. Scheinkman Christine L. Soutter Working Paper 7216 http://www.nber.org/papers/w7216 NATIONAL BUREAU OF ECONOMIC RESEARCH 1050 Massachusetts Avenue Cambridge, MA 02138 July 1999 The MacArthur Foundation has generously funded this research which is part of the MacArthur Foundation Network on Norms and Preferences. Glaeser and Laibson also thank the National Science Foundation and the Sloan Foundation. David Cutler, Lawrence Katz, George Loewenstein, Andrei Shleifer, and Steve Tadelis provided helpful comments. Meghana Bhatt, Lars Nesheim, and Joseph Robbins provided excellent research assistance. All opinions expressed are those of the authors and not those of the National Bureau of Economic Research. © 1999 by Edward L. Glaeser, David Laibson, Jose A. Scheinkman, and Christine L. Soutter. All rights reserved. Short sections of text, not to exceed two paragraphs, may be quoted without explicit permission provided that full credit, including © notice, is given to the source.

Welcome message from author
This document is posted to help you gain knowledge. Please leave a comment to let me know what you think about it! Share it to your friends and learn new things together.
Transcript
NBER WORKING PAPER SERIES
WHAT IS SOCIAL CAPITAL?THE DETERMINANTS OF TRUST
AND TRUSTWORTHINESS
Edward L. GlaeserDavid Laibson
Jose A. ScheinkmanChristine L. Soutter
Working Paper 7216http://www.nber.org/papers/w7216
NATIONAL BUREAU OF ECONOMIC RESEARCH1050 Massachusetts Avenue
Cambridge, MA 02138July 1999
The MacArthur Foundation has generously funded this research which is part of the MacArthur FoundationNetwork on Norms and Preferences. Glaeser and Laibson also thank the National Science Foundation and theSloan Foundation. David Cutler, Lawrence Katz, George Loewenstein, Andrei Shleifer, and Steve Tadelisprovided helpful comments. Meghana Bhatt, Lars Nesheim, and Joseph Robbins provided excellent researchassistance. All opinions expressed are those of the authors and not those of the National Bureau of EconomicResearch.
© 1999 by Edward L. Glaeser, David Laibson, Jose A. Scheinkman, and Christine L. Soutter. All rightsreserved. Short sections of text, not to exceed two paragraphs, may be quoted without explicit permissionprovided that full credit, including © notice, is given to the source.

What is Social Capital? The Determinants of Trust and TrustworthinessEdward L. Glaeser, David Laibson,Jose A. Scheinkman, and Christine L. SoutterNBER Working Paper No. 7216July 1999JEL No. C9, D7, J7
ABSTRACT
Using a sample of Harvard undergraduates, we analyze trust and social capital in two
experiments. Trusting behavior and trustworthiness rise with social connection; differences in race
and nationality reduce the level of trustworthiness. Certain individuals appear to be persistently more
trusting, but these people do not say they are more trusting in surveys. Survey questions about trust
predict trustworthiness not trust. Only children are less trustworthy. People behave in a more
trustworthy manner towards higher status individuals, and therefore status increases earnings in the
experiment. As such, high status persons can be said to have more social capital.
Edward L. Glaeser David LaibsonDepartment of Economics Department of Economics327 Littauer Center Littauer M-14Harvard University Harvard UniversityCambridge, MA 02138 Cambridge, MA 02138and NBER and [email protected] [email protected]
Jose A. Scheinkman Christine L. SoutterDepartment of Economics 2687 Harvard Yard Mail CenterThe University of Chicago Harvard University1126 East 59th Street Cambridge, MA 02138Chicago, Illinois 60637 [email protected]@uchicago.edu
I. Introduction
Following Jacobs (1961), Loury (1977), Coleman (1990), and Putnam (1993), researchershave argued that "social capital" — which is often measured with questions about the level
of trust— influences a wide range of significant economic and political phenomena.Arrow (1972) and Fukuyama (1995) suggest that the level of trust in a society strongly
influences its economic success. Knack and Keefer (1997) show that a one-standarddeviation increase in a measure of country-level trust increases economic growth by morethan one-half of a standard deviation. Putnam (1993) uses Italian cross-regional data toshow that local governments are more efficient where there is greater civic engagement.
LaPorta, Lopez-de-Silaries, Shleifer and Vishny (1997) find that across countries, a one-standard deviation increase in the same measure of trust increasesjudicial efficiency by0.7 of a standard deviation and reduces government corruption by 0.3 of a standarddeviation.
Usually social capital is described as a community level attribute.1 Jacobs (1961) definessocial capital as "neighborhood networks." According to Putnam (1995), social capital
represents "features of social life—networks, norms, and trust—that enable participantsto act together more effectively to pursue shared objectives." The theory and empiricalwork on social capital generally focus on community-level aggregates and downplayindividual heterogeneity. Social capital is seen as a feature of the group, not the person.
However, even group-level social capital must be a function of individual-level actionsand attributes. Networks are not merely the result of historicalaccident, they come about
as individuals spend time and energy to connect with others.2 If economists are going tounderstand social capital, then we must start with an analysis of the decision-makers who
actually invest in social connection. A micro-approach to social capital might sensibly
Individual-oriented definitions of social capital do exist. Loury (1979) thought social capital captured"the consequences of social position in facilitating acquisition of the standard human capitalcharacteristics." Shleifer and Summers (1988) emphasize individual heterogeneity in trustworthiness andargue that firms promote managers who are known to be innately trustworthy (i.e. there is an economicreturn to one particular form of social capital).2 DiPasquale and Glaeser (1999) focus on the factors that influence the incentives to invest in social capital.
2
begin with an individual-based definition of the concept: an individual's social capital is
that individual's social characteristics—including charisma, status and access tonetworks—that enable that person to extract private returns from interactions with
others.3 The social capital of a set of individuals is the aggregate of those individuals'
social capital that takes into account all externalities across the members of the set.4
This paper makes the case for an individual-oriented approach to social capital in three
ways. First, we document the existence of stable, individual heterogeneity in social
capital, trust (trust is defined as the commitment of resources to an activity where the
outcome depends upon the cooperative behavior of others), and trustworthiness
(trustworthiness is defined as behavior that increases the returns to people who trust you).
Without significant individual heterogeneity, there would be little reason to eschew grouplevel analysis for individual-based analysis. Second, we show that a simplemicroeconomic model provides comparative statics that are generally vindicated in a
simple experiment involving trust. Third, we show that private returns to social capital
variables appear (at least in our particular case) to be quite different than social returns to
the same variables. Since investment in social capital is presumably driven by private,not public, returns, this finding means that understanding investment in social capital
cannot be done with an approach that only thinks about public returns to social capital.
Much of the social capital research relies upon survey questions such as "Generally
speaking would you say that most people can be trusted or that you can't be too careful?"
While these survey questions are interesting, they are also vague, abstract and hard to
interpret. Putnam (1995), for example, laments this problem: "Since trust is so central to
the theory of social capital, it would be desirable to have strong behavioral indicators of
trends in social trust or misanthropy. I have discovered no such behavioral measures."
In this paper, we observe trust and trustworthiness in experiments involving monetaryrewards. To test whether social capital is a stable individual-level characteristic, we
3 . .. . . . . . ..As such, individual social capital is determined both by individual level characteristics (e.g. personalskills) and group level characteristics (e.g. community cohesion).
3
examine whether survey questions and background characteristics predict trust,trustworthiness and the ability to extract resources from a trust game (this ability is socialcapital in this setting).
We first survey 258 Harvard undergraduates and then a subpopulation of 196
undergraduates plays two trust games. The limited size and unusual nature of our subject
population naturally means that there may be limits to the general applicability of our
results. First, individuals are paired and meet their partner. Then they are separated and
one member of the pair (the sender) has the opportunity to send between 0 and 15 dollars
to his or her partner (the recipient).5 The experimenter matches each dollar that is sent.
After the second player receives the transfer and the matching amount, he or she maysend money back to the first player.6 This stylized game (based on Berg, Dickhaut and
McCabe, 1995) is similar to many economically relevant settings such as investment with
imperfect contracts or producing a public good. In our second game, subjects report their
willingness to pay for an envelope containing 10 dollars that is addressed to them and
dropped in several different public places (e.g. Harvard Square) under various conditions
(e.g. sealed and stamped).
Overview of Results: The degree of social connection between the sender and recipient—the number of friends they have in common, being members of the same race ornationality and the duration of their acquaintanceship—generally predict the level of trust
and trustworthiness in the two-person trust game. These results might mean that higher
probabilities of repeated play in dense social network facilitate trust (as in Abreu, 1988,
Greif, 1993) or that inter-personal altruism supports trust. These results vindicate the
importance ofjoint group membership for creating social capital.
" This aggregation is complex and characteristics that increase an individual's social capital may actuallyreduce the social capital of the group. For example, a particularly slick car salesman may have plenty ofindividual social capital but he is likely to reduce the social capital ofany group that he joins.
One-half of the sample of trustees (essentially chosen randomly) were given the opportunity to promise toreturn at least as much money as they were sent by the trustor.' All of the rules of the game are common knowledge.
Fershtman and Gneezy (1998) also use a variant of this game to examine trust is Israel and finda similarresult. They document the importance of group membership by showing that males (notfemales) are lesstrusting of Sephardic males. In their version of the game, players do not meet one another and theyare leftto deduce ethnic background from their opponents' last name.
4

We also find that individual characteristics predict trust, trustworthiness and social
capital. While most survey questions about trust do not predict trust in eithergame, two
relatively precise questions about trusting strangers do predict trust in the envelopedropgame and in the two-person trust game when the subjects are indeed strangers. Measures
of trusting behavior are better predictors of the individual's level of trust than abstract
survey questions; an index of past trusting behavior has a 22.4 percent correlation
coefficient with the amount sent in the trust game (significant at the 5percent level). The
connection between trust in the envelope drop experiment and trust in the two-persontrust game is almost significant at the 10 percent level. There appear to be stableindividual specific characteristics that influence trust.
There are also stable, individual measures that predict trustworthiness. The basic survey
questions about how much you trust others, surprisingly, predict the extent to which youyourself should be trusted. An index of an individual's response to General Social
Survey (GSS) attitudinal questions about others being trustworthy, fair and helpful has a34 percent correlation with the amount ofmoney that the individual himself gives back
(significant at the 0.1 percent level).8 While trust survey questions are bad at predictingany individual's level of trust, they may be good at predicting the overall level oftrustworthiness in society.
Subjects who are only children are less trustworthy in our experiment than subjects with
siblings. The average respondent with siblings returns 98 percent of the amount sentover
(49 percent of the doubled amount). The average only child returns 46 percent of theamount sent over.
8 The lack of correlation between trusting behaviors and self-reported measures of trust is consistent with awide range of failures of attitudes to predict behavior in the social psychological literature (for a review,see Ajzen and Fishbein, 1977). LaPierre (1934) finds that the self-reports willingness of restaurant ormotel owners to cross racial barriers and serve minority clientele is not correlated with later behaviors toactual minorities. McClelland, Koestner and Weinberger (1989) find no correlation between self-reportedmotivation to achieve and achievement-enhancing behavior. They explain this phenomenonby arguingthat self-reported motivation reflects expectations about society as a whole, not any individual attribute.Banaji and Greenwald (1994) have begun a growing trend toward use of implicit cognitive measures todetermine unconscious values that do predict behavior rather than stated beliefs, which often do not.
5
Background characteristics capturing the level of status and organization membership—variables meant to proxy for an individual's own social capital--only weakly predict thelevel of trust, but strongly predict the amount ofmoney that senders receive back from
recipients. As a result, these measures of social status positively predict financial returnsfor subjects in the game who start in the sender position. People with better educated
parents, students who work fewer hours for pay, individuals with more friends, and
members of volunteer organizations all earn more money in the experiment.
We interpret these facts as meaning that, at least in this particular social setting,individual variables meant to capture social capital really do produce individual financial
returns, just as one would expect of any form of "capital". However, these social capitalvariables do not enhance everyone's welfare (at least not in this game). People who areplaying against these high status subjects end up with less earnings from the game. Thissuggests that aggregation of social capital variables may be much more difficult than
aggregation of physical or human capital—some types of individual social capitalproduce negative externalities.
II. Discussion and Analysis of the Game
This section discusses the connections between trust, trustworthiness and social capital,
and we start with the determinants of trust.9 People differ in theirwillingness trust others
because of three factors: (1) different beliefs about the trustworthiness of others,
controlling for situational variation, (2) different preferences about giving to others and
(3) different abilities to elicit trustworthy behavior from others.o Beliefs, altruisticpreferences and the ability to elicit trustworthiness may all depend on both individual and
group characteristics. To test for the presence of stable, individual heterogeneity, we
examine different measures of trust: (1) the GSS survey question, (2) past trusting
Social capital may exist in situations without trust. For example, Ball, Eckel, Grossman and Zame (1998)document that arbitrarily assigned status increases the economic returns to subjects in a classic marketsetting with no scope for trust or trustworthiness.10 We will not consider the extent to which trust in this game is driven by risk tolerance (which is possible).
6

behavior, (3) the level of trust in the two-person trust game and (4) the level of trust in
the envelope drop. All four measures are different and not every factor will influence
every measure. For example, trust in the envelope drop game will be a function of beliefs
and preferences towards giving but will not depend on theability to elicit trustworthiness.
One test of individual heterogeneity is to examine the correlation between these different
measures of trust. A second test is to see whether individual variation in beliefs, altruistic
preferences and the ability to punish can explain differences across individuals in the
levels of trust. We will spend little time examining differences in beliefs, as most
standard economic models have difficulty explaining why these differences in beliefs
could persist across people, We will examine the connection between trust and measures
of altruism. Most importantly, in the two-person trust game, we will examine whether
trust is related to different abilities to elicit trustworthy behavior from others.
To understand the determinants of trustworthy behavior and its connection with trust, we
now formally analyze the game that will be used in our experiments. In the first round of
the game, the sender gives an amount S (the level of trust) between 0 and S (in our
experiment S equals $15). The experiment matches this amount so that the recipientreceives a total of where 0>1 (in our experiment In the second period, the
recipient may return some money to the sender and we denote this sum as R, whereo � R � S. This structure is representative of a large range of trust situations, where
one person puts resources into the care of another person who might decide to keepeverything for himself.
In general, trustworthiness is the product of a calculation where the benefits of short-run
financial gain are outweighed by psychic costs from cheating and long run penalties
imposed on cheaters. To capture the possible role of long-run penalties and rewards due
to repeated play, we assume that after the game (when we no longer observe thesubjects), the subjects meet again with probability 8. This continuation payoff to one
player, say "player 1," depends on the extent to which the other player, 'j," wants topunish or reward i, which is determined by player j 's altruism toward player i:
7
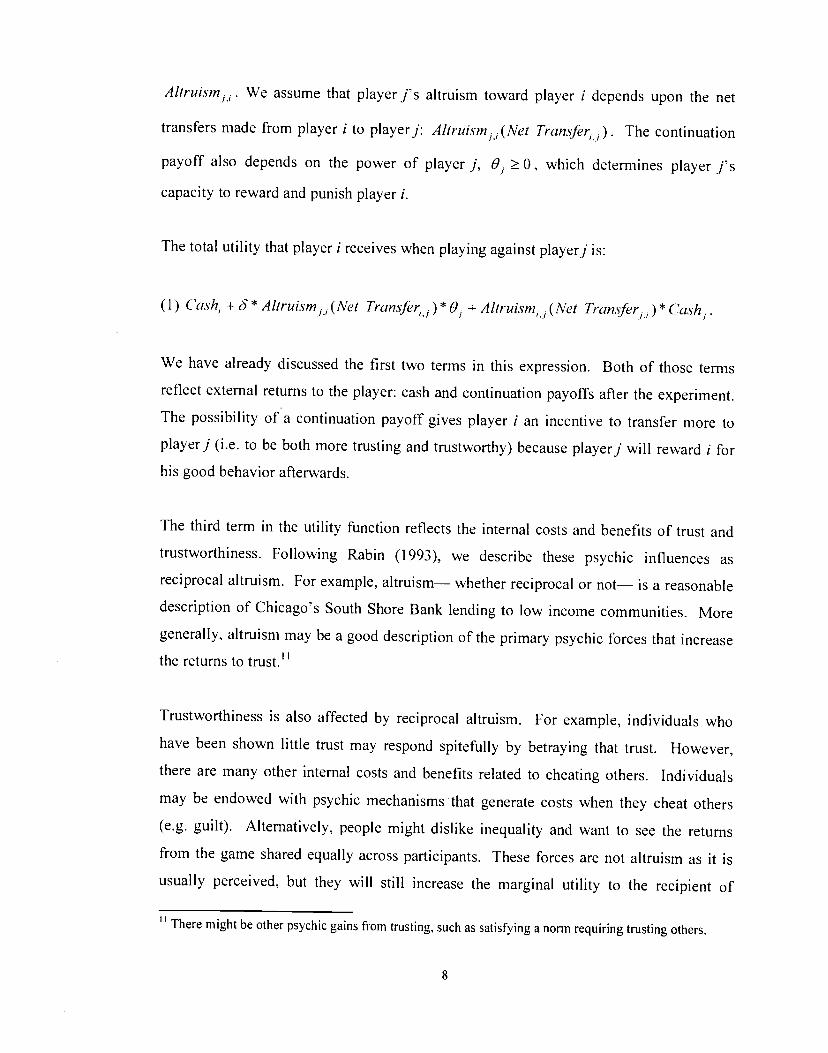
Altruism,1. We assume that playerj's altruism toward player i depends upon the net
transfers made from player ito player]: Altruism,(Nei Transfer,,). The continuation
payoff also depends on the power of player], 8, � 0, which determines player i's
capacity to reward and punish player 1.
The total utility that player i receives when playing against player] is:
(1) Cash, + 8 *Altruism,,(Net Transfer,,)* 0, + Allruism,,(Net Tran.sfer,,)* Cash,.
We have already discussed the first two terms in this expression. Both of those terms
reflect external returns to the player: cash and continuation payoffs after the experiment.
The possibility of a continuation payoff gives player i an incentive to transfer more to
player] (i.e. to be both more trusting and trustworthy) because player] will reward I for
his good behavior afterwards.
The third term in the utility function reflects the internal costs and benefits of trust and
trustworthiness. Following Rabin (1993), we describe these psychic influences as
reciprocal altruism. For example, altruism— whether reciprocal or not— is a reasonable
description of Chicago's South Shore Bank lending to low income communities. More
generally, altruism may be a good description of the primary psychic forces that increasethe returns to trust.
Trustworthiness is also affected by reciprocal altruism. For example, individuals who
have been shown little trust may respond spitefully by betraying that trust. However,
there are many other internal costs and benefits related to cheating others. Individuals
may be endowed with psychic mechanisms that generate costs when they cheat others
(e.g. guilt). Alternatively, people might dislike inequality and want to see the returns
from the game shared equally across participants. These forces are not altruism as it is
usually perceived, but they will still increase the marginal utility to the recipient of
There might be other psychic gains from trusting, such as satisfying a norm requiring trusting others.
8
returning money to the sender. Furthermore, it is likely that this desire to transfer will be
higher if the sender behaved generously initially. As such, our algebra, as long as it is
interpreted broadly enough, captures a wide range of psychic mechanisms.
Formally, altruism will be Altruism,, (Net Transfer11) = a. + K + a(Net Transftr11),where a() is increasing and concave, and the altruism of the sender lies between 0 and1.12 The altruism from person i to person j contains two constant terms: a., which
reflects the generosity of person i, and Ic, that reflects the charisma and attractiveness of
person j (perhaps one measure of person j's social capital). When person i is the
recipient/trustee, then a. might also reflect any internal distaste for cheating.
The amount of trustworthiness (i.e. the amount that the recipient returns) is found so that
the marginal cost of returning a dollar is equal to the marginal benefits from altruism (or
fairness) (ar(.,p,e,j, + 'sender + a(S)) plus the marginal benefits from avoiding punishment
after the experiment, &i'(R —S)OS,,I(Ier. Holding the amount sent constant, the amount
returned will be rising with the (1) charisma of the sender, (2) thepower of the sender to
punish and reward, (3) the altruism of the recipient (which can also be interpreted as the
psychic costs of cheating), and (4) the probability of the two individuals meetingagain.
Empirically, we will have difficulty distinguishing between effects (1) and (2). We will
test them together by using measures of the social status and general sociability or thesender. We will also have difficulty differentiating between effects (3) and (4). Thelength of the friendship, the number of friends the sender and recipient have incommon,
and differences in race or nationality might be proxies for either effect. As long as the
amount returned is strictly positive, the amount returned increases more than one-for-one
with amount sent, i.e. dR/dS>1, which is also an implication thatwe will examine.13
2 There are certainly some circumstances where altruism is greater than one, but we believe that it wouldbe unusual for two undergraduates to prefer dollar-for-dollar transfers to other undergraduates. There arealso circumstances where altruism is negative (i.e. spite exists). Ruling outnegative altruism is sufficient,but not necessary for most of our results.
This result stems from our assumption that net transfers drive reciprocal altruism, and isnot general. Theother comparative statics are much more robust across permutations of the model.
9

In the first period, the sender chooses the amount to send (i.e. the level oftrust) formingan expectation of the amount that will be returned. The financial returns from trustingmay be either positive or negative. The other returns from trusting including the benefit
of pleasing the other person, which produces both psychic rewards from altruism and apayoff from the other player after the experiment is over. These returns are alwayspositive. Since dR/dS>1, as long as S>O and R>O, then marginal increases S willalwaysincrease financial returns and increasing S always makes sense. Thus the sender either
gives nothing, or gives something and expects nothing back or gives everything (i.e.S = S). Using this logic, in the appendix we prove:
Proposition 1: Both S and R rise weakly with 60/?,pw,,/ . , '
and K
Thus trust is predicted to increase with the probability of repeated contact, the power of
the sender to enforce trustworthy behavior, the extent to which the sender inspires morealtruism from the recipient, and the generosity of the recipient. These effects willincrease the direct financial returns from trust, because they increase the trustworthinessof the recipient. We will test these hypotheses empirically by looking for effects of thestatus of the sender and social connection between the sender and the recipient. We will
also look at measures of general altruism to test the implication regarding
Trust is also predicted to increase with the attractiveness and power of the recipient.These effects raise the non-financial rewards from trusting behavior, and when theseforces are strong, senders will be willing to trusteven when trusting is an activity with a
negative expected dollar payoff If the ability to punish the recipient actually declined
with °'d/)1t'?:l which it might, then these comparative statics could be reversed. As such,we will put less stock in these implications.
I0
Comparative statics on the total returns from the experiment are also straightforward
when returns are defined in, unfortunately unobservable, utility terms. Senders with
higher values of and O.,,,er—our key private, social capital variables-- will receive
higher levels of utility from the experiment. For many regions of parameter values, these
variables will also increase financial payoffs, but that will not always be true. In someinstances, individuals with more social capital will use that social capital to satisfy their
altruism and to generate goodwill, which will generate returns in the continuation game.As such, higher social capital may be associated with lower financial returns from the
game but greater overall returns. We will empirically test whether financial returns in the
game are higher for senders who come from a more successful family background or who
appear to be more charismatic or who are more socially connected.'4
III. Basic Facts from the Trust Surveys
In this section, we revisit some of the basic findings that are by now well known in the
literature on trust and social capital. As described earlier the basic dependent variable is
the answer given by respondents to the question: "Generally speaking, would you say that
most people can be trusted or that you can't be too careful in dealing with people?"While the abstraction of this question makes interpretation difficult, we interpret thisquestion to ask about individual's expectations of trustworthiness averagedover a rangeof situations. As discussed above, variation in answers to this question might occurbecause of differences in beliefs about the trustworthiness ofa common set of people or
because some people are better at eliciting trustworthy behavior from others.'5
Table I gives mean answers to this question in the National Opinion Research Center's
General Social Survey (the GSS). This survey is the primary source for U.S. evidence on
trust. Since its inception in 1972, the survey has been administered 20 times to a sample
4We focus on financial returns for senders rather than recipients because for senders, payoffs in the
experiment (which are primarily determined by inducing trustworthiness) are Ukely to be positivelycorrelated with payoffs after the experiment. However, as recipients who do well are those who cheat thesenders, the model predicts them to do poorly after the experiment.
Ii
of between one and two thousand respondents. The sample of questions asked changes
from survey to survey, but the trust question has been asked almost continuously.Definitions of variables appear in Appendix II. The last two rows compare the samplethat we will use for our trust experiment with the GSS sample. The responses of ourHarvard subjects closely resemble the responses of GSS subjects. particularly when wefocus on the GSS subjects who are young and college educated.
The first regression of Table 2 presents our benchmark results, where we run probitregressions to estimate how different characteristics explain trust and report the marginaleffects of the variables. Trust is much lower for later cohorts. Thegap in the level oftrust between individuals who were born before 1914 and those who are born after 1959
is 30.4 percent.' Supporting the prediction of the model that higher status persons arebetter at eliciting trustworthiness, trust is much higher among richer and well-educated
individuals. College graduates are more than 35 percent more likely to answer yes to the
trust question than high school dropouts. Blacks are 27 percent less likely to say thatthey are trusting than whites.'7 Men are slightly more trusting. Married persons are also
more trusting. City size has a slightly negative effect on the amount of trust.
Most of these results have multiple interpretations that emphasize both group-level social
capital and individual-level social capital. For example, the positive effect of education
on trust might be the result of groups of more educated people being more trustworthy.
Alternatively, education might create individual social capital by raising social skillsor
because high status increases the ability to reward andpunish others.
Regression (2) repeats regression (11) using membership in non-professionalorganizations—a measure of observable, social behavior-- as the dependent variable.
The correlation of this variable with the trust measure is high, and many of the same
15Variation in the answer to this question might also occur because there is heterogeneity in the definition
of "most people." It seems unlikely that differences in altruism, as discussed above, will drive answers tothis question (although certainly altruistic attitudes might correlate with this answers to this question).'' We cannot separately identify age, cohort and time effects, due to multicollinearity. We identify age andcohort effects by assuming away time effects.7 The
gap between the race diminishes in states where blacks are less of a minority.
12
patterns hold for this variable. For example, the basic cohort, education and income
effects remain. There are only two real differences with the trust question. The sign onrace flips, and membership in non-professional organizations peaks among individualsbetween 35 and 4418
Regression (3) returns to the trust survey question and examines the role of television.
Putnam (1995) argues that television may have played a major role in eliminating trustand social capital. Individuals who watch dramatically large amounts of television trust
less. However including the number of hours spent watching television does not explain,
or even affect, the measured cohort effects. To evaluate the possible role of television in
explaining the decline of trust, consider the experiment of moving everyone fromwatching zero television to watching 3 hours per day (the average in the GSS). Thiswould cause a 5.75 percentage point decline in trust, which is less thanone-quarter of thedecline in trust between the pre-1940 and post-1959 cohorts.'9
Regression (4) examines the role of religion and finds that individuals who attend church
more are indeed more trusting. perhaps because they associate more with other
churchgoers (a group effect) or perhaps because they have individual characteristics
which both propel them to church and make themtrusting. Denominations clearly matter,but it is hard to find a clear pattern. Across denominations, Lutherans, Episcopalians and
Presbyterians are the more trusting groups. Baptists and Jews are the least trusting andCatholics are in the middle (the omitted category is "Protestant—No SpecificDenomination"). 20 Goldin and Katz (1999) find that the proportion of residents in an
area who are Lutheran in the early part of this century strongly predicts currentmeasures
of social capital. We confirm this result and find that the proportion of Lutherans inone's state is a strong predictor of trust.21
8This finding is robust to controlling for the number of children in the household.This calculation might be wrong if there are spillovers from television, so that the macro-elasticity of
watching television is much higher than our estimated micro-elasticity.20 LaPorta et at. (1997) argue that hierarchical religions reduce social capital at the country level becausethe operation of these religions entails less cooperative interaction between lay people. lannacone (1991)argues that religion serves a large social purpose and we might expect to find significantly more trustamong members of particular religious groups (see also Glaeser and Glendon, 1997).21 Indeed, percent Lutheran can explain 30 percent of the variation in the mean level of trust across states.
13
This importance of Lutheranism at the state-level relative to the individual beingLutheran himself suggests the importance of the group, rather than the individual, in
generating trust. However this impression is somewhat misleading. State-level variables
often have big coefficients, but they have little explanatory power. The additional R-Squared created by including a complete set of state dummies in the regression (relativeto a regression with no state controls at all) is less than 1.5 percent. This suggests eitherthat states are too large to serve as meaningful proxies for social networks or that group-
level characteristics are not that important in explaining the variance in levels of trustacross people.
In regression (5), we find that indeed trust is higher in states where there are fewer high
school dropouts. However, trust is lower in states with more college graduates. Ifeducation increased trust because more educated groups were better networked, then the
connection between college education and trust should occur at both the micro and the
macro level. However, if education increases trust by increasing the ability to punishothers then low human capital people might well be less trusting when they aresurrounded by high human capital people who can't be held accountable. As such, thisregression pushes us towards the view of social capital as an individual attribute.
Table 3 presents results from results from regressions across countries. These results arefrom the World Values Survey taken in various years. The World Values Survey ismeant to be a random sample of between 500 and 3000 persons in each country. The firstcolumn presents the mean answer to the GSS trust question in the country. Patternsacross countries do not always line up with our expectations (e.g. China).22 The table's
next column gives results on membership in organizations.
22Fukuyama discusses China as a particularly low trust country, but we find high levels of trust there. One
explanation for this discrepancy is that in answering the trust question Chinese respondentsmay be heavilyweighting their trustfulness with respect to family members (which is said to be high), and placingrelatively little weight on their trustfulness to society at large (which is said to be low). This may beanother example of the difficulties with imprecise self-reportedmeasures of trust.
14
In the next set of columns, we report results from ordinary least squares regressionsincluding year of birth (entered linearly) and two education dummies.23 Trust declines
significantly with birth year in several countries (13 out of 40), but in most countries the
relationship between birth year and trust is either insignificant or positive. The effect of
schooling is more pervasive. In 19 cases, continuing school until age 21 had a positive.
significant correlation with trust. In only three cases, none of which were significant, this
schooling variable had a negative effect on trust. In 20 out of 40 cases, finishing school
before age 18 had a negative and significant effect on trust. In only threes cases (one is
significant) did this lack of schooling variable increase trust.
The survey results present four stylized facts. Measured trust is declining significantlyfor later cohorts in the U.S. (and 13 out of 39 other countries), but the relationship
between cohort and trust is insignificant in most nations. Trust is lower among racial
minorities, perhaps because they generally deal with people who are socially distant from
them, or they deal with people from different races that face weak psychic costs ofcheating them, or because they are less able to punish people who cheat them. Education
increases measured trust and organization membership. Religion also appears to impacttrust. As all of these results could represent either individual social capital or groupeffects, we believe that our experiments are necessary to test whether social capital can
be a meaningful individual level variable.
IV. Survey and Experimental Design
We recruited the subjects for our two experiments during the first week ofclass from
Harvard's introductory economics course (EdO).24 Approximately 2/3 of Harvard
undergraduates take EdO, suggesting that the population from which we recruited is
representative of Harvard undergraduates. During two short recruitment speeches,subjects were asked to stay after class to sign-up for the experiment. Out ofapproximately 1000 Eel 0 students, 274 agreed to participate, of which 189 completed all
parts of the study. Our recruitment handout and all of our other subject materials (e.g.,
23 In general, the surveys occur in a single year so we cannot distinguish birthyear and age effects.24Hence, subjects had received no economics training before their participation in the study.
15
consent forms, instructions, and debriefing forms) are available upon request. Ourexperimental procedure has three components. First, subjects are asked to fill out asurvey. Three to four weeks later, subjects participate in two experiments, the "TrustGame" and the "Envelope Drop."
Part I, Survey: Subjects are asked to fill out an anonymous l37-question survey.Subjects took between 20 and 30 minutes to complete the survey. The first half of the
survey contains demographic and behavioral questions (e.g., gender, parental education,
race, college activities etc...). The second half of the survey contains attitudinal
measures of subjects' self-perceived trustfulness and trustworthiness.
The trust questions are chosen from a wide range of sources, with particular emphasis on
the General Social Survey, and we invented several trust questions ofour own. As noneof these standard GSS questions elicit information about past trusting behaviors, we askthe following questions: 'How often do you lend money to your friends?"; "How often
do you lend personal possessions to your friends (e.g., CD's, clothes, bicycle, etc...)?"and "How often do you intentionally leave your rooming group's hallway door unlocked
(when nobody is home)?" A complete copy of oursurvey is available upon request.
Part 2, The Trust Game: Three to four weeks after subjects fill out the survey, theyparticipate in the experimental component of our protocol. Each subject participates intwo experiments: the "Trust Game" and the "Envelope Drop." These titles are not used in
the actual experiment. When communicating with the subjects, we refer respectively tothe "Transfer Game" and the "Bonus Winnings Procedure." Forclarity, we use the moredescriptive titles here.
In our "Trust Game" subjects arrive at the experiment site, sign in, fill out a consentform, and are then paired with another subject. Those who arrive together and wish to
play together are allowed to do so, raising the likelihood that subjects who know each
other will be paired.25 Others are paired in order of arrival. After being paired, the
25 This procedure increases the variation in social connection across pairs of subjects.
16
subjects jointly fill out a social connection survey, which asks nine questions about how
well the two subjects are socially linked. For example, we ask the subjects to produce alist of all personal acquaintances that they have in common. This measure of the number
of mutual acquaintances is an important variable for our analysis. Note that subjectsreport to us the number of names on their joint list, but keep the actual list of names to
assure anonymity of the subjects (and their friends).
After filling out the social connection survey, the subjects are separated and told thattheywill not see each other again during the course of the experiment. The rest of the game(steps 1-5 below) is then explained to the separated subjects. Then thegame is played.
In the experimental instructions we refer to the subjects as either RED or GREEN
players. Each pair of subjects contains one RED player and one GREEN player. In the
current summary, we use more meaningful labels: "sender" and "recipient." The five
steps of the game are as follows: (1) The sender is given $15; (2) The recipient sends the
sender a message/promise about the recipient 's intended future actions in the game; (3)The sender chooses to send all, some, or none of his/her $15 to the recipient; (4) Theexperimenters double whatever the sender chooses to send (for example, if the sender
sends $4, the recipient receives $8, and the sender keeps $1 I of the original $15); (5)The recipient chooses to send all, some, or none of the received money back to the sender
(for example, if the recipient receives $8, and the recipient sends $1 back to thesender,then the recipient gets to keep $7, and the sendergets to keep $1 +$ 11 r=$12). After this
point, the subjects no longer interact in the formal game setting.
To implement this procedure, subjects write their decisions on a record sheet, which is
placed in an envelope and collected by a subset of experimental assistants whonever see
the contents of the envelope. The other subset of experimental assistants who actuallyopen the envelopes (in a different room) never see the subjects. Hence, subject
anonymity (vis-à-vis the experimenters) is assured.
17
We implement step (2) which allows subjects to make a promise by allowing therecipient (GREEN) the opportunity to check one of two statements: (a) "I, personGREEN, promise to repay RED at least as much as RED sends me. Forexample, if RED
sends me $4, which will be doubled by the experimenters to $8, then I will repay RED at
least $4," or (b) "I. person GREEN. make no promise to RED."26 Only half of our pairs
of subjects are given the opportunity to send such a message. The other subjects receive
no opportunity to send a message and no mention of a promise is made in theirexperimental instructions.
Our procedure differs from the Berg et aI..(1995) experiment on which it is based in three
ways. First, the Berg et al procedure guarantees that individual subject decisions are
unobservable to all parties (i.e., both experimentalists and other subjects). Our game only
guarantees anonymity vis-à-vis the experimenters; the subjects know the identity of the
other subject in their pair. We want the paired subjects to know each others identity sowe can determine how variation in social connection influences trusting behavior.
Second, unlike Berg et al., some of our games include a promise condition. Third, ourexperiment differs from Berg et al, because we only double --- rather than triple the
money that the sender sends to the recipient. We made this change to ensure that there
would be some senders who don't send over everything.
26 As we intended, all but one of the 47 subjects who were given the chance to make the scripted promisedid so. Our investigation differentiates between people randomly given the opportunity to promise, notbetween people who did promise vs. people could have promised and didn't.
18
Part 3, The Envelope Drop. After completing the trust game, subjects participate in a
second experimental procedure that provides an additional behavioralmeasure of trust. In
the envelope drop experiment, our subjects report their valuation ofhaving an addressed
envelope which contains $10 dropped in a public place (e.g., Harvard Square). The
subjects self-address the envelope which is later intentionally "dropped" by the
experimenters. We believe that the subject's valuation of such an envelope drop
primarily measures confidence that a random pedestrian will return the envelope to the
subject (say by putting it into a mailbox). The procedure may also measure the subject's
trust of the experimenter.
To elicit truthful reporting we randomly generate valuations and pay the subject therandom valuation if their reported willingness to pay is below the randomly generated
valuation. We implement the envelope drop if the subject's reported valuation is above
the randomly generated valuation. Finally, we vary properties of the envelope drop (e.g.,
location, time of day, stamp on envelope, envelope sealed). Each subject providesvaluations for 15 different envelope drop conditions. These manipulations lead tosensible variations in the measured willingness-to-pay across various conditions (see
Appendix Table 3). We average each subject's responses across the 15 differentconditions, and use this mean reservation value as our second measure of trust.
V. Results
Appendix Tables I and 2 give the means and correlations from the survey and the two
experiments. Figure 1 shows our basic results and documents the connection between
the amount sent and the amount returned. Figure 2 shows the distribution of mean
reservation values from the envelope drop. Obviously, there is substantialheterogeneityin trust and trustworthiness, but this heterogeneity does not mean that social capital is an
individual characteristic. This heterogeneity could be the result of partnership specificattributes (in the trust game) or random situational factors.
19
To show that social capital is an individual characteristic, we must document that pre-
experiment individual attributes are systematically related to trust and trustworthy
behavior in the experiment. We estimate three basic types of regressions. First, we
estimate the determinants of trust:
(2) Amount Sent = f(Sender, Recipient and Match Characteristics)
using ordinary least squares.27 We next estimate the determinants of trustworthiness:
Amount Returned / .(3) . = g Sender,Recipient and Match Characteristics
Amount Available to Return
using ordinary least squares.28 Finally, using results from the envelope drop experiment,
we regress:
(4) Mean Reservation Value = h( Subject Characteristics)
The mean reservation value is the average reservation value across all of the different
envelope drop conditions.
Table 4— Social Connection
Before examining individual level attributes, in Table 4 we begin by estimating the
importance of both subjects sharing membership in the same social groups. These
variables are meant to test the implication of the model that people who will meet againare more likely to be both trusting and trustworthy. In all of our regressions, we include a
dummy variable that takes on a value of one if the sender was given the opportunity to
27Since more than 50 percent of our sample is at the upper limit (see Figure 1), we have also estimated all
of our results with a Tobit specification. Our results are robust to this alternative specification, andareproduction of all tables using this specification is available upon request.28 Again, the results are robust to all of the alternative functional forms (e.g. Tobits) that we tried.
20
make a promise. We also include a dummy variable that takes on a value of one if the
subjects are of different sexes. Neither of these variables is statistically significant.
In the first regression, we include the logarithm of one plus the number of months that the
sender and the recipient have known one another. We also includea dummy variable thattakes on a value of one if the two individuals had met before theexperiment. The amount
of trust rises significantly (at the 10 percent level) with the number of months thatthe two
individuals have known one another. Controlling for the amount of time that the
individuals have known one another, there is no positive impact ofhaving met before the
experiment.29 In the second regression, we examine the logarithm ofone plus the number
of friends that they have in common. There is a positive, insignificant effect of thisvariable on the amount of trust. In the third and fourth regressions, we test whether
individuals from different countries or different races trust each other less,controlling forthe number of friends they have in common. People from different national and racial
groups trust each other less, but these effects are not significant.3°
Regressions (5)-(8) examine the impact of these same four social connection variableson
the level of trustworthiness. In these regressions, we include the amount sent over in thefirst stage as an added control variable, and this variable positively predicts the fractionof money sent back. One natural interpretation is that recipients' who get sent little
initially respond spitefully by returning a lower fraction of the income that they haveavailable to send. The fact that the amount returned rises more than one-for-one with the
amount sent is consistent with the presence of reciprocal altruism discussed in themodel.31
29If we drop the time since met variable, this dummy variable becomes positive.
3 These results support those of Fershtman and Gneezy (1998), but differ in important ways. First, theyexamine trust of all people towards a low status minority and find that there is lesstrust. Second, theirsubjects have no possibility of repeated interaction after the game. Third, they allow no personal contactbetween subjects who must infer ethnicity from the last name of their partners.31 The slope of amount returned on amount sent is 1.18 when amount sent is greater than zero. This strongpositive correlation may also be the result omitted variables (perhaps relating to the ability topunish ornon-reciprocal altruism) that induce a positive correlation between trust and trustworthiness.
21
The effects of the duration of friendship are sizable. People who have never met return
82 percent of the amount sent over. Pairs who met at least one year earlier return an
average of 124 percent of the amount sent over. The racial effects are also big.
Individuals of the same race return 106 percent of the amount sent over on average.Individuals of different races return 80 percent of the amount sent over on average. 90percent of the cases where the recipient sent back nothing occurred when the individuals
were of different races (only 50 percent of the pairings were of different races). The
different country effects are even larger. These effects occur primarily because whites
(or Americans) returning small amounts to Asians (or non-Americans).32
The negative effect of different races may occur because people from different races or
countries have a lower probability of interacting in the future, but our results control for
the number of friends that the two groups have in common. Alternately, lower levels of
trustworthiness between the races may instead reflect lower levels of reciprocal altruism.
\Vhatever the interpretation, these results suggest that heterogeneitymay decrease trust in
social groups.33
Tables 5 and 6— Is Trust an Individual Specf IcAttribute?
In Table 5, we examine whether survey questions and other individual backgroundcharacteristics predict the level of trust in the two-person game. In all regressions, we
include the two previous control variables (different genders and thepromise condition)and four sender characteristics which will be included in all subsequent regressions:
gender, race (white or non-white), year at Harvard (freshman or older) and family size
(only child or not).34 In most of our regressions, these control variables are insignificant
and their inclusion or exclusion does not affect any of our other results.
32Fershtman and Gneezy (1998) find no ethnic effects on amounts returned, but they look only at the effect
of the sender being Sephardic not at any effects of sender-recipient ethnic similarity on the amountreturned.
LaPorta et al. (1999) argue that ethnic heterogeneity may decrease the quality of government by limitingthe formation of aggregate social capital.
22

In the first column, we show results for the basic trust question. Individuals who answer
yes to this question send 22 cents more over than individuals who answer no to this
question. This effect is not statistically distinguishable from zero. In the next regression,
we replace the basic GSS trust question with an index based on three GSS questions
(GSS Trust, GSS Fair and GSS Helpful—all defined in Appendix II) which is formed by
adding the three variables after they are demeaned and normalized by their standard
deviations. In this case, increases in this measure of trust reduce the actual level of trust
insignificantly. As Appendix Table 2 shows, all but 2 survey questions about trust have
no effect on the actual amount of trust.
The two survey questions that do predict trust specifically ask about trust ofstrangers. In
column (3), we find that subjects who disagree with the statement "you can't trust
strangers anymore" are actually more trusting. Individuals who say no to this question
send over an average of $2.20 more than comparable individuals who answer yes to this
question. A similar question (the individual's response to the statement "when dealing
with strangers, one is better off using caution before trusting them") is also negativelycorrelated with the amount of trust.
There are two plausible interpretations of this finding. First, among so many trustquestions it is unsurprising to find one that is significant. Second, the questions regarding
strangers are more precise and relevant and therefore we should have predicted that they
have particularly high explanatory power. To further test whether the connection
between this variable and the amount sent is the result of spurious correlation or a true
relationship, we examine separately sender-recipient pairs that are strangers and those
that are friends. We find that the question about strangers only predicts the amount of
trust between strangers, which supports its validity as a real measure. If the connection
between this survey question and trust is real then it is our first piece of evidence that
suggests that trust is any sense a stable, individual characteristic.
The dummy variables where chosen so that approximately 50percent of the sample had a value of onefor the variable.
23
In the fourth and fifth regressions, we examine the connection between trust outside of
the experiment and trust in the experiment. The fourth regression shows the connection
between an index of past trusting behavior and the mean reservation value. This index is
an average of having lent possessions, having lent money and leaving your door
unlocked.3 A one standard deviation increase in this variable (2.22) increases the dollar
amount sent over by 89 cents (one-fifth of a standard deviation). In the fifth regression,
we show a positive, but insignificant, correlation between the mean reservation value and
the amount sent over (without other controls, this relationship is significant at the 12.5
percent level). The results on the questions about trusting strangers, past trusting
behavior and the reservation value together suggest that there is a stable individual-
specific characteristic that predicts the levels of trusting behavior in different situations.
There are at least three classes of individual specific attributes that could generate this
stable level of trust. First, some individuals might be more trusting because they havea
greater ability to enforce trustworthy behavior (this would be the variable 0 in the model).
This factor, though, cannot explain anything about trust in the envelope drop game.
Second, some individuals might have more altruism towards others (this would be the
variable ct in the model). Third, some individuals might be more trusting because theyhave different assessments of the trustworthiness of others, perhaps based on pastexperiences. The next two regressions tests two of these hypotheses.
In the sixth regression, we examine two proxies for altruism (1) the logarithm ofone plus
the number of hours spent in volunteer activities and (2) the individual's attitude to the
statement "a person's income shouldn't be determined by work." Neither variable
predicts the level of trust, perhaps because they are both bad proxies for altruism.
In the seventh regression, we examine the hypothesis of whether past positive experience
influences trust by looking at the impact of subject's response to the question "have you
ever spontaneously benefited from the generosity of someone you never knew before?"
This question also had no predictive power. Other proxies for past experiences that
The index is formed by demeaning these three variables and dividing by their standard deviations.
24
might have led to a cynical outlook (parental divorce, childhood violence, etc.) also had
no effect on trust or on the coefficient on past trusting behavior. As such, we do not
believe that trust should be seen as a cognitive bias induced by past experiences.
In Table 6, we examine the determinants of the level of trust in the envelope dropgame.We include an extra control variable described as "Lost mail" refers to the recency with
which the respondent lost an item in the mail. The answer takes on a value between one
(never) and four (within the last six months). A one-standard deviation increase in this
variable (.98) causes the willingness to pay for a dropped envelope to fall by -.22,or one-
seventh of a standard deviation. The impact of this variable suggests the importance of
past experiences working presumably through beliefs, but this variable is somewhat
tainted because it was asked after the envelope drop experiment (aspart of a debriefing)rather than before the experiment.
In the first regression of Table 6, we include the basic GSS trust question. Individuals
who answer yes to this question are willing to pay 20 cents more for the ten dollar
envelope drop. This effect goes in the right direction but it is not significant. In
regression (2), we also include the three variable survey question index. A one standard
deviation increase in this index (2.22) causes an insignificant ten cent increase in
willingness to pay for the dropped envelope. Almost all of the other trust variables (and
other trust survey questions and indices not reported in the table) are not significantlycorrelated with the mean reservation value.
Again the two survey questions that specifically ask about trusting strangers positively
predict trust. As regression 3 illustrates, individuals who believe that you can trust
strangers are willing to pay 68 cents more for the envelope. Again, this result may be
spurious, but if it is real it suggests the presence of stable individuals attributes which
create trust.
The fourth regression shows the connection between our index of past trusting behaviorand the mean reservation value. This index also has a modest, significant effect on the
25

mean reservation value. A one standard deviation increase in this index raises the level
of mean reservation value by 27 cents. In Appendix Table 2, we show that thestrongestconnection occurs between lending possessions and the mean reservation value. There is
a borderline-significant connection between leaving your door unlocked and the mean
reservation value.
In the fifth regression, we examine whether altruism might lie behind the correlation
between past levels of trust and current trust in the envelope drop game. We find that
attitudes towards redistribution are a strong predictor of trust in this game. In Appendix2, we show that another measure of pro-redistribution opinions (labeled pro-charity) also
predicts more trust. Behavioral measures of altruism (hours spent on volunteer work or
dollars given to charity) are orthogonal to this trust measure.
To see if the correlation with the pro-transfer question is spurious, we examined the
influence of being pro-transfers on trust in low income areas (e.g. Central Square) and an
average income area (i.e the Post Office). The strongest connection between pro-transfer
opinions and trust in this game occurred in lowest income areas and that there was no
connection between pro-transfer opinions and trust for the envelopes dropped in the Post
Office. This finding suggests that the connection between some altruistic attitudes and
trust in this particular circumstance is real and that altruism might be one factor that
induces some people to be trusting across a variety of settings.
Table 7—Is Trustworthiness an Individual SpecUIc Attribute?
In Table 7, we examine the effect of individual, recipient characteristics on the fraction of
total income available returned by the recipient. We add the amount ofmoney sent over
in the first round as a control variable and find that this variable has a positive effecton
the ratio of money returned. As Figure 1 shows, people generally return exactly as much
26
as they are sent. This might reflect exactly the form of reciprocal altruism in the model,
but it might also reflect prevailing norms about fair play.36
These norms do appear to be influenced by the promise condition, as shown in Figure 3.
Individuals in the promise condition were significantly more likely to send back exactlythe same amount that they were sent. However, the promise condition does not in anysense deter cheating (i.e. returning less than you were sent), and the promise condition
actually has a negative effect on the total ratio returned. The main effect of the promise
condition is that there are fewer individuals who send back more than they were sent and
more who send back exactly what they were sent.
By examining the effect of individual characteristics on the level of trustworthiness, we
are testing whether trustworthiness is also a stable characteristic. In the first regression.
we find that our controls actually have some impact. Being non-white and being a
freshman slightly depress trustworthiness.37 More significantly, only childrenare much
less likely to return money. Being an only child reduces the percent sent back by 22
percent.
We also find a significant correlation between the GSS trust question and the ratio of
money returned. In regression (2), we find an even stronger relationship between the
level of trustworthiness and the index of trust-related questions (GSS Helpful, Fair and
Trust). The strongest subcomponent of that index is the question about whether youthink other people are fair. Appendix Table 2 shows a relatively reliable correlation
between many of the trust measures and the measure of trustworthiness.
This finding suggests that the standard trust questions may be picking up trustworthinessrather than trust. Tables 2 and 3 take on a substantially different meaning when viewed
in that light. When aggregated up to the country or region level, presumably a measure
16 This finding is harder to reconcile with inequality aversion which would generally imply that individualswho receive 5 dollars or less should not return anything.
27
of trustworthiness is as good (or better) a measure of social capital than a measure of
trust. This finding (as well as the only child results) suggests that trustworthiness may
be an individual level characteristic.
In regression (3), we show that there is a negative, insignificant connection between self-
reported trustworthiness and actual trustworthiness. We are not surprised that those
people who are willing to admit to being untrustworthy are not the least trustworthy of
our subjects. The combination of this result with the previous section suggests that
subjects may reveal more about themselves in their answers to questions about other
people than in their answers to questions directly about themselves. The final regression
in this table presents an index of past deception. This is a normalized average of subjects
answers to four questions about the frequency of lying to parents, roommates,
acquaintances and close friends. This behavioral measure of deception weakly predicts
the level of untrustworthiness. The important components of the index relate to lying to
acquaintances and lying to close friends. Again, it appears that asking about actions is
more successful than asking about opinions.
Table 8— The Role of Status and Individual Social Capital
In Table 8, we test the hypotheses of the model that high status (or high social capital)
people, who may be either more effective at punishing others or at eliciting altruism, trust
more and elicit more trustworthy behavior. In our first regression, we examine two
measures of family status: (1) hours spent working for pay and (2) whether one's father
has a college degree. Hours spent working for pay is strongly correlated with low family
income (44 percent) and we believe it is significantly better measure than the categorical
family income variable that we have. In the first regression, we find that working for pay
has a close to negative effect on the amount of trust that is significant at the 10 percentlevel. The effect of father's education is insignificant.
This is the type of effect that shows how blurry the distinction between individual social capital andgroup social capital can be. If individuals acquire social capital over their time at Harvard by joininggroups, is it individual social capital or group social capital?
28

In regressions (5)-(8), we ask how the trustor's attributes predict the trustworthiness of
the trustee. These are qualitatively different regressions than those that have come
before, because we are now regressing the return ratio on the attributes of the trustor. In
regression (5), we find that working for pay negatively significantly predicts the amount
that senders receive back from the trustee. Father's education positively predicts the
amount received back. This latter effect becomes significant if the other family status
control is dropped (see Appendix Table 2, for example). People who say that they are in
the lowest income categories (average or below) receive about 18 percent less than
people who are in the higher income categories (this effect is significant only at the 15
percent level).
In regressions (2) and (6), we examine beer drinking (defined as the logarithm of the beer
servings per week, which may be related to collegiate social status) and whether the
individual has a sexual partner.38 We use having a sexual partner as a proxy forattractiveness and find that it positively predicts trust and the amount ofmoney received
in the second stage. Beer drinking may be a correlate of "coolness" among some
undergraduates. It weakly predicts the amount of trust and more strongly predicts the
amount returned in the second period.
In the third and seventh regressions, we examine organization membership. We find
little significant connection between membership and trust. However, members of
organizations generally elicit more trustworthy behavior (with the exception of members
of religious organizations). We are puzzled that trustors with attributes that increase the
trustworthiness of trustees, do not exhibit high levels of trust. One explanation of this is
that the novelty of the game may have made it difficult for the trustors to use backward
induction to figure out the optimal level of trust.
Finally in the fourth and eighth regressions, we examine four other social connection
variables. In these regressions, we also control for the amount of time that the trustor and
38 This variable takes on a value of one if the individual has a current girlfriend or boyfriend and if theindividual has had sex with at least one other person in the past 5 years.
29
the trustee have known one another—the other results are not sensitive to this variable.
We examine the logarithm of one plus the value of four variables: (1) hours per week
spent watching television, (2) the number of the individual's close friends, (3) the number
of hours per week spent alone studying and (4) the hours per week that the individual
spends performing volunteer work. The only variable that predicts trust is the number of
hours per week spent alone studying. This variable, which has a negative effect on trust,
may be best interpreted as a proxy for individual-level trust.
Individuals who spend more time volunteering and have more close friends are much
better at eliciting trustworthy behavior in the second period. A one standard deviation
increase in the close friends variable (.597) increases the percent received back by 8
percent. Again, it is surprising that these variables which increase the individual's ability
to elicit trustworthy behavior don't increase trust.
In this table, we have received our sharpest evidence so far that individual characteristics
predict their level of trust and in particular their ability to elicit trustworthiness from
others. Natural social status variables, some of which are predetermined by others (i.e.
parent's education) and some of which are choice variables (time spent volunteering)
predict both trust and the ability to induce others to behave in a trustworthy manner.
These variables can naturally be described as individual social capital and theyappear to
have important effects on social interactions. In the next section, we will actuallyquantify the financial returns to different forms of social capital.
Table 9— The Returns to Social Capital
Ideally, we might be interested in the extent to which social capital measures predict
outcomes in more important settings (school, work, etc.), but the game does offer a
relatively controlled atmosphere with real money and we can investigate what personal
characteristics lead to greater financial returns in the experiment. The experiment is one
particular social setting and we can directly examine what acts as social capital in this
setting by examining the following regression:
30

(5) Financial Returns = R(Personal Characieri,s'iics)
We perform this regression separately for individuals in the sender and the recipient
position in Table 9. All returns are measured in dollars.
In the first regression, we show the effect of parental college status, which is significant
and positive for individuals who are in the trustor position. The average return for
individuals in the trustor position whose fathers have graduated from college is 14.75
dollars. The average return for these individuals whose fathers did not graduate is 9.29
dollars. Individuals coming from lower human capital families would have been better
off financially if they hadn't trusted at all. Comparing persons from low and high-
income families also demonstrates these effects. The average returns for people from low
income families was more than 2 dollars less than the average returns for people from
high income families. These higher returns come from the ability to elicit trustworthy
behavior, so it seems that high family status appears to provide social capital.
In the second regression, we examine whether more trusting people generate higher rents
in the experiment and we find that they do not. This is true with the GSS trust index, the
GSS trust question (not in the table), the stranger question (not in the table) and the
behavioral trust index. This suggests that a tendency to trust may reflect social capital at
the region or country level, but not at an individual level.
The third regression includes social status variables from Table 8. Individuals who work
for pay receive less from the social interaction. Individuals with sexual partners take
home more over 4 dollars more than their celibate classmates. Individuals who drink
beer earn more in this setting. A one standard deviation increase in the volunteering
variable raise financial returns from the game by over a dollar. Surprisingly, hoursspentstudying alone also increases the returns from the game. However, this result is very
fragile and does not appear in most specifications (including univariate ordinary least
31
squares).39 The R-squared from the appropriate standard ordinary least squares
regression is over 30 percent (the adjusted R-squared is 27.5 percent), so these variables
are in fact explaining a significant amount of the variation in private returns.
However, the step from individual social capital to group level social capital requires us
to understand if our measures of individual social capital have positive or negative
externalities. In this particular game, we will measure this by asking whether our
measure of the sender's social capital raise the returns for the recipient. A particularly
group-oriented view of social capital might emphasize that social capital improves
everyone's lot (except the experimenter). Alternatively, the returns to social capital
might just lead to redistribution from one player to another. In regressions (4)-(6), we
find that all of the social capital variables that increase the financial returns for the sender
decrease the returns to the recipient. As such, these social capital variables appear to
generate private, not group, returns, and emphasize the importance of distinguishing
between individual and group-level social capital.
We would stress that these results may not generalize. The only way in which social
capital could increase everyone's returns in this game was to increase the level of trust in
the first period, but a large share of our sample trusted as much as it could already. As
such, there may not have been enough of a chance for the positive effects of social capital
on social returns to operate. Naturally, the earlier warnings about the possibility that a
study on a modest sample of Harvard undergraduates in a very particular pair of games
also apply here as well.
VI. Conclusion
Using two experiments, we investigated whether trust, trustworthiness and social capital
are characteristics of individuals, as well as groups. Past trusting behavior correlates with
trusting behavior in our experiments; the levels of trust in the two experiments are
Every single other variable that is significant in this specification is also significant when there are noother controls in the regression.
32

correlated with each other. We also found that two of our survey questions about trusting
strangers both predict trust. Trustworthiness also seems to be stable and is strongly
predicted by survey questions about trust (not trustworthiness) and by having siblings.
A simple economic model did well at predicting behavior in the games. Individuals with
greater social connection trusted each other more. People from different races or
nationalities behaved in a less trustworthy manner towards one another. Individuals from
more successful families, individuals with more friends, individuals who volunteer and
individuals with sexual partners all elicit more trustworthy behavior. For other
predictions of the model, results went generally in the right direction but were statistically
insignificant. We hope that future research will be able to test these findings with larger
samples and more diverse subject populations.
There are three major implications of this paper for future research. First, social capital is
a meaningful, individual-level variable that can be studied with the tools of price theory,
once it is understood that aggregation will be much more difficult than for other forms of
capital. Our evidence supports the idea that human capital includes cognitive and
physical abilities and also social capital, e.g. interpersonal skills, status and access to
networks (as in Bowles and Gintis, 1976).
Second, standard survey questions about trust do not appear to measure trust. However,
they do measure trustworthiness, which is one ingredient of social capital. This means
that most work using these survey questions needs to be somewhat reinterpreted. If
future surveys mean to measure trust, then other instruments, including questions about
past trusting behavior, should be developed and used when they predict trust inexperiments or in the field.4°
Finally, we believe that this paper shows the value of using experiments and surveys
together. Experiments can measure personal attributes much more convincingly than
40 Indirect psychological measures of attitudes have been shown to be more effective that direct measures(McCIelIand, Koestner, and Weinberger, 1989).
33

surveys. By connecting the two forms of evidence, we can determine the socioeconomic
correlates of hard-to-measure personal attributes, and test the validity of survey measures
of these attributes.
34
References
Abreu, D. (1988) "On the Theory of Infinitely Repeated Games with Discounting,"
Econometrica.56(2): 383-96.
Ajzen I., and Fishbein M. (1977), "Attitude-behavior relations: A theoretical analysis and
review of empirical research," Psychological Bulletin 84: 999-918.
Arrow, K. (1972) "Gifts and Exchanges," Philosophy and Public Affairs 1: 343-362.
Ball, C., Eckel, C., Grossman, P. and W. Zame (1998) "Status in Markets,"
mimeographed.
Banaji M. R., and A. G. Greenwald (1994) "Implicit Stereotyping and Prejudice," pages
55-76 in M.P. Zanna and J. M. Olson (Eds.). The Psychology of Prejudice: The
Ontario Symposium, 7, Hillsdale: Lawrence Erlbaum.
Berg J., J. Dickhaut, and K. McCabe (1995) "Trust, Reciprocity, and Social History,"
Games and Economic Behavior 10: 122-42.
Bowles, S. and H. Gintis (1976) Schooling in capitalist America.• educational reform and
the contradictions of economic life. New York: Basic Books.
Coleman, J. (1990) Foundations of Social Theory. Cambridge MA: Harvard University
Press.
DiPasquale, D. and E. Glaeser (1999) "Incentives and Social Capital: Are Homeowners
better Citizens?" Journal of Urban Economics 45(2): 354-384.
Fershtman, C. and U. Gneezy (1998) "Trust and Discrimination in a Segmented Society:
An Experimental Approach," mimeographed.
Fukuyama, F. (1995) Trust. New York: Free Press.
Glaeser, E. and S. Glendon (1998) "The Demand for Religion," mimeograph.
Goldin, C. and L. Katz (1999) "Human Capital and Social Capital: The Rise of
Secondary Schooling in America, 1910-1940," Journal of Interdisciplinary History
29: 683-723.
Greif, A. (1993) "Contract Enforceability and Economic Institutions in Early Trade: the
Maghribi Traders' Coalition," American Economic Review 83(3): 525-48.
lannaccone, L. (1991) "Sacrifice and Stigma: Reducing Free-Riding in Cults, Communes,
and Other Collectives," Journal of Political Economy 100(2): 271-91.
35
References Continued
Jacobs, J. (1961) The Death and Life of Great American Cities. New York: Vintage.
Knack, S. and P. Keefer (1997) "Does Social Capital Have an Economy Payoff? A
Cross-Country Investigation," Quarterly Journal of Economics 112: 1251-1288.
La Pierre, R. (1934) "Attitude and actions," Social Forces 13: 230-237.
La Porta, R ., F. Lopez-de-Salanes, A. Shleifer, and R. Vishny (1997) "Trust in Large
Organizations," American Economic Review Papers and Proceedings 87: 333-338.
La Porta, R ., Lopez-de-Salanes, F.. Shleifer, A. and R. Vishny (1999) "The Quality of
Government," Journal of Law, Economics and Organization 15(1): 222-279.
Loury, G. (1977) "A Dynamic Theory of Racial Income Differences," in Women,
Minorities and Employment Discrimination, P. Wallace and A. LeMund eds.
Lexington, MA: Lexington Books.
McClelland, D. C., R. Koestner, and J. Weinberger (1989), "How do self-attributed and
implicit motives differ?" Psychological Review 96: 690-702.
Putnam, R. (1995) 'The Case of the Missing Social Capital," mimeographed.
Putnam, R. (1993) Making Democracy Work: Civic Traditions in Modern Italy.
Princeton: Princeton University Press.
Rabin, M. (1993) "Incorporating Fairness into Game Theory and Economics," American
Economic Review 83(5): 1281-1302.
Shleifer, A. and L. Summers (1988) "Breach of Trust in Hostile Takeovers," in A.
Auerbach, Ed. Corporate Takeovers: Causes and Consequences. Chicago:
University of Chicago Press.
36

</ref_section>
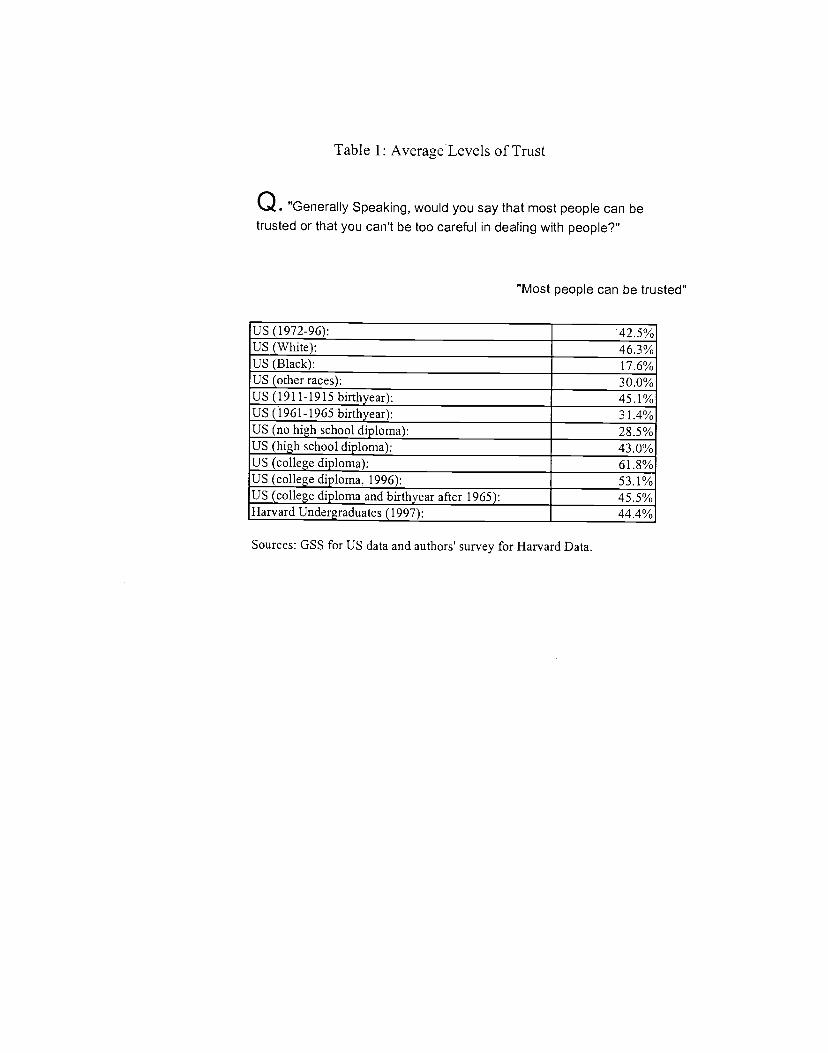
Table 1: Average Levels of Trust
Q. "Generally Speaking, would you say that most people can betrusted or that you can't be too careful in dealing with people?"
"Most people can be trusted"
US (1972-96): 42.5%US (White): 46.3%US (Black): 17.6%US (other races): 30.0%US(1911-l9l5birthyear): 45.1%US (1961-1965 birthyear): 3 1.4%US (no high school diploma): 28.5%US (high school diploma): 43.0%US (college diploma): 61.8%US (college diploma, 1996): 53.1%US (college diploma and birthyear after 1965): 45.5%Harvard Undergraduates (1997): 44.4%
Sources: GSS for US data and authors' survey for Harvard Data.
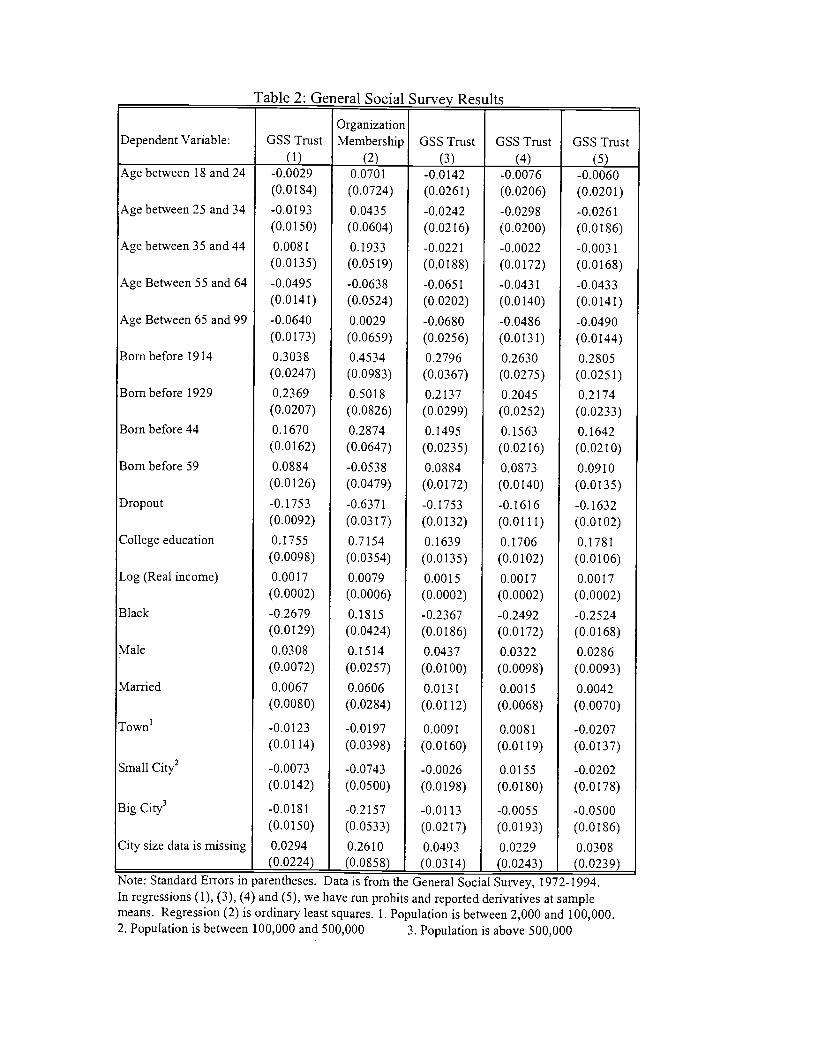
Table 2: General Social Survey Results
Dependent Variable: GSS Trust(1)
OrganizationMembership
(2)GSS Trust
(3)GSS Trust
(4)
GSS Trust
(5)Age between 18 and 24
Age between 25 and 34
Age between 35 and 44
Age Between 55 and 64
Age Between 65 and 99
Born before 1914
Born before 1929
Born before 44
Born before 59
Dropout
College education
Log (Real income)
Black
Male
Married
Townt
Small City2
Big City3
City size data is missing
-0.0029
(0.0184)-0.0 193
(0.0150)0.008 1
(0.0135)-0.0495
(0.0 14 1)
-0.0640
(0.0 173)0.3038
(0.0247)0.2369
(0.0207)0. 1670
(0.0 162)
0.0884
(0.0126)-0. 1753
(0.0092)0. 1755
(0.0098)0.0017(0.0002)-0.2679
(0.0 129)
0.0308
(0.0072)0.0067
(0.0080)
-0.0 123
(0.0114)
-0.0073
(0.0142)
-0.0181
(0.0 150)
0.0294(0.0224)
0.0701
(0.0724)0.0435
(0.0604)0. 1933
(0.05 19)
-0.0638
(0.0524)0.0029
(0.0659)0.4534
(0.0983)0.5018
(0.0826)0.2874
(0.0647)-0.053 8
(0.0479)-0.6371
(0.03 17)
0.7 154
(0.0354)0.0079
(0.0006)0. 18 15
(0.0424)0.1514
(0.0257)0.0606(0.0284)
-0.0 197
(0.0398)
-0.0743
(0.0500)
-0.2157
(0.0533)0.26 10
(0.0858)
-0.0 142
(0.026 1)
-0.0242
(0.02 16)-0.022 1
(0.0188)-0.065 1
(0.0202)-0.0680
(0.0256)0.2796(0.0367)0.2 137
(0.0299)0. 1495
(0.0235)0.0884
(0.0 172)
-0. 1753
(0.0132)0.163 9
(0.0135)0.0015(0.0002)-0.23 67
(0.0186)0.0437
(0.0100)0.0131
(0.01 12)
0.009 1
(0.0 160)
-0.0026
(0.0198)
-0.0113
(0.02 17)
0.0493
(0.0314)
-0.0076
(0.0206)-0.0298
(0.0200)-0.0022
(0.0 172)
-0.0431
(0.0 140)-0.0486
(0.0 13 1)
0.2630
(0.0275)0.2045
(0.0252)0. 1563
(0.02 16)
0.0873
(0.0 140)
-0. 1616
(0.0111)0. 1706
(0.0102)0.0017
(0.0002)-0.2492
(0.0 172)
0.0322
(0.0098)0.0015
(0.0068)
0.008 1
(0.01 19)
0.0 155
(0.0180)
-0.0055
(0.0193)0.0229(0.0243)
-0.0060
(0.0201)-0.0261
(0.0 186)
-0.003 1
(0.0 168)-0.0433
(0.0141)-0.0490(0.0 144)0.2805
(0.0251)0.2174(0.0233)0. 1642
(0.0210)0.09 10
(0.0135)-0. 1632
(0.0 102)0.1781
(0.0 106)0.0017
(0.0002)-0.2524
(0.0168)0.0286
(0.0093)0.0042(0.0070)
-0.0207(0.0137)
-0.0202(0.0178)
-0.0500(0.0 186)0.0308(0.0239)
Note: Standard Errors in parentheses. Data is from the General Social Survey, 1972-1994.In regressions (1), (3), (4) and (5), we have run probits and reported derivatives at samplemeans. Regression (2) is ordinary least squares. 1. Population is between 2,000 and 100,000.2. Population is between 100,000 and 500,000 3. Population is above 500,000
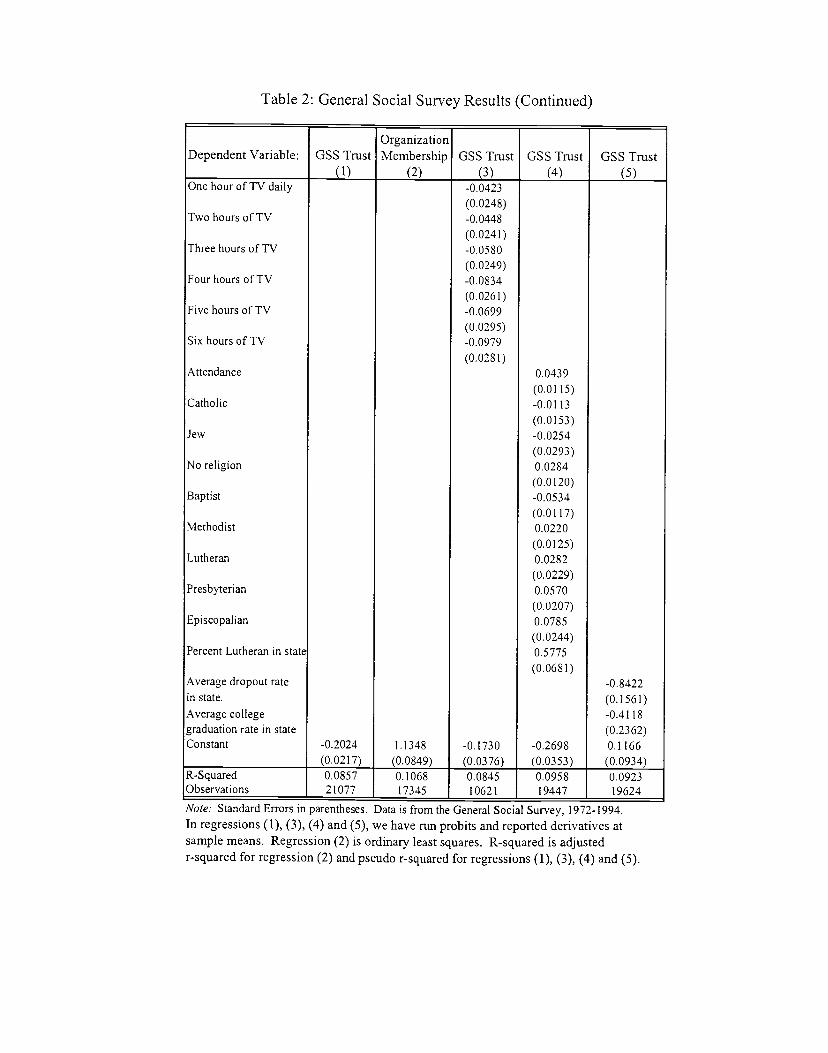
Table 2: General Social Survey Results (Continued)
Dependent Variable: GSS Trust(1)
OrganizationMembership
(2)
GSS Trust
(3)GSS Trust
(4)GSS Trust
(5)One hour of TV daily
Two hours of TV
Three hours of TV
Four hours of TV
Five hours of TV
Six hours of TV
Attendance
Catholic
Jew
No religion
Baptist
Methodist
Lutheran
Presbyterian
Episcopalian
Percent Lutheran in state
Average dropout ratein state.
Average collegegraduation rate in stateConstant
-0.0423
(0.0248)-0.0448
(0.0241)-0.05 80
(0.0249)-0. 0834
(0.0261)-0.0699
(0.0295)-0.0979
(0.0281)
-0. 1730
(0.0376)
0.0439
(0.0115)-0.0113
(0.0 15 3)-0.0254(0.0293)0.0284
(0.0 120)-0.0534
(0.0117)0.0220
(0.0 125)0.0282(0.0229)0.05 70
(0.0207)0.0785
(0.0244)0. 5775
(0.0681)
-0.269 8
(0.0353)
-0.2024
(0.02 17)
1.1348
(0.0849)
-0. 8422
(0.1561)-0.4 118
(0.2362)0.1166
(0.0934)R-SquaredObservations
0.0857
21077
0.106817345
0.0845
10621
0.0958
19447
0.0923
19624
Note: Standard Errors in parentheses. Data is from the General Social Survey, 1972-1994.
In regressions (1), (3), (4) and (5), we have run probits and reported derivatives atsample means. Regression (2) is ordinary least squares. R-squared is adjustedr-squared for regression (2) and pseudo r-squared for regressions (1), (3), (4) and (5).
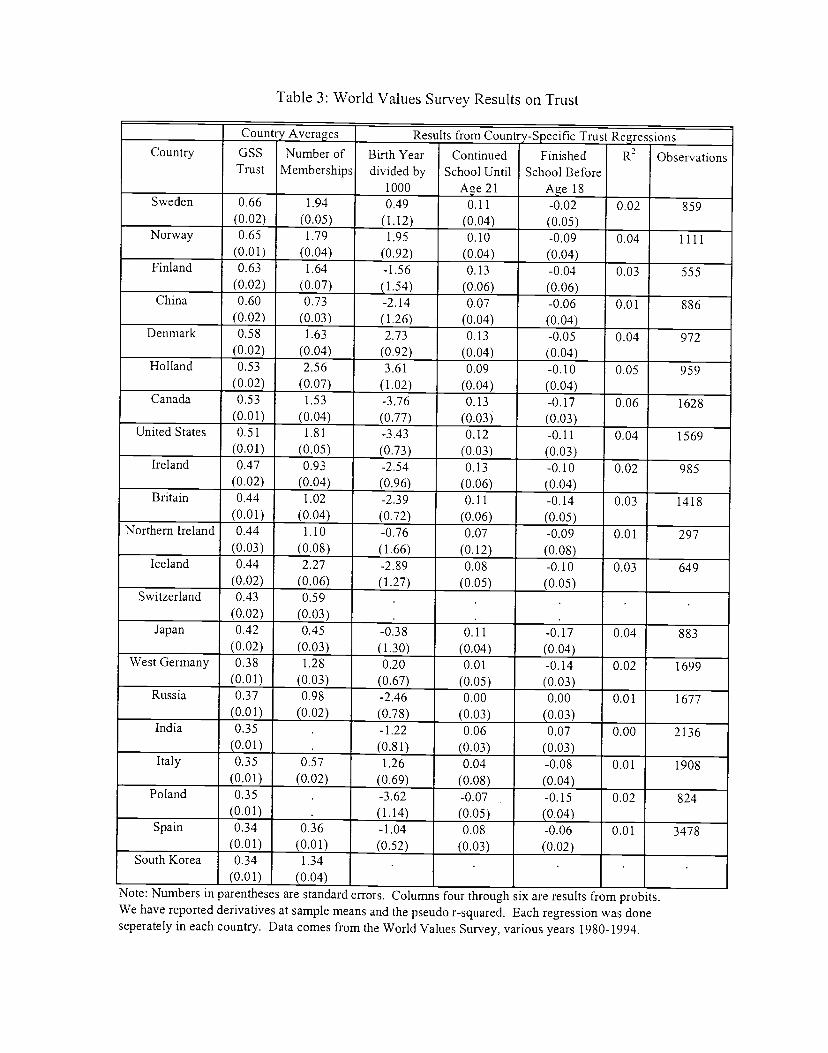
Table 3: World Values Survey Results on Trust
Country Averages Results from Country-Specific Trust RegressionsCountry GSS
TrustNumber of
MembershipsBirth Yeardivided by
1000
ContinuedSchool Until
Age2l
FinishedSchool Before
Age 18
R2 Observations
Sweden 0.66(0.02)
1.94
(0.05)0.49
(1.12)0.11
(0.04)-0.02
(0.05)0.02 859
Norway 0.65
(0.01)1.79
(0.04)1.95
(0.92)0.10
(0.04)-0.09(0.04)
0.04 1111
Finland 0.63
(0.02)1.64
(0.07)-1.56(1.54)
0.13
(0.06)-0.04
(0.06)0.03 555
China 0.60
(0.02)0.73
(0.03)-2.14
(1.26)0.07
(0.04)-0.06(0.04)
0.01 886
Denmark 0.58(0.02)
1.63
(0.04)2.73
(0.92)0.13
(0.04)-0.05
(0.04)0.04 972
Holland 0.53
(0.02)2.56
(0.07)3.61
(1.02)0.09
(0.04)-0.10
(0.04)
0.05 959
Canada 0.53
(0.01)1.53
(0.04)-3.76(0.77)
0.13
(0.03)-0.17
(0.03)0.06 1628
UnitedStates 0.51
(0.01)1.81
(0.05)-3.43
(0.73)0.12
(0.03)-0.11
(0.03)0.04 1569
Ireland 0.47
(0.02)0.93
(0.04)-2.54
(0.96)0.13
(0.06)-0.10(0.04)
0.02 985
Britain 0.44
(0.01)1.02
(0.04)-2.39
(0.72)0.11
(0.06)-0.14
(0.05)0.03 1418
Northern Ireland 0.44(0.03)
1.10
(0.08)-0.76(1.66)
0.07(0.12)
-0.09
(0.08)
0.01 297
Iceland 0.44(0.02)
2.27(0.06)
-2.89(1.27)
0.08
(0.05)-0.10
(0.05)0.03 649
Switzerland 0.43
(0.02)0.59
(0.03).
.
.
.
.
.
. .
Japan 0.42
(0.02)0.45
(0.03)-0.38
(1.30)0.11
(0.04)-0.17(0.04)
0.04 883
West Germany 0.38
(0.01)1.28
(0.03)0.20
(0.67)0.01
(0.05)-0.14(0.03)
0.02 1699
Russia 0.37
(0.01)0.98
(0.02)-2.46
(0.78)
0.00(0.03)
0.00
(0.03)
0.01 1677
India 0.35(0.01)
.
.
-1.22
(0.81)0.06
(0.03)
0.07
(0.03)
0.00 2136
Italy 0.35
(0.01)0.57
(0.02)1.26
(0.69)0.04
(0.08)-0.08
(0.04)
0.01 1908
Poland 0.35
(0.01).
.
-3.62(1.14)
-0.07
(0.05)
-0.15
(0.04)0.02 824
Spain 0.34
(0.01)0.36
(0.01)-1.04
(0.52)0.08
(0.03)-0.06
(0.02)0.01 3478
South Korea 0.34
(0.01)1.34
(0.04). . . . .
Note: Numbers in parentheses are standard errors. Columns four through six are results from probits.We have reported derivatives at sample means and the pseudo r-squared. Each regression was doneseperately in each country. Data comes from the World Values Survey, various years 1980-1994.
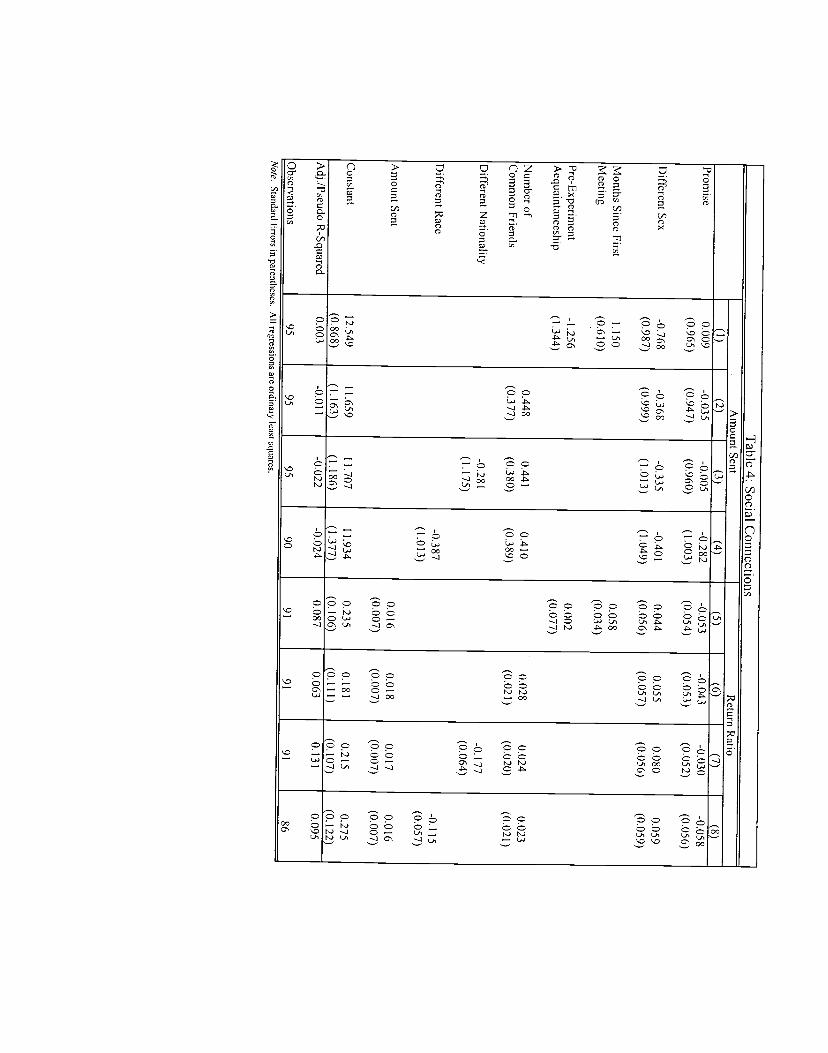
Table 4: Social C
onnections A
mount S
ent R
eturn Ratio
(I) (2)
(3) (4)
Promise
Different Sex
Months S
ince First
Meeting
Pre-E
xperiment
Acquaintanceship
Num
ber of C
omm
on Friends
Different N
ationality
Different R
ace
Am
ount Sent
Constant
0.009
(0.965)
-0.768
(0.987)
I .150
(0.6 10)
-1.256
(1.344)
12. 549
(0.868)
-0.03 5
(0.947)
-0.368
(0.999)
0.448
(0.3 77)
11.659
(1.163)
-0.005
(0.960)
-0.335
(1.013)
0.441
(0.3 80)
-0.281
(1.175)
11.707
(1.186)
-0.282
(1.003)
-0.401
(1.049)
0.4 10
(0.389)
-0.3 87
(1.0 13)
11.934
(1.3 77)
-0.053
(0.054)
0.044
(0.056)
0.05 8
(0.034)
0.002
(0.077)
0.0 16 (0.007)
0.235
(0.106)
-0.043
(0.053)
0.055
(0.057)
0.02 8
(0.02 I)
0.0 18
(0.007)
0.181
(0.111)
-0.030
(0.052)
0.080
(0.056)
0.024
(0.020)
-0.177
(0.064)
0.0 17
(0.007)
0.2 15 (0.107)
-0.058
(0.056)
0.059
(0.059)
0.023
(0.02 1)
-0.115
(0.057)
0.0 16 (0.007)
0.275 (0.122)
Note.
Standard E
rrors in parentheses. A
ll regressions are ordinary least squares.
Adj./P
seudo R-S
quared
Observations
0.003
95
-0.011
95
-0.022
95
-0.024
90
0.087
91
0.063
91
0.131
91
0.095
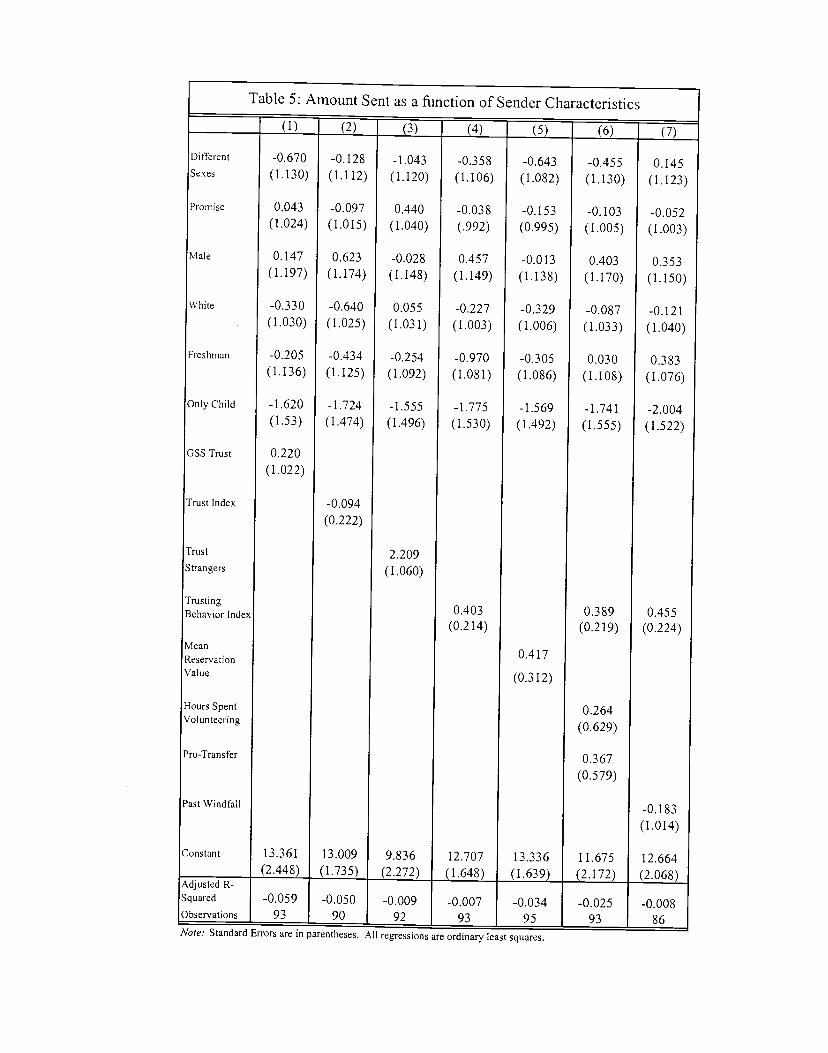
Table 5: Amount Sent as a function ofSender Characteristics
(1) (2) (3) (4)
Di fterent
Sexes
Promise
Male
White
Freshman
Only Child
GSS Trust
Trust Index
Trust
Strangers
TrustingBehavior Index
MeanReservationValue
Hours SpentVolunteering
Pro-Transfer
Past Windfall
Constant
-0.670
(1.130)
0.043
(1.024)
0.147
(1.197)
-0.330
(1.030)
-0.205
(1.136)
-1.620
(1.53)
0.220
(1.022)
13 .361
(2.448)
-0.128
(1.112)
-0.097
(1.0 15)
0.623
(1.174)
-0.640
(1.02 5)
-0.434
(1.125)
-1.724
(1.474)
-0.094
(0.222)
13 .009
(1.73 5)
-1.043
(1.120)
0.440
(1.040)
-0.028
(1.148)
0.055
(1.03 1)
-0.254
(1.092)
-1.555
(1.496)
2.209
(1.060)
9.836
(2.272)
-0.358
(1.106)
-0.03 8
(.992)
0.457
(1.149)
-0.227
(1.003)
-0.970
(1.081)
-1.775
(1.530)
0.403
(0.214)
12.707
(1.648)
-0.643
(1.082)
-0.153
(0.995)
-0.0 13
(1.138)
-0.329
(1.006)
-0.3 05
(1.086)
-1.569
(1.492)
0.417
(0.3 12)
13 .33 6
(1.639)
-0.455
(1.130)
-0.103
(1.005)
0.403
(1.170)
-0.087
(1.03 3)
0.030
(1.108)
-1.74 1
(1.555)
0.389
(0.2 19)
0.264
(0.629)
0.367
(0.579)
11.675
(2.172)
0.145
(1.123)
-0.052
(1.003)
0.353
(1.150)
-0.121
(1.040)
0.383
(1.076)
-2.004
(1.522)
0.455
(0.224)
-0.183
(1.0 14)
12 .664
(2.068)Adjusted R-Squared
Observations
-0.05993
-0.05090
-0.00992
-0.00793
-0.03495
-0.02593
-0.00886
Note. Standard Errors are in parentheses. All regressions are ordinary least squares.
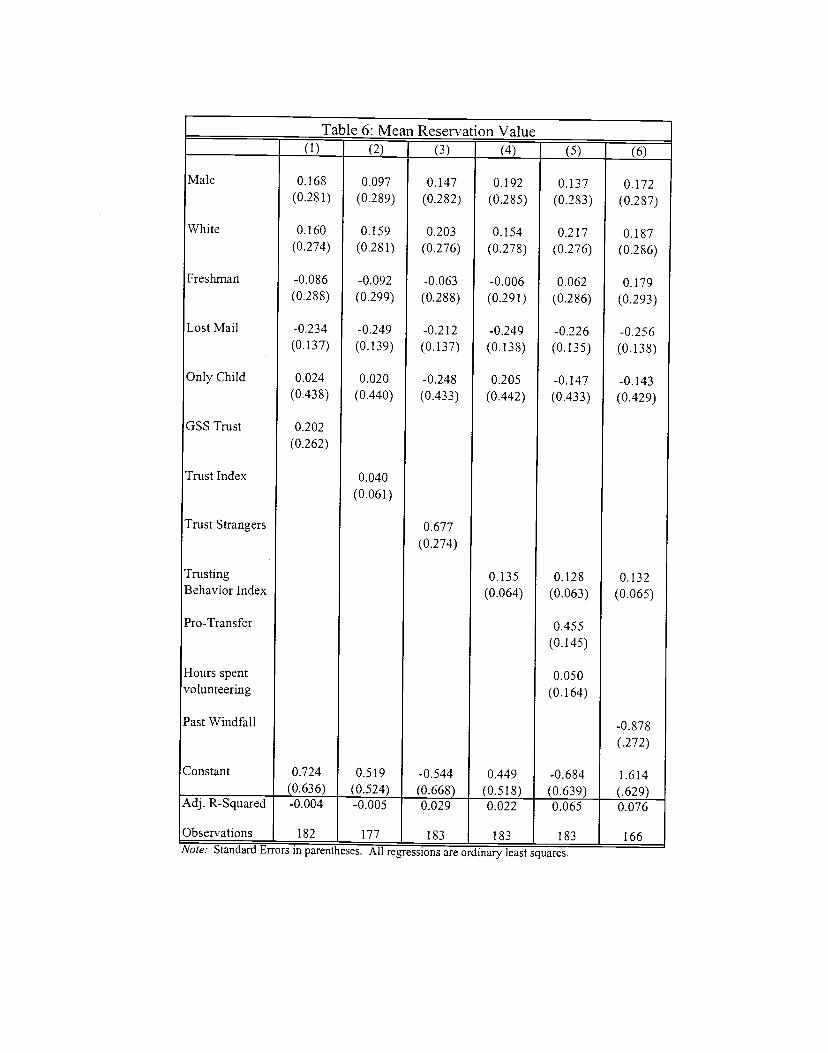
0.168 0.097 0.147 0.192 0.137 0.172(0.281) (0.289) (0.282) (0.285) (0.283) (0.287)
0.160 0.159 0.203 0.154 0.217 0.187(0.274) (0.28 1) (0.276) (0.278) (0.276) (0.286)
-0.086 -0.092 -0.063 -0.006 0.062 0.179(0.288) (0.299) (0.288) (0.291) (0.286) (0.293)
-0.234 -0.249 -0.212 -0.249 -0.226 -0.256(0.137) (0.139) (0.137) (0.138) (0.135) (0.138)
0.024 0.020 -0.248 0.205 -0.147 -0.143(0.438) (0.440) (0.433) (0.442) (0.433) (0.429)
0.724 0.519 -0.544 0.449 -0.684 1.614(0.636) (0.524) (0.668) (0.518) (0.639) (.629)
Table(1)
6: Mean(2)
Reservation(3)
Value(4) (5) (6)
0.202
(0.262)
Male
White
Freshman
Lost Mail
Only Child
GSS Trust
Trust Index
Trust Strangers
TrustingBehavior Index
Pro-Transfer
Hours spentvolunteering
Past Windfall
Constant
0.040
(0.061)
0.677
(0.274)
0.135(0.064)
0.128 0.132
(0.063) (0.065)
0.455
(0.145)
0.050
(0.164)
-0.878
(.272)
Adj. R-Squared -0.004 -0.005 0.029 '0.022 0.065 0.076
Observations 182 177 183 183 183 166Note: Standard Errors in parentheses. All regressions are ordinary least squares.
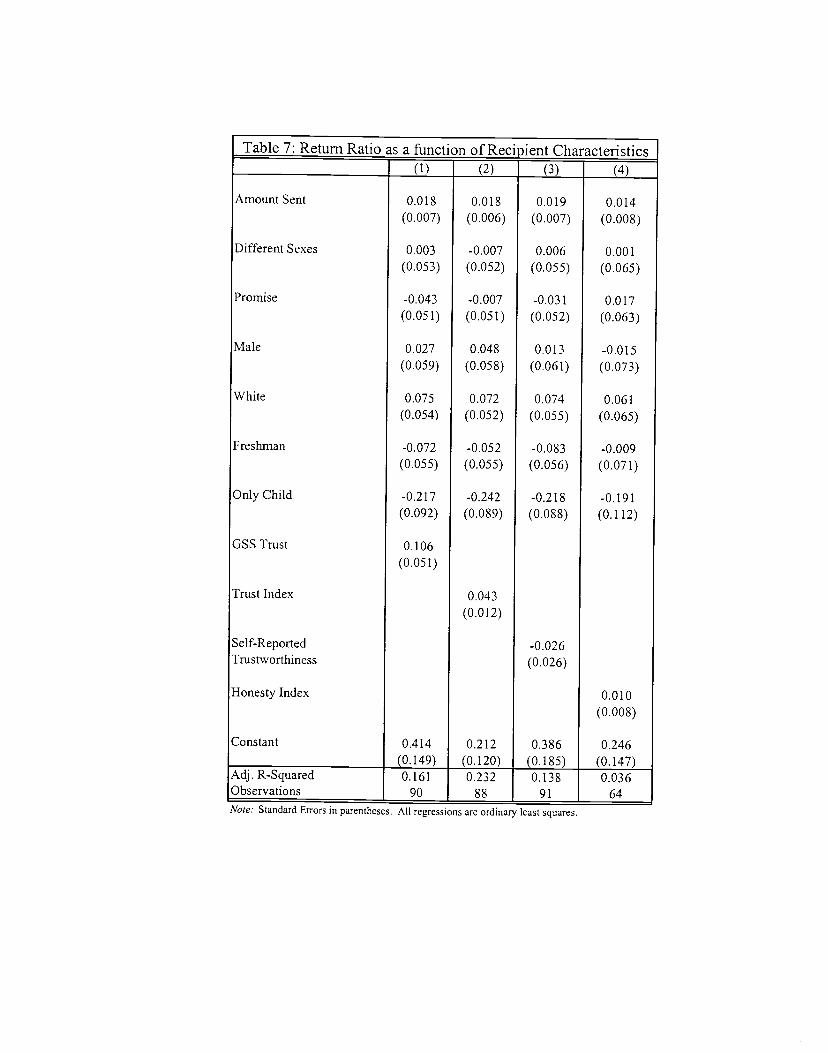
-0.043 -0.007 -0.031 0.017(0.051) (0.051) (0.052) (0.063)
0.027 0.048 0.013 -0.015(0.059) (0.058) (0.061) (0.073)
0.075 0.072 0.074 0.061(0.054) (0.052) (0.055) (0.065)
-0.072 -0.052 -0.083 -0.009(0.055) (0.055) (0.056) (0.071)
-0.217 -0.242 -0.218 -0.191(0.092) (0.089) (0.088) (0.112)
0.106(0.051)
Self-ReportedTrustworthiness
Honesty Index 0.0 10
(0.008)
0.414 0.212 0.386 0.246______________________ (0.149) (0.120) (0.185) (0.147)
Table 7: Return Ratio as a function of Recinient Characteristics(1) (2) (3) (4)
0.018 0.018(0.007) (0.006)
0.019(0.007)
0.0 14
(0.008)
0.003
(0.053)-0.007 0.006 0.001(0.052) (0.055) (0.065)
Amount Sent
Different Sexes
Promise
Male
White
Freshman
Only Child
GSS Trust
Trust Index 0.043
(0.0 12)
-0.026(0.026)
Constant
Adj.R-SquaredObservations
0.16190
0.23288
0.13891
0.03664
Note: Standard Errors in parentheses. All regressions are ordinary least squares.

Table 8: Social Capital and Status
Amount Sent as a function ofSender Clr--acterjstics
Return Ration as a function ofSender Characteristics
(1) (2) (3) (4) (5)
-0.03 2
(1.023)
-0.090(1.141)
0.151
(0.994)
-0.497
(1.098)
-0.579
(1.085)
-1.989(1.5 13)
-0.726
(0.43 7)
-0.965
(2.050)
0.0 16
(.007)
0.081
(0.057)
0.067(0.064)
-0.016(0.055)
-0.063
(0.060)
0.056
(0.059)
0.040(0.084)
0.015
(0.007)
0.03 5
(0.055)
0.05 7
(0.062)
-0.008(0.054)
-0.104
(0.060)
0.081
(0.059)
0.059(0.085)
-0.048
(.024)
0.149
(.1 tO)
-0.318(1.050)
0.240
(1.150)
0.023
(0.994)
0.76 1
(1.199)
-1.03 3
(1.110)
-2.1 22
(1.561)
0.166
(0.603)
2.984(1.485)
0.0 14
(.007)
0.016(0.057)
0.07
(0.063)
-0.023
(0.055)
-0.03 0
(0.066)
0,068(0.061)
0.066
(0.088)
0.065(0.034)
0.1 33
(0.082)
Amount Sent
White
Male
Promise
Freshman
Different Sex
Only Child
Hours WorkedFor Pay
Father with aCollege Degree
Beer Servings
Sexual Paraser
Member of aPolitical Group
Member of a
Journalism Group
Member of aSports Team
Member of aService Group
Member of a
Religious Group
Time Since Met
TV HoursWatched
Number of CloseFriends
Hours StudyingAlone
Hours SpentVolunteering
Constant
0.159
(1.064)
-0.03 0
(1.2 18)
0.223
(1.029)
-0.273
(1.135)
-0.604(1.121)
—1.711
(1.548)
-0.821
(1148)
1.143
(1.174)
1.0 14
(1.043)
1.159
(1.097)
-0.924
(1.226)
12 .252
(1.93 8)
0.038
(1.021)
0.209
(1.158)
1.052
(1.055)
-0.400(1.096)
0.022
(1.079)
-1.541
(1.499)
0.656
(0.486)
-0.859
(0.676)
-0.705
(0.8 17)
-3.444
(0.979)
0.139
(0.642)
22 .993
(3.407)
0.0 IS
(0.007)
0.01 4
(0.056)
0.100
(0.063)
-0.05 8
(0.059)
0.003
(0.060)
0.041
(0.058)
0.047
(0.084)
0.036
(0.026)
0.026(0.03 7)
0.132(0.045)
0.057(0.058)
0.087
(0.036)
-0.3 50
(0.23 5)
0.095(0.060)
0.000
(0.061)
0.079(0.056)
0.161
(0.058)
-0.054(0.064)
0.157 0.157 0.089(0.174) (0.128) (0.133)
14.872 11.929
(2.641) (1.754)
AdjustedR-Squared
-0.0342 -0.0172 -0.0622 0.0923 0.1057 0.1028 0.1366 0.1813
Observattons 95 93 95 91 91 89 91 87Note: Standard Errors parenthesized. All regressions arc ordinary least squares.,
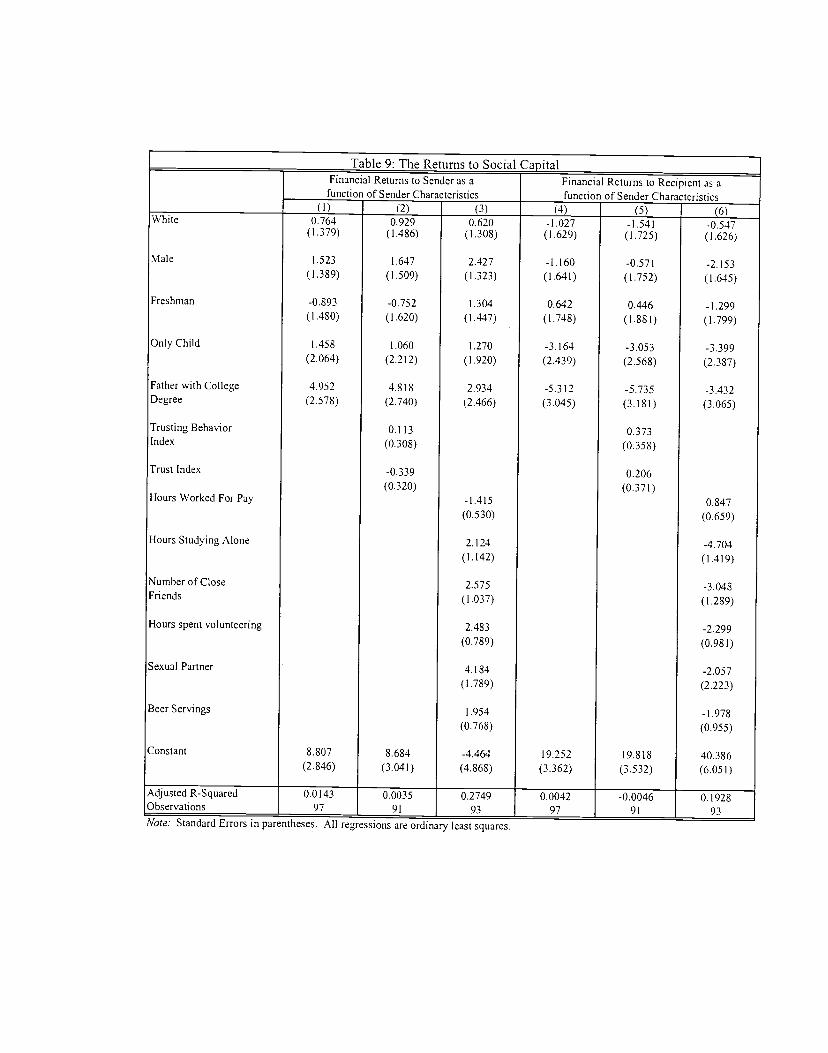
Table 9: The Returns to Social CapitalFinancial Returns to Sender as afunction of Sender Characteristics
Financial Returns to Recipient as afunction of Sender Characteristics
(1) (2) (3) (4) (5) (6)White
Male
Freshman
Only Child
Father with College
Degree
Trusting BehaviorIndex
Trust Index
Hours Worked For Pay
Flours Studying Alone
Number of CloseFriends
Hours spent volunteering
Sexual Partner
Beer Servings
Constant
0.764(1.379)
1.523
(1.389)
-0.893
(1.480)
1.45 8
(2.064)
4.952(2.578)
8.807
(2.846)
0.929(1.486)
1.647
(1.509)
-0.752
(1.620)
1.060
(2.2 12)
4.8 18
(2.740)
0.113
(0.308)
-0.339
(0.320)
8.684
(3.041)
0.620(1.308)
2.427
(1.323)
1.304
(1.447)
1.270
(1.920)
2.934
(2.466)
-1.4 15
(0.530)
2.124
(1.142)
2.575
(1.03 7)
2.483
(0.789)
4.184
(1.789)
1.954
(0.768)
-4.464
(4.868)
-1.027(1.629)
-1.160
(1.641)
0.642
(1.748)
-3.164
(2.439)
-5.3 12
(3.045)
19.252
(3.362)
-1.541(1.725)
-0.57 1
(1.752)
0.446
(1.88 1)
-3.05 3
(2.568)
-5.735
(3.18 1)
0.373
(0.358)
0.206
(0.37 1)
19.8 18
(3.532)
-0.547(1.626)
-2.153
(1.645)
-1.299
(1.799)
-3.399
(2.387)
-3.432
(3.065)
0.847
(0.659)
-4.704
(1.4 19)
-3.048
(1.289)
-2.299
(0.98 1)
-2.05 7
(2.223)
-1.978
(0.955)
40386(6.051)
Note: Standard Errors in parentheses. All regressions are ordinary least squares.
Adjusted R-SquaredObservations
0.0 14397
0.003591
0.274993
0.004297
-0.004691
0.192893

___________________________________ Appendix Table IVariable Mean Standard DeviationMean Reservation Value 0.003 1.771
Amount Sent 12.412 4.540
Return Ratio 0.455 0.267
GSS Trust -1.552 0.498
GSS Help -1.609 0.489
GSS Fair 1.569 0.496
GSS Index o.ooo 2.225
Scale Trust 2.656 1.169
A Lot of Trust 2.856 1.230
A Little Trust 4.411 0.964
Others Honest 4.157 1.039
Cheat 4.130 1.252
Stranger 1.387 0.488
Caution 1.935 0.946
Lend Possessions 2.382 1151
Lend Money 2.851 1.143
Door Unlocked 4.287 1.077
Behavioral Index 0.009 2.093
Trustworthy 5309 0.935
Don't lie o.ooo 3.585
Pro Charity 2.403 0.960
Pro Transfer 2.171 0.890
Hours Volunteering 0.792 0 836
Dollars Donated 2.023 2.209
Past Windfall 1.434 0497
Lost Mail 2.542 0.990
White 0.605 0.490
Male 0.663 0.474
Freshman 0.669 0.471
Only Child 0.121 0.327

Appendix Table I (continued)Variable Mean Standard Deviation
Eldest Child 0.561 0.497
Father v/BA 0.892 0.305
Hours Worked For Pay i .037 1.175
Male * Girlfriends 0.177 0.382
Female * Boyfriends 0.079 0.270
Beer Servings 0.559 0.867
Membership in Service Group 0.460 0.499
Membership in Political Group 0.303 0.460
Membership in Joumalism Group 0.280 0 450
Membership in Sports Group 0.444 0.498
Membership in Religious Group 0.3 52 0.479
Number of Close Friends 1.940 0.597
Hours Studying Alone 2.634 0.555
Hours Watched TV 0.926 0.773
Promise 0.361 0.481
Different Sex 0.421 0.495
Different Country 0.221 0.416
Different Race 0.544 0.499
Time Since Met 0.383 0.902
Number of Common Friends 1.403 1.418
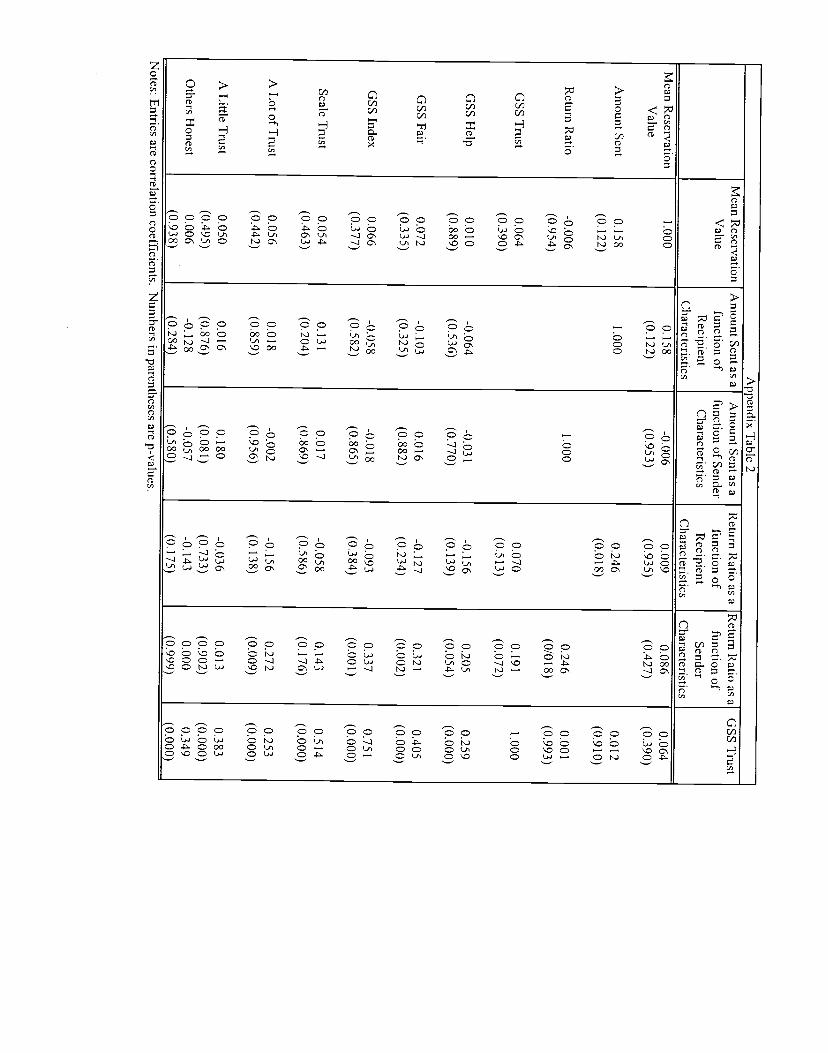
Appendix T
able 2 M
ean Reservation
Am
ount Sent as a A
mount Sent as a
Return R
atio as a R
eturn Ratio as a
GSS T
rust V
alue function of R
ecipient C
haracteristics
function of Sender C
haracteristics function of R
ecipient C
haracteristics
function of Sender
Characteristics
Mean R
eservation V
alue
Am
ount Sent
Return R
atio
GSS T
rust
GSS H
elp
GSS Fair
GSS Index
Scale Trust
A L
ot of Trust
A L
ittle Trust
Others H
onest
I .000
0.158
(0.122)
-0.006
(0.954)
0.064
(0.390)
0.0 10
(0.889)
0.072 (0.335)
0.066
(0.377)
0.054
(0.463)
0.056
(0.442)
0.050
(0.495) 0.006
(0.938)
0.158
(0.122)
1.000
-0.064
(0.536)
-0.103 (0.325)
-0.058
(0.582)
0.131
(0.204)
0.0 18
(0.859)
0.0 16
(0.876) -0.128 (0.284)
-0.006 (0.953)
1.000
-0.031
(0.770)
0.016
(0.882)
-0.0 18
(0.865)
0.0 17
(0.869)
-0.002
(0.956)
0.180
(0.08 1) -0.057 (0.580)
0.009
(0.935)
0.246
(0.0 18)
0.070
(0.5 13)
-0.156
(0.139)
-0.127 (0.234)
-0.093
(0.384)
-0.058
(0.586)
-0.156
(0.138)
-0.03 6
(0.733) -0.143 (0.175)
0.086
(0.427)
0.246
(0/018)
0.19 1
(0.072)
0.205
(0.054)
0.32 1
(0.002)
0.337
(0.00 1)
0.143
(0.176)
0.272
(0.009)
0.013
(0.902) 0.000
(0.999)
0.064
(0.390)
0.0 12
(0.9 10)
0.001
(0.993)
1.000
0.259
(0.000)
0.405
(0.000)
0.75 1
(0.000)
0.5 14
(0.000)
0.253
(0.000)
0.383
(0.000) 0.349
(0.000) N
otes: Entries are correlation coefficients. N
umbers in parentheses are p-values.
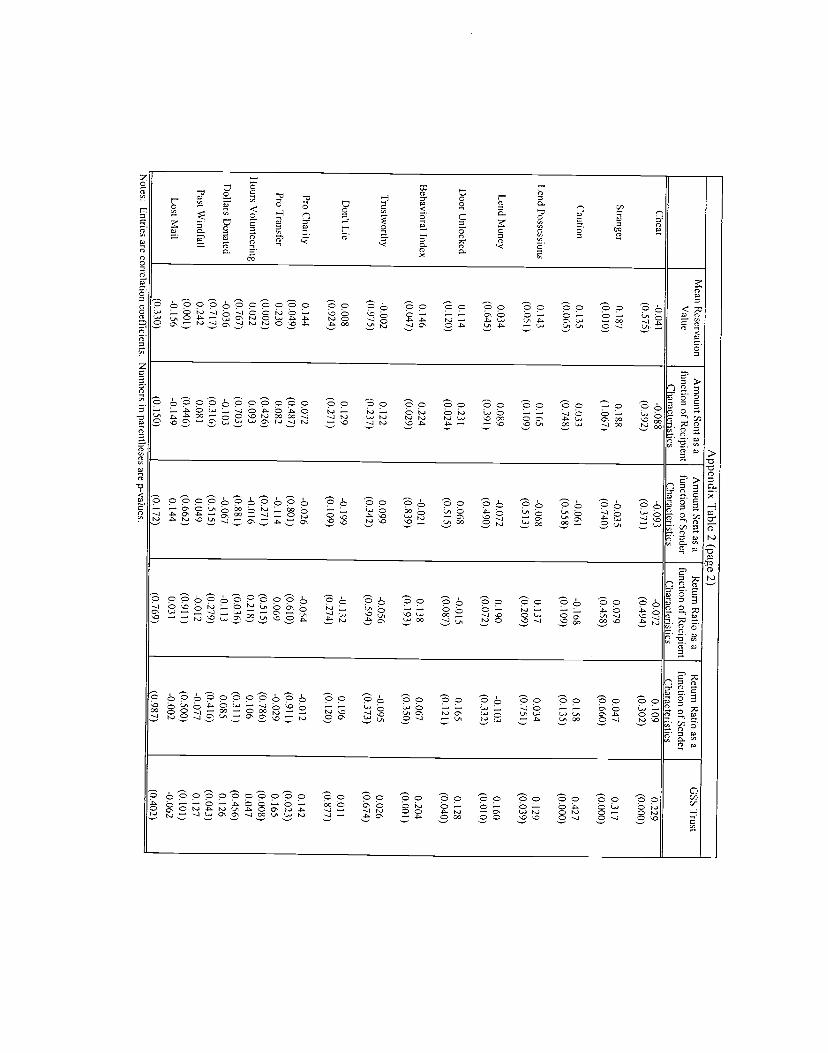
Appendix T
able 2 (page 2) M
ean Reservation
Am
ount Sent as a A
mount Sent as a
Return R
atio R
eturn Ratio
Value
function of Recipient
Characteristics
function of Sender C
haracteristics function of R
ecipient C
haracteristics
as a function of Sender
Characteristics
'trust
Cheat
Stranger
Caution
Lend Possessions
Lend M
oney
Door U
nlocked
Behavioral Index
Trustw
orthy
Don't L
ie
Pro Charity
Pro Transfer
I tours Volunteering
Dollars D
onated
Past Windfall
Lost M
ail
-0.041
(0.575)
0.187 (0.010)
0.135 (0.065)
0.143 (0.051)
0.034
(0.645)
0.114 (0.120)
0.146 (0.047)
-0.002
(0.975)
0.008 (0.924)
0.144
(0.049) 0.230
(0.002) 0.022
(0.767) -0.036 (0.717) 0.242
(0.00 1) -0.156
(0.330)
-0.088 (0.392)
0.188
(1.067)
0.033 (0.748)
0.165
(0.109)
0.089 (0.391)
0.231
(0.024)
0.224 (0.029)
0.122 (0.237)
0.129 (0.271)
0.072 (0.487) 0.082
(0.426) 0.093
(0.703) -0.103
(0.3 16) 0.081
(0.446) -0.149
(0.150)
-0.093 (0.37 1)
-0.035 (0.740)
-0.061
(0.558)
-0.068 (0.5 13)
-0.072 (0.490)
0.068 (0.5 15)
-0.021 (0.839)
0.099 (0.342)
-0.199 (0.109)
-0.026
(0.801) -0.114
(0.27 1) -0.016 (0.88 1) -0.067 (0.5 15) 0.049
(0.662) 0.144
(0.172)
-0.072 (0.494)
0.079 (0.458)
-0.168
(0.109)
0.137 (0.209)
0.190
(0.072)
-0.0 15 (0.087)
0.138 (0.193)
-0.056 (0.594)
-0.132 (0.274)
-0.054 (0.6 10) 0.069
(0.5 15) 0.2 18) (0.036) -0.113 (0.279) -0.0 12
(0.911) 0.031
(0.769)
0.109
(0.302)
0.047
(0.660)
0.158 (0.135)
0.034
(0.75 1)
-0.103 (0.332)
0.165 (0.121)
0.067 (0.350)
-0.095 (0.373)
0.196 (0.120)
-0.012 (0.911) -0.029 (0.786) 0.106
(0.3 11) 0.085 (0.4 16) -0.077 (0.500) -0.002
(0.987)
0.229
(0.000)
0.317 (0.000)
0.427
(0.000)
0.129
(0.039)
0.160 (0.0 10)
0.128
(0.040)
0.204 (0.001)
0.026 (0.674)
0.011 (0.877)
0.142
(0.023) 0.165
(0.008) 0.047
(0.456) 0.126 (0.043) 0.127
(0.101) -0.062
(0.402) N
otes: Entries are correlation coefficients.
Num
bers in parenttieses are p-values.
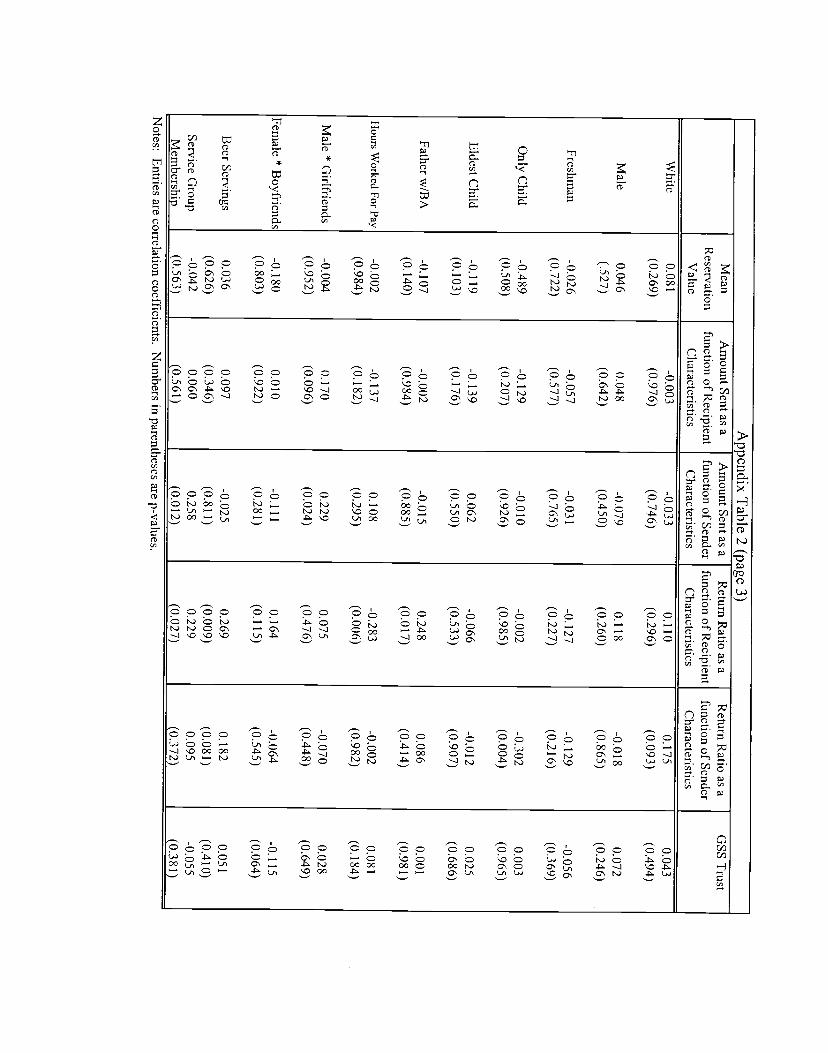
Appendix T
able 2 (page 3) M
ean A
mount Sent as a
Am
ount Sent as a R
eturn Ratio as a
Return R
atio as a G
SS Trust
Reservation
function of Recipient
function of Sender function of R
ecipient function of Sender
Value
Characteristics
Characteristics
Characteristics
Characteristics
White
0.081 -0.003
-0.033 0.110
0.175 0.043
(0.269) (0.976)
(0.746) (0.296)
(0093) (0.494)
Male
0.046 (1048
-(1079 0.118
-0.018 0.072
(.527) (0.642)
(0.450) (0.260)
(0865) (0.246)
Freshman
-0.026 -0.057
-0.031 -0.127
-0.129 -0.056
(0.722) (0.577)
(0.765) (0.227)
(0.216) (0.369)
Only C
hild -0.489
-0.129 -0.010
-0.002 -0.302
0.003 (0.508)
(0.207) (0.926)
(0.985) (0.004)
(0.965)
EldestC
hild -0.119
-0.139 0.062
-0.066 -0.012
0.025 (0.103)
(0.176) (0.550)
(0.533) (0.907)
(0.686)
Father w/B
A
-0.107 -0.002
-0.015 0.248
0.086 0.001
(0.140) (0.984)
(0.885) (0.017)
(0.414) (0.981)
Hours W
orked For Pay -0.002
-0.137 0.108
-0.283 -0.002
0.081 (0.984)
(0.182) (0.295)
(0.006) (0.982)
(0.184)
Male * G
irlfriends -0.004
0.170 0.229
0.075 -0.070
0.028 (0.952)
(0.096) (0.024)
(0.476) (0.448)
(0.649)
Female * B
oyfriends -0.180
0.010 -0.111
0.164 -0.064
-0.115 (0.803)
(0.922) (0.281)
(0.115) (0.545)
(0.064)
Beer S
ervings 0.036
0.097 -0.025
0.269 0.182
0.051 (0.626)
(0.346) (0.811)
(0.009) (0.081)
(0.410) S
ervice Group
-0.042 0.060
0.258 0.229
0.095 -0.05 5
Mem
bership (0.563)
(0.561) (0.012)
(0.027) (0.372)
(0.381) N
otes: Entries are correlation coefficients. N
umbers in parentheses are p-values.
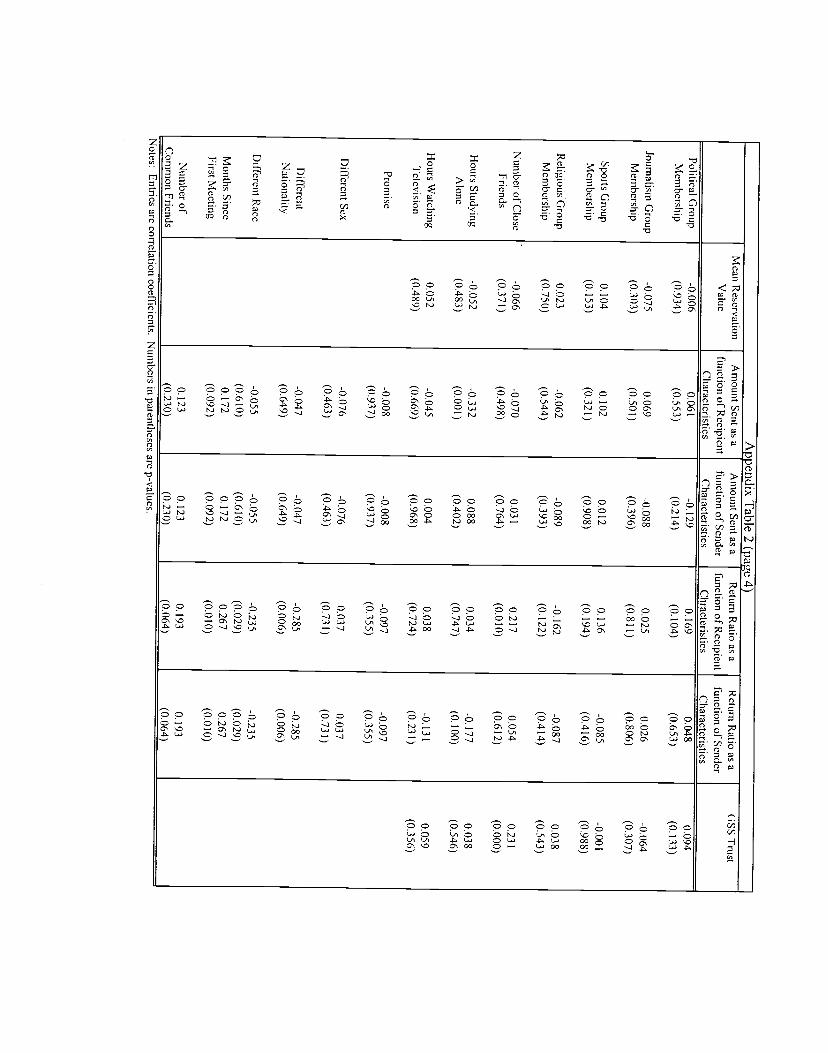
Appendix T
able 2 (paze 4) M
ean Reservation
Am
ount Sent as a
Am
ount Sent as a
Return R
atio R
eturn Ratio
Value
function of Recipient
Characteristics
function of Sender
Characteristics
as a function of R
ecipient C
hracteristjcs
as a function of S
ender G
SS
Trust
0.094
(0.133)
-0.064
(0.307)
-0.00 1
(0.988)
0.038
(0.543)
0.231
(0.000)
0.038
(0.546)
0.059 (0.356)
Political G
roup -0.006
0.061 -0.129
Mem
bership (0.934)
(0.553) (0.214)
Journalism G
roup -0.075
0.069 -0.088
Mem
bership (0.303)
(0.501) (0.396)
Sports G
roup 0.104
0.102 0.012
Mem
bership (0.153)
(0.321) (0.908)
Religious G
roup 0.023
-0.062 -0.089
Mem
bership (0.750)
(0.544) (0.393)
Num
ber ofClose
-0.066 -0.070
0.031 F
riends (0.371)
(0.498) (0.764)
Hours S
tudying -0.052
-0.332 0.088
Alone
(0.483) (0.001)
(0.402)
Hours W
atching 0.052
-0.045 0.004
Television
(0.489) (0.669)
(0.968)
Prom
ise -0.008
-0.008
(0.937) (0.937)
Different S
ex -0.076
-0.076 (0.463)
(0.463)
Different
-0.047 -0.047
Nationality
(0.649) (0.649)
Different R
ace -0.055
-0.055
(0.610) (0.610)
Months S
ince 0.172
0.172 F
irst Meeting
(0.092) (0.092)
Num
ber of 0.123
0.123 C
omm
on Friends
__________________ (0.230)
(0.230) N
otes: Entries are correlation coefficients.
Num
bers in parentheses are p-values.
0.169
(0.104)
0.025
(0.811)
0.136
(0.194)
-0.162
(0.122)
0.2 17
(0.0 10)
0.034
(0.747)
0.038
(0.724)
-0.097
(0.355)
0.037
(0.73 1)
-0.285
(0.006)
-0.235
(0.029) 0.267
(0.0 10)
0.193 (0.064
0.048
(0.653)
0.026
(0.806)
-0.085
(0.4 16)
-0.087
(0.4 14)
0.054
(0.6 12)
-0.177
(0.100)
-0.131
(0.231)
-0.097
(0.355)
0.037
(0.731)
-0.285
(0.006)
-0.23 5
(0.029) 0.267
(0.0 10)
0.193
(0.064)
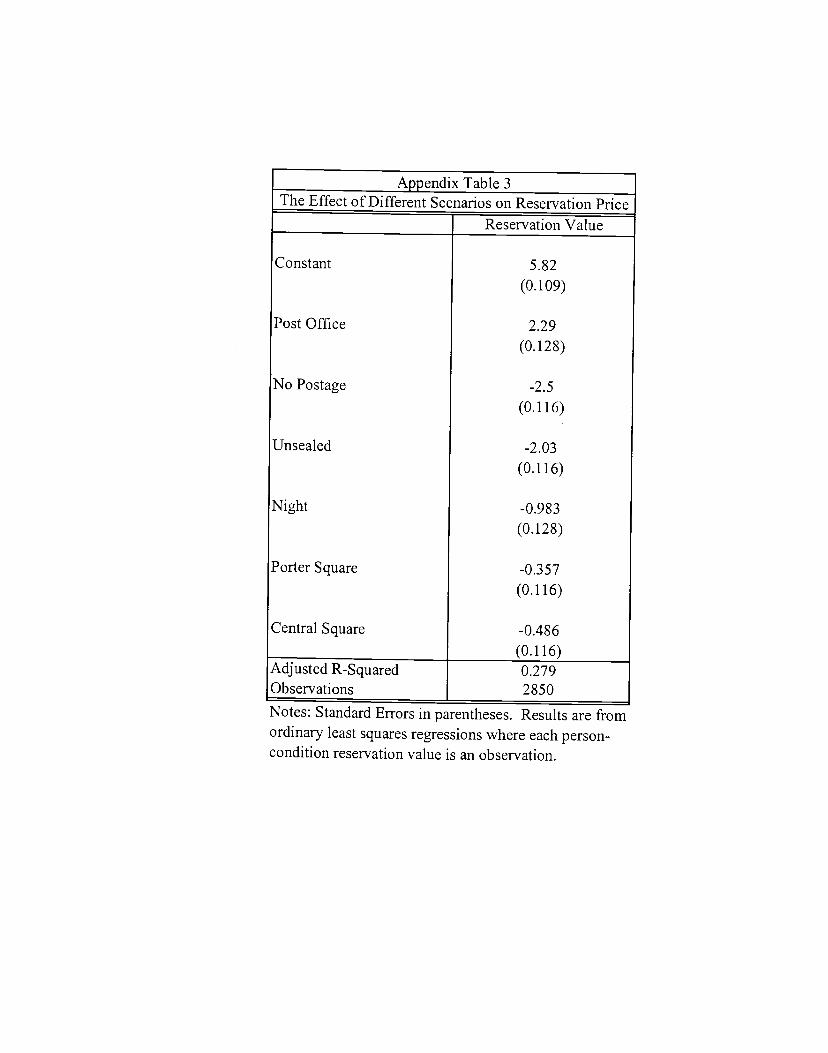
Appendix Table 3The Effect of Different Scenarios on Reservation Price
Reservation Value
Adjusted R-SquaredObservations
0.2792850
Notes: Standard Errors in parentheses. Results are fromordinary least squares regressions where each person-condition reservation value is an observation.
Constant
Post Office
No Postage
Unsealed
Night
Porter Square
Central Square
5.82
(0.109)
2.29
(0.128)
-2.5
(0.116)
-2.03
(0.116)
-0.983
(0.128)
-0.357
(0.116)
-0.486
(0.116)
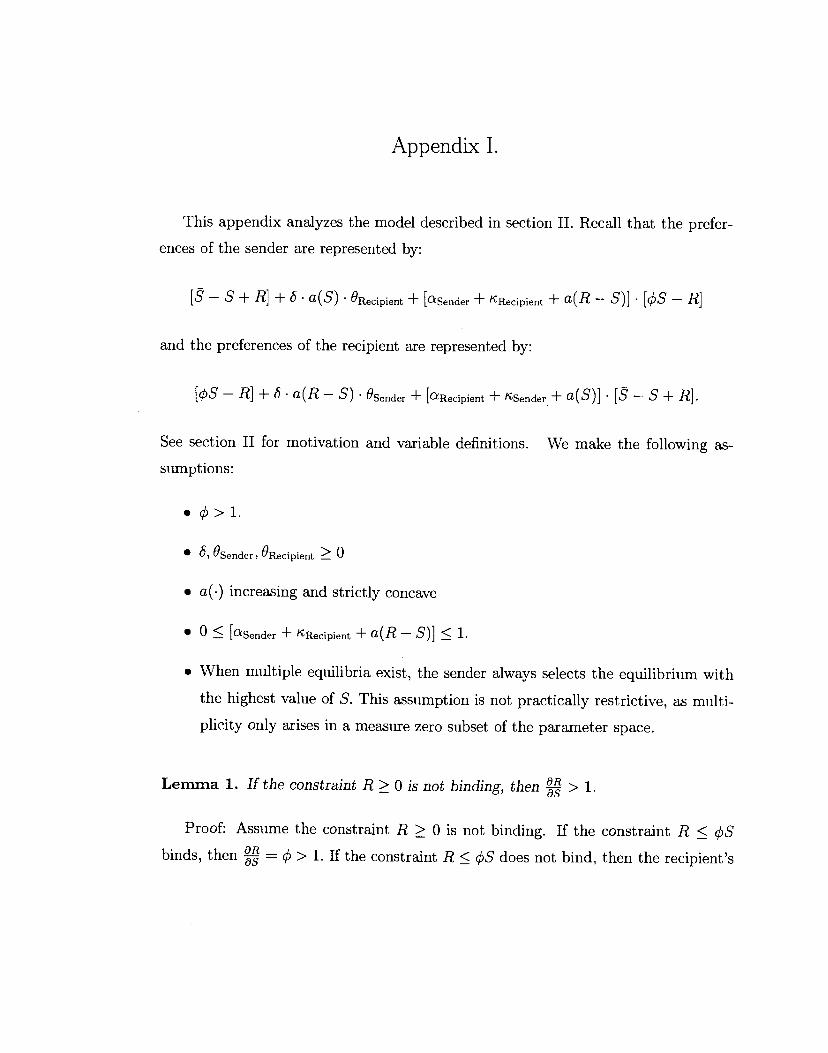
Appendix I.
This appendix analyzes the model described in section II. Recall that the prefer-
ences of the sender are represented by:
[S — S + R] +6. a(S) °Recipient + kSender + Recipient + a(R — S)] [q5S — R]
and the preferences of the recipient are represented by:
[S — R] + 6 a(R — S) °Sender + [Recipient + kSender + a(s)] .[ — S + R].
See section II for motivation and variable definitions. We make the following as-
suxnptions:
• >1.• & 9Sender, °Recipient � 0
• a(.) increasing and strictly concave
• 0 [CSender + 'Ftecipient + a(R — S)] < 1.
• When multiple equilibria exist, the sender always selects the equilibrium with
the highest value of S. This assumption is not practically restrictive, as multi-
plicity only arises in a measure zero subset of the parameter space.
Lemma 1. If the constraint R � 0 is not binding, then > 1.
Proof: Assume the constraint R > 0 is not binding. If the constraint R qSbinds, then 1. If the constraint R < qS does not bind, then the recipient's

choice of R must satisfy the first-order-condition:
—1 + 6. a'(R — 5) 0Sender + [cRecipient + frtSender + a(s)] = 0.
Totally differentiating this condition yields,
— 5•a"(R—S)•OSender—a'(S) >155—
5 a"(R — S) °Sender
since, a"(R — S) <0 and a'(S) > o.
Lemma 2. If the constraint R � 0 is not binding, then the constraint S < willbind.
Proof: Assume the constraint R � 0 is not binding. The derivative of the
sender's objective function is given by:
[_i + +6a'(S).ORjpjent+a'(R—S). —
i] [5—R1
+[LSender + kRecipient + a(R — S)]. [c —]. (1)
If — � 0, then by application of Lemma 1, the derivative of the sender's objective
function is strictly positive. If — <0, then the derivative of the sender's objective
function is greater than or equal to
SR SR+
which is strictly positive.U
Proposition The equilibrium values of S and R rise weakly with 6, 0Sender, 0Recipient,
Sender, Recipient, kSender, K Recipient.
Proof: Consider the following three mutually exclusive regions of the parameter
space:
Region I: Constraint S � 0 binds.
Region II: Neither constraint on S binds.
Region III: Constraint S S binds.
Let X represent a fixed parameter of the problem (e.g., (5). In the interior of
Region I, = 0 and = 0, since R = 0. In the interior of Region II, the constraint
R � 0 will bind (by application of Lemma 2). So jj = and = 0. In the
interior of Region III, = 0 and = -j• Using these intermediate results, it is
straightforward to show that in the interior each of the three regions, both S and R
rise weakly with (5, °Sender, °Recipient, Sender, aRecipient, KSender, kRecipient. This follows
from total differentiation of the first-order conditions of the sender and recipient
(setting S and R fixed when required).
It only remains to show that these comparative statics results continue to hold
when shifts occur between regions I, II, and III. Specifically, it is sufficient to rule
out the following three types of shifts: shifts from Region II to I (as X rises); shifts
from Region III to I (as X rises); shifts from Region III to II (as X rises).
Suppose that as X rises, a shift occurs from Region II to Region I at X =X. Let
S represent the limiting equilibrium value of S in Region II (as X rises to .k). ByLemma 2, the constraint R � 0 will bind. Let V(S, R, X), represent the value of the
sender's objective function. To justify a shift from Region II to I, it is necessary to
show that Vx(S, 0, X) < Vx(0, 0, k), since by assumption V(, 0, T) � V(0, 0, X). Itis straightforward to confirm that Vx(, 0, k) > Vx(0, 0, ) for all of the parameters
of interest: X E {6, 0Sender, °Recipient, aSender, aRecipient, kSender, KRecipient}. Hence, a shift
from Region II to Region I can not exist (unless S =0, which would not contradict
the Proposition in the first place).
Suppose that as X rises, a shift occurs from Region III to Region I at X =will be the equilibrium value of S in Region III. To justify a shift from
Region III to I, it is necessary to show that I, k) + VR(,Vx(O,O,t), since by assiunption V(,,k) � V(O,O,k). It is straightforward toconfirm that Vx(, I?, k) +VR(, , k). � Vx(O, 0, k), for all of the parametersof interest: X E {o, °Sender, °Recipient, aSender, Recipient, kSender, kRecipient}. Hence, a shift
from Region III to Region I can not exist.
Suppose that as X rises, a shift occurs from Region III to Region II at X = k.Let S < represent the limiting equilibrium value of S in Region II (as X falls toX). In Region II, the constraint R � 0 will bind (by Lemma 2). To justify a shiftfrom Region III to II, it is necessary to show that ,k) +VR(, ' ) 8X1S <
0, k), since by assumption V(, ,) � V(, 0, k). It is straightforward toconfirm that V(S, R, X) + VR(S, ' fi � 0, k), for all of the parametersof interest: X E {o,°Sender, 0Recipient, aSender, aaecipient, KSender, kRecipjent}. Hence, a shift
from Region III to Region II can not exist.

APPENDIX II: DEFINITIi OF VARIABLESVariable Name Question/Description Answer Range
Amount Sent Amount Sent from the Sender to theRecipient in the Trust Game. U - 15
Attendence "How often do you attend religious services?"
Never - 0Less than once a year -1
About once or twice a year - 2Several times a year - 3About once a month - 42-3 times a month - 5Nearly every week - 6
Every week - 7Several times a week - 8
Don't know, No Answer - 9
Beer ServingsLog of one plus the number of beers
consumed per week. Positive Real Numbers
Caution "When dealing with strangers, one is betteroff using caution before trusting them."
Disagree Strongly - 1Disagree Mildly - 2
Agree and Disagree equally - 3Agree Mildly -4
Agree Strongly - 5
Cheat Most students do not cheat on exams."
Disagree Strongly - 1Disagree Somewhat - 2
Disagree Slightly - 3Agree Slightly -4
Agree Somewhat - 5Agree Strongly - 6
Number of CloseFriends
Log of one plus the number of close friendslisted by the subject.
Positive Real Numbers
Number ofCommon Friends
Log of one plus the number of friends the twoparticipants of the trust game have in
common.Positive Real Numbers
DifferentNationality
Are the participants in the trust game fromdifferent countries? 0 - No, 1 - Yes
Different Sex Are the participants in the trust game ofopposite sex?
o - No, 1 - Yes
Different Race Are the participants in the trust game ofdifferent races? o - No, 1 - Yes
Dollars Donated Log of one plus the amount of money
donated_in_the_past_year.Positive Real Numbers
Door Unlocked "How often do you leave your doorunlocked?"
Very Often - 1Often - 2
Sometimes - 3Rarely -4Never - 5
Eldest Child Eldest Child 0- No, 1 - YesFather w/BA Father with a College degree 0 - No, 1 - YesFreshman Freshman 0 - No, 1 - Yes
GSS Fair"Do you think most people would try to take
advantage of you if they got a chance, orwould they try to be fair?"
Would take advantage of you - 1Would try to be fair - 2
Depends - 3Don't know - 8No Answer 9
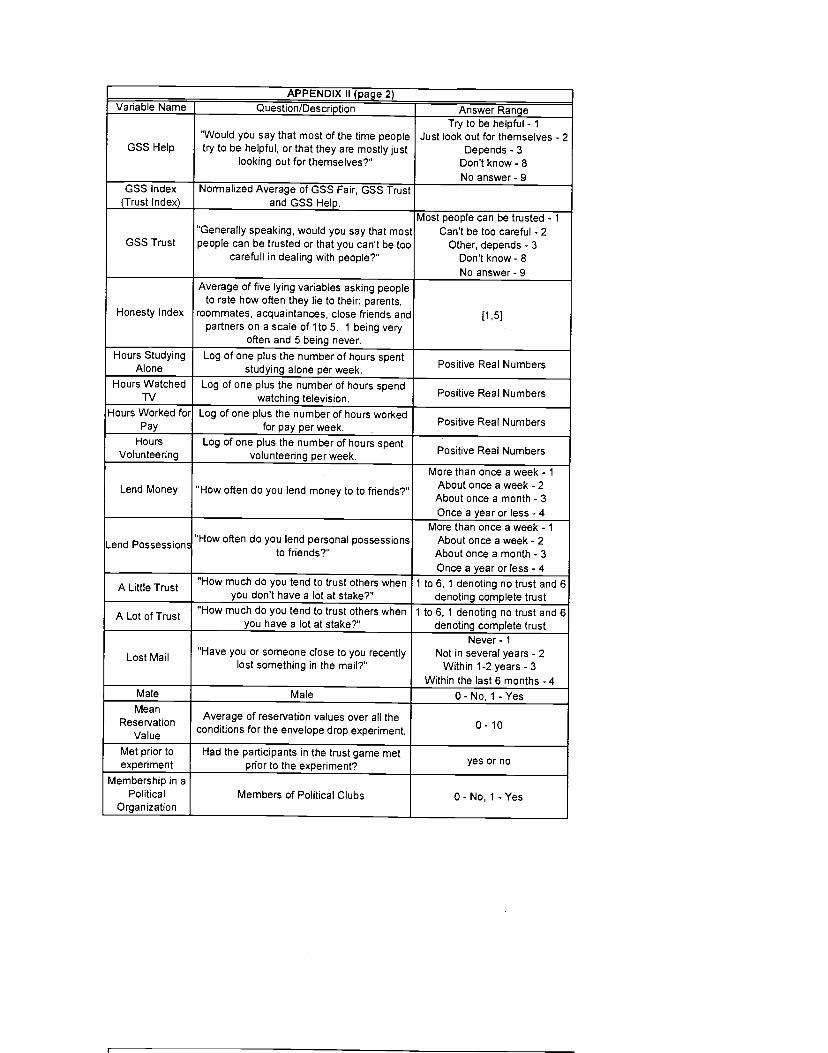
APPENDIX II (page 2)Variable Name Question/Description Answer Range
GSS Help"Would you say that most of the time peopletry to be helpful, or that they are mostly just
looking out for themselves?"
Try to be helpful - 1Just look out for themselves - 2
Depends - 3Don't know - 8No answer - 9
GSS Index(Trust Index)
Normalized Average of GSS Fair, GSS Trustand GSS Help.
GSS Trust"Generally speaking, would you say that mostpeople can be trusted or that you can't be too
carefull in dealing with people?"
Most people can be trusted - 1Can't be too careful - 2
Other, depends - 3Don't know - 8No answer - 9
Honesty Index
Average of five lying variables asking peopleto rate how often they lie to their: parents,
roommates, acquaintances, close friends andpartners on a scale of ito 5. 1 being very
often and 5 being never.
[1,5]
Hours StudyingAlone
Log of one plus the number of hours spentstudying alone per week.
Positive Real Numbers
Hours WatchedTV
Log of one plus the number of hours spendwatching television.
Positive Real Numbers
Hours Worked for
PayLog of one plus the number of hours worked
for pay per week.Positive Real Numbers
HoursVolunteering
Log of one plus the number of hours spentvolunteering per week.
Positive Real Numbers
Lend Money "How often do you lend money to to friends?"
More than once a week - 1About once a week - 2About once a month - 3Once a year or less - 4
Lend Possession "How often do you lend personal possessionsto friends?"
More than once a week -About once a week - 2About once a month - 3Once a year or less - 4
A Little Trust "How much do you tend to trust others whenyou don't have a lot at stake?"
1 to 6, 1 denoting no trust and 6denoting complete trust
A Lot of Trust "How much do you tend to trust others whenyou have a lot at stake?"
ito 6, 1 denoting no trust and 6denoting complete trust
Lost Mail "Have you or someone close to you recentlylost something in the mail?"
Never - 1Not in several years - 2
Within 1-2 years - 3Within the last 6 months - 4
Male Male O-No,1-YesMean
ReservationValue
Average of reservation values over all theconditions for the envelope drop experiment. 0- 10
Met prior toexperiment
Had the participants in the trust game metprior to the experiment? yes or no
Membership in aPolitical
OrganizationMembers of Political Clubs 0 - No, 1 - Yes

APPENDIX II (page 3)
Variable Name Question/Description Answer Range
Member of aJournalism Group
Members of Newspaper or Magazine 0 - No, 1 - Yes
Member of aService Group
Members of Service Organization 0 - No, 1 - Yes
Member of aSports Team Members of Sports Organizations 0 - No, 1 - Yes
Member of aReligious Group
Members of Religious Organizations 0 - No, 1 - Yes
Only Child Only Child 0 - No, 1 - Yes
Others Honest "Most people are basically honest."
Disagree Strongly - 1Disagree Somewhat - 2
Disagree Slightly - 3Agree Slightly - 4
Agree Somewhat - 5Agree Strongly - 6
Past Windfall"Have you ever spontaneously benefited fromthe generosity of someone you never knew
before?yes - 1 or no - 2
Pro-Charity"I don't mind giving money to others if they
need the money more than I do."
Disagree Strongly - 1Disagree Somewhat - 2
Agree Somewhat -3Agree Strongly - 4
Pro-Transfer "Personal Income shouldn't be determined bywork."
Disagree Strongly - 1Disagree Somewhat - 2
Agree Somewhat -3Agree Strongly - 4
Promise Promise to return at least as much to thesender as he sent. 0 - agreed, 1 - didn't agree
Return Ration (Amount returned to Sender)/(Amount
Recipient_received)[0,1]
Scale Trust"Rate your willingness to trust others on a
scale of 1-6 where us always trusting and 6is never trusting."
ito 6
Sexual Partner Does the participant have a sexual partner? 0 - No, 1 - YesStranger
(Trust Stranger)"You can't count on strangers anymore." More or less agree -
More or less disagree - 2
Time since Met Log of one plus the number of months thesender and recipient have known eachother. Positive Real Numbers
Trustworthy (Self-Reported
Trustworthiness)"I am trustworthy."
Disagree Strongly - 1Disagree Somewhat - 2
Disagree Slightly - 3Agree Slightly - 4
Agree Somewhat - 5Agree Strongly - 6
White White 0- No, 1 - Yes
Related Documents