Natural Resources Natural Resources Accounting for Forestry Accounting for Forestry Sector- A Case Study Sector- A Case Study Presenter : J Dash 1

Natural Resources Accounting for Forestry Sector- A Case Study Presenter : J Dash 1.
Dec 18, 2015
Welcome message from author
This document is posted to help you gain knowledge. Please leave a comment to let me know what you think about it! Share it to your friends and learn new things together.
Transcript
Natural Resources Natural Resources Accounting for Forestry Accounting for Forestry
Sector- A Case StudySector- A Case Study
Presenter : J Dash
1
Natural Resource Accounting for Forestry Natural Resource Accounting for Forestry Sector in KarnatakaSector in Karnataka
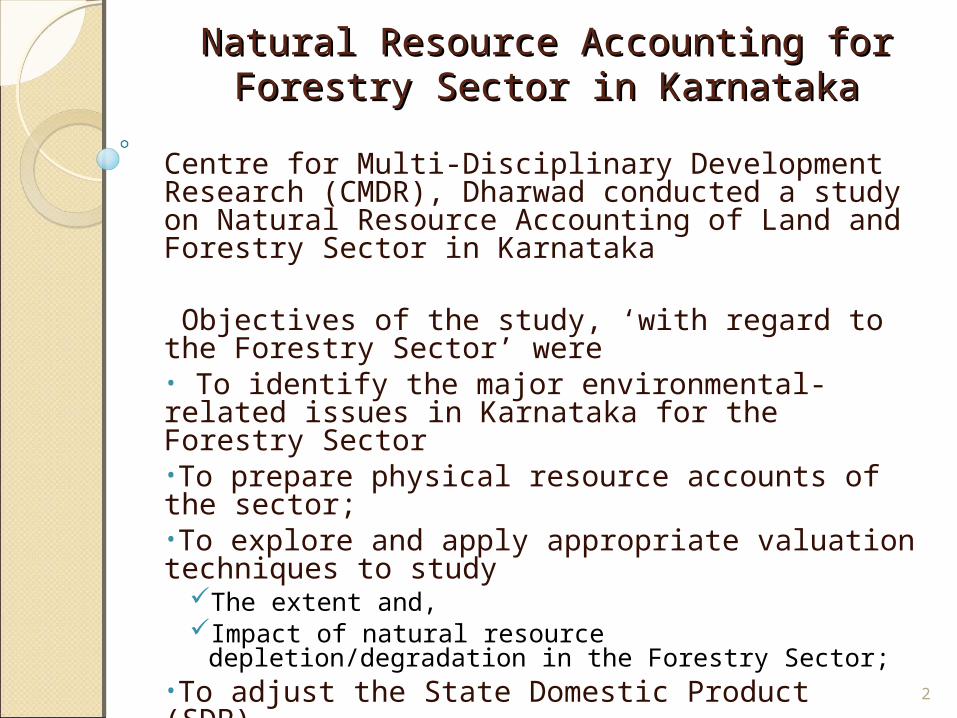
Centre for Multi-Disciplinary Development Research (CMDR), Dharwad conducted a study on Natural Resource Accounting of Land and Forestry Sector in Karnataka
Objectives of the study, ‘with regard to the Forestry Sector’ were• To identify the major environmental-related issues in Karnataka for the Forestry Sector •To prepare physical resource accounts of the sector; •To explore and apply appropriate valuation techniques to study
The extent and,Impact of natural resource depletion/degradation in the
Forestry Sector; •To adjust the State Domestic Product (SDP),
• For the changes in natural resource assets; and •To carry out analyses to identify data gaps
2
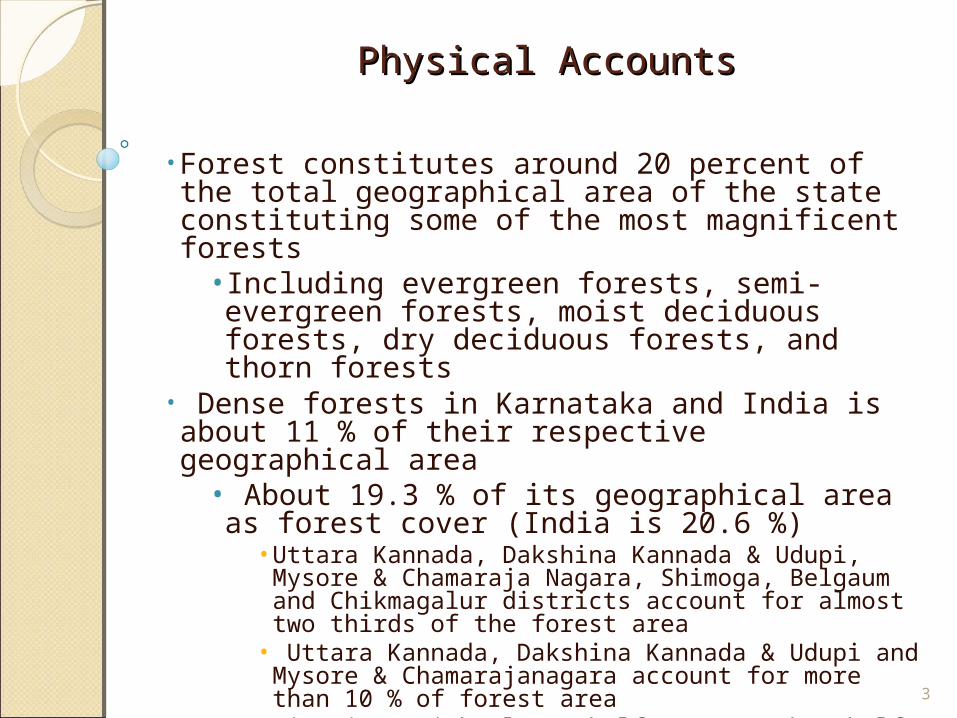
• Forest constitutes around 20 percent of the total geographical area of the state constituting some of the most magnificent forests
• Including evergreen forests, semi-evergreen forests, moist deciduous forests, dry deciduous forests, and thorn forests
• Dense forests in Karnataka and India is about 11 % of their respective geographical area
• About 19.3 % of its geographical area as forest cover (India is 20.6 %)
• Uttara Kannada, Dakshina Kannada & Udupi, Mysore & Chamaraja Nagara, Shimoga, Belgaum and Chikmagalur districts account for almost two thirds of the forest area
• Uttara Kannada, Dakshina Kannada & Udupi and Mysore & Chamarajanagara account for more than 10 % of forest area
• Districts with almost half or more than half of the forest cover are: Chamrajanagar, Chickmaglur, Shimoga, Udupi, Kannad Dakshin, Kannad Uttar, Kodagu.
3
Physical AccountsPhysical Accounts
4
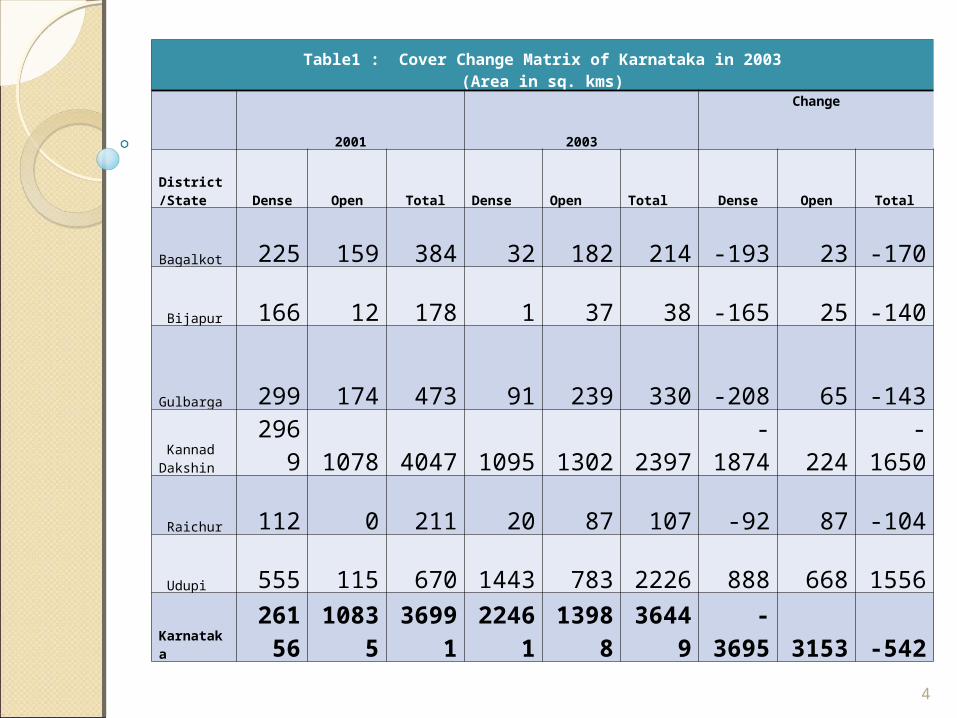
Table1 : Cover Change Matrix of Karnataka in 2003(Area in sq. kms)
2001 2003
Change
District/State Dense Open Total Dense Open Total Dense Open Total
Bagalkot 225 159 384 32 182 214 -193 23 -170
Bijapur 166 12 178 1 37 38 -165 25 -140
Gulbarga 299 174 473 91 239 330 -208 65 -143
Kannad Dakshin 2969 1078 4047 1095 1302 2397 -1874 224 -1650
Raichur 112 0 211 20 87 107 -92 87 -104
Udupi 555 115 670 1443 783 2226 888 668 1556
Karnataka
26156 10835 36991 22461 13988 36449 -3695 3153 -542
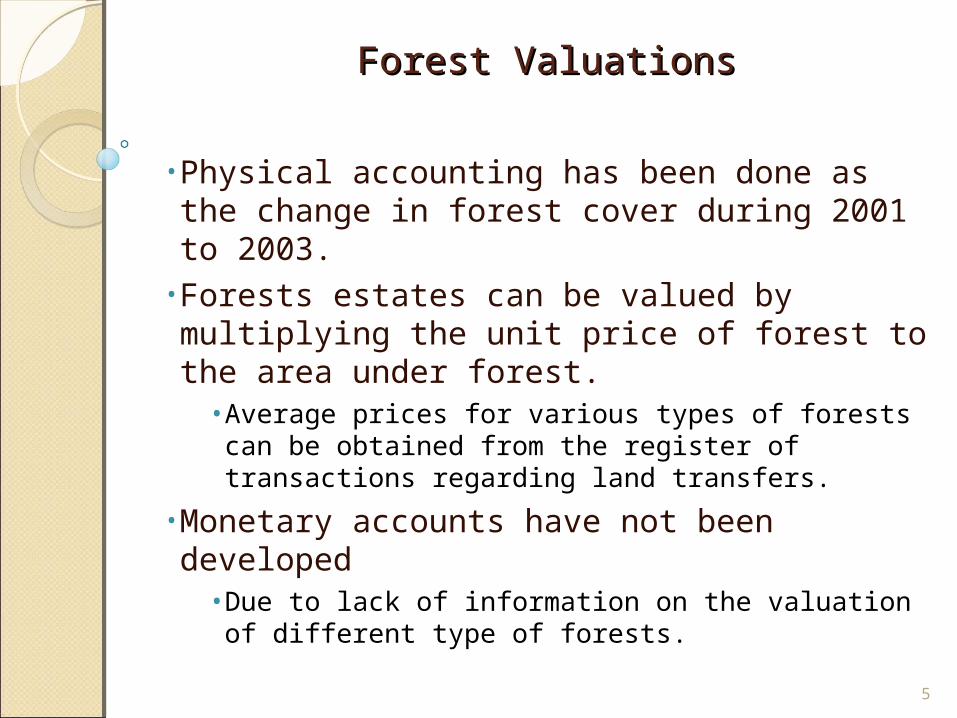
• Physical accounting has been done as the change in forest cover during 2001 to 2003.
• Forests estates can be valued by multiplying the unit price of forest to the area under forest.
• Average prices for various types of forests can be obtained from the register of transactions regarding land transfers.
• Monetary accounts have not been developed • Due to lack of information on the valuation of different type of forests.
5
Forest ValuationsForest Valuations
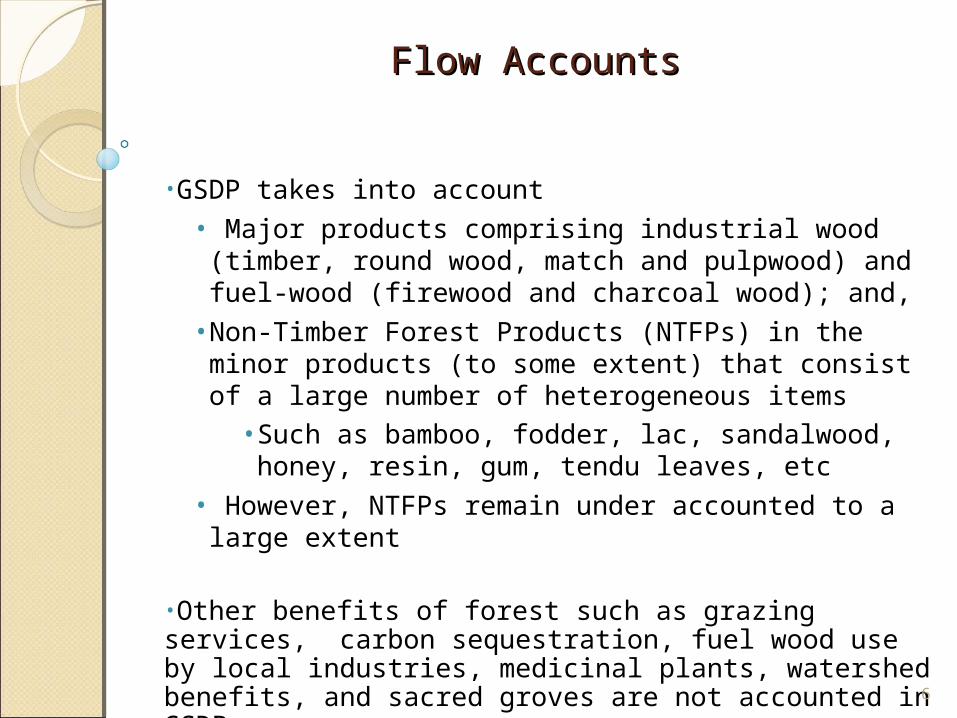
•GSDP takes into account• Major products comprising industrial wood (timber, round wood, match and pulpwood) and fuel-wood (firewood and charcoal wood); and,
• Non-Timber Forest Products (NTFPs) in the minor products (to some extent) that consist of a large number of heterogeneous items
• Such as bamboo, fodder, lac, sandalwood, honey, resin, gum, tendu leaves, etc
• However, NTFPs remain under accounted to a large extent
•Other benefits of forest such as grazing services, carbon sequestration, fuel wood use by local industries, medicinal plants, watershed benefits, and sacred groves are not accounted in GSDP 6
Flow Accounts Flow Accounts
Estimation of under accounting of NTFPs and Estimation of under accounting of NTFPs and contribution of other products and services:contribution of other products and services:
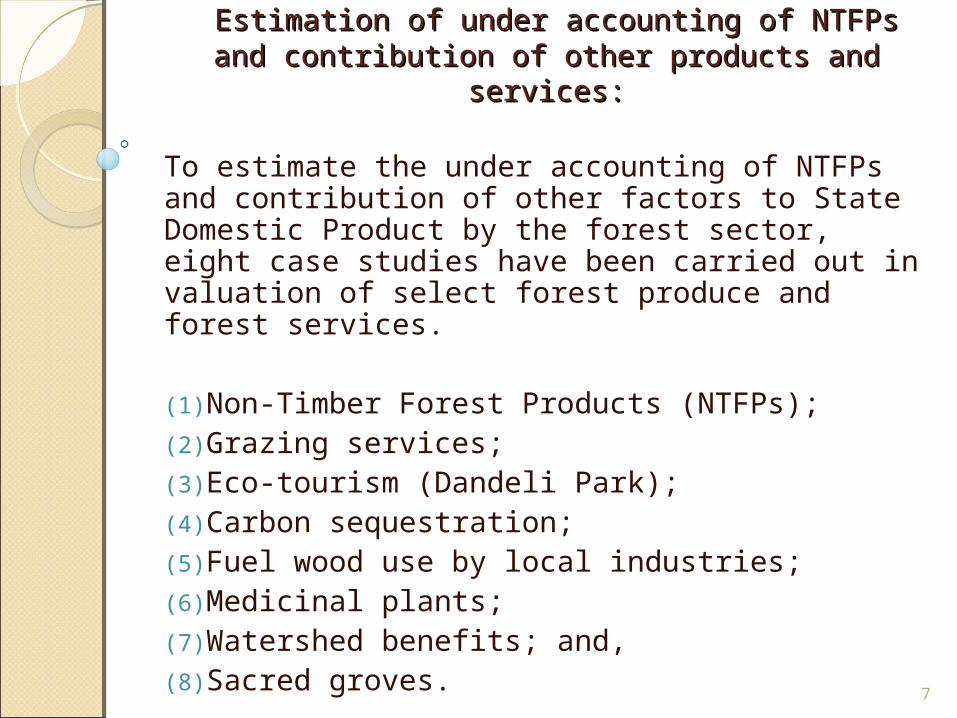
To estimate the under accounting of NTFPs and contribution of other factors to State Domestic Product by the forest sector, eight case studies have been carried out in valuation of select forest produce and forest services.
(1)Non-Timber Forest Products (NTFPs); (2)Grazing services; (3)Eco-tourism (Dandeli Park); (4)Carbon sequestration; (5)Fuel wood use by local industries; (6)Medicinal plants; (7)Watershed benefits; and, (8)Sacred groves.
7
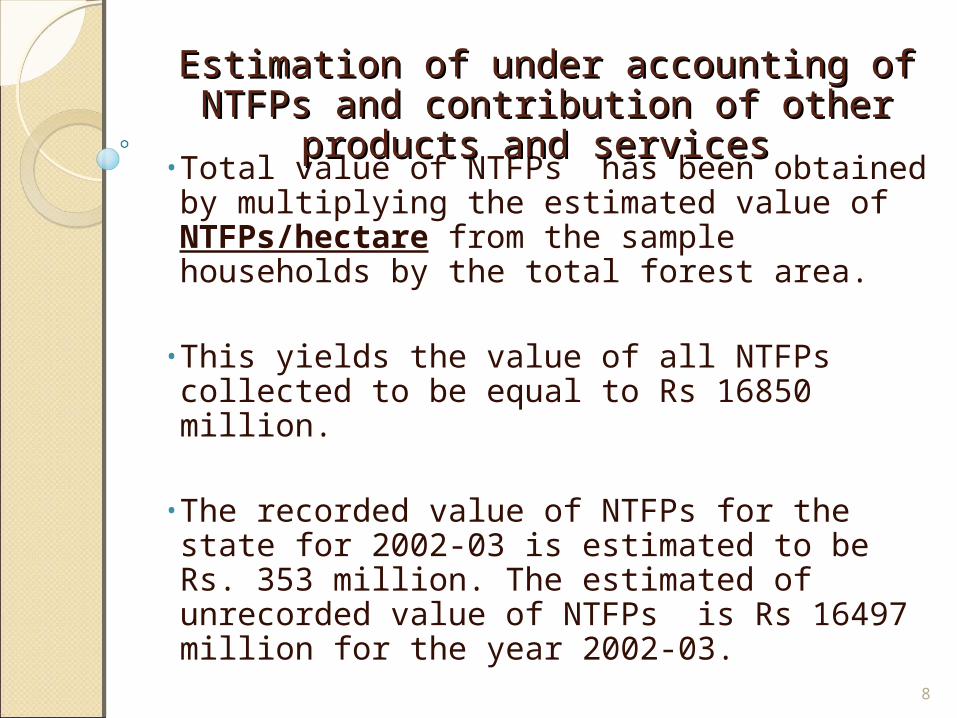
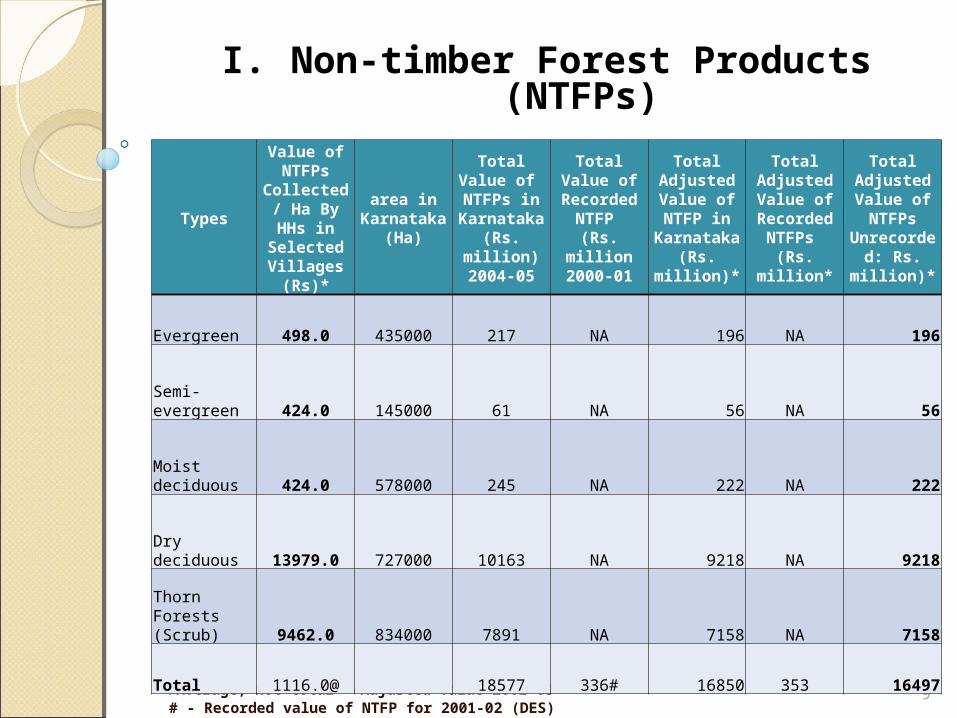
• Total value of NTFPs has been obtained by multiplying the estimated value of NTFPs/hectare from the sample households by the total forest area.
• This yields the value of all NTFPs collected to be equal to Rs 16850 million.
• The recorded value of NTFPs for the state for 2002-03 is estimated to be Rs. 353 million. The estimated of unrecorded value of NTFPs is Rs 16497 million for the year 2002-03.
8
Estimation of under accounting of NTFPs and Estimation of under accounting of NTFPs and contribution of other products and servicescontribution of other products and services
@- Average, not total *-Adjusted value 2002-03# - Recorded value of NTFP for 2001-02 (DES)
9
Types
Value of NTFPs
Collected / Ha By HHs in Selected
Villages (Rs)*
area in Karnataka
(Ha)
Total Value of NTFPs in Karnataka
(Rs. million)2004-05
Total Value of Recorded NTFP (Rs.
million2000-01
Total Adjusted Value of NTFP in
Karnataka (Rs. million)*
Total Adjusted Value of
Recorded NTFPs (Rs.
million*
Total Adjusted Value of NTFPs
Unrecorded: Rs. million)*
Evergreen 498.0 435000 217 NA 196 NA 196
Semi-evergreen 424.0 145000 61 NA 56 NA 56
Moist deciduous 424.0 578000 245 NA 222 NA 222
Dry deciduous 13979.0 727000 10163 NA 9218 NA 9218
Thorn Forests (Scrub) 9462.0 834000 7891 NA 7158 NA 7158
Total 1116.0@ 18577 336# 16850 353 16497
I. Non-timber Forest Products (NTFPs)
•About 45 percent of the livestock owning households fully depend on forest for grazing their livestock. These households do not use other sources of fodder.
•The livestock of the sample households and then the animal units during different seasons grazing in the forests of villages of the study area has been used to calculate the grazing intensity during various seasons and forest types.
10
II Grazing Services
• Using the average grazing intensity (Animal Units per HH) in different types of forests, animal units per hectare have been estimated in various types of forests.
• On an average, 4.18 tonnes* of fodder per year per livestock is required
• The study has assumed that 75 percent@ of the fodder requirement of the live stock (i.e., 3.14 ton out of total requirement of 4.18 ton) is met from the grazing facilities of the forest.
• Using the average price of fodder in the market of Rs. 600 per ton, the estimate of the fodder supplied by various forest types in the state is of the magnitude of about Rs. 6350 million in 2003-04.
*-Reported average fodder requirement per year per live stock (Govt. of Karnataka 1996)
@- Commom property resources and rural poor in dry regions of India, Jodhe NS (1992)
11
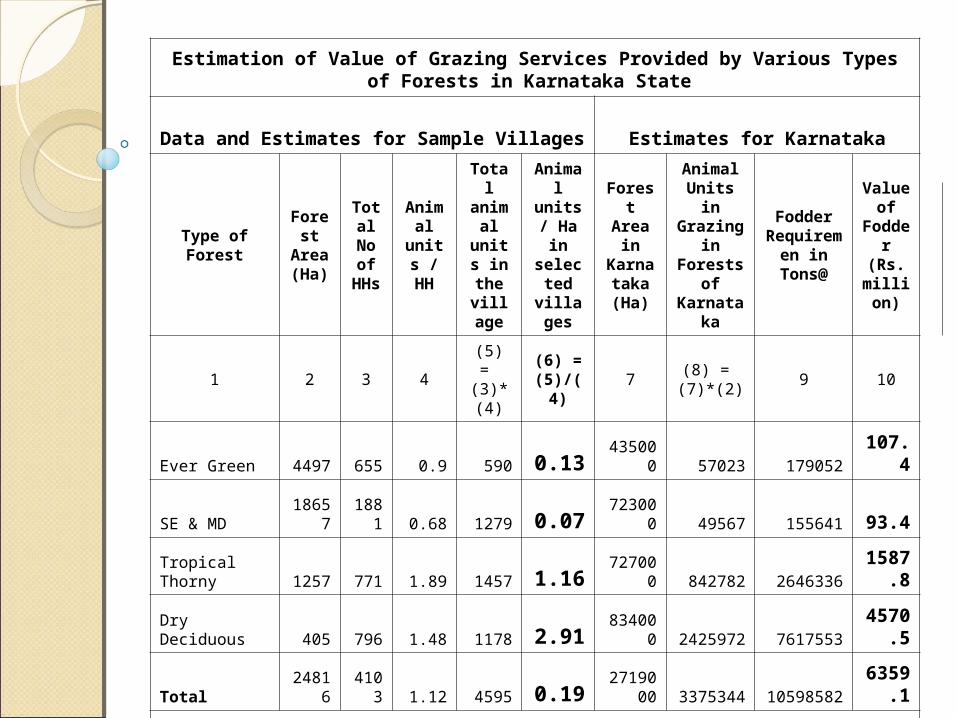
Estimation of Value of Grazing Services Provided by Various Types of Forests in Karnataka State
Data and Estimates for Sample Villages Estimates for Karnataka
Type of Forest
Forest
Area (Ha)
Total No of
HHs
Animal
units / HH
Total animal units in the village
Animal units/ Ha in
selected villages
Forest Area in Karnat
aka (Ha)
Animal Units in Grazing
in Forests of
Karnataka
Fodder Requireme
n in Tons@
Value of
Fodder (Rs.
million)
1 2 3 4(5) =
(3)*(4)(6) =
(5)/(4)7
(8) = (7)*(2)
9 10
Ever Green 4497 655 0.9 590 0.13 435000 57023 179052 107.4
SE & MD 18657 1881 0.68 1279 0.07 723000 49567 155641 93.4
Tropical Thorny 1257 771 1.89 1457 1.16 727000 842782 2646336
1587.8
Dry Deciduous 405 796 1.48 1178 2.91 834000 2425972 7617553
4570.5
Total 24816 4103 1.12 4595 0.19271900
0 3375344 10598582
6359.1
Note: @ = Assumption: Fodder required/ animal unit is 3.14 ton per year
III. III. Recreation and Tourism Services Recreation and Tourism Services
Travel cost method used for estimating the recreational value of forests.
Based on the primary data from 300 sample visits, total recreational value was estimated using the recreational value for Dandeli Wild Life Sanctuary calculated through multiple log linear model. Visitors’ statistics were collected from different sources (Govt. and private guesthouses, lodges and hotels etc.) and an approximate estimate was made of 18,000 visitors for recreational purpose.
The sample average travel expenses incurred by individuals to reach the site was estimated to be Rs. 480.2 /-per visit.
The sample average consumer’s surplus per visit corresponding to log-linear and linear demand curves were estimated to be Rs.500/- and Rs.1711/- respectively.
The recreational value of forests in the study area was then estimated as Rs 37,142.86 per Sq km. Taking the wildlife area of 6319.33 Sq km in the State, recreational value of forests for the State as a whole was estimated to be Rs 211 million constituting 0.02 % of GSDP at current prices for 2002-03
13
IV. IV. Carbon Sequestration Carbon Sequestration
Carbon content of forests has been calculated assuming forests biomass density of 92t/Ha (Haripriya 2000) and multiplying this density i.e. per Ha biomass density (i.e. 92t) by the total forest area (i.e.3828430 Ha).
Estimated biomass of 352215560 tonnes has been converted to carbon values by assigning a carbon content of 0.5mg per mg over dry biomass (i.e. 176107780t - 352215560 tonnesX0.5mg)
Carbon was valued at the rate of US$20/metric tonne of carbon (Haripriya 2000). The value of dollar was around Rs. 47.33 during the year 2002-03.
The estimated value of carbon content in the forests of Karnataka is Rs. 16,6598 million.
14
V. V. Fuel Wood Used by Local IndustriesFuel Wood Used by Local Industries
A sample of 32 local producers using fuel wood for various purposes was selected for the case study.
The value of fuel wood consumed by the sample units ranges from as low as Rs. 480 per annum to as high as Rs. 25,00,000/- per annum. Valuation of fuel wood consumption by local producers was not attempted to avoid double counting. The sale of fuel wood by government depots is already accounted for in the national income accounts and has also been included the case study on consumption of fuel wood for household purposes.
15
• On the basis of the average willingness to pay for the preservation of medicinal plants, total willingness to pay in the selected villages was found to be Rs.8220/- and the willingness to pay per hectare was calculated to be Rs 23.48.
• Total willingness to pay for the preservation of medicinal plants for the State as a whole was estimated as Rs.90 million taking the total forest area as 3828430 hectares.
• This constituted 0.01 percent share of medicinal plants in GSDP of the State for the year 2002-03.
16
VI Medicinal Plants
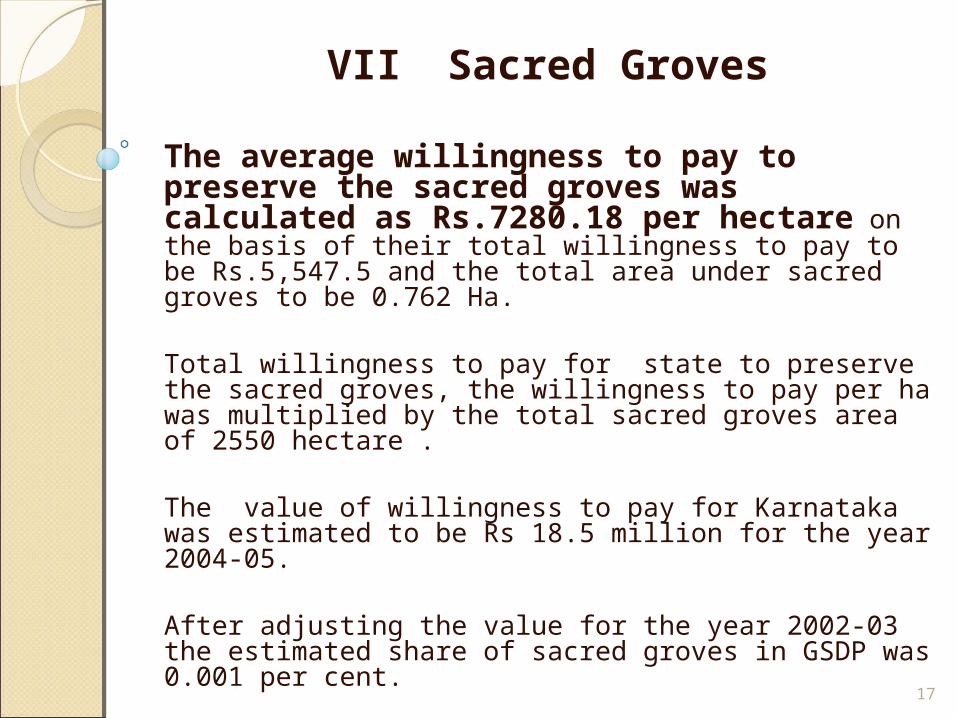
VII Sacred Groves
The average willingness to pay to preserve the sacred groves was calculated as Rs.7280.18 per hectare on the basis of their total willingness to pay to be Rs.5,547.5 and the total area under sacred groves to be 0.762 Ha.
Total willingness to pay for state to preserve the sacred groves, the willingness to pay per ha was multiplied by the total sacred groves area of 2550 hectare .
The value of willingness to pay for Karnataka was estimated to be Rs 18.5 million for the year 2004-05.
After adjusting the value for the year 2002-03 the estimated share of sacred groves in GSDP was 0.001 per cent.
17
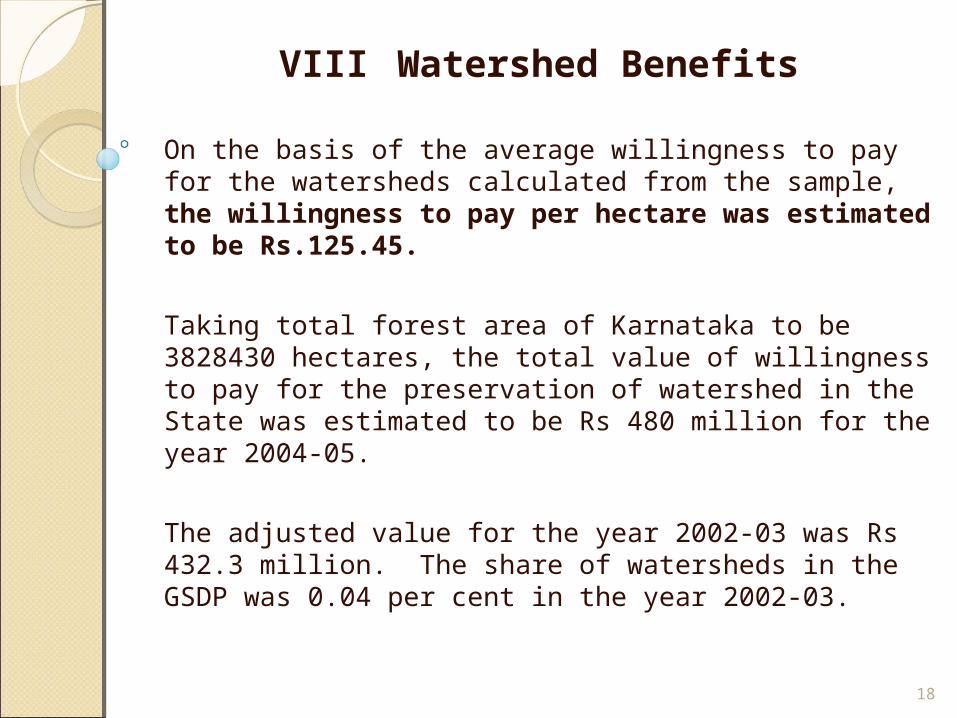
VIII Watershed Benefits
On the basis of the average willingness to pay for the watersheds calculated from the sample, the willingness to pay per hectare was estimated to be Rs.125.45.
Taking total forest area of Karnataka to be 3828430 hectares, the total value of willingness to pay for the preservation of watershed in the State was estimated to be Rs 480 million for the year 2004-05.
The adjusted value for the year 2002-03 was Rs 432.3 million. The share of watersheds in the GSDP was 0.04 per cent in the year 2002-03.
18
19
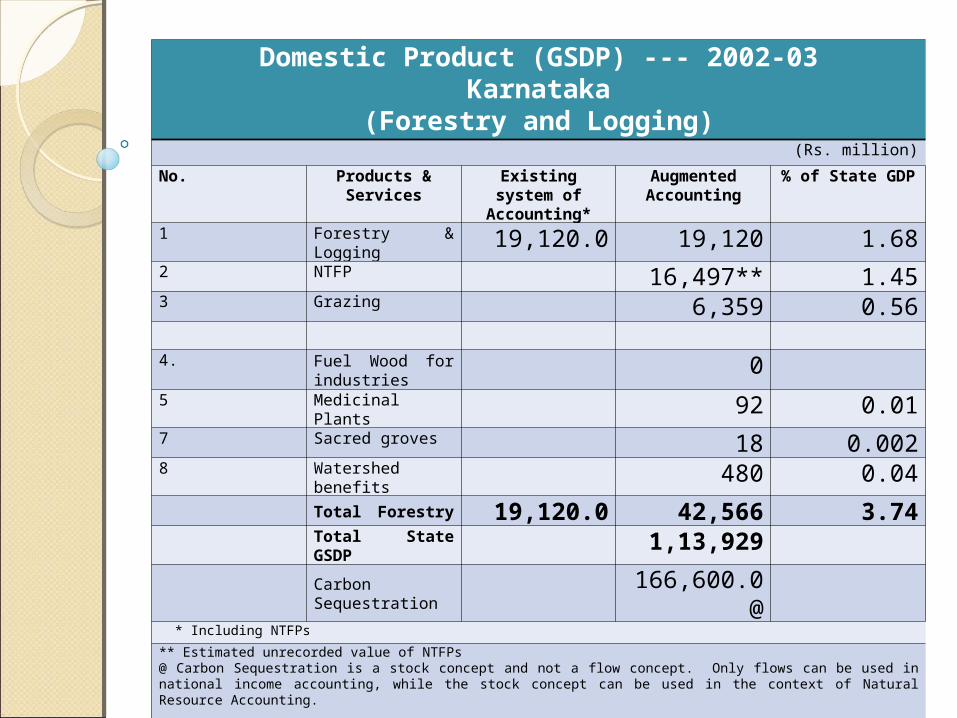
Domestic Product (GSDP) --- 2002-03Karnataka
(Forestry and Logging)(Rs. million)
No. Products & Services Existing system of Accounting*
Augmented Accounting
% of State GDP
1 Forestry & Logging 19,120.0 19,120 1.682 NTFP 16,497** 1.453 Grazing 6,359 0.56
4. Fuel Wood for industries
05 Medicinal Plants 92 0.017 Sacred groves 18 0.0028 Watershed benefits 480 0.04
Total Forestry 19,120.0 42,566 3.74Total State GSDP 1,13,929Carbon Sequestration 166,600.0@
* Including NTFPs
** Estimated unrecorded value of NTFPs @ Carbon Sequestration is a stock concept and not a flow concept. Only flows can be used in national income accounting, while the stock concept can be used in the context of Natural Resource Accounting.
20
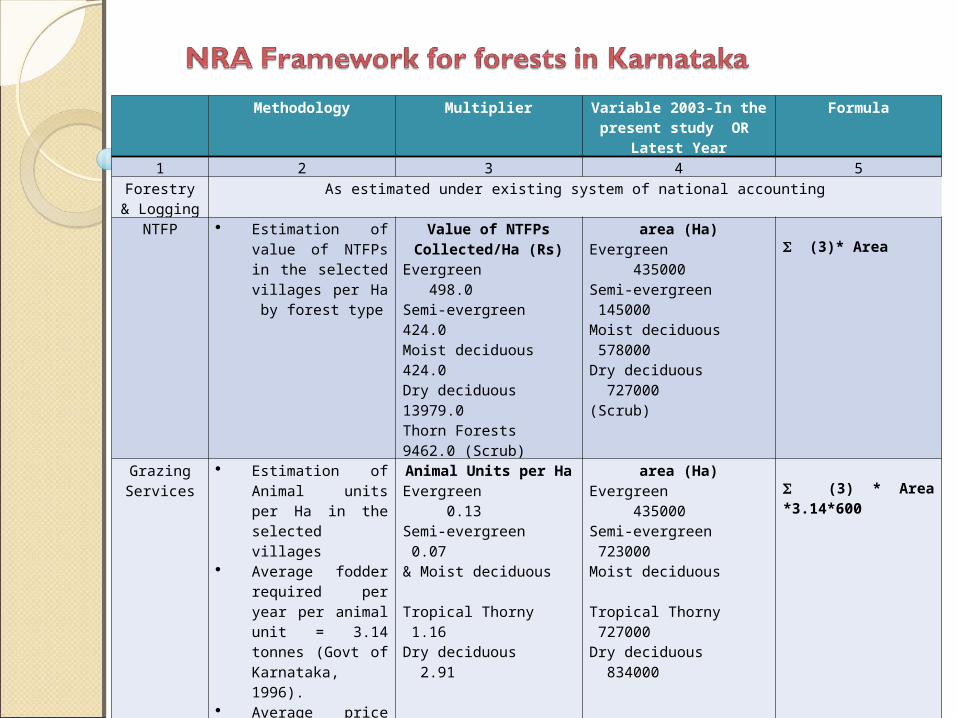
Methodology Multiplier Variable 2003-In the present study OR
Latest Year
Formula
1 2 3 4 5
Forestry & Logging
As estimated under existing system of national accounting
NTFP Estimation of value of NTFPs in the selected villages per Ha by forest type
Value of NTFPs Collected/Ha (Rs)
Evergreen 498.0Semi-evergreen 424.0Moist deciduous 424.0Dry deciduous 13979.0Thorn Forests 9462.0 (Scrub)
area (Ha)Evergreen 435000Semi-evergreen 145000Moist deciduous 578000Dry deciduous 727000(Scrub)
(3)* Area
Grazing Services
Estimation of Animal units per Ha in the selected villages
Average fodder required per year per animal unit = 3.14 tonnes (Govt of Karnataka, 1996).
Average price of fodder in the market is about Rs. 600 per ton
Animal Units per Ha Evergreen 0.13Semi-evergreen 0.07& Moist deciduous Tropical Thorny 1.16Dry deciduous 2.91
area (Ha)Evergreen 435000Semi-evergreen 723000Moist deciduous Tropical Thorny 727000Dry deciduous 834000
(3) * Area *3.14*600
Recreational Value of Wildlife
Sanctuaries
Estimation of recreational value of Dandeli wildlife sanctuary
Recreational value of wildlife sanctuaries = Rs. 37142.86 per Sq Km.
Wildlife sanctuary area of the state = 6319.33 Sq Km
(3)*Wildlife sanctuary area
21
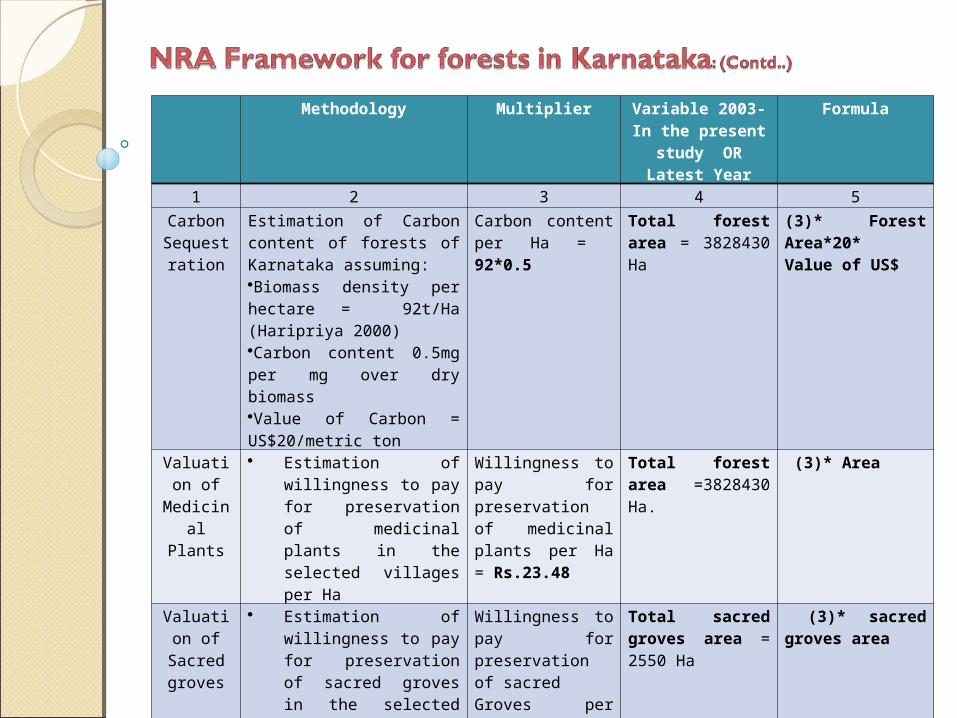
Methodology Multiplier Variable 2003-In the present study OR
Latest Year
Formula
1 2 3 4 5
Carbon Sequestrati
on
Estimation of Carbon content of forests of Karnataka assuming: Biomass density per hectare = 92t/Ha (Haripriya 2000) Carbon content 0.5mg per mg over dry biomass Value of Carbon = US$20/metric ton
Carbon content per Ha = 92*0.5
Total forest area = 3828430 Ha
(3)* Forest Area*20* Value of US$
Valuation of
Medicinal Plants
Estimation of willingness to pay for preservation of medicinal plants in the selected villages per Ha
Willingness to pay for preservation of medicinal plants per Ha = Rs.23.48
Total forest area =3828430 Ha.
(3)* Area
Valuation of Sacred
groves
Estimation of willingness to pay for preservation of sacred groves in the selected villages per Ha
Willingness to pay for preservation of sacred Groves per Ha=Rs.7280.18
Total sacred groves area = 2550 Ha
(3)* sacred groves area
Valuation of
Watershed benefits
Estimation of willingness to pay for preservation of watershed in the selected villages
Willingness to pay for preservation of watershed per Ha = Rs. Rs.125.45
Total forest area =3828430 Ha
(3)* Area
Related Documents