Nile Basin Initiative Transboundary EnvironmentalAction Project National Nile Basin Water Quality Monitoring Baseline Report for Ethiopia PREPARED BY FITSUM MERID SANITARY ENGINEER (NATIONAL CONSULTANT)

Welcome message from author
This document is posted to help you gain knowledge. Please leave a comment to let me know what you think about it! Share it to your friends and learn new things together.
Transcript

Nile Basin Initiative
Transboundary EnvironmentalAction Project
National
Nile Basin Water Quality Monitoring Baseline Report
for
Ethiopia
PREPARED BY
FITSUM MERID
SANITARY ENGINEER
(NATIONAL CONSULTANT)

Prepared by Fitsum Merid, National Consultant
National Water Quality Monitoring Baseline Report in the Nile River Basin, Ethiopia
i
TABLE OF CONTENTS
LIST OF TABLES.............................................................................................................................................................IV LIST OF FIGURES............................................................................................................................................................ V ACRONYMS AND ABBREVIATIONS .........................................................................................................................VI EXECUTIVE SUMMERY ................................................................................................................................................. 1 1 BACKGROUND ........................................................................................................................................................ 5
1.1 INTRODUCTION..................................................................................................................................................... 5 1.2 STUDY OBJECTIVES.............................................................................................................................................. 5 1.3 SCOPE OF THE STUDY........................................................................................................................................... 6 1.4 DESCRIPTION OF PROJECT AREA.......................................................................................................................... 7
1.4.1 Abbay (Blue Nile) River Basin ...................................................................................................................... 7 1.4.2 Tekeze (Atbar) River Basin ......................................................................................................................... 13 1.4.3 Baro-Akobo (Sobat) River Basin................................................................................................................. 14
2 METHODOLOGY................................................................................................................................................... 16 2.1 REVIEW OF EXISTING INFORMATION & MONITORING EFFORT ...................................................... 16
2.1.1 Questionnaire Development and Field Trip ............................................................................................... 16 2.1.2 Inventories of Available Information .......................................................................................................... 16 2.1.3 Subjects of Inventories................................................................................................................................. 16 2.1.4 List of Data Sources .................................................................................................................................... 16 2.1.5 Data Verification, Analysis & Interpretation ............................................................................................. 17 2.1.6 Reporting and Data Presentation ............................................................................................................... 17 2.1.7 Institutional and Legal Framework for Water Quality Monitoring........................................................... 18
2.2 DEVELOPMENT OF WATER QUALITY MONITORING .......................................................................... 18 3 INSTITUTIONAL ARRANGEMENTS AND LEGAL FRAMEWORK FOR WRM AND WQ CONTROL ......................................................................................................................................................................... 19
3.1 INSTITUTIONAL FRAMEWORK ................................................................................................................. 19 3.2 POLICY AND LEGISLATIVE FRAMEWORKS........................................................................................... 21
3.2.1 Policy Framework ....................................................................................................................................... 21 3.2.2 Legislative Framework................................................................................................................................ 22
3.3 WATER QUALITY GUIDELINES, STANDARDS AND REGULATIONS ................................................ 23 3.4 EFFORTS ON WATER QUALITY MONITORING, WATER RESOURCES ASSESSMENT
PRACTICES AND STRATEGIES................................................................................................................... 24 3.5 COMMUNITIES, NGOS & CBOS INVOLVEMENT & AWARENESS IN WATER QUALITY
MANAGEMENT .............................................................................................................................................. 26 3.6 LOGISTICAL AND ADMINISTRATIVE CAPACITIES AT FEDERAL & REGIONAL LEVES FOR
WATER QUALITY MONITORING ............................................................................................................... 27 3.6.1 Water Quality Control Laboratories .......................................................................................................... 27 3.6.2 Status of Public Health Laboratories.......................................................................................................... 28 3.6.3 Staff Availability in WQ Management Activities ........................................................................................ 28 3.6.4 Staff Training & Upgrading Programs....................................................................................................... 28 3.6.5 Logistic Problems........................................................................................................................................ 29 3.6.7 Sampling Frequency.................................................................................................................................... 29
4 WATER QUALITY OVERVIEW OF ABBAY (BLUE NILE) RIVER BASIN.............................................. 31 4.1 WATER QUALITY STATUS OF ABBAY RIVER & ITS TRIBUTARIES..................................................................... 31
4.1.1 Total Dissolved Solids (TDS) and Electrical Conductivity (EC) ............................................. 31 4.1.2 Pesticides and Metals ...................................................................................................................... 31 4.1.3 pH ........................................................................................................................................................... 33 4.1.4 Nutrient ................................................................................................................................................. 33 4.1.5 Sodium and Potassium .................................................................................................................... 33 4.1.6 Total Suspended Solids (TSS) .......................................................................................................... 34
Prepared by Fitsum Merid, National Consultant
National Water Quality Monitoring Baseline Report in the Nile River Basin, Ethiopia
ii
4.1.7 Chloride ................................................................................................................................................ 34 4.2 WATER QUALITY OF LAKE TANA & OTHER SMALLER LAKES......................................................... 37 4.3 QUALITY OF GROUND AND SURFACE WATER AS DRINKING WATER SOURCE IN THE
ABBAY BASIN ................................................................................................................................................ 40 4.3.1 Physico-chemical Quality ............................................................................................................... 40
5 WATER QUALITY OVERVIEW OF TEKEZE (ATBARA) RIVER BASIN................................................ 41 5.1 GROUND WATER QUALITY ........................................................................................................................ 41
5.1.1 Hardness............................................................................................................................................... 41 5.1.2 Nitrate & Nitrites ................................................................................................................................. 41 5.1.3 Total Dissolved Solids (TDS) ............................................................................................................. 42 5.1.4 Pesticides and Metals ...................................................................................................................... 42 5.1.5 pH, Carbon-dioxide, Carbonate and Bicarbonate ............................................................... 42 5.1.6 Sulfate ................................................................................................................................................... 43 5.1.7 Iron and Manganese ....................................................................................................................... 43 5.1.8 Fluoride ................................................................................................................................................. 43
5.2 SURFACE WATER QUALITY ....................................................................................................................... 43 6 WATER QUALITY OVERVIEW OF BARO-AKOBO (SOBAT) RIVER BASIN........................................ 45
6.1 SURFACE WATER QUALITY ....................................................................................................................... 45 6.1.1 Turbidity & Color ..................................................................................................................................... 45 6.1.2 Iron and Manganese ............................................................................................................................ 45 6.1.3 pH and SAR ......................................................................................................................................... 45 6.1.4 TDS and EC.................................................................................................................................................... 45 6.1.5 Nitrate and Nitrite .............................................................................................................................. 46
6.2 GROUND WATER QUALITY ........................................................................................................................ 46 6.2.1 Turbidity and Color............................................................................................................................ 46 6.2.2 Pesticides and Metals ........................................................................................................................... 46 6.2.3 Iron and Manganese ....................................................................................................................... 46 6.2.4 pH and SAR ......................................................................................................................................... 46 6.2.5 Hardness, TDS & EC ................................................................................................................................ 47 6.2.6 Nitrate and Nitrite................................................................................................................................... 47
7 POTENTIAL SOURCES OF POLLUTION........................................................................................................ 48 7.1 INDUSTRIAL WASTE .................................................................................................................................... 48 7.2 DOMESTIC WASTE ........................................................................................................................................ 48 7.3 AGRICULTURAL RUNOFF ........................................................................................................................... 48 7.4 EROSION .......................................................................................................................................................... 48 7.5 MINING AND QUARRYING.......................................................................................................................... 49
8 PROPOSED WATER QUALITY MONITORING............................................................................................. 50 8.1 OBJECTIVES.................................................................................................................................................... 50 8.2 PRELIMINARY SURVEYS............................................................................................................................. 50 8.3 DESCRIPTION OF THE PROJECT AREA..................................................................................................... 51 8.4 SAMPLING SITES ........................................................................................................................................... 51 8.5 MONITORING MEDIA AND VARIABLES .................................................................................................. 60
8.5.1 Appropriate Media ...................................................................................................................................... 60 8.5.2 Water Quality Variables ....................................................................................................................... 60
8.6 FREQUENCY AND SAMPLING .................................................................................................................... 62 8.7 ANYLITICAL COST OF WATER SAMPLES ............................................................................................... 64
9 CONCLUSION AND RECOMMENDATION .................................................................................................... 65 9.1 CONCLUSION ..................................................................................................................................................... 65 9.2 RECOMMENDATIONS .......................................................................................................................................... 65
REFERENCES AND USEFUL LITERATURES.......................................................................................................... 67 ANNEXES........................................................................................................................................................................... 69
ANNEX-1 GAMBELLA REGION ANALYTICAL CAPACITY................................................................................ 69
Prepared by Fitsum Merid, National Consultant
National Water Quality Monitoring Baseline Report in the Nile River Basin, Ethiopia
iii
ANNEX-1 GAMBELLA REGION ANALYTICAL CAPACITY................................................................................ 70 ANNEX-2 TIGRAY REGION ANALYTICAL CAPACITY ...................................................................................... 71 ANNEX-3 BENSHANGUL-GUMUZ REGION ANALYTICAL CAPACITY.......................................................... 72 ANNEX-4 AMHARA REGION ANALYTICAL CAPACITY .................................................................................... 73 ANNEX-5 QUESTIONNAIRE...................................................................................................................................... 74

Prepared by Fitsum Merid, National Consultant
National Water Quality Monitoring Baseline Report in the Nile River Basin, Ethiopia
iv
LIST OF TABLES
TABLE-S. 1 ABBAY BASIN SURFACE WATER QUALITY RANGE........................................................................................................ 1 TABLE-S. 2 ABBAY BASIN GROUNDWATER QUALITY RANGE......................................................................................................... 2 TABLE-S. 3 TEKEZE BASIN GROUNDWATER QUALITY RANGE ......................................................................................................... 2 TABLE-S. 4 TEKEZE BASIN SURFACE WATER QUALITY RANGE ........................................................................................................ 3 TABLE-S. 5 BARO-AKOBO BASIN GROUNDWATER QUALITY RANGE........................................................................................... 3 TABLE-S. 6 BARO-AKOBO BASIN SURFACE WATER QUALITY RANGE ........................................................................................... 3 TABLE-1. 1 ABBAY BASIN STATISTICS........................................................................................................................................... 10 TABLE-1. 2 MAIN DRAINAGE BASIN UNITS OF THE ABBAY BASIN................................................................................................ 11 TABLE-1. 3 FACTS AND FIGURES OF LAKE TANA......................................................................................................................... 12 TABLE-1. 4 MORPHOLOGICAL DATA OF SMALL RESERVOIRS ..................................................................................................... 12 TABLE-1. 5 TAKEZE RIVER BASIN STATISTICS ................................................................................................................................ 13 TABLE-1. 6 BARO-AKOBO BASIN CATCHMENT AREA AND MEAN ANNUAL RUNOFF................................................................ 15 TABLE-2. 1 DATA TYPE & THEIR SOURCES .................................................................................................................................. 17 TABLE-3. 1 : MAJOR ORGANIZATIONS INVOLVED IN WQ MONITORING AND CONTROL ACTIVITIES ........................................ 20 TABLE-3. 2 AVAILABILITY OF REGIONAL, ZONAL AND BASIC WQ LABORATORIES .................................................................... 27 TABLE-3. 3 TRAINING PROGRAMS OFFERED FROM 1998 TO 2000 ........................................................................................... 29 TABLE-3. 4 ANNUAL AVERAGE NO OF TESTS & ACTIVITIES CONDUCTED BY WQ SURVEILLANCE PROGRAM(EXTERNAL
AGENCY BY MOH UNTIL YEAR 2002) ............................................................................................................................... 30 TABLE-4. 1 WQ RESULT FOR MAJOR RIVERS & LAKES WITHIN THE ABBAY BASIN (USBR, 1964) ........................................ 35 TABLE-4. 2 WQ RESULT FOR MAJOR RIVERS (BCEOM, 1996, CITED BY BCEOM ABBAY RIVER BASIN STUDY, 1998) ......... 36 TABLE-4. 3 WATER QUALITY STATISTICS OF LAKE TANA .............................................................................................................. 37 TABLE-4. 4 PHYSICO-CHEMICAL RESULT OF MAJOR LAKES WITHIN THE ABBAY BASIN................................................................ 39 TABLE-4. 5 NUMBER OF PHYSICO-CHEMICAL TEST RESULT FROM MOWR DATA BASE ............................................................... 40 TABLE-5. 1 NUMBER OF SAMPLES FAIL TO MEET GUIDELINE VALUE (DATA FROM NEDCO, 1998) .......................................... 41 TABLE-5. 2 NUMBER OF PHYSICO-CHEMICAL TEST RESULT (TEKEZE BASIN) ................................................................................ 44 TABLE-5. 3 TEKEZE BASIN MICROBIOLOGICAL TEST RESULT OF EXISTING WS SCHEMES 1990 TO 2001 ..................................... 44 TABLE-8. 1LINKS BETWEEN TYPES OF MONITORING SITE AND PROGRAM OBJECTIVES ................................................................... 52 TABLE-8. 2 IDENTIFICATION OF MONITORING SITES AT ABBAY BASIN .......................................................................................... 56 TABLE-8. 3 IDENTIFICATION OF MONITORING SITES AT BARO-AKOBO BASIN ............................................................................. 58 TABLE-8. 4 IDENTIFICATION OF MONITORING SITES AT TEKEZE BASIN.......................................................................................... 59 TABLE-8. 5 PROPOSED TRANS-BOUNDARY IMPORTANT MONITORING STATIONS..................................................................... 60 TABLE-8. 6 VARIABLES FOR BASIC & EXPANDED MONITORING................................................................................................. 61 TABLE-8. 7 SAMPLING FREQUENCY FOR GEMS/WATER STATIONS ......................................................................................... 63 TABLE-8. 8 COST FOR PHYSICO-CHEMICAL ANALYSIS ................................................................................................................ 64
Prepared by Fitsum Merid, National Consultant
National Water Quality Monitoring Baseline Report in the Nile River Basin, Ethiopia
v
LIST OF FIGURES
FIGURE-1. 1 LOCATION MAP OF ABBAY, TEKEZE & BARO-AKOBO RIVERS BASINS ................................................................ 9 FIGURE-1. 2 PROPORTION OF TEKEZE BASIN CATCHMENT AREA .......................................................................................... 14
FIGURE-4. 1 LOCATION OF SAMPLING SITES BY USBR, 1964 .............................................................................................. 32 FIGURE-4. 2 MEAN MONTHLY SUSPENDED SEDIMENT LOAD (GILGEL ABBAY NEAR MERAWI) ............................................ 33
FIGURE-8. 1 PROPOSED SAMPLING SITES FOR ABBAY RIVER BASIN ...................................................................................... 53 FIGURE-8. 2 PROPOSED SAMPLING SITES FOR TEKEZE RIVER BASIN....................................................................................... 54 FIGURE-8. 3 PROPOSED SAMPLING SITES FOR BARO-AKOBO RIVER BASIN .......................................................................... 55

Prepared by Fitsum Merid, National Consultant
National Water Quality Monitoring Baseline Report in the Nile River Basin, Ethiopia
vi
ACRONYMS AND ABBREVIATIONS
2,4-D Dichlorophenoxyacetic acid AAWSA Addis Ababa Water and Sewerage Authority AMU Arba-Minch University ASARECA
Association for Strengthening Agricultural Research in Eastern and Central Africa
BH Borehole BOD Bio-chemical Oxygen Demand BoH Bureau of Health CBO Community Based Organizations COD Chemical Oxygen Demand CRS Catholic Relief Service CSA Central Statistics Authority CSE Conservation Strategy of Ethiopia DO Dissolved Oxygen EC Electrical Conductivity ENHRI Ethiopian Nutrition and Health Research Institute EPA Environmental Protection Authority ESRDF Ethiopian Social Rehabilitation Fund EWRM Ethiopian Water Resources Management FTU Formazin Turbidity Unit H Health HCS Harerege Catholic Secretariat HDW Hand Dug Well HP Hand Pump IGS Institute of Geological Survey IMR Infant Mortality Rate KAP Knowledge, Attitude and Practice LAB Laboratory MMR Maternal Mortality rate MoA Ministry of Agriculture MoH Ministry of Health MoWR Ministry of Water Resources NBI Nile Basin Initiative NGO Non Governmental Organizations NPC National Project Coordinator NTEAP Nile Trasboundary Environmental Action Project NTU Nephlometric Turbidity Unit PGR Population Growth Rate PMU Project Management Unit QSAE Quality and standard Authority of Ethiopia

Prepared by Fitsum Merid, National Consultant
National Water Quality Monitoring Baseline Report in the Nile River Basin, Ethiopia
vii
SAR Sodium Adsorption Ration SNNP Southern Nation and Nationalities People TCU True Color Unit TDS Total Dissolved Solids TNT Too Numerous To Count UNOPS United Nation Organization for Projects Services USBR United States Bureau of Reclamation USGS United States Geological Survey WHO World Health Organization WME Water Mines and Energy WMERD Water Mines and Energy Resources Development WQ Water Quality WQM Water Quality Management WRDB Water Resources Development Bureau WRM Water Resources Management WS Water Service WSSS Water Supply & Sanitation Services WWDSE Water Works Design and Supervision Enterprise

Prepared by Fitsum Merid, National Consultant
National Water Quality Monitoring Baseline Report in the Nile River Basin, Ethiopia
1
EXECUTIVE SUMMERY
This document presents water quality baseline status of the Nile Basin within Ethiopia. The study is based on physical and chemical water quality data generated from 1961 to 2002 under different objectives. The Nile Basin within Ethiopia consists of Abbay (Blue Nile), Baro-Akobo (Sobat) and Tekeze (Atbara) river sub-basins. These sub-basins lie within five regional sates of Ethiopia namely Amhara, Tigray, Oromia, Gambella & Benshangul-Gumuz. These rivers are the major tributaries contributing more than three quarter of the main Nile annual average flow. The Nile basin portion of Ethiopia is generally characterized by steep slops and erodible soil. It has high intensity, short duration rainfall confined to a four months period (July to October). During wet season the rivers are turbid and full of suspended solids. Deforestation and population pressure on the marginal highland area are major threat of the basin. So far there is no any form of regular water quality monitoring program identified in the sub-basins. The limited intermittent efforts by federal and regional Government bureaus are focusing on quality control of water supply schemes. The awareness and participation of communities, CBOs and NGO regarding water quality monitoring is almost none existent. This document attempts to provide the physical descriptions and an overview of the water quality of each sub-basins. The existing water quality situation is compared for compliance against the Ethiopian Drinking Water Quality Guidelines (2002) and Ambient Environmental Standard (2003) for Surface Water Quality. The document also provides the cause and possible sources of water pollution in the basin, institutional and legal framework, water quality monitoring efforts in the basin and proposes monitoring system to enhance the quality of water within the basin. The collected water quality data are not representing the spatial and temporal condition of the basin adequately. Using the available data, however, an overview of water quality has been given. Water Quality situations of the Basins are statistically summarized as follows. For details see Tables-S1 to S6.
Table-S. 1 Abbay Basin Surface Water Quality Range
Well Code/Name EC
TDS pH Na+ k+ T. Hard
T. Alk
Ca++ Mg++ Cl- PO4--
(µs/cm) mg/l mg/l mg/l mg/l Ca CO3 mg/l mg/l mg/l mg/l No of Tests 37 36 36 31 32 19 19 34 34 25 16
Mean 176 108 7 8 5 45 36 19 6 4 2median 105.0 78.0 7.2 4.0 2.5 24.0 22.0 14.0 3.1 4.0 2.5Min 25.0 10.0 5.5 0.9 1.0 6.0 4.1 1.5 0.9 0.0 0.2Max 846.0 550.0 8.7 55.0 45.0 238.0 120.0 100.8 58.3 28.0 2.8Ambient Surface water Standard 1000
6 to 9 250
No. of Tests Exceed Guideline 1 0 0 0 (Source: USBR, 1964 & BECOM, 1996) NB: "0" at Min value represent "less than detection limit"

Prepared by Fitsum Merid, National Consultant
National Water Quality Monitoring Baseline Report in the Nile River Basin, Ethiopia
2
Lake Tana Water Quality The chemical composition of Lake Tana is characterized as Oligomesotrophic (Nagelkerke & BCEOM, 1997 cited by BCEOM, 1998). Lake Tana water is slightly alkaline of acceptable pH range, low TDS and EC values. The EC value is associated with low fish productivity of the lake. The average 6.5 mg-DO/l can drop down to nil without anoxic layer. Due to high suspended solids of the tributary rivers, the effective storage capacity of Lake Tana is being reduced by 6% per100 years. WQ of Other Smaller Reservoirs The test for physico-chemical parameters of the remaining smaller lakes and reservoirs is within the acceptable range of ambient water quality standard set by EPA (2003) for aquatic species.
Table-S. 2 Abbay Basin Groundwater Quality Range
Color EC
Har total
Alk total pH TDS NO3
- NO2- Cl- F- SO4-- PO4--- Na+ Fe tot Mn
TCU µS/cm
mg/l CaCO3 mg/l mg/l mg/l mg/l mg/l mg/l mg/l mg/l mg/l mg/l
No of Tests 414 539 649 578 641 464 538 484 532 442 468 470 189 380 448 Mean 128 377 149 176 7 215 8 0 16 1 10 1 32 1 0 median 2 295 112 129 7.4 167 3.04 0.02 7.1 0.32 1 0.265 18.7 0.06 0 Min 0 6 2 0 4.1 9 0 0 0 0 0 0 0 0 0 Max 12250 4260 2800 3000 10.2 2933 145 6.72 535 10.4 318 27.5 489 32 20.2 Guideline Value 22 392 6.5-8.5 1776 50 6 533 3 358 0.3 0.13 No. of Tests Exceed Guidelin 121 24 70 3 13 2 1 7 3 96 69 (%) of Tests Exceed Guidelin 29.23 0 3.7 0 10.92 0.65 2.42 0.41 0.2 1.58 0 0 1.59 25.3 15.4 (Source: MoWR Database) NB: "0" at Min value represent "less than detection limit"
Table-S. 3 Tekeze Basin Groundwater Quality Range
TDS
pH
NH
4+
Na+
K+
Fe++
Mn++
Cl-
NO
2
NO
3
F HC
O3
CO
3
SO4
PO4
HA
RD
N
mg/
l
mg/
l
mg/
l
mg/
l
mg/
l
mg/
l
mg/
l
mg/
l
mg/
l
mg/
l
mg/
l
mg/
l
mg/
l
mg/
l
mg/
l as
CaC
O3
No. of Tests 336 335 213 282 281 94 108 264 72 247 272 281 75 205 236 282 Median 312 7.2 0.21 21.5 2 0.02 0.2 13.3 0.02 7.5 0.33 241.6 9.6 15 0.17 223 Min 32 4.9 0 2.4 0.09 0 0 1 0 0 0.03 20.3 0 0 0 16 Max 2750 9.8 7.42 650 24 2.03 3 890 4.05 261 1.88 734.4 34 1700 231 2780
Eth Guideline Value 1776
6.5 to 8.5 2 358 0.4 0.13 533 6 50 3 483 392
No. of Parameters Exceeding Guideline 7 41 5 1.00 7 61 1 0 17 0 8 45
(Source: NEDECO, 1998) NB: "0" at Min value represent "less than detection limit"

Prepared by Fitsum Merid, National Consultant
National Water Quality Monitoring Baseline Report in the Nile River Basin, Ethiopia
3
Table-S. 4 Tekeze Basin Surface Water Quality Range
Tur EC TDS pH NO3 NO2 Cl CO3- HCO3- SO4-- PO4--- Na+ K+
Ca++
Mg++
FTU
µS/c
m
mg/
l
mg/
l
mg/
l
mg/
l
mg/
l
mg/
l
mg/
l
mg/
l
mg/
l
mg/
l
mg/
l
mg/
l
No. of Samples 11 15 8 25 15 20 25 19 21 21 13 20 14 27 27
Mean 36 622 388 7.8 2.632 0.21 28.1 2.8 196.7 60.9 0.2 27.5 20.2 56.1 18.3 median 18 417 284.5 8 1.2 0.02 15 0 195.2 2 0.04 13.5 2.5 40 16.32 Min 0 96 88 6.6 0 0 0.07 0 48.8 0 0 0.57 0.05 10 2.4 Max 118 2029 1015 8.6 11.2 2.8 190 28.8 537 450 1 119 252 252 67.2
Guideline 7 1776 6.5-8.5 50 6 533 483 358
No. of Sample Exceed
Guideline 6 0 1 0 0 0 0 0 (Source: MoWR Database) NB: "0" at Min value represent "less than detection limit"
Table-S. 5 Baro-Akobo Basin Groundwater Quality Range
Color Turb EC Hard Alk total pH TDS NO3 NO2 Cl F SO4 PO4 Na
Fe (total) Mn
TCU
FTU
µS/c
m
mg/l CaCO3 mg/l mg/l mg/l mg/l mg/l mg/l mg/l mg/l mg/l mg/lNo of Tests 16 18 13 22 21 25 13 24 23 22 17 21 15 12 13 21
Mean 119 23 139 31 31 7 112 1 0 8 0 8 0 5 1 0 median 55 18 93 25.75 30 7.2 60 1 0.02 5 0.15 3 0.1 3.05 0.61 0 Min 0 0 22 7.2 0.16 6.3 25 0 0 0 0 0 0 1.2 0 0 Max 342 64 450 90 60 8 457 10.12 0.4 35 2.1 46.1 0.55 30.9 1.33 0.5 Guideline Value 22 7 392
6.5-8.5 1776 50 6 533 3 483 358 0.3 0.13
No. of Tests
Exceed Guideline 12 12 0 3 0 0 0 0 0 0 10 3 (Source: MoWR Database) NB: "0" at Min value represent "less than detection limit"
Table-S. 6 Baro-Akobo Basin Surface Water Quality Range
Color Turb EC Hard Alk total pH TDS NO3 N02 Cl F SO4 PO4 Na
Fe total Mn
TCU
FTU
µS/c
m
mg/l CaCO3 mg/l mg/l mg/l mg/l
mg/l
mg/l
mg/l
mg/l mg/l mg/l
25 30 29 30 34 30 24 32 30 32 30 31 26 8 22 27Mean 102 20 389 148 222 7 219 17 0 28 1 6 0 73 2 1 median 12 1 270 78 81 7.17 202.5 3.31 0.04 4.985 0.3 0.7 0.26 12 0.095 0.04 Min 0 0 20 10 0.2 5.35 10 0 0 0 0 0 0 1 0 0 Max 990 198 1344 1560 2640 8.74 655 2123 6.72 280 9.8 37 3.6 489 32 12 Guideline Value 22 7 392
6.5-8.5 1776 50 6 533 3 483 358 0.3 0.13
No of tests Exceed Guideline 10 9 7 4 2 4 13 13 (Source: MoWR Database) NB: "0" at Min value represent "less than detection limit"
Prepared by Fitsum Merid, National Consultant
National Water Quality Monitoring Baseline Report in the Nile River Basin, Ethiopia
4
Point and Non-point Sources of Pollution There is no domestic and industrial waste data and information to understand the effect of point and non-points sources of pollution within the Basin. However, it is generally known that, very few industries are situated within the Basin. The type and amount of fertilizer and pesticides concentration in the ground and surface water is totally unknown. Currently the mining activities are very small and their effect on surface water is very minimal. As a result of deforestation, high intensity short duration type of rainfall and sloppy topography very high suspended solids are observed on all surface waters. Proposed Water Quality Monitoring Since there is no water quality monitoring program within the basin and no sampling stations, a simple, affordable and basic monitoring system is proposed. The anticipated monitoring should function using the existing Governmental structure and able to generate a consistent and reliable data that can comprehensively characterize and helps to evaluate the basin. The establishment and strengthening of federal, regional, zonal and basic laboratories is paramount importance for the implementation of the program. Type of sampling sites, sampling site location, monitoring media and parameters as well as frequency of sampling are proposed on the basis of objectives set. This study proposes 68 surface and 21 groundwater sampling sites (macrolocation) of trend and/Baseline stations type. The sampling station (microlocation) should be determined after proper field assessment of the sub-basins. Among these, five (5) geo-referenced & trans-boundary important, sampling stations are selected. It is the recommendation of the project that the identified gaps and proposed monitoring system within the basin will be taken into consideration by the MoWR and other concerned Federal and Regional line bureaus in carrying out their responsibilities by strengthening their analytical capacity. In addition to that, the study will provide a framework for cooperative efforts between various stakeholders in the basin towards a common goal of protecting the basin's water resource while accommodating reasonable economic growth.
Prepared by Fitsum Merid, National Consultant
National Water Quality Monitoring Baseline Report in the Nile River Basin, Ethiopia
5
1 BACKGROUND
1.1 Introduction
The Nile Basin within Ethiopia consists of Abbay (Blue Nile), Baro-Akobo (Sobat) and Tekeze (Atbara) River sub-basins. These sub basins lie within five regional sates of Ethiopia namely; Amhara, Tigray, Oromia, Gambella and Benshangul-Gumuz. This study is prepared on the basis of existing information and Meta water quality data derived from federal and regional organizations, study documents and databases in the country. The existing water quality situation is compared against the Ethiopian Drinking Water Quality Guidelines (2002) and Ambient Environmental Standard (2003) for surface water. It provides the cause and possible sources of water pollution in the basin, institutional and legal frameworks, water quality monitoring efforts and proposes monitoring system to enhance the quality of water within the basin. The study provides a framework for cooperative efforts between various stakeholders in the basin towards a common goal of protecting the basin's water resource while accommodating reasonable economic growth. The MoWR and other concerned federal and regional line bureaus are expected to consider the identified gaps and proposed monitoring system in carrying out their responsibilities in the basin by strengthening their analytical capacity. The basin wide water quality monitoring component is one of the six components of the NTEAP. This component will initiate a basin-wide dialogue on water quality and improve understanding of trans-boundary water quality issues, improve capacities for monitoring and management of water quality and initiate exchange and dissemination of information on key-parameters. Trans-boundary cooperation will be increasingly important to maintain appropriate water quality for drinking water, irrigation, and industry and to support human health and livelihoods and ecosystem function in the Nile Basin. Exchange of experiences on regulatory issues and on water quality information between countries will facilitate improved decision making by governments and other resource users. This project component will increase the understanding of the current state of water quality and priority needs for trans-boundary cooperation between the Nile countries and will contribute to building greater capacity for water quality monitoring and management. The present project component also aims to create a starting point for increased regional trans-boundary water quality assessment and collaborative action. Basin-wide dialogue among relevant stakeholders will help to develop a common vision and goal for water quality management for the Nile Basin.
1.2 Study Objectives
The specific objectives of this study are: • to provide general overview of the water resources and water quality management
practices in the country, • to assess the existing water quality information, • to identify major information gaps and needs, • to appraise institutional, technical and professional capacities in the country,

Prepared by Fitsum Merid, National Consultant
National Water Quality Monitoring Baseline Report in the Nile River Basin, Ethiopia
6
• to identify recent and on-going water quality related projects in the country; and • to indicate regular sampling points and their geo-reference within the basin. In order to achieve the above mentioned objectives, the Consultant has closely consulted with federal governmental organizations such as MoWR, MoH & EPA, and regional water bureaus of Amhara, Tigray, Gambella and Benshangul-Gumuz, which are actively involved in the water sector within the basin.
The Consultant has also studied the Integrated Master Plan Study reports of Abbay (Blue Nile), Tekeze (Atbara) and Baro-Akobo (Sobat) Basins and mined the water quality database at the MoWR. References are also made to Water Quality Guidelines and Standards prepared by MoWR and Environmental Protection Agency. Relevant documents from Federal Ministry of Health, Quality & Standard Authority of Ethiopia (QSAE) and Regional Water & Energy Bureaus have also been used as useful information. Proclamation, policy and strategy documents of MoWR, MoH and EPA are examined to understand their roles and responsibilities.
Special attention has been paid to the current and past water quality related projects within the basin by different organizations. The Consultant has collected and summarized all available water quality data especially on key parameters of trans-boundary importance. Based on the identified gaps affordable water quality monitoring system is proposed to be pursued within the basins.
1.3 Scope of the Study
The scope of the study as set out in TOR is listed below:- A. Present the status of the institutional and legal framework for water resources
management and water quality control in the country and the status of policy formulation and strategies on water resources management; clearly indicate who the major sector actors are and how they relate to each other.
B. Indicate the status of formulation or enforcement of water quality standards, guidelines
and regulations. C. Give an inventory of the major rivers and lakes including wetlands, stating their quality
status and their national or trans-boundary importance. D. Give an overview of the water quality monitoring programs, and the water resources
assessment practices and strategies, clearly indicating the major sources of pollution. E. State, if any, regular water quality monitoring program exists; the number and type of
existing water sampling stations, the frequency of sampling, and the parameters tested. F. Record the water quality data for each of the water quality monitoring stations,
ensuring that the data for both the dry and wet seasons is captured. G. Ensure that the analytical data recorded for each of the regular sampling stations is
properly geo-referenced and has results of basic parameters of trans-boundary

Prepared by Fitsum Merid, National Consultant
National Water Quality Monitoring Baseline Report in the Nile River Basin, Ethiopia
7
importance to facilitate the drawing of a Nile Basin Surface Water Quality map. This is of utmost importance.
H. Indicate the number and type of analytical laboratory facilities and their operational
status, stating if water quality assurance programs exist, and whether the laboratories are accredited.
I. Critically examine the cadre and staffing levels in the water quality testing laboratories
and state if staff training programs or institutions exist. J. Indicate the analytical scope and capabilities of the laboratories stating if any other
environmental monitoring tests are carried out. K. State if communities are involved in water quality control, and if any NGOs and CBOs
are also involved, and in what roles. L. Ensure that the collected information has identifiable benchmarks that can be used as
baseline indicators upon which subsequent actions can be measured, in order to gauge progress.
M. Determine the level of awareness with respect to water quality monitoring,
management and information exchange. N. Indicate and suggest actions by the NTEAP to address the identified gaps in water
quality monitoring. O. Compile all the above findings into a National Water Quality Monitoring Baseline Report
and submit copies to the PMU as stipulated.
1.4 Description of Project Area
1.4.1 Abbay (Blue Nile) River Basin
The Abbay River basin consists of two hydrologically distinct Basins. These are the Abbay River with its tributaries and the Lake Tana. The geography, hydrology and major activities within the two sub-basins are discussed below. a. The Abbay River and Its Tributaries The Abbay River basin covers approximately 196,770 km2 (excluding Lake Tana) draining areas of Amhara (9 Zones), Oromia (6 Zones) and Benshangul-Gumuz (3 Zones) regions. See Figure-1.1 for location of the Basin. The basin encompasses a total population of 14,231,000 in 1999, who relies on Abbay River basin for drinking, agriculture, industries and other uses. Statistics related to the resources of the Basin is provided in Tables-1.1 & 1.2. The Abbay River has a total length of 922 km and falls from Lake Tana (1785 masl) to the Ethiopia/Sudan Border (490 masl) (BCEOM, 1998). The Abbay Basin is physically composed of two major structures (BCEOM, 1998). The first one located in an elevated plateau (the highland) at the center and east of the Basin, the elevation ranges from 1500 to 3000 masl, caped by thick basaltic deposits and occasionally
Prepared by Fitsum Merid, National Consultant
National Water Quality Monitoring Baseline Report in the Nile River Basin, Ethiopia
8
penetrated by ancient volcanoes which reach over 4000 masl, with an overall slop east to west. The second one is situated in the west ancient plain, tilting westward from about 100 to 500 masl. The above stated structures are separated by different escarpments. Cutting through this general picture is the Abbay River and its tributaries, which have broken through the basaltic capping of the highland to produce deep and narrow gorges, which continue to flow toward Sudan. This dissection divides the highland plateau into a series of isolated blocks, provides an obstacle to communication between these blocks, and offered little in the way of valley bottom land for cultivation and irrigation. On the other hand, the dramatic break between highland and gorge, with the highland protected by its basaltic cap, provides the basis for the extensive hydro-potential of the basin. It is the highland massive which also traps and elevates the rain-bearing air masses, providing for generally plentiful rainfall which rises with altitude while temperature falls. The basalts of the highland mass, under condition of moderate to high rainfall, have weathered to produce clay rich soils. Despite variations in climate and parent material, similar soils have also developed through much of the lowland, reflecting the long period of stability of these lands and perhaps past climates. The highland area with temperate weather condition, good rainfall and moderately low temperature, owns a rich vegetation of forest and low prevalence of diseases, which makes it suitable for settlement and cultivation. As a result most of the forest land has been converted to farm and grazing areas. The basin with 14,231,000 populations is one of the major agricultural area of the country, accounted for more than 40 % of both cultivated land and crop production, and 39% of the national cattle herd. This positive feature, however, are under threat, due to soil losses ranging from 2 to 3 cm/year and there is evidence that the soils are already seriously reduced in depth(BCEOM, 1998).

Prepared by Fitsum Merid, National Consultant
National Water Quality Monitoring Baseline Report in the Nile River Basin, Ethiopia
9
Figure-1. 1 Location Map of Abbay, Tekeze & Baro-Akobo Rivers basins While rainfall, in the lowland, is generally sufficient for at least a single rain-fed crop, population has not significantly settled in these areas. With lower rainfall and warmer temperature than highland, the natural vegetation is woodland and grassland with significant areas of bamboo plantation. Currently mineral exploitation in the lowland area is at primary level which is expected to be sustained in the future.
Prepared by Fitsum Merid, National Consultant
National Water Quality Monitoring Baseline Report in the Nile River Basin, Ethiopia
10
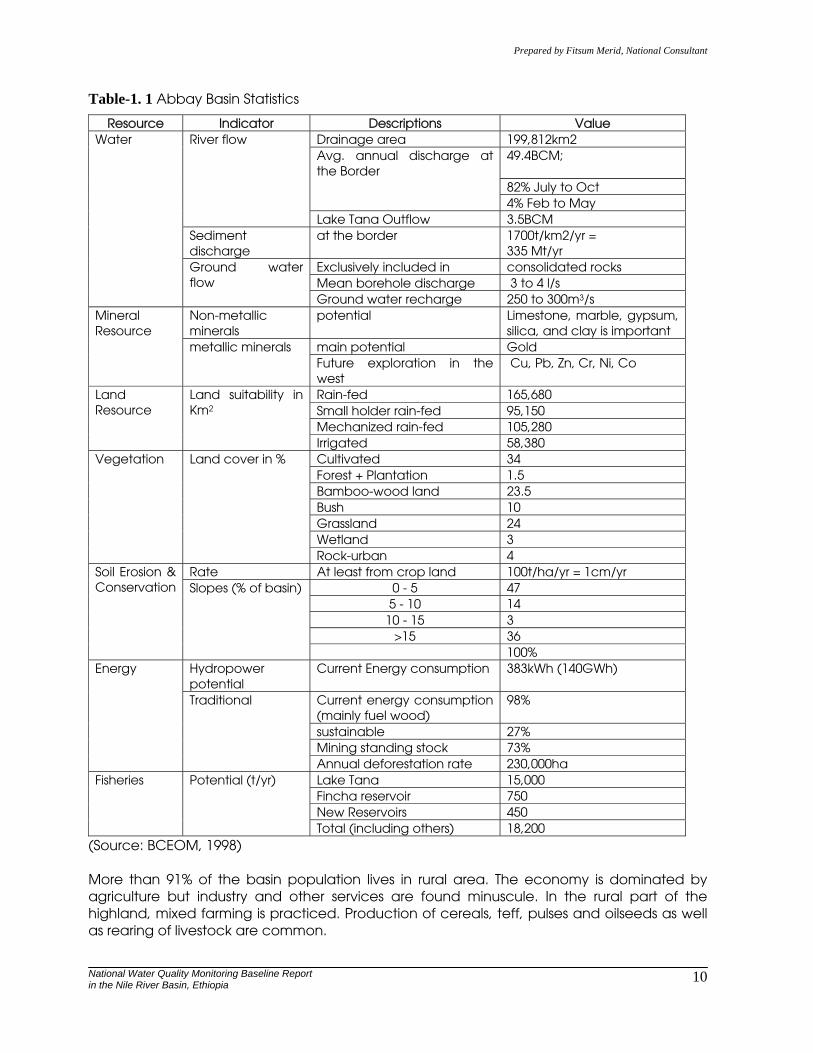
Table-1. 1 Abbay Basin Statistics
Resource Indicator Descriptions Value Drainage area 199,812km2
49.4BCM; 82% July to Oct
Avg. annual discharge at the Border
4% Feb to May
River flow
Lake Tana Outflow 3.5BCM Sediment discharge
at the border 1700t/km2/yr = 335 Mt/yr
Exclusively included in consolidated rocks Mean borehole discharge 3 to 4 l/s
Water
Ground water flow
Ground water recharge 250 to 300m3/s Non-metallic minerals
potential Limestone, marble, gypsum, silica, and clay is important
main potential Gold
Mineral Resource
metallic minerals Future exploration in the west
Cu, Pb, Zn, Cr, Ni, Co
Rain-fed 165,680 Small holder rain-fed 95,150 Mechanized rain-fed 105,280
Land Resource
Land suitability in Km2
Irrigated 58,380 Cultivated 34 Forest + Plantation 1.5 Bamboo-wood land 23.5 Bush 10 Grassland 24 Wetland 3
Vegetation Land cover in %
Rock-urban 4 Rate At least from crop land 100t/ha/yr = 1cm/yr
0 - 5 47 5 - 10 14
10 - 15 3 >15 36
Soil Erosion & Conservation Slopes (% of basin)
100% Hydropower potential
Current Energy consumption 383kWh (140GWh)
Current energy consumption (mainly fuel wood)
98%
sustainable 27% Mining standing stock 73%
Energy
Traditional
Annual deforestation rate 230,000ha Lake Tana 15,000 Fincha reservoir 750 New Reservoirs 450
Fisheries Potential (t/yr)
Total (including others) 18,200 (Source: BCEOM, 1998) More than 91% of the basin population lives in rural area. The economy is dominated by agriculture but industry and other services are found minuscule. In the rural part of the highland, mixed farming is practiced. Production of cereals, teff, pulses and oilseeds as well as rearing of livestock are common.
Prepared by Fitsum Merid, National Consultant
National Water Quality Monitoring Baseline Report in the Nile River Basin, Ethiopia
11
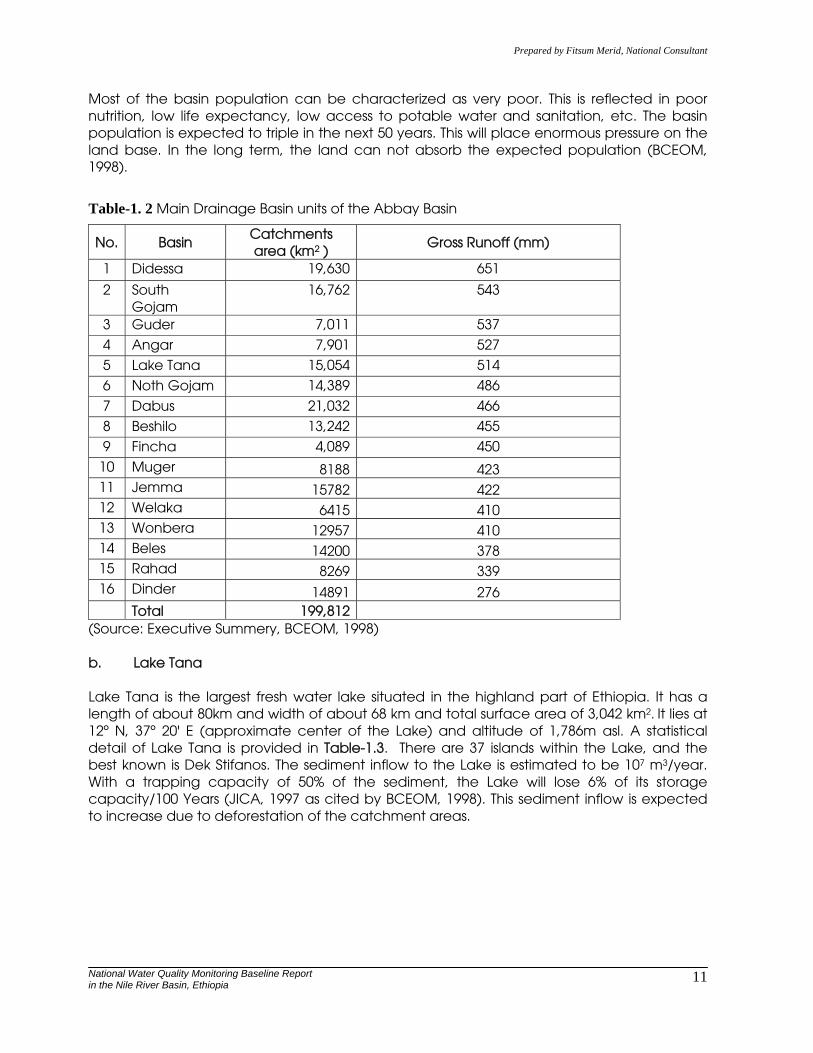
Most of the basin population can be characterized as very poor. This is reflected in poor nutrition, low life expectancy, low access to potable water and sanitation, etc. The basin population is expected to triple in the next 50 years. This will place enormous pressure on the land base. In the long term, the land can not absorb the expected population (BCEOM, 1998).
Table-1. 2 Main Drainage Basin units of the Abbay Basin
No. Basin Catchments area (km2 )
Gross Runoff (mm)
1 Didessa 19,630 651
2 South Gojam
16,762 543
3 Guder 7,011 537
4 Angar 7,901 527
5 Lake Tana 15,054 514
6 Noth Gojam 14,389 486
7 Dabus 21,032 466
8 Beshilo 13,242 455
9 Fincha 4,089 450
10 Muger 8188 423 11 Jemma 15782 422 12 Welaka 6415 410 13 Wonbera 12957 410 14 Beles 14200 378 15 Rahad 8269 339 16 Dinder 14891 276
Total 199,812 (Source: Executive Summery, BCEOM, 1998) b. Lake Tana Lake Tana is the largest fresh water lake situated in the highland part of Ethiopia. It has a length of about 80km and width of about 68 km and total surface area of 3,042 km2. It lies at 12º N, 37º 20' E (approximate center of the Lake) and altitude of 1,786m asl. A statistical detail of Lake Tana is provided in Table-1.3. There are 37 islands within the Lake, and the best known is Dek Stifanos. The sediment inflow to the Lake is estimated to be 107 m3/year. With a trapping capacity of 50% of the sediment, the Lake will lose 6% of its storage capacity/100 Years (JICA, 1997 as cited by BCEOM, 1998). This sediment inflow is expected to increase due to deforestation of the catchment areas.

Prepared by Fitsum Merid, National Consultant
National Water Quality Monitoring Baseline Report in the Nile River Basin, Ethiopia
12
Table-1. 3 Facts and Figures of Lake Tana
No. Description Data Remark 1 Location 12º N, 37º 20' E Approxiately lake center 2 Altitude 1786 asl 3 Surface Area 3042 to 3500 km2 4 Catchments area 16,500 km2 Gasse, 1987, cited by BCEOM,
1998 15,054 km2 BCEOM, 1997 5 Depth 14m Max 8 to 9 m mean 6 Volume 28 km3 7 Max Length 80 km LFDP, 1997 cited by BCEOM, 1998 8 Max width 64 km LFDP, 1997 cited by BCEOM, 1998 9 Major influent rivers Gilgel-Abbay, Ribb, Gumara, &
Megech
10 Effluent rivers Abbay (Blue Nile) River (Source: Limnology Report, BCEOM, 1998) The mean annual inflow to the lake is 10.3 Billion m3 of water which arises from a catchment area of 15,054 km2 with 61 water courses including 4 main perennial catchments. The perennial rivers include Gilgel Abbay (catchment area of 5004 km2), Ribb (2464 km2), Gumara (1893 km2) and Megech (2620 km2). The effluent from the lake is about 3.7 Billion m3 and the remaining 64% is assumed to be lost by evaporation. c. Other Small Reservoirs The other water bodies within the basin are: Fincha, Lake Wonchi, Lake Dandi, Amerti Reservoir, Muger Reservoir, Gebete Dam, and Intro Dam (BCEOM, 1998). The Fincha dam was constructed in 1972 for hydroelectric power generation. It is situated at an altitude of 2215 m and has surface area of 157km2 and mean depth of 6m. It contains large amount of decomposing plants, much of it is stoloniferous grass (panicum hygrochloris) (BCEOM, 1998) which moves from one part of the reservoir to the other following the direction of the wind. The statistical detail of the water bodies is presented in Table-1.4 below.
Table-1. 4 Morphological data of Small Reservoirs
Depth (m) No. Water Body
Area (km2) Min Max Avg
Altitude (m asl)
1 Lake Wenchi 4.225 km2 - 24 - 2780 2 Lake Dandi 7.55 km2 - - - - 3 Fincha Reservoir 157.6 km2 - - 3.5 2217 to 2222 4 Amrti Reservoir 1.5 km2 3.5 10.0 - 2235 5 Muger Reservoir 45 ha - 12.5 8.5 2500 6 Gebete Dam 9 ha - 6.0 - 2250 7 Sorga Dam 30 ha - 6.5 - 204 8 Intro Dam 14 ha - 6.8 4.5 1950
(Source: Limnology Report, BCEOM, 1998)
Prepared by Fitsum Merid, National Consultant
National Water Quality Monitoring Baseline Report in the Nile River Basin, Ethiopia
13
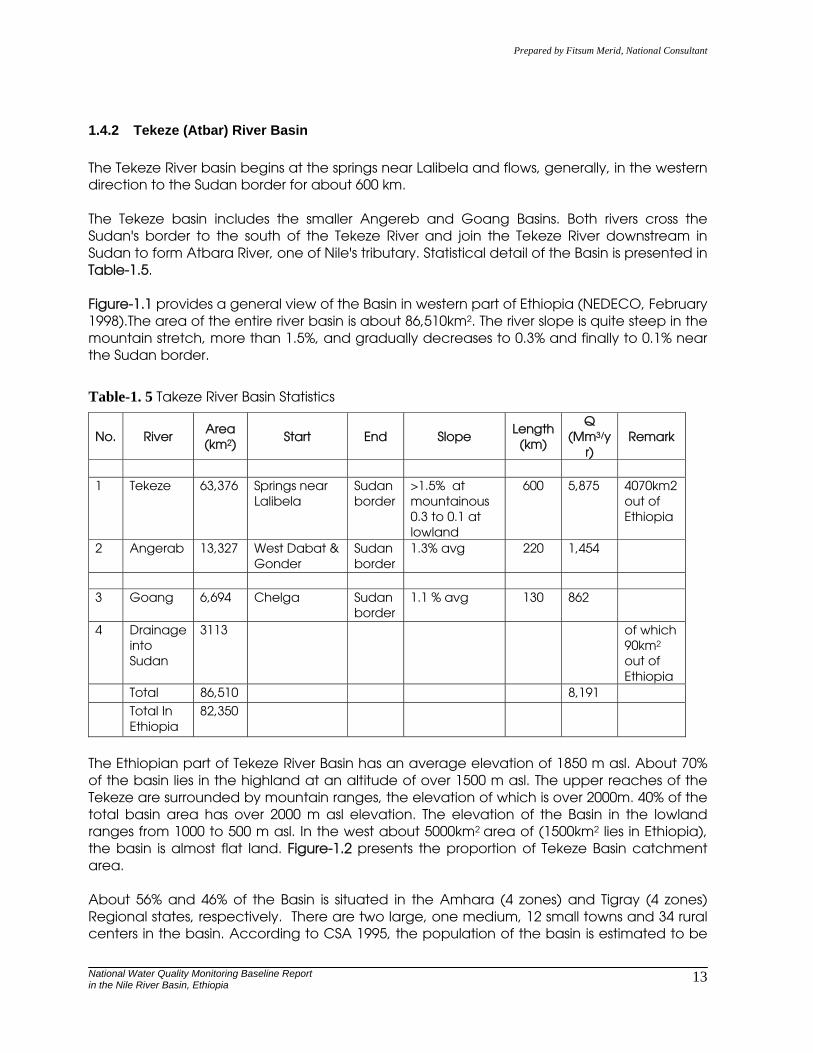
1.4.2 Tekeze (Atbar) River Basin The Tekeze River basin begins at the springs near Lalibela and flows, generally, in the western direction to the Sudan border for about 600 km. The Tekeze basin includes the smaller Angereb and Goang Basins. Both rivers cross the Sudan's border to the south of the Tekeze River and join the Tekeze River downstream in Sudan to form Atbara River, one of Nile's tributary. Statistical detail of the Basin is presented in Table-1.5. Figure-1.1 provides a general view of the Basin in western part of Ethiopia (NEDECO, February 1998).The area of the entire river basin is about 86,510km2. The river slope is quite steep in the mountain stretch, more than 1.5%, and gradually decreases to 0.3% and finally to 0.1% near the Sudan border.
Table-1. 5 Takeze River Basin Statistics
No. River Area (km2)
Start End Slope Length
(km)
Q (Mm3/y
r) Remark
1 Tekeze 63,376 Springs near
Lalibela Sudan border
>1.5% at mountainous 0.3 to 0.1 at lowland
600 5,875 4070km2 out of Ethiopia
2 Angerab 13,327 West Dabat & Gonder
Sudan border
1.3% avg 220 1,454
3 Goang 6,694 Chelga Sudan
border 1.1 % avg 130 862
4 Drainage into Sudan
3113 of which 90km2 out of Ethiopia
Total 86,510 8,191 Total In
Ethiopia 82,350
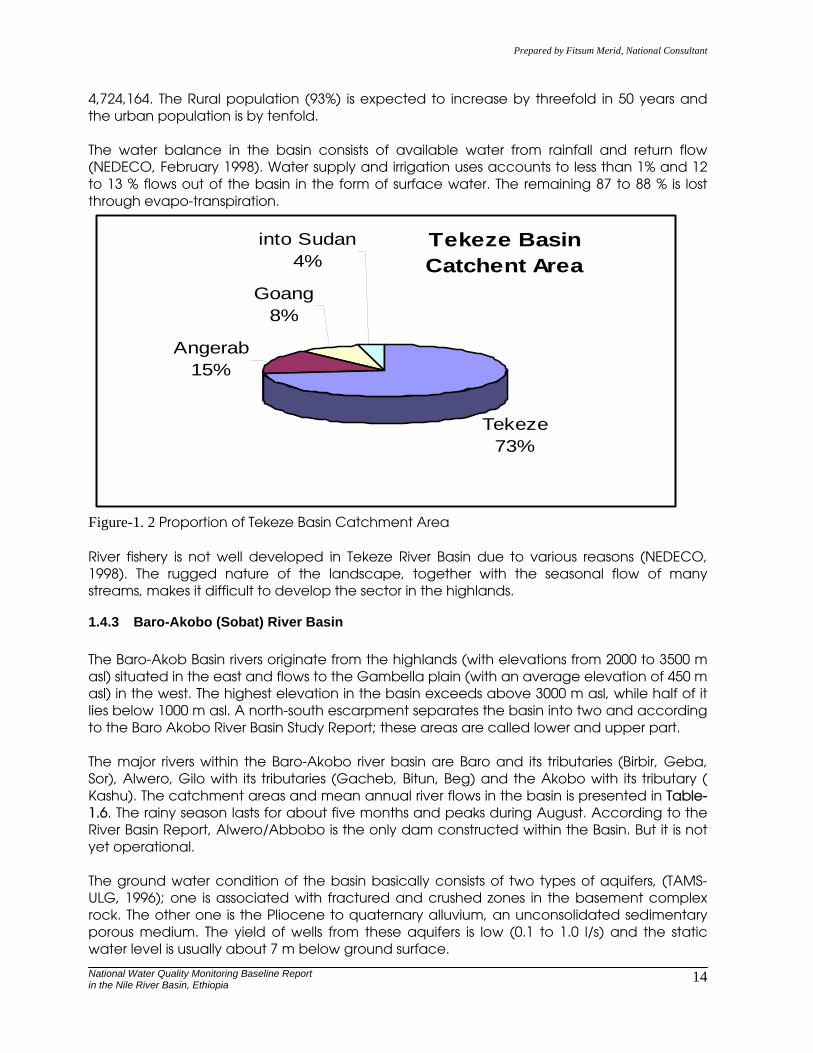
The Ethiopian part of Tekeze River Basin has an average elevation of 1850 m asl. About 70% of the basin lies in the highland at an altitude of over 1500 m asl. The upper reaches of the Tekeze are surrounded by mountain ranges, the elevation of which is over 2000m. 40% of the total basin area has over 2000 m asl elevation. The elevation of the Basin in the lowland ranges from 1000 to 500 m asl. In the west about 5000km2 area of (1500km2 lies in Ethiopia), the basin is almost flat land. Figure-1.2 presents the proportion of Tekeze Basin catchment area. About 56% and 46% of the Basin is situated in the Amhara (4 zones) and Tigray (4 zones) Regional states, respectively. There are two large, one medium, 12 small towns and 34 rural centers in the basin. According to CSA 1995, the population of the basin is estimated to be
Prepared by Fitsum Merid, National Consultant
National Water Quality Monitoring Baseline Report in the Nile River Basin, Ethiopia
14
4,724,164. The Rural population (93%) is expected to increase by threefold in 50 years and the urban population is by tenfold. The water balance in the basin consists of available water from rainfall and return flow (NEDECO, February 1998). Water supply and irrigation uses accounts to less than 1% and 12 to 13 % flows out of the basin in the form of surface water. The remaining 87 to 88 % is lost through evapo-transpiration.
Tekeze Basin Catchent Area
Tekeze73%
Angerab15%
Goang8%
into Sudan4%
Figure-1. 2 Proportion of Tekeze Basin Catchment Area River fishery is not well developed in Tekeze River Basin due to various reasons (NEDECO, 1998). The rugged nature of the landscape, together with the seasonal flow of many streams, makes it difficult to develop the sector in the highlands.
1.4.3 Baro-Akobo (Sobat) River Basin The Baro-Akob Basin rivers originate from the highlands (with elevations from 2000 to 3500 m asl) situated in the east and flows to the Gambella plain (with an average elevation of 450 m asl) in the west. The highest elevation in the basin exceeds above 3000 m asl, while half of it lies below 1000 m asl. A north-south escarpment separates the basin into two and according to the Baro Akobo River Basin Study Report; these areas are called lower and upper part. The major rivers within the Baro-Akobo river basin are Baro and its tributaries (Birbir, Geba, Sor), Alwero, Gilo with its tributaries (Gacheb, Bitun, Beg) and the Akobo with its tributary ( Kashu). The catchment areas and mean annual river flows in the basin is presented in Table-1.6. The rainy season lasts for about five months and peaks during August. According to the River Basin Report, Alwero/Abbobo is the only dam constructed within the Basin. But it is not yet operational. The ground water condition of the basin basically consists of two types of aquifers, (TAMS-ULG, 1996); one is associated with fractured and crushed zones in the basement complex rock. The other one is the Pliocene to quaternary alluvium, an unconsolidated sedimentary porous medium. The yield of wells from these aquifers is low (0.1 to 1.0 l/s) and the static water level is usually about 7 m below ground surface.
Prepared by Fitsum Merid, National Consultant
National Water Quality Monitoring Baseline Report in the Nile River Basin, Ethiopia
15
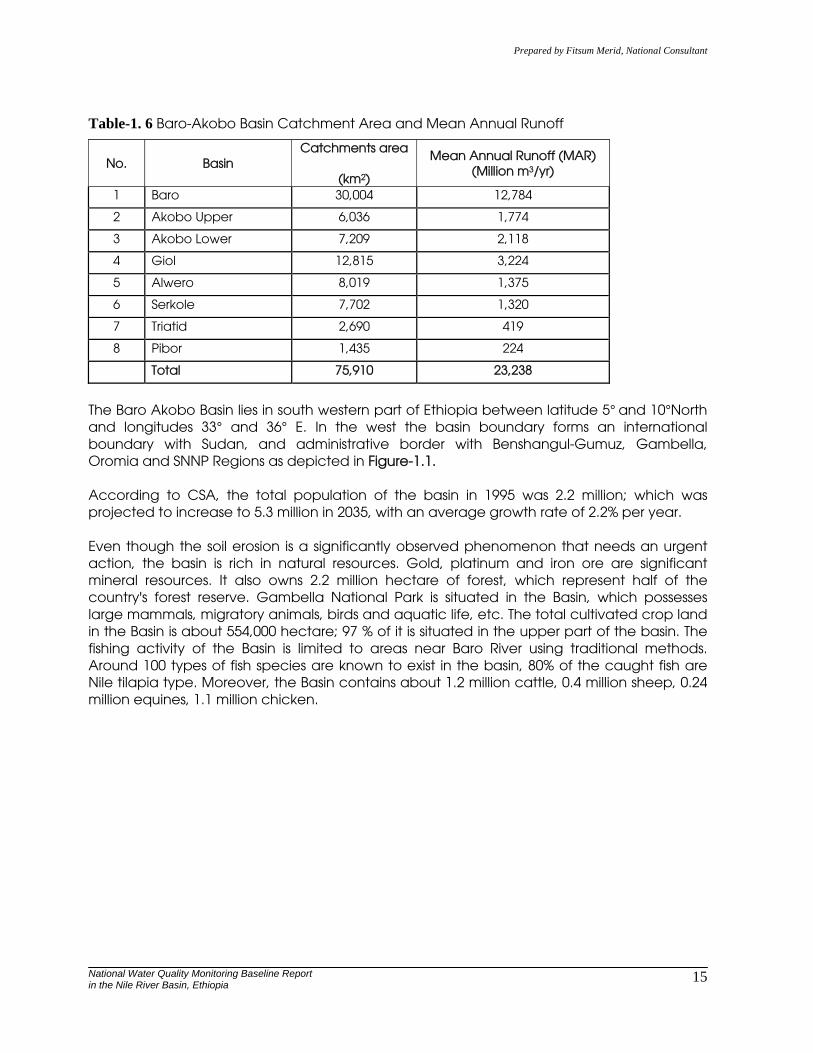
Table-1. 6 Baro-Akobo Basin Catchment Area and Mean Annual Runoff
No. Basin Catchments area
(km2)
Mean Annual Runoff (MAR) (Million m3/yr)
1 Baro 30,004 12,784
2 Akobo Upper 6,036 1,774
3 Akobo Lower 7,209 2,118
4 Giol 12,815 3,224
5 Alwero 8,019 1,375
6 Serkole 7,702 1,320
7 Triatid 2,690 419
8 Pibor 1,435 224
Total 75,910 23,238
The Baro Akobo Basin lies in south western part of Ethiopia between latitude 5° and 10°North and longitudes 33° and 36° E. In the west the basin boundary forms an international boundary with Sudan, and administrative border with Benshangul-Gumuz, Gambella, Oromia and SNNP Regions as depicted in Figure-1.1. According to CSA, the total population of the basin in 1995 was 2.2 million; which was projected to increase to 5.3 million in 2035, with an average growth rate of 2.2% per year. Even though the soil erosion is a significantly observed phenomenon that needs an urgent action, the basin is rich in natural resources. Gold, platinum and iron ore are significant mineral resources. It also owns 2.2 million hectare of forest, which represent half of the country's forest reserve. Gambella National Park is situated in the Basin, which possesses large mammals, migratory animals, birds and aquatic life, etc. The total cultivated crop land in the Basin is about 554,000 hectare; 97 % of it is situated in the upper part of the basin. The fishing activity of the Basin is limited to areas near Baro River using traditional methods. Around 100 types of fish species are known to exist in the basin, 80% of the caught fish are Nile tilapia type. Moreover, the Basin contains about 1.2 million cattle, 0.4 million sheep, 0.24 million equines, 1.1 million chicken.

Prepared by Fitsum Merid, National Consultant
National Water Quality Monitoring Baseline Report in the Nile River Basin, Ethiopia
16
2 METHODOLOGY
2.1 REVIEW OF EXISTING INFORMATION & MONITORING EFFORT
2.1.1 Questionnaire Development and Field Trip The Consultant has developed questionnaires (copy attached) to enhance a quick and proper collection of data such as physico-chemical, microbiological, industrial waste, domestic waste, agricultural run-off, institutional and legal framework as well as the geography and hydrology information of the basin. Federal Governmental Organizations and pertinent Regional Water Bureaus of Tigray, Amhara, Gambella, Benshangul-Gumuz and Oromia Regions were contacted through direct visit and telephone conversation. The Consultant’s plan to make a quick field visit to some regional bureaus was cancelled after discussion with NBI/NTEAP- NPC Ethiopia.
2.1.2 Inventories of Available Information Inventories of available data have been made but often data are inherent and distributed among different agencies/institutions, Ministries or their various departments, synthesized with different objectives. These include not only listing of information available from historical data in organizations database, but also a general screening and interpretation of all information relevant to the aspects under consideration.
2.1.3 Subjects of Inventories The inventories have covered major aspects that are relevant to the identification of the issues. These include water uses and water needs in the river basin; run-off characteristics and water quality; the most important point sources of pollution from industry and domestic waste, characterizing these in terms of production process, pollution composition and discharge load; and uses and diffuse pollution sources from land use with an inventory of the use of fertilizers and pesticides in agriculture. The status of existing water quality monitoring program and organization and management has been well studied. Logistic and staffing of laboratories in the basin was also inventorized.
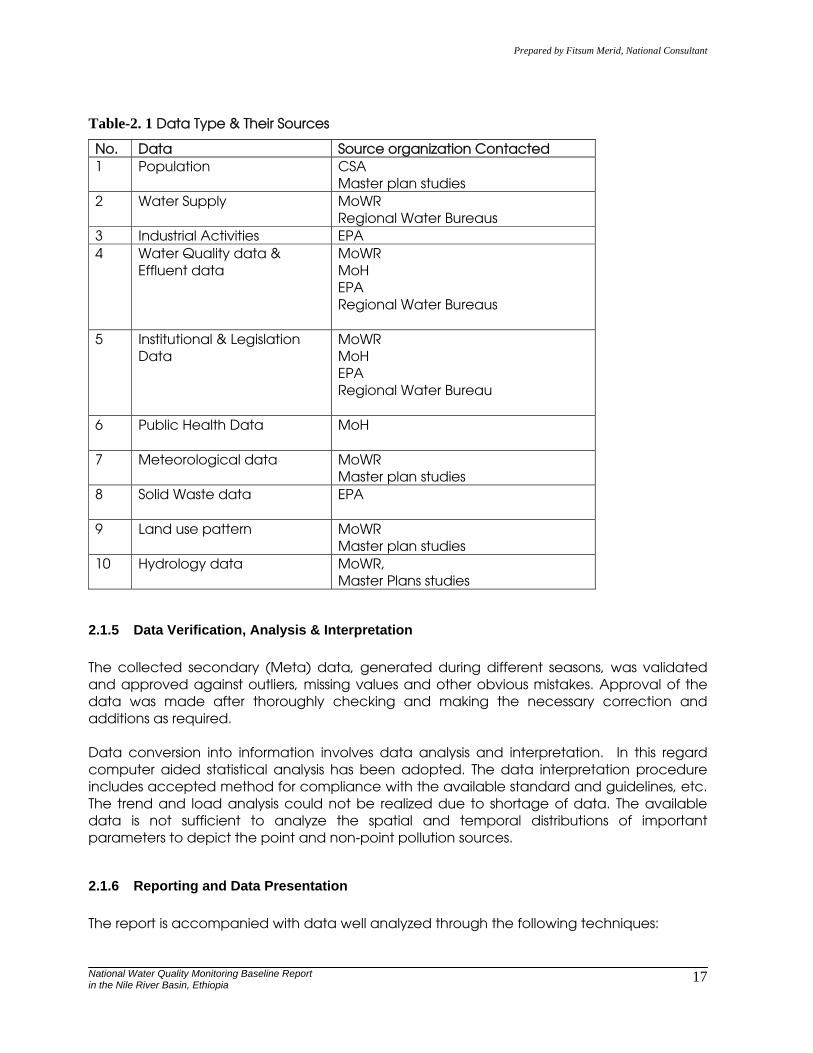
2.1.4 List of Data Sources One of the major tasks of the Consultant was to locate all possible major sources of information and extract the required data from the Governmental & non-Governmental Organization using the developed questionnaire (See ANNEX-5). Table-2.1 provides the list of major information and their sources.
Prepared by Fitsum Merid, National Consultant
National Water Quality Monitoring Baseline Report in the Nile River Basin, Ethiopia
17
Table-2. 1 Data Type & Their Sources
No. Data Source organization Contacted 1 Population CSA
Master plan studies 2 Water Supply MoWR
Regional Water Bureaus 3 Industrial Activities EPA 4 Water Quality data &
Effluent data MoWR MoH EPA Regional Water Bureaus
5 Institutional & Legislation Data
MoWR MoH EPA Regional Water Bureau
6 Public Health Data MoH
7 Meteorological data MoWR Master plan studies
8 Solid Waste data EPA
9 Land use pattern MoWR Master plan studies
10 Hydrology data MoWR, Master Plans studies
2.1.5 Data Verification, Analysis & Interpretation The collected secondary (Meta) data, generated during different seasons, was validated and approved against outliers, missing values and other obvious mistakes. Approval of the data was made after thoroughly checking and making the necessary correction and additions as required. Data conversion into information involves data analysis and interpretation. In this regard computer aided statistical analysis has been adopted. The data interpretation procedure includes accepted method for compliance with the available standard and guidelines, etc. The trend and load analysis could not be realized due to shortage of data. The available data is not sufficient to analyze the spatial and temporal distributions of important parameters to depict the point and non-point pollution sources.
2.1.6 Reporting and Data Presentation The report is accompanied with data well analyzed through the following techniques:
Prepared by Fitsum Merid, National Consultant
National Water Quality Monitoring Baseline Report in the Nile River Basin, Ethiopia
18
• Tables of list of summarized secondary data; • Statistically processed measurement data that shows minimum, maximum, mean, etc
values; • Graphs such as line-graph, pie charts, etc; • Geographically presented information can provide a better understanding of the
spatial distribution of the water quality parameter. The attempt to prepare surface water quality map was not successful due to lack of consistent and adequate water quality data.
2.1.7 Institutional and Legal Framework for Water Quality Monitoring
A review and assessment of the existing institutional and legal framework for water quality monitoring has been carried out to identify and collect relevant documents including studies and proposals. Institutional and legal issues have been identified and proposals are put forward for their improvements and efficient monitoring system within the basin. The status of existing water quality monitoring program and organization and management are thoroughly discussed. Logistic, staffing and conditions of water quality laboratories at both federal and regional levels within the basin are also examined.
2.2 DEVELOPMENT OF WATER QUALITY MONITORING
In response to identified gaps an effective and efficient tailor-made Water Quality Monitoring System is suggested by taking the socio-economic condition of the country into consideration. Lack of appropriate, consistent and reliable data and the non-existence of adequate baseline against which progress can be ensured make a phased approach realistic. In view of this and considering cost-effectiveness factor a phased approach of growing from broad to fine, from labor-intensive to technology-intensive, and from simple to advanced, is adopted for bringing the proposed monitoring system into operation. The following procedures are followed to develop the water quality assessment program (UNEP/WHO, 1996): • The water quality monitoring objectives are defined, • The type and nature of the water body is fully understood, particularly the special and
temporal variability within the whole water body, • Simple water quality monitoring program is devised, • The appropriate media is chosen, • The variables, type of samples, sampling frequency and sites are chosen carefully with
respect to the objectives, • Analytical costs of water quality samples are given.

Prepared by Fitsum Merid, National Consultant
National Water Quality Monitoring Baseline Report in the Nile River Basin, Ethiopia
19
3 INSTITUTIONAL ARRANGEMENTS AND LEGAL FRAMEWORK FOR WRM AND WQ CONTROL
3.1 INSTITUTIONAL FRAMEWORK
The major responsibility vested up on federal executive organs is the formulation and enforcement of policies, strategies and sector development plans. At the federal level, the Ministry of Water Resources (MoWR) is the executive organ of the federal government responsible for the planning, allocation, development, protection and management of the water resources of Ethiopia. The following are among the key responsibilities of the Ministry: • To determine conditions and methods required for the optimum allocation and
utilization of water that flows across or lies between more than one Regional Governments among various users and regions;
• To prepare laws concerning the protection and utilization of water resources; • To issue permits to construct and operate water works relating to waters referred to in
the above (first) article and regulate the same; • To undertake studies pertaining to the utilization of the waters of Transboundary Rivers
and upon approval, follow up the implementation of the same. • To sign international agreements relating to Transboundary rivers in accordance with
the law; and • In cooperation with appropriate organs, prescribe the quality standards for waters to
be used for various purposes. At the regional levels, similar responsibilities are given to Water Resources Development Bureaus / Water, Mines and Energy Resources Development Bureaus. Some of the major roles of Regional Water Bureaus are to:- • Ensure that Federal Government laws, regulations and directives in relation to the
conservation and utilization of water resources are respected in the regions; • Grant permits to persons engaged in water works construction activities in view of
utilizing the water resources of the regions; • Supervise the balanced distribution and utilization of the water resources of the regions
for various types of services or uses; and • Plan, study and design rural water supply schemes. At the lowest level of administration, Woreda Water Desks (WWDs) are responsible for the planning, development and management of water supply activities. The information from MoWR shows that there is no as such Water Sector Reform after the formulation and endorsement of the Ethiopian Water Resources Management Policy in 1999. Currently the Ministry is directly implementing the policy. Regional sector Bureaus are making structural changes that allow them to better implement their programs. Changes like focusing on regulatory function are done by Regional Bureaus while direct implementation is undertaken by private sector, public and NGOs, etc. Management of water resources of a basin requires reliable information on water quality. This includes the collection, analysis and evaluation of the existing water quality, the influence of human’s activity on water quality and criteria for the present and planned uses in a timely and efficient manner. Furthermore, water quality measurements become

Prepared by Fitsum Merid, National Consultant
National Water Quality Monitoring Baseline Report in the Nile River Basin, Ethiopia
20
essential in order to enforce the laws developed on the basis of the above information as well as to evaluate the effectiveness of the management program. In Ethiopia, comprehensive and regular water quality monitoring and surveillance activities are lacking at all levels. In general, the level of emphasis provided for water quality management issues is very low when compared with the level of attention given to other aspects of water development. Despite this fact, the functions of water quality control and monitoring fall under different institutions. The major institutions engaged in water quality monitoring and surveillance activities in one form or another, both at the federal and regional as well as at lower administrative levels are presented in Table-3.1.
Table-3. 1 : Major Organizations involved in WQ Monitoring and Control Activities
Federal Regional Woreda Remark Ministry of Water Resources
Regional Water Bureaus
Woreda Water Desk
Ministry of Health Regional Health Bureaus
Woreda Health Office
Labs with limited capacity focus on drinking WQ surveillance
Environmental Protection Authority
Has new lab for water & wastewater. But, does not give service to outsiders
Quality and Standards Authority of Ethiopia
Among the labs for all types of products in the country
Ethiopian Nutrition and Health Research Institute
Has Labs for research purpose
Addis Ababa Water and Sewerage Authority
Has Labs for internal routine water & wastewater quality control
Ethiopian Geological Survey
Have Labs for hydro- geochemistry analysis of own use
Ethiopian Agricultural Research Organization
Has Labs for research purpose
Higher Academic Institutions
- Higher Academic Institutions
Has Labs for Educational purpose
WWDSE Has big water & soil Lab, it is a profit making Gov. organization
NGOs NGOs No lab but few NGOs own portable kits for drinking WQ - IRC & Merlin international, GOAL Ethiopia, etc. NGOs are out of the Basin which own test-kit. - CRS/HCS NGO has water lab at Dire-Dawa
Prepared by Fitsum Merid, National Consultant
National Water Quality Monitoring Baseline Report in the Nile River Basin, Ethiopia
21
Even though the level differs from one stage to the other, common institutional problems attributed to water quality management issues in Ethiopia are the following: • Low attention accorded to water quality management programs in the sector; • Inadequate or lack of qualified water quality management staff; • Insufficient allocation of financial resources to water quality monitoring interventions; • Inadequate water laboratory facilities for monitoring and surveillance activities; and • Very low or inadequate logistical support to WQM activities etc.
3.2 POLICY AND LEGISLATIVE FRAMEWORKS
3.2.1 Policy Framework The Government of the Federal Democratic Republic of Ethiopia undertook major water sector reform by establishing for the first time, the Ministry of Water Resources in 1995. After its establishment, the ministry formulated the Ethiopian Water Resources Management Policy which was issued in September 1999. Currently, it serves as the principal framework for the management (planning, development, utilization, conservation and protection) of the water resources across the country. The policy is in conformity with the constitution of the country and addresses such major issues as: • Rights of Women, • Rights to own Property, • Right to Development, and • Right to clean and healthy environment, etc. Being comprehensive in its nature, the Ethiopian Water Resources Management Policy covers numerous issues including, but not limited to:- • Goals, Objectives, Fundamental principles and General Policies on Water Resources
Management; • Cross-sectoral issues covering among others, environment, water quality management,
water resources management information systems, transboundary waters, stakeholders and enabling environment;
• Sectoral policies such as water supply, irrigation, hydropower, aquatic resources, inland water transport, water for tourism and recreation.
An important feature of the policy is that it takes into account the “Basin” as a fundamental planning unit in water resources management. This is clearly stipulated under the general water resources management policies and in the cross-cutting issues related to water allocation and apportionment. In the area of water quality management, the following are considered as main issues in: • Standards, guidelines and criteria for various uses of water, • Water quality monitoring and surveillance, • Water quality management policy, legal and regulatory frameworks, • Institutions, capacity and human resources development for water quality
management, • Financing of water quality management, • Water pollution prevention and control,
Prepared by Fitsum Merid, National Consultant
National Water Quality Monitoring Baseline Report in the Nile River Basin, Ethiopia
22
• Research and development in WQM, • Technological aspects, • Information system and database with respect to water quality parameters, • Public awareness and education programs related to water quality and health,
protection of water sources, hygienic practices as well as public information on water quality.
So far, general water quality management policy statements are incorporated under cross- statements embodied in the water policy related to:- • Development of water quality criteria, guidelines and standards for all uses of water, • Formulation of receiving water quality standards and pollutants for controlling and
protecting indiscriminate discharges of effluents into natural water courses, and • Development of suitable water pollution prevention and control approaches
commensurate with the Ethiopian context. Considering the comprehensive issues of WQM, however, the water quality management component of the Ethiopian Water Resources Management Policy did not cover all the above issues. In order to attain the cardinal objective of water quality management, that is, “maintenance of the fitness for use of water resources in such a way that it remains fit for any recognized use,” formulation of comprehensive and detail WQM Objectives, Policies, Strategies, Action plans and programs as well as Laws and Regulations remains to be an area for future consideration by the water sector. With respect to environment, the following aspects are treated in the water policy: • Incorporate environment conservation and protection requirements as integral parts of
water resources management. • Encourage that Environment Impact Assessments and protection requirements serve as
part of the major criteria in all water resources projects.
3.2.2 Legislative Framework
Following to the issuance of the water policy, immediate steps were taken to translate the water policy into concrete actions. Subsequently, the following were formulated: • Water Sector Strategy, • Water Sector Development Program, • Water Resources Management Proclamation, • Water Resources Management Regulations, and • Guidelines for clarifying issues in the water policy and regulations.
The Ethiopian Water Resources Management Proclamation entered into force on March 9, 2000. This Proclamation designates the Ministry of Water Resources or Regional counterparts as the supervising body for the management of the water resources of the country. Several provisions are incorporated in the proclamation including the application, issuance, duration, suspension and revocation of permits. The regional water bureaus will be given the authority to play as the supervising body in their respective areas. The Proclamation also provides for the payment of water charges and fees to the supervising body. The amount and criteria for determining fees and charges are defined in the new regulation.
Prepared by Fitsum Merid, National Consultant
National Water Quality Monitoring Baseline Report in the Nile River Basin, Ethiopia
23
In order to effectively elucidate the various matters in the proclamation, the Ethiopian Water Resources Management Regulation has been issued very recently by the Council of Ministers (still to be issued in the Negarit Gazetta). In the meantime, specific guidelines that are essential to clarify the main issues in the regulations are just being finalized.
3.3 WATER QUALITY GUIDELINES, STANDARDS AND REGULATIONS
The Ministry of Water Resources has developed Drinking Water Quality Guidelines based on the realities in Ethiopia which was issued in March 2002. Prior to the formulation of these guidelines, water quality standards were developed and issued in September 1990 by the then Ethiopian Standards Authority that are more or less a direct copy of the Guidelines Values for Drinking Water Quality issued in 1984 by the World Health Organization (WHO). This was later, in year 2000, updated by the present Quality and Standards Authority of Ethiopia (QSAE) on the basis of the latest edition of WHO guidelines for Drinking Water Quality. The recent attempt by the MoWR to develop the Ethiopian Guidelines for Drinking Water Quality was the first national effort in the country that tried to take due account of a variety of local factors such as environmental, geographical, socio-economic and cultural. It is also unique in that it was entirely formulated by local consultants. The formulation process was consultative as stakeholders both from the regions and the center participated at the different stages of the process. Once it was issued, the guideline was circulated to major users for subsequent implementation. One year after circulation, the Ministry collected feedback from stakeholders to evaluate the problems encountered in the implementation process. The MoWR has plans to build up a comprehensive and multi year water quality database that will be used for development of Water Quality Standards in the future. A major segment of the Ethiopian Drinking Water Quality Guidelines is the recommendations on mechanisms for drinking water quality monitoring and surveillance as well as the legal and institutional framework for the implementation and enforcement of the Ethiopian Drinking Water Quality Guidelines (EDWQG). The main features of these recommendations include, among others: • Institutional framework aiming at establishing effective system of water quality
monitoring and surveillance which in turn ensures enforcement of the EDWQG. • Legislation for water quality management that ensures clear designation of
responsibilities in undertaking regulatory functions. Even though the recommendations of the study document were not taken any further to issue them fully as a legal document, there are few provisions of water quality monitoring functions contained in the EWRM Proclamation and Regulations. Some of the major regulations related to water quality monitoring and control include articles on: • Waste water discharge permit, • Obligation of persons discharging a treated waste water, • Renewal of a treated waste water discharge permits, • Termination or suspension of treated waste water discharge permits, • Ground water quality test, • Care for water supply wells, • Charges for the discharge of treated wastes into water resources, • Power of entry, inspection and taking of samples, and • Reporting obligations.

Prepared by Fitsum Merid, National Consultant
National Water Quality Monitoring Baseline Report in the Nile River Basin, Ethiopia
24
The Federal Government of Ethiopia, through Proclamation 9/1995, established the Federal Environmental Protection Authority (EPA). The Authority is mandated to protect and preserve ecosystems of the Ethiopian environment. In fulfillment to this mandate the "Ambient Environment Standards, August 2003" and "Standards for Industrial Pollution Control in Ethiopia, September 2003" are prepared and presented for Government endorsement. The Ambient Environmental Standards include Air quality, surface water quality, soil and ground water and noise standard. The surface water quality is not based on use related criteria e.g water for abstraction as a source of drinking water, or irrigation, etc, purposes. It is anticipated that such standards will be prepared by the Ministry of Water resources at a later date (EPA, 2003). This Guideline for surface water pollutants is prepared with regard to protection of aquatic species.
3.4 EFFORTS ON WATER QUALITY MONITORING, WATER RESOURCES ASSESSMENT PRACTICES AND STRATEGIES
For centuries, the Ethiopian highlands have suffered from serious soil erosion problems. As a result of soil erosion, most rivers in Ethiopia are extremely turbid with very high sediment yields. Moreover, many earth dams have shown significant reduction in their storage capacities as a result of heavy sedimentation. A typical example of rivers in Ethiopia with very high sediment loads is the Blue Nile River particularly during rainy season. Although there are no, systematic and comprehensive water quality assessment programs in Ethiopia, the few available reports and studies so far reveal that there are increasing indications of water pollution problems in some parts of the country. Depending on the locations of the water courses, the major causes of this pollution is soil erosion. The level of pollution is presumed to be increasing due to increasing population growth, and deforestation. The situation in the Awash River Basin1 (out of the Basin of our concern) is of particular concern. As such, there is no central data bank as well as information management system to keep record of pollution levels in the Awash River. In an aim to generate water quality data and information in the basin, the MoWR initiated a project to design a water quality monitoring network in the Awash Basin in July 2002. The project as its main components covers: • Institutional aspects, • Technical aspects, • Laboratory and quality control, • Data storage and retrieval facilities and • Reporting. In addition to the ministry’s effort to develop a monitoring system in the Awash Basin, the Environmental Protection Authority (EPA) had established a water quality monitoring network in the same Basin some 5 years ago. This network operates in 36 locations along the (upper) 1 Awash River is situated out of the Nile Basin. It is mentioned here to show the existing Government effort on Water Quality monitoring.
Prepared by Fitsum Merid, National Consultant
National Water Quality Monitoring Baseline Report in the Nile River Basin, Ethiopia
25
Awash River. In addition, samples are being analyzed from 34 stations in the Addis Ababa region (great and little Akaki Rivers). Looking at the two initiatives, it seems that the two institutions are attempting to implement water quality monitoring networks perhaps for more or less similar purposes. It would, therefore, be worthwhile to compare the data requirements of the two agencies and create a mechanism to make a joint and collaborative use of the network. It should be noted that failure to conserve water resources through effective management and water quality monitoring, will not only affect the health and livelihood of the citizens but may eventually impede long-term socio-economic development. Water quality monitoring scheme may be different depending on the purpose of the network. Generally, however, it may include; • Determination of the natural water quality, • The variability of this quality, • The reasons and deviations from normal variability, • The trend in changes of quality patterns, • Assessment of the effectiveness and consistency of effluent treatment, and • Anticipation of potential health hazards to prescribe appropriate corrective measures. Basic categories of water quality monitoring programs include; • Toxic pollutants, or those which create a health hazard for human beings, are
considered most important. • The second priority is given to pollutants that cause biological growth (phosphates,
nitrogen compounds and carbonaceous matter). • The third priority pollutants include mineral salts which are normally harmless but difficult
to remove. In planning networks for water quality monitoring, there should be collaboration with agencies responsible for water resources management including health, environment, irrigation / agriculture. To harmonize monitoring efforts, minimize costs and to render water quality data more interpretable, water quality monitoring networks should conform to the hydro-meteorological network of the water body whenever possible. Regarding water quality assessment programs in Ethiopia, up until recently, systematic and country-wide water quality assessment programs are not undertaken. The only national program under implementation so far, is the newly initiated Rapid Water Quality Assessment Program that is assisted by UNICEF and WHO. The program covers only existing domestic water supply sources. Ethiopia is one of the six pilot countries (together with China, Nepal, Nicaragua, Nigeria, and Tajikistan) selected for the Rapid Water Quality Assessment program. MOH and MoWR jointly implement the assessment program in representative sites across the country. The main purpose of the rapid water quality assessment program is to generate a national data base of major water quality information in each country that would also be used as a major data for global reporting. The assessment is based on low-cost and field-based techniques that provide reliable results.
Prepared by Fitsum Merid, National Consultant
National Water Quality Monitoring Baseline Report in the Nile River Basin, Ethiopia
26
3.5 COMMUNITIES, NGOS & CBOS INVOLVEMENT & AWARENESS IN WATER QUALITY MANAGEMENT
There are virtually no or intermittent surveillance or monitoring activities carried out principally in rural water supply systems in Ethiopia. Any effort made in this regard is fragmented and serves only limited needs mainly of the organization engaged in the survey. In most rural areas, the few and limited monitoring and survey measures had focused on occasional sanitary inspections. It is only in some rural water supply projects that initial examination of source water quality such as testing of physical, chemical and bacteriological parameters is performed during source development. As in many countries, responsible authorities such as the water and health departments are expected to perform water quality control and surveillance activities. In order to undertake such programs effectively and on a continuous basis, adequate human, financial and logistical resources are required. This is, however, very difficult to attain for developing countries such as ours. Water quality monitoring and surveillance programs become even more difficult to implement in every community water scheme as they are located very far from central laboratories and are numerous in number.
It is thus imperative that any water supply intervention should carefully plan for effective and sustainable programs that aim at getting active support of community members in water quality monitoring and surveillance activities. Involvement could be at various phases including; • Initial surveys, • Monitoring and surveillance of water supplies, • Reporting faults, • Undertaking maintenance and remedial activities. In order to involve communities in such activities, a major strategy to be followed may therefore be to conduct continuous community awareness and health education programs that gradually trigger interest and involvement of communities in rural water quality monitoring and control activities. This again requires development and implementation of comprehensive community education programs. If a well-tailored education programs are put in place, the community will:- • Be aware of the importance of water quality and its relation to health, and of the need
for safe water supplies; • Accept the importance of surveillance as well as the need for community response; • Understand and be prepared to play its role in the surveillance process; and finally • Have the required skills to perform water quality and surveillance activities. Non-Governmental Organizations (NGOs) and Community Based Organizations (CBOs) are important actors in the implementation and delivery of rural water supply facilities in Ethiopia. The main area of interest for most of the NGOs is however, construction of new facilities. As such, there is very little or no evidence that shows the involvement of NGOs/CBOs in water quality monitoring and surveillance activities.
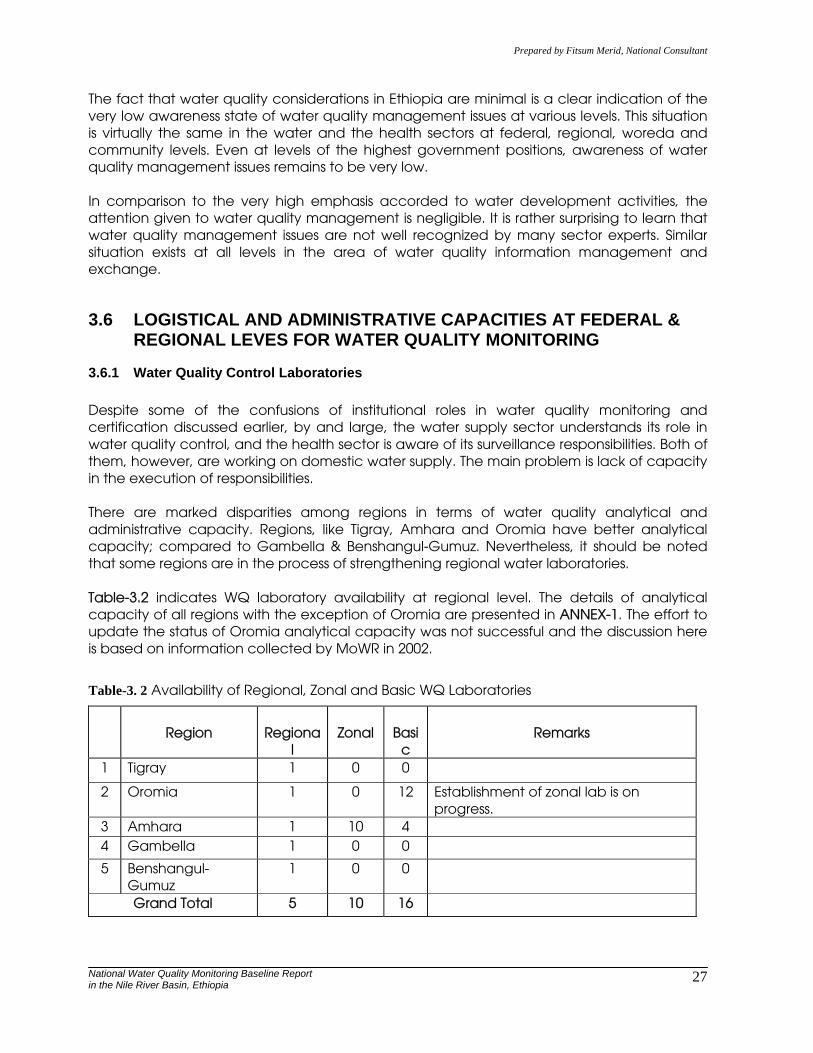
Prepared by Fitsum Merid, National Consultant
National Water Quality Monitoring Baseline Report in the Nile River Basin, Ethiopia
27
The fact that water quality considerations in Ethiopia are minimal is a clear indication of the very low awareness state of water quality management issues at various levels. This situation is virtually the same in the water and the health sectors at federal, regional, woreda and community levels. Even at levels of the highest government positions, awareness of water quality management issues remains to be very low. In comparison to the very high emphasis accorded to water development activities, the attention given to water quality management is negligible. It is rather surprising to learn that water quality management issues are not well recognized by many sector experts. Similar situation exists at all levels in the area of water quality information management and exchange.
3.6 LOGISTICAL AND ADMINISTRATIVE CAPACITIES AT FEDERAL & REGIONAL LEVES FOR WATER QUALITY MONITORING
3.6.1 Water Quality Control Laboratories Despite some of the confusions of institutional roles in water quality monitoring and certification discussed earlier, by and large, the water supply sector understands its role in water quality control, and the health sector is aware of its surveillance responsibilities. Both of them, however, are working on domestic water supply. The main problem is lack of capacity in the execution of responsibilities. There are marked disparities among regions in terms of water quality analytical and administrative capacity. Regions, like Tigray, Amhara and Oromia have better analytical capacity; compared to Gambella & Benshangul-Gumuz. Nevertheless, it should be noted that some regions are in the process of strengthening regional water laboratories. Table-3.2 indicates WQ laboratory availability at regional level. The details of analytical capacity of all regions with the exception of Oromia are presented in ANNEX-1. The effort to update the status of Oromia analytical capacity was not successful and the discussion here is based on information collected by MoWR in 2002.
Table-3. 2 Availability of Regional, Zonal and Basic WQ Laboratories
�
Region
Regiona
l
Zonal
Basi
c
Remarks
1 Tigray 1 0 0
2 Oromia 1 0 12 Establishment of zonal lab is on progress.
3 Amhara 1 10 4 4 Gambella 1 0 0
5 Benshangul-Gumuz
1 0 0
Grand Total 5 10 16

Prepared by Fitsum Merid, National Consultant
National Water Quality Monitoring Baseline Report in the Nile River Basin, Ethiopia
28
The zonal labs listed in ANNEX-1 are expected to cover the needs of all rural and urban water services of Amhara. The Oromia zonal labs provide laboratory services for rural and urban water schemes. It is to be noted that only few water services have basic laboratories at town level. All regions do not own laboratory at Woreda level.
3.6.2 Status of Public Health Laboratories* As is the case with WQ control laboratories, only a few regions have public health laboratories. According to the Environmental Health Department of the MoH, Amhara has such facilities at Bahir-Dar and Dessie. It is also understood that Oromia has started the construction of zonal health laboratories at Nazareth, Jimma Zone and Eastern Wellega Zone. It is reported that the Gondar and Jimma Health Colleges provide water quality testing services upon request. The information collected by MoWR in year 2002, shows that Addis Ababa Administration public health lab did not conduct any regular WQ test since 1990, due to shortage of chemicals. The Tigray Public Health Laboratory and Research center is reported to have started operations. The public health laboratories mentioned above are in most cases involved in bacteriological examinations on drinking water. But it is reported that most of them have problems in obtaining consumables for carrying out their activities. Regions with no public health laboratories send samples to the ENHRI in Addis Ababa and other public health laboratories outside their regions.
3.6.3 Staff Availability in WQ Management Activities There is a general lack of skilled and semi-skilled WQ staff in almost all regions (see ANNEX-1 to 4). Zonal WQ control labs in all regions have staff with qualification below the minimum requirement by WHO and MoWR guideline prepared in March 2002. As is to be expected most of the high level WQ manpower is not adequate in number and are located at regional facilities. Only Amhara has deployed at least one diploma holder technician at the zonal laboratories level. At Woreda level there are no water quality lab and staff at all. The Ethiopian Guideline for Drinking Water Quality recommends 4 professional at Regional level, 4 sub-professionals at Zonal and 2 technicians at basic laboratory level.
3.6.4 Staff Training & Upgrading Programs Short and long training courses are provided to Regional WQ staffs in water quality management from 1998 to 1999 (Continental Consultants, 2002) and summarized in Table-3.3. Only Amhara Region, has reported the existence of appropriations for the purpose of training and that training of staff has taken place. Two Amhara regional lab technicians were trained in the AAWSA laboratory and two others were trained abroad for a total of 64 man-weeks. Oromia had arranged training for a total of 45 staff. Twelve of these were zonal laboratory technicians. What can be concluded from this discussion is that the relatively more organized water development regional organizations have paid more attention to staff training and upgrading programs. Arba-Minch University (AMU) situated in SNNP
* This discussion is based on information provided by the Environmental Health Department of the MoH.
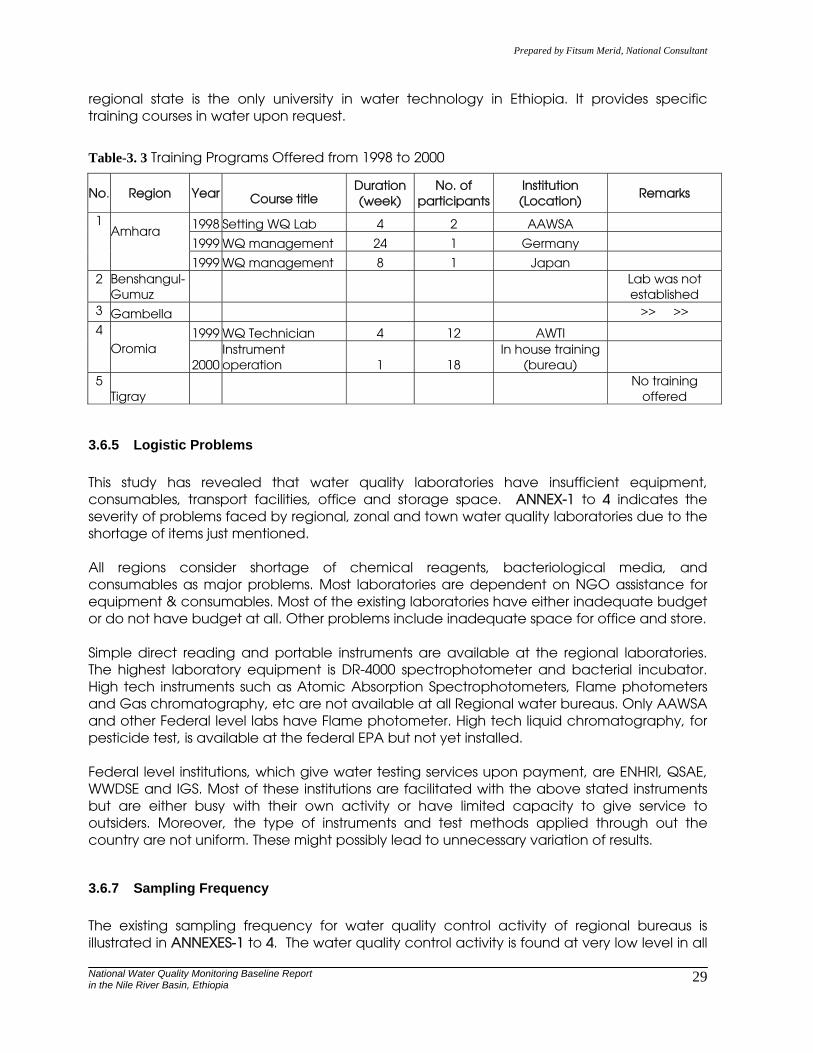
Prepared by Fitsum Merid, National Consultant
National Water Quality Monitoring Baseline Report in the Nile River Basin, Ethiopia
29
regional state is the only university in water technology in Ethiopia. It provides specific training courses in water upon request.
Table-3. 3 Training Programs Offered from 1998 to 2000
No. Region Year Course title Duration (week)
No. of participants
Institution (Location)
Remarks
1998 Setting WQ Lab 4 2 AAWSA
1999 WQ management 24 1 Germany
1 Amhara 1999 WQ management 8 1 Japan
2 Benshangul-Gumuz
Lab was not established
3 Gambella >> >>
1999 WQ Technician 4 12 AWTI 4
Oromia 2000
Instrument operation 1 18
In house training (bureau)
5 Tigray
No training offered
3.6.5 Logistic Problems This study has revealed that water quality laboratories have insufficient equipment, consumables, transport facilities, office and storage space. ANNEX-1 to 4 indicates the severity of problems faced by regional, zonal and town water quality laboratories due to the shortage of items just mentioned. All regions consider shortage of chemical reagents, bacteriological media, and consumables as major problems. Most laboratories are dependent on NGO assistance for equipment & consumables. Most of the existing laboratories have either inadequate budget or do not have budget at all. Other problems include inadequate space for office and store. Simple direct reading and portable instruments are available at the regional laboratories. The highest laboratory equipment is DR-4000 spectrophotometer and bacterial incubator. High tech instruments such as Atomic Absorption Spectrophotometers, Flame photometers and Gas chromatography, etc are not available at all Regional water bureaus. Only AAWSA and other Federal level labs have Flame photometer. High tech liquid chromatography, for pesticide test, is available at the federal EPA but not yet installed. Federal level institutions, which give water testing services upon payment, are ENHRI, QSAE, WWDSE and IGS. Most of these institutions are facilitated with the above stated instruments but are either busy with their own activity or have limited capacity to give service to outsiders. Moreover, the type of instruments and test methods applied through out the country are not uniform. These might possibly lead to unnecessary variation of results.
3.6.7 Sampling Frequency The existing sampling frequency for water quality control activity of regional bureaus is illustrated in ANNEXES-1 to 4. The water quality control activity is found at very low level in all

Prepared by Fitsum Merid, National Consultant
National Water Quality Monitoring Baseline Report in the Nile River Basin, Ethiopia
30
Regions. This could possibly be ascribed to many problems mentioned above. The amount of tests conducted by all regions is far from the Minimum Frequency of Sampling and Analysis requirement proposed by Ethiopian Guideline value (2002). With the available infrastructure, human and financial resources, it is difficult to attain the guideline in the short-term. Similarly the number of samples tested by Regional Health Bureaus until year 2000 is presented in Table-3.4 (Continental Consultants, 2002). This result shows that until 2002 there was no any water quality surveillance activity in the country. Likewise, currently there is no regular surveillance program. In general there is no planned water quality monitoring program undertaken in the domestic water sources and surface water of the Basins.
Table-3. 4 Annual Average No of Tests & Activities Conducted by WQ Surveillance Program(external agency by MoH until year 2002)
No. Region Physical Chemical Bacteriological Sanitary Inspection
1 Addis Ababa * 780 780 2 Amhara 0 0 0 0 3 Benshangul-Gumuz 0 0 0 0 4 Gambella 0 0 0 0 5 Oromia 0 0 0 0 6 Tigray 0 0 0 0
* A.A Surveillance activity was conducted before 1990. Currently there is no such activity at all.

Prepared by Fitsum Merid, National Consultant
National Water Quality Monitoring Baseline Report in the Nile River Basin, Ethiopia
31
4 WATER QUALITY OVERVIEW OF ABBAY (BLUE NILE) RIVER BASIN
4.1 Water Quality Status of Abbay River & Its Tributaries
The water quality status of Abbay Basin is evaluated using the data collected from MoWR database, Abbay River Basin Master Plan Study Report (1998) and the Land and Water Study of the Blue Nile (1964). The WQ results reported by USBR, 1961 & BCEOM, 1997 are stipulated in Table-4.2. The location of sampling sites by USBR is depicted in Figure-4.2. Its collective usefulness is limited by its inconsistent nature. Interpretation and synthesis of this information, which would result in a more coherent understanding of water-quality conditions, trends, controlling factors, and process is a difficult and challenging task but would be of considerable value. Although these samples are not representative of the whole Basin in terms of space and time, they do illustrate some physico-chemical composition of the water. The collected Abbay Basin Meta data are evaluated for compliance against:
• "Guideline standards for priority surface water pollutants with regard to protection of aquatic species" prepared by EPA, in August 2003 and waiting for Government endorsement and;
• "Ethiopian Guideline for Drinking Water Quality", prepared by MoWR in March 2002. Major findings of Abbay Basin surface and ground water quality are presented as follows.
4.1.1 Total Dissolved Solids (TDS) and Electrical Conductivity (EC)
Total dissolved solids characterized mainly by major anions and cations are directly related to the electrical conductivity of the water. The low Electrical Conductivity (EC) and TDS value in general shows that the water is soft in nature and has low salinity. Moreover, the low conductivity is sign of low fertility of the water with regard to aquatic life. Electrical conductivity (EC) measurements were very low at all the sampled sites. EC is the ability of the water to conduct electric current and directly related to the amount of cations and anions in the water. The maximum concentration recorded is 846 �s/cm, at Dindir near Abu Mendi (Table-4.2,USGS, 1964). The report explained the high value of EC at Dindir was due to very low flow of the river at time of sampling and did not represent the actual condition of the River. The EC measurement of the same River at a relatively higher flow shows lower value of 167 (Table-4.1).
4.1.2 Pesticides and Metals
Data for metals such as copper, zinc, cobalt, aluminum, barium, lead, chromium mercury and cadmium as well as pesticides are not available to provide overview on the surface water quality of Abbay River Basin.
Prepared by Fitsum Merid, National Consultant
National Water Quality Monitoring Baseline Report in the Nile River Basin, Ethiopia
32
Figure-4. 1 Location of Sampling Sites by USBR, 1964

Prepared by Fitsum Merid, National Consultant
National Water Quality Monitoring Baseline Report in the Nile River Basin, Ethiopia
33
Figure-4. 2 Mean Monthly Suspended Sediment Load (Gilgel Abbay Near Merawi)
Fig-4.2 Mean Monthly Suspended Sediment Load (Gilgel Abbay Near Merawi)
0200400600800
1000120014001600
Jan
MarMay Ju
lSep Nov
Month
(000
, Ton
s)
Mean Max Min
4.1.3 pH
All the pH readings taken are within the standard value for fish support (6 to 9) (Table-4.2 & 4.3). The pH value is the measure of the concentration of hydrogen (H+) and hydroxyl (OH-) ions in the water. It is to determine the acidity or alkalinity of the substance. The 7.455 median pH values show the slightly alkaline nature of the water.
4.1.4 Nutrient
Nutrient concentration of surface water expressed in terms of phosphate and nitrate are usually the main causes of algal blooming in surface water. Eutrophication results from nutrients entering surface water, either from a point discharge or in run-off from agricultural land. The variables that should be measured are nitrate, nitrite, ammonia, total phosphorus (filtered and unfiltered), reactive silica, transparency and chlorophyll a. However, the only available measured parameter is phosphate and that is very low in concentration.
4.1.5 Sodium and Potassium
The Na+ and K+ reading expressed in terms of Sodium Adsorption Ratio (SAR) is the useful parameter for the evaluation of the water body for irrigation purpose. For irrigation water it is important to measure the sodium adsorption ratio as follows:
The higher the SAR value of the water the less suitable will be for irrigation purposes. The maximum computed value among the readings is 0.62 which is less than 10. This illustrates that the water is very much suitable for irrigation purpose.
Prepared by Fitsum Merid, National Consultant
National Water Quality Monitoring Baseline Report in the Nile River Basin, Ethiopia
34
4.1.6 Total Suspended Solids (TSS)
The EPA has set a TSS concentration standard of < 25 mg/l [annual mean] and < 50 mg/l [maximum value]. As a result of steep topography, strong seasonal rainfall and deforestation all the tributaries of Abbay are known to have significant sediment load during the rainy season.
The monthly sediment load of Gilgel Abbay near Merawi, tributary of Lake Tana, is presented in Figure-4.2. The period of record is from 1982 to 1990. There is no data for Suspended Solid concentration value for the other tributary rivers in the Basin.
The effect of high suspended solid on the aquatic life is well documented. It absorbs heat from the sun, increase the water temperature and thus cause the O2 level to fall down. The low O2 level has negative effect on reproduction of aquatic organisms. Suspended solids can clog fish gills, reduce growth rates, and decrease resistance to diseases and decrease egg and larva development of the aquatic life. Particles can also settle at the bottom of the river and smother the egg of fish and other aquatic organism.
4.1.7 Chloride
The chloride concentration of the rivers stipulated in Tables-4.1 and 4.2 is very low (nil to 6 mg/l), at times of sampling. Hence the parameter was in conformity with the standard set by EPA (250mg/l for aquatic species).
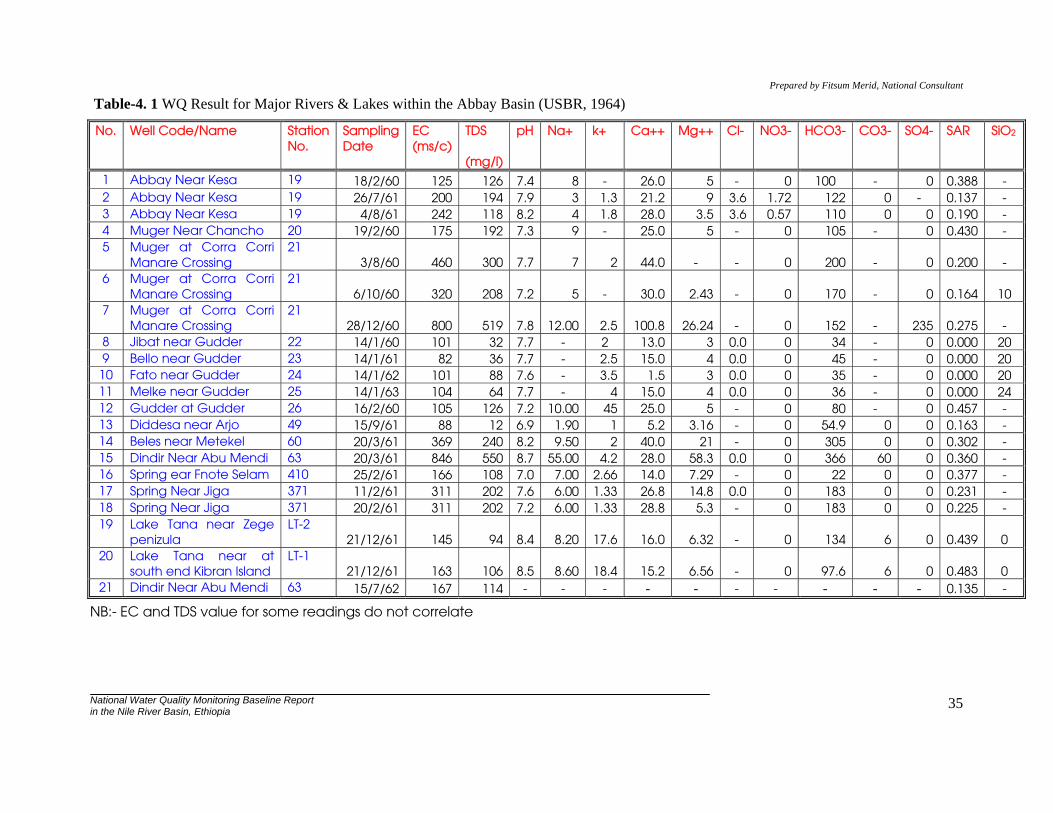
Prepared by Fitsum Merid, National Consultant
National Water Quality Monitoring Baseline Report in the Nile River Basin, Ethiopia
35
Table-4. 1 WQ Result for Major Rivers & Lakes within the Abbay Basin (USBR, 1964)
No. Well Code/Name Station No.
Sampling Date
EC (ms/c)
TDS (mg/l)
pH Na+ k+ Ca++ Mg++ Cl- NO3- HCO3- CO3- SO4- SAR SiO2
1 Abbay Near Kesa 19 18/2/60 125 126 7.4 8 - 26.0 5 - 0 100 - 0 0.388 - 2 Abbay Near Kesa 19 26/7/61 200 194 7.9 3 1.3 21.2 9 3.6 1.72 122 0 - 0.137 - 3 Abbay Near Kesa 19 4/8/61 242 118 8.2 4 1.8 28.0 3.5 3.6 0.57 110 0 0 0.190 - 4 Muger Near Chancho 20 19/2/60 175 192 7.3 9 - 25.0 5 - 0 105 - 0 0.430 - 5 Muger at Corra Corri
Manare Crossing 21
3/8/60 460 300 7.7 7 2 44.0 - - 0 200 - 0 0.200 - 6 Muger at Corra Corri
Manare Crossing 21
6/10/60 320 208 7.2 5 - 30.0 2.43 - 0 170 - 0 0.164 10 7 Muger at Corra Corri
Manare Crossing 21
28/12/60 800 519 7.8 12.00 2.5 100.8 26.24 - 0 152 - 235 0.275 - 8 Jibat near Gudder 22 14/1/60 101 32 7.7 - 2 13.0 3 0.0 0 34 - 0 0.000 20 9 Bello near Gudder 23 14/1/61 82 36 7.7 - 2.5 15.0 4 0.0 0 45 - 0 0.000 20 10 Fato near Gudder 24 14/1/62 101 88 7.6 - 3.5 1.5 3 0.0 0 35 - 0 0.000 20 11 Melke near Gudder 25 14/1/63 104 64 7.7 - 4 15.0 4 0.0 0 36 - 0 0.000 24 12 Gudder at Gudder 26 16/2/60 105 126 7.2 10.00 45 25.0 5 - 0 80 - 0 0.457 - 13 Diddesa near Arjo 49 15/9/61 88 12 6.9 1.90 1 5.2 3.16 - 0 54.9 0 0 0.163 - 14 Beles near Metekel 60 20/3/61 369 240 8.2 9.50 2 40.0 21 - 0 305 0 0 0.302 - 15 Dindir Near Abu Mendi 63 20/3/61 846 550 8.7 55.00 4.2 28.0 58.3 0.0 0 366 60 0 0.360 - 16 Spring ear Fnote Selam 410 25/2/61 166 108 7.0 7.00 2.66 14.0 7.29 - 0 22 0 0 0.377 - 17 Spring Near Jiga 371 11/2/61 311 202 7.6 6.00 1.33 26.8 14.8 0.0 0 183 0 0 0.231 - 18 Spring Near Jiga 371 20/2/61 311 202 7.2 6.00 1.33 28.8 5.3 - 0 183 0 0 0.225 - 19 Lake Tana near Zege
penizula LT-2
21/12/61 145 94 8.4 8.20 17.6 16.0 6.32 - 0 134 6 0 0.439 0 20 Lake Tana near at
south end Kibran Island LT-1
21/12/61 163 106 8.5 8.60 18.4 15.2 6.56 - 0 97.6 6 0 0.483 0 21 Dindir Near Abu Mendi 63 15/7/62 167 114 - - - - - - - - - - 0.135 -
NB:- EC and TDS value for some readings do not correlate

Prepared by Fitsum Merid, National Consultant
National Water Quality Monitoring Baseline Report in the Nile River Basin, Ethiopia
36
Table-4. 2 WQ Result for Major Rivers (BCEOM, 1996, Cited By BCEOM Abbay River basin study, 1998)
T. Hard
T. Alka No. Well Code/Name
Sampling Date
Elel (m asl)
EC ms/c TDS (mg/l)
pH Na+ k+
( mg/l Ca CO3)
Ca++ Mg++ Cl- PO4-- SAR
1 Gudder River (Bridge)
9/7/96 2030 58 10.0 6.52 2.9 2.4 18 18 4.80 1.2 4.0 0.17 0.32
2 Muger River (Sodolbe)
15/7/96 2200 180 100.0 6.29 4.7 3.9 238 120 79.20 9.72 5.0 2.8 0.14
3 Anger River (Bridge)
10/8/96 1340 50 20.0 6.97 2.8 2.5 24 18 5.60 2.43 4.0 1.6 0.26
4 Anger River (Guten)
10/8/96 1350 220 100.0 7.55 12.4 5 74 82 18.80 5.3 6.0 2.5 0.68
5 Didessa River (Bedele bridge)
13/8/96 1300 60 20.0 6.74 3.3 1.9 26 20 6.40 2.43 1.0 2.7 0.29
6 Dabena River (W. of bedele)
13/8/96 1830 30 10.0 7.02 0.9 2.8 16 14 4.80 0.98 4.0 1.7 0.10
7 Dabena River (E. of bedele)
13/8/96 1890 30 10.0 6.64 1.7 2.2 6 10 4.80 0.98 3.0 2.8 0.19
8 Didessa River (Gimbe bridge)
14/8/96 1200 50 20.0 6.97 3 2.5 30 22 9.60 1.4 2.0 2.5 0.25
9 Dabus River (bridge)
16/8/96 1400 50 20.0 6.34 2.6 2.2 24 10 5.60 2.43 4.0 0.35 0.24
10 Muger River (Chancho bridge)
21/8/96 1550 40 10.0 7.51 1.6 2.6 42 30 12.80 2.43 4.0 - 0.32

Prepared by Fitsum Merid, National Consultant
National Water Quality Monitoring Baseline Report in the Nile River Basin, Ethiopia
37
4.2 WATER QUALITY OF LAKE TANA & OTHER SMALLER LAKES
The shallow depth nature of Lake Tana, (Max 14m & average depth of 8m), low temperature variation and presence of fairly strong wind after sunset generally allows the water to be well mixed (BCEOM, 1998). Hence there is no stratification layer in the lake. Table-4.3 presents the physico-chemical composition of Lake Tana analyzed in different years.
Table-4. 3 Water Quality Statistics of Lake Tana
NO. Parameter Value Year of Analysis Remarks 1 pH 7.5 to 8.2 in 1940
7.86 to 8.87 8.43 Avg in 1997 2 TDS (mg/l) 151 1940
174 1925 3 EC (�s/cm) 210 105 to 212 1997 136 Min 1997 No. observation 92 234 Max 1997 No. observation 92 194
Avg 1997 No. observation 92
4 Transparency 0.31 to 1.82 m 1997 No. of Obs=218 0.83 m Avg 1997 No. of Obs=218 5 Temp (oC) 20.1 - 23.9 1997 18.3 - 26.2 1997 No. of Obs=216 22.3 Avg No. of Obs=216 6 Chlorophyll
"a" 3.7 mg/m3 Min
1988
6.2 g/m3 Max
1986
7 Bioass 129 mg C/2 avg
1997
7 DO (mg/l) 3.3 Min 1997 10.8 Max 1997 6.5 Avg 1997 No. of Obs=216 8 Ca++ (mg/l) 27.1 1925 8.7 1940 18.0 1940 9 Mg++ (mg/l) 10 1925 9.3 1940 9.7 10 Cl (mg/l) 8.0 1925 8.0 1940 11 SiO2 (mg/l) 22 1940 12 CO3 + HCO3 1.7 (mg/l) 1940 13 Hardness 84.9 (mg/l)
Prepared by Fitsum Merid, National Consultant
National Water Quality Monitoring Baseline Report in the Nile River Basin, Ethiopia
38
Chemical composition of Lake Tana characterized it as Oligomesotrophic (Nagelkerke & BCEOM, 1997 cited by BCEO, 1998). The pH (long period measurement value) of Lake Tana is slightly alkaline and within acceptable range of ambient standard for aquatic species as well as for drinking purposes. The low TDS and EC value show that the water is soft and suitable for domestic purposes. The limnology part of the master plan study report by BCEOM (1998) associates it with low fish productivity of the lake. The primary production of the lake is dependent on the availability of carbonates, nitrates and phosphates which is evaluated in bulk by the EC measurement. The 6.5 mg-DO/l is the average value of 216 observations (Nagelkerke, 1997 cited by BCEOM, 1998). The report acknowledged that oxygen content of the Lake can drop down to nil without anoxic layer. Major towns like Bahir-Dar & Gonder and villages situated in the Lake Tana sub-basin don't own any form of waste collection and treatment facilities. Therefore, it is obvious that the waste is directly discharged to the lake. Hence, the population pressure and industrialization trend of the area will be pollution concern of Lake Tana in the near future. The physico-chemical water quality of the remaining smaller lakes and reservoirs is presented in Table-4.4. The samples were collected from the water bodies by BCEOM (1996). Their water quality results during sampling were within the acceptable range of ambient water quality standard set by EPA (2003) for aquatic species.

Prepared by Fitsum Merid, National Consultant
National Water Quality Monitoring Baseline Report in the Nile River Basin, Ethiopia
39
Table-4. 4 Physico-chemical Result of Major Lakes within the Abbay basin
No. Well Code/Name
Samp Date
Elevation (m asl)
EC (ms/c)
TDS (mg/l)
pH Na+ k+ T. Hard mg/l Ca CO3
T. Alk mg/l Ca CO3
Ca++ Mg++ Cl- PO4--
1 Lake Wenchi 1997 2780 208.67 420 7.55 47.3 6.3 20 80.67 6.4 0.93 28.0 2.8 2 Lake Dandi 1997 - 140 - 7.7 - - 60 60.00 - - - - 3 Fincha
Reservoir 1997 2217 to
2222 70 25 6.99 2.8 2.05 34 30.00 8.8 2.9 5.0 2.7 4 Amrti
Reservoir 1997 2235
25 10 6.55 1.08 1.38 16 23.33 4.2 1.2 3.0 2.6 5 Muger
Reservoir 1997 2500
214 135 6.83 5.45 2.5 84 59.00 - 6.33 5.0 - 6 Muger
Reservoir 1997 2500
250.33 133 7.09 5.4 2.67 82.67 66.00 23.2 5.85 5.7 2.2 7 Gebete
Dam 1997 2250
78 64 5.54 1.10 3.1 24 4.08 5.6 1.43 3.0 0.4 8 Sorga Dam 1997 204 91 68 6.35 2.90 2.9 22 8.00 6.4 1.4 7.0 0.18 9 Intro Dam 1997 1950 57 60 6.52 1.50 1.7 18 6.00 4.8 1.4 4.0 2.8
Source: (BCEOM, 1996, Cited By BCEOM Abbay River basin study, 1998)
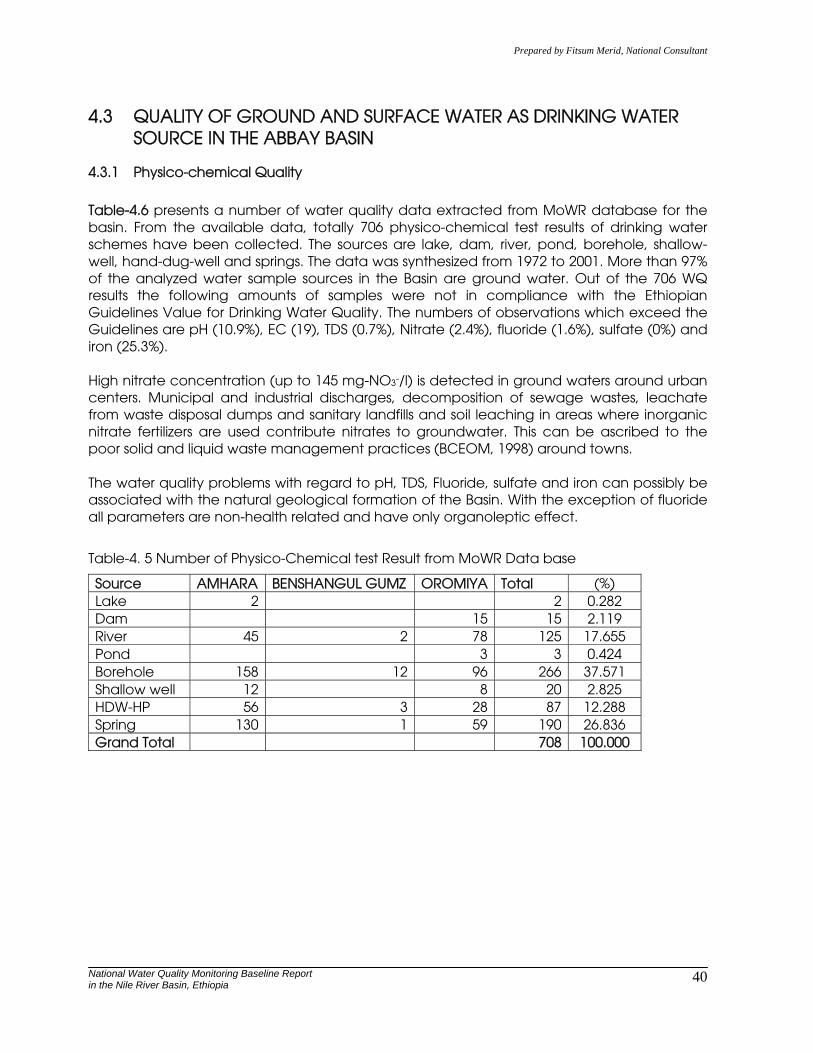
Prepared by Fitsum Merid, National Consultant
National Water Quality Monitoring Baseline Report in the Nile River Basin, Ethiopia
40
4.3 QUALITY OF GROUND AND SURFACE WATER AS DRINKING WATER SOURCE IN THE ABBAY BASIN
4.3.1 Physico-chemical Quality
Table-4.6 presents a number of water quality data extracted from MoWR database for the basin. From the available data, totally 706 physico-chemical test results of drinking water schemes have been collected. The sources are lake, dam, river, pond, borehole, shallow-well, hand-dug-well and springs. The data was synthesized from 1972 to 2001. More than 97% of the analyzed water sample sources in the Basin are ground water. Out of the 706 WQ results the following amounts of samples were not in compliance with the Ethiopian Guidelines Value for Drinking Water Quality. The numbers of observations which exceed the Guidelines are pH (10.9%), EC (19), TDS (0.7%), Nitrate (2.4%), fluoride (1.6%), sulfate (0%) and iron (25.3%). High nitrate concentration (up to 145 mg-NO3-/l) is detected in ground waters around urban centers. Municipal and industrial discharges, decomposition of sewage wastes, leachate from waste disposal dumps and sanitary landfills and soil leaching in areas where inorganic nitrate fertilizers are used contribute nitrates to groundwater. This can be ascribed to the poor solid and liquid waste management practices (BCEOM, 1998) around towns. The water quality problems with regard to pH, TDS, Fluoride, sulfate and iron can possibly be associated with the natural geological formation of the Basin. With the exception of fluoride all parameters are non-health related and have only organoleptic effect.
Table-4. 5 Number of Physico-Chemical test Result from MoWR Data base
Source AMHARA BENSHANGUL GUMZ OROMIYA Total (%) Lake 2 2 0.282 Dam 15 15 2.119 River 45 2 78 125 17.655 Pond 3 3 0.424 Borehole 158 12 96 266 37.571 Shallow well 12 8 20 2.825 HDW-HP 56 3 28 87 12.288 Spring 130 1 59 190 26.836 Grand Total 708 100.000
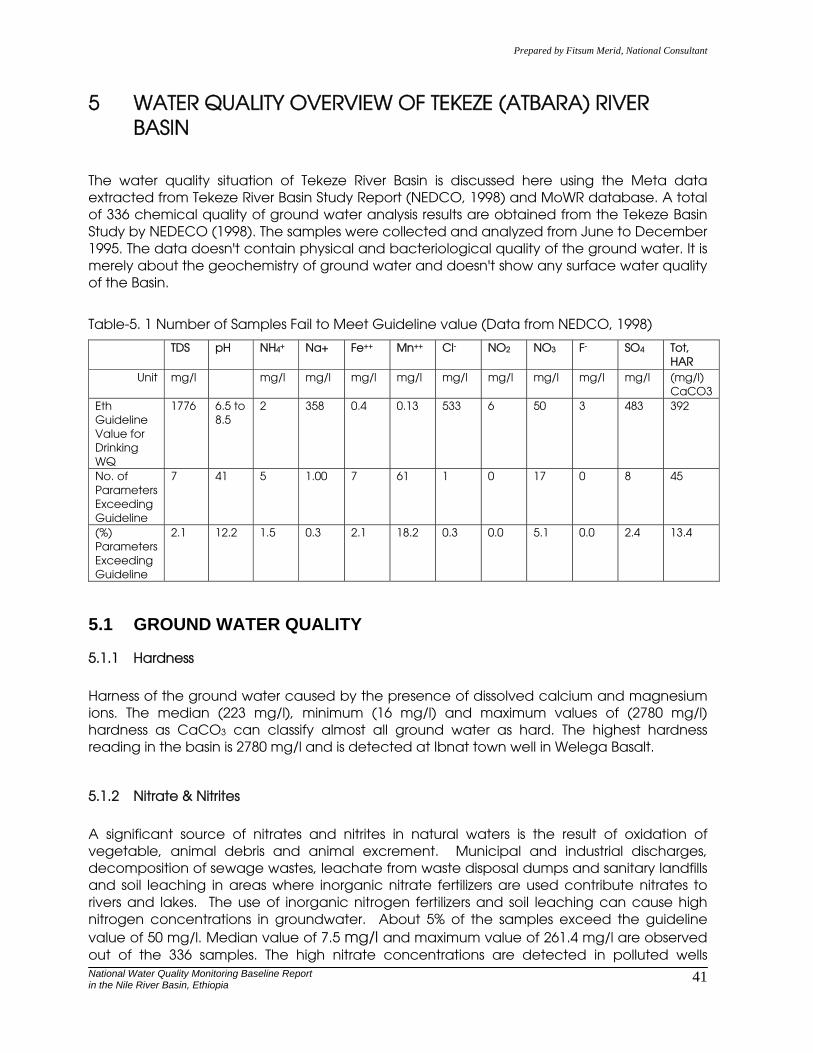
Prepared by Fitsum Merid, National Consultant
National Water Quality Monitoring Baseline Report in the Nile River Basin, Ethiopia
41
5 WATER QUALITY OVERVIEW OF TEKEZE (ATBARA) RIVER BASIN
The water quality situation of Tekeze River Basin is discussed here using the Meta data extracted from Tekeze River Basin Study Report (NEDCO, 1998) and MoWR database. A total of 336 chemical quality of ground water analysis results are obtained from the Tekeze Basin Study by NEDECO (1998). The samples were collected and analyzed from June to December 1995. The data doesn't contain physical and bacteriological quality of the ground water. It is merely about the geochemistry of ground water and doesn't show any surface water quality of the Basin.
Table-5. 1 Number of Samples Fail to Meet Guideline value (Data from NEDCO, 1998)
TDS pH NH4+ Na+ Fe++ Mn++ Cl- NO2 NO3 F- SO4 Tot, HAR
Unit mg/l mg/l mg/l mg/l mg/l mg/l mg/l mg/l mg/l mg/l (mg/l) CaCO3
Eth Guideline Value for Drinking WQ
1776 6.5 to 8.5
2 358 0.4 0.13 533 6 50 3 483 392
No. of Parameters Exceeding Guideline
7 41 5 1.00 7 61 1 0 17 0 8 45
(%) Parameters Exceeding Guideline
2.1 12.2 1.5 0.3 2.1 18.2 0.3 0.0 5.1 0.0 2.4 13.4
5.1 GROUND WATER QUALITY
5.1.1 Hardness
Harness of the ground water caused by the presence of dissolved calcium and magnesium ions. The median (223 mg/l), minimum (16 mg/l) and maximum values of (2780 mg/l) hardness as CaCO3 can classify almost all ground water as hard. The highest hardness reading in the basin is 2780 mg/l and is detected at Ibnat town well in Welega Basalt.
5.1.2 Nitrate & Nitrites
A significant source of nitrates and nitrites in natural waters is the result of oxidation of vegetable, animal debris and animal excrement. Municipal and industrial discharges, decomposition of sewage wastes, leachate from waste disposal dumps and sanitary landfills and soil leaching in areas where inorganic nitrate fertilizers are used contribute nitrates to rivers and lakes. The use of inorganic nitrogen fertilizers and soil leaching can cause high nitrogen concentrations in groundwater. About 5% of the samples exceed the guideline value of 50 mg/l. Median value of 7.5 mg/l and maximum value of 261.4 mg/l are observed out of the 336 samples. The high nitrate concentrations are detected in polluted wells

Prepared by Fitsum Merid, National Consultant
National Water Quality Monitoring Baseline Report in the Nile River Basin, Ethiopia
42
around large towns such as Ibnat (North of Debre Tabor), Mekel, Aykel, Indasilase and Shiraro (NEDCO, 1998). Nitrate in drinking water is primarily of health concern in that it can be readily converted in the gastrointestinal tract to nitrite as a result of bacterial reduction and cause blue babies disease.
5.1.3 Total Dissolved Solids (TDS)
Total dissolved solids are characterized mainly by major anions and cations such as carbonate, bicarbonate, sulfate, chloride, nitrate, sodium, calcium, magnesium, potassium, etc. With respect to drinking water quality, water with extremely low TDS concentrations may be objectionable because of its flat, insipid taste. High concentration of TDS on the other hand poses some physiological synonymous. These may include: laxative effects mainly from sodium sulfate and magnesium sulfate; the adverse effect of sodium on certain cardiac patients; the effect of sodium on women with toxaemia associated with pregnancy; and some effects on the function kidnies at high concentrations. Waters in areas of Paleozoic and Mesozoic sedimentary rock have high levels of TDS. Domestic and industrial discharges and runoff can result in elevated levels of total dissolved solids of natural waters. The statistics of TDS reading has median value of 312 mg/l, minimum values of 32 mg/l, maximum value of 2750 mg/l and only 7 samples exceed the guideline value for drinking WQ. The high TDS reading is most probably related to deep wells, as in the tertiary Dolerite originated from the Aguala Shale into which the Dolerite intrudes (NEDECO, 1998). The low TDS value in the ground water can be explained by the fact that ground water with tuffs are very porous and are generally located topographically at the highest point of the Basin. Dilution of the ground water by infiltrating rainwater is therefore high.
5.1.4 Pesticides and Metals
Data for metals such as copper, zinc, cobalt, aluminum, barium, lead, chromium, mercury and cadmium as well as pesticides are not available to provide overview on the surface water quality of Tekeze River Basin.
5.1.5 pH, Carbon-dioxide, Carbonate and Bicarbonate
The pH of natural waters is a measure of acid-base equilibrium achieved by various dissolved compounds and which is a result of the carbon dioxide – bicarbonate – carbonate equilibrium system. The pH plays an important role since it influences physical, chemical and biological processes in the aquatic environment. It may be influenced by various factors and processes, including temperature, discharge of effluents, acid mine drainage, runoff and decay processes. Low pH levels cause severe corrosion of metals in the distribution system while high pH values result in progressive decrease in the efficiency of the chlorine disinfection process. More than 12 % of the samples exceed the Guideline value (6.5 to 8.5) with Max value of 9.8, Min 4.9 and median value of 7.2. The alkaline and acidic nature of some samples is due to natural geological formation of the aquifer.
Prepared by Fitsum Merid, National Consultant
National Water Quality Monitoring Baseline Report in the Nile River Basin, Ethiopia
43
5.1.6 Sulfate
Water is the principal and natural source of sulfate. No data is available regarding the sulfate content of foodstuffs. Food additives, however, contain sulfate. It is one of the least toxic anion to humans. Gypsum (CaSO4.2H2O), anhydrite (CaSO4) and pyrite (FeS2) are the possible natural sources of sulfate in ground water. With the exception of 8 samples all are within the acceptable value (Guideline 483 mg/l). Statically the median value is 15, minimum 0 and maximum 1700 mg/l sulfate concentration found in ground water. The highest value is caused by dissolved gypsum originating from various horizons inter-bedded within the shalle and limestone layers of the lower part of the Aguala shalle formation (NEDECO, 1998). The low sulfate concentration is found in Tuffs and basal formation.
5.1.7 Iron and Manganese
Iron, the essential element required for the formation of hemoglobin and other proteins and enzymes in the body is released naturally into the aquatic environment from weathering and leaching of sulfide ores and igneous, sedimentary and metamorphic rocks. The presence of high iron concentrations in drinking water poses predominantly aesthetic problems. The presence of iron in water and the environment is also attributable to human activities (acid mine drainage, sewage, iron related industries, etc). Maximum concentration of 2.03 mg/l, minimum 0 and median value of 0.02 is detected in the Basin groundwater. The Enticho sandstone and Edaga Arbi Glacial deposits are containing the highest and lowest iron concentrations respectively (NEDECO, 1998) Manganese, which is frequently found in association with iron, has similar chemical behavior to that of iron. Raw water frequently contains manganese from natural sources such as soils, sediments, and metamorphic and sedimentary rocks. In addition, industrial discharges can also contribute significantly to the amount of manganese found in waters. More than 18% of the samples are exceeding the Guideline value, 0.13 mg-Mn/l. Maximum concentration of 3mg/l and median value of 0.2 are detected.
5.1.8 Fluoride
Fluorine, which exists naturally as fluorides in some minerals such as fluorapatite, fluorspar and cryolite, is also present in several industrial as well as in wide variety of pharmaceutical products. While traces of fluoride occur in different water sources, higher concentrations are often associated with groundwater. Whereas a small amount of fluoride is necessary for proper hardening of dental enamel and to increase resistance to attack on tooth enamel by bacterial acids, excessive concentrations cause dental mottling (at cons. 1.5-2.0 mg/L); skeletal fluorosis (when conc. exceeds 3-6 mg/L); and crippling fluorosis (at concentration of 20-40 mg/L) per day. All the measured fluoride concentrations in the groundwater are low enough to prevent fluorosis, but 80 % of them have less than 1mg-F/l which may cause dental caries.
5.2 SURFACE WATER QUALITY
All the 509 physico-chemical water quality data collected from MoWR database are from existing drinking water schemes in Tekeze River Basin. These physico-chemical water quality results are generated from 1982 to 2000. Out of the total number of data about 95 % of the results have ground water source. Only 29 test results are about surface water source. These

Prepared by Fitsum Merid, National Consultant
National Water Quality Monitoring Baseline Report in the Nile River Basin, Ethiopia
44
values are not representative of the Basin surface water quality at all but discussed here to give the reader some impression of the Basin surface water quality situation. The discharge of the streams and exact location of sampling stations are not known for sure. Exceptionally high EC values (Saint merry River =2029, Mai-Kemeu River= 1340, & 1000 �s/cm) are recorded in the rivers located in Tigray Region. This unusually high EC value of river water could be attributed to pollution of domestic waste around towns. Moreover, the sampling might be conducted during low flow condition of the rivers. The Tekeze Basin surface water quality supports the use for domestic and irrigation purposes with the exception of Illala River, which has a high TDS value and sediment load of all the Basin Rivers (NEDECO, 1998).
Table-5. 2 Number of Physico-Chemical test Result (Tekeze Basin)
Sources Amhara Tigray Total (%) lake dam 3 3 0.6 River 18 8 26 5.1 Pond 0.0 Borehole 53 289 342 67.2 Shallow-well 4 12 16 3.1 HDW-HP 32 13 45 8.8 Spring 42 35 77 15.1 Grand Total 149 360 509 100 (Source: MoWR Data base)

Prepared by Fitsum Merid, National Consultant
National Water Quality Monitoring Baseline Report in the Nile River Basin, Ethiopia
45
6 WATER QUALITY OVERVIEW OF BARO-AKOBO (SOBAT) RIVER BASIN
A total of 64 surface and ground water physico-chemical and 25 bacteriological quality data, generated from 1972 to 2001, are mined from the MoWR database. Statistically summarized 22 sites' chemical analysis results of repeated sampling are obtained from Baro-Akobo Master Plan study Report by TAMS-ULG, 1996.
6.1 SURFACE WATER QUALITY
Water quality data of rivers and lake within the basin generated from 1986 to 1988 obtained from the Baro-Akobo Basin study Report. Twelve surface water sites sampled for 84 observations and 9 groundwater sites for 109 observations data are statistically recorded. Moreover 28 results generated from 1972 to 2000 are obtained from MoWR database. The results are interpreted and evaluated within the context of guidelines and standards pertaining to Ethiopia.
6.1.1 Turbidity & Color
Turbidity in water is caused by the presence of suspended matter, with soil particles constituting the major part in most natural water. The color of drinking water may be due to the presence of colored organic matter, metals such as iron and manganese, or highly colored wastes of industrial origin. Similar to many other rivers of Ethiopia maximum concentration of 342 TCU and 65 FTU are detected at rivers Dabena in Bedele. This high concentration value of the raw water quality is due to high suspended solids and presence of dissolved iron (1.05mg/l) and manganese (0.5mg/l) concentrations.
6.1.2 Iron and Manganese
Iron, the essential element required for the formation of hemoglobin and other proteins and enzymes in the body is released naturally into the aquatic environment from weathering and leaching of sulfide ores and igneous, sedimentary and metamorphic rocks. The presence of high iron (1.05mg/l) & manganese (0.5mg/l) concentrations in drinking water poses predominantly aesthetic problems. Five samples for iron and 2 samples for manganese exceed the Guideline Value for Drinking Water Quality.
6.1.3 pH and SAR
The pH value between 6 and 8 is acceptable for aquatic species and almost for drinking water supply purposes. The low salinity and SAR (less than 10) value indicates the suitability of the water for irrigation purposes.
6.1.4 TDS and EC
Based on the hardness, TDS & EC measured values the sampled water can be characterized as very soft, less saline and low mineral water, suitable for domestic purposes and aquatic species.
Prepared by Fitsum Merid, National Consultant
National Water Quality Monitoring Baseline Report in the Nile River Basin, Ethiopia
46
6.1.5 Nitrate and Nitrite
Municipal and industrial discharges, decomposition of sewage wastes, leachate from waste disposal dumps, sanitary landfills and soil leaching in areas where inorganic nitrate fertilizers are used contribute nitrates to rivers and lakes. Therefore low Nitrate (10mg/l) and nitrite (0.4mg/l) shows that the surface water is free from above mentioned recent pollutions.
6.2 GROUND WATER QUALITY
A total of 43 physico-chemical water quality data of bore-holes, springs, shallow-wells and hand-dug-wells generated from 1986 to 1988 and 1972 to 2000 are obtained from Baro-Akobo Basin study Report (1996) and from MoWR database respectively. The results are analyzed and interpreted as follows.
6.2.1 Turbidity and Color
Turbidity in water is caused by the presence of suspended matter, with soil particles constituting the major part in most natural water. The color of drinking water may be due to the presence of colored organic matter, metals such as iron and manganese, or highly colored wastes of industrial origin. The collected data shows that out of 43 samples 26% and 29% of them exceed the turbidity and color values set by Ethiopian drinking water quality Guideline values for drinking water quality. Maximum values of 199 TCU and 990 FTU at Iyra, Mirab Wellega shallow-well is detected. This high reading can be associated with the presence of high concentration of iron (32mg/l) and manganese (12mg/l) in dissolved form. The little bit acidic (pH value 6.7) shows that Iron and Manganese are found in dissolved form.
6.2.2 Pesticides and Metals
Data for metals such as copper, zinc, aluminum, barium, lead, chromium, mercury and cadmium as well as pesticides are not available to provide overview on the surface water quality of Baro-Akobo Basin.
6.2.3 Iron and Manganese
Extremely high concentration of iron (60 mg/l) and manganese (14.8 mg/l) measurements are found in Alwero inerfleuve borehole, near Abobo, Gabella Region. In consistence with this finding the data obtained from MoWR shows maximum iron (32 mg/l) and manganese (12 mg/l) concentration in Baro-Akobo Basins. Iron, the essential element required for the formation of hemoglobin and other proteins and enzymes in the body is released naturally into the aquatic environment from weathering and leaching of sulfide ores and igneous, sedimentary and metamorphic rocks. The presence of high iron & manganese concentrations in drinking water poses predominantly aesthetic problems. The result shows that 38 % of the samples exceed drinking water quality guideline for iron and manganese.
6.2.4 pH and SAR
Out of the collected data 21 % of the samples are either acidic (>6.5) or alkaline (>8.5) and exceeds the Guideline value for Drinking water quality. The salinity and low SAR (less than 10) value shows that the water is suitable for irrigation.
Prepared by Fitsum Merid, National Consultant
National Water Quality Monitoring Baseline Report in the Nile River Basin, Ethiopia
47
6.2.5 Hardness, TDS & EC
Only 2 samples for hardness (1560 and 526 g/l as CaCO3) and one sample for TDS (3293 mg/l) at Gambella springs and hand-dug-well exceeded the Guideline value for drinking water quality. Generally the tested schemes have 78 mg/l CaCo3 median hardness value can be characterized as soft water and medium mineral water, suitable for domestic purposes.
6.2.6 Nitrate and Nitrite
Out of the 34 samples tested 12 % and 6% of the samples are not in compliance with the above stated guideline value for drinking water quality for nitrate (50mg/l) and nitrite (6mg/l) values respectively. Municipal and industrial discharges, decomposition of sewage wastes, leachate from waste disposal, dumps and sanitary landfills and soil leaching in areas where inorganic nitrate fertilizers are used contribute nitrates to rivers and lakes. This very high nitrate (212 mg/l) and nitrite (6.7mg/l) concentrations are observed at Shishinda shallow-well, Kefich-shekicho Woreda, SNNP Region, most probably associated with pollution with domestic waste.

Prepared by Fitsum Merid, National Consultant
National Water Quality Monitoring Baseline Report in the Nile River Basin, Ethiopia
48
7 POTENTIAL SOURCES OF POLLUTION
The important point and non-point sources of water pollution in the Nile Ethiopian Basin are basically natural and the effect of anthropogenic is very minimal. Industrial waste, domestic waste, agricultural runoff, erosion and mining activities are among the internationally accepted possible sources of pollution that threatens the water resources. In the previous chapters the detail causes of pollution are discussed and this part of the report presents information status of possible sources and fates of pollutants.
7.1 INDUSTRIAL WASTE
It is known that industrial activities in the Basin is currently limited to the Regional capita towns such as, BahirDar and Zonal center towns like Gonder, Debremarkos, Debrebrhan, Ambo and Neket. The attempt made to establish the industrial waste load was unsuccessful due to luck of information such as number and type of industries and their production capacity. The study lucks wastewater quality data to appreciate the effect of industries within the Basin.
7.2 DOMESTIC WASTE
The effort made to get domestic solid waste and effluent data and to determine the degree of pollution of water bodies was not successful. Hence, knowledge about domestic waste management is identified as gap to be explored in the future.
7.3 AGRICULTURAL RUNOFF
Meta water quality data for pesticide was not available during this study. The newly established Federal EPA water & soil laboratory has owned High Performance Liquid Chromatographic equipment, for pesticide analysis, but not yet installed and consumables are not yet readily available.
Ethiopia has been one of the lowest fertilizers utilizing country among ASARECA member states in the region until the mid 1970s (FAO data for the period from 1991 to 2000, cited by Tsedeke, 2004). Ethiopia’s per capita fertilizer consumption for the above period (12.4 kg/ha/yr) was less than that for Kenya (27.4 kg/ha/yr).
Absence of water quality data for fertilizer and pesticides hinders this study from exploring their influence on the surface and ground waters of the Basin. Therefore, it is important to establish baseline monitoring of such parameters.
7.4 EROSION
One of the major water quality issue identified in all the three Basins is suspended solid load in surface waters as a result of erosion. The high sediment load in the rivers is a combination
Prepared by Fitsum Merid, National Consultant
National Water Quality Monitoring Baseline Report in the Nile River Basin, Ethiopia
49
result of high topographic slope, strong rain-fall pattern and deforestation as a result of population pressure. Baro-Akobo River has average elevation difference of 2300m between the origin of the River at the highland and fall to the Gambella plane (TAMS-ULG, 1996). Within Ethiopia the Abbay River has an average slope of 1.4m/km. It is swift and turbid (BCEOM, 1998). The Tekeze River slope is quite steep, greater than 1.5%, in the mountainous stretch (NEDECO, 1998). Angereb and Goang rivers have average slope of 1.3% and 1.1% respectively.
7.5 MINING AND QUARRYING
Effluents and leachates from mining operations affect surface water and groundwater, often very severely. The minerals being mined provide an indication of the metals for which analyses should be made and other chemicals compounds might also be used for the processing. During this study no information was revealed that indicate the presence of mining activities in the Basin. In general; however, it is known that mining activities within the Basins are very minimal. There were no any underground and open mining activities going on within the Basin (NEDECO, 1998). Only quarrying in the form of mining involving extraction of rocks from outcrops, is going on throughout the Basin area. This extraction is done mostly by hand and used for the construction of building and road. The contribution of these activities on the chemical quality status of the Basins water seems very insignificant. However, suspended solid on surface water could possibly arise, if the necessary protective measures are not taken into consideration.
Prepared by Fitsum Merid, National Consultant
National Water Quality Monitoring Baseline Report in the Nile River Basin, Ethiopia
50
8 PROPOSED WATER QUALITY MONITORING
As can be concluded from the preceding discussions, there is no any regular water quality monitoring program in all the three Basins. Some amount of stream flow and water quality data exists, but its collective usefulness is limited by its inconsistent nature. Hence there is a wider gap as there is no water quality monitoring program, no consistent data to evaluate the Basin status, identify pollution sources, determine trends and model the fate of pollutants. However, there are some institutional frameworks that could be expanded and developed to produce more comprehensive and coherent information. Monitoring is the process of repetitive observing, for defined purposes, of one or more elements of the environment according to pre-arranged schedules in space and time and using comparable methodologies for environmental sensing and data collection. It provides information concerning the present state and past trends in environmental behavior (UN/ECE, 2000). In order to characterize and understand the general condition of the Basins water with certainty, one requires looking into at least three to five years of Baseline data.
8.1 OBJECTIVES
The monitoring program is designed to satisfy the following objectives: • To provide a water quality overview of Ethiopian part Nile Basin through enhanced
monitoring; • To identify baseline conditions in the water-course system; • to detect any signs of deterioration in water quality; • To identify any water bodies in the water-course system that do not meet the desired
water quality standards; • To identify any contaminated areas; • To address gaps identified during this assessment study such as surface water quality
map; • To make a distinction of the real load of contaminants; • to identify trends of pollutant loads; and • To supply data required for the Nile Basin water management planning program;
8.2 PRELIMINARY SURVEYS
It is advisable to begin with a small-scale pilot project or preliminary survey when such programs are started (UNEP/WHO, 1996). This provides an opportunity: • for newly trained staff to gain hands-on experience and to confirm whether
components of the program can be implemented as planned; • to assess the sampling network and provide indications of whether more (or possibly
fewer) samples are adequate; • to test assumptions about the mixing of lakes, reservoirs and rivers at the selected
sampling sites and times. It might be appropriate, therefore, to consider variations in water quality through the width and depth of a river at selected sampling sites throughout an annual cycle in order to confirm the number of samples required to produce representative data;

Prepared by Fitsum Merid, National Consultant
National Water Quality Monitoring Baseline Report in the Nile River Basin, Ethiopia
51
• to determine whether water quality, In a lake or reservoir, should be sampled at different points or at a single point;
• to understand whether the lake or reservoir behaves as a number of separate water bodies with different water quality characteristics or not;
• to investigate variation in water quality with depth and especially during stratification. Lakes and reservoirs are generally well-mixed at overturn (i.e. when stratification breaks down) and sampling from a single depth or the preparation of a composite sample from two depths may adequately represent the overall water quality;
• to confirm whether or not the borehole casing is perforated and allowing access to more than one aquifer. If this is the case then an alternative site should be sought or measures taken to sample from a single aquifer only;
• to refine the logistical aspects of monitoring such as transport difficulties; • to evaluate the access to sampling stations and to indicate whether refinements are
necessary to the site selection. Sampling sites could also be found to be impractical for a variety of reasons; and
• to review on-site testing techniques or sample preservation, transportation methods, sample volume requirements and preservation procedure, etc.
Preliminary surveys and staff training and involvement in the planning process, may often avoid major problems and inefficiencies which might otherwise arise.
8.3 DESCRIPTION OF THE PROJECT AREA
The project area is consisting of three sub-basins namely Abbay, Tekeze and Baro-Akobo. Details of the catchments area, runoff, geography, hydrology, socio-economy, etc are provided in Section-1.4 of this report.
8.4 SAMPLING SITES
Water quality issues and their influence should be taken into account when sampling sites are selected. A sampling site is the general area of a water body from which samples are to be taken and is sometimes called a “macrolocation”. The exact place at which the sample is taken is commonly referred to as a sampling station or, sometimes, a “microlocation”. Selection of sampling sites requires consideration of the monitoring objectives and some knowledge of the geography of the water-course system, as well as of the uses of the water and of any discharges of wastes into it (Table-8.1) (UNEP/WHO, 1996). Sampling sites can be marked on a map or an aerial photograph, but a final decision on the precise location of a sampling station can be made only after a field investigation. For the combined use of quality and quantity data, the hydrological measurement and water quality sampling should be carried out, as far as possible, at the same location.

Prepared by Fitsum Merid, National Consultant
National Water Quality Monitoring Baseline Report in the Nile River Basin, Ethiopia
52
Based on the geographic and hydrological flow of the basins sites are identified and presented in Tables 8.1 to 8.3. Among the different types of sampling sites available for surface and ground water bodies Baseline station and trend stations are found applicable to these Basins within the context of objectives set. The choices for site selection are made with respect to the available catchments area in Figures-8.1 to 8.3 and are based on the monitoring objectives listed above. As per the discussion with MoWR five (5), trans-boundary important, geo-referenced sampling stations are selected and presented in Table-8.5. These are currently used hydrological stations.
Table-8. 1Links between types of monitoring site and program objectives
Type of site Location Objectives
Baseline site
Headwater lakes or undisturbed upstream river stretches
• To establish natural water quality conditions • To provide a basis for comparison with stations
having significant direct human impact (as represented by trend and global flux stations)
• To test for the influence of long-range transport of contaminants and the effects of climatic change
Trend site Major river basins, large lakes or major aquifers
• To test for long-term changes in water quality • To provide a basis for statistical identification of
the possible causes of measured conditions or identified trends
Global river flux site
Mouth of a major river • To determine fluxes of critical pollutants from river basin to ocean or regional sea
• Some trend stations on rivers also serve as global flux stations
Prepared by Fitsum Merid, National Consultant
National Water Quality Monitoring Baseline Report in the Nile River Basin, Ethiopia
53
Figure-8. 1 Proposed Sampling Sites for Abbay River Basin
Prepared by Fitsum Merid, National Consultant
National Water Quality Monitoring Baseline Report in the Nile River Basin, Ethiopia
54
Figure-8. 2 Proposed Sampling Sites for Tekeze River Basin
Prepared by Fitsum Merid, National Consultant
National Water Quality Monitoring Baseline Report in the Nile River Basin, Ethiopia
55
Figure-8. 3 Proposed Sampling Sites for Baro-Akobo River Basin

Prepared by Fitsum Merid, National Consultant
National Water Quality Monitoring Baseline Report in the Nile River Basin, Ethiopia
56
Table-8. 2 Identification of Monitoring Sites at Abbay Basin
Site No.
Type of site Site Name Criteria
1 Trend site / Baseline
Lake Tana center General Water quality of Lake
2 Trend site Lake Tana outlet Water leaving Lake 3 Trend site Beshilo River inlet to Abbay Important tributary can influence
main R. 4 Trend site Down stream of Beshilo &
Abbay R. confluence Down stream of confluence
5 Trend site Welaka River inlet to Abbay Important tributary can influence main R.
6 Trend site Jimma River inlet to Abbay Important tributary can influence main R.
7 Trend site Down stream of Jimma & Abbay R. confluence
Down stream of confluence
8 Trend site Muger River inlet to Abbay Important tributary can influence main R., down stream of cement factory
9 Trend site Down stream of Muger & Abbay R. confluence
Down stream of confluence
10 Trend site Gudder River inlet to Abbay Important tributary can influence main R.
11 Trend site / Baseline
Lake Fincha Dam center General Water quality of dam
12 Trend site Fincha River inlet to Abbay Important tributary can influence main R., down stream of sugar factory
13 Trend site Down stream of Fincha & Abbay R. confluence
Down stream of confluence
14 Trend site Birr River inlet to Abbay Important tributary can influence main R.
15 Trend site Fettam River inlet to Abbay Important tributary can influence main R.
16 Trend site Down stream of Fettam & Abbay R. confluence
Down stream of confluence
17 Trend site Durra River inlet to Abbay Important tributary can influence main R.
18 Trend site Down stream of Durra & Abbay R. confluence
Down stream of confluence
19 Trend site Angar River inlet to Abbay Important tributary can influence main R.
20 Trend site Didesa River inlet to Abbay Important tributary can influence main R.
21 Trend site Down stream of Didesa & Abbay R. confluence
Down stream of confluence (Didesa & Abat R.
22 Trend site Dabus River inlet to Abbay Important tributary can influence main R., down stream of cement factory
23 Trend site Down stream of Dabus & Abbay R. confluence
Down stream of confluence
24 Trend site Beles River inlet to Abbay Important tributary can influence main R., down stream of catchments cement factory

Prepared by Fitsum Merid, National Consultant
National Water Quality Monitoring Baseline Report in the Nile River Basin, Ethiopia
57
Site No.
Type of site Site Name Criteria
25 Trend site / Baseline
Down stream of Beles & Abbay R. confluence
International boundary with Sudan
26 Trend site / Baseline
Dindir River International boundary with Sudan
27 Trend site / Baseline
Rehad River International boundary with Sudan
28 Trend site / Baseline
Gilgel Abbay R. Principal Lake feeder tributary
29 Trend site / Baseline
Gumera R. Principal Lake feeder tributary
30 Trend site / Baseline
Ribb R. Principal Lake feeder tributary
31 Trend site / Baseline
Megech R. Principal Lake feeder tributary
32 Trend Site Bore-hole around Bahir-Dar Major aquifer 33 Trend Site Bore-hole around Gondar Major aquifer 34 Trend Site Bore-hole around Debre-
Markos Major aquifer
35 Trend Site Bore-hole around Muger Major aquifer 36 Trend Site Bore-hole around Fincha Major aquifer 37 Trend Site Bore-hole around Nekemt Major aquifer 38 Trend Site Bore-hole around Bedelet Major aquifer 39 Trend site Intake for Bahir-Dar Water
Supply Water supply for major town
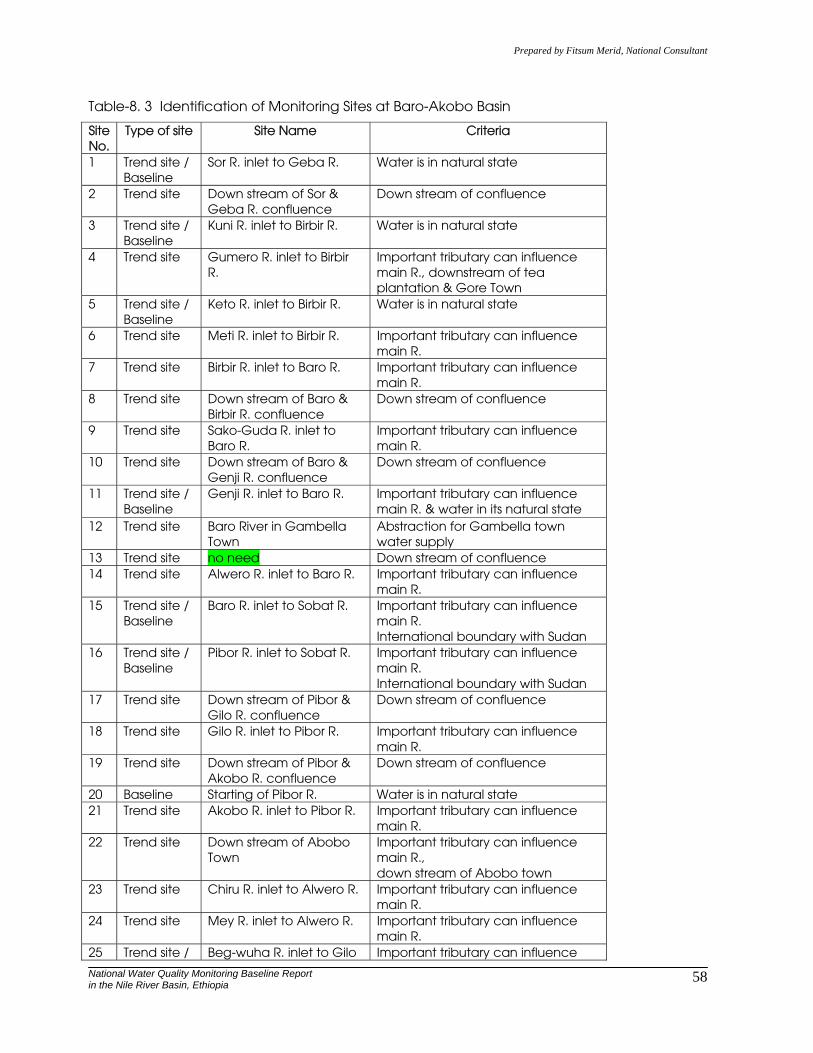
Prepared by Fitsum Merid, National Consultant
National Water Quality Monitoring Baseline Report in the Nile River Basin, Ethiopia
58
Table-8. 3 Identification of Monitoring Sites at Baro-Akobo Basin
Site No.
Type of site Site Name Criteria
1 Trend site / Baseline
Sor R. inlet to Geba R. Water is in natural state
2 Trend site Down stream of Sor & Geba R. confluence
Down stream of confluence
3 Trend site / Baseline
Kuni R. inlet to Birbir R. Water is in natural state
4 Trend site Gumero R. inlet to Birbir R.
Important tributary can influence main R., downstream of tea plantation & Gore Town
5 Trend site / Baseline
Keto R. inlet to Birbir R. Water is in natural state
6 Trend site Meti R. inlet to Birbir R. Important tributary can influence main R.
7 Trend site Birbir R. inlet to Baro R. Important tributary can influence main R.
8 Trend site Down stream of Baro & Birbir R. confluence
Down stream of confluence
9 Trend site Sako-Guda R. inlet to Baro R.
Important tributary can influence main R.
10 Trend site Down stream of Baro & Genji R. confluence
Down stream of confluence
11 Trend site / Baseline
Genji R. inlet to Baro R. Important tributary can influence main R. & water in its natural state
12 Trend site Baro River in Gambella Town
Abstraction for Gambella town water supply
13 Trend site no need Down stream of confluence 14 Trend site Alwero R. inlet to Baro R. Important tributary can influence
main R. 15 Trend site /
Baseline Baro R. inlet to Sobat R. Important tributary can influence
main R. International boundary with Sudan
16 Trend site / Baseline
Pibor R. inlet to Sobat R. Important tributary can influence main R. International boundary with Sudan
17 Trend site Down stream of Pibor & Gilo R. confluence
Down stream of confluence
18 Trend site Gilo R. inlet to Pibor R. Important tributary can influence main R.
19 Trend site Down stream of Pibor & Akobo R. confluence
Down stream of confluence
20 Baseline Starting of Pibor R. Water is in natural state 21 Trend site Akobo R. inlet to Pibor R. Important tributary can influence
main R. 22 Trend site Down stream of Abobo
Town Important tributary can influence main R., down stream of Abobo town
23 Trend site Chiru R. inlet to Alwero R. Important tributary can influence main R.
24 Trend site Mey R. inlet to Alwero R. Important tributary can influence main R.
25 Trend site / Beg-wuha R. inlet to Gilo Important tributary can influence
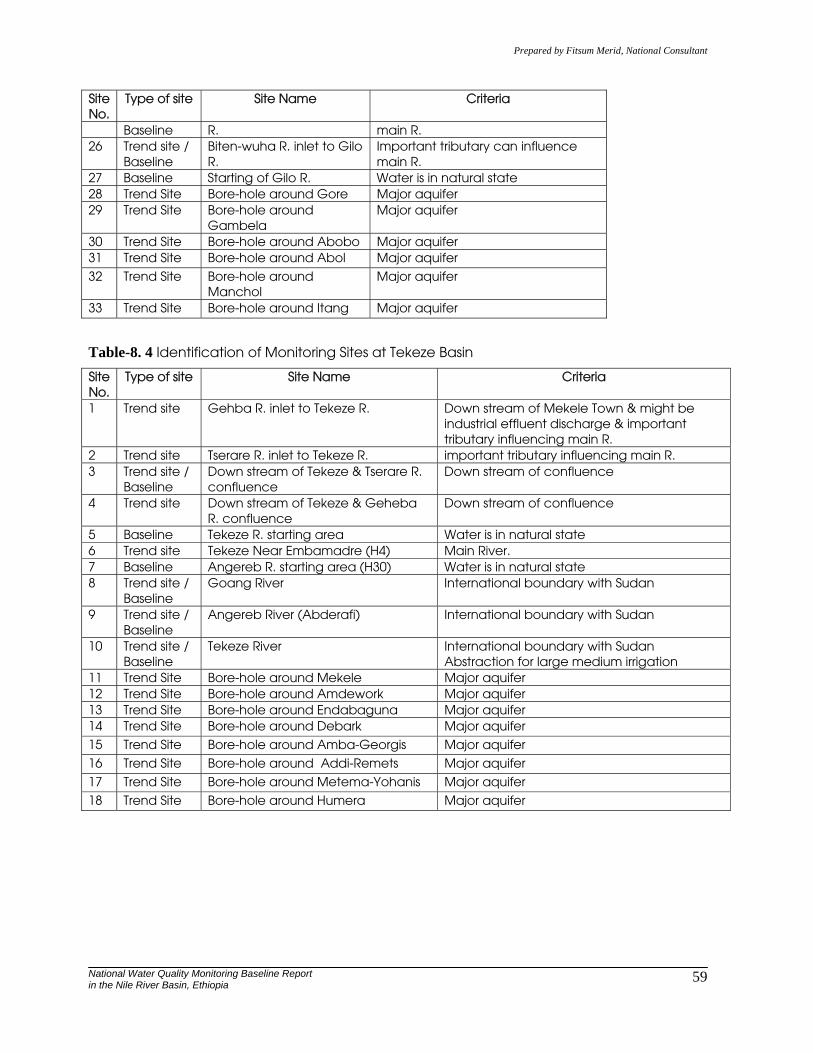
Prepared by Fitsum Merid, National Consultant
National Water Quality Monitoring Baseline Report in the Nile River Basin, Ethiopia
59
Site No.
Type of site Site Name Criteria
Baseline R. main R. 26 Trend site /
Baseline Biten-wuha R. inlet to Gilo R.
Important tributary can influence main R.
27 Baseline Starting of Gilo R. Water is in natural state 28 Trend Site Bore-hole around Gore Major aquifer 29 Trend Site Bore-hole around
Gambela Major aquifer
30 Trend Site Bore-hole around Abobo Major aquifer 31 Trend Site Bore-hole around Abol Major aquifer
32 Trend Site Bore-hole around Manchol
Major aquifer
33 Trend Site Bore-hole around Itang Major aquifer
Table-8. 4 Identification of Monitoring Sites at Tekeze Basin
Site No.
Type of site Site Name Criteria
1 Trend site Gehba R. inlet to Tekeze R. Down stream of Mekele Town & might be industrial effluent discharge & important tributary influencing main R.
2 Trend site Tserare R. inlet to Tekeze R. important tributary influencing main R. 3 Trend site /
Baseline Down stream of Tekeze & Tserare R. confluence
Down stream of confluence
4 Trend site Down stream of Tekeze & Geheba R. confluence
Down stream of confluence
5 Baseline Tekeze R. starting area Water is in natural state 6 Trend site Tekeze Near Embamadre (H4) Main River. 7 Baseline Angereb R. starting area (H30) Water is in natural state 8 Trend site /
Baseline Goang River International boundary with Sudan
9 Trend site / Baseline
Angereb River (Abderafi) International boundary with Sudan
10 Trend site / Baseline
Tekeze River International boundary with Sudan Abstraction for large medium irrigation
11 Trend Site Bore-hole around Mekele Major aquifer 12 Trend Site Bore-hole around Amdework Major aquifer 13 Trend Site Bore-hole around Endabaguna Major aquifer 14 Trend Site Bore-hole around Debark Major aquifer
15 Trend Site Bore-hole around Amba-Georgis Major aquifer
16 Trend Site Bore-hole around Addi-Remets Major aquifer
17 Trend Site Bore-hole around Metema-Yohanis Major aquifer
18 Trend Site Bore-hole around Humera Major aquifer
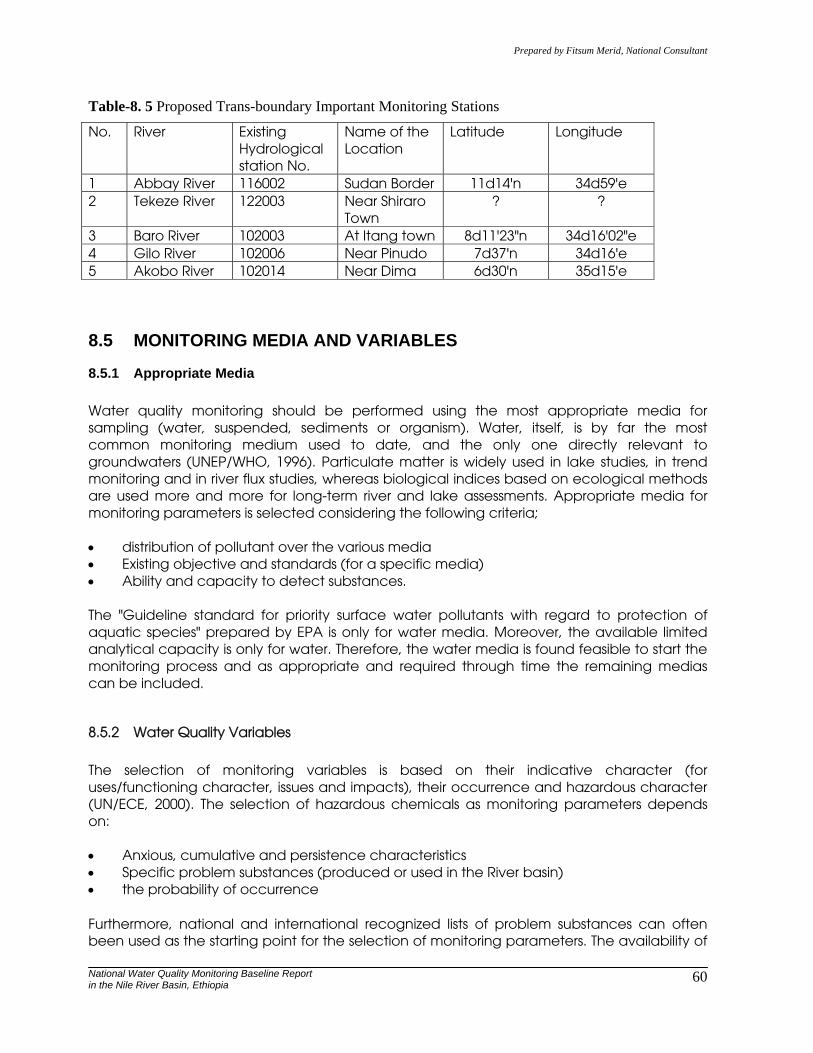
Prepared by Fitsum Merid, National Consultant
National Water Quality Monitoring Baseline Report in the Nile River Basin, Ethiopia
60
Table-8. 5 Proposed Trans-boundary Important Monitoring Stations
No. River Existing Hydrological station No.
Name of the Location
Latitude Longitude
1 Abbay River 116002 Sudan Border 11d14'n 34d59'e 2 Tekeze River 122003 Near Shiraro
Town ? ?
3 Baro River 102003 At Itang town 8d11'23"n 34d16'02"e 4 Gilo River 102006 Near Pinudo 7d37'n 34d16'e 5 Akobo River 102014 Near Dima 6d30'n 35d15'e
8.5 MONITORING MEDIA AND VARIABLES
8.5.1 Appropriate Media Water quality monitoring should be performed using the most appropriate media for sampling (water, suspended, sediments or organism). Water, itself, is by far the most common monitoring medium used to date, and the only one directly relevant to groundwaters (UNEP/WHO, 1996). Particulate matter is widely used in lake studies, in trend monitoring and in river flux studies, whereas biological indices based on ecological methods are used more and more for long-term river and lake assessments. Appropriate media for monitoring parameters is selected considering the following criteria; • distribution of pollutant over the various media • Existing objective and standards (for a specific media) • Ability and capacity to detect substances. The "Guideline standard for priority surface water pollutants with regard to protection of aquatic species" prepared by EPA is only for water media. Moreover, the available limited analytical capacity is only for water. Therefore, the water media is found feasible to start the monitoring process and as appropriate and required through time the remaining medias can be included.
8.5.2 Water Quality Variables
The selection of monitoring variables is based on their indicative character (for uses/functioning character, issues and impacts), their occurrence and hazardous character (UN/ECE, 2000). The selection of hazardous chemicals as monitoring parameters depends on: • Anxious, cumulative and persistence characteristics • Specific problem substances (produced or used in the River basin) • the probability of occurrence
Furthermore, national and international recognized lists of problem substances can often been used as the starting point for the selection of monitoring parameters. The availability of
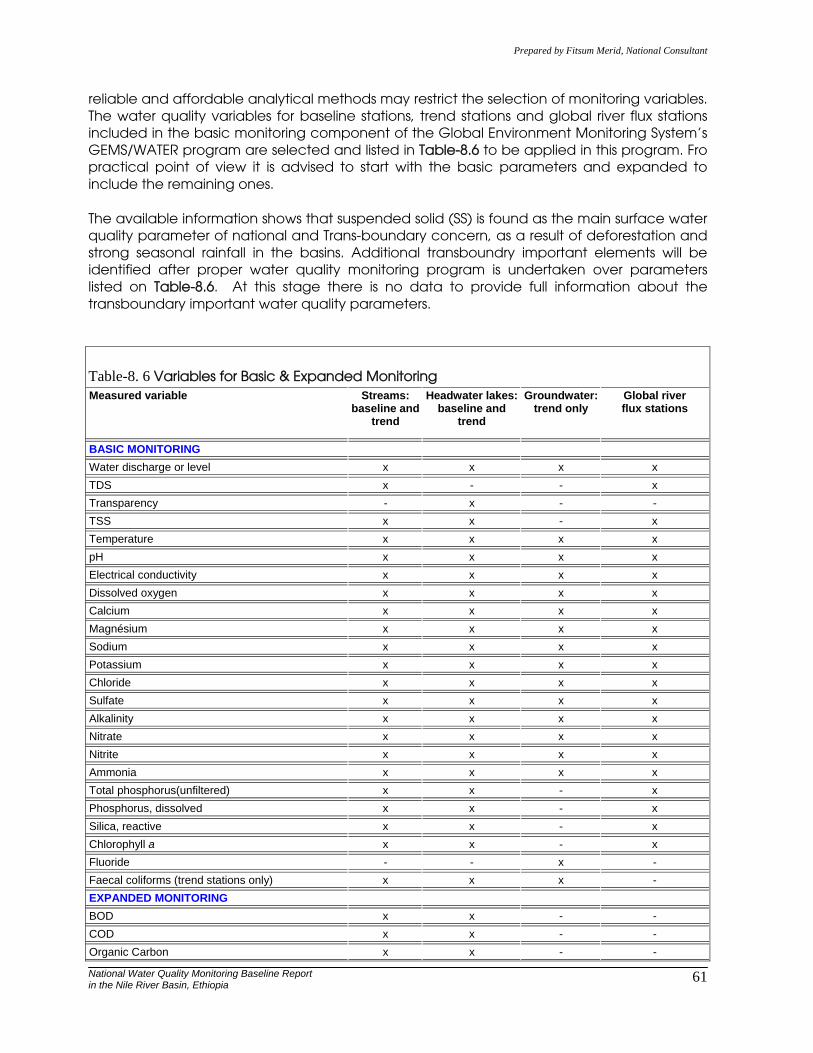
Prepared by Fitsum Merid, National Consultant
National Water Quality Monitoring Baseline Report in the Nile River Basin, Ethiopia
61
reliable and affordable analytical methods may restrict the selection of monitoring variables. The water quality variables for baseline stations, trend stations and global river flux stations included in the basic monitoring component of the Global Environment Monitoring System’s GEMS/WATER program are selected and listed in Table-8.6 to be applied in this program. Fro practical point of view it is advised to start with the basic parameters and expanded to include the remaining ones.
The available information shows that suspended solid (SS) is found as the main surface water quality parameter of national and Trans-boundary concern, as a result of deforestation and strong seasonal rainfall in the basins. Additional transboundry important elements will be identified after proper water quality monitoring program is undertaken over parameters listed on Table-8.6. At this stage there is no data to provide full information about the transboundary important water quality parameters.
Table-8. 6 Variables for Basic & Expanded Monitoring Measured variable Streams:
baseline andtrend
Headwater lakes:baseline and
trend
Groundwater: trend only
Global river flux stations
BASIC MONITORING Water discharge or level x x x x TDS x - - x Transparency - x - - TSS x x - x Temperature x x x x pH x x x x Electrical conductivity x x x x Dissolved oxygen x x x x Calcium x x x x Magnésium x x x x Sodium x x x x Potassium x x x x Chloride x x x x Sulfate x x x x Alkalinity x x x x Nitrate x x x x Nitrite x x x x Ammonia x x x x Total phosphorus(unfiltered) x x - x Phosphorus, dissolved x x - x Silica, reactive x x - x Chlorophyll a x x - x Fluoride - - x - Faecal coliforms (trend stations only) x x x - EXPANDED MONITORING BOD x x - - COD x x - - Organic Carbon x x - -

Prepared by Fitsum Merid, National Consultant
National Water Quality Monitoring Baseline Report in the Nile River Basin, Ethiopia
62
Organic Nitrogen x x - - Aluminum x x x x Iron x x x x Manganese x x x x CONTAMINANT DETECTION Arsenic x x x x Cadmium x x x x Chromium x x x x Copper x x x x Lead x x x x Mercury, total x x x x Nickel x x x x Selenium x x x x Zinc x x x x AGROCHEMICALS Dieldrin x x x x Aldrin x x x x Sum of DDTs x x x x Atrazine x x x x HCH (lindane) x x x x Aldicard x x x x Organophosphurus pesticides x x x - 2,4D x x x - IRRIGATION SAR x x x x Boron x x x x Selenium x x x x Source: WHO, 1991, cited by UNEP/WHO, 1996
8.6 FREQUENCY AND SAMPLING
The sampling frequency is directly related to the variability of water quality of a certain stations. Sampling frequency at stations where water quality varies considerably should be higher than at stations where quality remains relatively constant. A new programme, however, with no advance information on quality variation, should be preceded by a preliminary survey (above mentioned) and then begin with a fixed sampling schedule that can be revised when the need becomes apparent. Sampling frequencies for baseline and trend stations should meet the minimum requirement for GEMS/WATER stations presented in Table 8.7.
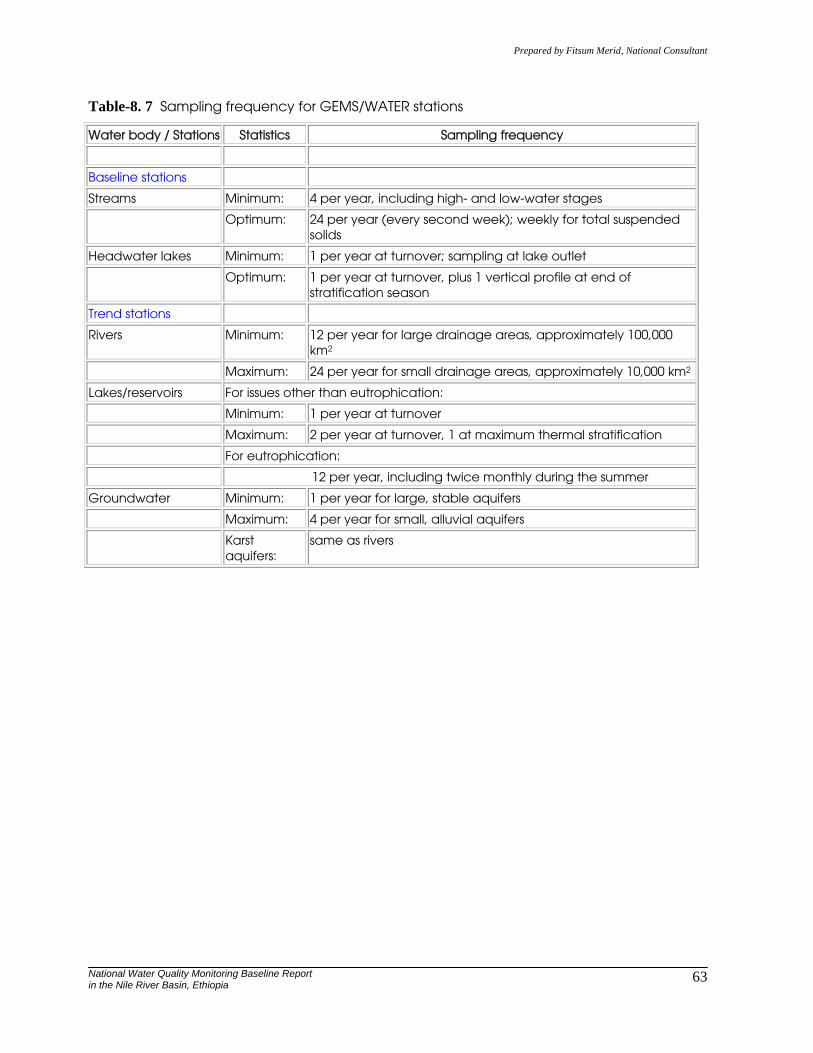
Prepared by Fitsum Merid, National Consultant
National Water Quality Monitoring Baseline Report in the Nile River Basin, Ethiopia
63
Table-8. 7 Sampling frequency for GEMS/WATER stations
Water body / Stations Statistics Sampling frequency
Baseline stations
Streams Minimum: 4 per year, including high- and low-water stages
Optimum: 24 per year (every second week); weekly for total suspended solids
Headwater lakes Minimum: 1 per year at turnover; sampling at lake outlet
Optimum: 1 per year at turnover, plus 1 vertical profile at end of stratification season
Trend stations
Rivers Minimum: 12 per year for large drainage areas, approximately 100,000 km2
Maximum: 24 per year for small drainage areas, approximately 10,000 km2
Lakes/reservoirs For issues other than eutrophication:
Minimum: 1 per year at turnover
Maximum: 2 per year at turnover, 1 at maximum thermal stratification
For eutrophication:
12 per year, including twice monthly during the summer
Groundwater Minimum: 1 per year for large, stable aquifers
Maximum: 4 per year for small, alluvial aquifers
Karst aquifers:
same as rivers
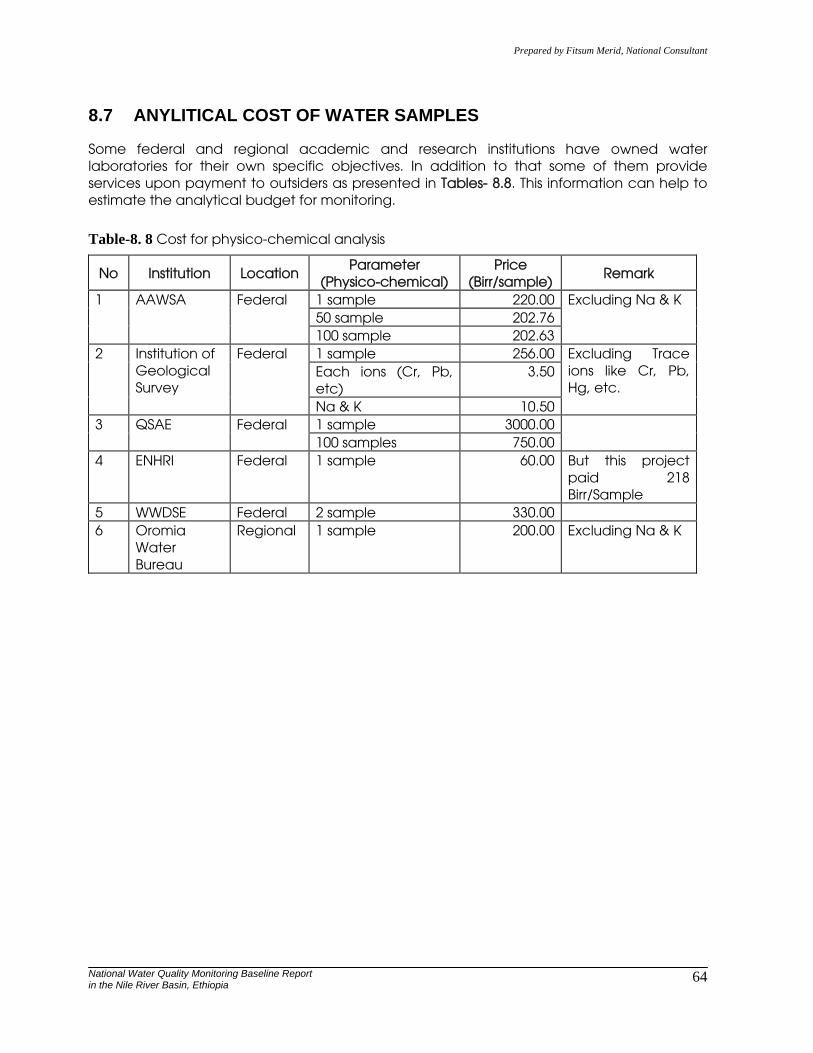
Prepared by Fitsum Merid, National Consultant
National Water Quality Monitoring Baseline Report in the Nile River Basin, Ethiopia
64
8.7 ANYLITICAL COST OF WATER SAMPLES
Some federal and regional academic and research institutions have owned water laboratories for their own specific objectives. In addition to that some of them provide services upon payment to outsiders as presented in Tables- 8.8. This information can help to estimate the analytical budget for monitoring.
Table-8. 8 Cost for physico-chemical analysis
No Institution Location Parameter
(Physico-chemical) Price
(Birr/sample) Remark
1 sample 220.00 50 sample 202.76
1 AAWSA Federal
100 sample 202.63
Excluding Na & K
1 sample 256.00 Each ions (Cr, Pb, etc)
3.50 2 Institution of
Geological Survey
Federal
Na & K 10.50
Excluding Trace ions like Cr, Pb, Hg, etc.
1 sample 3000.00 3 QSAE Federal 100 samples 750.00
4 ENHRI Federal 1 sample 60.00 But this project paid 218 Birr/Sample
5 WWDSE Federal 2 sample 330.00 6 Oromia
Water Bureau
Regional 1 sample 200.00 Excluding Na & K

Prepared by Fitsum Merid, National Consultant
National Water Quality Monitoring Baseline Report in the Nile River Basin, Ethiopia
65
9 CONCLUSION AND RECOMMENDATION
9.1 Conclusion
As indicated in the preceding sections, so far there is no any form of regular water quality monitoring program identified in the basin. The limited intermittent effort by federal and regional Government bureaus focuses on quality control of water supply schemes. There are few water laboratories compared to the Ethiopian Guideline recommendation and those available ones are suffering from shortage of capacity in terms of manpower, lab rooms, equipment, consumables, budget and transport. The MoWR water quality sections do not own laboratory to support the regional efforts. There is, however, a water & soil laboratory owned by WWSDE under the MoWR, which provides service upon commercial basis. The awareness and participation of communities, CBOs and NGO regarding water quality monitoring is almost none existent. Some amount of stream flow and water quality data exists for the three Basins, but its collective usefulness is limited by its inconsistent nature. The collected water quality data are not representing the spatial and temporal condition of the basin adequately. In general there is no dependable data to evaluate the Basin status effectively, identify pollution sources, determine trends and model the fate of pollutants. Using the available data, however, an overview of water quality has been given. High suspended solids is the prime surface water issue identified in the basins as a result of soil erosion. The high sediment load in the rivers is a combination result of high topographic slope, high intensity short duration type of rainfall and deforestation as a result of population pressure. In general for the available data the water quality situation of the basin seems acceptable and the anthropogenic effect on water quality of the Basin is meniscus.
9.2 Recommendations
In the Nile Basin there is a need to conduct regular water quality monitoring program to characterize the water quality, understand the general condition of the water, and determine if degraded water quality exists. Absence of a central or MoWR water laboratory can be mentioned as a core issue contributing for lack of regular water quality monitoring in the country. The Ethiopian Water Quality Guideline (2002) recommend central lab to be established as the highest-level facilities employed for reference purposes. Such a lab must be well staffed and equipped. It should possess some sophisticated equipments like AAS and gas chromatography that cannot be decentralized because of high capital cost. At this level it is expected to conduct applied research on the national WQ problems, training of staff at all levels and quality assurance activities. The central labs should have the capacity to test biological, inorganic, organic, organoleptic and radioactivity tests. The existing regional institutional frameworks should be expanded and capacitated to produce a more comprehensive and coherent information. In order to adequately address the proposed water quality monitoring program, the establishment of new zonal and basic laboratories is vital at zones and major towns, where they do not exist. Capacity of new and
Prepared by Fitsum Merid, National Consultant
National Water Quality Monitoring Baseline Report in the Nile River Basin, Ethiopia
66
existing labs should also be upgraded through the continuous training, staffing, equipping and allocation of adequate budgeting. The MoWR, as a federal entity, will be dealing with the sampling and analysis of proposed tarns-boundary important sampling stations. While, the national important sampling sites will be treated with the respective regional bureaus. Since the over all project has trans-boundary and multi-regional nature, the monitoring program should be lead by MoWR. Hence the Ministry should be responsible for the organization of the project in terms of standardized sampling and testing methods carried out by different regions as well as data collection, compilation, analysis and report writing at national level. At national level institutional arrangements should be made to undertake the cooperation between local governments, the coordination of quality and quantity monitoring by various organizations and the appointment of national reference laboratory. The EPA should be actively involved in the basin to implement the ambient water quality standard and standard for industrial pollution control. Proper solid and wastewater management practice should be exercised through community, NGO, CBO participation.
Information and education are important tools to create awareness on water quality and its relation to negative environmental impacts. Such awareness could lead to improved behavioral change in preventing the contamination of surface and groundwater of the Basin. The information and education program should create an appreciation not only people's right to safe water but also their responsibility to use and maintain it wisely and well.
Reporting is the final step in data management program and links the gathering of information with the information users (UN/ECE, 1996). Reports should be regularly prepared and disseminated to information users. The frequency and level of detail depends on the use of information. Frequently and more detail information is important for technical staff than policy makers. The report to decision makers should be interpreted information with relevant recommendation for management action.

Prepared by Fitsum Merid, National Consultant
National Water Quality Monitoring Baseline Report in the Nile River Basin, Ethiopia
67
REFERENCES AND USEFUL LITERATURES
Works cited and best international water monitoring experiences referred are listed as follows.
1. MoWR, 1999, Ethiopian Water Resources Management Policy, Addis Ababa. 2. MoWR, 2002. Ethiopian Water Resources Strategy, Addis Ababa. 3. BCEOM et al, April 1999. Abbay River Basin Integrated Development Master Plan
Project, Executive Summery, Addis Ababa. 4. BCEOM et al, October 1998. Abbay River Basin Integrated Development Master Plan
Project, Environment, Part-3 Limnology, Vol-XIII, Addis Ababa. 5. TAMS-ULG, 1996. Baro-Akobo River Basin Integrated Development Master Plan Project,
Executive Summery, Prepared by TAMS Consultants, Addis Ababa. 6. TAMS-ULG, 1996, May 1997. Baro-Akobo River Basin Integrated Development Master
Plan Project, ANNEX-4-Environment, Vol-XIX-ENV-3, Prepared by TAMS Consultants, Addis Ababa.
7. SELKHOZPROMEXPPORT, 1990. Baro-Akobo River Basin Master Study of water and land Resources of The Gambella Plane, Final Report Draft Vol-1, Summery, Addis Ababa.
8. NEDECO, February 1998. Tekeze River Basin Integrated Development Master Plan Project, Executive Summery, Addis Ababa.
9. NEDECO, February 1998. Tekeze River Basin Integrated Development Master Plan Project, Assessment of Ground Water Quality Vol-IX WR3B, Addis Ababa.
10. USBR, 1964, Land and Water Study of the Blue Nile, Addis Ababa. 11. Continental Consultants, 2002. Ethiopian Guidelines for Drinking Water Quality,
Recommendation, Addis Ababa. 12. Continental Consultants, 2002. Ethiopian Guidelines for Drinking Water Quality, Water
Quality Monitoring & Surveillance, Addis Ababa. 13. Tsedeke Abate, 2004. Ethiopia Pest Management and Pesticide Evaluation Report,
Addis Ababa. 14. WHO, 1982. Rapid Assessment of Air, Water and Land pollution. Geneva, Switzerland. 13. UNEP/WHO, 1996. Water Quality Monitoring - A Practical Guide to the Design and
Implementation of Freshwater Quality Studies and Monitoring Programs. 14. EPA, August 2003. Ambient Water Quality Standard for Ethiopia, Addis Ababa 15. EPA, September 2003. Standard for Industrial Pollution Control in Ethiopia, Addis Ababa. 16. MOH, 2004. Health Indicators, Addis Ababa. 17. MOH, September, 1993. Health Policy of the Transitional Government of Ethiopia, Addis
Ababa 18. EPA, April 1997. Federal Democratic Republic of Ethiopia, Environmental Policy, Addis
Ababa. 19. UN/ECE, March 2000. Guidelines on Monitoring and Assessment of Transboundary Rivers. 20. UN/ECE, May 1996. Guidelines on Water Quality Monitoring and Assessment of Trans-
boundary Rivers, The Netherlands. 21. Saco River Basin Water Quality Monitoring program. 22. Water Quality in the San Joaquin Basin 23. Delaware River Basin Commission, 2002. Delaware River Basin Water Quality Assessment
Report. 24. USGS & USEPA, 1998. Concepts for Monitoring Water Quality in the Spokane River Basin,
Northern Idaho and Eastern Washington, Boise, Idaho.
Prepared by Fitsum Merid, National Consultant
National Water Quality Monitoring Baseline Report in the Nile River Basin, Ethiopia
68
25. Clark L. et al, 2004. U.S. Geological Survey Monitoring of Powder River Basin Stream-water Quantity and Quality.
26. University of Minnesota, 2002. Minnesota RIVER BASIN Water Quality Over View, Minnesota.
27. Chehalis River Basin Water Problem Description 28. ________August 2003. Charlotte Harbor Estuary Status and Trends. 29. USGS, 1994. Water Quality Assessment in the Trinity River basin, Texas-Pesticide
Occurrence in Streams, winter and spring 1994. 30. Red River Authority of Texas & Texas Natural Resource Conservation Commission, Oct
1996. Regional Assessment of Water Quality, Canadian River basin of Texas, Executive Summery, Third Biennial Report.
31. NCDENR, March 2000. Basin wide Assessment Report, Savannah River. Division of Water Quality Section Environmental Science Branch.
32. Department of Environmental protection, 2002. Pennsylvania Water Quality Assessment 305(b) Report.

Prepared by Fitsum Merid, National Consultant
National Water Quality Monitoring Baseline Report in the Nile River Basin, Ethiopia
69
ANNEXES
ANNEXES
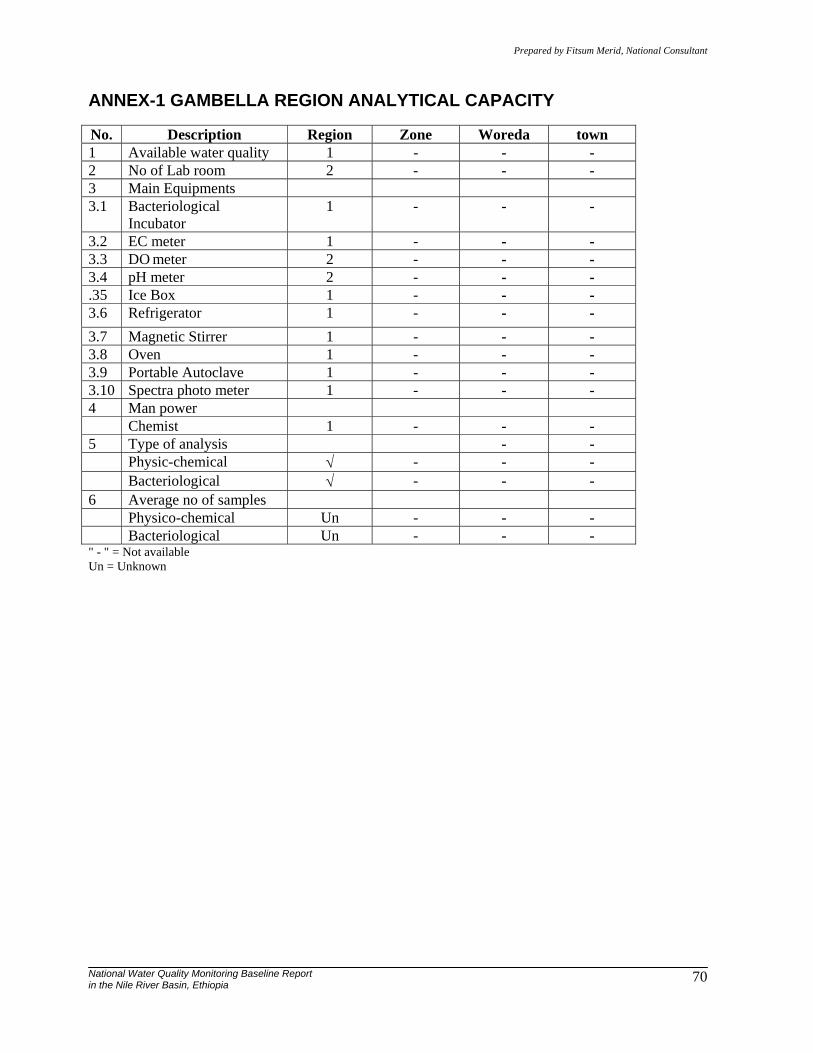
Prepared by Fitsum Merid, National Consultant
National Water Quality Monitoring Baseline Report in the Nile River Basin, Ethiopia
70
ANNEX-1 GAMBELLA REGION ANALYTICAL CAPACITY
No. Description Region Zone Woreda town 1 Available water quality 1 - - - 2 No of Lab room 2 - - - 3 Main Equipments 3.1 Bacteriological
Incubator 1 - - -
3.2 EC meter 1 - - - 3.3 DO meter 2 - - - 3.4 pH meter 2 - - - .35 Ice Box 1 - - - 3.6 Refrigerator 1 - - - 3.7 Magnetic Stirrer 1 - - - 3.8 Oven 1 - - - 3.9 Portable Autoclave 1 - - - 3.10 Spectra photo meter 1 - - - 4 Man power Chemist 1 - - - 5 Type of analysis - - Physic-chemical √ - - - Bacteriological √ - - - 6 Average no of samples Physico-chemical Un - - - Bacteriological Un - - - " - " = Not available Un = Unknown

Prepared by Fitsum Merid, National Consultant
National Water Quality Monitoring Baseline Report in the Nile River Basin, Ethiopia
71
ANNEX-2 TIGRAY REGION ANALYTICAL CAPACITY
No. Description Region Zone Woreda Town 1 Available water quality lab 1 - - - 2 No of lab rooms 2 - - - 3 Main Equipments 3.1 pH meter √ - - - 3.2 EC meter √ - - - 3.3 DO meter - - - - 3.4 Spectrometer √ - - - .35 Bacteriological incubator √ - - - 3.6 Balance √ - - - 3.7 Oven - - - - 3.8 mobile lab - - - - 3.9 Autoclave √ - - - 3.10 Titration apparatus √ - - - 4 Man power 1 chemist (degree) 1 - - - chemist (diploma) 1 - - - Biologist - - - - Lab tech (12 complete) 1 - - - Others 5 Type of analysis Physical √ - - - Chemical √ - - - Bacteriological √ - - - Biological - - - - Others - - - - 6 Avg. no of samples Year Physico-chemical Un - - - Bacteriological Un - - - " - " = Not available Un = Unknown √ = Present

Prepared by Fitsum Merid, National Consultant
National Water Quality Monitoring Baseline Report in the Nile River Basin, Ethiopia
72
ANNEX-3 BENSHANGUL-GUMUZ REGION ANALYTICAL CAPACITY
No. Description Region Zone Woreda Town 1 Available water quality lab 1 - - - 2 No of Room 2 - - - 3 Main Equipments 3.1 Spectrophotometer meter 1 - - - 3.2 pH meter 1 - - - 3.3 EC meter 1 - - - 3.4 DO meter 1 - - - .35 Autoclave 1 - - - 3.6 Refrigerator 1 - - - 3.7 Bacteriological Incubator 1 - - - 3.8 Ice box 1 - - - 3.9 oven 1 - - - 4 Man power Lab technician 1 - - - 5 type of analysis Physico-chemical √ - - - Bacteriological √ - - - 6 Average no of samples analyzed/year Physico-chemical Un - - - Bacteriological Un - - - " - " = Not available Un = Unknown √ = Present
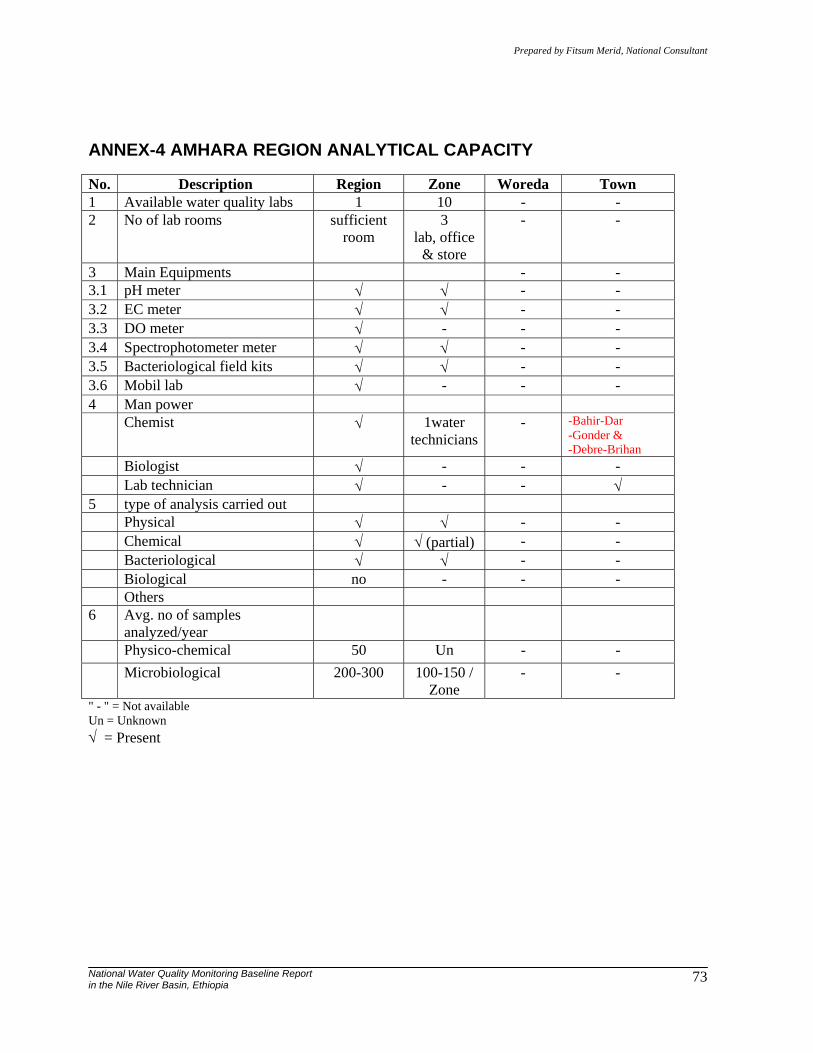
Prepared by Fitsum Merid, National Consultant
National Water Quality Monitoring Baseline Report in the Nile River Basin, Ethiopia
73
ANNEX-4 AMHARA REGION ANALYTICAL CAPACITY
No. Description Region Zone Woreda Town 1 Available water quality labs 1 10 - - 2 No of lab rooms sufficient
room 3
lab, office & store
- -
3 Main Equipments - - 3.1 pH meter √ √ - - 3.2 EC meter √ √ - - 3.3 DO meter √ - - - 3.4 Spectrophotometer meter √ √ - - 3.5 Bacteriological field kits √ √ - - 3.6 Mobil lab √ - - - 4 Man power Chemist √ 1water
technicians- -Bahir-Dar
-Gonder & -Debre-Brihan
Biologist √ - - - Lab technician √ - - √ 5 type of analysis carried out Physical √ √ - - Chemical √ √ (partial) - - Bacteriological √ √ - - Biological no - - - Others 6 Avg. no of samples
analyzed/year
Physico-chemical 50 Un - - Microbiological 200-300 100-150 /
Zone - -
" - " = Not available Un = Unknown √ = Present
Prepared by Fitsum Merid, National Consultant
National Water Quality Monitoring Baseline Report in the Nile River Basin, Ethiopia
74
ANNEX-5 QUESTIONNAIRE
Related Documents