NASA SNPP Cross Track Infrared Sounder (CrIS) Level 1B Full Spectral Resolution Sample Data Users’ Guide University of Wisconsin-Madison Space Science and Engineering Center University of Maryland Baltimore County Atmospheric Spectroscopy Laboratory Version 1.0 Note: this document describes a sample Full Spectral Resolution CrIS L1B data product which is provided for purposes of evaluation and development of software. This dataset should be considered preliminary, and will be replaced by the future Version 2.0 release. June 2017 This research was conducted with funding provided by the National Aeronautics and Space Administration.

Welcome message from author
This document is posted to help you gain knowledge. Please leave a comment to let me know what you think about it! Share it to your friends and learn new things together.
Transcript
NASASNPPCrossTrack InfraredSounder(CrIS) Level 1B Full Spectral ResolutionSampleDataUsers’GuideUniversityofWisconsin-MadisonSpaceScienceandEngineeringCenter
UniversityofMarylandBaltimoreCountyAtmosphericSpectroscopyLaboratory
Version1.0
Note:thisdocumentdescribesasampleFullSpectralResolutionCrISL1B data productwhich is provided for purposes of evaluation anddevelopment of software. This dataset should be consideredpreliminary,andwillbereplacedbythefutureVersion2.0release.
June2017
This research was conducted with funding provided by the National Aeronautics and SpaceAdministration.

NASASNPPCrossTrackInfraredSounderLevel1BSampleDataUsers’Guide
2
CrISL1BScienceandSoftwareTeam
HankRevercomb–PI UW-Madison
LarrabeeStrow–PI UMBC
JessicaBraun UW-Madison
RayGarcia UW-Madison
LiamGumley UW-Madison
RobertKnuteson UW-Madison
EliKrenzke UW-Madison
GraemeMartin UW-Madison
HowardMotteler UMBC
CodaPhillips UW-Madison
GregQuinn UW-Madison
JoeTaylor UW-Madison
DaveTobin UW-Madison

NASASNPPCrossTrackInfraredSounderLevel1BSampleDataUsers’Guide
3
Revisions:
Version1.0 14June2017 ReleasedescribingVersion1.0FSR-onlysampledata

NASASNPPCrossTrackInfraredSounderLevel1BSampleDataUsers’Guide
4
TableofContents
CrISL1BScienceandSoftwareTeam...................................................................................................................2
1 Introduction..................................................................................................................................................................7
1.1 Overview................................................................................................................................................................7
1.2 Software.................................................................................................................................................................8
1.3 Productgeneration...........................................................................................................................................8
1.4 InstrumentDescription...................................................................................................................................8
1.5 ContactInformation.........................................................................................................................................9
1.6 DataDisclaimer...................................................................................................................................................9
1.7 ObtainingtheProduct......................................................................................................................................9
2 CrISL1BProduct.....................................................................................................................................................10
2.1 AlgorithmBackground.................................................................................................................................10
2.2 Granulation........................................................................................................................................................10
2.3 ProductFiles.....................................................................................................................................................11
2.4 NSRvsFSR.........................................................................................................................................................11
3 FileFormatandConventions.............................................................................................................................13
3.1 NetCDF4..............................................................................................................................................................13
3.2 MetadataConventions..................................................................................................................................13
3.3 MissingData......................................................................................................................................................14
3.4 FileNaming........................................................................................................................................................14
3.5 TimeRepresentation.....................................................................................................................................15
4 DataContents............................................................................................................................................................17
4.1 Dimensions........................................................................................................................................................17
4.2 GlobalAttributes.............................................................................................................................................17
4.3 VariableAttributes.........................................................................................................................................21
4.4 Variables.............................................................................................................................................................22
4.5 ScienceVariables............................................................................................................................................22
4.6 AuxiliaryVariables.........................................................................................................................................24

NASASNPPCrossTrackInfraredSounderLevel1BSampleDataUsers’Guide
5
4.7 GeolocationVariables...................................................................................................................................24
4.8 QualityFlags......................................................................................................................................................26
4.9 GranuleandObservationIDs.....................................................................................................................27
5 CaveatsandKnownIssues..................................................................................................................................29
6 References..................................................................................................................................................................30
AppendixA:ExampleDataIngestCode.................................................................................................................31
AppendixB:CDLfile.......................................................................................................................................................32
AppendixC:QualityFlagMeanings.........................................................................................................................42

NASASNPPCrossTrackInfraredSounderLevel1BSampleDataUsers’Guide
6
ListofFiguresFigure2.1-1CrISL1BSoftwareModulesandDataFlow...............................................................................10
ListofTablesTable3.4-1CrISL1BFilenameFields.....................................................................................................................14
Table4.2-1CrISL1BDynamicGlobalAttributes..............................................................................................18
Table4.3-1CrISL1BVariableAttributes..............................................................................................................21
Table4.5-1CrISL1BScienceVariables.................................................................................................................23
Table4.7-1CrISL1BGeolocationVariables........................................................................................................25
Table4.8-1CrISL1BQualityVariables..................................................................................................................27
TableC-1CrISL1B"geo_qual"Variables………………..……………………………………………………………...42
TableC-2CrISL1B"l1b_qual"Variables…………..……………………………………………………………………42
NASASNPPCrossTrackInfraredSounderLevel1BSampleDataUsers’Guide
7
1 Introduction
1.1 Overview
This document describes the Version 1.0 CrIS Level 1B (L1B) Full Spectral Resolution (FSR)Sample Data. This sample dataset is provided for purposes of evaluation and softwaredevelopment. It will be replaced by the future Version 2.0 CrIS L1B Product, and should beconsideredanephemeralproduct.
NotethatuserswhoareinterestedintheNormalSpectralResolution(NSR)productshouldusetheVersion1.0product,whichisNSR-only.ForinformationonthedifferencebetweenNSRandFSR,refertoSection2.4.
ThispreliminarysampleFSRproductisbeingprovidedbeforetheFSRalgorithmisfullymatureinorderto:
1. familiarizeuserswiththeCrISL1BFSRdataformat,
2. provideL1BFSRdatafortheLevel2scienceteamstoworkwithastheydeveloptheirownsoftware,
3. provideL1BFSRdataforuseinpreparingproposals,and
4. solicitfeedbackfromusersonbothdataformatandcontents.
It should be understood that the software used to generated the sample data was not fullymature or feature complete, and that the sample product has not been fully evaluated orvalidated.Knownissuesaffectingthesampleproductaredescribedin“Section5:CaveatsandKnownIssues”.
The product consists of calibrated radiance spectra and geolocation information, as well asmetadataandvariousderivedparametersrelatedtotheobservations.
Thegoal of creating theCrISL1Bproduct is toprovideahigh-quality, consistently calibrateddatasetspanningtheSuomiNPP(SNPP)mission,foruseinclimatologyandotherapplicationswherelong-termstabilityisaprimaryconsideration.
The mission start date for purposes of the FSR product is defined as November 2, 2015, at1736z.AtthattimetheSNPPsatellitebegantransmittingextradatapointsintheCrISrawdatastream,whichareusedintheLevel1BsoftwaretocalibratetheFSRproduct.
ThefileformatoftheCrISL1BproductisNetCDF4.TheClimateandForecast(CF)andAttributeConventionforDatasetDiscovery(ACDD)standardsarefollowedwhereapplicable.
NASASNPPCrossTrackInfraredSounderLevel1BSampleDataUsers’Guide
8
1.2 Software
This product was generated by Version 1.0 FSR Beta2 of the CrIS L1B software, which wasdeveloped with funding from NASA at the University of Wisconsin - Madison (UW) SpaceScience and Engineering Center and the University of Maryland - Baltimore County (UMBC)AtmosphericSpectroscopyLaboratory.
Thedata format and granulation schemeweredeveloped in collaborationwith theAdvancedTechnologyMicrowaveSounder(ATMS)L1Bteam, locatedatNASAJetPropulsionLaboratory(JPL).
1.3 Productgeneration
Theproductwasgenerated fromEOSDataandOperationsSystem(EDOS)Level0dataat theSNPPAtmosphereScienceInvestigator-ledProcessingSystem(SIPS), locatedattheUniversityofWisconsin Space Science and Engineering Center. Level 0 data consists of packetized rawtelemetryasreceivedfromthesatellite,withaddedmetadata.
1.4 InstrumentDescription
The Cross-track Infrared Sounder (CrIS) is a Fourier Transform Spectrometer (FTS) onboardtheSuomiNationalPolar-OrbitingPartnership(S-NPP)satellite,launchedonOctober28,2011intoanorbitwithanaltitudeof824kmabovetheEarthsurface,aninclinationangleof98.7deganda13:30localtimeascendingnode[NOAATechnicalReportNESDIS143].S-NPPisthefirstina seriesofnext generationU.S.weather satellitesof the JointPolarSatelliteSystem(JPSS).CrISisaflat-mirrorMichelsoninterferometerwhichmeasuresinterferogramsinthreeInfrared(IR)bandssimultaneously.
TheCrIS interferometer includes a beamsplitter, a stationary andmovingmirror, and a lasersampling system. The scene radiance entering the interferometer is split by the beamsplitterintotwobeamsalongtwoseparatepaths.Onebeamtravelstowardsthemovingmirror,whiletheothertoastationarymirror.Thetwobeamsarereflectedfromthecorrespondingmirrorsandrecombinebeforeconvergingonthedetector.Theopticalpathdifference(OPD)traveledbythe twobeams is twice thephysical pathdifferencebetween the twomirrors.As themovingmirror sweeps from one side of the zero path difference (ZPD) to the other, a time-varyinginterference pattern known as the interferogram is recorded. A convolution of theinterferogramwithaFinite ImpulseResponse(FIR)numerical filter isapplied inreal-timeonthespacecrafttoreducetheinternaldataratetomeettelemetryrequirements.Thisresultsinacomplex-valued interferogram of a fixed number of sample points which is included in thedownlinkeddatapackets.
Duringa single scene scanmirrordwellperiod, one interferogram is recorded for eachof27detectors simultaneously (3 focal planes (LW, MW, SW) each containing 9 bore-sighteddetectors in a 3x3 pattern). The CrIS uses a 45 deg scene scanmirror to provide sequentialviewsofaninternalblackbody(ICT),adeepspaceview(DS),and30Earthviewsinthecross-trackinarepeatingpatternasthespacecraftmovesalong-track.Theinterferogramsassociatedwith the ICT and DS views and a measurement of ICT temperature are used in the ground
NASASNPPCrossTrackInfraredSounderLevel1BSampleDataUsers’Guide
9
processing software to calibrate the Earth views to produce radiance spectra. Prior tocalibration, a correction is applied to account for measured signal nonlinearity of selecteddetectors.Correctionsarealsoapplied in thegroundprocessingsoftware toremoveFTSself-apodizationeffectsandtoresamplethespectratoapredefineduserspectralgrid.
1.5 ContactInformation
Inquiriesregardingthedataproductcanbedirectedtosounder.sips@jpl.nasa.gov.
Inquiries regarding the software and underlying algorithms can be directed [email protected].
1.6 DataDisclaimer
TheVersion1.0CrISFSRSampleDataisreleasedtothepublicasis.
1.7 ObtainingtheProduct
TheCrISLevel1BproductandsampledatacanbedownloadedfromtheGoddardDistributedActiveArchiveCenter(GDAAC).
https://disc.gsfc.nasa.gov/datasets/SNPPCrISL1BFSR_V1/summary

NASASNPPCrossTrackInfraredSounderLevel1BSampleDataUsers’Guide
10
2 CrISL1BProduct 2.1 AlgorithmBackground
TheCrISL1Bsoftwareconsistsofthreemainprocessingmodules:Level1A(L1A),GeolocationandL1BCalibration.Thecontrolling“glue”logiciswritteninBashandPython.
Figure2.1-1CrISL1BSoftwareModulesandDataFlow
TheL1AandGeolocationmodulesweredevelopedasmostlynewcode,writteninPython.TheL1BCalibrationmoduleiswritteninMatlabandisbasedontheCrISCalibrationAlgorithmandSensorTestbed (CCAST) softwaredeveloped at theUWandUMBC. TheCCAST softwarewasmodified for this project to be compatiblewith thenewL1AandGeoproducts. Additionally,modificationstothecalibrationalgorithmandqualityflagindicatorshavebeenincorporated.
ForinformationonthetheoreticalbasisoftheCrISL1BVersion1.0software,refertothe“NASASNPP Cross Track Infrared Sounder (CrIS) Level 1B Delta Algorithm Theoretical BasisDocument(ATBD),Version1.0”.ThatdocumentdescribesalgorithmdifferencesrelativetotheJPSSSDRATBDdocument.
2.2 Granulation
Thedataispartitionedinto6-minutegranules,withonegranuleperfileand240granulesperday.GranulesarealignedtoCoordinatedUniversalTime(UTC)suchthatthenominalstarttimeofthefirstgranuleofthedayis00:00Z,andthenominalstarttimeofthelastgranuleis23:54Z.

NASASNPPCrossTrackInfraredSounderLevel1BSampleDataUsers’Guide
11
Each granule is composed of 45 complete 8-second scans. A complete scan is included in agranuleifitsstarttimeisbetweenthenominalgranulestartandendtimes.NotethatbecausegranulesareUTC-alignedandcontainonlycompletescans,theactualdatastarttimemaybeuptoeightsecondsafterthenominalgranulestarttime.Thisactual-versus-nominaltimedelta isgenerallystable,butchangesaftereachUTCleapsecondadjustment.
TheCrISandATMSproductsusethesamegranulationscheme,sothatCrISandATMSgranulescanbeeasilymatchedviathefilenamesorfilemetadata.However,notethatthetemporalandspatialalignmentof thedatawillnotbeperfectdue todifferences in theCrISandATMSscanstarttimesandfootprints.
It is notable that the granulation occurs during L1A processing and uses direct telemetrytimes. In thecaseofCrIS,earthscene,deepspace,and internalcalibrationtargetobservationtimesarecorrectedbackwardfromtelemetrytimestoreflectthecenterofthe interferometerscan. This correction is done using a delta value provided by the instrument in the 4-minuteengineering telemetry. As a result, the first earth scene observation time can and doessometimeslandslightly(milliseconds)beforethenominalstartofa6-minuteUTC-alignedCrISL1AorL1Bgranule.Thissituationoccursafterthe20161231T235960leapsecondadjustmentandpriortothefollowing(future)leapsecondadjustment.
2.3 ProductFiles
L1AandL1Bproductsarewrittentoseparatefiles,withthesamegranulation.
TheL1Aproductconsistsofrawtelemetryvaluesthathavebeendecodedandunscaled,aswellas bit-trimmed interferograms, geolocation data, quality flags and other metadata. The L1Aproductisnotdescribedinthisdocument.
TheL1BproductconsistsofcalibratedradiancespectraandtheassociatedNEdN,auxiliarydataincluding imaginary spectra, geolocation data (identical to L1A), quality flags and othermetadata.TheL1Bproductisdescribedinthisdocument.
2.4 NSRvsFSR
For the first part of the SNPPmission, the effective spectral resolution of CrIS data receivedfromthesatellitewas lower intheshort-waveandmid-waveinfraredbandsthaninthe long-wave infrared band. Level 0 data received during this initial period is referred to as NormalSpectralResolution(NSR).
InDecember2014, the resolutionof theshort-waveandmid-wavedata transmitted fromthesatellitewasincreasedtomatchthelong-waveresolution.Level0datareceivedfromthistimeonwardisreferredtoasFullSpectralResolution(FSR).AfterthetransitiontoFSR,theeffectivespectralresolutionofshort-wavedatareceivedonthegroundwasquadrupled,andtheeffectivespectral resolution of mid-wave data was doubled, with the Level 0 data volume increasingaccordingly.
NASASNPPCrossTrackInfraredSounderLevel1BSampleDataUsers’Guide
12
InNovember2015, thesatellitebegantransmitting long-waveandshort-wave interferogramswithextrapointsontheends.Thesepointshadpreviouslybeendiscarded,butwereaddedtothedatastreambecauseitwasdeterminedthattheycouldbeusedtoimprovethequalityofthecalibration.TheVersion1.0CrISL1BProduct spans themission to-date, including theNSRandFSR timeperiods. To produce a consistent product, Level 0 interferograms from the FSR time periodweretruncatedtoNSRpriortocalibration.TheresolutionoftheVersion1.0CrISL1BProductisthereforeNSR,meaning that the resolution of the short-wave andmid-wave spectra is lowerthantheresolutionofthelong-wavespectra.TheVersion1.0CrISL1BFSRSampleDatawasproducedforthepartofthemissionstartinginNovember2015.ThiswasdeterminedtobetheoptimalstarttimeofanFSRproduct,becauseofthe availability of the additional points at the end of the long-wave and short-waveinterferograms, andbecauseof thedesire tohave a consistent product. The resolutionof theVersion1.0CrISL1BFSRSampleDataisFSR,meaningthatthelong-wave,mid-waveandshort-wavespectraareatthesameresolution.Theavailabilityoftheadditionalpointsattheendofthe long-wave interferogramsallows for reduced spectral ringing in the long-wave spectra inthe FSR Sample Data product, compared to the CrIS L1B (NSR-only) product. However, ifapodizationisappliedbytheuser,theLWradiancedifferencesareexpectedtobeinsignificantbetweenthetwoproducts.NotethatthefutureVersion2.0CrISL1BProductwillincludebothNSRandFSRdatasetsfortheportionofthemissionthatsupportseachresolution.TheNSRproductisintendedtocoverthelongestpossibletimespan,andtheFSRproductisintendedtoprovidehigherresolutionintheshort-waveandmid-wavebands.
NASASNPPCrossTrackInfraredSounderLevel1BSampleDataUsers’Guide
13
3 FileFormatandConventions
The CrIS L1B file format is similar to the ATMS L1B file format, sharing common namingconventions,fileandvariableattributes,andoverallfileorganization.BothCrISandATMSL1BproductsarewrittenanddistributedasNetCDF4files.
3.1 NetCDF4
Theproduct filescanbereadandqueriedusing theNetCDF4 libraryandtoolsmaintainedbyUnidata (http://www.unidata.ucar.edu/software/netcdf/). Support for reading NetCDF isofferedinmanyprogramminglanguages,includingPython,Matlab,IDL,C/C++andFortran.
NetCDF4 files are legal HDF5 files with additional bookkeeping informationmanaged by theNetCDF4 library. It is thereforepossible to inspect and copydataoutof theNetCDF4 filesbyusing the HDF5 utilities and libraries maintained by the HDF Group(https://www.hdfgroup.org/products/hdf5_tools/index.html)orbyusingtheHDF5interfaceinyourfavoriteprogramminglanguage.However,thetwolibrariesshouldnotbeconsideredfullyinterchangeable.
Examplecodeshowinghowtoreadthefilesisshownin“AppendixA”.
MatlabusersshouldnotethattheMatlabNetCDF4interfaceiscurrently(asofversionR2017a)notabletoreadattributesthatarestringarrays,andwillthrowanexceptionifthatisattempted.TheworkaroundistousetheHDF5interfacetoreadthosevariables.See“AppendixA”foranexample.
3.2 MetadataConventions
Wherepossible, theattributesand file structure conform to theClimateandForecasting (CF)Conventions, Version 1.6, as well as the Attribute Conventions for Data Discovery (ACDD),Version1.3.TheseconventionsareintendedtoallowCF-awaresoftwaretounderstandthedata,andtoimproveusabilityofdatabystandardizingtherepresentation.
FormoreinformationonCF,referto:
http://cfconventions.org/
FormoreinformationonACDD,referto:
http://wiki.esipfed.org/index.php?title=Category:Attribute_Conventions_Dataset_Discovery
NASASNPPCrossTrackInfraredSounderLevel1BSampleDataUsers’Guide
14
3.3 MissingData
Missing data is represented by a fill value, as recommended by the CF convention. For eachproductvariablethefillvalueisindicatedbytheattribute"_FillValue".Everydatapointshouldbecheckedforfillbeforeitisused.
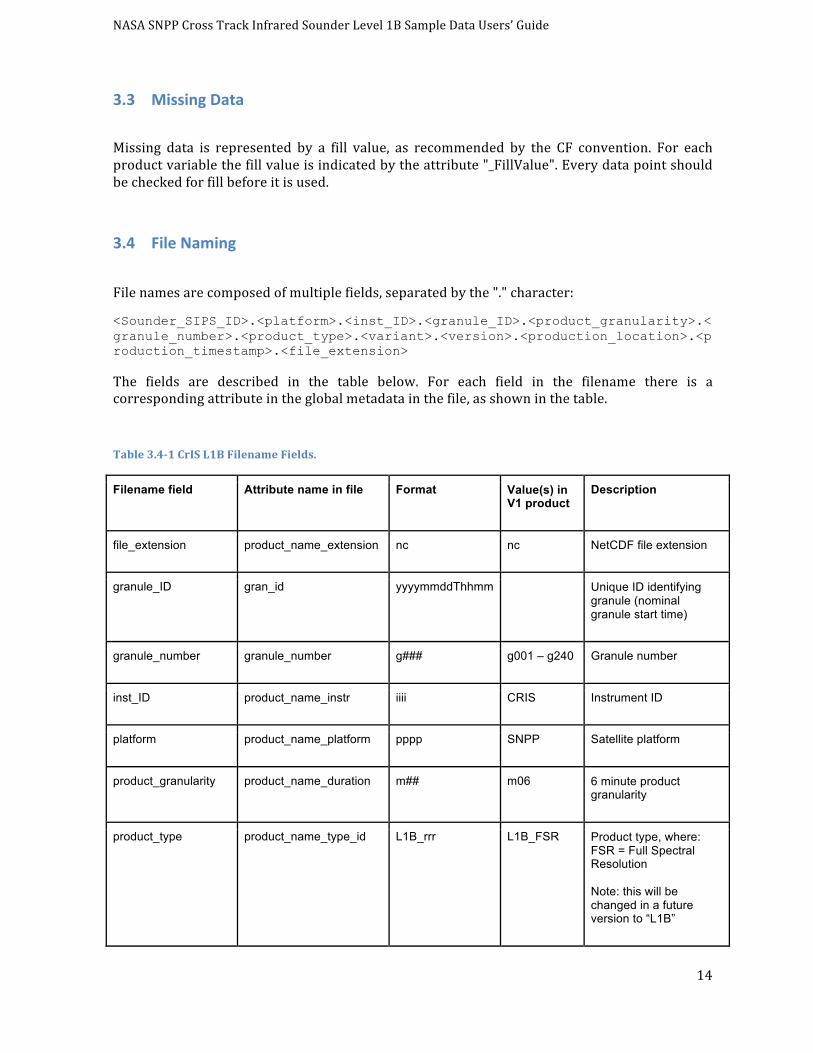
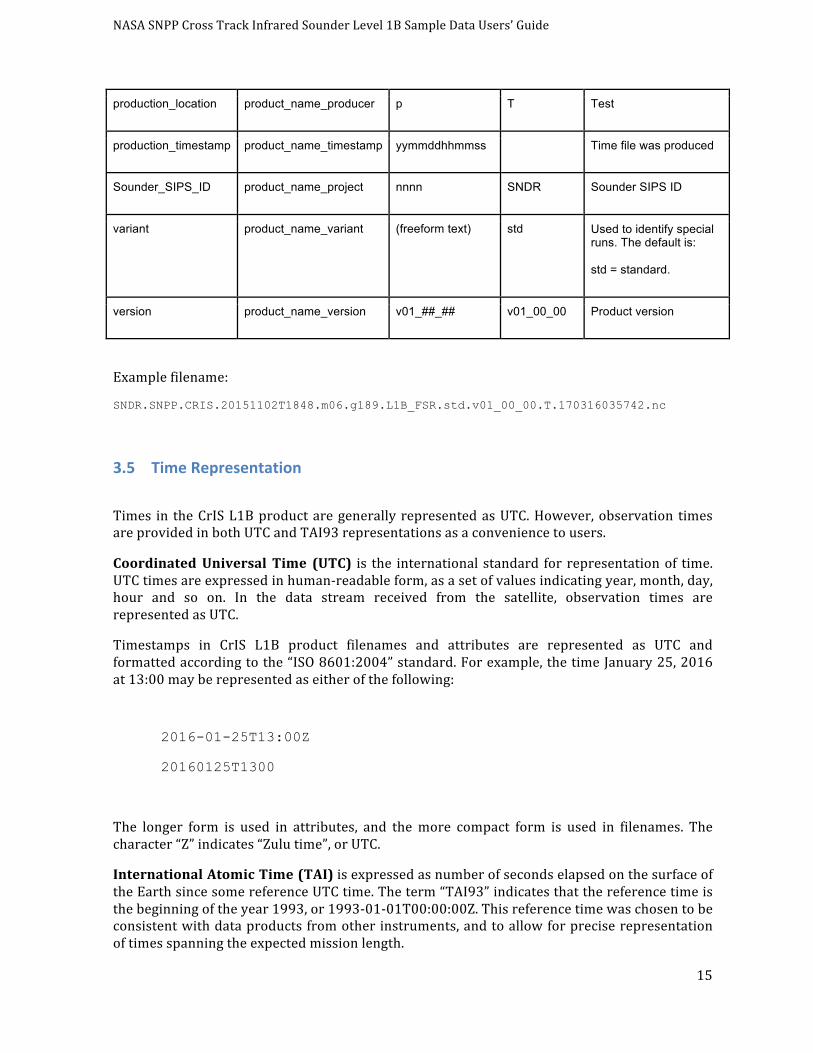
3.4 FileNaming
Filenamesarecomposedofmultiplefields,separatedbythe"."character:
<Sounder_SIPS_ID>.<platform>.<inst_ID>.<granule_ID>.<product_granularity>.<granule_number>.<product_type>.<variant>.<version>.<production_location>.<production_timestamp>.<file_extension>
The fields are described in the table below. For each field in the filename there is acorrespondingattributeintheglobalmetadatainthefile,asshowninthetable.
Table3.4-1CrISL1BFilenameFields.
Filename field Attribute name in file Format Value(s) in V1 product
Description
file_extension product_name_extension nc nc NetCDF file extension
granule_ID gran_id yyyymmddThhmm
Unique ID identifying granule (nominal granule start time)
granule_number granule_number g### g001 – g240 Granule number
inst_ID product_name_instr iiii CRIS Instrument ID
platform product_name_platform pppp SNPP Satellite platform
product_granularity product_name_duration m## m06 6 minute product granularity
product_type product_name_type_id L1B_rrr L1B_FSR Product type, where: FSR = Full Spectral Resolution
Note: this will be changed in a future version to “L1B”
NASASNPPCrossTrackInfraredSounderLevel1BSampleDataUsers’Guide
15
production_location product_name_producer p T Test
production_timestamp product_name_timestamp yymmddhhmmss
Time file was produced
Sounder_SIPS_ID product_name_project nnnn SNDR Sounder SIPS ID
variant product_name_variant (freeform text) std Used to identify special runs. The default is:
std = standard.
version product_name_version v01_##_## v01_00_00 Product version
Examplefilename:
SNDR.SNPP.CRIS.20151102T1848.m06.g189.L1B_FSR.std.v01_00_00.T.170316035742.nc
3.5 TimeRepresentation
Times in theCrISL1Bproductaregenerally representedasUTC.However,observation timesareprovidedinbothUTCandTAI93representationsasaconveniencetousers.
CoordinatedUniversal Time (UTC) is the international standard for representationof time.UTCtimesareexpressedinhuman-readableform,asasetofvaluesindicatingyear,month,day,hour and so on. In the data stream received from the satellite, observation times arerepresentedasUTC.
Timestamps in CrIS L1B product filenames and attributes are represented as UTC andformattedaccordingtothe“ISO8601:2004”standard.Forexample,thetimeJanuary25,2016at13:00mayberepresentedaseitherofthefollowing:
2016-01-25T13:00Z
20160125T1300
The longer form is used in attributes, and themore compact form is used in filenames. Thecharacter“Z”indicates“Zulutime”,orUTC.
InternationalAtomicTime(TAI)isexpressedasnumberofsecondselapsedonthesurfaceoftheEarthsincesomereferenceUTCtime.Theterm“TAI93”indicatesthatthereferencetimeisthebeginningoftheyear1993,or1993-01-01T00:00:00Z.Thisreferencetimewaschosentobeconsistentwithdataproductsfromotherinstruments,andtoallowforpreciserepresentationoftimesspanningtheexpectedmissionlength.
NASASNPPCrossTrackInfraredSounderLevel1BSampleDataUsers’Guide
16
Leapsecondsareone-secondadjustmentsthatareoccasionallyappliedtoUTCas23:59:60,toaccount for irregularities in the rotation of theEarth. Therewere27 leap seconds applied toUTCbetweenJan1,1958andJan1,1993.BetweenJan1,1993andJan1,2017,anadditional10leap seconds were applied to UTC. Leap secondsmust be accounted for when doing certainkindsoftimecalculations,especiallyinastronomyandsatelliteapplications.LeapsecondscanoccuronDecember31orJune30ofagivenyear,andareannouncedmonthsinadvance.
Leapsecondsmustbeaccountedforinthefollowingoperations:
• WhencalculatingexactelapsedtimebetweentwoUTCtimes.IfoneormoreleapsecondswereinsertedbetweentheUTCendpoints,theymustbeaccountedforinorderfortheresulttobeaccurate.
• WhenconvertingbetweenUTCandTAItimes.AnyleapsecondsthatoccurredbetweentheTAIreferencetimeandtheUTCtimemustbeaccountedfor,ortheresultwillbewrong.
• WhencomparingTAItimeswithdifferentreferencetimes,orconvertingfromoneTAIreferencetimetotheother.Anyleapsecondsthatoccurredbetweenthereferencetimesmustbeaccountedfor,ortheresultwillbewrong.AnexamplewouldbewhencomparingTAI93timesinL1Bproductsto“IET”microsecondsinoperationalCrISSDRproducts,whichuseareferencetimeof1958-01-01T00:00Z.Inthiscase27leapsecondsoccurredbetweenthereferencetimes.
In general, these operations can be error-prone. Therefore it is recommended that timecalculationsandconversionsbedonewithleap-second-awarethirdpartytoolsthatrelyonanup-to-datetableofleapseconds,suchasthe“astropy”pythonpackage.Asagenerality,itcanbeassumed that most computational systems use POSIX time scale and cannot represent leapseconds,unlessspecificallystatedinthesoftwarespecifications.
NASASNPPCrossTrackInfraredSounderLevel1BSampleDataUsers’Guide
17
4 DataContents
CrISL1BdataisstoredinNetCDF4formatdatafilesandrequiresarecentversionoftheUnidataNetCDF library to access content. NetCDF4 is effectively a specialization of theHDF5 format,unlikeNetCDF3andpriorversions.SomeusersmayprefertouseHDF5librariestoaccessthefiles;doingsoissubjecttoanumberofcaveatsoutsidethescopeofthisdocument.
TheNetCDF4datamodel allows forvariables, groups (similar todirectories in a file system),dimensionsandattributes.
Most of the variables in the CrIS L1B files are at the root level. However, auxiliary variables,whicharemainlyusefulfordiagnosticandvalidationpurposes,arecontainedinagroupcalled“aux”.
Each variable has attributes recommended by the Unidata Climate and Forecasting (CF)convention,sufficienttodescribethemeaningof thevariableandinterpret itsvalue.Eachfilehas a set of standard-conforming global attributes that describe the granule, includinggeographicinformation,qualityflagsummarystatistics,anddataprovenance.
This section describes the variables, dimensions and attributes in the CrIS L1B files. For acompletelistinCommonDataformLanguage(CDL)format,referto“AppendixB”.
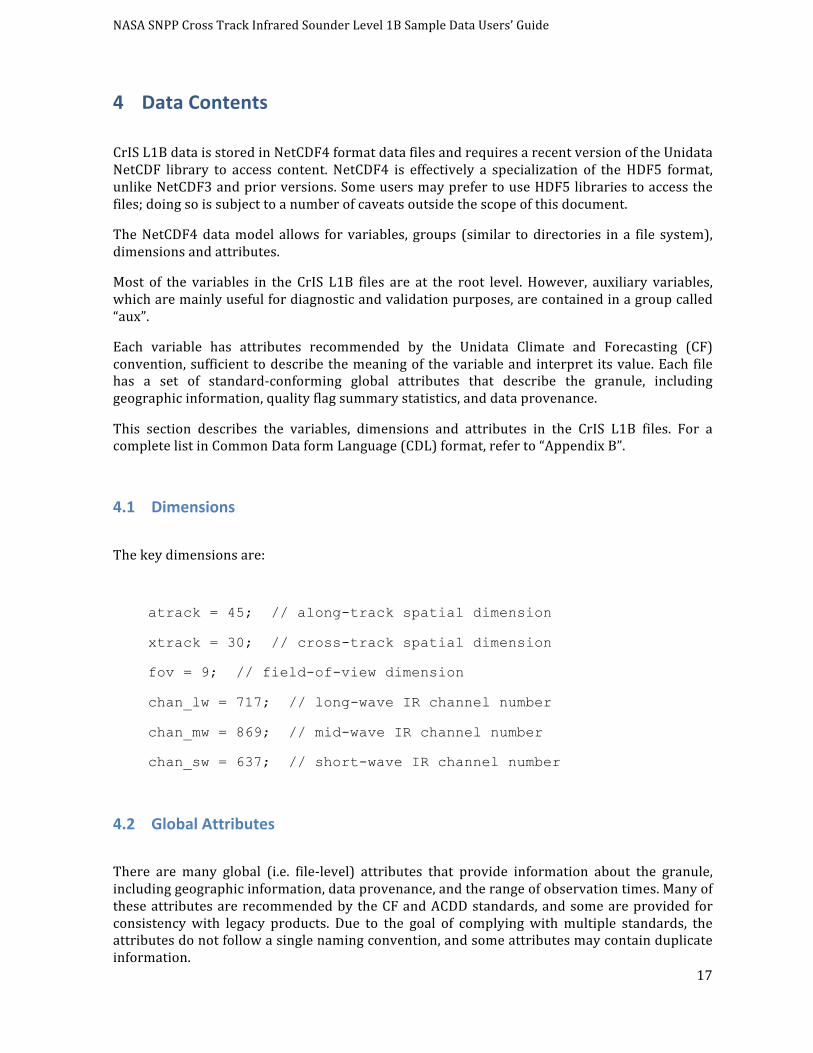
4.1 Dimensions
Thekeydimensionsare:
atrack = 45; // along-track spatial dimension
xtrack = 30; // cross-track spatial dimension
fov = 9; // field-of-view dimension
chan_lw = 717; // long-wave IR channel number
chan_mw = 869; // mid-wave IR channel number
chan_sw = 637; // short-wave IR channel number
4.2 GlobalAttributes
There are many global (i.e. file-level) attributes that provide information about the granule,includinggeographicinformation,dataprovenance,andtherangeofobservationtimes.ManyoftheseattributesarerecommendedbytheCFandACDDstandards,andsomeareprovided forconsistencywith legacy products. Due to the goal of complyingwithmultiple standards, theattributesdonotfollowasinglenamingconvention,andsomeattributesmaycontainduplicateinformation.

NASASNPPCrossTrackInfraredSounderLevel1BSampleDataUsers’Guide
18
Some global attributes are static, i.e. unvarying across files, some are set by the operator(typicallytheNASAGESDISC)viaconfigurationfiles,andsomearesetdynamicallyatruntimebytheL1Bsoftwarebasedonthedatabeingprocessed.
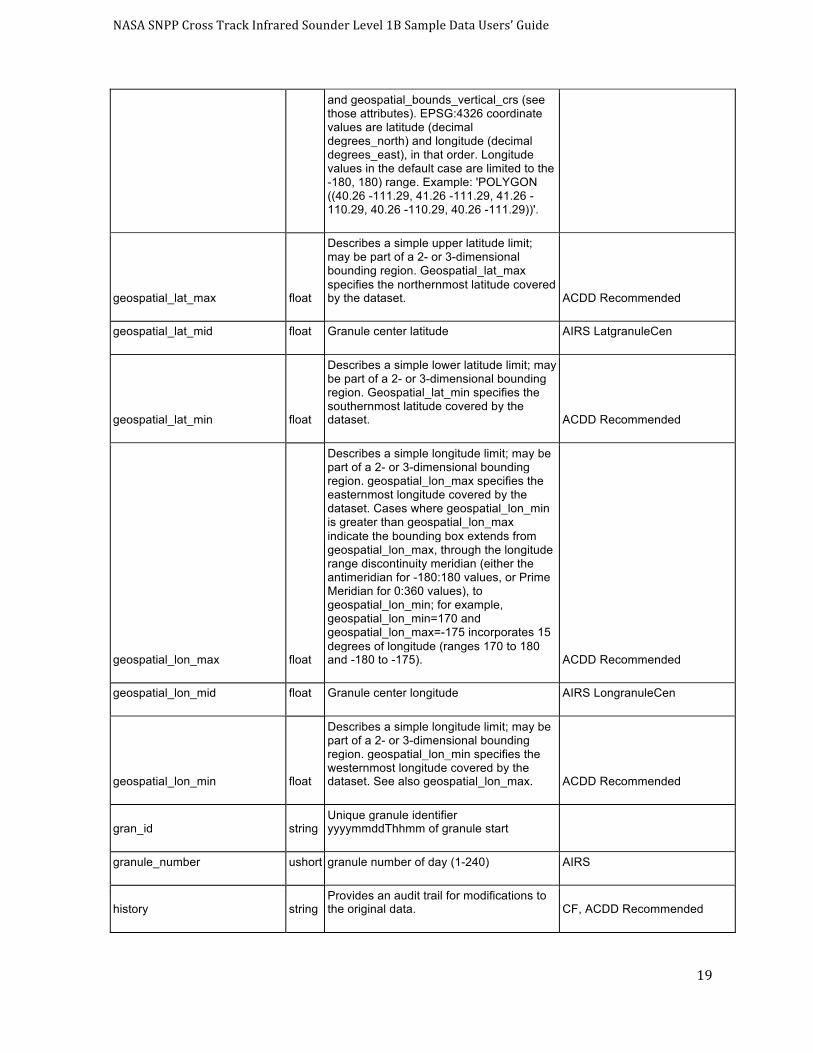
Thetablebelowdescribesthedynamicglobalattributes.Forafulllistofglobalattributes,referto“AppendixB:CDLFiles”.
Table4.2-1CrISL1BDynamicGlobalAttributes
Attribute Name Type Description Heritage
AutomaticQualityFlag string
"Passed": the granule contains a non-degraded calibrated brightness temperature or radiance for at least one channel in a geolocated FOV; "Suspect": the granule does not qualify as "Passed" but contains a (possibly degraded) calibrated brightness temperature or radiance for at least one channel (possibly without associated geolocation); "Failed": the granule contains no calibrated brightness temperatures/radiances.
ECS. AIRS called it AutomaticQAFlag in HDF attributes but AutomaticQualityFlag in metadata.
comment string
Miscellaneous information about the data or methods used to produce it. Can be empty. CF, ACDD Recommended
date_created string
The date on which this version of the data was created. (Modification of values implies a new version, hence this would be assigned the date of the most recent values modification.) Metadata changes are not considered when assigning the date_created.
ACDD Recommended, ECS/AIRS ProductionDateTime
day_night_flag string
Data is day or night. "Day" means subsatellite point for all valid scans has solar zenith angle less than 90 degrees. "Night" means subsatellite point for all valid scans has solar zentih angle greater than 90 degrees. "Both" means the dataset contains valid observations with solar zenith angle above and below 90 degrees. "NA" means a value could not be determined. AIRS DayNightFlag
geospatial_bounds string
Describes the data's 2D or 3D geospatial extent in OGC's Well-Known Text (WKT) Geometry format (reference the OGC Simple Feature Access (SFA) specification). The meaning and order of values for each point's coordinates depends on the coordinate reference system (CRS). The ACDD default is 2D geometry in the EPSG:4326 coordinate reference system. The default may be overridden with geospatial_bounds_crs
ACDD Recommended
NASASNPPCrossTrackInfraredSounderLevel1BSampleDataUsers’Guide
19
and geospatial_bounds_vertical_crs (see those attributes). EPSG:4326 coordinate values are latitude (decimal degrees_north) and longitude (decimal degrees_east), in that order. Longitude values in the default case are limited to the -180, 180) range. Example: 'POLYGON ((40.26 -111.29, 41.26 -111.29, 41.26 -110.29, 40.26 -110.29, 40.26 -111.29))'.
geospatial_lat_max float
Describes a simple upper latitude limit; may be part of a 2- or 3-dimensional bounding region. Geospatial_lat_max specifies the northernmost latitude covered by the dataset. ACDD Recommended
geospatial_lat_mid float Granule center latitude AIRS LatgranuleCen
geospatial_lat_min float
Describes a simple lower latitude limit; may be part of a 2- or 3-dimensional bounding region. Geospatial_lat_min specifies the southernmost latitude covered by the dataset. ACDD Recommended
geospatial_lon_max float
Describes a simple longitude limit; may be part of a 2- or 3-dimensional bounding region. geospatial_lon_max specifies the easternmost longitude covered by the dataset. Cases where geospatial_lon_min is greater than geospatial_lon_max indicate the bounding box extends from geospatial_lon_max, through the longitude range discontinuity meridian (either the antimeridian for -180:180 values, or Prime Meridian for 0:360 values), to geospatial_lon_min; for example, geospatial_lon_min=170 and geospatial_lon_max=-175 incorporates 15 degrees of longitude (ranges 170 to 180 and -180 to -175). ACDD Recommended
geospatial_lon_mid float Granule center longitude AIRS LongranuleCen
geospatial_lon_min float
Describes a simple longitude limit; may be part of a 2- or 3-dimensional bounding region. geospatial_lon_min specifies the westernmost longitude covered by the dataset. See also geospatial_lon_max. ACDD Recommended
gran_id string Unique granule identifier yyyymmddThhmm of granule start
granule_number ushort granule number of day (1-240) AIRS
history string Provides an audit trail for modifications to the original data. CF, ACDD Recommended

NASASNPPCrossTrackInfraredSounderLevel1BSampleDataUsers’Guide
20
input_file_dates string
Semicolon-separated list of creation dates for each input file in input_file_names. There will always be one space after each semicolon. There is no final semicolon. ISO Source Creation Date
input_file_names string
Semicolon-separated list of names or unique identifiers of files that were used to make this product. There will always be one space after each semicolon. There is no final semicolon.
ECS InputPointer; ISO Source Citation
input_file_types string
Semicolon-separated list of tags giving the role of each input file in input_file_names. There will always be one space after each semicolon. There is no final semicolon. ISO Source Description
orbitDirection string
Orbit is ascending and/or descending. Values are "Ascending" or "Descending" if the entire granule fits that description. "NorthPole" and "SouthPole" are used for polar-crossing granules. "NA" is used when a determination cannot be made.
SMAP uses this attribute name but only asc/desc because files are half orbits. The values used here are similar to AIRS node_type.
processing_level string
A textual description of the processing (or quality control) level of the data. "Dummy" when file contains no data. ACDD Recommended
product_name string Canonical fully qualified product name (official file name) ECS LocalGranuleID
product_name_granule_number string zero-padded string for granule number of day (g001-g240) AIRS
product_name_timestamp string Processing timestamp as it appears in product_name (yymmddhhmmss)
product_name_variant string Processing variant identifier as it appears in product_name
production_host string
Identifying information about the host computer for this run. (Output of linux "uname -a" command.)
qa_no_data string
A simple indicator of whether this is an "empty" granule with no data from the instrument. "TRUE" or "FALSE".
qa_pct_data_geo float Percentage of expected observations that are successfully geolocated.
Maps to (part of) ISO 19115 CompletenessComission
qa_pct_data_missing float Percentage of expected observations that are missing.
ECS, maps to (part of) ISO 19115 CompletenessComission
qa_pct_data_sci_mode float Percentage of expected observations that were taken while the instrument was in science mode and are successfully
Maps to (part of) ISO 19115 CompletenessComission
NASASNPPCrossTrackInfraredSounderLevel1BSampleDataUsers’Guide
21
geolocated.
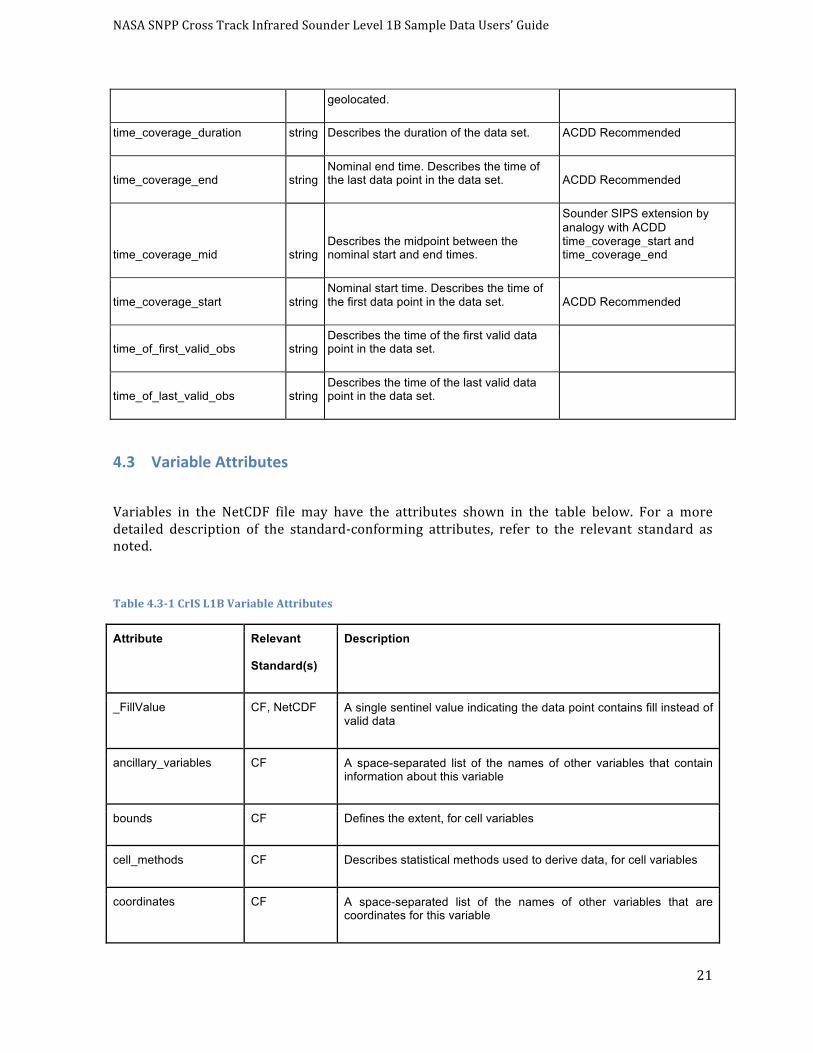
time_coverage_duration string Describes the duration of the data set. ACDD Recommended
time_coverage_end string Nominal end time. Describes the time of the last data point in the data set. ACDD Recommended
time_coverage_mid string Describes the midpoint between the nominal start and end times.
Sounder SIPS extension by analogy with ACDD time_coverage_start and time_coverage_end
time_coverage_start string Nominal start time. Describes the time of the first data point in the data set. ACDD Recommended
time_of_first_valid_obs string Describes the time of the first valid data point in the data set.
time_of_last_valid_obs string Describes the time of the last valid data point in the data set.
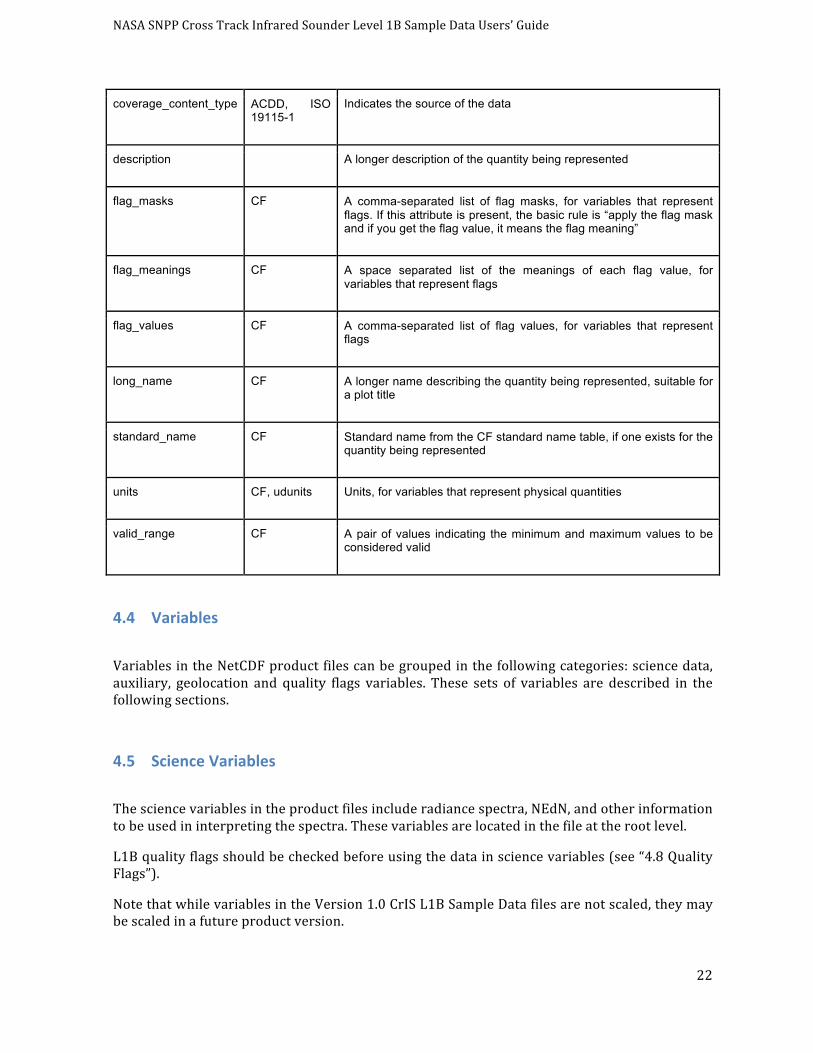
4.3 VariableAttributes
Variables in the NetCDF file may have the attributes shown in the table below. For a moredetailed description of the standard-conforming attributes, refer to the relevant standard asnoted.
Table4.3-1CrISL1BVariableAttributes
Attribute Relevant
Standard(s)
Description
_FillValue CF, NetCDF A single sentinel value indicating the data point contains fill instead of valid data
ancillary_variables CF A space-separated list of the names of other variables that contain information about this variable
bounds CF Defines the extent, for cell variables
cell_methods CF Describes statistical methods used to derive data, for cell variables
coordinates CF A space-separated list of the names of other variables that are coordinates for this variable
NASASNPPCrossTrackInfraredSounderLevel1BSampleDataUsers’Guide
22
coverage_content_type ACDD, ISO 19115-1
Indicates the source of the data
description
A longer description of the quantity being represented
flag_masks CF A comma-separated list of flag masks, for variables that represent flags. If this attribute is present, the basic rule is “apply the flag mask and if you get the flag value, it means the flag meaning”
flag_meanings CF A space separated list of the meanings of each flag value, for variables that represent flags
flag_values CF A comma-separated list of flag values, for variables that represent flags
long_name CF A longer name describing the quantity being represented, suitable for a plot title
standard_name CF Standard name from the CF standard name table, if one exists for the quantity being represented
units CF, udunits Units, for variables that represent physical quantities
valid_range CF A pair of values indicating the minimum and maximum values to be considered valid
4.4 Variables
VariablesintheNetCDFproductfilescanbegroupedinthefollowingcategories:sciencedata,auxiliary, geolocation and quality flags variables. These sets of variables are described in thefollowingsections.
4.5 ScienceVariables
Thesciencevariablesintheproductfilesincluderadiancespectra,NEdN,andotherinformationtobeusedininterpretingthespectra.Thesevariablesarelocatedinthefileattherootlevel.
L1Bqualityflagsshouldbecheckedbeforeusingthedatainsciencevariables(see“4.8QualityFlags”).
NotethatwhilevariablesintheVersion1.0CrISL1BSampleDatafilesarenotscaled,theymaybescaledinafutureproductversion.
NASASNPPCrossTrackInfraredSounderLevel1BSampleDataUsers’Guide
23
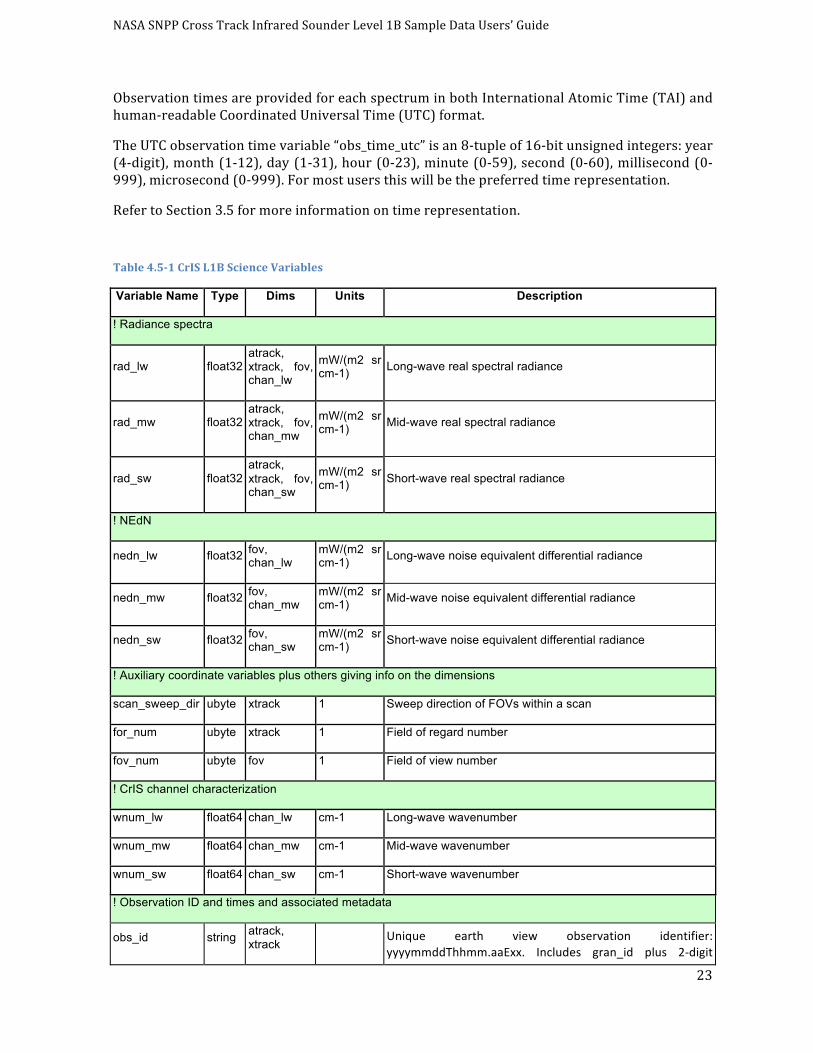
ObservationtimesareprovidedforeachspectruminbothInternationalAtomicTime(TAI)andhuman-readableCoordinatedUniversalTime(UTC)format.
TheUTCobservationtimevariable“obs_time_utc”isan8-tupleof16-bitunsignedintegers:year(4-digit),month(1-12),day(1-31),hour(0-23),minute(0-59),second(0-60),millisecond(0-999),microsecond(0-999).Formostusersthiswillbethepreferredtimerepresentation.
RefertoSection3.5formoreinformationontimerepresentation.
Table4.5-1CrISL1BScienceVariables
Variable Name Type Dims Units Description
! Radiance spectra
rad_lw float32 atrack, xtrack, fov, chan_lw
mW/(m2 sr cm-1) Long-wave real spectral radiance
rad_mw float32 atrack, xtrack, fov, chan_mw
mW/(m2 sr cm-1) Mid-wave real spectral radiance
rad_sw float32 atrack, xtrack, fov, chan_sw
mW/(m2 sr cm-1) Short-wave real spectral radiance
! NEdN
nedn_lw float32 fov, chan_lw
mW/(m2 sr cm-1) Long-wave noise equivalent differential radiance
nedn_mw float32 fov, chan_mw
mW/(m2 sr cm-1) Mid-wave noise equivalent differential radiance
nedn_sw float32 fov, chan_sw
mW/(m2 sr cm-1) Short-wave noise equivalent differential radiance
! Auxiliary coordinate variables plus others giving info on the dimensions
scan_sweep_dir ubyte xtrack 1 Sweep direction of FOVs within a scan
for_num ubyte xtrack 1 Field of regard number
fov_num ubyte fov 1 Field of view number
! CrIS channel characterization
wnum_lw float64 chan_lw cm-1 Long-wave wavenumber
wnum_mw float64 chan_mw cm-1 Mid-wave wavenumber
wnum_sw float64 chan_sw cm-1 Short-wave wavenumber
! Observation ID and times and associated metadata
obs_id string atrack, xtrack
Unique earth view observation identifier:yyyymmddThhmm.aaExx. Includes gran_id plus 2-digit

NASASNPPCrossTrackInfraredSounderLevel1BSampleDataUsers’Guide
24
along-track index (01-45) and2-digit cross-track index (01-30).
fov_obs_id string atrack, xtrack, fov
Unique earth view observation identifier for FOV: yyyymmddThhmm.aaExx.f. Includes obs_id plus 1-digit FOV number (1-9).
obs_time_tai double atrack, xtrack
seconds since 1993-01-01 00:00
Earth view observation midtime for each fov
obs_time_utc uint16 atrack, xtrack, utc_tuple
1 UTC earth view observation time as an array of integers: year, month, day, hour, minute, second, millisecond, microsecond
utc_tuple_lbl string utc_tuple
Names of the elements of UTC when it is expressed as an array of integers: year, month, day, hour, minute, second, millisecond, microsecond
! Instrument state
instrument_state ubyte atrack, xtrack, fov 1
Instrument/data state: 0/'Process' - Data is usable for science; 1/'Special' - Observations are valid but instrument is not configured for science data (ex: stare mode or spacecraft maneuver); 2/'Erroneous' - Data is not usable (ex: checksum error); 3/'Missing' - No data was received.
4.6 AuxiliaryVariables
Auxiliaryvariables,includingimaginaryspectraandvariouscalibrationparameters,arelocatedinthegroupcalled“aux”.Formoreinformationonauxiliaryvariables,referto“AppendixB:CDLFile”.
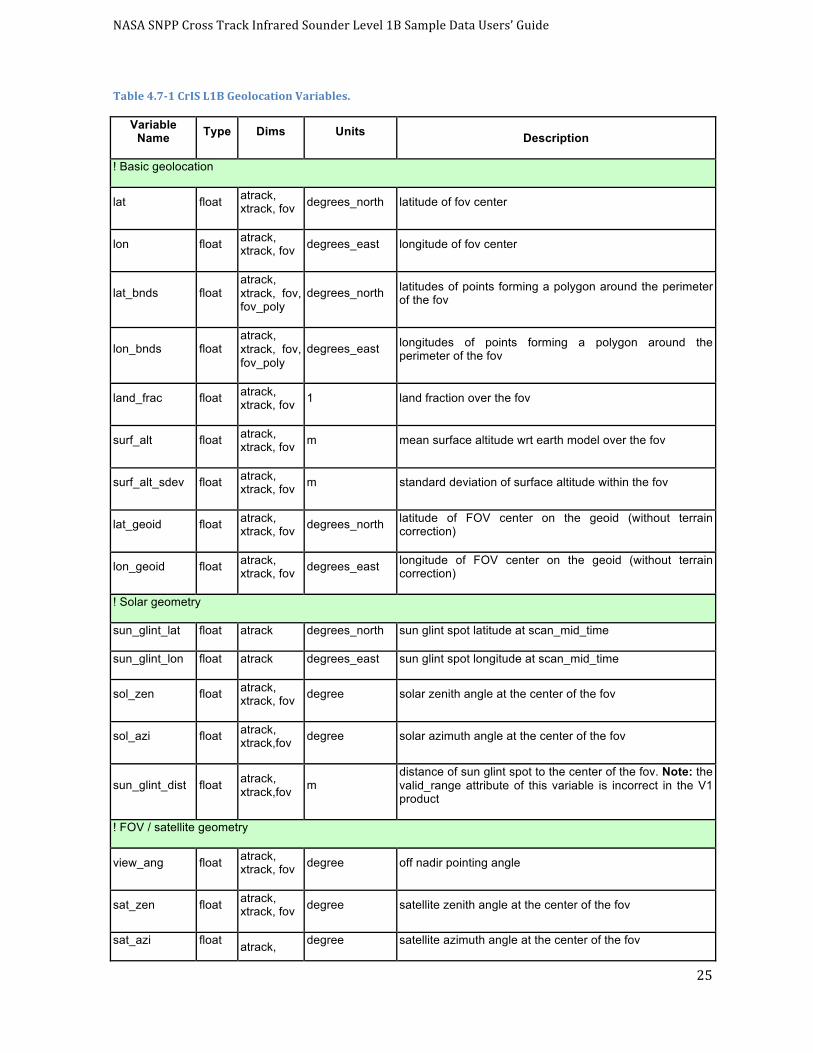
4.7 GeolocationVariables
Geolocationvariablesincludelatitudesandlongitudesassociatedwitheachobservation,aswellas satellite and solar geometry information, spacecraft position and heading, surfaceinformationandrelatedmetadata.Geolocationvariablesarelocatedinthefileattherootlevel.
Thegeolocationqualityflagsshouldbecheckedbeforeusingdataingeolocationvariables(see“4.8QualityFlags”).
Observationlocationsarecalculatedbyfindingtheintersectionofthesensor’sline-of-sightbothwithamodeloftheearth’sgeoid(approximatingsealevelatallearthlocations)andalsowithadigital elevation model of the earth’s terrain. The resulting earth locations are reportedseparately as lat_geoid/lon_geoid for the former case and as simply lat/lon for the latter. Allother geolocation variables based on earth location are derived from the terrain-corrected(lat/lon)values.
NASASNPPCrossTrackInfraredSounderLevel1BSampleDataUsers’Guide
25
Table4.7-1CrISL1BGeolocationVariables.
Variable Name Type Dims Units Description
! Basic geolocation
lat float atrack, xtrack, fov degrees_north latitude of fov center
lon float atrack, xtrack, fov degrees_east longitude of fov center
lat_bnds float atrack, xtrack, fov, fov_poly
degrees_north latitudes of points forming a polygon around the perimeter of the fov
lon_bnds float atrack, xtrack, fov, fov_poly
degrees_east longitudes of points forming a polygon around the perimeter of the fov
land_frac float atrack, xtrack, fov 1 land fraction over the fov
surf_alt float atrack, xtrack, fov m mean surface altitude wrt earth model over the fov
surf_alt_sdev float atrack, xtrack, fov m standard deviation of surface altitude within the fov
lat_geoid float atrack, xtrack, fov degrees_north latitude of FOV center on the geoid (without terrain
correction)
lon_geoid float atrack, xtrack, fov degrees_east longitude of FOV center on the geoid (without terrain
correction)
! Solar geometry
sun_glint_lat float atrack degrees_north sun glint spot latitude at scan_mid_time
sun_glint_lon float atrack degrees_east sun glint spot longitude at scan_mid_time
sol_zen float atrack, xtrack, fov degree solar zenith angle at the center of the fov
sol_azi float atrack, xtrack,fov degree solar azimuth angle at the center of the fov
sun_glint_dist float atrack, xtrack,fov m
distance of sun glint spot to the center of the fov. Note: the valid_range attribute of this variable is incorrect in the V1 product
! FOV / satellite geometry
view_ang float atrack, xtrack, fov degree off nadir pointing angle
sat_zen float atrack, xtrack, fov degree satellite zenith angle at the center of the fov
sat_azi float atrack, degree satellite azimuth angle at the center of the fov
NASASNPPCrossTrackInfraredSounderLevel1BSampleDataUsers’Guide
26
xtrack, fov
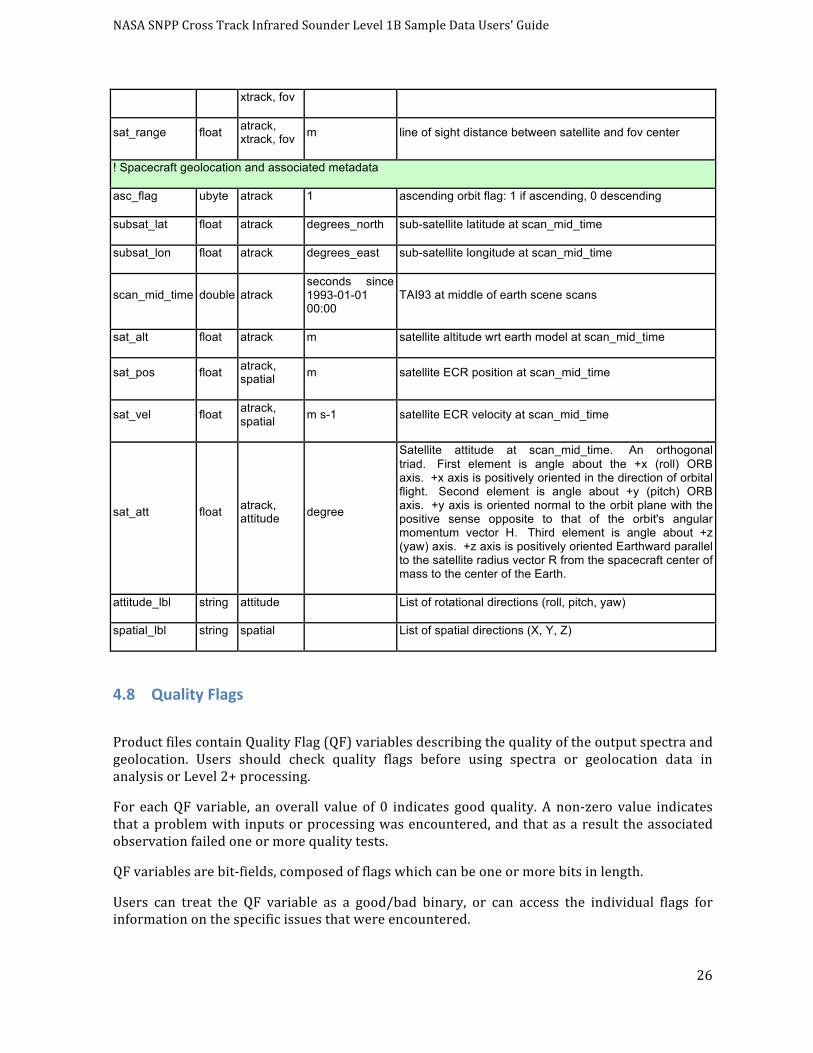
sat_range float atrack, xtrack, fov m line of sight distance between satellite and fov center
! Spacecraft geolocation and associated metadata
asc_flag ubyte atrack 1 ascending orbit flag: 1 if ascending, 0 descending
subsat_lat float atrack degrees_north sub-satellite latitude at scan_mid_time
subsat_lon float atrack degrees_east sub-satellite longitude at scan_mid_time
scan_mid_time double atrack seconds since 1993-01-01 00:00
TAI93 at middle of earth scene scans
sat_alt float atrack m satellite altitude wrt earth model at scan_mid_time
sat_pos float atrack, spatial m satellite ECR position at scan_mid_time
sat_vel float atrack, spatial m s-1 satellite ECR velocity at scan_mid_time
sat_att float atrack, attitude degree
Satellite attitude at scan_mid_time. An orthogonal triad. First element is angle about the +x (roll) ORB axis. +x axis is positively oriented in the direction of orbital flight. Second element is angle about +y (pitch) ORB axis. +y axis is oriented normal to the orbit plane with the positive sense opposite to that of the orbit's angular momentum vector H. Third element is angle about +z (yaw) axis. +z axis is positively oriented Earthward parallel to the satellite radius vector R from the spacecraft center of mass to the center of the Earth.
attitude_lbl string attitude
List of rotational directions (roll, pitch, yaw)
spatial_lbl string spatial
List of spatial directions (X, Y, Z)
4.8 QualityFlags
ProductfilescontainQualityFlag(QF)variablesdescribingthequalityoftheoutputspectraandgeolocation. Users should check quality flags before using spectra or geolocation data inanalysisorLevel2+processing.
For eachQF variable, an overall value of 0 indicates goodquality.Anon-zero value indicatesthataproblemwithinputsorprocessingwasencountered,andthatasaresulttheassociatedobservationfailedoneormorequalitytests.
QFvariablesarebit-fields,composedofflagswhichcanbeoneormorebitsinlength.
Users can treat the QF variable as a good/bad binary, or can access the individual flags forinformationonthespecificissuesthatwereencountered.

NASASNPPCrossTrackInfraredSounderLevel1BSampleDataUsers’Guide
27
The individual flags ineachvariablearedescribed in “AppendixC:QualityFlagMeanings”. Amore complete description is provided in the document “NASA SNPP Cross-track InfraredSounder (CrIS) Level 1B Quality Flags Description Document, Version 1.0”. Note that themeaningsoftheseflagsarefullydescribedbytheattributes“flag_values”,“flag_meanings”and“flag_masks”,asrecommendedbytheCFstandard.Itisrecommendedthatanysoftwarethatisdeveloped to decode individual flags should use these attributes directly to interpret themeaningofthevalues,insteadofrelyingontheinformationinthisdocument.Forinformationonhowtoapplytheseattributes,refertotheCFstandard.
The dimensions of theQFs correspond to the dimensions of the variables that they describe.Notethatthereisno“band”dimensioninanyoftheQFs;thevaluesapplytoallbands,exceptwhereindividualflagsareidentifiedasdescribingasingleband.
The primary quality test for each spectrum applies an envelope to the imaginary residual atcertainwavenumberregions,andsetstheflagtonon-zero(bad)ifthethresholdisexceeded.
Ifadditionalqualitytestsareaddedinafutureproductversion,weplantomaintainthepositionand meanings of the currently defined flags to avoid negatively affecting software that wasdevelopedusingthecurrentproduct.
Table4.8-1CrISL1BQualityVariables.
Variable Name Type Dims Units Description
l1b_qual int64 atrack, xtrack, fov 1 Indicates L1B quality for each observation, where an overall value of 0
indicates no critical issues.
geo_qual int64 atrack, xtrack, fov 1 Indicates geolocation quality for each observation, where an overall
value of 0 indicates no critical issues.
4.9 GranuleandObservationIDs
Included in theproductare IDs that allowa granuleorobservation tobeuniquely identified.UsersareencouragedtorefertotheseIDstounambiguouslyidentifydatasetswithinaproduct,forexamplewhenplottingdataorpublishingresults.
Granule ID:Eachgranulehasaunique ID that isstored inaglobalattributecalled“gran_id”,whichalsoappearsinthefilename.Thisattributeisastringrepresentationofthenominalstarttimeofthegranule.Theformatofthestringis“yyyymmddThhmm”.
Forexample:
20160125T1300
ObservationID:Eachfieldofregard(FOR),definedasasetof9simultaneouslyobservedfieldsofview,hasagloballyuniqueIDstoredinthevariable“obs_id”.TheobservationIDiscreated
NASASNPPCrossTrackInfraredSounderLevel1BSampleDataUsers’Guide
28
from the granule ID, with information appended to identify the FOR observation within thegranule.
Thedimensionsofthisvariable(atrack=45,xtrack=30)correspondtothefirsttwodimensionsofthesciencedatavariables,suchasradiances.AnobservationIDcanbeassociatedwithdatabyapplyingthesameindicesintothesecommondimensions.
TheformatoftheobservationIDstringis“yyyymmddThhmm.aaExx”,where“aa”isthe2-digitalong-track index (01-45), and “xx” is the 2-digit cross-track index (01-30). The “E” indicatesthatitisanearthview.
Forexample:
20160125T1300.01E18
FOVObservation ID:At the finest levelofgranularity,each fieldofview(FOV)withinaFORobservation has a globally unique ID that is stored in a variable called “fov_obs_id”. The FOVobservationIDiscreatedfromtheobservationID,withextrainformationappendedtoidentifytheFOVwithintheFORobservation.
The dimensions of this variable (atrack=45, xtrack=30, fov=9) correspond to the first threedimensions of the science data variables, such as radiances. A FOV observation ID can beassociatedwithdatabyapplyingthesameindicesintothesecommondimensions.
TheformatoftheFOVobservationIDstringis“yyyymmddThhmm.aaExx.f”where“f” isthe1-digitFOVnumber(1-9).
Forexample:
20160125T1300.01E18.6

NASASNPPCrossTrackInfraredSounderLevel1BSampleDataUsers’Guide
29
5 CaveatsandKnownIssues This section describes known issues affecting the CrIS L1BVersion 1.0 CrIS L1B FSR SampleData.
1. An issue has been reportedwhere processing fails on granules adjacent to data gaps.
Controlling logic may be optimized in a future software version to handle thesesituationsbetter,improvingoverallgranuleyield.
2. The imaginary part of the calibrated radiances (rad_imag_lw, rad_imag_mw,rad_imag_sw)andtheNEdNestimates(nedn_lw,nedn_mw,nedn_sw)contained in thenetcdffilesareonawavenumberscalethatisshiftedrelativetowavenumberscaleusedfor the corresponding calibrated radiances. This error will be corrected in a futureproductrelease.Formoreinformation,pleasecontactthesoftwaremaintainers.
3. DuetoleapsecondimplementationerrorsbothintheCrISL1AsoftwareandtheSNPPCrIS instrument system, data is not produced surrounding leap second transitions.Partialresolutiontothis is implementedfora futurerelease,but fullresolutionofthisissuemaynotbeavailableuntilJPSS-1CrISorlater.
4. The valid_range attribute for the geolocation variable sun_glint_dist is incorrectlyexpressedinkilometers,notmetersasidentifiedbytheunitsattribute.
5. The“product_name_type_id”fieldintheL1Bfilenamewillbechangedinafutureversionfrom “L1B_FSR” to “L1B”. This also applies to the “product_name_type_id” and“product_name”fileattributes.
6. In the V2.0 FSR Alpha sample product, the Noise Equivalent Differential Radiances(NEdN;nedn_lw,nedn_mw,andnedn_sw)areinadvertentlyprovidedinrawinstrumentcountsunits(inconsistentwiththenamingconventionandattributes).Toconvertthesevalues to their approximate radiance equivalents,multiply by a Planck radiance for ablackbodyatatemperatureof280K.Thisissuewillbecorrectedinthenextrelease.
7. Principal Component filteringhasnot been applied to theNEdNestimate for theV2.0Alphasample(FSR)product.
NASASNPPCrossTrackInfraredSounderLevel1BSampleDataUsers’Guide
30
6 References
1. NASASNPPCrossTrackInfraredSounder(CrIS)Level1BDeltaAlgorithmTheoreticalBasisDocument(ATBD),Version1.0
2. NASASNPPCrossTrackInfraredSounder(CrIS)Level1BQualityFlagsDescriptionDocument,Version1.0
3. JointPolarSatelliteSystem(JPSS)CrossTrackInfraredSounder(CrIS)SensorDataRecords(SDR)AlgorithmTheoreticalBasisDocument(ATBD),RevC,Code474,474-00032
4. NOAATechnicalReportNESDIS143CrossTrackInfraredSounder(CrIS)SensorDataRecord(SDR)User’sGuide.Version1.0,Washington,D.C.,December,2013
NASASNPPCrossTrackInfraredSounderLevel1BSampleDataUsers’Guide
31
AppendixA:ExampleDataIngestCode
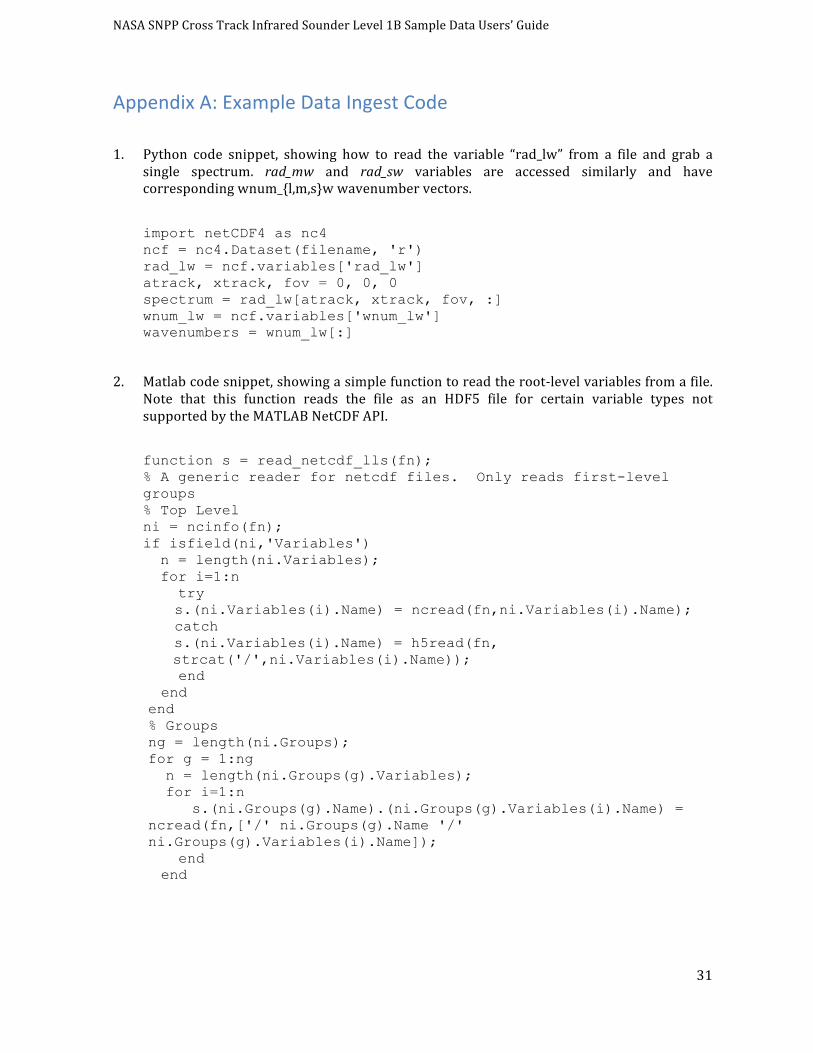
1. Python code snippet, showing how to read the variable “rad_lw” from a file and grab asingle spectrum. rad_mw and rad_sw variables are accessed similarly and havecorrespondingwnum_{l,m,s}wwavenumbervectors.
import netCDF4 as nc4 ncf = nc4.Dataset(filename, 'r') rad_lw = ncf.variables['rad_lw'] atrack, xtrack, fov = 0, 0, 0 spectrum = rad_lw[atrack, xtrack, fov, :] wnum_lw = ncf.variables['wnum_lw'] wavenumbers = wnum_lw[:]
2. Matlabcodesnippet,showingasimplefunctiontoreadtheroot-levelvariablesfromafile.Note that this function reads the file as an HDF5 file for certain variable types notsupportedbytheMATLABNetCDFAPI.
function s = read_netcdf_lls(fn); % A generic reader for netcdf files. Only reads first-level groups % Top Level ni = ncinfo(fn); if isfield(ni,'Variables') n = length(ni.Variables); for i=1:n try
s.(ni.Variables(i).Name) = ncread(fn,ni.Variables(i).Name); catch
s.(ni.Variables(i).Name) = h5read(fn, strcat('/',ni.Variables(i).Name));
end end
end % Groups ng = length(ni.Groups); for g = 1:ng n = length(ni.Groups(g).Variables); for i=1:n s.(ni.Groups(g).Name).(ni.Groups(g).Variables(i).Name) = ncread(fn,['/' ni.Groups(g).Name '/' ni.Groups(g).Variables(i).Name]);
end end
NASASNPPCrossTrackInfraredSounderLevel1BSampleDataUsers’Guide
32
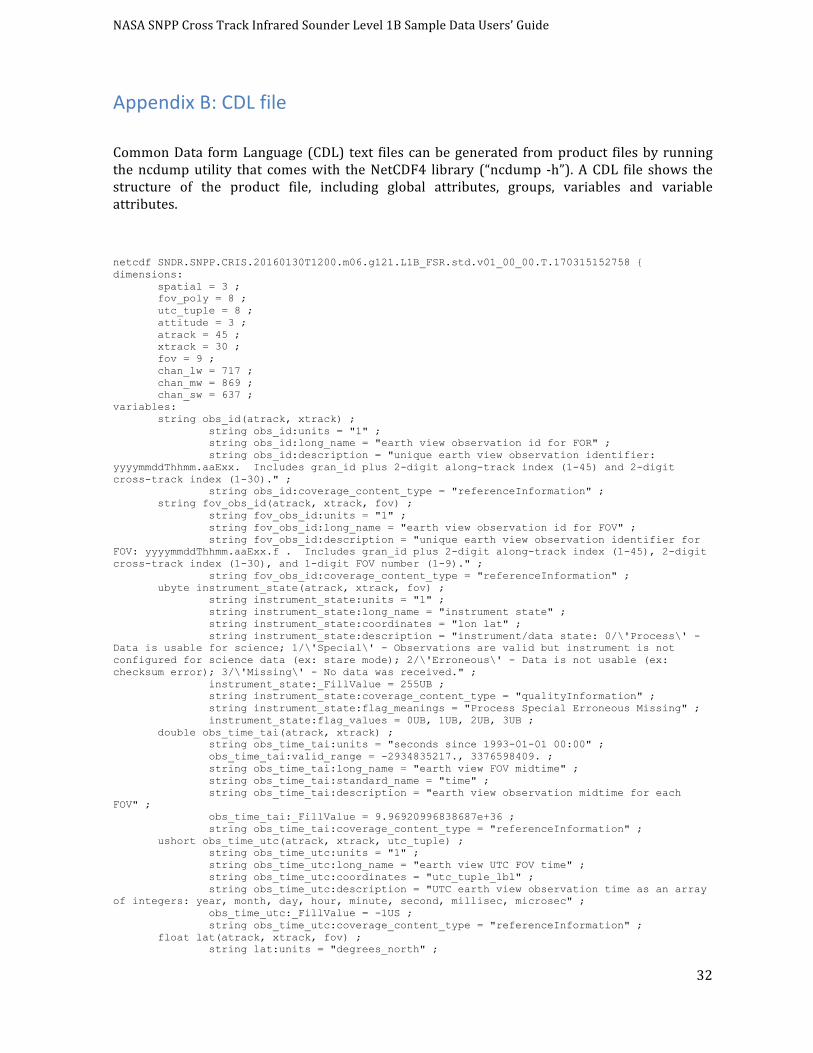
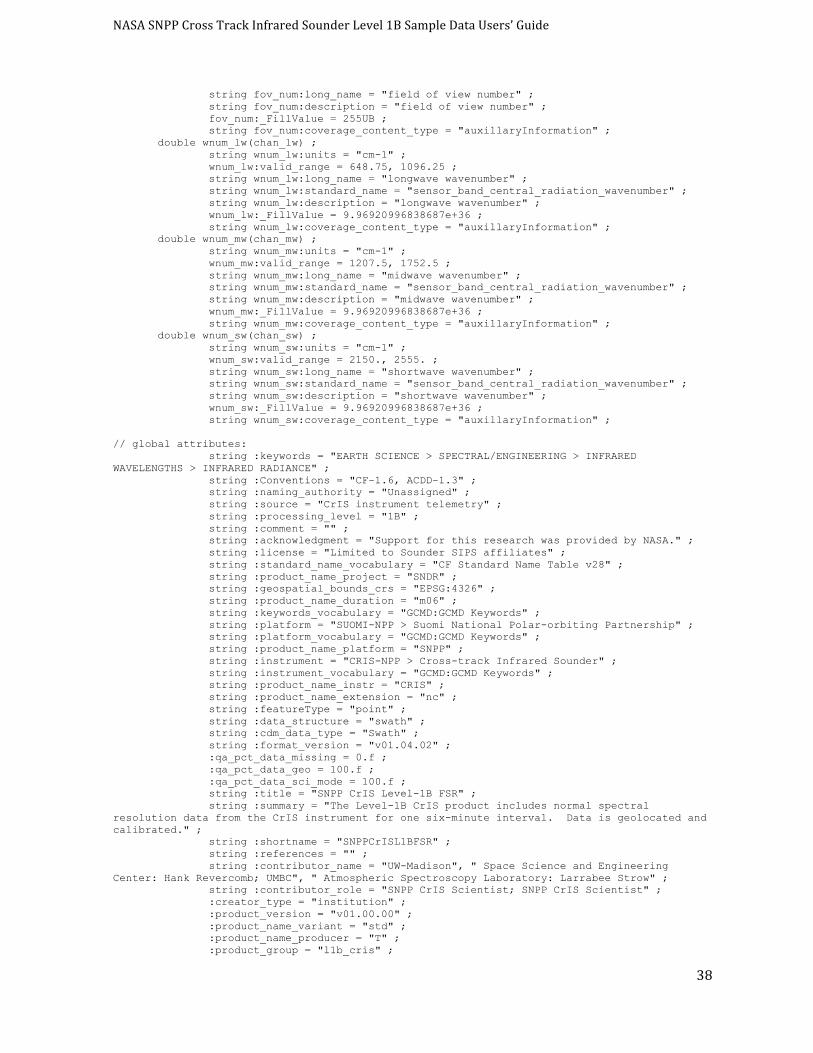
AppendixB:CDLfile
CommonData formLanguage(CDL) text filescanbegenerated fromproduct filesbyrunningthencdumputility that comeswith theNetCDF4 library (“ncdump -h”).ACDL file shows thestructure of the product file, including global attributes, groups, variables and variableattributes.
netcdf SNDR.SNPP.CRIS.20160130T1200.m06.g121.L1B_FSR.std.v01_00_00.T.170315152758 { dimensions: spatial = 3 ; fov_poly = 8 ; utc_tuple = 8 ; attitude = 3 ; atrack = 45 ; xtrack = 30 ; fov = 9 ; chan_lw = 717 ; chan_mw = 869 ; chan_sw = 637 ; variables: string obs_id(atrack, xtrack) ; string obs_id:units = "1" ; string obs_id:long_name = "earth view observation id for FOR" ; string obs_id:description = "unique earth view observation identifier: yyyymmddThhmm.aaExx. Includes gran_id plus 2-digit along-track index (1-45) and 2-digit cross-track index (1-30)." ; string obs_id:coverage_content_type = "referenceInformation" ; string fov_obs_id(atrack, xtrack, fov) ; string fov_obs_id:units = "1" ; string fov_obs_id:long_name = "earth view observation id for FOV" ; string fov_obs_id:description = "unique earth view observation identifier for FOV: yyyymmddThhmm.aaExx.f . Includes gran_id plus 2-digit along-track index (1-45), 2-digit cross-track index (1-30), and 1-digit FOV number (1-9)." ; string fov_obs_id:coverage_content_type = "referenceInformation" ; ubyte instrument_state(atrack, xtrack, fov) ; string instrument_state:units = "1" ; string instrument_state:long_name = "instrument state" ; string instrument_state:coordinates = "lon lat" ; string instrument_state:description = "instrument/data state: 0/\'Process\' - Data is usable for science; 1/\'Special\' - Observations are valid but instrument is not configured for science data (ex: stare mode); 2/\'Erroneous\' - Data is not usable (ex: checksum error); 3/\'Missing\' - No data was received." ; instrument_state:_FillValue = 255UB ; string instrument_state:coverage_content_type = "qualityInformation" ; string instrument_state:flag_meanings = "Process Special Erroneous Missing" ; instrument_state:flag_values = 0UB, 1UB, 2UB, 3UB ; double obs_time_tai(atrack, xtrack) ; string obs_time_tai:units = "seconds since 1993-01-01 00:00" ; obs_time_tai:valid_range = -2934835217., 3376598409. ; string obs_time_tai:long_name = "earth view FOV midtime" ; string obs_time_tai:standard_name = "time" ; string obs_time_tai:description = "earth view observation midtime for each FOV" ; obs_time_tai:_FillValue = 9.96920996838687e+36 ; string obs_time_tai:coverage_content_type = "referenceInformation" ; ushort obs_time_utc(atrack, xtrack, utc_tuple) ; string obs_time_utc:units = "1" ; string obs_time_utc:long_name = "earth view UTC FOV time" ; string obs_time_utc:coordinates = "utc_tuple_lbl" ; string obs_time_utc:description = "UTC earth view observation time as an array of integers: year, month, day, hour, minute, second, millisec, microsec" ; obs_time_utc:_FillValue = -1US ; string obs_time_utc:coverage_content_type = "referenceInformation" ; float lat(atrack, xtrack, fov) ; string lat:units = "degrees_north" ;
NASASNPPCrossTrackInfraredSounderLevel1BSampleDataUsers’Guide
33
lat:valid_range = -90.f, 90.f ; string lat:long_name = "latitude" ; string lat:standard_name = "latitude" ; string lat:description = "latitude of FOV center" ; lat:_FillValue = 9.96921e+36f ; string lat:coverage_content_type = "referenceInformation" ; string lat:bounds = "lat_bnds" ; float lat_geoid(atrack, xtrack, fov) ; string lat_geoid:units = "degrees_north" ; lat_geoid:valid_range = -90.f, 90.f ; string lat_geoid:long_name = "latitude" ; string lat_geoid:standard_name = "latitude" ; string lat_geoid:description = "latitude of FOV center on the geoid (without terrain correction)" ; lat_geoid:_FillValue = 9.96921e+36f ; string lat_geoid:coverage_content_type = "referenceInformation" ; float lon(atrack, xtrack, fov) ; string lon:units = "degrees_east" ; lon:valid_range = -180.f, 180.f ; string lon:long_name = "longitude" ; string lon:standard_name = "longitude" ; string lon:description = "longitude of FOV center" ; lon:_FillValue = 9.96921e+36f ; string lon:coverage_content_type = "referenceInformation" ; string lon:bounds = "lon_bnds" ; float lon_geoid(atrack, xtrack, fov) ; string lon_geoid:units = "degrees_east" ; lon_geoid:valid_range = -180.f, 180.f ; string lon_geoid:long_name = "longitude" ; string lon_geoid:standard_name = "longitude" ; string lon_geoid:description = "longitude of FOV center on the geoid (without terrain correction)" ; lon_geoid:_FillValue = 9.96921e+36f ; string lon_geoid:coverage_content_type = "referenceInformation" ; float lat_bnds(atrack, xtrack, fov, fov_poly) ; string lat_bnds:units = "degrees_north" ; lat_bnds:valid_range = -90.f, 90.f ; string lat_bnds:long_name = "FOV boundary latitudes" ; string lat_bnds:description = "latitudes of points forming a polygon around the perimeter of the FOV" ; lat_bnds:_FillValue = 9.96921e+36f ; string lat_bnds:coverage_content_type = "referenceInformation" ; float lon_bnds(atrack, xtrack, fov, fov_poly) ; string lon_bnds:units = "degrees_east" ; lon_bnds:valid_range = -180.f, 180.f ; string lon_bnds:long_name = "FOV boundary longitudes" ; string lon_bnds:description = "longitudes of points forming a polygon around the perimeter of the FOV" ; lon_bnds:_FillValue = 9.96921e+36f ; string lon_bnds:coverage_content_type = "referenceInformation" ; float land_frac(atrack, xtrack, fov) ; string land_frac:units = "1" ; land_frac:valid_range = 0.f, 1.f ; string land_frac:long_name = "land fraction" ; string land_frac:standard_name = "land_area_fraction" ; string land_frac:coordinates = "lon lat" ; string land_frac:description = "land fraction over the FOV" ; land_frac:_FillValue = 9.96921e+36f ; string land_frac:coverage_content_type = "referenceInformation" ; string land_frac:cell_methods = "area: mean (beam-weighted)" ; float surf_alt(atrack, xtrack, fov) ; string surf_alt:units = "m" ; string surf_alt:ancillary_variables = "surf_alt_sdev" ; surf_alt:valid_range = -500.f, 10000.f ; string surf_alt:long_name = "surface altitude" ; string surf_alt:standard_name = "surface_altitude" ; string surf_alt:coordinates = "lon lat" ; string surf_alt:description = "mean surface altitude wrt earth model over the FOV" ; surf_alt:_FillValue = 9.96921e+36f ; string surf_alt:coverage_content_type = "referenceInformation" ; string surf_alt:cell_methods = "area: mean (beam-weighted)" ;
NASASNPPCrossTrackInfraredSounderLevel1BSampleDataUsers’Guide
34
float surf_alt_sdev(atrack, xtrack, fov) ; string surf_alt_sdev:units = "m" ; surf_alt_sdev:valid_range = 0.f, 10000.f ; string surf_alt_sdev:long_name = "surface altitude standard deviation" ; string surf_alt_sdev:coordinates = "lon lat" ; string surf_alt_sdev:description = "standard deviation of surface altitude within the FOV" ; surf_alt_sdev:_FillValue = 9.96921e+36f ; string surf_alt_sdev:coverage_content_type = "qualityInformation" ; string surf_alt_sdev:cell_methods = "area: standard_deviation (beam-weighted)" ; float sun_glint_lat(atrack) ; string sun_glint_lat:units = "degrees_north" ; sun_glint_lat:valid_range = -90.f, 90.f ; string sun_glint_lat:long_name = "sun glint latitude" ; string sun_glint_lat:standard_name = "latitude" ; string sun_glint_lat:coordinates = "subsat_lon subsat_lat" ; string sun_glint_lat:description = "sun glint spot latitude at scan_mid_time. Fill for night observations." ; sun_glint_lat:_FillValue = 9.96921e+36f ; string sun_glint_lat:coverage_content_type = "referenceInformation" ; float sun_glint_lon(atrack) ; string sun_glint_lon:units = "degrees_east" ; sun_glint_lon:valid_range = -180.f, 180.f ; string sun_glint_lon:long_name = "sun glint longitude" ; string sun_glint_lon:standard_name = "longitude" ; string sun_glint_lon:coordinates = "subsat_lon subsat_lat" ; string sun_glint_lon:description = "sun glint spot longitude at scan_mid_time. Fill for night observations." ; sun_glint_lon:_FillValue = 9.96921e+36f ; string sun_glint_lon:coverage_content_type = "referenceInformation" ; float sol_zen(atrack, xtrack, fov) ; string sol_zen:units = "degree" ; sol_zen:valid_range = 0.f, 180.f ; string sol_zen:long_name = "solar zenith angle" ; string sol_zen:standard_name = "solar_zenith_angle" ; string sol_zen:coordinates = "lon lat" ; string sol_zen:description = "solar zenith angle at the center of the FOV" ; sol_zen:_FillValue = 9.96921e+36f ; string sol_zen:coverage_content_type = "referenceInformation" ; float sol_azi(atrack, xtrack, fov) ; string sol_azi:units = "degree" ; sol_azi:valid_range = 0.f, 360.f ; string sol_azi:long_name = "solar azimuth angle" ; string sol_azi:standard_name = "solar_azimuth_angle" ; string sol_azi:coordinates = "lon lat" ; string sol_azi:description = "solar azimuth angle at the center of the FOV" ; sol_azi:_FillValue = 9.96921e+36f ; string sol_azi:coverage_content_type = "referenceInformation" ; float sun_glint_dist(atrack, xtrack, fov) ; string sun_glint_dist:units = "m" ; sun_glint_dist:valid_range = 0.f, 30000.f ; string sun_glint_dist:long_name = "sun glint distance" ; string sun_glint_dist:coordinates = "lon lat" ; string sun_glint_dist:description = "distance of sun glint spot to the center of the FOV" ; sun_glint_dist:_FillValue = 9.96921e+36f ; string sun_glint_dist:coverage_content_type = "referenceInformation" ; float view_ang(atrack, xtrack, fov) ; string view_ang:units = "degree" ; view_ang:valid_range = 0.f, 180.f ; string view_ang:long_name = "view angle" ; string view_ang:standard_name = "sensor_view_angle" ; string view_ang:coordinates = "lon lat" ; string view_ang:description = "off nadir pointing angle" ; view_ang:_FillValue = 9.96921e+36f ; string view_ang:coverage_content_type = "referenceInformation" ; float sat_zen(atrack, xtrack, fov) ; string sat_zen:units = "degree" ; sat_zen:valid_range = 0.f, 180.f ; string sat_zen:long_name = "satellite zenith angle" ; string sat_zen:standard_name = "sensor_zenith_angle" ;
NASASNPPCrossTrackInfraredSounderLevel1BSampleDataUsers’Guide
35
string sat_zen:coordinates = "lon lat" ; string sat_zen:description = "satellite zenith angle at the center of the FOV" ; sat_zen:_FillValue = 9.96921e+36f ; string sat_zen:coverage_content_type = "referenceInformation" ; float sat_azi(atrack, xtrack, fov) ; string sat_azi:units = "degree" ; sat_azi:valid_range = 0.f, 360.f ; string sat_azi:long_name = "satellite azimuth angle" ; string sat_azi:standard_name = "sensor_azimuth_angle" ; string sat_azi:coordinates = "lon lat" ; string sat_azi:description = "satellite azimuth angle at the center of the FOV" ; sat_azi:_FillValue = 9.96921e+36f ; string sat_azi:coverage_content_type = "referenceInformation" ; float sat_range(atrack, xtrack, fov) ; string sat_range:units = "m" ; sat_range:valid_range = 100000.f, 1.e+07f ; string sat_range:long_name = "satellite range" ; string sat_range:coordinates = "lon lat" ; string sat_range:description = "line of sight distance between satellite and FOV center" ; sat_range:_FillValue = 9.96921e+36f ; string sat_range:coverage_content_type = "referenceInformation" ; ubyte asc_flag(atrack) ; string asc_flag:units = "1" ; asc_flag:valid_range = 0UB, 1UB ; string asc_flag:long_name = "ascending orbit flag" ; string asc_flag:coordinates = "subsat_lon subsat_lat" ; string asc_flag:description = "ascending orbit flag: 1 if ascending, 0 descending" ; asc_flag:_FillValue = 255UB ; string asc_flag:coverage_content_type = "referenceInformation" ; string asc_flag:flag_meanings = "descending ascending" ; asc_flag:flag_values = 0UB, 1UB ; float subsat_lat(atrack) ; string subsat_lat:units = "degrees_north" ; subsat_lat:valid_range = -90.f, 90.f ; string subsat_lat:long_name = "sub-satellite latitude" ; string subsat_lat:standard_name = "latitude" ; string subsat_lat:description = "sub-satellite latitude at scan_mid_time" ; subsat_lat:_FillValue = 9.96921e+36f ; string subsat_lat:coverage_content_type = "referenceInformation" ; float subsat_lon(atrack) ; string subsat_lon:units = "degrees_east" ; subsat_lon:valid_range = -180.f, 180.f ; string subsat_lon:long_name = "sub-satellite longitude" ; string subsat_lon:standard_name = "longitude" ; string subsat_lon:description = "sub-satellite longitude at scan_mid_time" ; subsat_lon:_FillValue = 9.96921e+36f ; string subsat_lon:coverage_content_type = "referenceInformation" ; double scan_mid_time(atrack) ; string scan_mid_time:units = "seconds since 1993-01-01 00:00" ; scan_mid_time:valid_range = -2934835217., 3376598409. ; string scan_mid_time:long_name = "midscan TAI93" ; string scan_mid_time:standard_name = "time" ; string scan_mid_time:coordinates = "subsat_lon subsat_lat" ; string scan_mid_time:description = "TAI93 at middle of earth scene scans" ; scan_mid_time:_FillValue = 9.96920996838687e+36 ; string scan_mid_time:coverage_content_type = "referenceInformation" ; float sat_alt(atrack) ; string sat_alt:units = "m" ; sat_alt:valid_range = 100000.f, 1000000.f ; string sat_alt:long_name = "satellite altitude" ; string sat_alt:standard_name = "altitude" ; string sat_alt:coordinates = "subsat_lon subsat_lat" ; string sat_alt:description = "satellite altitude with respect to earth model at scan_mid_time" ; sat_alt:_FillValue = 9.96921e+36f ; string sat_alt:coverage_content_type = "referenceInformation" ; float sat_pos(atrack, spatial) ; string sat_pos:units = "m" ;

NASASNPPCrossTrackInfraredSounderLevel1BSampleDataUsers’Guide
36
string sat_pos:long_name = "satellite position" ; string sat_pos:coordinates = "subsat_lon subsat_lat spatial_lbl" ; string sat_pos:description = "satellite ECR position at scan_mid_time" ; sat_pos:_FillValue = 9.96921e+36f ; string sat_pos:coverage_content_type = "referenceInformation" ; float sat_vel(atrack, spatial) ; string sat_vel:units = "m s-1" ; string sat_vel:long_name = "satellite velocity" ; string sat_vel:coordinates = "subsat_lon subsat_lat spatial_lbl" ; string sat_vel:description = "satellite ECR velocity at scan_mid_time" ; sat_vel:_FillValue = 9.96921e+36f ; string sat_vel:coverage_content_type = "referenceInformation" ; float sat_att(atrack, attitude) ; string sat_att:units = "degree" ; sat_att:valid_range = -180.f, 180.f ; string sat_att:long_name = "satellite attitude" ; string sat_att:coordinates = "subsat_lon subsat_lat angular_lbl" ; string sat_att:description = "satellite attitude at scan_mid_time. An orthogonal triad. First element is angle about the +x (roll) ORB axis. +x axis is positively oriented in the direction of orbital flight. Second element is angle about +y (pitch) ORB axis. +y axis is oriented normal to the orbit plane with the positive sense opposite to that of the orbit\'s angular momentum vector H. Third element is angle about +z (yaw) axis. +z axis is positively oriented Earthward parallel to the satellite radius vector R from the spacecraft center of mass to the center of the Earth." ; sat_att:_FillValue = 9.96921e+36f ; string sat_att:coverage_content_type = "referenceInformation" ; string attitude_lbl(attitude) ; string attitude_lbl:long_name = "rotational direction" ; string attitude_lbl:description = "list of rotational directions (roll, pitch, yaw)" ; string attitude_lbl:coverage_content_type = "auxillaryInformation" ; string spatial_lbl(spatial) ; string spatial_lbl:long_name = "spatial direction" ; string spatial_lbl:description = "list of spatial directions (X, Y, Z)" ; string spatial_lbl:coverage_content_type = "auxillaryInformation" ; string utc_tuple_lbl(utc_tuple) ; string utc_tuple_lbl:long_name = "UTC date/time parts" ; string utc_tuple_lbl:description = "names of the elements of UTC when it is expressed as an array of integers year,month,day,hour,minute,second,millisecond,microsecond" ; string utc_tuple_lbl:coverage_content_type = "auxillaryInformation" ; float rad_lw(atrack, xtrack, fov, chan_lw) ; string rad_lw:units = "mW/(m2 sr cm-1)" ; string rad_lw:long_name = "longwave real spectral radiance" ; string rad_lw:standard_name = "toa_outgoing_radiance_per_unit_wavenumber" ; string rad_lw:coordinates = "lon lat" ; string rad_lw:description = "longwave real spectral radiance" ; rad_lw:_FillValue = 9.96921e+36f ; string rad_lw:coverage_content_type = "physicalMeasurement" ; float rad_mw(atrack, xtrack, fov, chan_mw) ; string rad_mw:units = "mW/(m2 sr cm-1)" ; string rad_mw:long_name = "midwave real spectral radiance" ; string rad_mw:standard_name = "toa_outgoing_radiance_per_unit_wavenumber" ; string rad_mw:coordinates = "lon lat" ; string rad_mw:description = "midwave real spectral radiance" ; rad_mw:_FillValue = 9.96921e+36f ; string rad_mw:coverage_content_type = "physicalMeasurement" ; float rad_sw(atrack, xtrack, fov, chan_sw) ; string rad_sw:units = "mW/(m2 sr cm-1)" ; string rad_sw:long_name = "shortwave real spectral radiance" ; string rad_sw:standard_name = "toa_outgoing_radiance_per_unit_wavenumber" ; string rad_sw:coordinates = "lon lat" ; string rad_sw:description = "shortwave real spectral radiance" ; rad_sw:_FillValue = 9.96921e+36f ; string rad_sw:coverage_content_type = "physicalMeasurement" ; int64 l1b_qual(atrack, xtrack, fov) ; string l1b_qual:units = "1" ; l1b_qual:valid_range = -9223372036854775808L, 9223372036854775806L ; string l1b_qual:long_name = "L1B quality flags" ; string l1b_qual:coordinates = "lon lat" ; string l1b_qual:description = "per-observation L1B product quality" ; l1b_qual:_FillValue = -1L ;
NASASNPPCrossTrackInfraredSounderLevel1BSampleDataUsers’Guide
37
string l1b_qual:coverage_content_type = "qualityInformation" ; string l1b_qual:flag_meanings = "lw_quality_degraded lw_quality_invalid mw_quality_degraded mw_quality_invalid sw_quality_degraded sw_quality_invalid geo_quality_invalid lw_rad_cal_qual_degraded lw_rad_cal_qual_invalid mw_rad_cal_qual_degraded mw_rad_cal_qual_invalid sw_rad_cal_qual_degraded sw_rad_cal_qual_invalid lw_spectral_cal_qual_degraded lw_spectral_cal_qual_invalid mw_spectral_cal_qual_degraded mw_spectral_cal_qual_invalid sw_spectral_cal_qual_degraded sw_spectral_cal_qual_invalid lw_imag_rad_anomaly mw_imag_rad_anomaly sw_imag_rad_anomaly lw_lunar_intrusion mw_lunar_intrusion sw_lunar_intrusion inv_instrument_temp excess_temp_drift neon_cal_quality_flag isa_degraded_flag l1a_lw_missing_es l1a_mw_missing_es l1a_sw_missing_es l1a_bit_trim_mismatch l1a_eight_sec_missing" ; l1b_qual:flag_masks = 3L, 3L, 12L, 12L, 48L, 48L, 64L, 384L, 384L, 1536L, 1536L, 6144L, 6144L, 24576L, 24576L, 98304L, 98304L, 393216L, 393216L, 524288L, 1048576L, 2097152L, 4194304L, 8388608L, 16777216L, 33554432L, 67108864L, 536870912L, 1073741824L, 281474976710656L, 562949953421312L, 1125899906842624L, 2251799813685248L, 4503599627370496L ; l1b_qual:flag_values = 1L, 2L, 4L, 8L, 16L, 32L, 64L, 128L, 256L, 512L, 1024L, 2048L, 4096L, 8192L, 16384L, 32768L, 65536L, 131072L, 262144L, 524288L, 1048576L, 2097152L, 4194304L, 8388608L, 16777216L, 33554432L, 67108864L, 268435456L, 536870912L, 1073741824L, 281474976710656L, 562949953421312L, 1125899906842624L, 2251799813685248L, 4503599627370496L ; int64 geo_qual(atrack, xtrack, fov) ; string geo_qual:units = "1" ; geo_qual:valid_range = -9223372036854775808L, 9223372036854775806L ; string geo_qual:long_name = "geolocation quality flags" ; string geo_qual:coordinates = "lon lat" ; string geo_qual:description = "per-observation L1B geolocation quality" ; geo_qual:_FillValue = -1L ; string geo_qual:coverage_content_type = "qualityInformation" ; string geo_qual:flag_meanings = "obs_time_missing servo_error_missing scd_gap_sm scd_gap_md scd_gap_lg stale_utcpole" ; geo_qual:flag_masks = 1L, 2L, 12L, 12L, 12L, 16L ; geo_qual:flag_values = 1L, 2L, 4L, 8L, 12L, 16L ; float nedn_lw(fov, chan_lw) ; string nedn_lw:units = "mW/(m2 sr cm-1)" ; string nedn_lw:long_name = "longwave noise equivalent differential radiance" ; string nedn_lw:description = "longwave noise equivalent differential radiance" ; nedn_lw:_FillValue = 9.96921e+36f ; string nedn_lw:coverage_content_type = "qualityInformation" ; float nedn_mw(fov, chan_mw) ; string nedn_mw:units = "mW/(m2 sr cm-1)" ; string nedn_mw:long_name = "midwave noise equivalent differential radiance" ; string nedn_mw:description = "midwave noise equivalent differential radiance" ; nedn_mw:_FillValue = 9.96921e+36f ; string nedn_mw:coverage_content_type = "qualityInformation" ; float nedn_sw(fov, chan_sw) ; string nedn_sw:units = "mW/(m2 sr cm-1)" ; string nedn_sw:long_name = "shortwave noise equivalent differential radiance" ; string nedn_sw:description = "shortwave noise equivalent differential radiance" ; nedn_sw:_FillValue = 9.96921e+36f ; string nedn_sw:coverage_content_type = "qualityInformation" ; ubyte scan_sweep_dir(xtrack) ; string scan_sweep_dir:units = "1" ; scan_sweep_dir:valid_range = 0UB, 1UB ; string scan_sweep_dir:long_name = "sweep direction of FOVs within a scan" ; string scan_sweep_dir:description = "sweep direction of FOVs within a scan" ; scan_sweep_dir:_FillValue = 255UB ; string scan_sweep_dir:coverage_content_type = "auxillaryInformation" ; string scan_sweep_dir:flag_meanings = "forward reverse" ; scan_sweep_dir:flag_values = 0UB, 1UB ; ubyte for_num(xtrack) ; string for_num:units = "1" ; for_num:valid_range = 1UB, 30UB ; string for_num:long_name = "field of regard number" ; string for_num:description = "field of regard number" ; for_num:_FillValue = 255UB ; string for_num:coverage_content_type = "auxillaryInformation" ; ubyte fov_num(fov) ; string fov_num:units = "1" ; fov_num:valid_range = 1UB, 9UB ;
NASASNPPCrossTrackInfraredSounderLevel1BSampleDataUsers’Guide
38
string fov_num:long_name = "field of view number" ; string fov_num:description = "field of view number" ; fov_num:_FillValue = 255UB ; string fov_num:coverage_content_type = "auxillaryInformation" ; double wnum_lw(chan_lw) ; string wnum_lw:units = "cm-1" ; wnum_lw:valid_range = 648.75, 1096.25 ; string wnum_lw:long_name = "longwave wavenumber" ; string wnum_lw:standard_name = "sensor_band_central_radiation_wavenumber" ; string wnum_lw:description = "longwave wavenumber" ; wnum_lw:_FillValue = 9.96920996838687e+36 ; string wnum_lw:coverage_content_type = "auxillaryInformation" ; double wnum_mw(chan_mw) ; string wnum_mw:units = "cm-1" ; wnum_mw:valid_range = 1207.5, 1752.5 ; string wnum_mw:long_name = "midwave wavenumber" ; string wnum_mw:standard_name = "sensor_band_central_radiation_wavenumber" ; string wnum_mw:description = "midwave wavenumber" ; wnum_mw:_FillValue = 9.96920996838687e+36 ; string wnum_mw:coverage_content_type = "auxillaryInformation" ; double wnum_sw(chan_sw) ; string wnum_sw:units = "cm-1" ; wnum_sw:valid_range = 2150., 2555. ; string wnum_sw:long_name = "shortwave wavenumber" ; string wnum_sw:standard_name = "sensor_band_central_radiation_wavenumber" ; string wnum_sw:description = "shortwave wavenumber" ; wnum_sw:_FillValue = 9.96920996838687e+36 ; string wnum_sw:coverage_content_type = "auxillaryInformation" ; // global attributes: string :keywords = "EARTH SCIENCE > SPECTRAL/ENGINEERING > INFRARED WAVELENGTHS > INFRARED RADIANCE" ; string :Conventions = "CF-1.6, ACDD-1.3" ; string :naming_authority = "Unassigned" ; string :source = "CrIS instrument telemetry" ; string :processing_level = "1B" ; string :comment = "" ; string :acknowledgment = "Support for this research was provided by NASA." ; string :license = "Limited to Sounder SIPS affiliates" ; string :standard_name_vocabulary = "CF Standard Name Table v28" ; string :product_name_project = "SNDR" ; string :geospatial_bounds_crs = "EPSG:4326" ; string :product_name_duration = "m06" ; string :keywords_vocabulary = "GCMD:GCMD Keywords" ; string :platform = "SUOMI-NPP > Suomi National Polar-orbiting Partnership" ; string :platform_vocabulary = "GCMD:GCMD Keywords" ; string :product_name_platform = "SNPP" ; string :instrument = "CRIS-NPP > Cross-track Infrared Sounder" ; string :instrument_vocabulary = "GCMD:GCMD Keywords" ; string :product_name_instr = "CRIS" ; string :product_name_extension = "nc" ; string :featureType = "point" ; string :data_structure = "swath" ; string :cdm_data_type = "Swath" ; string :format_version = "v01.04.02" ; :qa_pct_data_missing = 0.f ; :qa_pct_data_geo = 100.f ; :qa_pct_data_sci_mode = 100.f ; string :title = "SNPP CrIS Level-1B FSR" ; string :summary = "The Level-1B CrIS product includes normal spectral resolution data from the CrIS instrument for one six-minute interval. Data is geolocated and calibrated." ; string :shortname = "SNPPCrISL1BFSR" ; string :references = "" ; string :contributor_name = "UW-Madison", " Space Science and Engineering Center: Hank Revercomb; UMBC", " Atmospheric Spectroscopy Laboratory: Larrabee Strow" ; string :contributor_role = "SNPP CrIS Scientist; SNPP CrIS Scientist" ; :creator_type = "institution" ; :product_version = "v01.00.00" ; :product_name_variant = "std" ; :product_name_producer = "T" ; :product_group = "l1b_cris" ;
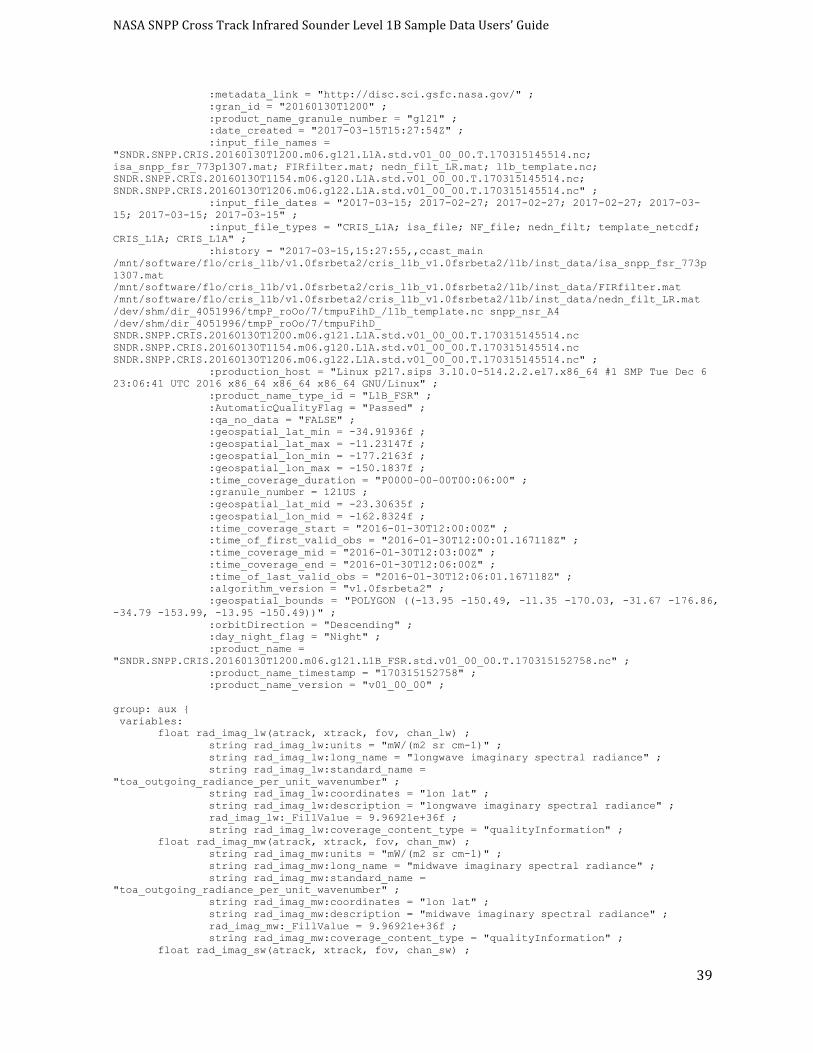
NASASNPPCrossTrackInfraredSounderLevel1BSampleDataUsers’Guide
39
:metadata_link = "http://disc.sci.gsfc.nasa.gov/" ; :gran_id = "20160130T1200" ; :product_name_granule_number = "g121" ; :date_created = "2017-03-15T15:27:54Z" ; :input_file_names = "SNDR.SNPP.CRIS.20160130T1200.m06.g121.L1A.std.v01_00_00.T.170315145514.nc; isa_snpp_fsr_773p1307.mat; FIRfilter.mat; nedn_filt_LR.mat; l1b_template.nc; SNDR.SNPP.CRIS.20160130T1154.m06.g120.L1A.std.v01_00_00.T.170315145514.nc; SNDR.SNPP.CRIS.20160130T1206.m06.g122.L1A.std.v01_00_00.T.170315145514.nc" ; :input_file_dates = "2017-03-15; 2017-02-27; 2017-02-27; 2017-02-27; 2017-03-15; 2017-03-15; 2017-03-15" ; :input_file_types = "CRIS_L1A; isa_file; NF_file; nedn_filt; template_netcdf; CRIS_L1A; CRIS_L1A" ; :history = "2017-03-15,15:27:55,,ccast_main /mnt/software/flo/cris_l1b/v1.0fsrbeta2/cris_l1b_v1.0fsrbeta2/l1b/inst_data/isa_snpp_fsr_773p1307.mat /mnt/software/flo/cris_l1b/v1.0fsrbeta2/cris_l1b_v1.0fsrbeta2/l1b/inst_data/FIRfilter.mat /mnt/software/flo/cris_l1b/v1.0fsrbeta2/cris_l1b_v1.0fsrbeta2/l1b/inst_data/nedn_filt_LR.mat /dev/shm/dir_4051996/tmpP_roOo/7/tmpuFihD_/l1b_template.nc snpp_nsr_A4 /dev/shm/dir_4051996/tmpP_roOo/7/tmpuFihD_ SNDR.SNPP.CRIS.20160130T1200.m06.g121.L1A.std.v01_00_00.T.170315145514.nc SNDR.SNPP.CRIS.20160130T1154.m06.g120.L1A.std.v01_00_00.T.170315145514.nc SNDR.SNPP.CRIS.20160130T1206.m06.g122.L1A.std.v01_00_00.T.170315145514.nc" ; :production_host = "Linux p217.sips 3.10.0-514.2.2.el7.x86_64 #1 SMP Tue Dec 6 23:06:41 UTC 2016 x86_64 x86_64 x86_64 GNU/Linux" ; :product_name_type_id = "L1B_FSR" ; :AutomaticQualityFlag = "Passed" ; :qa_no_data = "FALSE" ; :geospatial_lat_min = -34.91936f ; :geospatial_lat_max = -11.23147f ; :geospatial_lon_min = -177.2163f ; :geospatial_lon_max = -150.1837f ; :time_coverage_duration = "P0000-00-00T00:06:00" ; :granule_number = 121US ; :geospatial_lat_mid = -23.30635f ; :geospatial_lon_mid = -162.8324f ; :time_coverage_start = "2016-01-30T12:00:00Z" ; :time_of_first_valid_obs = "2016-01-30T12:00:01.167118Z" ; :time_coverage_mid = "2016-01-30T12:03:00Z" ; :time_coverage_end = "2016-01-30T12:06:00Z" ; :time_of_last_valid_obs = "2016-01-30T12:06:01.167118Z" ; :algorithm_version = "v1.0fsrbeta2" ; :geospatial_bounds = "POLYGON ((-13.95 -150.49, -11.35 -170.03, -31.67 -176.86, -34.79 -153.99, -13.95 -150.49))" ; :orbitDirection = "Descending" ; :day_night_flag = "Night" ; :product_name = "SNDR.SNPP.CRIS.20160130T1200.m06.g121.L1B_FSR.std.v01_00_00.T.170315152758.nc" ; :product_name_timestamp = "170315152758" ; :product_name_version = "v01_00_00" ; group: aux { variables: float rad_imag_lw(atrack, xtrack, fov, chan_lw) ; string rad_imag_lw:units = "mW/(m2 sr cm-1)" ; string rad_imag_lw:long_name = "longwave imaginary spectral radiance" ; string rad_imag_lw:standard_name = "toa_outgoing_radiance_per_unit_wavenumber" ; string rad_imag_lw:coordinates = "lon lat" ; string rad_imag_lw:description = "longwave imaginary spectral radiance" ; rad_imag_lw:_FillValue = 9.96921e+36f ; string rad_imag_lw:coverage_content_type = "qualityInformation" ; float rad_imag_mw(atrack, xtrack, fov, chan_mw) ; string rad_imag_mw:units = "mW/(m2 sr cm-1)" ; string rad_imag_mw:long_name = "midwave imaginary spectral radiance" ; string rad_imag_mw:standard_name = "toa_outgoing_radiance_per_unit_wavenumber" ; string rad_imag_mw:coordinates = "lon lat" ; string rad_imag_mw:description = "midwave imaginary spectral radiance" ; rad_imag_mw:_FillValue = 9.96921e+36f ; string rad_imag_mw:coverage_content_type = "qualityInformation" ; float rad_imag_sw(atrack, xtrack, fov, chan_sw) ;

NASASNPPCrossTrackInfraredSounderLevel1BSampleDataUsers’Guide
40
string rad_imag_sw:units = "mW/(m2 sr cm-1)" ; string rad_imag_sw:long_name = "shortwave imaginary spectral radiance" ; string rad_imag_sw:standard_name = "toa_outgoing_radiance_per_unit_wavenumber" ; string rad_imag_sw:coordinates = "lon lat" ; string rad_imag_sw:description = "shortwave imaginary spectral radiance" ; rad_imag_sw:_FillValue = 9.96921e+36f ; string rad_imag_sw:coverage_content_type = "qualityInformation" ; double max_opd_lw ; string max_opd_lw:units = "cm" ; string max_opd_lw:long_name = "maximum longwave optical path difference" ; string max_opd_lw:description = "maximum longwave optical path difference" ; max_opd_lw:_FillValue = 9.96920996838687e+36 ; string max_opd_lw:coverage_content_type = "qualityInformation" ; double max_opd_mw ; string max_opd_mw:units = "cm" ; string max_opd_mw:long_name = "maximum midwave optical path difference" ; string max_opd_mw:description = "maximum midwave optical path difference" ; max_opd_mw:_FillValue = 9.96920996838687e+36 ; string max_opd_mw:coverage_content_type = "qualityInformation" ; double max_opd_sw ; string max_opd_sw:units = "cm" ; string max_opd_sw:long_name = "maximum shortwave optical path difference" ; string max_opd_sw:description = "maximum shortwave optical path difference" ; max_opd_sw:_FillValue = 9.96920996838687e+36 ; string max_opd_sw:coverage_content_type = "qualityInformation" ; short spectral_fold_point_lw ; string spectral_fold_point_lw:units = "1" ; string spectral_fold_point_lw:long_name = "longwave spectral folding index" ; string spectral_fold_point_lw:description = "one-based index for unfolding uncalibrated longwave spectrum into ascending wavenumbers" ; spectral_fold_point_lw:_FillValue = -32767s ; string spectral_fold_point_lw:coverage_content_type = "auxillaryInformation" ; short spectral_fold_point_mw ; string spectral_fold_point_mw:units = "1" ; string spectral_fold_point_mw:long_name = "midwave spectral folding index" ; string spectral_fold_point_mw:description = "one-based index for unfolding uncalibrated midwave spectrum into ascending wavenumbers" ; spectral_fold_point_mw:_FillValue = -32767s ; string spectral_fold_point_mw:coverage_content_type = "auxillaryInformation" ; short spectral_fold_point_sw ; string spectral_fold_point_sw:units = "1" ; string spectral_fold_point_sw:long_name = "shortwave spectral folding index" ; string spectral_fold_point_sw:description = "one-based index for unfolding uncalibrated shortwave spectrum into ascending wavenumbers" ; spectral_fold_point_sw:_FillValue = -32767s ; string spectral_fold_point_sw:coverage_content_type = "auxillaryInformation" ; double measured_laser_wlen ; string measured_laser_wlen:units = "nm" ; measured_laser_wlen:valid_range = 695., 850. ; string measured_laser_wlen:long_name = "measured metrology laser half-wavelengths" ; string measured_laser_wlen:description = "measured metrology laser half-wavelengths" ; measured_laser_wlen:_FillValue = 9.96920996838687e+36 ; string measured_laser_wlen:coverage_content_type = "qualityInformation" ; double smoothed_laser_wlen ; string smoothed_laser_wlen:units = "nm" ; string smoothed_laser_wlen:long_name = "smoothed metrology laser half-wavelengths" ; string smoothed_laser_wlen:description = "smoothed metrology laser half-wavelengths" ; smoothed_laser_wlen:_FillValue = 9.96920996838687e+36 ; string smoothed_laser_wlen:coverage_content_type = "qualityInformation" ; double smoothed_neon_wlen ; string smoothed_neon_wlen:units = "nm" ; string smoothed_neon_wlen:long_name = "smoothed neon laser half-wavelengths" ; string smoothed_neon_wlen:description = "smoothed neon laser half-wavelengths" ; smoothed_neon_wlen:_FillValue = 9.96920996838687e+36 ; string smoothed_neon_wlen:coverage_content_type = "qualityInformation" ; double neon_wlen ;

NASASNPPCrossTrackInfraredSounderLevel1BSampleDataUsers’Guide
41
string neon_wlen:units = "nm" ; string neon_wlen:long_name = "neon laser half-wavelengths" ; string neon_wlen:description = "neon laser half-wavelengths" ; neon_wlen:_FillValue = 9.96920996838687e+36 ; string neon_wlen:coverage_content_type = "qualityInformation" ; } // group aux }
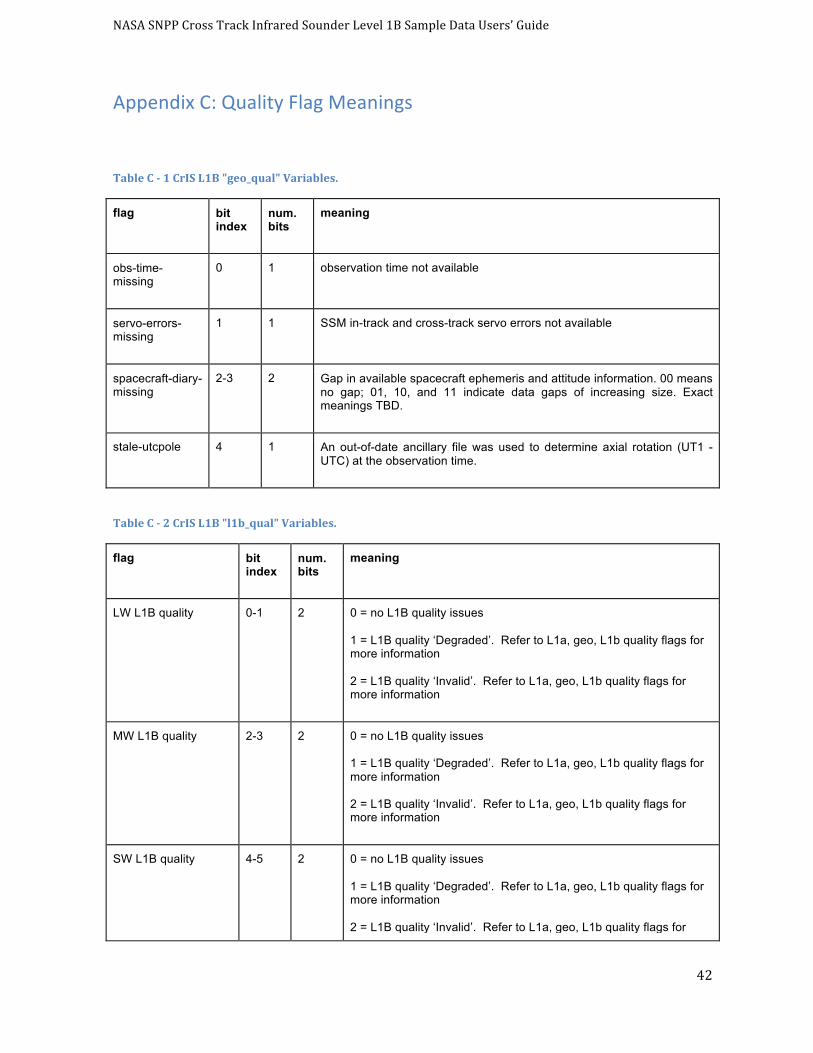
NASASNPPCrossTrackInfraredSounderLevel1BSampleDataUsers’Guide
42
AppendixC:QualityFlagMeanings
TableC-1CrISL1B"geo_qual"Variables.
flag bit index
num. bits
meaning
obs-time-missing
0 1 observation time not available
servo-errors-missing
1 1 SSM in-track and cross-track servo errors not available
spacecraft-diary-missing
2-3 2 Gap in available spacecraft ephemeris and attitude information. 00 means no gap; 01, 10, and 11 indicate data gaps of increasing size. Exact meanings TBD.
stale-utcpole 4 1 An out-of-date ancillary file was used to determine axial rotation (UT1 - UTC) at the observation time.
TableC-2CrISL1B"l1b_qual"Variables.
flag bit index
num. bits
meaning
LW L1B quality 0-1 2 0 = no L1B quality issues
1 = L1B quality ‘Degraded’. Refer to L1a, geo, L1b quality flags for more information
2 = L1B quality ‘Invalid’. Refer to L1a, geo, L1b quality flags for more information
MW L1B quality 2-3 2 0 = no L1B quality issues
1 = L1B quality ‘Degraded’. Refer to L1a, geo, L1b quality flags for more information
2 = L1B quality ‘Invalid’. Refer to L1a, geo, L1b quality flags for more information
SW L1B quality 4-5 2 0 = no L1B quality issues
1 = L1B quality ‘Degraded’. Refer to L1a, geo, L1b quality flags for more information
2 = L1B quality ‘Invalid’. Refer to L1a, geo, L1b quality flags for
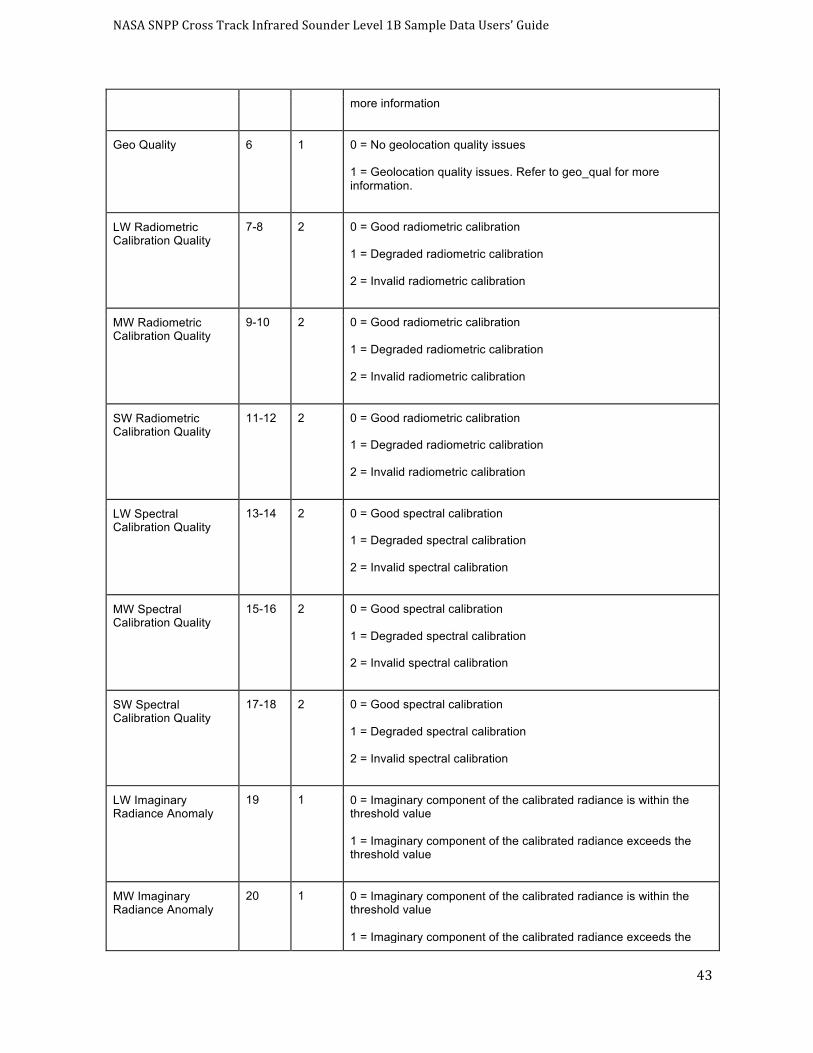
NASASNPPCrossTrackInfraredSounderLevel1BSampleDataUsers’Guide
43
more information
Geo Quality 6 1 0 = No geolocation quality issues
1 = Geolocation quality issues. Refer to geo_qual for more information.
LW Radiometric Calibration Quality
7-8 2 0 = Good radiometric calibration
1 = Degraded radiometric calibration
2 = Invalid radiometric calibration
MW Radiometric Calibration Quality
9-10 2 0 = Good radiometric calibration
1 = Degraded radiometric calibration
2 = Invalid radiometric calibration
SW Radiometric Calibration Quality
11-12 2 0 = Good radiometric calibration
1 = Degraded radiometric calibration
2 = Invalid radiometric calibration
LW Spectral Calibration Quality
13-14 2 0 = Good spectral calibration
1 = Degraded spectral calibration
2 = Invalid spectral calibration
MW Spectral Calibration Quality
15-16 2 0 = Good spectral calibration
1 = Degraded spectral calibration
2 = Invalid spectral calibration
SW Spectral Calibration Quality
17-18 2 0 = Good spectral calibration
1 = Degraded spectral calibration
2 = Invalid spectral calibration
LW Imaginary Radiance Anomaly
19 1 0 = Imaginary component of the calibrated radiance is within the threshold value
1 = Imaginary component of the calibrated radiance exceeds the threshold value
MW Imaginary Radiance Anomaly
20 1 0 = Imaginary component of the calibrated radiance is within the threshold value
1 = Imaginary component of the calibrated radiance exceeds the

NASASNPPCrossTrackInfraredSounderLevel1BSampleDataUsers’Guide
44
threshold value
SW Imaginary Radiance Anomaly
21 1 0 = Imaginary component of the calibrated radiance is within the threshold value
1 = Imaginary component of the calibrated radiance exceeds the threshold value
LW Lunar Intrusion Detected
22 1 0 = No DS views affected by lunar intrusion
1 = At least one DS view is affected by lunar intrusion within the moving window
MW Lunar Intrusion Detected
23 1 0 = No DS views affected by lunar intrusion
1 = At least one DS view is affected by lunar intrusion within the moving window
SW Lunar Intrusion Detected
24 1 0 = No DS views affected by lunar intrusion
1 = At least one DS view is affected by lunar intrusion within the moving window
Invalid Instrument Temperature
25 1 0 = All instrument temperatures within respective thresholds
1 = Instrument temperature outside of respective threshold
Excess Thermal Drift 26 1 0 = No excess thermal drift of instrument temperatures
1 = Thermal drift between measurements exceeds respective threshold
FCE Detected 27 1 0 = No fringe count error detected
1 = Fringe count error detected
Not Implemented for this version
FCE Correction Failed 28 1 0 = FCE correction successful
1 = FCE correction failed
Not implemented for this version
Neon Calibration Quality
29 1 0 = Less than 25% of the neon calibration dataset varied from the mean by greater than the 28ppm threshold
1 = 25% or greater of the neon calibration dataset varied from the mean by greater than the 28ppm threshold
ISA Degraded 30 1 0 = Current laser wavenumber value differs by less than 15 ppm with respect to the laser wavenumber used to calculate the ISA

NASASNPPCrossTrackInfraredSounderLevel1BSampleDataUsers’Guide
45
matrices
1 = Current laser wavenumber value differs by 15 ppm or greater with respect to the laser wavenumber used to calculate the ISA matrices
Spare 31-47 17 Unassigned
LW L1a ES Missing 48 1 Replicated from ES/l1a_qual lw-missing
MW L1a ES Missing 49 1 Replicated from ES/l1a_qual mw-missing
SW L1a ES Missing 50 1 Replicated from ES/l1a_qual sw-missing
Bit Trim Mismatch 51 1 Replicated from ES/l1a_qual bit-trim-mismatch
Scan Line Missing 8 Sec Sci
52 1 Replicated from ES/l1a_qual scan-line-missing-8sec-sci
Spare 53-63 11 Unassigned
Related Documents