Multiple Indicator Cluster Surveys Survey Design Workshop Fieldwork: Survey Quality Control MICS Survey Design Workshop

Multiple Indicator Cluster Surveys Survey Design Workshop Fieldwork: Survey Quality Control MICS Survey Design Workshop.
Dec 16, 2015
Welcome message from author
This document is posted to help you gain knowledge. Please leave a comment to let me know what you think about it! Share it to your friends and learn new things together.
Transcript

Multiple Indicator Cluster SurveysSurvey Design Workshop
Fieldwork:Survey Quality Control
MICS Survey Design Workshop
Objectives
• Identify factors affecting the accuracy and reliability of survey data
• How to prevent and correct errors
• The essential role of supervision in the field and providing feedback to the team
Accuracy and reliability
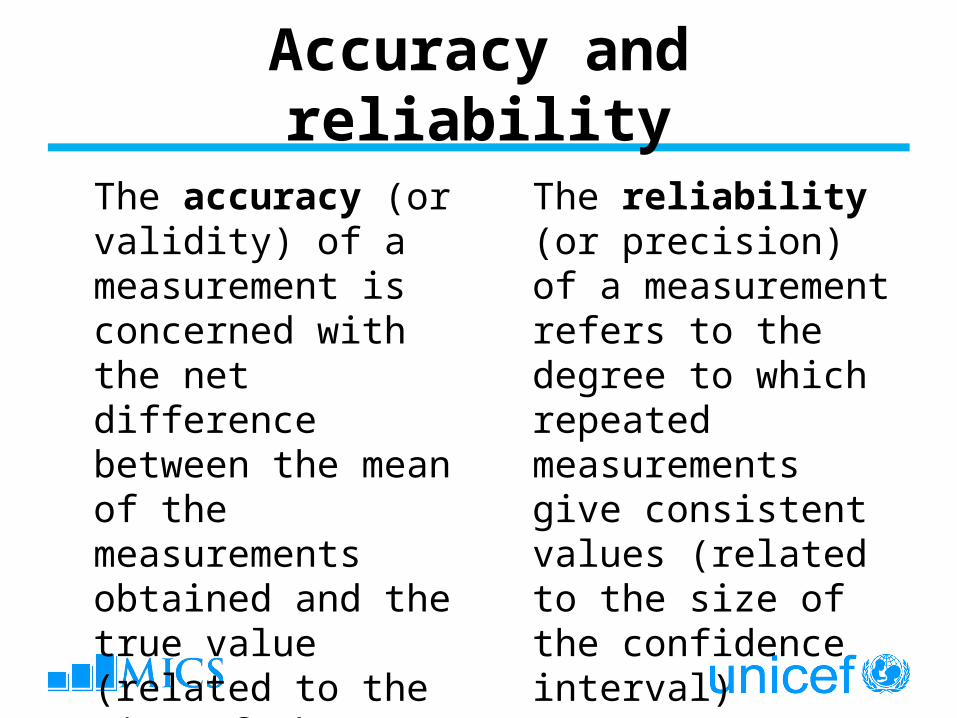
The accuracy (or validity) of a measurement is concerned with the net difference between the mean of the measurements obtained and the true value (related to the size of the bias)
The reliability (or precision) of a measurement refers to the degree to which repeated measurements give consistent values (related to the size of the confidence interval)
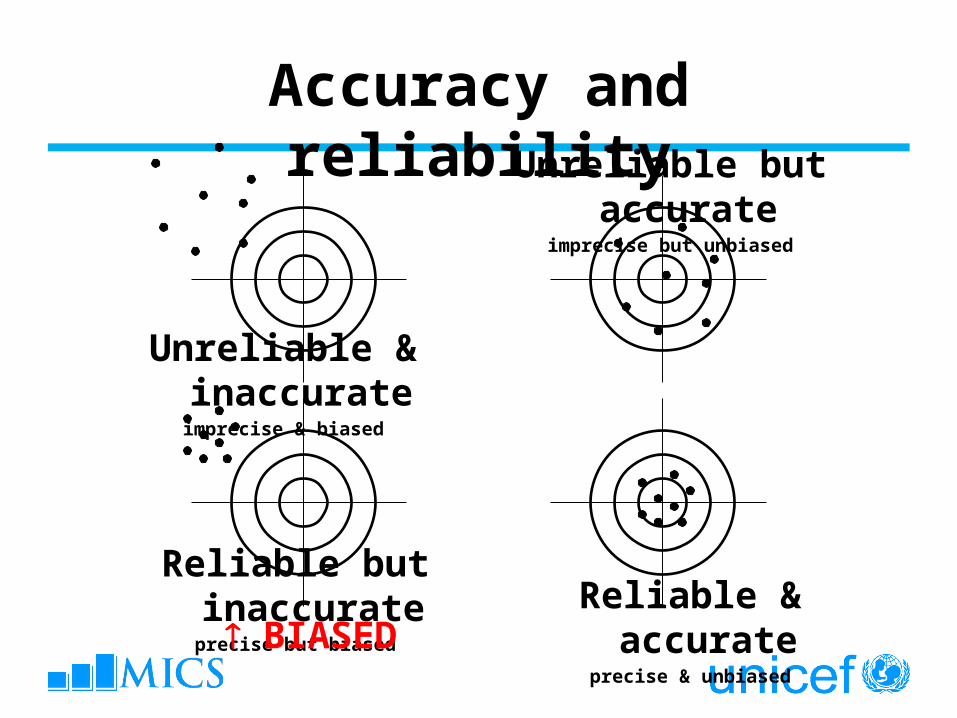
Accuracy and reliability
Reliable & accurateprecise & unbiased
Unreliable & inaccurateimprecise & biased
Reliable but inaccurateprecise but biased
Unreliable but accurateimprecise but unbiased
BIASED
Overview of presentation
• Data collection• Field supervision
Data Collection
• Organisation of daily work, • Security of staff and equipment
Data Collection: Implementation of sample
• Non-response: failure to obtain information for selected households, eligible women, or children
• A potentially serious bias that can be minimized • Interviewers will need to make return visits to
households (call-backs)
1. Interviewer is unable to do the selected household
2. Interviewer unable to meet eligible respondents
3. Respondent refuses to be interviewed
Types of non-response:
Data Collection: Implementation of sample

1. Interviewer is unable to do the selected household. Why?
Types of non-response:
– Structure not found– Occupied structure inaccessible– Structure non-residential, vacant, or demolished
Data Collection: Implement. of sample
Data Collection: Implement. of sample
2. Interviewer unable to meet eligible respondents. Why?
Types of non-response:
– No one at home at time of call– Respondent temporarily absent Will need call-backs
Call-backs
• Interview that is not completed requires a “call-back” or follow-up visit
• Three call-backs required (different times and days)
• Supervisors and interviewers keep track using control sheets
• Requires good tracking of work to ensure that all planned interviews are completed before leaving cluster
Data Collection: Implement. of sample
3. Respondent refuses to be interviewed. Why? What to do?
Types of non-response:
– Approach respondent from her point of view– Postponed interview to another day– Have supervisor/field editor revisit the respondentThe number of refusals should be closely monitored.
Need to find out reasons for frequent refusals.
Data Collection: Monitoring field work
• Training is a continuous process
• Observation and supervision throughout the fieldwork are a part of the training
• Team supervisors and field editors play very important roles in continuing this training and in ensuring the quality of MICS data

Data Collection: Monitoring field work
• Fieldwork control sheets• Direct observation of interviews• Review of completed questionnaires (editing)• Spot-checking households and HH composition
Systematic Spot Checking
• How to spot-check household composition?– Supervisors should complete columns 2-6 in the
HH questionnaire and compare with that of the interviewer
– Check about 5% of households (5-6 per week)– All team members must be spot-checked;
provide feedback if necessary
Fieldwork Control Sheets
• Interviewers’ work is monitored and evaluated by keeping accurate record of assignments
• Both supervisors and interviewers have control forms to maintain
• These forms should be returned to the director of field operations along with the completed questionnaires
• Interviewer is responsible for ensuring that control sheet is up-to-date
Observing Interviews, part 1
• To evaluate and improve interviewer performance
• To look for errors and misconceptions that cannot be detected through editing
• Why? Precise but inaccurate answers • Who observes? The supervisors or field editors • Who should be observed? Every interviewer • To check if interviewer is editing h/er own work
before leaving HH

Observing Interviews, part 2
• How often? 5-6 interviews per week, more at start of fieldwork
• How? Just take notes without disrupting the interview
• What to do after? Supervisors reviews questionnaires with interviewer, highlight issues and proposes solution and training

Editing Questionnaires in the Field
• Fundamental to survey quality
• Need to ensure:
– Accurate and complete information in each questionnaire
– Correct count of questionnaires
Editing Questionnaires in the Field
• Done daily by field editor; supervisor can assist
• Editing of all questionnaires must be completed BEFORE leaving cluster
• Results and errors are discussed with interviewers
• Interviewers should go back to HH for correction
Evaluating Interviewers Performance
• Daily discuss the quality of interviewers work • Point out mistakes discovered during observation of
interviews or noticed during editing• Discuss examples of actual mistakes, but be careful not to
embarrass individual interviewers. • Re-read relevant sections from the Interviewer's Manual
with the team to resolve problems. • Encourage the interviewers to talk about any situations
they encountered in the field • Discuss whether situations are handled properly, and how
to do it in the future
Overview of presentation
• Data collection• Field supervision
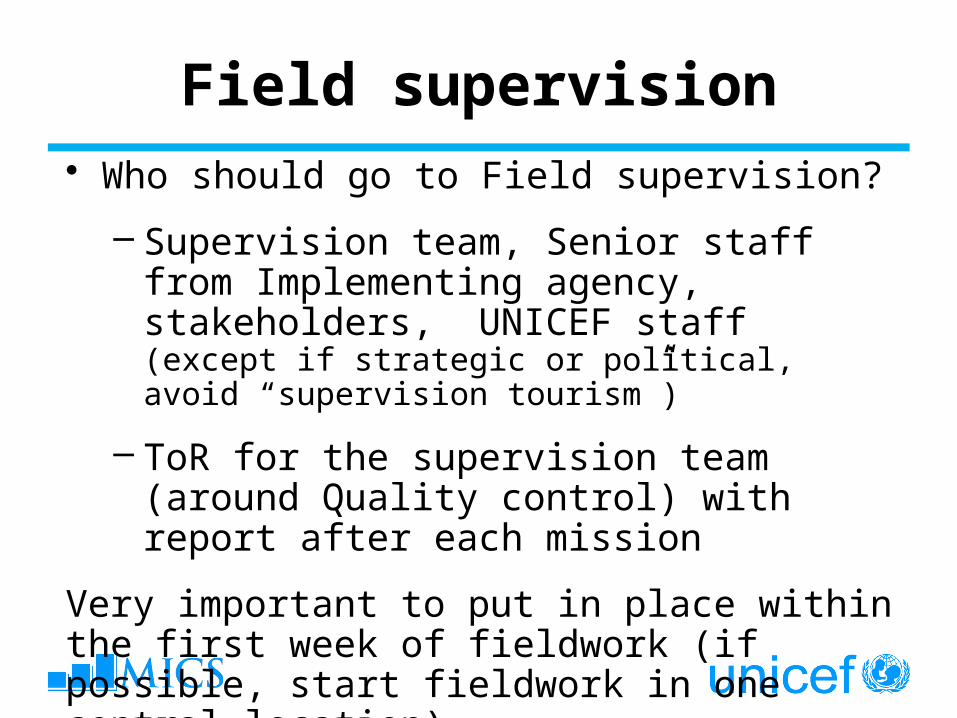
Field supervision• Who should go to Field supervision?
– Supervision team, Senior staff from Implementing agency, stakeholders, UNICEF staff (except if strategic or political, avoid “supervision tourism”)
– ToR for the supervision team (around Quality control) with report after each mission
Very important to put in place within the first week of fieldwork (if possible, start fieldwork in one central location)
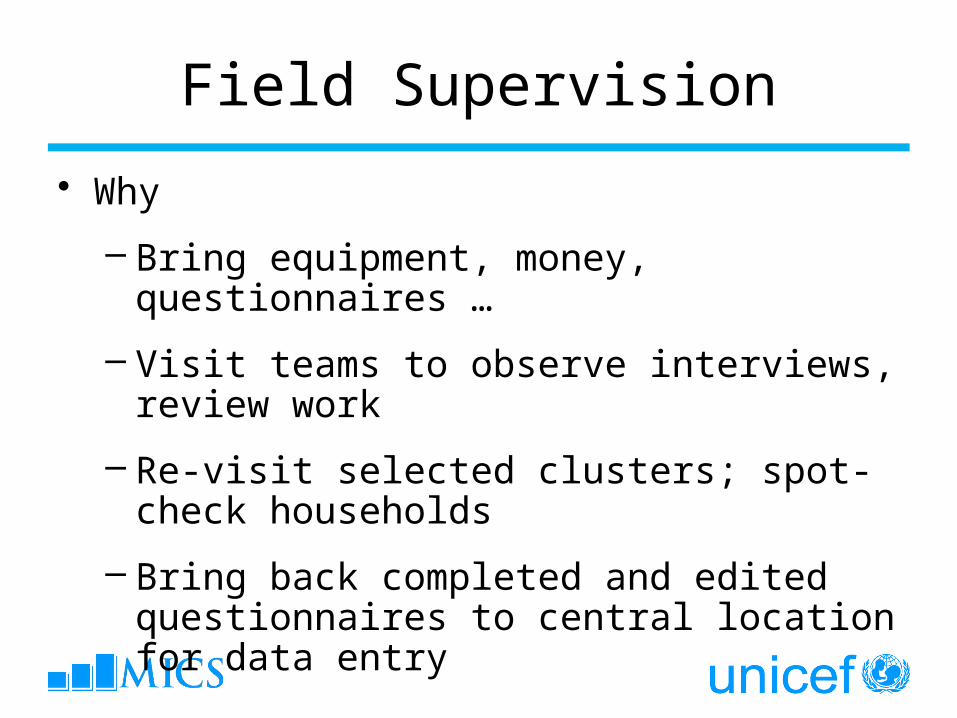
Field Supervision
• Why
– Bring equipment, money, questionnaires …
– Visit teams to observe interviews, review work
– Re-visit selected clusters; spot-check households
– Bring back completed and edited questionnaires to central location for data entry
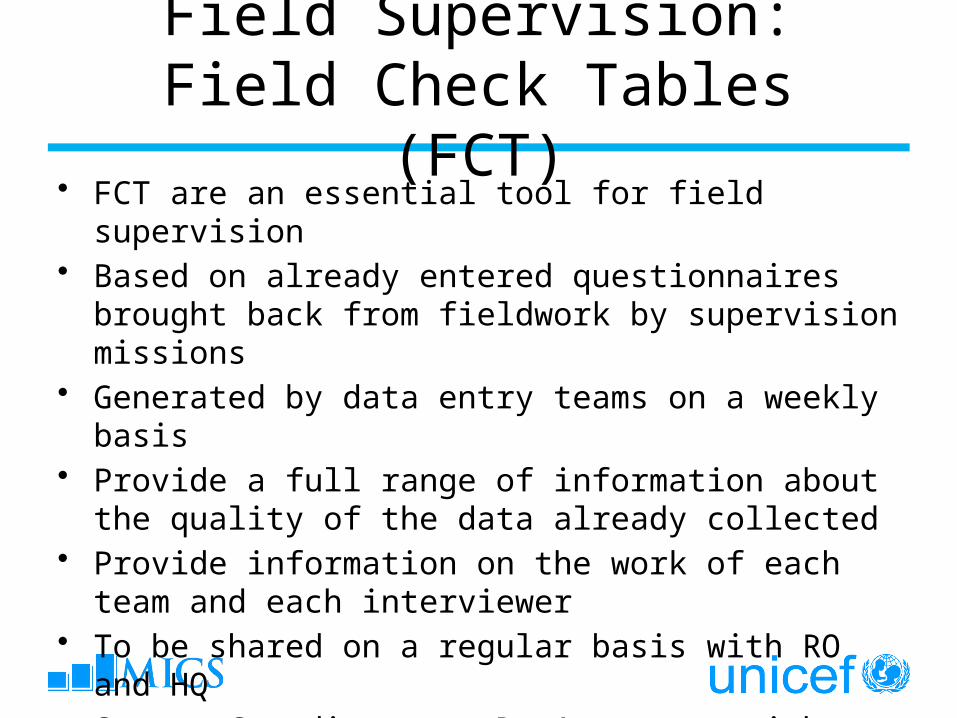
Field Supervision: Field Check Tables (FCT)
• FCT are an essential tool for field supervision• Based on already entered questionnaires brought back
from fieldwork by supervision missions• Generated by data entry teams on a weekly basis• Provide a full range of information about the quality of
the data already collected• Provide information on the work of each team and each
interviewer• To be shared on a regular basis with RO and HQ• Survey Coordinators: Don’t go out without them
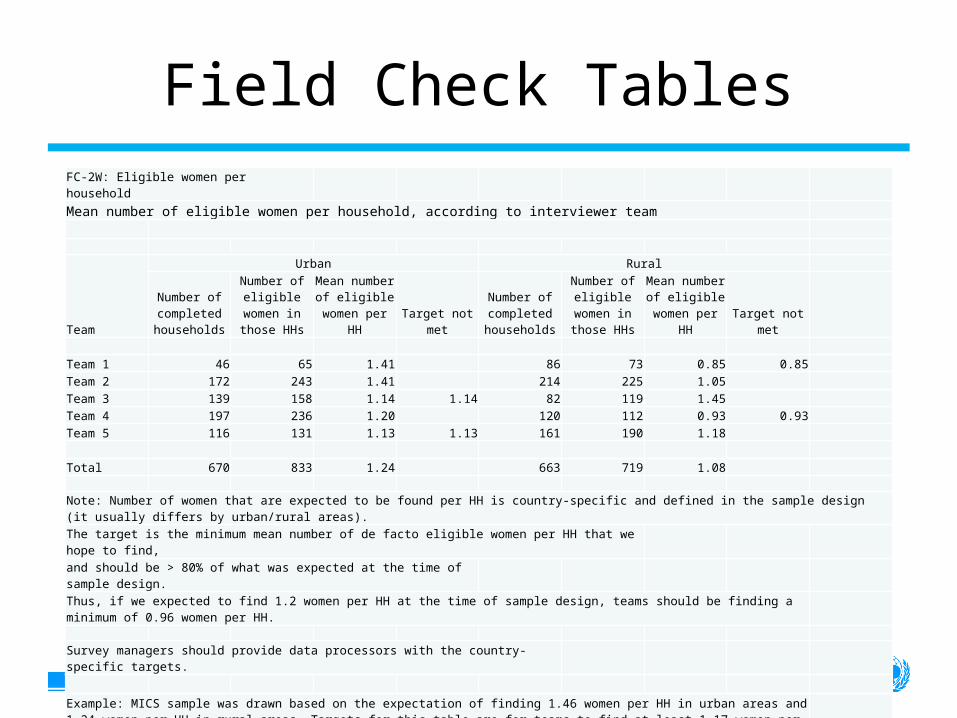
Field Check TablesFC-2W: Eligible women per household
Mean number of eligible women per household, according to interviewer team
Team
Urban Rural
Number of completed households
Number of eligible women in those HHs
Mean number of eligible
women per HH Target not met
Number of completed households
Number of eligible women in those HHs
Mean number of eligible
women per HH Target not met Team 1 46 65 1.41 86 73 0.85 0.85Team 2 172 243 1.41 214 225 1.05 Team 3 139 158 1.14 1.14 82 119 1.45 Team 4 197 236 1.20 120 112 0.93 0.93Team 5 116 131 1.13 1.13 161 190 1.18 Total 670 833 1.24 663 719 1.08
Note: Number of women that are expected to be found per HH is country-specific and defined in the sample design (it usually differs by urban/rural areas).The target is the minimum mean number of de facto eligible women per HH that we hope to find, and should be > 80% of what was expected at the time of sample design.Thus, if we expected to find 1.2 women per HH at the time of sample design, teams should be finding a minimum of 0.96 women per HH.
Survey managers should provide data processors with the country-specific targets.
Example: MICS sample was drawn based on the expectation of finding 1.46 women per HH in urban areas and 1.24 women per HH in rural areas. Targets for this table are for teams to find at least 1.17 women per HH (80% of 1.46) in urban areas and 0.99 women per HH (80% of 1.24) in rural areas.
Field Check Tables
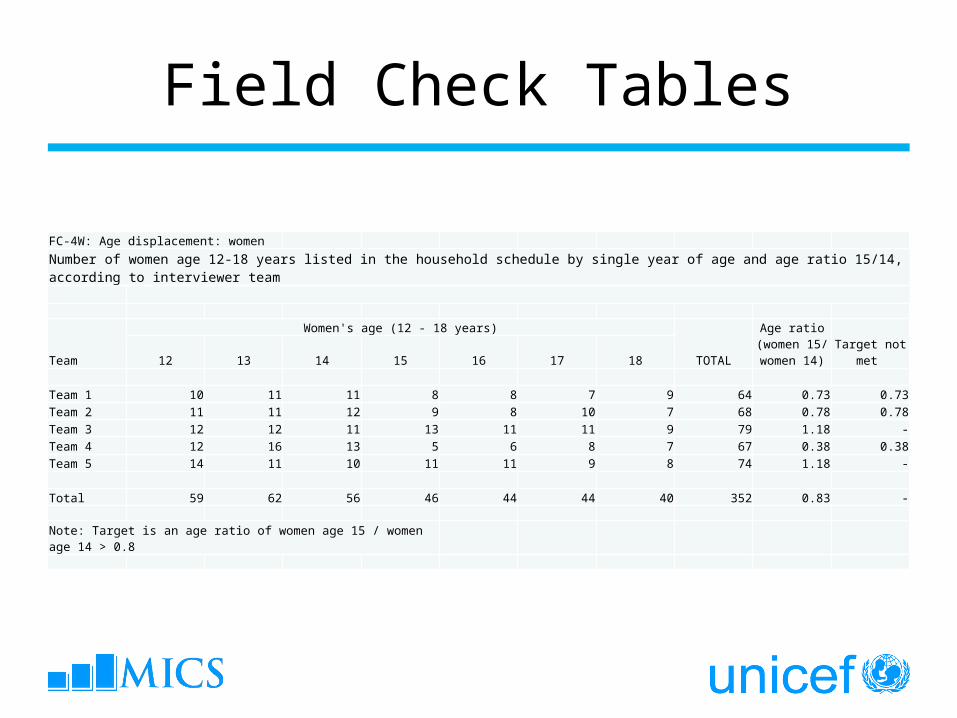
FC-4W: Age displacement: womenNumber of women age 12-18 years listed in the household schedule by single year of age and age ratio 15/14, according to interviewer team
Team
Women's age (12 - 18 years)
TOTAL
Age ratio (women 15/ women 14)
Target not met 12 13 14 15 16 17 18
Team 1 10 11 11 8 8 7 9 64 0.73 0.73Team 2 11 11 12 9 8 10 7 68 0.78 0.78Team 3 12 12 11 13 11 11 9 79 1.18 -Team 4 12 16 13 5 6 8 7 67 0.38 0.38Team 5 14 11 10 11 11 9 8 74 1.18 - Total 59 62 56 46 44 44 40 352 0.83 -
Note: Target is an age ratio of women age 15 / women age 14 > 0.8
FCT : What else ?
USE THEM!
USE THEM!
USE THEM!
Related Documents