Hanoi, June 2015 Uỷ BAN DâN TộC SITUATION, DYNAMICS, AND CHALLENGES OF ETHNIC MINORITY CHILDREN MULTIDIMENSIONAL CHILD POVERTY

Welcome message from author
This document is posted to help you gain knowledge. Please leave a comment to let me know what you think about it! Share it to your friends and learn new things together.
Transcript
Hanoi, June 2015
Uỷ Ban Dân Tộc
Situation, DynamicS, anD cHallengeS
of Ethnic Minority childrEn MultidiMEnsional child PovErty

MultidiMensional Child Poverty of ethniC Minority Childrensituation, dynamics, and Challenges 1
Situation, DynamicS, anD cHallengeS
of Ethnic Minority childrEn MultidiMEnsional child PovErty
MultidiMensional Child Poverty of ethniC Minority Childrensituation, dynamics, and Challenges2
2 | P a g e
Table of Contents
Table of Contents ...................................................................................................... 2
Abbreviations and acronyms ...................................................................................... 4
List of tables .............................................................................................................. 5
List of figures ............................................................................................................. 6
Acknowledgement ..................................................................................................... 7
Executive Summary ................................................................................................... 8
Introduction ............................................................................................................ 19
Chapter 1 – Analytical Framework ............................................................................ 23
I. Methodology ....................................................................................... 23
I.1 Measurement of Multidimensional Child Poverty ................................. 23
II.2 Empirical models .............................................................................. 29
II. Data sources ...................................................................................... 33
Chapter 2: Multidimensional Child Poverty of Ethnic Minorities in Vietnam ................ 36
I. Child Poverty: Unidimensional approach ................................................ 36
II. Different Domains of Multidimensional Child Poverty ............................ 39
II.1. Education ........................................................................................ 39
II.2. Healthcare ....................................................................................... 42
II.3. Shelter ............................................................................................ 45
II.4. Water and Sanitation ....................................................................... 49
II.5. Child Labour .................................................................................... 52
II.6. Social Inclusion ................................................................................ 55
II.7. Multidimensional Child Poverty ......................................................... 58
Chapter 3 – Determinants of Multidimensional Child Poverty .................................... 64
I. Determinants of Multidimensional Child Poverty .................................... 64
I.1 Determinants of Multidimensional Child Poverty .................................. 64
I.2 Dynamics of Multidimensional Child Poverty ........................................ 68
II. Impacts of Multidimensional Poverty on Child Development .................. 71
MultidiMensional Child Poverty of ethniC Minority Childrensituation, dynamics, and Challenges 3
3 | P a g e
Chapter 4 – Poverty Reduction Policies for Children in the Ethnic Minority Areas ........ 77
I. Approach Toward Child Poverty Reduction ........................................... 77
I.1 Policies for children from Ethnic minority groups .................................. 77
I.2 Targeting Children in the Current Policies and Programs on Poverty
Reduction .............................................................................................. 78
II. Policies and Programmes for Reduction of Child Poverty ........................ 79
II.1 There Are Too Many Policies and Programmes on poverty reduction. ... 80
II.2 Most Policies/Programmes Are Under-‐Resourced ................................ 81
II.3 Having Too Many Agencies Operating Without Effective Coordination
Mechanisms .......................................................................................... 84
Conclusions and Policy Recommendations ................................................................ 87
References .............................................................................................................. 92
Annexes .................................................................................................................. 94
Annex 1. Classification of ethnic minority groups ...................................... 94
Annex 2. Some detailed calculation results ............................................... 96
Annex 3. List of programmes/policies on child poverty ............................ 113
MultidiMensional Child Poverty of ethniC Minority Childrensituation, dynamics, and Challenges4
4 | P a g e
Abbreviations and acronyms
BLS Baseline Survey
CEMA Committee on Ethnic Minority Affair
CPG Child poverty gap
CPIT Child poverty intensity
HDR Human Development Report
IRC Indochina Research and Consulting
MARD Ministry of Agriculture, Rural and Development
MFA Ministry of Foreign Affairs
MICS Multiple Indicator Cluster Survey
MOET Ministry of Education and Training
MOF Ministry of Finance
MOH Ministry of Health
MOLISA Ministry of Labour, Invalids and Social Affairs
MPI Ministry of Planning and Investment
OPHI Human Development Initiative by the University of Oxford
P135-‐II Program 135 – Phase II
UNDP United Nations Development Programme
UNICEF United Nation Children’s Fund
VHLSS Vietnam Household Living Standards Survey
MultidiMensional Child Poverty of ethniC Minority Childrensituation, dynamics, and Challenges 5
5 | P a g e
List of tables
Table 2.1 Prevalence of Income Poverty (unit: %) .................................................................. 37
Table 2.2 Poverty in the Domain of Education (unit: %) ......................................................... 40
Table 2.3 Poverty in the Domain of Healthcare (unit: %) ........................................................ 42
Table 2.4 Poverty in the Domain of Shelter (unit: %) .............................................................. 46
Table 2.5 Poverty in the Domain of Safe Drinking Water and Sanitation (unit: %) ..................... 50
Table 2.6 Poverty in terms of Children Engaged in Child Labour (unit: %) ................................ 53
Table 2.7 Poverty in the Domain of Social Inclusion (unit: %) .................................................. 56
Table 2.8 Multidimesional Child Poverty in 2007 and 2012 .................................................... 59
Table 3.1 Determinants of Multidimensional Child Poverty – Cross Sectional Estimates ........... 66
Table 3.2 Determinants of Multidimensional Child Poverty – Panel Estimates ......................... 67
Table 3.3 Multidimensional Poverty Dynamics Outcomes ...................................................... 69
Table 3.4 Determinants of Dynamics of Multidimensional Child Poverty ................................. 70
Table 3.5 Impacts of Multidimensional Child Poverty on Child Development Outcomes ........... 74
Table A1.1 Distribution of households of 14 ethnic groups in BLS ........................................... 95
Table A2.1 % attending school at the enrollment ages and not completing primary education .. 96
Table A2.2 Children having health insurance card (unit: %) .................................................... 98
Table A2.3 Children living in inconcrete dwelling and no electricity (unit: %) ........................... 99
Table A2.4 Possession of some household assets (unit: %) ................................................... 101
Table A2.5 Children using safe water and hygienic toilet (unit: %) ........................................ 103
Table A2.6 Conditions of child poverty (unit: %) .................................................................. 105
Table A2.7 Language competency and Children living in households whose head or his/her spouse
are unable to work (unit: %) .............................................................................................. 107
Table A2.8 Children having shortage in at least one dimension (unit: %) ............................... 109
Table A2.9 Other indexes on multidimension child poverty (unit: %) ..................................... 111
Table A3.1 List of programmes/policies supporting children ................................................ 113
MultidiMensional Child Poverty of ethniC Minority Childrensituation, dynamics, and Challenges6
6 | P a g e
List of figures
Figure 2.1 Cumulative Probability Function (CDF) of Per Capita Income ...................... 38
Figure 2.2 Income-‐based Poverty vs. Poverty in the Domain of Education ................... 41
Figure 2.3 Income-‐based Poverty vs. Poverty in the Domain of Healthcare .................. 44
Figure 2.4 Income-‐based Poverty vs Poverty in the Domain of Shelter ........................ 49
Figure 2.5 Income-‐based Poverty v. Poverty in the Domain of Water and Sanitation .... 52
Figure 2.6 Income-‐based Poverty vs. Poverty in the Domain of Child Labor (unit: %) .... 55
Figure 2.7 Income-‐based Poverty vs. Poverty in the Domain of Social Inclusion ........... 58
Figure 2.8 Multidimensional Poverty vs. Income-‐Based Poverty ................................. 61
Figure 2.9 Temporal Comparison of Child Poverty across Different Domains ............... 62
Figure 4.1 System of programmes and policies addressing aspects of child poverty ..... 80
Figure 4.2 Allocated funds for some key policies and programs (%) ............................ 82
MultidiMensional Child Poverty of ethniC Minority Childrensituation, dynamics, and Challenges 7
7 | P a g e
Acknowledgement
This report was made within the long-‐term cooperation between UNICEF
Vietnam to the Ethnic Miniority Policies Management Board -‐ Committee for
Ethnic Minority Affrairs (CEMA) in 2014. We would like to thank the research
team from IRC Development Research and Consulting (IRC Consulting)
(include Dr. Pham Thai Hung – team leader, Hoang Xuan Trung, Pham Quang
Hung, and Le Thi Thu Trang, with support from Pham Thi Thuy Chi, Le
Nguyen Quynh Chang, Nguyen Dinh Tuan, and Nguyen Thi Thao, and Do Thu
Thuy). Many comments were made to earlier drafts of this Report, especially
those from Ms. Be Thi Hong Van , Ms. Tran Chi Mai, and Ms. Nguyen Thu
Thao (CEMA), and Ms. Nguyen Thi Van Anh, Ms. Yoshimi Nishino, Ms.
Mizuho Okimoto and Ms. Christina Popivanova (UNICEF ), and the two
independent reviewers. We would like to thank you all for sharing your
comments and suggestions to improve the Report. We also thank UNICEF
Vietnam for providing financial support for this study and the associated
events. However, the results and recommendations of this report are of the
authors’ and do not necessarily reflect the views of CEMA , UNICEF Vietnam
or any other parties.
Hanoi, June 2015
Ethnic Miniority Policies Management Board
Committee for Ethnic Minority Affrairs (CEMA)
MultidiMensional Child Poverty of ethniC Minority Childrensituation, dynamics, and Challenges8
8 | P a g e
Executive Summary
Context
After two decades of attacking poverty that lifted around 35 million people out of poverty, Vietnam has achieved arguably most impressive records in promoting economic growth and poverty reduction. Nevertheless, poverty remains persistent in some ‘pockets of poverty’ – which are mainly the most difficult and mountainous areas with high density of ethnic minorities. Accounting for less than 15 percent of the total population, ethnic minorities constitute of more than a half of the total poor. Previous studies, such as IRC-‐CEMA-‐UNDP (2013), have suggested that if no radical changes secured, poverty will largely be an ethnicity phenomenon in the coming years.
Being born and grown up in the ‘pockets of poverty’, children are arguably one of the most vulnerable groups in the country. Existing studies have highlighted persistent poverty in these ethic minority areas but been not informative on child poverty. UNICEF-‐Maastricht-‐MOLISA (2008) in a pioneer study using multidimensional poverty approach reported a prevalence of child poverty that is considerably higher than using uni-‐dimensional (e.g. income or consumption expenditure) poverty approach. At this stage, child poverty in the ethnic minority areas remains an under-‐researched issues. This study is expected to fill in this gap.
Using the two comprehensive surveys available from P135-‐II, which covers a panel of nearly 6,000 households that are representative for the extremely difficult communes in the mountainous and ethnic minority areas (hereafter in ‘ethnic minority areas’) across the two years of 2007 and 2012, the study focuses on child poverty in these areas, using the multidimensional poverty approach. With the multi-‐dimensional poverty measure method basically same as the method used in study of UNICEF, Maastricht University, and MOLISA (2008), the report provides a narrative on child poverty in different poverty domains, dynamics of multidimensional child poverty over time, as
MultidiMensional Child Poverty of ethniC Minority Childrensituation, dynamics, and Challenges 9
9 | P a g e
well as how multidimensional poverty exerts its impacts on some future outcomes of poor children. In addition, it provides some reviews of the current policies and programs that are directly or indirectly addressing child poverty. Based on such new insights and findings, the study produces a number of policy recommendations.
Key Findings: ‘Dimensions’ of Poverty
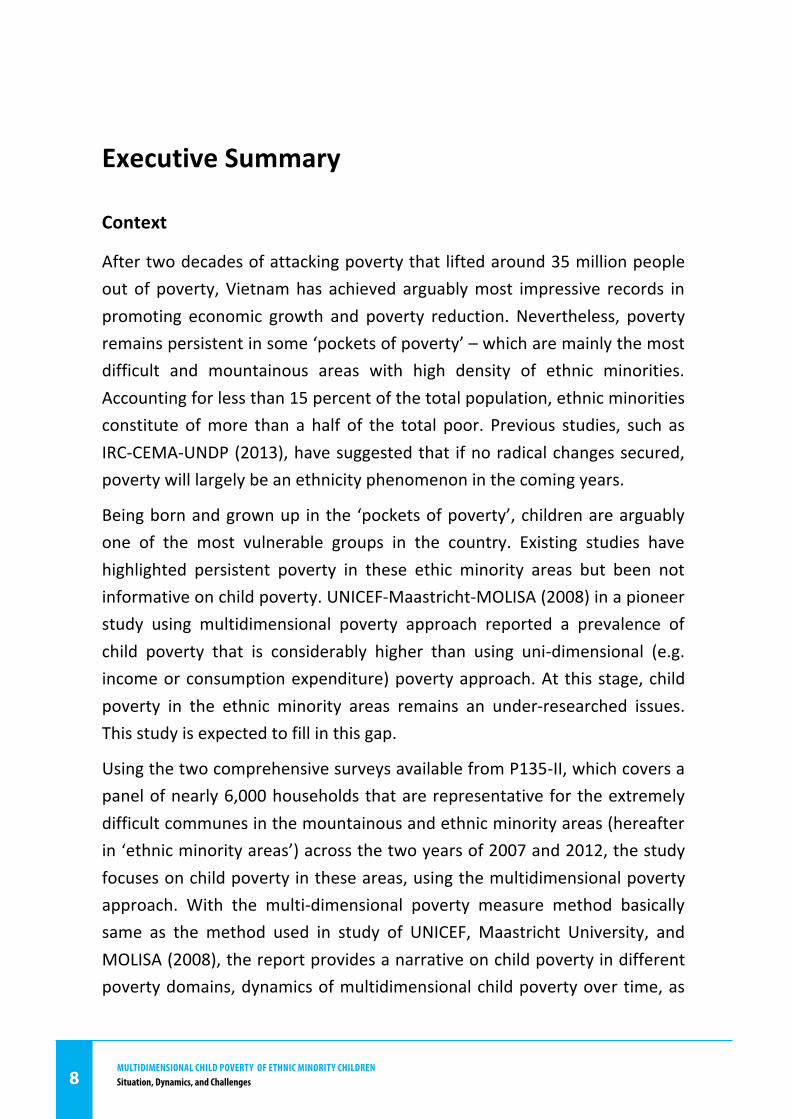
Income-‐based Poverty. To provide a benchmark for multidimensional poverty, the study notes that there have been significant improvements in income aspect of the living standards in the ‘pockets of poverty’. The cumulative distribution function (CDF) of per capita income has shifted to the right by a considerable extent, demonstrating a reduction of income poverty by an order of 11 percentage points between 2007 and 2012 (from 60.5 to 49.5 percent). This means annual rate of poverty reduction by nearly two percentage points. Poverty in different domains according to multidimensional poverty approach will be analyzed in reference to this income poverty.
Poverty in the domain of education is measured by the percentage of children either not going to school at the appropriate enrolment age or children aged between 11 and 15 years not completing primary education level. By 2012, around one fifth of children in the ethnic minority areas are poor in education. Compared to 2007, there has been a very modest improvement in the poverty rate in this domain by an order of 1.5 percentage point within the five year period. This modest improvement is observed under plenty of policies to provide access to education for children in these ‘pockets of poverty’. It could be taken to suggest that the recent initiatives in education have not effectively addressed the key constraints that keep children in the most difficult areas either not completing primary education or not enrolling at the enrollment age. The graph on the right hand side suggests that there is a small proportion of children that are poor in both income and education (around 15 and 12 percent in 2007 and 2012,
0
.2
.4
.6
.8
1
0 5 10 15
c.d.f. of 2007 c.d.f. of 2012
MultidiMensional Child Poverty of ethniC Minority Childrensituation, dynamics, and Challenges10
10 | P a g e
respectively). This is certainly the group that needs support most. It is also noted that many income non-‐poor children is actually poor in education (e.g. 15.2 percent of children in 2012). If income poverty is used as the only targeting criterion for support, this group of children would be excluded.
Poverty in the domain of shelter is defined as percentage of children who are residing in temporary shelters or in shelters without access to national electricity grid. Figures on shelter poverty provide an encouraging picture as the rate of shelter poverty has decreased significantly by around 24 percentage points between 2007 and 2012. This is one of the few cases where ethnic minority children were found to experience the reduction that was as fast as the Kinh ethnic children. The percentage of children being poor in terms of both income and shelter has decreased substantially over time. Especially, there are ¼ children who are poor in income but not in the domain of shelter. So, significant improvement in income (as mentioned above) perhaps has permitted households to improve housing conditions and using electricity. Besides, policy to support poor households and ethnic minorities with houses has brought positive signals in improving sheltering condition for those people. Despite of such improvement, improving housing conditions remains a challenge as 36 percent of ethnic minority children are poor in shelter while the corresponding figure of Kinh ethnic children is around 24 percent.
Poverty in the domain of engaging in child labour is measured by the percentage of children aged between 6 and 15 years old and engaged in some paid work (either for their household businesses or other households). It is noted that the age of 15 was selected as many of children in the ethnic minority areas leave schools after lower secondary level and could start working. Results on in the domain of children engaging in child labour reveals an encouraging picture. Accordingly, the prevalence of children in the ethnic minority areas engaging in child labour has decreased from 27 percent in 2007 to around 14 percent in 2012, meaning a reduction of nearly 2.5 percentage points per year. Apparently, income improvement reported earlier is likely to be the major cause underlying this reduction. Perhaps, the most striking finding from the graph on the right hand side is that there is a
MultidiMensional Child Poverty of ethniC Minority Childrensituation, dynamics, and Challenges 11
11 | P a g e
small percentage of children who are poor both in income and in the domain of engaging in labour. In fact, nearly 44 percent of children in the ethnic minority areas were found to be poor in income but not poor in engaging child labour. This represents certainly a positive note as income poverty is not the major reason that makes parents putting their children at work to support income generation of the families.
Poverty in the domain of water and sanitation covers two aspects of living conditions including safe drinking water and hygienic toilets. A child is considered to be poor in this dimension if his/her household does not has access to either of these two facilities. The report reveals a worrying situation in the level of access by children to safe water and hygienic toilet facilities. In the first year of the period 2007-‐2012, nearly all children in the ‘pocket of poverty’ was poor in this domain. After five years, there has been a moderate reduction by an order of 11 percentage points but poverty in water and sanitation among children in the ethnic minority areas remain very high at 81 percent. Underlying the 11 percentage point reduction, calculated figures suggest that this improvement was caused by increasing availability of toilet facilities while the level of access to safe water remains relatively stable in this period. Notably, It was reported that more than one third of children in these ‘pockets of poverty’ were non-‐poor in income but poor in water and sanitation in 2012. In this case, if income poverty is used as the targeting criterion, this significant group of children would then be left out of beneficial scale.
Poverty in the domain of healthcare is measured by the percentage of children aged between 2 and 4 years old who have not been taken to formal health facilities (e.g. commune health center, hospitals) in the last 12 months. The study reflects a worrying situation as poverty in healthcare in the ethnic minority areas has increased by around 13 percentage points from 40.5 percent in 2007 to 54 percent in 2012. This increase was reported while the percentage of children having health insurance remains as high as 94 percent in the period and there has been improvements in the level of access to healthcare services reflected in availability of healthcare facilities in most of the communes in Vietnam. This finding suggests that ensuring the
MultidiMensional Child Poverty of ethniC Minority Childrensituation, dynamics, and Challenges12
12 | P a g e
level of access does not mean ‘having the job done’. Instead, further efforts are needed to ensure that children, subject to their parents’ decision, would be taken care by professional health workers when experience sickness. \The report also emphasizes that, there were nearly one fifth of the children (e.g. 19.4 percent) who were poor in healthcare but non-‐poor in income. This proportion of children could be excluded from support policies if income poverty is used as the main targeting background. It is also noted that the increase in health poverty was mainly driven by the increase in the prevalence of income non-‐poor children who became poor in health in the period 2007-‐2012 (i.e. from 9.8 percent to 19.4 percent between the two years).
Poverty in the domain of social inclusion is measured by the percentage of poor children in terms of social inclusion, including 2 criteria: (i) children stay in the family whose household head cannot work because of disability or old age; (ii) using common language in communicating outside household. Figures on poverty in social inclusion also represent a worrying situation. Between 2007 and 2012, the rate of social inclusion has increased from nearly 53 percent to approximately 62 percent. Examining the causes underlying this dynamics reveals that the decreasing ability of ethnic minority children in using the majority language is the driving force. This finding is of particular attention as language barrier has considered an obstacle and many efforts have been put in place, especially in providing language classes for ethnic minority children, in order to improve the majority language ability of ethnic minority children
Key Findings: Multidimensional Child Poverty
Multidimensional poverty rate. Combining poverty from different domains, the multidimensional poverty rates were reported at 81.4 percent in 2007 and 70 percent in 2012, meaning a reduction of around 11.5 percentage points or a rate of around 2.2 percentage points per annual. Though this moderate reduction is observed, multidimensional child poverty remains very high. On average, nearly two third of children in the ethnic minority areas are considered poor. This is considerably higher than the income
MultidiMensional Child Poverty of ethniC Minority Childrensituation, dynamics, and Challenges 13
13 | P a g e
poverty headcount found in these ‘pockets of poverty’ (i.e. at 49.2 percent in 2012, using the same dataset). Notably, the gap in multidimensional poverty between the Kinh children and the ethnic minority children is considerably more pronounced. In 2012, for instance, 29 percent of Kinh ethnic children were reported to be poor while the majority of ethnic minority children (i.e. 81 percent) were poor. Most importantly, this high prevalence of child poverty and the marginalized position of ethnic minority children persists after two decades of implementing many policies and programs for socio-‐economic development of the areas, including the two phases of P135. This raises very important question on effectiveness of the past and existing interventions.
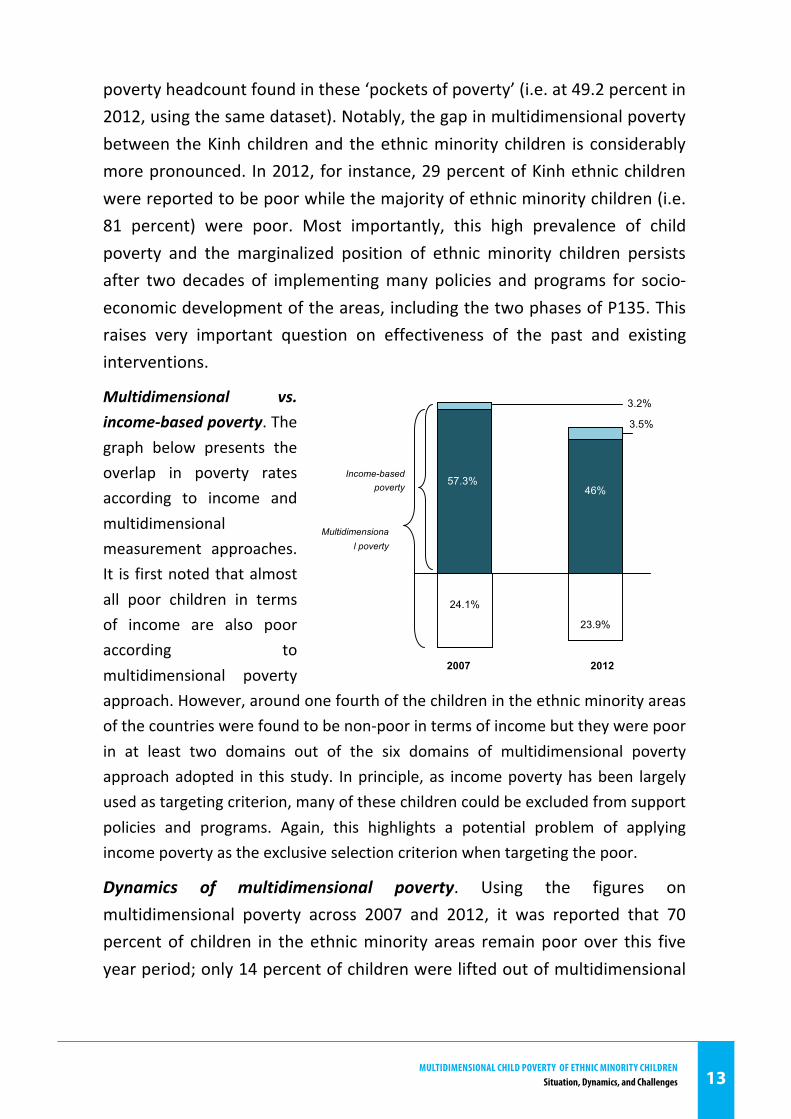
Multidimensional vs. income-‐based poverty. The graph below presents the overlap in poverty rates according to income and multidimensional measurement approaches. It is first noted that almost all poor children in terms of income are also poor according to multidimensional poverty approach. However, around one fourth of the children in the ethnic minority areas of the countries were found to be non-‐poor in terms of income but they were poor in at least two domains out of the six domains of multidimensional poverty approach adopted in this study. In principle, as income poverty has been largely used as targeting criterion, many of these children could be excluded from support policies and programs. Again, this highlights a potential problem of applying income poverty as the exclusive selection criterion when targeting the poor.
Dynamics of multidimensional poverty. Using the figures on multidimensional poverty across 2007 and 2012, it was reported that 70 percent of children in the ethnic minority areas remain poor over this five year period; only 14 percent of children were lifted out of multidimensional
24.1%
23.9%
57.3%
24,1 %
3.2%
3.5%
46%
23,9 %
Income-based poverty
Multidimensional poverty
2007 2012
MultidiMensional Child Poverty of ethniC Minority Childrensituation, dynamics, and Challenges14
14 | P a g e
poverty; six percent of children fell back into multidimensional poverty; and around ten percent of children in these pockets of poverty were found to be non-‐poor cross the period. It means that for around 80 percent of the children population in the ethnic minority, there are no changes in their poverty status across the period 2007-‐2012. This finding is consistent with the reported reduction of poverty in this area (as above). This finding was reported in the context of the GoV and its development partners having several policies and programs on poverty reduction for ethnic minorities. This raises a very important question: why there have been very little changes in multidimensional child poverty while there are a lot of poverty reduction interventions?
Determinants of multidimensional poverty and its dynamics. Economic modeling was then adopted to examine empirically the determinants of multidimensional poverty and its dynamics. The results generally show that children in the Kinh-‐headed households are much less likely to be multidimensional poor in a given time and more likely to escaping poverty and/or stay non-‐poor over time. Educational attainment levels of household heads were also reported as an important determinant of multidimensional poverty. Landholding, especially irrigated annual crop land was found to be another determinant of multidimensional child poverty in most cases. It was also reported that the presence of most basic infrastructure and facilities at the commune levels is a contributing factor to improvement of living standards of children in the ethnic minority areas.
Potential impacts of multidimensional child poverty on some future outcomes of children remain a very challenging question, both methodologically and empirically. Using the panels of children and their households available from the two surveys, the study reported that being multidimensional poor in 2007 could exert negative effects of some outcomes in living standards of children in 2012. Particularly, if a child was poor in 2007, on average and other things stay the same, the number of schooling years of that child in 2012 would be lower than the others by around 25 percent. In addition, being poor in 2007 would induce the probability of being engaged in child labour by 3.4 percentage points in
MultidiMensional Child Poverty of ethniC Minority Childrensituation, dynamics, and Challenges 15
15 | P a g e
2012. Finally, the estimates also suggest that being poor in 2007 could produce negative effect on access to healthcare services in 2012. On average, a poor child in 2007 would be less likely to be treated in hospital while sickness by around five percentage points. One central message from all of these figures is that child poverty, as it is confirmed by this study, would have materialized and negative impacts on some outcomes in living standards of children in the future. From policy perspective, this lends a further background for having the support to address child poverty in the ‘pockets of poverty’ in Vietnam.
Drawbacks in children poverty reduction policies and institutions
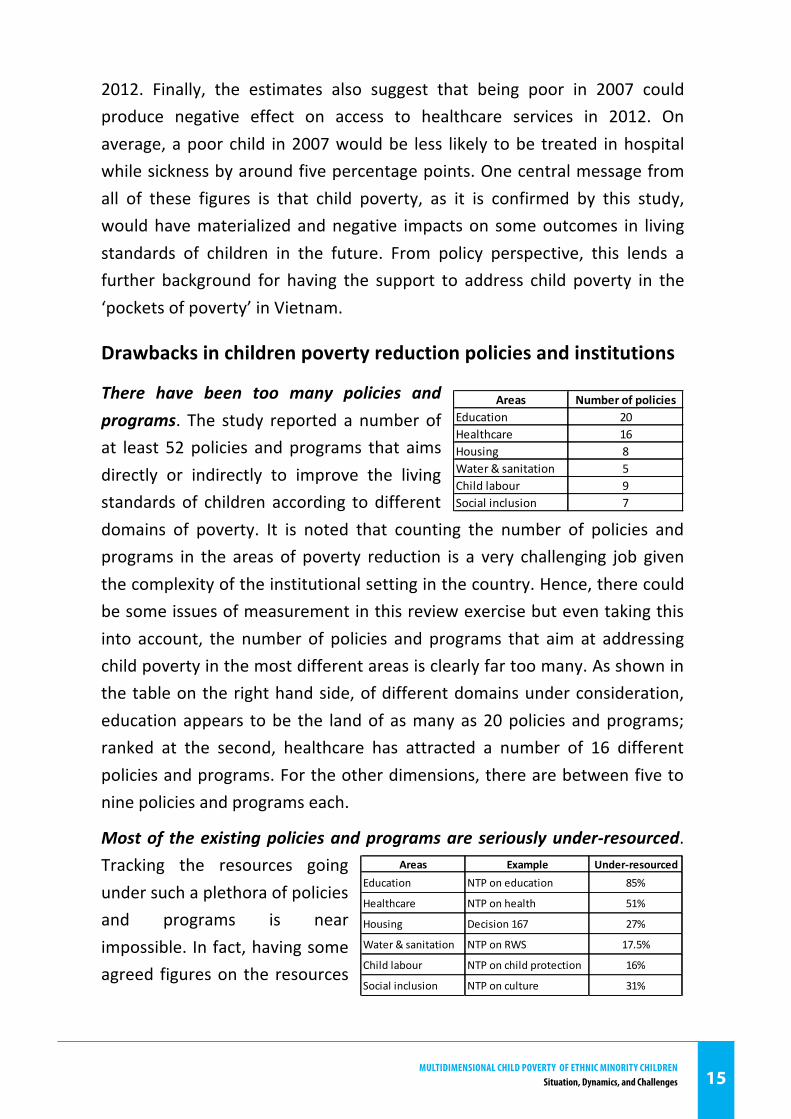
There have been too many policies and programs. The study reported a number of at least 52 policies and programs that aims directly or indirectly to improve the living standards of children according to different domains of poverty. It is noted that counting the number of policies and programs in the areas of poverty reduction is a very challenging job given the complexity of the institutional setting in the country. Hence, there could be some issues of measurement in this review exercise but even taking this into account, the number of policies and programs that aim at addressing child poverty in the most different areas is clearly far too many. As shown in the table on the right hand side, of different domains under consideration, education appears to be the land of as many as 20 policies and programs; ranked at the second, healthcare has attracted a number of 16 different policies and programs. For the other dimensions, there are between five to nine policies and programs each.
Most of the existing policies and programs are seriously under-‐resourced. Tracking the resources going under such a plethora of policies and programs is near impossible. In fact, having some agreed figures on the resources
Areas Example Under-‐resourcedEducation NTP on education 85%
Healthcare NTP on health 51%
Housing Decision 167 27%
Water & sanitation NTP on RWS 17.5%
Child labour NTP on child protection 16%
Social inclusion NTP on culture 31%
Areas Number of policiesEducation 20Healthcare 16Housing 8Water & sanitation 5Child labour 9Social inclusion 7
MultidiMensional Child Poverty of ethniC Minority Childrensituation, dynamics, and Challenges16
16 | P a g e
spent for poverty reduction in Vietnam is already a challenge for the authorities. This is possibly the result of the lack of transparency and accountability in allocating public resources. This might also originate from the fact that there are too many stakeholders involved in the course of poverty reduction, which render it impossible to have a precise estimate. Therefore, the next table presents a snapshot by selecting some typical programs and/or policies under each domain of poverty, where data on resources allocation could be traceable. The figures, albeit rough, suggest an astonishing picture of how resources have been allocated for addressing poverty in general and child poverty in the ethnic minority areas in particular. It was reported that education is an exception with an actual allocation ratio of 85 percent observed for the National Target Program (NTP) on Education (i.e. 85 percent of the resources expected was actually allocated for implementation). The NTP on healthcare also received a relatively high actual allocation ratio of 51 percent. But clearly, having a half of the total budget ‘missing’ make it impossible to reach the targets of that NTP. For all other domains, the examples show that policies and programs are seriously under-‐resourced.
Lack of effective coordination mechanisms was what could be drawn from reviewing who are in charge of the plethora of policies and programs reviewed in this study. In principle, having different Government agencies and development partners does not represent a problem as child poverty is a multidimensional issue that hence the involvement of different stakeholders is a must. However, such involvement would not be translated into bottlenecks in implementation if there have been working coordination mechanisms. Unfortunately, this precondition is not observed in most cases. Hence, poverty reduction efforts managed by many different stakeholders are seemingly not coordinated by effective coordination mechanisms. These could be then translated into overlaps of efforts, waste of resources, and low effectiveness of poverty interventions.
Policy Recommendations
MultidiMensional Child Poverty of ethniC Minority Childrensituation, dynamics, and Challenges 17
17 | P a g e
This study, together with few previous studies, has highlighted a very high prevalence of poverty among children in the ethnic minority areas, especially among ethnic minority children, regardless what poverty measurement approaches are adopted. It also highlights that given the importance and significance of this issue, there has been a plethora of policies and programs that aim at addressing child poverty in these areas. Despite of some encouraging improvements in different aspects of living standards of children, child poverty remains very high. There are four multidimensional poor children out of every five children in the ethnic minority areas. This calls for urgent policy actions.
It is first important to argue that children should be considered as the targeting unit in many policies and programs. At this stage, most of the policies and programs target areas and households rather than individuals. There are many intermediate stages and mechanisms through which interventions to the areas or households could be translated into children and hence whether the existing policies and programs could reach children as expected is not guaranteed. This is also the time to consider seriously on application of multidimensional poverty in both targeting and monitoring. This represents an important departure to the mainstream approach toward poverty reduction over the past two decades, which is largely based on income poverty. If this strategy is adopted, actions are needed now to incorporate and mainstream this into the new socio-‐economic development plans 2016-‐2020.
Rationalizing the plethora of policies and programs on poverty reduction is most needed. In addition, setting institutional arrangements that could empower a ‘conductor’ and put an effective coordination mechanism is very important to ensure effectiveness of poverty reduction efforts. In this regard, Resolution 80 on the direction for sustainable poverty reduction has created important institutional background for such arrangements. Unfortunately, the implementation of this Resolution has been subject to a number of constraints. However, unless this arrangement could be sorted out, all other solutions to create more effective coordination would not be
MultidiMensional Child Poverty of ethniC Minority Childrensituation, dynamics, and Challenges18
18 | P a g e
able to solve the root of the status quo institutional setting for poverty reduction in the country.
Having sufficient resources that could be allocated and informed in a more transparent manner is a necessary condition for planning poverty reduction efforts. At this stage, resources are allocated mainly by MPI and MoF. Many agencies that are the ‘owning agencies’ of different policies and programs are not aware of how much and when the resources would be made available. Program 30A represents a typical example. Being such an ambitious poverty reduction package, this Program was allocated the amount of resources that equalled to between 15 to 20 percent of the level required. In this regard, bold reforms are needed in terms of how public resources are allocated for future policies and programs on poverty reduction.
MultidiMensional Child Poverty of ethniC Minority Childrensituation, dynamics, and Challenges 19
19 | P a g e
Introduction
Vietnam has made remarkable achievements in poverty reduction. The poverty rate fell from 58 percent in 1993 to 20.7 percent in 2010 (according to the Vietnam Living Standard Survey (VLSS) 1992/93 and the Vietnam Household Living Standards Survey (VHLSS 2010). However, the rate of poverty levels of ethnic minority groups was considerably lower. In 2010, the poverty rate of the majority (e.g. the Kinh or Viet ethnic group) was only 7.5 percent, meanwhile that of ethnic minorities was nearly 48 percent. Although ethnic minority groups comprised less than 15 percent of the country population, they accounted for nearly 53 percent of the total poor population of the country. Deprivation among ethnic minority groups is also reflected in other non-‐monetary measurement of living standards. For instance, 44 percent of ethnic minority household heads did not complete primary education, while it was 25 percent among the majority ethnic group (using VHLSS 2010). High prevalence of child malnutrition also reflects low living standards of ethnic minority groups. In 2010, approximately 37 percent of under-‐5 ethnic minority children were malnourished, whereas that of the majority ethnic group was only 22 percent. Among ethnic minorities, children are known to be as one of the most vulnerable groups.
In the recent years, there are increasing number of studies that adapt the
multidimensional poverty approach (see Alkire and Foster, 2009 for a
review) in analysing the trends and causes of poverty in general and poverty
of ethnic minorities in particular. The report by Ministry of Labour, Invalids,
and Social Affairs (MOLISA), University of Maastricht, and UNICEF (2008) is
probably the most influential study in the literature on multidimensional
poverty (MdP) in Vietnam to date. The report estimated that one third of
children under age of 16 were reported to be multidimensional poor (i.e.
equivalent to approximately seven million poor children). On different
dimensions of child poverty, poverty in water and sanitation, recreation and
MultidiMensional Child Poverty of ethniC Minority Childrensituation, dynamics, and Challenges20
20 | P a g e
healthcare were found most serious. This study also highlighted significant
gaps in child poverty across regions. Multidimensional child poverty rates
were reported to be the highest in in the northern mountainous regions (i.e.
the North West and the North East) and Mekong River Delta. Furthermore, it
indicated ethnic minority children are more likely to be deprived in multiple
dimensions compared to Kinh children.
Using the same approach as MOLISA, Maastricht University and UNICEF
(2008) on different dataset (i.e. Multi Indicator Cluster Survey – MICS),
Roelen et al. (2010) reported a rate of multidimensional child poverty of 37
percent. The study also highlighted considerable gaps in multidimensional
child poverty (MdCP) across different ethnic groups. More recently, Roelen
(2013) used VHLSSs 2004, 2006 and 2008 to analyse trends in poverty and
poverty dynamics, the study reported that the rate of multidimensional child
poverty in Vietnam has been reduced over the period 2004-‐2008. However,
a significant proportion of children remained persistently in
multidimensional poverty and this calls for policy attention to address the
root cause of child poverty.
All of these studies have shown that the prevalence of poverty is considerably higher when using multidimensional poverty approach compared to those measured against income or expenditure (i.e. unidimensional poverty approach). Most notably, the result indicates that the rate of multidimensional child poverty is worryingly high in Vietnam. While these studies have had several policy implications, perhaps what is most noted was the emphasis that poverty when measured by income or expenditure is likely to provide an incomplete and even misleading conclusion on poverty as it affects children. Hence, it is reasonable to argue that policies and strategies on poverty reduction using this unidimensional approach might not be sufficient to address multiple facets of poverty. Furthermore, it raises a question on whether using unidimensional poverty approach would affect targeting effectiveness of poverty reduction policies.
MultidiMensional Child Poverty of ethniC Minority Childrensituation, dynamics, and Challenges 21
21 | P a g e
Although many studies examine the poverty using the MdP approach, they did not provide in-‐depth insights on the poverty status of ethnic minority children and its dynamics. So far, there is no comprehensive study on poverty of ethnic minority children in Vietnam. This report aims at filling in this gap. The report uses data available from the Baseline Survey 2007 and Endline Survey 2012 of the Program 135, Phase II (P135-‐II). Each survey includes nearly 6,000 households, of which 76 percent are ethnic minorities. These two surveys are considered high quality and representative of the areas with most difficult socio-‐economic conditions in the country, the areas with high concentration of ethnic minorities (and for that reason, the term ‘ethnic minority areas’ is used interchangeably for these areas). Using these two surveys, this study examines poverty among ethnic minority children with the following objectives:
� To analyse poverty among children in the ethnic minority areas, using
the multidimensional approach that covers different dimensions,
including education, healthcare, drinking water and sanitation, shelter,
child labor and social inclusion; and evaluate poverty dynamics of ethnic
minority children;
� To identify the socio-‐economic determinants of multidimensional child
poverty in the ethnic minority areas and assess some long-‐term impact
of multidimensional child poverty on future child development;
� To provide a review of recent policy changes related to multidimensional
child poverty in the ethnic minority areas; and, combining with the
analysis above, to suggest some policy recommendations on reduction of
multidimensional poverty for children in the ethnic minority areas.
The report adapts the multidimensional child poverty approach as in
MOLISA, Maastricht University, and UNICEF (2008). In addition, the current
study will empirically examine the determinants of multidimensional child
poverty and investigate the effects of multidimensional poverty on child
development, especially among ethnic minority children. This represents a
novelty of the study as there has been very little evidence on the
MultidiMensional Child Poverty of ethniC Minority Childrensituation, dynamics, and Challenges22
22 | P a g e
relationship between multidimensional poverty in child development.1 It is
expected that this report will inform policy dialogue on socio-‐economic
development for children in the areas with high concentration of ethnic
minorities in Vietnam as well as researchers in the relevant fields.
The report is structured as follows:
� Chapter 1 provides the framework for the analysis of multidimensional
poverty of children in the ethnic minority areas.
� Chapter 2 analyses the status-‐quo of multidimensional child poverty in
the ethnic minority areas. The analysis covers six dimensions of child
poverty, including education, healthcare, drinking water and sanitation,
shelter, child labour, and social inclusion.
� Chapter 3 examines the dynamics of multidimensional child poverty over
the period 2007-‐2012. It empirically investigates the effects of some
socio-‐economic factors as well as the determinants of multidimensional
child poverty and the long-‐term impact of multidimensional poverty on
some child development outcomes (which will be discussed in details
later).
� Chapter 4 discusses the existing poverty reduction policies that relate to
children in the ethnic minority areas. Consolidating the findings from
Chapter 2 and 3, this Chapter will suggest some policy implications for
reducing multidimensional child poverty in the ethnic minority areas.
1 In Vietnam, a study by Roelen (2013) is the first to provide some analysis of changes in multidimensional child poverty over time. This study uses data from VLHSS 2004, 2006 and 2008. However, the analysis of multi-‐dimensional child poverty of ethnic minority groups using data from VHLSSs have certain limitations because the number of ethnic minority households in the survey sample are quite small.
MultidiMensional Child Poverty of ethniC Minority Childrensituation, dynamics, and Challenges 23
23 | P a g e
Chapter 1 – Analytical Framework
This chapter describes the multidimensional child poverty approach applied
in the current study, making references to the literature on
multidimensional poverty. The first section outlines the measurement issues
and empirical models employed for the analysis. The second section details
the sources of data used and some remarks on data availability and its
implications on the results.
I. Methodology
I.1 Measurement of Multidimensional Child Poverty
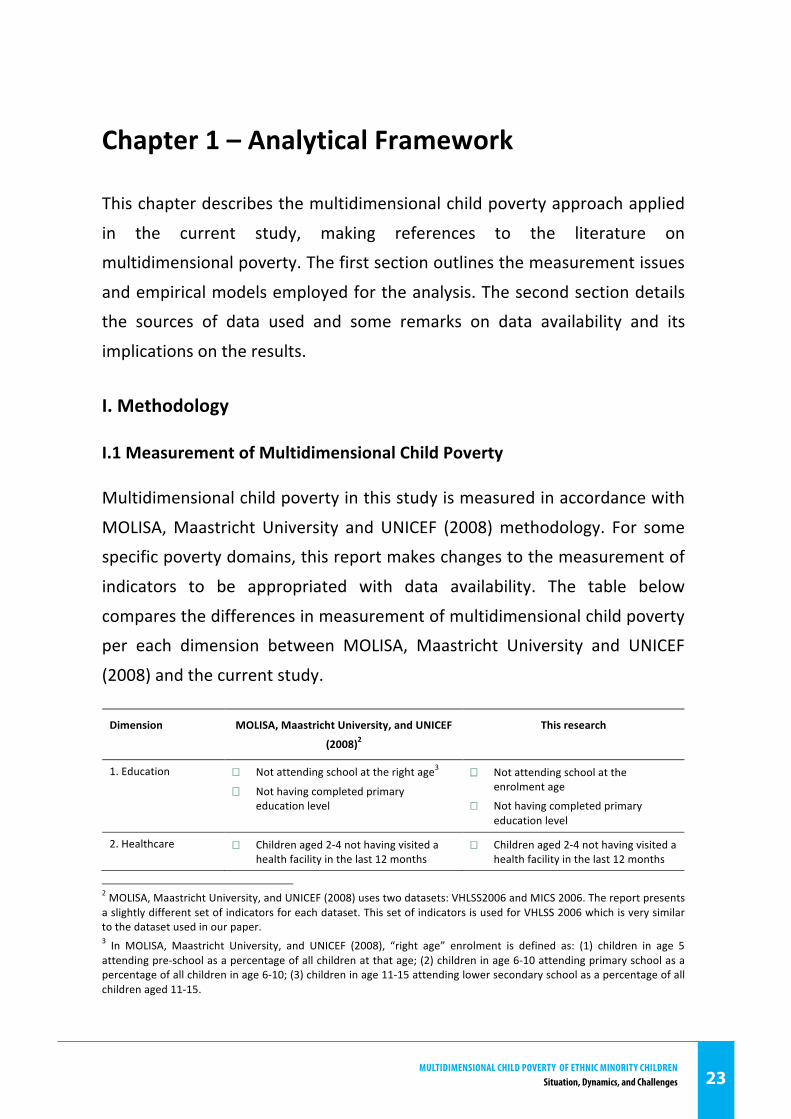
Multidimensional child poverty in this study is measured in accordance with
MOLISA, Maastricht University and UNICEF (2008) methodology. For some
specific poverty domains, this report makes changes to the measurement of
indicators to be appropriated with data availability. The table below
compares the differences in measurement of multidimensional child poverty
per each dimension between MOLISA, Maastricht University and UNICEF
(2008) and the current study.
Dimension MOLISA, Maastricht University, and UNICEF
(2008)2
This research
1. Education � Not attending school at the right age3
� Not having completed primary education level
� Not attending school at the enrolment age
� Not having completed primary education level
2. Healthcare � Children aged 2-‐4 not having visited a health facility in the last 12 months
� Children aged 2-‐4 not having visited a health facility in the last 12 months
2 MOLISA, Maastricht University, and UNICEF (2008) uses two datasets: VHLSS2006 and MICS 2006. The report presents a slightly different set of indicators for each dataset. This set of indicators is used for VHLSS 2006 which is very similar to the dataset used in our paper. 3 In MOLISA, Maastricht University, and UNICEF (2008), “right age” enrolment is defined as: (1) children in age 5 attending pre-‐school as a percentage of all children at that age; (2) children in age 6-‐10 attending primary school as a percentage of all children in age 6-‐10; (3) children in age 11-‐15 attending lower secondary school as a percentage of all children aged 11-‐15.
MultidiMensional Child Poverty of ethniC Minority Childrensituation, dynamics, and Challenges24
24 | P a g e
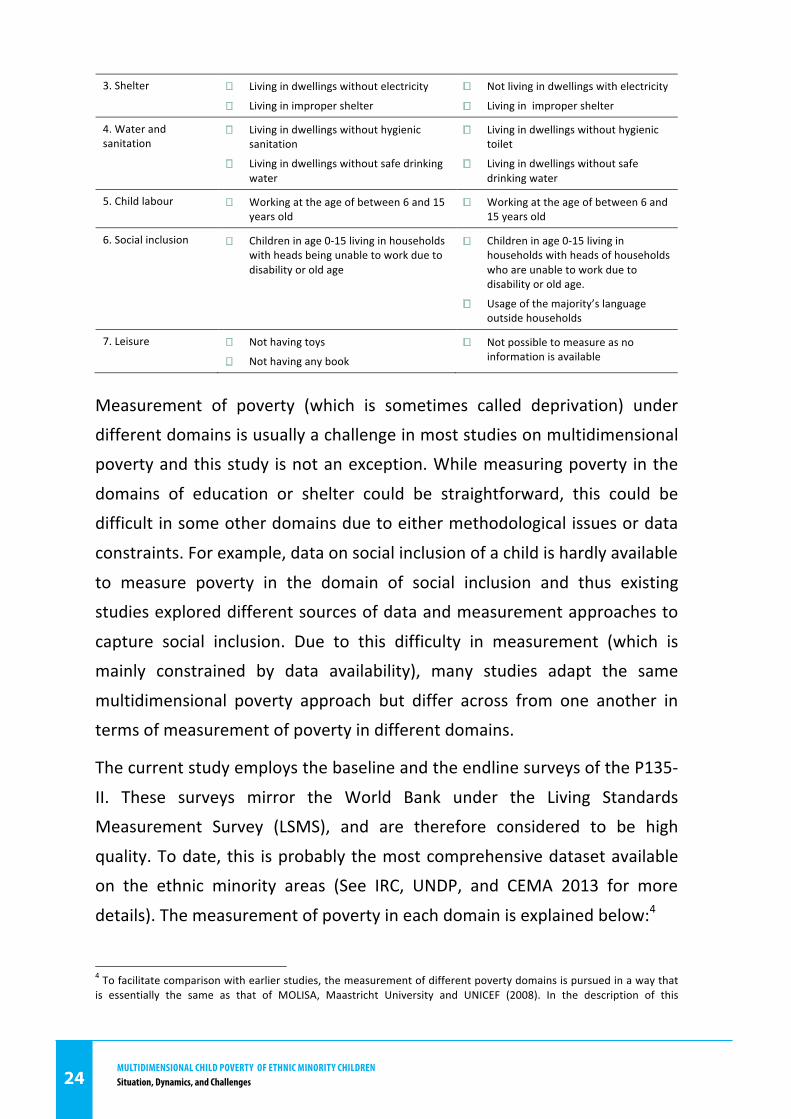
3. Shelter � Living in dwellings without electricity
� Living in improper shelter
� Not living in dwellings with electricity
� Living in improper shelter
4. Water and sanitation
� Living in dwellings without hygienic sanitation
� Living in dwellings without safe drinking water
� Living in dwellings without hygienic toilet
� Living in dwellings without safe drinking water
5. Child labour � Working at the age of between 6 and 15 years old
� Working at the age of between 6 and 15 years old
6. Social inclusion � Children in age 0-‐15 living in households with heads being unable to work due to disability or old age
� Children in age 0-‐15 living in households with heads of households who are unable to work due to disability or old age.
� Usage of the majority’s language outside households
7. Leisure � Not having toys
� Not having any book
� Not possible to measure as no information is available
Measurement of poverty (which is sometimes called deprivation) under
different domains is usually a challenge in most studies on multidimensional
poverty and this study is not an exception. While measuring poverty in the
domains of education or shelter could be straightforward, this could be
difficult in some other domains due to either methodological issues or data
constraints. For example, data on social inclusion of a child is hardly available
to measure poverty in the domain of social inclusion and thus existing
studies explored different sources of data and measurement approaches to
capture social inclusion. Due to this difficulty in measurement (which is
mainly constrained by data availability), many studies adapt the same
multidimensional poverty approach but differ across from one another in
terms of measurement of poverty in different domains.
The current study employs the baseline and the endline surveys of the P135-‐
II. These surveys mirror the World Bank under the Living Standards
Measurement Survey (LSMS), and are therefore considered to be high
quality. To date, this is probably the most comprehensive dataset available
on the ethnic minority areas (See IRC, UNDP, and CEMA 2013 for more
details). The measurement of poverty in each domain is explained below:4
4 To facilitate comparison with earlier studies, the measurement of different poverty domains is pursued in a way that is essentially the same as that of MOLISA, Maastricht University and UNICEF (2008). In the description of this
MultidiMensional Child Poverty of ethniC Minority Childrensituation, dynamics, and Challenges 25
25 | P a g e
� Poverty in the domain of education (or education poverty) is measured by
the percentage of children either not going to school at the appropriate
enrolment age or children aged between 11 and 15 years not completing
primary education level. Children not attending school at the right
enrolment age are defined as children aged 5 years old but not attending
pre-‐schools (or kindergarten); or children aged 6-‐10 years old but not
currently attending primary schools; or children aged 11-‐15 years old but
not attending lower secondary schools.
� Poverty in the domain of health (or health poverty), as per MOLISA,
Maastricht University, and UNICEF (2008), is the percentage of children
aged between 2 and 4 years old who have not been taken to formal
health facilities (e.g. commune health centre, hospitals) in the last 12
months.
� Poverty in the domain of shelter (or shelter poverty) is defined as
percentage of children who are residing in temporary shelters or in
shelters without access to national electricity grid. The definition of
temporary shelter is similar to what employed in the World Bank-‐GSO
VHLSS series.
� Poverty in the domain of water and sanitation (or water and sanitation
poverty) covers two aspects of living conditions including safe drinking
water and hygienic toilet facilities. A child is considered to be poor in this
dimension if his/her household does not has access to either of these two
facilities. The definition of safe drinking water and hygienic toilet facilities
are consistent with international practices, for instance those used in the
series of VHLSSs or GSO’s Population and Housing Census 2009.
� Poverty in terms of children engaged in child labour (or child labour
poverty) refers to children aged between 6 and 15 years old and engaged
in some paid work (either for their household businesses or other
measurement, when differences made in the current study compared to that in MOLISA, Maastricht University and UNICEF (2008), these will be noted.
MultidiMensional Child Poverty of ethniC Minority Childrensituation, dynamics, and Challenges26
26 | P a g e
households). It is noted that the age of 15 was selected as many of
children in the ethnic minority areas leave schools after lower secondary
level and could start working.
� Poverty in of the domain of social inclusion (or social inclusion poverty) implies the inclusion of a child in a family and a community. The report by
MOLISA, Maastricht University and UNICEF (2008) (when using MICS
dataset) measures the degree of social inclusion based on the criteria
that children do not have birth certificates or their caregivers (e.g.
household heads) are unable to work due to a disability and old age. In
the current study, as the information birth certificate was not available,
poverty in terms of social inclusion is measured using two criteria,
including either (i) household heads were unable to work due to disability
or old age; or (ii) usage of the Kinh language outside households. While
the usage of the former is straightforward, introduction of the latter
requires an appropriate rationale. Previous studies show that language is
an important factor for access to public services. Grant and Wong (2003)
find that language is a barrier to learning of ethnic minority students.
Martinez (2010) shows evidence that language barriers prevent access to
health services, and therefore affect the health of ethnic minority groups.
Studies by Baulch et al (2009) and IRC, UNDP, CEMA (2010 ) also show
that if ethnic minority household heads have the ability to speak
Vietnamese fluently, their risk of falling into poverty is lower compared
to that of the families with household heads who cannot speak
Vietnamese or speak little.5 It could be argued that the ability of using the
majority’s language is likely a factor of social inclusion for ethnic minority
children. However, information on ability of using the majority’s language
is not available from the dataset used in the current study. Instead, the
surveys identified which languages were used by children outside their
households. There were five options listed in the survey questionnaires, 5 Due to data limitations, some important domains of poverty are discussed in previous studies but not covered in the current study. For instance, domains of nutrition or leisure are arguably important domains of multidimensional poverty. This study does not capture these dimensions due to data constraints.
MultidiMensional Child Poverty of ethniC Minority Childrensituation, dynamics, and Challenges 27
27 | P a g e
including (i) Only use ethnic minority languages; (ii) Mainly use ethic
minority languages and little Kinh language; (iii) Both ethnic minority
languages and Kinh majority’s language; (iv) Mainly use Kinh language
and little ethic minority languages; or (v) Only Kinh language. As nearly all
children in the ethnic minority areas enrols to schools and are taught the
Kinh majority’s language, hence those who selected the first two options
could be arguably considered as having limited ability to use the
majority’s language.
Given the above approach and measurement, child poverty rate under each
of the six domains above could be calculated. A child is considered poor in
one domain if he/she experiences deprivation in that domain.6
Computationally, each dimension is assigned with a deprivation score
between 0 and 1 (i.e. zero if the child does not suffer deprivation in that
dimension and 1 otherwise). For some dimensions that consists of two
aspects (e.g. education), each aspect will has a deprivation score of between
0 and 0.5. For these dimensions, a child is considered deprived or poor in
that dimension if the total deprivation score is equal to 0.5 or 1.
Based on poverty rates under different domains, a multidimensional child
poverty index is constructed as the un-‐weighted sum of the deprivation
score obtained in all dimensions. Equal weight for each dimension is
assigned as every dimension significantly contributes to a child’s living
standards. Conceptual considerations have not resulted in compelling
reasons to assign greater weight to certain dimension over others.
Moreover, equal weighting scheme would provide a more justifiably
accurate picture of multidimensional poverty pattern, which acts as an
instrumental asset for policy implication. Specifically, equal weighting
scheme enables policy makers to identify the most pressing areas of
deprivation within all six dimensions for each ethnic minority group based
6 The terms poverty and deprivation are used interchangeably in the literature of MdP. But the term ‘poverty’ is preferred in this study as the term ‘poverty’ is more familiar with the majority of the readers. In addition, the term ‘poverty’ in different domains of MdP is usually compared with the term ‘poverty’ which is measured by income in this report, and hence this term is used for the ease of reading.
MultidiMensional Child Poverty of ethniC Minority Childrensituation, dynamics, and Challenges28
28 | P a g e
upon an unbiased assessment of every dimension. Within each dimension,
we use equal weights for indicators (if any). A child is considered “deprived”
or “poor” in one dimension if he/she is deprived in at least one indicator in
that dimension. This measurement of multidimensional poverty using at
least two dimensions, as suggested in MOLISA, Maastricht University, and
UNICEF (2008), is less sensitive compared to the measurement using only
one dimension.
Using the approach outlined above, Chapter 2 of this study will provide a
narrative of multidimensional child poverty in the ethnic minority areas. To
further inform different aspects of multidimensional child poverty, the
indicators will be disaggregated (when appropriate) according to parameters
ethnicity, region, poverty status, age and gender of children as below:7
� Ethnicity: to highlight different child poverty across ethnic groups, the
report presents indicators calculated separately the Kinh/Hoa children
(‘Kinh’ hereafter in) and ethnic minority children. Within ethnic minority
children, the analysis provides the disaggregated figures for 13 ethnic
minority groups (see Appendix 1).
� Regions: figures will be calculated for the eight geographic regions of the
country. However, the Red River Delta has relatively less observations
compared to the remaining regions and thus the figures on this region is
sensitive to some outliers and thus not reliable. But merging this region
into any one of the remaining regions will undermine cross comparison
with other studies on poverty in Vietnam. Therefore, figures on the Red
River Delta will be reported butno interpretation should be made.
� Household poverty: figures on multidimensional child poverty will be
reported according to poverty status of households, which is classified by
MOLISA, using the income (unidimensional) poverty line.
7 Note that all calculated figures reported in this study are adjusted for sampling weights so that the figures could be considered as representative for the ethnic minority areas.
MultidiMensional Child Poverty of ethniC Minority Childrensituation, dynamics, and Challenges 29
29 | P a g e
� Children’s age: when appropriate, figures will be calculated according to
three age intervals, including the age between 0-‐5, 6-‐10 and 11-‐15. This
classification of three age intervals are consistent with the enrolment
ages at pre-‐school, primary education, and lower secondary education,
respectively.
� Gender: to inform whether multidimensional child poverty represents
some gender aspects, figures on child poverty will be calculated
separately for boys and girls.
It should be noted that the narrative on multidimensional child poverty in
Chapter 2 will be provided for both 2007 and 2012 – where the data is
available. It is thus important to focus on the changes of child poverty over
this 5-‐year period. In order to identify whether the changes are statistically
significant (and hence should be interpreted), a standard t-‐test was
performed. If a change is not statistically significant, this change is best
understood as ‘statistical noise’ rather than change in the indicator itself and
thus should not be analysed.8
II.2 Empirical models
Chapter 3 of this study employs some econometric models to empirically
examine the determinants of multidimensional child poverty and the effect
of multidimensional child poverty on child developments. The essences of
these empirical models are outlined below.
Determinants of multidimensional child poverty
To evaluate the factors affecting multidimensional child poverty, Chapter 3
presents some regression models using the datasets of 2007 and 2012. In
these models, the dependent variable is the multidimensional child poverty
index while the set of independent variables are selected household
characteristics, access to some infrastructure and public services, and
8 For ease of interpretation, the report does not present unnecessary technique on t-‐test. Only the results on t-‐test are provided.
MultidiMensional Child Poverty of ethniC Minority Childrensituation, dynamics, and Challenges30
30 | P a g e
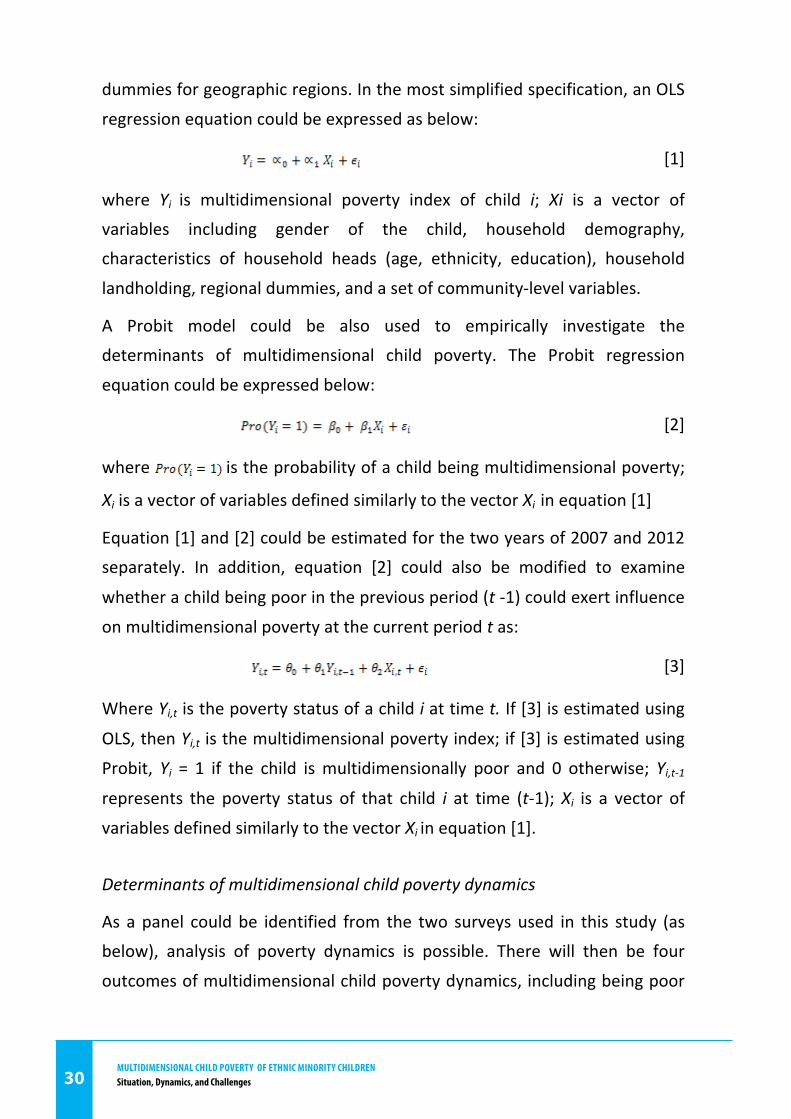
dummies for geographic regions. In the most simplified specification, an OLS
regression equation could be expressed as below:
[1]
where Yi is multidimensional poverty index of child i; Xi is a vector of
variables including gender of the child, household demography,
characteristics of household heads (age, ethnicity, education), household
landholding, regional dummies, and a set of community-‐level variables.
A Probit model could be also used to empirically investigate the
determinants of multidimensional child poverty. The Probit regression
equation could be expressed below:
[2]
where is the probability of a child being multidimensional poverty;
Xi is a vector of variables defined similarly to the vector Xi in equation [1]
Equation [1] and [2] could be estimated for the two years of 2007 and 2012
separately. In addition, equation [2] could also be modified to examine
whether a child being poor in the previous period (t -‐1) could exert influence
on multidimensional poverty at the current period t as:
[3]
Where Yi,t is the poverty status of a child i at time t. If [3] is estimated using
OLS, then Yi,t is the multidimensional poverty index; if [3] is estimated using
Probit, Yi = 1 if the child is multidimensionally poor and 0 otherwise; Yi,t-‐1
represents the poverty status of that child i at time (t-‐1); Xi is a vector of
variables defined similarly to the vector Xi in equation [1].
Determinants of multidimensional child poverty dynamics
As a panel could be identified from the two surveys used in this study (as
below), analysis of poverty dynamics is possible. There will then be four
outcomes of multidimensional child poverty dynamics, including being poor
MultidiMensional Child Poverty of ethniC Minority Childrensituation, dynamics, and Challenges 31
31 | P a g e
in both 2007 and 2012 (P-‐P); being poor in 2007 and non-‐poor 2012 (out of
poverty, P-‐NP); being non-‐poor in 2007 and poor in 2012 poverty (fall into
poverty) (NP-‐P); and being non-‐poor in both 2007 and 2012 (NP-‐NP).
Chapter 3 will empirically examine the determinants of these poverty
dynamics outcome. A multinomial logit (MNL) model is the relevant
econometric model in this context. The MNL model has been used in a
number of other studies on poverty dynamics in Vietnam. For example,
Glewwe et al (2002) and Justino et al (2008). The MNL regression equation
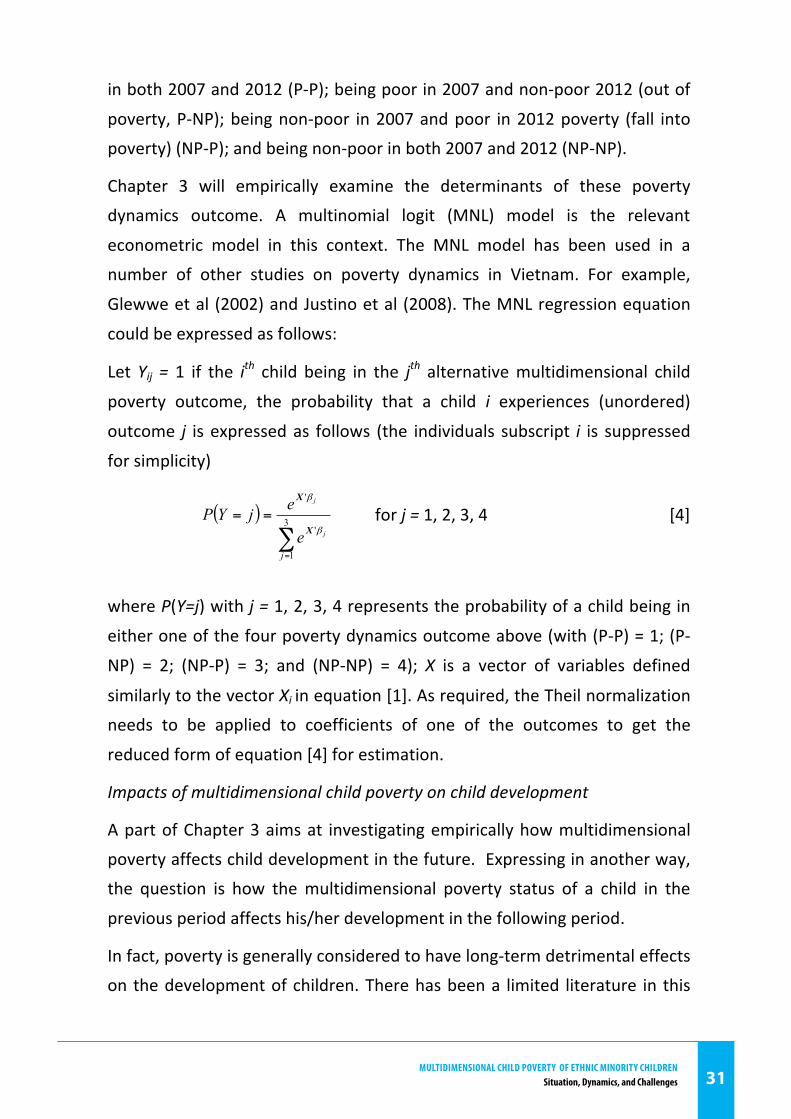
could be expressed as follows:
Let Yij = 1 if the ith child being in the jth alternative multidimensional child
poverty outcome, the probability that a child i experiences (unordered)
outcome j is expressed as follows (the individuals subscript i is suppressed
for simplicity)
( )∑=
== 3
1
'
'
j
j
j
e
ejYPβ
β
X
X
for j = 1, 2, 3, 4 [4]
where P(Y=j) with j = 1, 2, 3, 4 represents the probability of a child being in
either one of the four poverty dynamics outcome above (with (P-‐P) = 1; (P-‐
NP) = 2; (NP-‐P) = 3; and (NP-‐NP) = 4); X is a vector of variables defined
similarly to the vector Xi in equation [1]. As required, the Theil normalization
needs to be applied to coefficients of one of the outcomes to get the
reduced form of equation [4] for estimation.
Impacts of multidimensional child poverty on child development
A part of Chapter 3 aims at investigating empirically how multidimensional
poverty affects child development in the future. Expressing in another way,
the question is how the multidimensional poverty status of a child in the
previous period affects his/her development in the following period.
In fact, poverty is generally considered to have long-‐term detrimental effects
on the development of children. There has been a limited literature in this
MultidiMensional Child Poverty of ethniC Minority Childrensituation, dynamics, and Challenges32
32 | P a g e
direction. For instance, Emerson et al (2006), Power (2007), and Bromley et
al (2010) show that children growing up in poor households would face
many unfavourable health conditions in the future. Other studies argue that
children in poor families are more likely to be born underweight; this would
affect their physical health as well as spiritual development at later stage
(Hack et al, 1995; Anderson et al, 2007, Ben -‐ Shlomo, 2002). Further,
Carneiro et al (2007) show that children’s cognition can affect their wages at
adulthood, this finding is consistent with that by Blanden et al (2008).
However, examining this question is usually constrained by data availability.
In pursuing this exploration, a panel of children must be available for the
period under consideration. Measurement of child development outcomes
represents another empirical challenge. In addition, controlling for factors
that could simultaneously affect child poverty and some child development
outcome is not an easy empirical task. As an explorative exercise, one part of
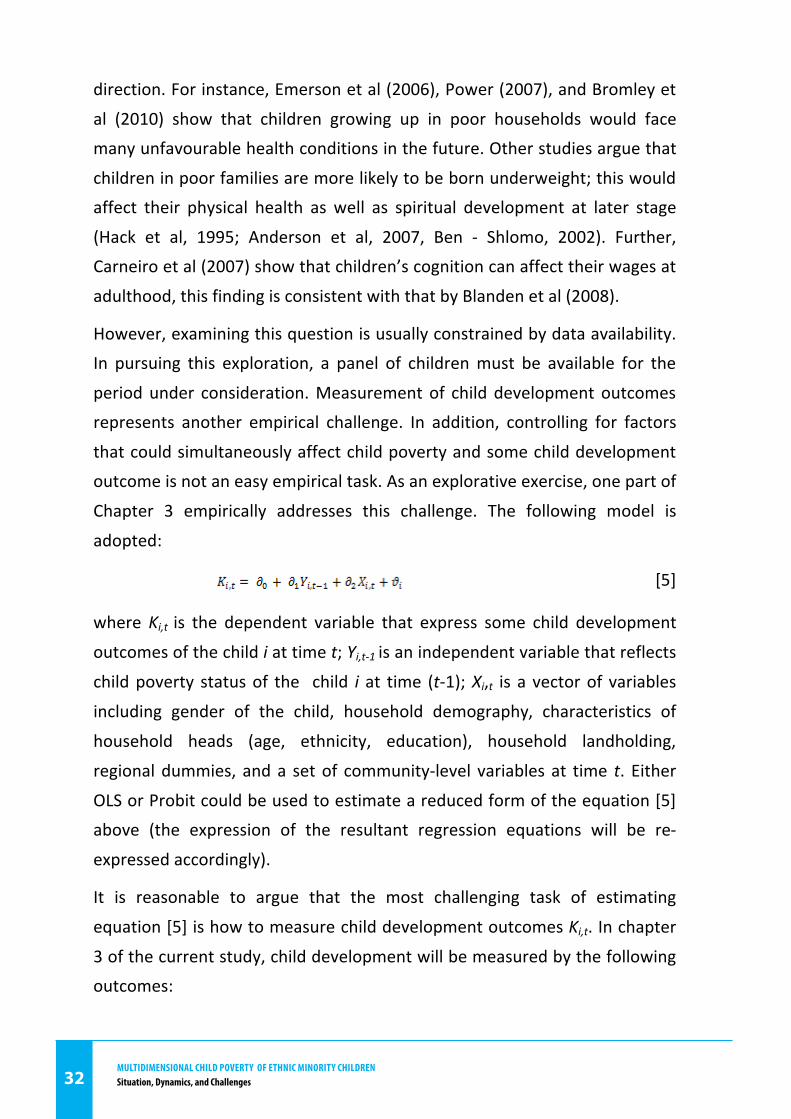
Chapter 3 empirically addresses this challenge. The following model is
adopted:
[5]
where Ki,t is the dependent variable that express some child development
outcomes of the child i at time t; Yi,t-‐1 is an independent variable that reflects
child poverty status of the child i at time (t-‐1); Xi,t is a vector of variables
including gender of the child, household demography, characteristics of
household heads (age, ethnicity, education), household landholding,
regional dummies, and a set of community-‐level variables at time t. Either
OLS or Probit could be used to estimate a reduced form of the equation [5]
above (the expression of the resultant regression equations will be re-‐
expressed accordingly).
It is reasonable to argue that the most challenging task of estimating
equation [5] is how to measure child development outcomes Ki,t. In chapter
3 of the current study, child development will be measured by the following
outcomes:
MultidiMensional Child Poverty of ethniC Minority Childrensituation, dynamics, and Challenges 33
33 | P a g e
� Child’s number of years of schooling: the hypothesis is that if a child was
at time (t-‐1), then the number of years of schooling he/she obtains at
time t would be lower than that of other non-‐poor children, on average
and ceteris paribus.
� Child labour: the hypothesis for testing is that if a child was poor at time
(t-‐1), he or she could be more likely to engage in child labour at time t.
Thus, poor child at time (t-‐1) may increase the probability of engaging in
child labour at time t.
� Number of sick days: this variable captures the number of sick days in the
last 12 months. The question to examine is that if a child was poor in
period (t-‐1), this would affect his/her health at time t. In addition to this
variable, two other alternatives are also explored, including being ill in
the last 12 months and having medical treatment in the last 12 months.
� Indebtedness: it is a likely that if a child was in a poor family at time (t-‐1),
his/her family would be more likely to be indebted at time t.
� Shelter condition: this is to test the hypothesis that if a child was poor at
time (t-‐1), the probability of his family having a permanent house at time
t would be reduced.
� Participation of rural households in a village meeting for selection of
priority projects: the question to empirically examine is that a household
with poor child is less likely to actively participate in the village meeting
compared to other households.
II. Data sources
This study makes use of the data available from the Baseline and End-‐line
Surveys of Program 135-‐II as the main data source for its analysis. These two
Surveys were conducted in 2007 and 2012, respectively. The surveys cover
the same sample of nearly 6,000 households residing in 400 communes. All
of these communes located in the areas with the most difficult socio-‐
MultidiMensional Child Poverty of ethniC Minority Childrensituation, dynamics, and Challenges34
34 | P a g e
economic conditions, and 76 percent of surveyed households are ethnic
minority groups. The samples of the two surveys were selected using the
same sampling procedure and could be considered as representative of the
areas with most difficult socio-‐economic conditions across the country.
These two surveys are arguably one of the most comprehensive data source
on the living standards of the ethnic minority groups to date. Since these
two surveys became available, the dataset has been used in most of the
studies and policy debates on ethnic minority groups in Vietnam (see, for
instance, IRC, UNDP and CEMA, 2010; 2013 for a review).
For this study, the baseline survey covers a sample of 9,817 children aged 0-‐
15, of which 86 percent are ethnic minorities. The end-‐line survey consists of
8,919 children aged 0-‐15, of which 87 percent are ethnic minorities. From
these two samples, a panel of 7,207 children could be identified as the basis
for the analysis of child poverty dynamics in this study. Using this panel
allows an empirical examination of different poverty dynamics outcomes
between 2007 and 2012. It also allows an analysis on potential effects of
child poverty in 2007 on some outcomes of child development in 2012. It is
important to note that these 5-‐year period coincided with the timeframe of
Program 135-‐II (as one of the most important poverty reduction initiative led
by the Government) and many other poverty reduction initiatives for ethnic
minorities. Therefore, the poverty dynamics analysis produced in this report
is expected to provide further evidence on the impacts of policies and
programs on poverty among ethnic minority groups (see IRC, UNDP and
CEMA, 2013 for a final impact evaluation of Program 135-‐II).
In addition, the study makes use of data sources, including (i) data available
from the VHLSS, when relevant to make comparison; (ii) data from other
sources, for instance, Ministry of Education and Training (MoET) or Central
Committee for Ethnic Minorities (CEMA) to validate the analysis; (iii) some
additional data on resource allocation for selected policies and programs
when analysing existing poverty reduction initiatives (see Chapter 4 for more
details on these policies).
MultidiMensional Child Poverty of ethniC Minority Childrensituation, dynamics, and Challenges 35
35 | P a g e
Some limitations of the study were considered. It is important to note that
the surveys were designed to capture the target areas of Program 135-‐II and
hence the samples could be considered as representative for the areas with
most difficult socio-‐economic conditions with high concentration of ethnic
minorities.9 The figures and analysis reported in the study should be
interpreted as those that are relevant for these areas with high
concentration of ethnic minorities. In addition, the surveys were designed to
evaluate the impacts of Program 135-‐II rather than to inform
multidimensional poverty of those in the ethnic minority areas and thus
these data sources are not sufficient to inform some poverty domains
employed in the current report. For instance, there is little information on
social inclusion of ethnic minority children (as discussed above). This
warrants areas for future research on multidimensional child poverty in the
country.
9 This study will use the words “most difficult areas”, “areas with high concentration of ethnic minorities”, or “ethnic minority areas” interchangeably to refer to these areas of with social-‐economic difficulties, mountainous areas, and areas with high concentration of ethnic minorities.
MultidiMensional Child Poverty of ethniC Minority Childrensituation, dynamics, and Challenges36
36 | P a g e
Chapter 2: Multidimensional Child Poverty of Ethnic
Minorities in Vietnam
This chapter presents analytical results of multidimensional ethnic minority
child poverty using the methodological framework explained in Chapter 1. In
the first part of this chapter, the unidimensional poverty (i.e. income
poverty) results are presented to provide the 'base' to compare to the other
poverty dimensions of multidimensional approach. Part II focuses on the
dimensions of education, health, shelter conditions, water and sanitation,
child labor and social inclusion. On that basis, part III calculates the
multidimensional poverty index to highlight multidimensional child poverty
in the ethnic minority areas.
I. Child Poverty: Unidimensional approach
Table 2.1 shows the poverty rate under unidimensional approach using the
official income poverty line defined by the Government.10 Results show that
the rate of income child poverty fell 11 percentage points between 2007 and
2012 in the most difficult communes, particularly income poverty rate was
60.5 percent in 2007 and 50 percent in 2012. Thus, during this period, the
poverty rate of children in ethnic minority areas decreased by more than 2
percentage points per year. This rate was significantly higher than the
calculation of GSO (2011) which used data from VHLSS and a similar
methods of calculation, whereby the national child poverty rate was 20.7
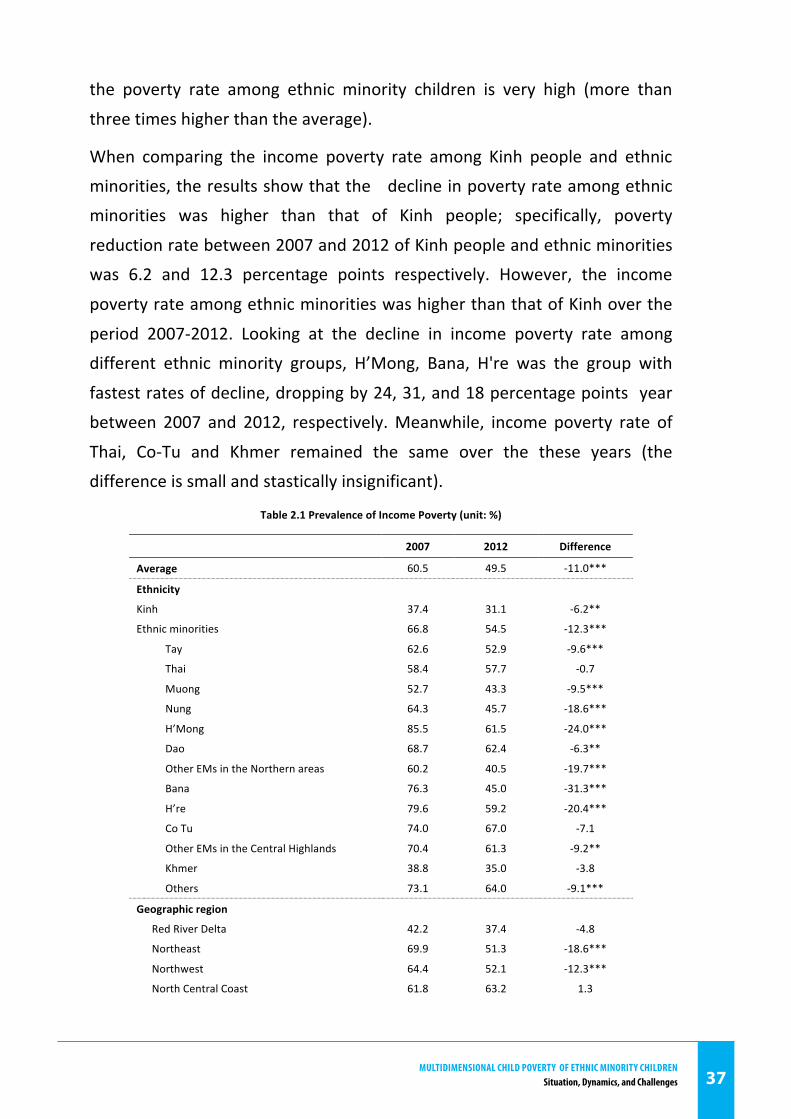
percent.11 Compared with the poverty rate of children across the country,
10 For unidimensional poverty (i.e. income poverty) approach , a child is poor in income if residing in a household with monthly per capita income of less than 200.000 VND/month in 2007 (applied before 2010) and less than 400.000 vnd/month in 2012 (applied from 2010 onward). 11 On the contrary, according to offical statistics, the income poverty rate using national poverty line in 2010 was 14.2 percent (and 20.7 percent by WB-‐GSO poverty line in the same year).
MultidiMensional Child Poverty of ethniC Minority Childrensituation, dynamics, and Challenges 37
37 | P a g e
the poverty rate among ethnic minority children is very high (more than
three times higher than the average).
When comparing the income poverty rate among Kinh people and ethnic
minorities, the results show that the decline in poverty rate among ethnic
minorities was higher than that of Kinh people; specifically, poverty
reduction rate between 2007 and 2012 of Kinh people and ethnic minorities
was 6.2 and 12.3 percentage points respectively. However, the income
poverty rate among ethnic minorities was higher than that of Kinh over the
period 2007-‐2012. Looking at the decline in income poverty rate among
different ethnic minority groups, H’Mong, Bana, H're was the group with
fastest rates of decline, dropping by 24, 31, and 18 percentage points year
between 2007 and 2012, respectively. Meanwhile, income poverty rate of
Thai, Co-‐Tu and Khmer remained the same over the these years (the
difference is small and stastically insignificant).
Table 2.1 Prevalence of Income Poverty (unit: %)
2007 2012 Difference
Average 60.5 49.5 -‐11.0***
Ethnicity
Kinh 37.4 31.1 -‐6.2**
Ethnic minorities 66.8 54.5 -‐12.3***
Tay 62.6 52.9 -‐9.6***
Thai 58.4 57.7 -‐0.7
Muong 52.7 43.3 -‐9.5***
Nung 64.3 45.7 -‐18.6***
H’Mong 85.5 61.5 -‐24.0***
Dao 68.7 62.4 -‐6.3**
Other EMs in the Northern areas 60.2 40.5 -‐19.7***
Bana 76.3 45.0 -‐31.3***
H’re 79.6 59.2 -‐20.4***
Co Tu 74.0 67.0 -‐7.1
Other EMs in the Central Highlands 70.4 61.3 -‐9.2**
Khmer 38.8 35.0 -‐3.8
Others 73.1 64.0 -‐9.1***
Geographic region
Red River Delta 42.2 37.4 -‐4.8
Northeast 69.9 51.3 -‐18.6***
Northwest 64.4 52.1 -‐12.3***
North Central Coast 61.8 63.2 1.3
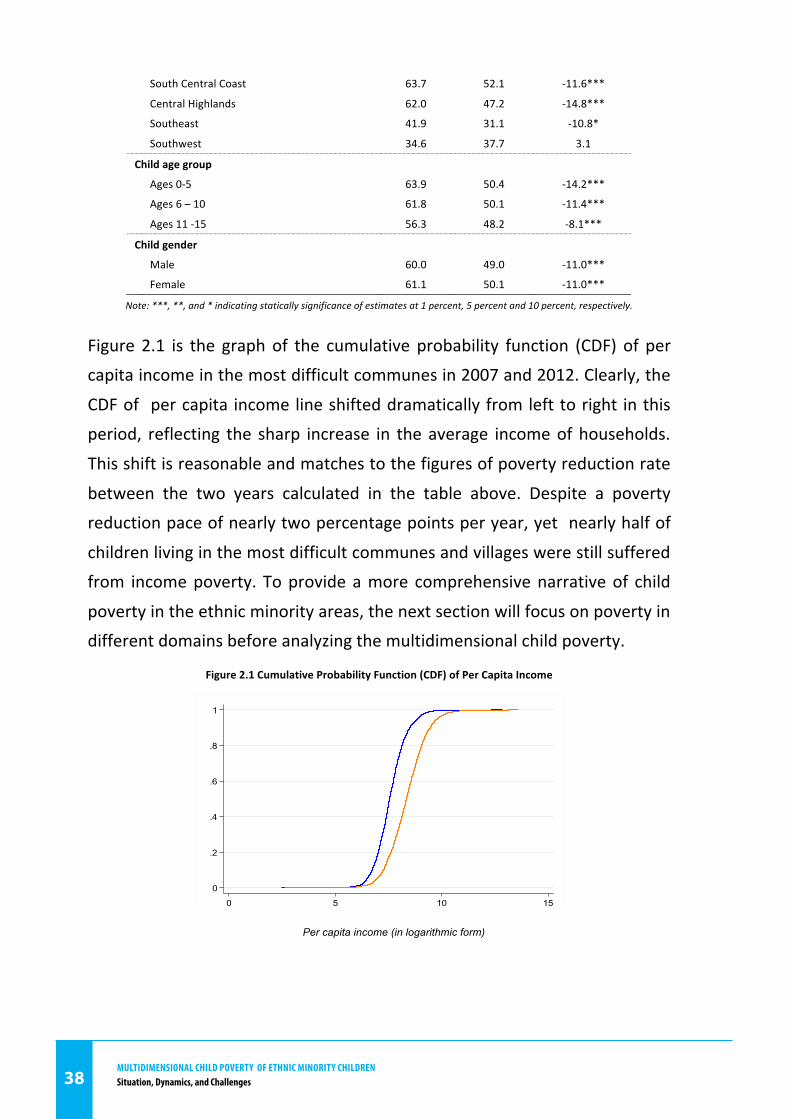
MultidiMensional Child Poverty of ethniC Minority Childrensituation, dynamics, and Challenges38
38 | P a g e
South Central Coast 63.7 52.1 -‐11.6***
Central Highlands 62.0 47.2 -‐14.8***
Southeast 41.9 31.1 -‐10.8*
Southwest 34.6 37.7 3.1
Child age group
Ages 0-‐5 63.9 50.4 -‐14.2***
Ages 6 – 10 61.8 50.1 -‐11.4***
Ages 11 -‐15 56.3 48.2 -‐8.1***
Child gender
Male 60.0 49.0 -‐11.0***
Female 61.1 50.1 -‐11.0***
Note: ***, **, and * indicating statically significance of estimates at 1 percent, 5 percent and 10 percent, respectively.
Figure 2.1 is the graph of the cumulative probability function (CDF) of per
capita income in the most difficult communes in 2007 and 2012. Clearly, the
CDF of per capita income line shifted dramatically from left to right in this
period, reflecting the sharp increase in the average income of households.
This shift is reasonable and matches to the figures of poverty reduction rate
between the two years calculated in the table above. Despite a poverty
reduction pace of nearly two percentage points per year, yet nearly half of
children living in the most difficult communes and villages were still suffered
from income poverty. To provide a more comprehensive narrative of child
poverty in the ethnic minority areas, the next section will focus on poverty in
different domains before analyzing the multidimensional child poverty.
Figure 2.1 Cumulative Probability Function (CDF) of Per Capita Income
0
.2
.4
.6
.8
1
0 5 10 15
c.d.f. of 2007 c.d.f. of 2012
Per capita income (in logarithmic form)
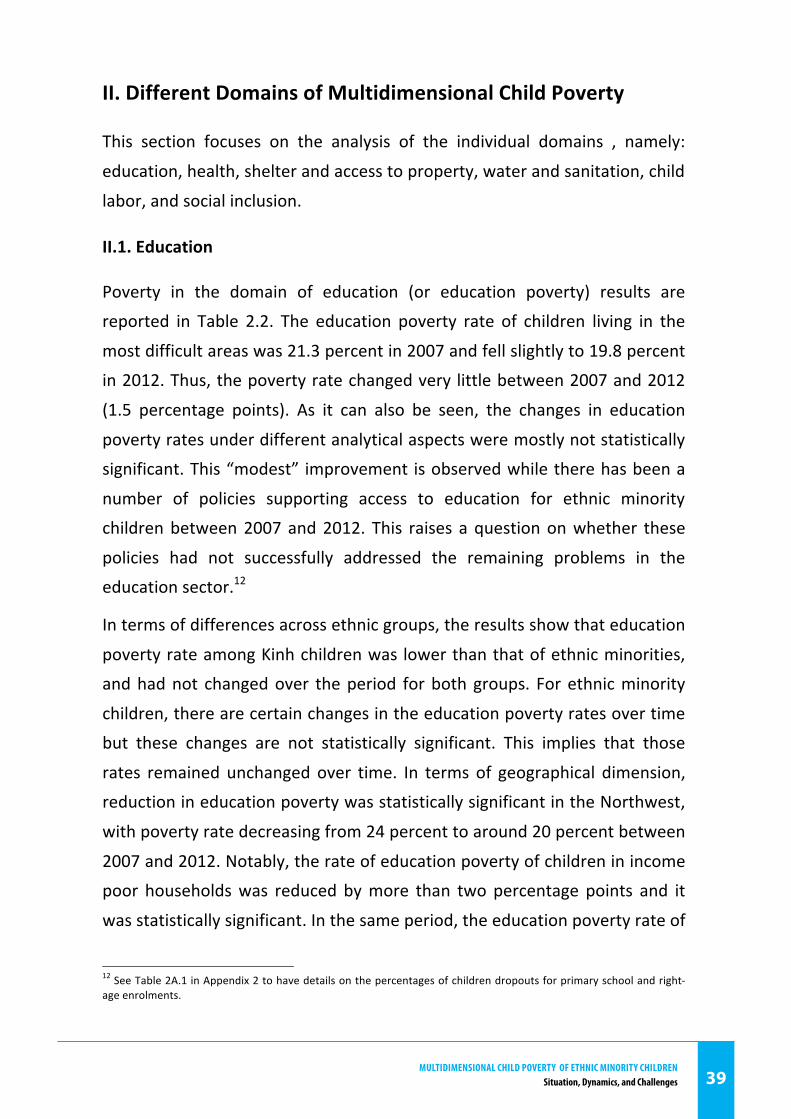
MultidiMensional Child Poverty of ethniC Minority Childrensituation, dynamics, and Challenges 39
39 | P a g e
II. Different Domains of Multidimensional Child Poverty
This section focuses on the analysis of the individual domains , namely:
education, health, shelter and access to property, water and sanitation, child
labor, and social inclusion.
II.1. Education
Poverty in the domain of education (or education poverty) results are
reported in Table 2.2. The education poverty rate of children living in the
most difficult areas was 21.3 percent in 2007 and fell slightly to 19.8 percent
in 2012. Thus, the poverty rate changed very little between 2007 and 2012
(1.5 percentage points). As it can also be seen, the changes in education
poverty rates under different analytical aspects were mostly not statistically
significant. This “modest” improvement is observed while there has been a
number of policies supporting access to education for ethnic minority
children between 2007 and 2012. This raises a question on whether these
policies had not successfully addressed the remaining problems in the
education sector.12
In terms of differences across ethnic groups, the results show that education
poverty rate among Kinh children was lower than that of ethnic minorities,
and had not changed over the period for both groups. For ethnic minority
children, there are certain changes in the education poverty rates over time
but these changes are not statistically significant. This implies that those
rates remained unchanged over time. In terms of geographical dimension,
reduction in education poverty was statistically significant in the Northwest,
with poverty rate decreasing from 24 percent to around 20 percent between
2007 and 2012. Notably, the rate of education poverty of children in income
poor households was reduced by more than two percentage points and it
was statistically significant. In the same period, the education poverty rate of
12 See Table 2A.1 in Appendix 2 to have details on the percentages of children dropouts for primary school and right-‐age enrolments.
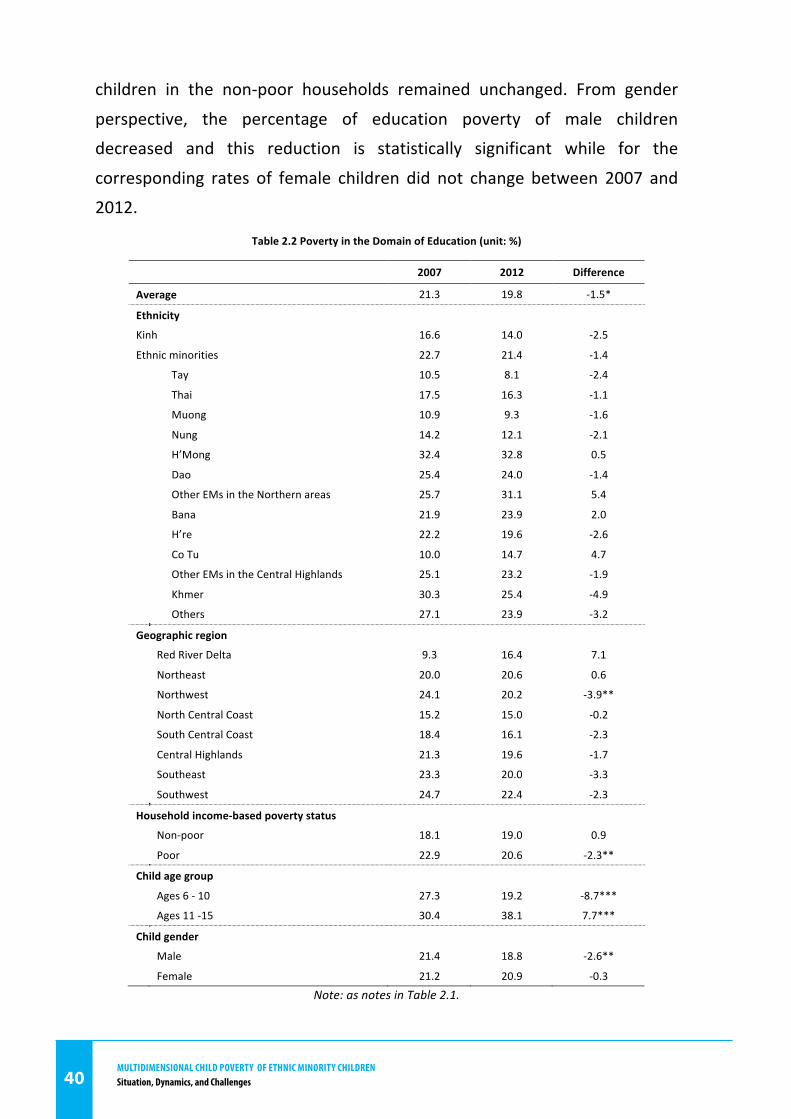
MultidiMensional Child Poverty of ethniC Minority Childrensituation, dynamics, and Challenges40
40 | P a g e
children in the non-‐poor households remained unchanged. From gender
perspective, the percentage of education poverty of male children
decreased and this reduction is statistically significant while for the
corresponding rates of female children did not change between 2007 and
2012.
Table 2.2 Poverty in the Domain of Education (unit: %)
2007 2012 Difference
Average 21.3 19.8 -‐1.5*
Ethnicity
Kinh 16.6 14.0 -‐2.5
Ethnic minorities 22.7 21.4 -‐1.4
Tay 10.5 8.1 -‐2.4
Thai 17.5 16.3 -‐1.1
Muong 10.9 9.3 -‐1.6
Nung 14.2 12.1 -‐2.1
H’Mong 32.4 32.8 0.5
Dao 25.4 24.0 -‐1.4
Other EMs in the Northern areas 25.7 31.1 5.4
Bana 21.9 23.9 2.0
H’re 22.2 19.6 -‐2.6
Co Tu 10.0 14.7 4.7
Other EMs in the Central Highlands 25.1 23.2 -‐1.9
Khmer 30.3 25.4 -‐4.9
Others 27.1 23.9 -‐3.2
Geographic region
Red River Delta 9.3 16.4 7.1
Northeast 20.0 20.6 0.6
Northwest 24.1 20.2 -‐3.9**
North Central Coast 15.2 15.0 -‐0.2
South Central Coast 18.4 16.1 -‐2.3
Central Highlands 21.3 19.6 -‐1.7
Southeast 23.3 20.0 -‐3.3
Southwest 24.7 22.4 -‐2.3
Household income-‐based poverty status
Non-‐poor 18.1 19.0 0.9
Poor 22.9 20.6 -‐2.3**
Child age group
Ages 6 -‐ 10 27.3 19.2 -‐8.7***
Ages 11 -‐15 30.4 38.1 7.7***
Child gender
Male 21.4 18.8 -‐2.6**
Female 21.2 20.9 -‐0.3
Note: as notes in Table 2.1.
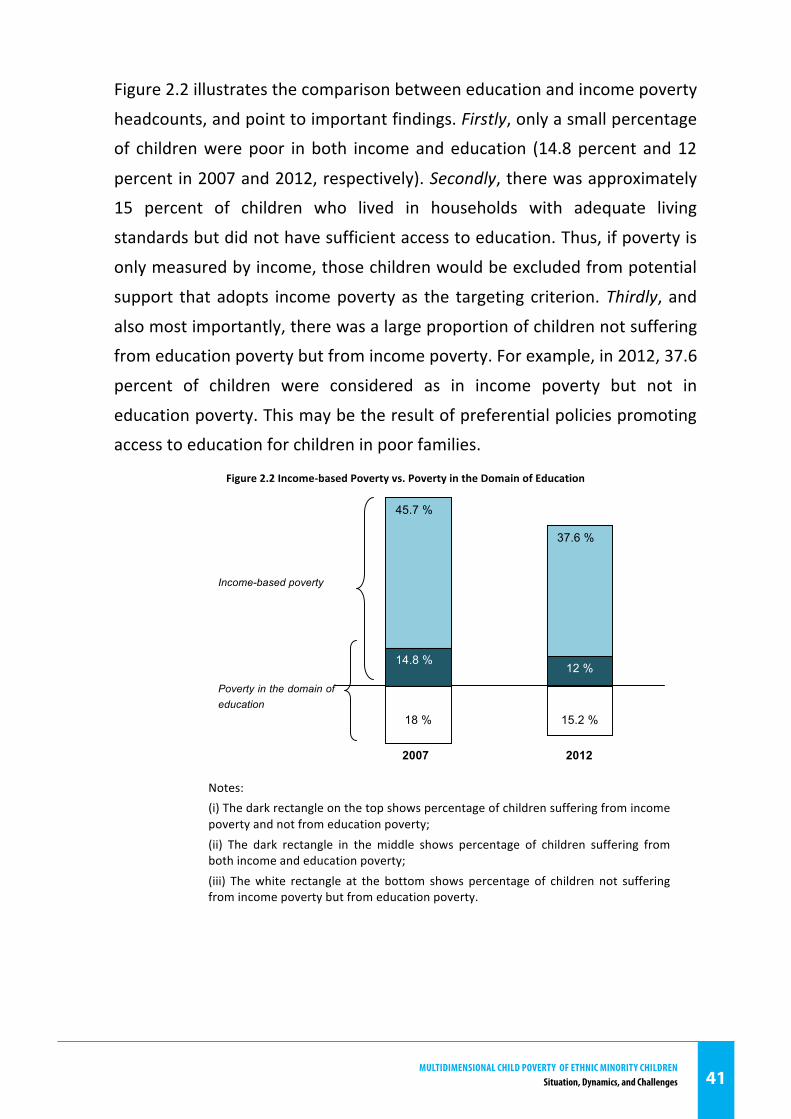
MultidiMensional Child Poverty of ethniC Minority Childrensituation, dynamics, and Challenges 41
41 | P a g e
Figure 2.2 illustrates the comparison between education and income poverty
headcounts, and point to important findings. Firstly, only a small percentage
of children were poor in both income and education (14.8 percent and 12
percent in 2007 and 2012, respectively). Secondly, there was approximately
15 percent of children who lived in households with adequate living
standards but did not have sufficient access to education. Thus, if poverty is
only measured by income, those children would be excluded from potential
support that adopts income poverty as the targeting criterion. Thirdly, and
also most importantly, there was a large proportion of children not suffering
from education poverty but from income poverty. For example, in 2012, 37.6
percent of children were considered as in income poverty but not in
education poverty. This may be the result of preferential policies promoting
access to education for children in poor families.
Figure 2.2 Income-‐based Poverty vs. Poverty in the Domain of Education
Notes: (i) The dark rectangle on the top shows percentage of children suffering from income poverty and not from education poverty; (ii) The dark rectangle in the middle shows percentage of children suffering from both income and education poverty; (iii) The white rectangle at the bottom shows percentage of children not suffering from income poverty but from education poverty.
2007 2012
Income-based poverty
Poverty in the domain of education
45.7 %
18 %
14.8 %
18 %
37.6 %
15.2 %
12 %
15,2 %
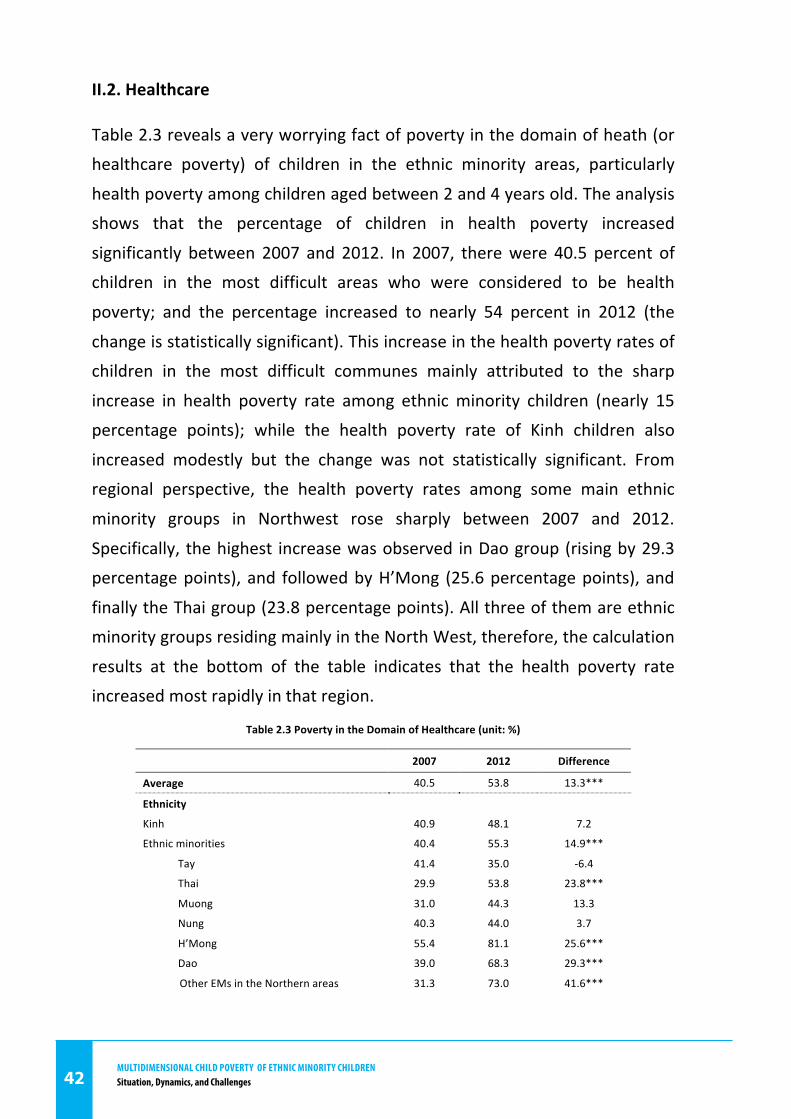
MultidiMensional Child Poverty of ethniC Minority Childrensituation, dynamics, and Challenges42
42 | P a g e
II.2. Healthcare
Table 2.3 reveals a very worrying fact of poverty in the domain of heath (or
healthcare poverty) of children in the ethnic minority areas, particularly
health poverty among children aged between 2 and 4 years old. The analysis
shows that the percentage of children in health poverty increased
significantly between 2007 and 2012. In 2007, there were 40.5 percent of
children in the most difficult areas who were considered to be health
poverty; and the percentage increased to nearly 54 percent in 2012 (the
change is statistically significant). This increase in the health poverty rates of
children in the most difficult communes mainly attributed to the sharp
increase in health poverty rate among ethnic minority children (nearly 15
percentage points); while the health poverty rate of Kinh children also
increased modestly but the change was not statistically significant. From
regional perspective, the health poverty rates among some main ethnic
minority groups in Northwest rose sharply between 2007 and 2012.
Specifically, the highest increase was observed in Dao group (rising by 29.3
percentage points), and followed by H’Mong (25.6 percentage points), and
finally the Thai group (23.8 percentage points). All three of them are ethnic
minority groups residing mainly in the North West, therefore, the calculation
results at the bottom of the table indicates that the health poverty rate
increased most rapidly in that region.
Table 2.3 Poverty in the Domain of Healthcare (unit: %)
2007 2012 Difference
Average 40.5 53.8 13.3***
Ethnicity
Kinh 40.9 48.1 7.2
Ethnic minorities 40.4 55.3 14.9***
Tay 41.4 35.0 -‐6.4
Thai 29.9 53.8 23.8***
Muong 31.0 44.3 13.3
Nung 40.3 44.0 3.7
H’Mong 55.4 81.1 25.6***
Dao 39.0 68.3 29.3***
Other EMs in the Northern areas 31.3 73.0 41.6***
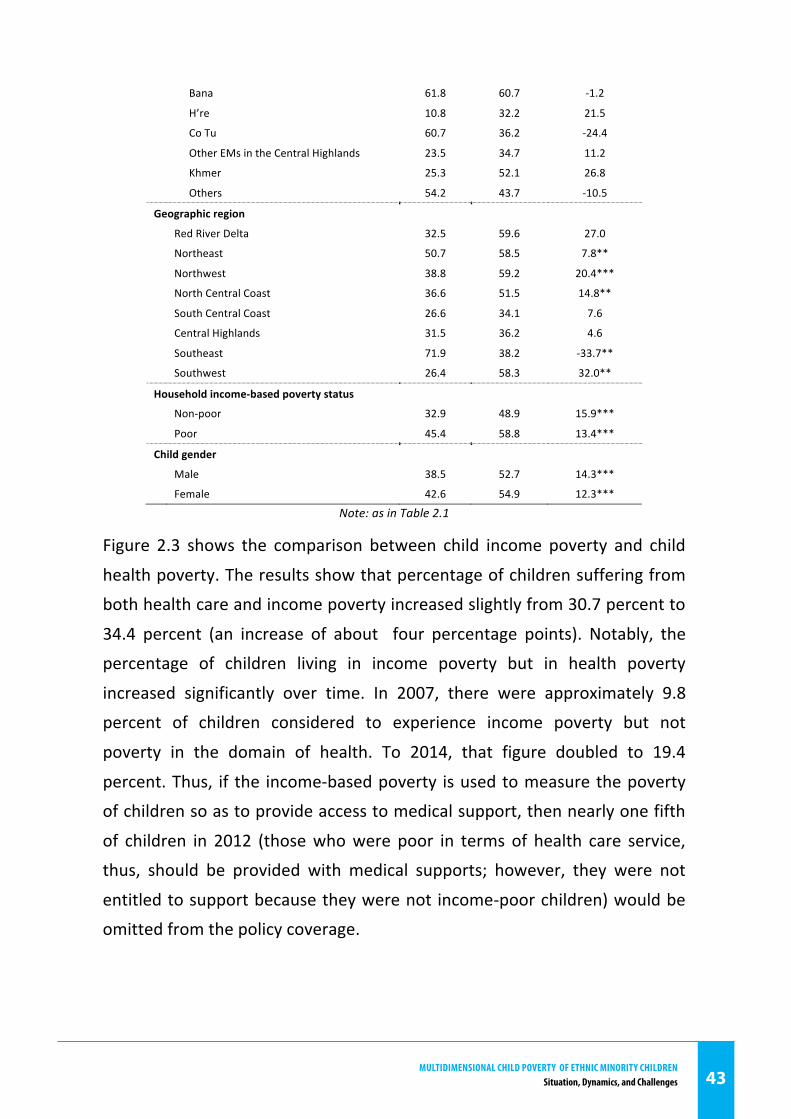
MultidiMensional Child Poverty of ethniC Minority Childrensituation, dynamics, and Challenges 43
43 | P a g e
Bana 61.8 60.7 -‐1.2
H’re 10.8 32.2 21.5
Co Tu 60.7 36.2 -‐24.4
Other EMs in the Central Highlands 23.5 34.7 11.2
Khmer 25.3 52.1 26.8
Others 54.2 43.7 -‐10.5
Geographic region
Red River Delta 32.5 59.6 27.0
Northeast 50.7 58.5 7.8**
Northwest 38.8 59.2 20.4***
North Central Coast 36.6 51.5 14.8**
South Central Coast 26.6 34.1 7.6
Central Highlands 31.5 36.2 4.6
Southeast 71.9 38.2 -‐33.7**
Southwest 26.4 58.3 32.0**
Household income-‐based poverty status
Non-‐poor 32.9 48.9 15.9***
Poor 45.4 58.8 13.4***
Child gender
Male 38.5 52.7 14.3***
Female 42.6 54.9 12.3***
Note: as in Table 2.1
Figure 2.3 shows the comparison between child income poverty and child
health poverty. The results show that percentage of children suffering from
both health care and income poverty increased slightly from 30.7 percent to
34.4 percent (an increase of about four percentage points). Notably, the
percentage of children living in income poverty but in health poverty
increased significantly over time. In 2007, there were approximately 9.8
percent of children considered to experience income poverty but not
poverty in the domain of health. To 2014, that figure doubled to 19.4
percent. Thus, if the income-‐based poverty is used to measure the poverty
of children so as to provide access to medical support, then nearly one fifth
of children in 2012 (those who were poor in terms of health care service,
thus, should be provided with medical supports; however, they were not
entitled to support because they were not income-‐poor children) would be
omitted from the policy coverage.
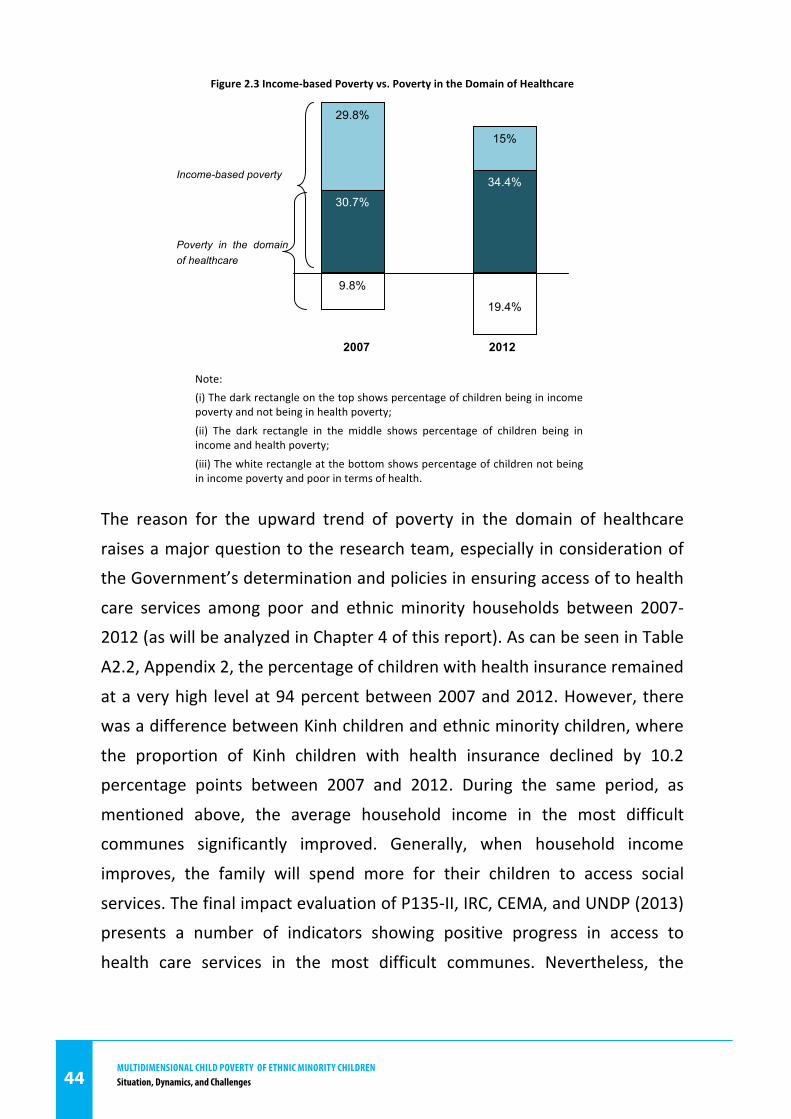
MultidiMensional Child Poverty of ethniC Minority Childrensituation, dynamics, and Challenges44
44 | P a g e
Figure 2.3 Income-‐based Poverty vs. Poverty in the Domain of Healthcare
Note: (i) The dark rectangle on the top shows percentage of children being in income poverty and not being in health poverty;
(ii) The dark rectangle in the middle shows percentage of children being in income and health poverty;
(iii) The white rectangle at the bottom shows percentage of children not being in income poverty and poor in terms of health.
The reason for the upward trend of poverty in the domain of healthcare
raises a major question to the research team, especially in consideration of
the Government’s determination and policies in ensuring access of to health
care services among poor and ethnic minority households between 2007-‐
2012 (as will be analyzed in Chapter 4 of this report). As can be seen in Table
A2.2, Appendix 2, the percentage of children with health insurance remained
at a very high level at 94 percent between 2007 and 2012. However, there
was a difference between Kinh children and ethnic minority children, where
the proportion of Kinh children with health insurance declined by 10.2
percentage points between 2007 and 2012. During the same period, as
mentioned above, the average household income in the most difficult
communes significantly improved. Generally, when household income
improves, the family will spend more for their children to access social
services. The final impact evaluation of P135-‐II, IRC, CEMA, and UNDP (2013)
presents a number of indicators showing positive progress in access to
health care services in the most difficult communes. Nevertheless, the
Poverty in the domain of healthcare
29.8%
9.8%
15%
19.4%
30.7%
9,8 %
34.4%
19,4 %
Income-based poverty
2007 2012
MultidiMensional Child Poverty of ethniC Minority Childrensituation, dynamics, and Challenges 45
45 | P a g e
calculation using actual data shows that child health poverty increased
significantly over time.
The methodology used to measure health poverty may partially be
attributed to this result. In the absence of detailed information on the health
and nutrition situations of children, we assume that if children aged
between 2 and 4 years old (whose frequency of sickness is often higher than
the older age groups) and did not go to the medical facility within the past
12 months shall be considered as being in health poverty. This assumption is
also used in the previous studies about the child health poverty. However,
this assumption is quite misleading because there is the possibility that
healthy children might have not needed to use health care services in the
previous 12 months and had been considered as being in health poverty.
Another possibility is that some children did not go to a health facility but
were treated at home when they are sick, and thus, were also classified as
being in health poverty. With the availability of data from the survey of
Program 135-‐ II, this measurement problem is not addressed thoroughly due
to the absence of detailed and suitable information on health conditions of
children. Given such conditions, tracing the cause of the increase in the
health child poverty rate should require further studies.
II.3. Shelter
Table 2.4 shows the results on poverty in the domain of shelter (or shelter
poverty), revealing that the percentage of children in shelter poverty fell by
23.6 percentage points (from 60 percent to 36 percent) between 2007 and
2012. The rate of reduction in shelter poverty among children from ethnic
minorities was the same as among the children from the majority both
decreased by 23.9 percentage points). However, there was still a large gap
between shelter conditions between ethnic minority and Kinh children.
Specifically, while 23 percent of Kinh children experienced shelter poverty,
this rate of ethnic minority groups was nearly 40 percent in 2012.
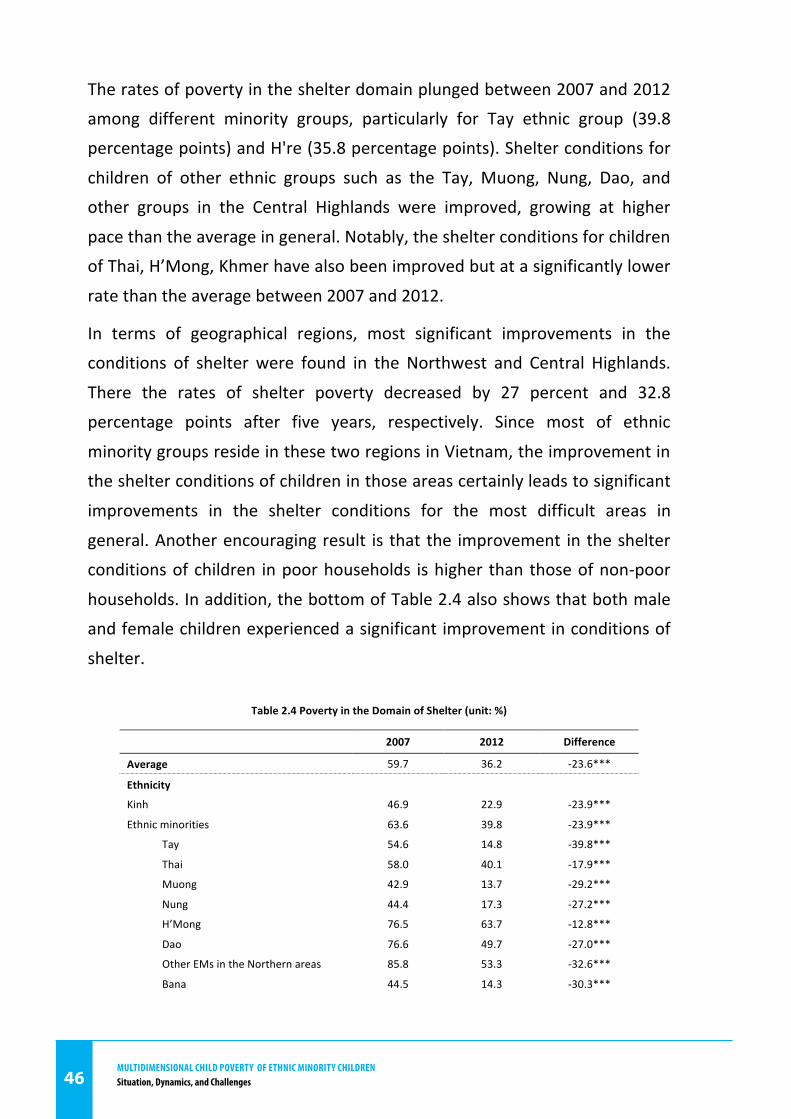
MultidiMensional Child Poverty of ethniC Minority Childrensituation, dynamics, and Challenges46
46 | P a g e
The rates of poverty in the shelter domain plunged between 2007 and 2012
among different minority groups, particularly for Tay ethnic group (39.8
percentage points) and H're (35.8 percentage points). Shelter conditions for
children of other ethnic groups such as the Tay, Muong, Nung, Dao, and
other groups in the Central Highlands were improved, growing at higher
pace than the average in general. Notably, the shelter conditions for children
of Thai, H’Mong, Khmer have also been improved but at a significantly lower
rate than the average between 2007 and 2012.
In terms of geographical regions, most significant improvements in the
conditions of shelter were found in the Northwest and Central Highlands.
There the rates of shelter poverty decreased by 27 percent and 32.8
percentage points after five years, respectively. Since most of ethnic
minority groups reside in these two regions in Vietnam, the improvement in
the shelter conditions of children in those areas certainly leads to significant
improvements in the shelter conditions for the most difficult areas in
general. Another encouraging result is that the improvement in the shelter
conditions of children in poor households is higher than those of non-‐poor
households. In addition, the bottom of Table 2.4 also shows that both male
and female children experienced a significant improvement in conditions of
shelter.
Table 2.4 Poverty in the Domain of Shelter (unit: %)
2007 2012 Difference
Average 59.7 36.2 -‐23.6***
Ethnicity
Kinh 46.9 22.9 -‐23.9***
Ethnic minorities 63.6 39.8 -‐23.9***
Tay 54.6 14.8 -‐39.8***
Thai 58.0 40.1 -‐17.9***
Muong 42.9 13.7 -‐29.2***
Nung 44.4 17.3 -‐27.2***
H’Mong 76.5 63.7 -‐12.8***
Dao 76.6 49.7 -‐27.0***
Other EMs in the Northern areas 85.8 53.3 -‐32.6***
Bana 44.5 14.3 -‐30.3***
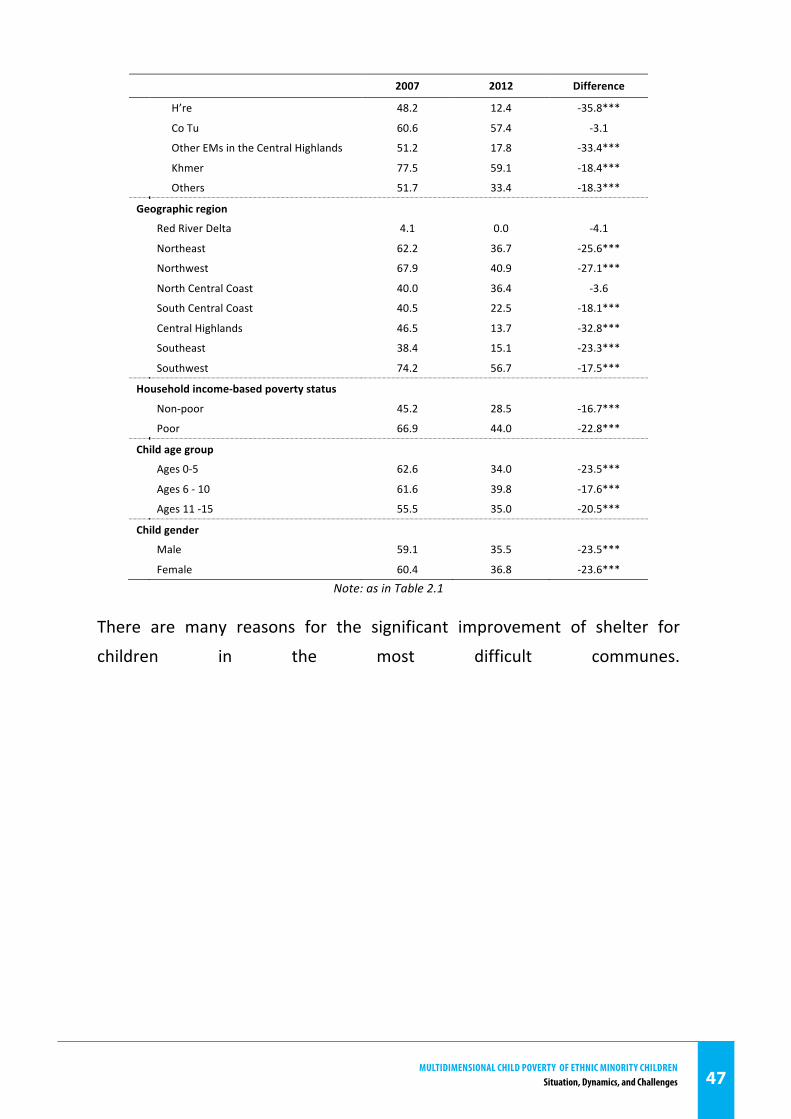
MultidiMensional Child Poverty of ethniC Minority Childrensituation, dynamics, and Challenges 47
47 | P a g e
2007 2012 Difference
H’re 48.2 12.4 -‐35.8***
Co Tu 60.6 57.4 -‐3.1
Other EMs in the Central Highlands 51.2 17.8 -‐33.4***
Khmer 77.5 59.1 -‐18.4***
Others 51.7 33.4 -‐18.3***
Geographic region
Red River Delta 4.1 0.0 -‐4.1
Northeast 62.2 36.7 -‐25.6***
Northwest 67.9 40.9 -‐27.1***
North Central Coast 40.0 36.4 -‐3.6
South Central Coast 40.5 22.5 -‐18.1***
Central Highlands 46.5 13.7 -‐32.8***
Southeast 38.4 15.1 -‐23.3***
Southwest 74.2 56.7 -‐17.5***
Household income-‐based poverty status
Non-‐poor 45.2 28.5 -‐16.7***
Poor 66.9 44.0 -‐22.8***
Child age group
Ages 0-‐5 62.6 34.0 -‐23.5***
Ages 6 -‐ 10 61.6 39.8 -‐17.6***
Ages 11 -‐15 55.5 35.0 -‐20.5***
Child gender
Male 59.1 35.5 -‐23.5***
Female 60.4 36.8 -‐23.6***
Note: as in Table 2.1
There are many reasons for the significant improvement of shelter for
children in the most difficult communes.
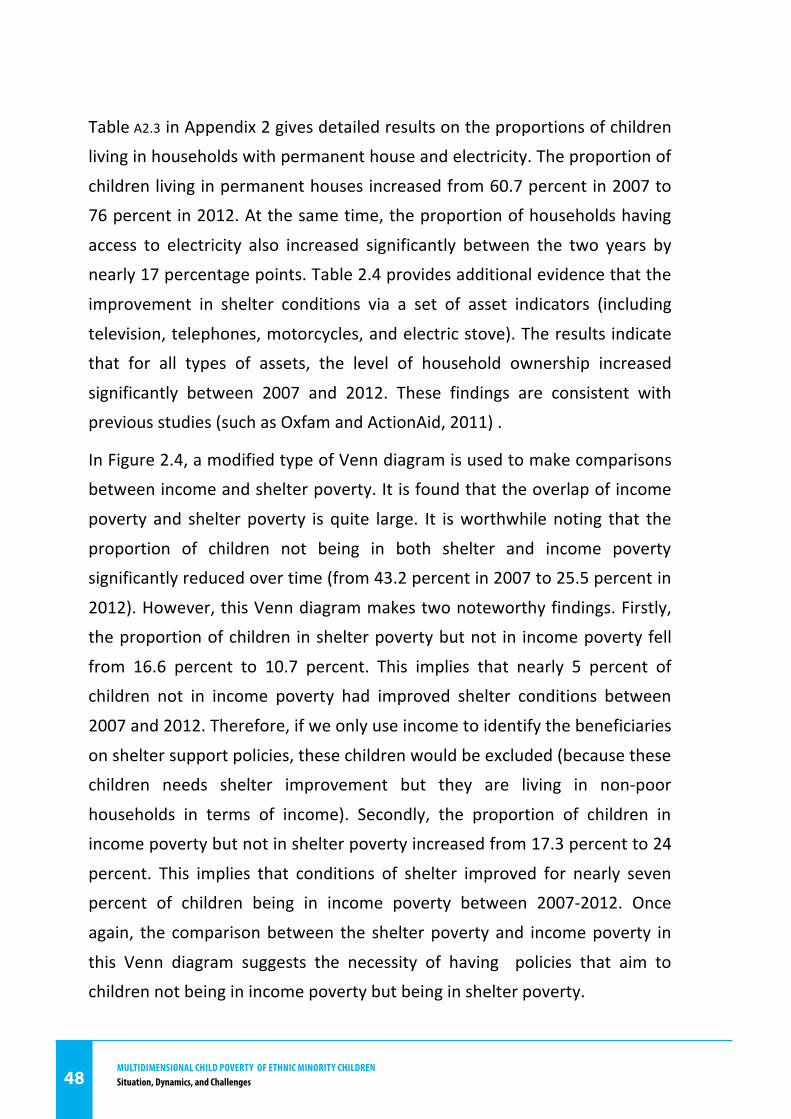
MultidiMensional Child Poverty of ethniC Minority Childrensituation, dynamics, and Challenges48
48 | P a g e
Table A2.3 in Appendix 2 gives detailed results on the proportions of children
living in households with permanent house and electricity. The proportion of
children living in permanent houses increased from 60.7 percent in 2007 to
76 percent in 2012. At the same time, the proportion of households having
access to electricity also increased significantly between the two years by
nearly 17 percentage points. Table 2.4 provides additional evidence that the
improvement in shelter conditions via a set of asset indicators (including
television, telephones, motorcycles, and electric stove). The results indicate
that for all types of assets, the level of household ownership increased
significantly between 2007 and 2012. These findings are consistent with
previous studies (such as Oxfam and ActionAid, 2011) .
In Figure 2.4, a modified type of Venn diagram is used to make comparisons
between income and shelter poverty. It is found that the overlap of income
poverty and shelter poverty is quite large. It is worthwhile noting that the
proportion of children not being in both shelter and income poverty
significantly reduced over time (from 43.2 percent in 2007 to 25.5 percent in
2012). However, this Venn diagram makes two noteworthy findings. Firstly,
the proportion of children in shelter poverty but not in income poverty fell
from 16.6 percent to 10.7 percent. This implies that nearly 5 percent of
children not in income poverty had improved shelter conditions between
2007 and 2012. Therefore, if we only use income to identify the beneficiaries
on shelter support policies, these children would be excluded (because these
children needs shelter improvement but they are living in non-‐poor
households in terms of income). Secondly, the proportion of children in
income poverty but not in shelter poverty increased from 17.3 percent to 24
percent. This implies that conditions of shelter improved for nearly seven
percent of children being in income poverty between 2007-‐2012. Once
again, the comparison between the shelter poverty and income poverty in
this Venn diagram suggests the necessity of having policies that aim to
children not being in income poverty but being in shelter poverty.
MultidiMensional Child Poverty of ethniC Minority Childrensituation, dynamics, and Challenges 49
49 | P a g e
Figure 2.4 Income-‐based Poverty vs Poverty in the Domain of Shelter
Note: (i) The dark rectangle on the top shows percentage of children being in income poverty and not being in shelter poverty; (ii) The dark rectangle in the middle shows percentage of children being in both income and shelter poverty; (iii) The white rectangle at the bottom shows percentage of children not being in income poverty and being in shelter poverty.
II.4. Water and Sanitation
Poverty in the domain of water and sanitation as calculated in Table 2.5
suggests that the proportion of children experiencing deprivation in the
domain of water and sanitation fell by 11 percentage points between 2007
and 2012, and this change was statistically significant. Table A2.5 in
Appendix 2 implies that the reduction came from the significant increase in
the percentage of children using sanitary latrines, while the percentage of
children with access to safe drinking water was almost unchanged during
this period. Specifically, the percentage of children living in households with
sanitary latrines increased from 10 percent to 30 percent. Meanwhile, the
proportion of children in households using safe drinking water remained at a
similar level of around 49 percent in 2012.
When analyzing the poverty rate in terms of access to safe drinking water
and sanitation, the results in Table 2.5 show remarkable findings. In terms of
ethnicity, the level of improvement in access to safe drinking water and
2007 2012
17.3%
16.6%
24%
10.7%
43.2%
25.2%
Income-based poverty
Poverty in the domain of shelter
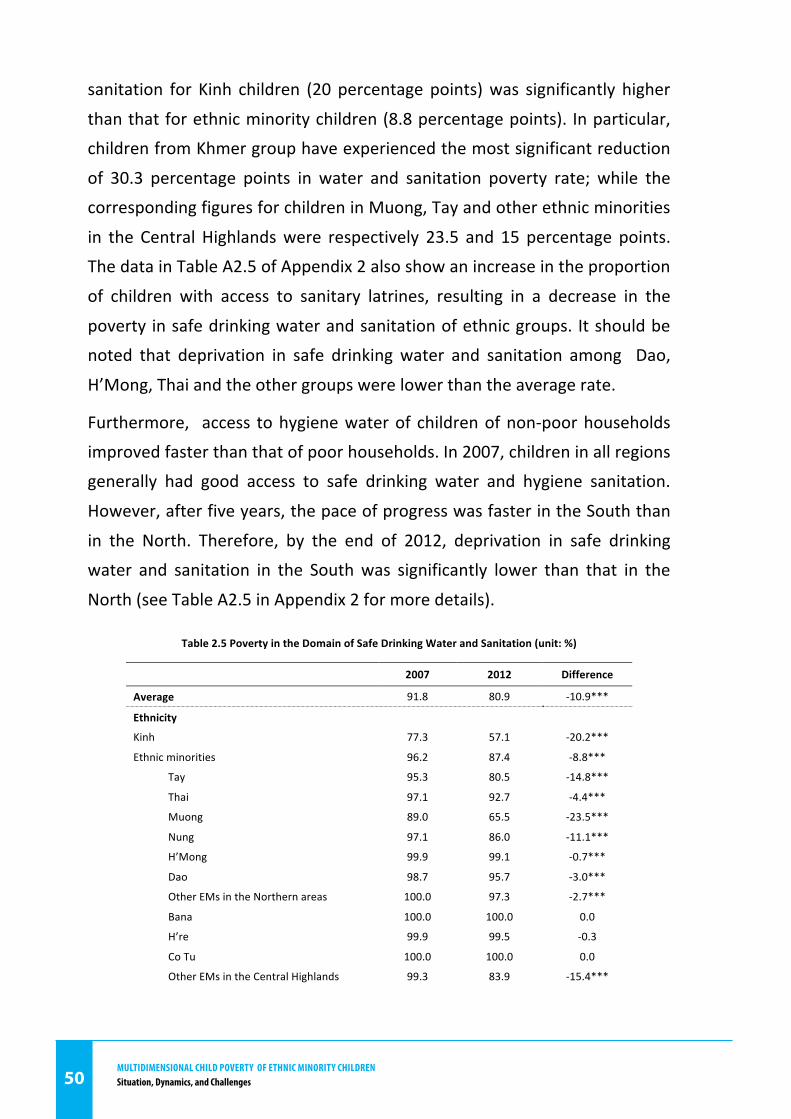
MultidiMensional Child Poverty of ethniC Minority Childrensituation, dynamics, and Challenges50
50 | P a g e
sanitation for Kinh children (20 percentage points) was significantly higher
than that for ethnic minority children (8.8 percentage points). In particular,
children from Khmer group have experienced the most significant reduction
of 30.3 percentage points in water and sanitation poverty rate; while the
corresponding figures for children in Muong, Tay and other ethnic minorities
in the Central Highlands were respectively 23.5 and 15 percentage points.
The data in Table A2.5 of Appendix 2 also show an increase in the proportion
of children with access to sanitary latrines, resulting in a decrease in the
poverty in safe drinking water and sanitation of ethnic groups. It should be
noted that deprivation in safe drinking water and sanitation among Dao,
H’Mong, Thai and the other groups were lower than the average rate.
Furthermore, access to hygiene water of children of non-‐poor households
improved faster than that of poor households. In 2007, children in all regions
generally had good access to safe drinking water and hygiene sanitation.
However, after five years, the pace of progress was faster in the South than
in the North. Therefore, by the end of 2012, deprivation in safe drinking
water and sanitation in the South was significantly lower than that in the
North (see Table A2.5 in Appendix 2 for more details).
Table 2.5 Poverty in the Domain of Safe Drinking Water and Sanitation (unit: %)
2007 2012 Difference
Average 91.8 80.9 -‐10.9***
Ethnicity
Kinh 77.3 57.1 -‐20.2***
Ethnic minorities 96.2 87.4 -‐8.8***
Tay 95.3 80.5 -‐14.8***
Thai 97.1 92.7 -‐4.4***
Muong 89.0 65.5 -‐23.5***
Nung 97.1 86.0 -‐11.1***
H’Mong 99.9 99.1 -‐0.7***
Dao 98.7 95.7 -‐3.0***
Other EMs in the Northern areas 100.0 97.3 -‐2.7***
Bana 100.0 100.0 0.0
H’re 99.9 99.5 -‐0.3
Co Tu 100.0 100.0 0.0
Other EMs in the Central Highlands 99.3 83.9 -‐15.4***
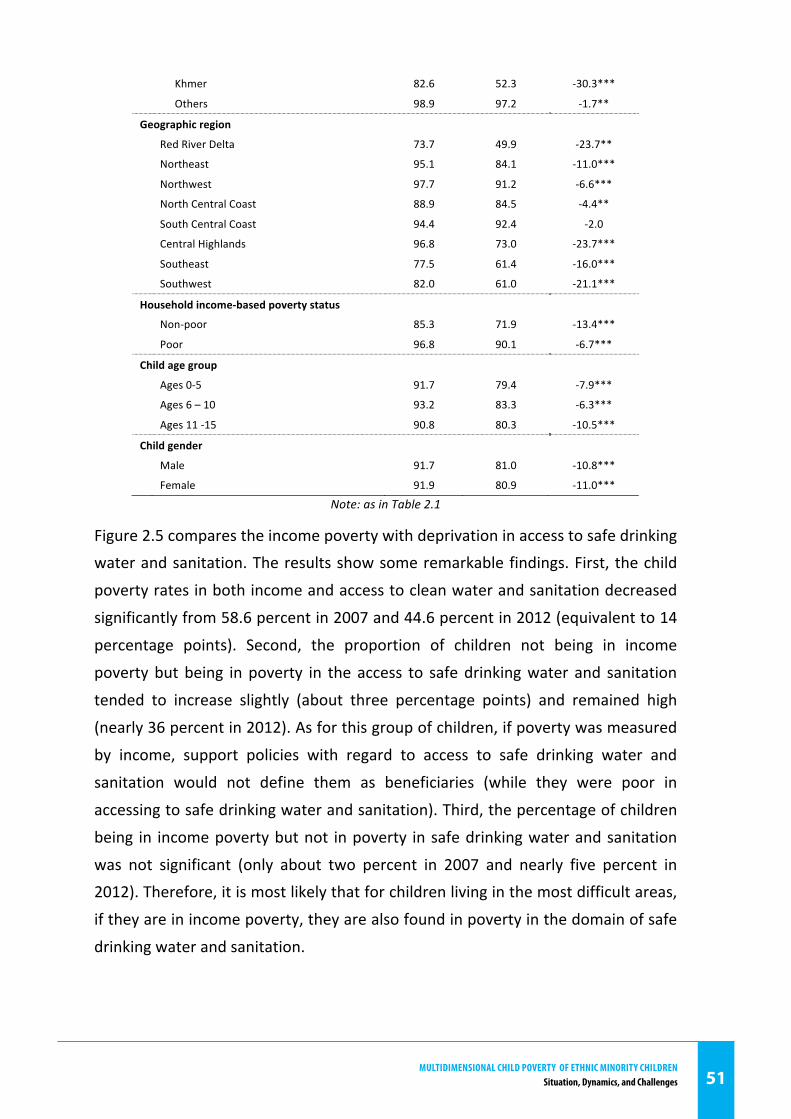
MultidiMensional Child Poverty of ethniC Minority Childrensituation, dynamics, and Challenges 51
51 | P a g e
Khmer 82.6 52.3 -‐30.3***
Others 98.9 97.2 -‐1.7**
Geographic region
Red River Delta 73.7 49.9 -‐23.7**
Northeast 95.1 84.1 -‐11.0***
Northwest 97.7 91.2 -‐6.6***
North Central Coast 88.9 84.5 -‐4.4**
South Central Coast 94.4 92.4 -‐2.0
Central Highlands 96.8 73.0 -‐23.7***
Southeast 77.5 61.4 -‐16.0***
Southwest 82.0 61.0 -‐21.1***
Household income-‐based poverty status
Non-‐poor 85.3 71.9 -‐13.4***
Poor 96.8 90.1 -‐6.7***
Child age group
Ages 0-‐5 91.7 79.4 -‐7.9***
Ages 6 – 10 93.2 83.3 -‐6.3***
Ages 11 -‐15 90.8 80.3 -‐10.5***
Child gender
Male 91.7 81.0 -‐10.8***
Female 91.9 80.9 -‐11.0***
Note: as in Table 2.1
Figure 2.5 compares the income poverty with deprivation in access to safe drinking water and sanitation. The results show some remarkable findings. First, the child
poverty rates in both income and access to clean water and sanitation decreased
significantly from 58.6 percent in 2007 and 44.6 percent in 2012 (equivalent to 14
percentage points). Second, the proportion of children not being in income
poverty but being in poverty in the access to safe drinking water and sanitation
tended to increase slightly (about three percentage points) and remained high
(nearly 36 percent in 2012). As for this group of children, if poverty was measured
by income, support policies with regard to access to safe drinking water and
sanitation would not define them as beneficiaries (while they were poor in
accessing to safe drinking water and sanitation). Third, the percentage of children
being in income poverty but not in poverty in safe drinking water and sanitation
was not significant (only about two percent in 2007 and nearly five percent in 2012). Therefore, it is most likely that for children living in the most difficult areas,
if they are in income poverty, they are also found in poverty in the domain of safe
drinking water and sanitation.
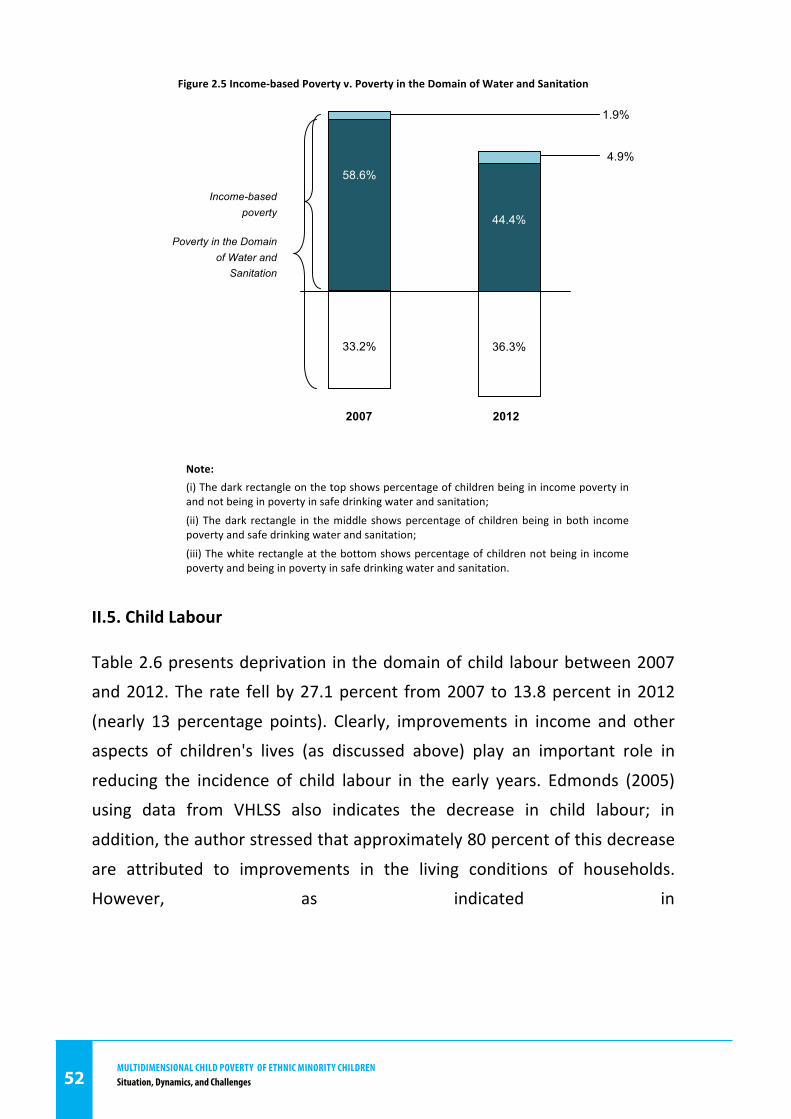
MultidiMensional Child Poverty of ethniC Minority Childrensituation, dynamics, and Challenges52
52 | P a g e
Figure 2.5 Income-‐based Poverty v. Poverty in the Domain of Water and Sanitation
Note: (i) The dark rectangle on the top shows percentage of children being in income poverty in and not being in poverty in safe drinking water and sanitation;
(ii) The dark rectangle in the middle shows percentage of children being in both income poverty and safe drinking water and sanitation;
(iii) The white rectangle at the bottom shows percentage of children not being in income poverty and being in poverty in safe drinking water and sanitation.
II.5. Child Labour
Table 2.6 presents deprivation in the domain of child labour between 2007
and 2012. The rate fell by 27.1 percent from 2007 to 13.8 percent in 2012
(nearly 13 percentage points). Clearly, improvements in income and other
aspects of children's lives (as discussed above) play an important role in
reducing the incidence of child labour in the early years. Edmonds (2005)
using data from VHLSS also indicates the decrease in child labour; in
addition, the author stressed that approximately 80 percent of this decrease
are attributed to improvements in the living conditions of households.
However, as indicated in
2007 2012
36.3%
1.9%
58,6 %
33,2 %
4.9%
58,6 %
33,2 %
44.4%
33.2%
58.6%
Income-based poverty
Poverty in the Domain of Water and
Sanitation
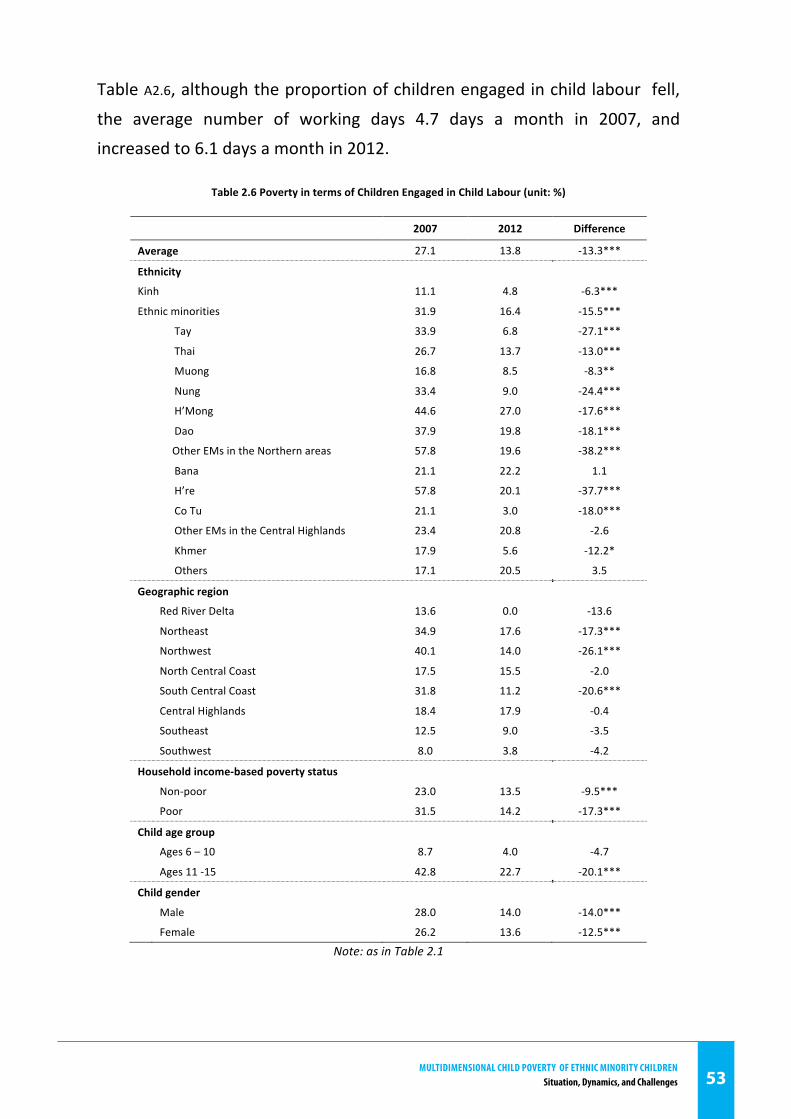
MultidiMensional Child Poverty of ethniC Minority Childrensituation, dynamics, and Challenges 53
53 | P a g e
Table A2.6, although the proportion of children engaged in child labour fell,
the average number of working days 4.7 days a month in 2007, and
increased to 6.1 days a month in 2012.
Table 2.6 Poverty in terms of Children Engaged in Child Labour (unit: %)
Note: as in Table 2.1
2007 2012 Difference
Average 27.1 13.8 -‐13.3***
Ethnicity
Kinh 11.1 4.8 -‐6.3***
Ethnic minorities 31.9 16.4 -‐15.5***
Tay 33.9 6.8 -‐27.1***
Thai 26.7 13.7 -‐13.0***
Muong 16.8 8.5 -‐8.3**
Nung 33.4 9.0 -‐24.4***
H’Mong 44.6 27.0 -‐17.6***
Dao 37.9 19.8 -‐18.1***
Other EMs in the Northern areas 57.8 19.6 -‐38.2***
Bana 21.1 22.2 1.1
H’re 57.8 20.1 -‐37.7***
Co Tu 21.1 3.0 -‐18.0***
Other EMs in the Central Highlands 23.4 20.8 -‐2.6
Khmer 17.9 5.6 -‐12.2*
Others 17.1 20.5 3.5
Geographic region
Red River Delta 13.6 0.0 -‐13.6
Northeast 34.9 17.6 -‐17.3***
Northwest 40.1 14.0 -‐26.1***
North Central Coast 17.5 15.5 -‐2.0
South Central Coast 31.8 11.2 -‐20.6***
Central Highlands 18.4 17.9 -‐0.4
Southeast 12.5 9.0 -‐3.5
Southwest 8.0 3.8 -‐4.2
Household income-‐based poverty status
Non-‐poor 23.0 13.5 -‐9.5***
Poor 31.5 14.2 -‐17.3***
Child age group
Ages 6 – 10 8.7 4.0 -‐4.7
Ages 11 -‐15 42.8 22.7 -‐20.1***
Child gender
Male 28.0 14.0 -‐14.0***
Female 26.2 13.6 -‐12.5***
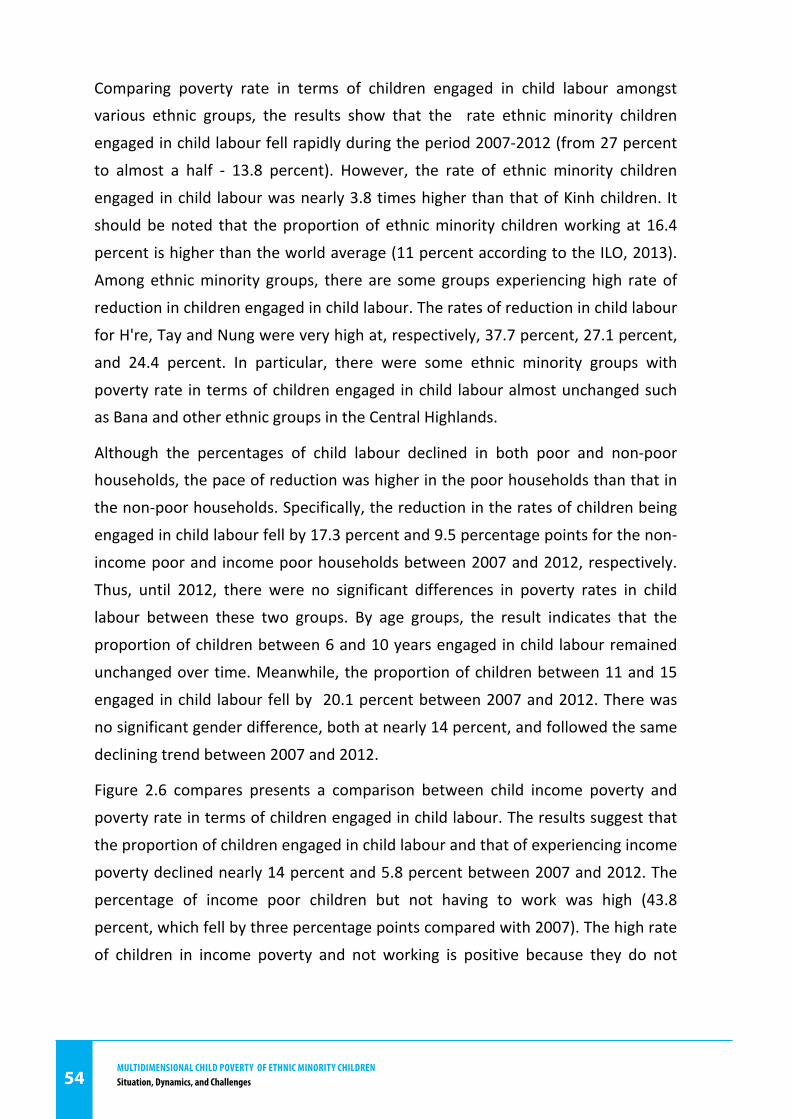
MultidiMensional Child Poverty of ethniC Minority Childrensituation, dynamics, and Challenges54
54 | P a g e
Comparing poverty rate in terms of children engaged in child labour amongst various ethnic groups, the results show that the rate ethnic minority children
engaged in child labour fell rapidly during the period 2007-‐2012 (from 27 percent
to almost a half -‐ 13.8 percent). However, the rate of ethnic minority children
engaged in child labour was nearly 3.8 times higher than that of Kinh children. It
should be noted that the proportion of ethnic minority children working at 16.4
percent is higher than the world average (11 percent according to the ILO, 2013).
Among ethnic minority groups, there are some groups experiencing high rate of
reduction in children engaged in child labour. The rates of reduction in child labour
for H're, Tay and Nung were very high at, respectively, 37.7 percent, 27.1 percent,
and 24.4 percent. In particular, there were some ethnic minority groups with
poverty rate in terms of children engaged in child labour almost unchanged such as Bana and other ethnic groups in the Central Highlands.
Although the percentages of child labour declined in both poor and non-‐poor households, the pace of reduction was higher in the poor households than that in
the non-‐poor households. Specifically, the reduction in the rates of children being
engaged in child labour fell by 17.3 percent and 9.5 percentage points for the non-‐
income poor and income poor households between 2007 and 2012, respectively.
Thus, until 2012, there were no significant differences in poverty rates in child
labour between these two groups. By age groups, the result indicates that the
proportion of children between 6 and 10 years engaged in child labour remained
unchanged over time. Meanwhile, the proportion of children between 11 and 15
engaged in child labour fell by 20.1 percent between 2007 and 2012. There was
no significant gender difference, both at nearly 14 percent, and followed the same
declining trend between 2007 and 2012.
Figure 2.6 compares presents a comparison between child income poverty and
poverty rate in terms of children engaged in child labour. The results suggest that
the proportion of children engaged in child labour and that of experiencing income
poverty declined nearly 14 percent and 5.8 percent between 2007 and 2012. The
percentage of income poor children but not having to work was high (43.8
percent, which fell by three percentage points compared with 2007). The high rate
of children in income poverty and not working is positive because they do not
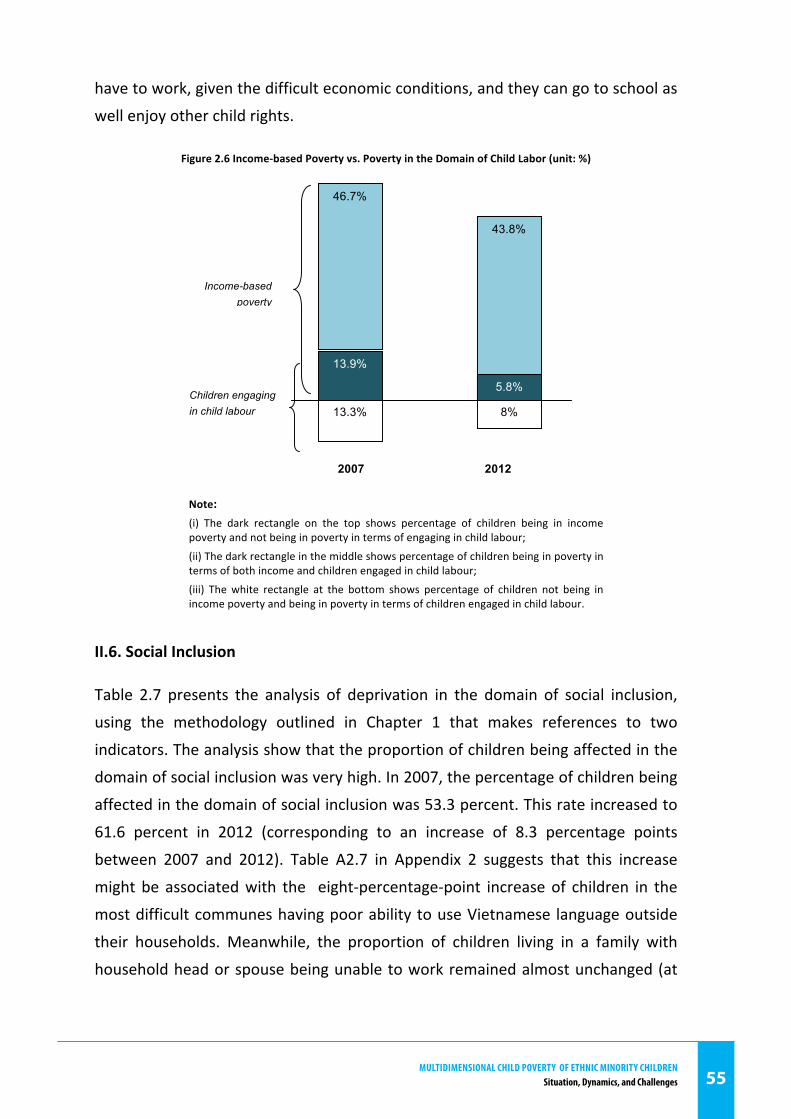
MultidiMensional Child Poverty of ethniC Minority Childrensituation, dynamics, and Challenges 55
55 | P a g e
have to work, given the difficult economic conditions, and they can go to school as
well enjoy other child rights.
Figure 2.6 Income-‐based Poverty vs. Poverty in the Domain of Child Labor (unit: %)
Note: (i) The dark rectangle on the top shows percentage of children being in income poverty and not being in poverty in terms of engaging in child labour;
(ii) The dark rectangle in the middle shows percentage of children being in poverty in terms of both income and children engaged in child labour;
(iii) The white rectangle at the bottom shows percentage of children not being in income poverty and being in poverty in terms of children engaged in child labour.
II.6. Social Inclusion
Table 2.7 presents the analysis of deprivation in the domain of social inclusion,
using the methodology outlined in Chapter 1 that makes references to two
indicators. The analysis show that the proportion of children being affected in the
domain of social inclusion was very high. In 2007, the percentage of children being
affected in the domain of social inclusion was 53.3 percent. This rate increased to
61.6 percent in 2012 (corresponding to an increase of 8.3 percentage points
between 2007 and 2012). Table A2.7 in Appendix 2 suggests that this increase
might be associated with the eight-‐percentage-‐point increase of children in the
most difficult communes having poor ability to use Vietnamese language outside
their households. Meanwhile, the proportion of children living in a family with
household head or spouse being unable to work remained almost unchanged (at
2007 2012
Income-based poverty
Children engaging in child labour
43.8%
8%
46.7%
13.3%
13.9%
5.8%
8 %
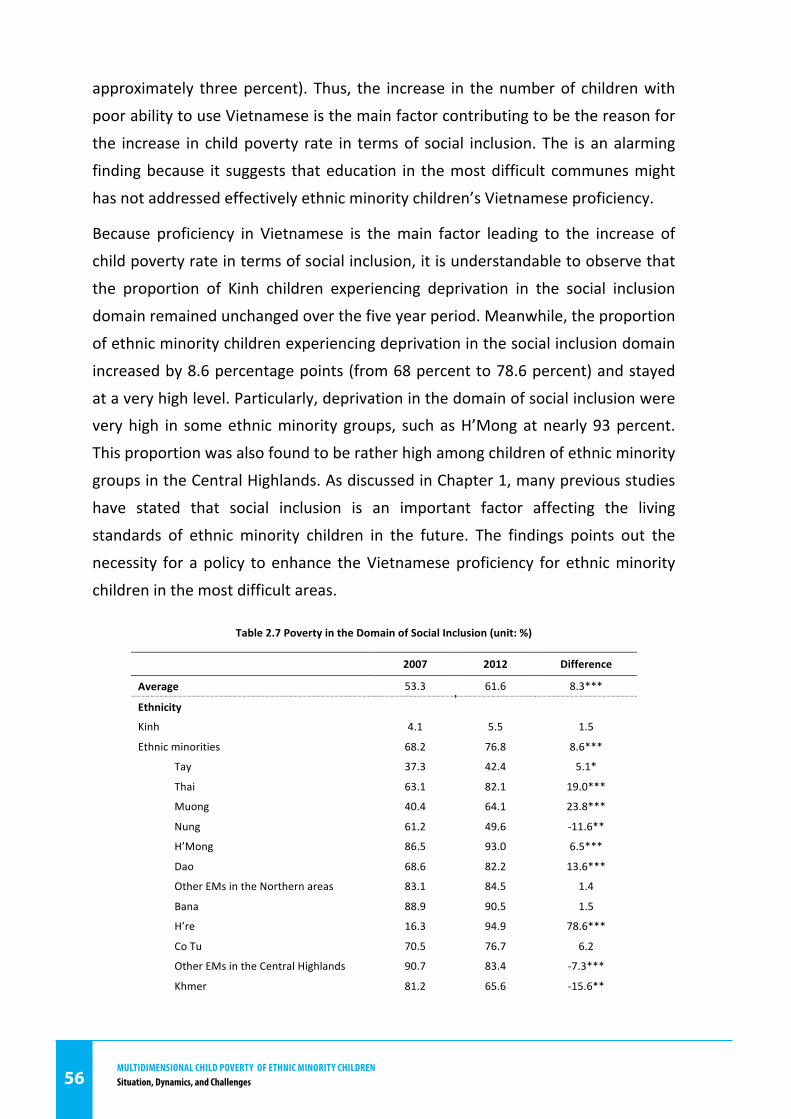
MultidiMensional Child Poverty of ethniC Minority Childrensituation, dynamics, and Challenges56
56 | P a g e
approximately three percent). Thus, the increase in the number of children with
poor ability to use Vietnamese is the main factor contributing to be the reason for
the increase in child poverty rate in terms of social inclusion. The is an alarming
finding because it suggests that education in the most difficult communes might
has not addressed effectively ethnic minority children’s Vietnamese proficiency.
Because proficiency in Vietnamese is the main factor leading to the increase of
child poverty rate in terms of social inclusion, it is understandable to observe that
the proportion of Kinh children experiencing deprivation in the social inclusion
domain remained unchanged over the five year period. Meanwhile, the proportion
of ethnic minority children experiencing deprivation in the social inclusion domain
increased by 8.6 percentage points (from 68 percent to 78.6 percent) and stayed
at a very high level. Particularly, deprivation in the domain of social inclusion were very high in some ethnic minority groups, such as H’Mong at nearly 93 percent.
This proportion was also found to be rather high among children of ethnic minority
groups in the Central Highlands. As discussed in Chapter 1, many previous studies
have stated that social inclusion is an important factor affecting the living
standards of ethnic minority children in the future. The findings points out the
necessity for a policy to enhance the Vietnamese proficiency for ethnic minority
children in the most difficult areas.
Table 2.7 Poverty in the Domain of Social Inclusion (unit: %)
2007 2012 Difference
Average 53.3 61.6 8.3***
Ethnicity
Kinh 4.1 5.5 1.5
Ethnic minorities 68.2 76.8 8.6***
Tay 37.3 42.4 5.1*
Thai 63.1 82.1 19.0***
Muong 40.4 64.1 23.8***
Nung 61.2 49.6 -‐11.6**
H’Mong 86.5 93.0 6.5***
Dao 68.6 82.2 13.6***
Other EMs in the Northern areas 83.1 84.5 1.4
Bana 88.9 90.5 1.5
H’re 16.3 94.9 78.6***
Co Tu 70.5 76.7 6.2
Other EMs in the Central Highlands 90.7 83.4 -‐7.3***
Khmer 81.2 65.6 -‐15.6**
MultidiMensional Child Poverty of ethniC Minority Childrensituation, dynamics, and Challenges 57
57 | P a g e
Others 66.2 87.2 21.0***
Geographic region
Red River Delta 2.7 20.4 17.7***
Northeast 55.9 64.9 9.1***
Northwest 73.2 77.4 4.2**
North Central Coast 50.2 63.8 13.6***
South Central Coast 31.9 62.5 30.6***
Central Highlands 72.7 61.9 -‐10.8***
Southeast 34.5 37.2 2.7
Southwest 40.1 33.3 -‐6.8
Household income-‐based poverty status
Non-‐poor 40.7 52.2 11.4***
Poor 65.0 71.2 6.3***
Child age group
Ages 0-‐5 56.4 67.7 11.9***
Ages 6 – 10 56.2 60.6 6.9***
Ages 11 -‐15 48.1 56.6 8.5***
Child gender
Male 53.2 61.9 8.8***
Female 53.5 61.3 7.8***
Note: as in Table 2.1
The comparison between income poverty and deprivation in the social
inclusion domain is summarized in Figure 2.7. The first point to note is that
the percentage of children experiencing income poverty and deprivation in
the social inclusion domain was very high and there were no significant
changes made. In 2012, there were up to nearly 43 percent of children in the
most difficult communes affected by both domains. The number of children
in income poverty but not experiencing deprivation in the social inclusion
domain accounts for merely a modest proportion and tends to decrease
over time. In 2007, over 15 percent of children were classified as being in
income poverty but not in terms of social inclusion. By 2012, this figure
dropped to about 6.6 percent (equivalent to a decrease of 7.4 percentage
points). Notably, the percentage of children not in income poverty but
experiencing deprivation in the social inclusion domain tends to increase
over time (from eight percent in 2007 to 18.7 percent in 2012). In other
words, even children of families with incomes above the poverty level could
still experience deprivation in the social inclusion domain. In 2012, the ratio
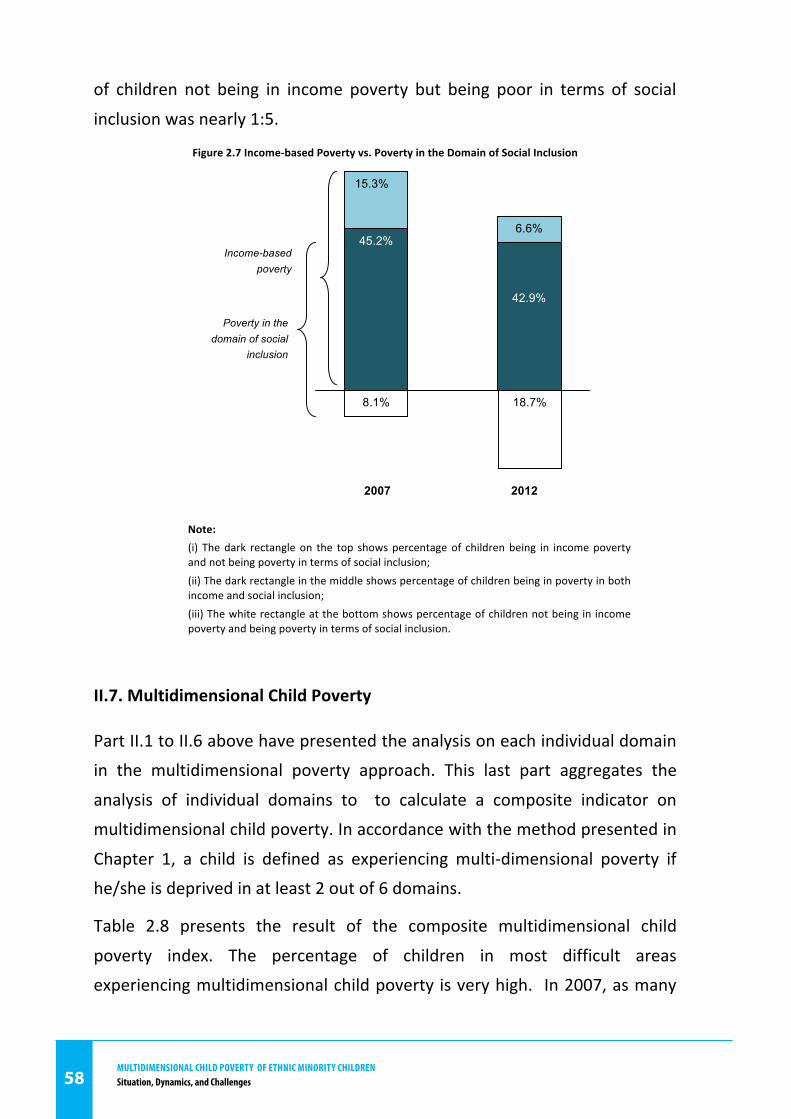
MultidiMensional Child Poverty of ethniC Minority Childrensituation, dynamics, and Challenges58
58 | P a g e
of children not being in income poverty but being poor in terms of social
inclusion was nearly 1:5.
Figure 2.7 Income-‐based Poverty vs. Poverty in the Domain of Social Inclusion
Note: (i) The dark rectangle on the top shows percentage of children being in income poverty and not being poverty in terms of social inclusion; (ii) The dark rectangle in the middle shows percentage of children being in poverty in both income and social inclusion; (iii) The white rectangle at the bottom shows percentage of children not being in income poverty and being poverty in terms of social inclusion.
II.7. Multidimensional Child Poverty
Part II.1 to II.6 above have presented the analysis on each individual domain
in the multidimensional poverty approach. This last part aggregates the
analysis of individual domains to to calculate a composite indicator on
multidimensional child poverty. In accordance with the method presented in
Chapter 1, a child is defined as experiencing multi-‐dimensional poverty if
he/she is deprived in at least 2 out of 6 domains.
Table 2.8 presents the result of the composite multidimensional child
poverty index. The percentage of children in most difficult areas
experiencing multidimensional child poverty is very high. In 2007, as many
15.3%
8.1%
6.6%
18.7%
Income-based poverty
Poverty in the domain of social
inclusion
45.2%
42.9%
2007 2012
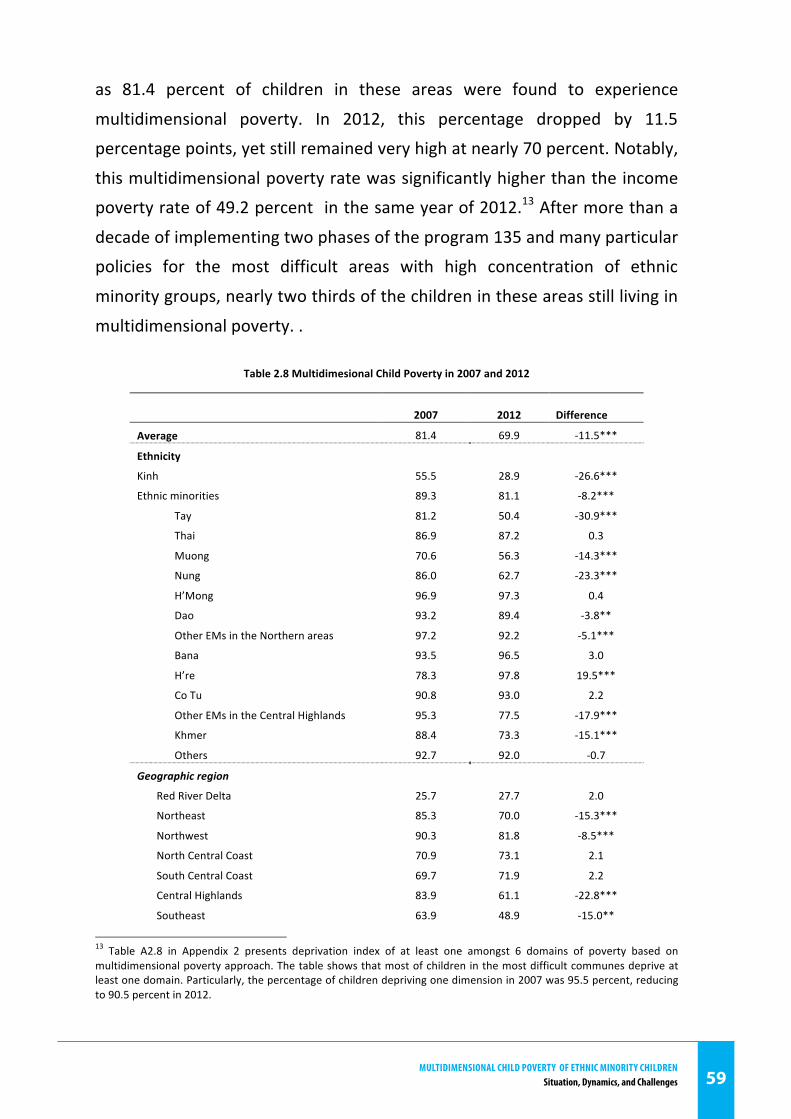
MultidiMensional Child Poverty of ethniC Minority Childrensituation, dynamics, and Challenges 59
59 | P a g e
as 81.4 percent of children in these areas were found to experience
multidimensional poverty. In 2012, this percentage dropped by 11.5
percentage points, yet still remained very high at nearly 70 percent. Notably,
this multidimensional poverty rate was significantly higher than the income
poverty rate of 49.2 percent in the same year of 2012.13 After more than a
decade of implementing two phases of the program 135 and many particular
policies for the most difficult areas with high concentration of ethnic
minority groups, nearly two thirds of the children in these areas still living in
multidimensional poverty. .
Table 2.8 Multidimesional Child Poverty in 2007 and 2012
2007 2012 Difference
Average 81.4 69.9 -‐11.5***
Ethnicity Kinh 55.5 28.9 -‐26.6***
Ethnic minorities 89.3 81.1 -‐8.2***
Tay 81.2 50.4 -‐30.9***
Thai 86.9 87.2 0.3
Muong 70.6 56.3 -‐14.3***
Nung 86.0 62.7 -‐23.3***
H’Mong 96.9 97.3 0.4
Dao 93.2 89.4 -‐3.8**
Other EMs in the Northern areas 97.2 92.2 -‐5.1***
Bana 93.5 96.5 3.0
H’re 78.3 97.8 19.5***
Co Tu 90.8 93.0 2.2
Other EMs in the Central Highlands 95.3 77.5 -‐17.9***
Khmer 88.4 73.3 -‐15.1***
Others 92.7 92.0 -‐0.7
Geographic region
Red River Delta 25.7 27.7 2.0
Northeast 85.3 70.0 -‐15.3***
Northwest 90.3 81.8 -‐8.5***
North Central Coast 70.9 73.1 2.1
South Central Coast 69.7 71.9 2.2
Central Highlands 83.9 61.1 -‐22.8***
Southeast 63.9 48.9 -‐15.0**
13 Table A2.8 in Appendix 2 presents deprivation index of at least one amongst 6 domains of poverty based on multidimensional poverty approach. The table shows that most of children in the most difficult communes deprive at least one domain. Particularly, the percentage of children depriving one dimension in 2007 was 95.5 percent, reducing to 90.5 percent in 2012.
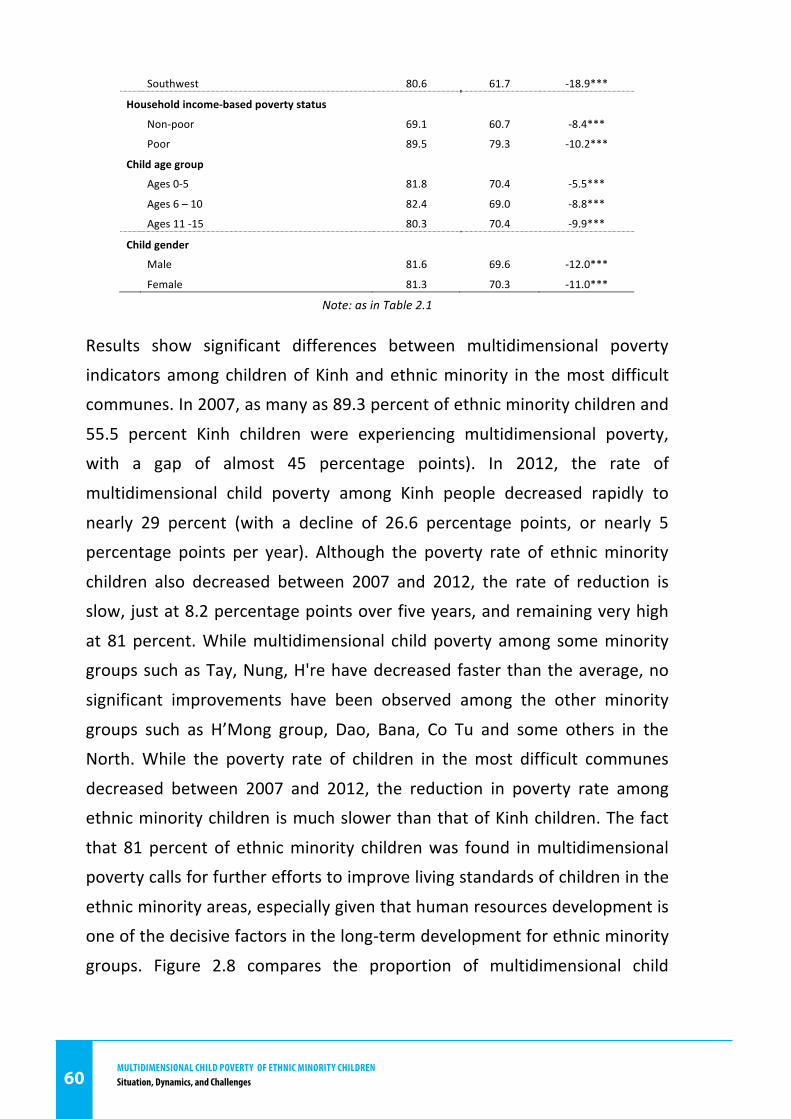
MultidiMensional Child Poverty of ethniC Minority Childrensituation, dynamics, and Challenges60
60 | P a g e
Southwest 80.6 61.7 -‐18.9***
Household income-‐based poverty status
Non-‐poor 69.1 60.7 -‐8.4***
Poor 89.5 79.3 -‐10.2***
Child age group
Ages 0-‐5 81.8 70.4 -‐5.5***
Ages 6 – 10 82.4 69.0 -‐8.8***
Ages 11 -‐15 80.3 70.4 -‐9.9***
Child gender
Male 81.6 69.6 -‐12.0***
Female 81.3 70.3 -‐11.0***
Note: as in Table 2.1
Results show significant differences between multidimensional poverty
indicators among children of Kinh and ethnic minority in the most difficult
communes. In 2007, as many as 89.3 percent of ethnic minority children and
55.5 percent Kinh children were experiencing multidimensional poverty,
with a gap of almost 45 percentage points). In 2012, the rate of
multidimensional child poverty among Kinh people decreased rapidly to
nearly 29 percent (with a decline of 26.6 percentage points, or nearly 5
percentage points per year). Although the poverty rate of ethnic minority
children also decreased between 2007 and 2012, the rate of reduction is
slow, just at 8.2 percentage points over five years, and remaining very high
at 81 percent. While multidimensional child poverty among some minority
groups such as Tay, Nung, H're have decreased faster than the average, no
significant improvements have been observed among the other minority
groups such as H’Mong group, Dao, Bana, Co Tu and some others in the
North. While the poverty rate of children in the most difficult communes
decreased between 2007 and 2012, the reduction in poverty rate among
ethnic minority children is much slower than that of Kinh children. The fact
that 81 percent of ethnic minority children was found in multidimensional
poverty calls for further efforts to improve living standards of children in the
ethnic minority areas, especially given that human resources development is
one of the decisive factors in the long-‐term development for ethnic minority
groups. Figure 2.8 compares the proportion of multidimensional child
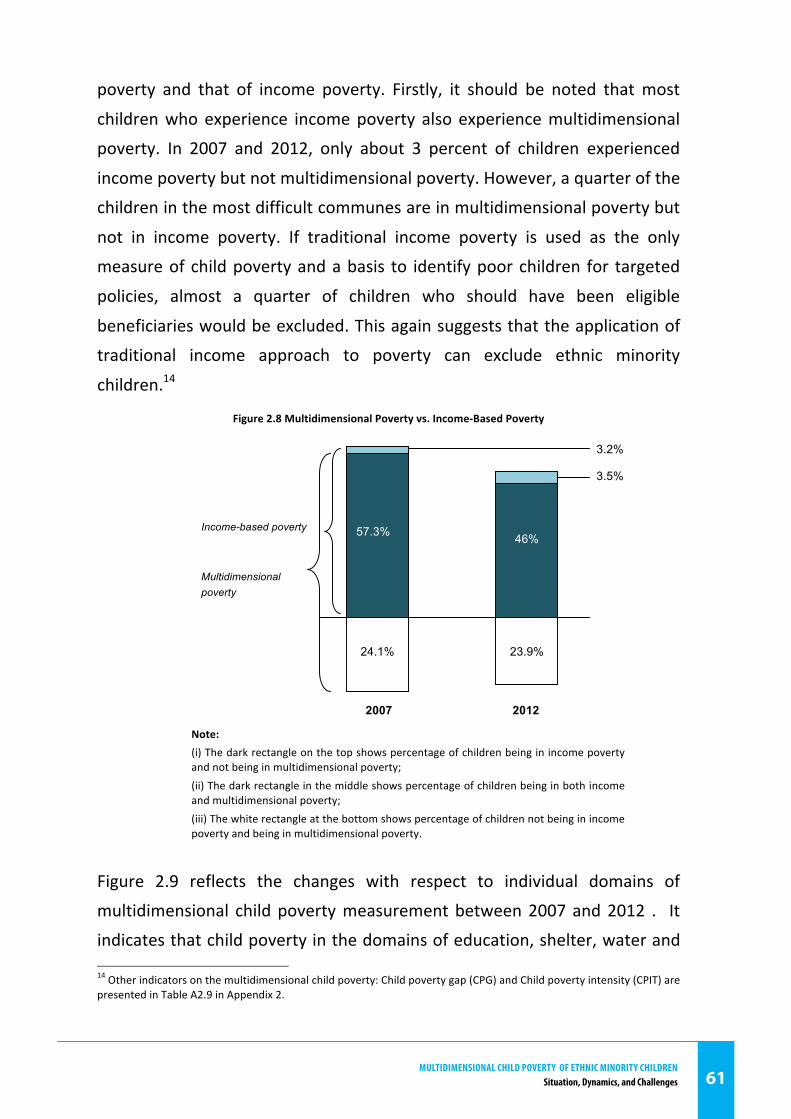
MultidiMensional Child Poverty of ethniC Minority Childrensituation, dynamics, and Challenges 61
61 | P a g e
poverty and that of income poverty. Firstly, it should be noted that most
children who experience income poverty also experience multidimensional
poverty. In 2007 and 2012, only about 3 percent of children experienced
income poverty but not multidimensional poverty. However, a quarter of the
children in the most difficult communes are in multidimensional poverty but
not in income poverty. If traditional income poverty is used as the only
measure of child poverty and a basis to identify poor children for targeted
policies, almost a quarter of children who should have been eligible
beneficiaries would be excluded. This again suggests that the application of
traditional income approach to poverty can exclude ethnic minority
children.14
Figure 2.8 Multidimensional Poverty vs. Income-‐Based Poverty
Note: (i) The dark rectangle on the top shows percentage of children being in income poverty and not being in multidimensional poverty; (ii) The dark rectangle in the middle shows percentage of children being in both income and multidimensional poverty; (iii) The white rectangle at the bottom shows percentage of children not being in income poverty and being in multidimensional poverty.
Figure 2.9 reflects the changes with respect to individual domains of
multidimensional child poverty measurement between 2007 and 2012 . It
indicates that child poverty in the domains of education, shelter, water and 14 Other indicators on the multidimensional child poverty: Child poverty gap (CPG) and Child poverty intensity (CPIT) are presented in Table A2.9 in Appendix 2.
24.1%
23.9%
57.3%
24,1 %
3.2%
3.5%
46%
23,9 %
Income-based poverty
Multidimensional poverty
2007 2012
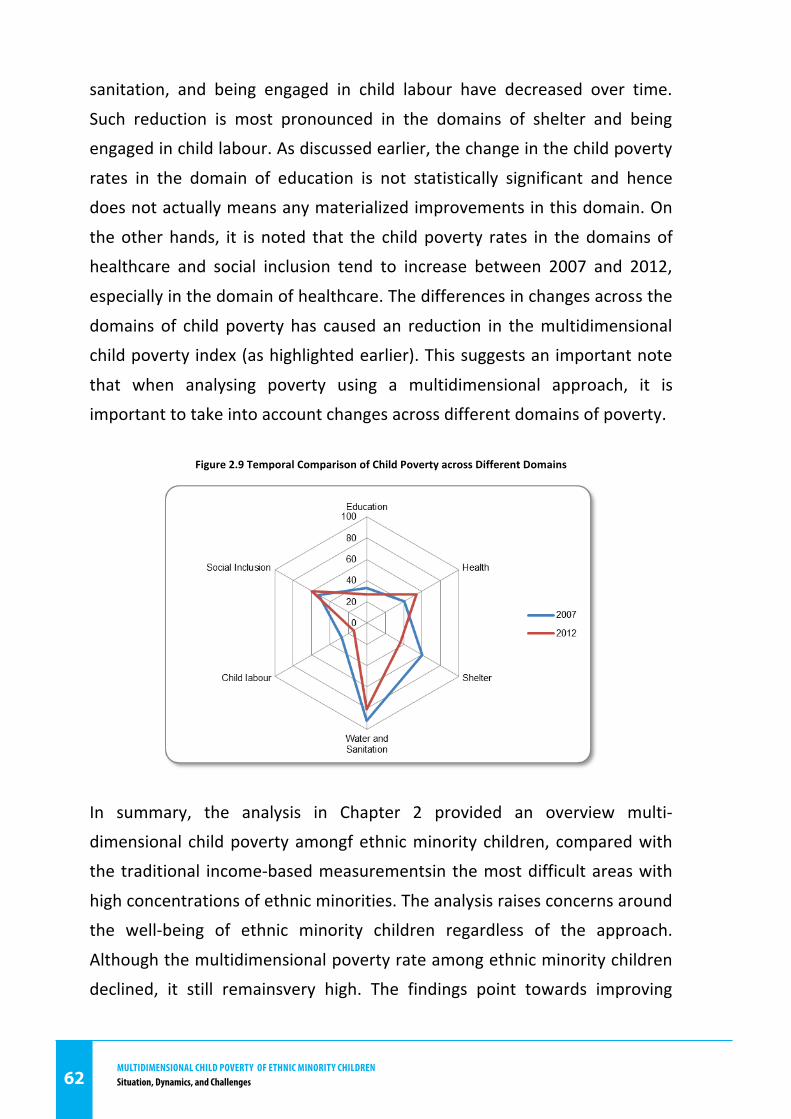
MultidiMensional Child Poverty of ethniC Minority Childrensituation, dynamics, and Challenges62
62 | P a g e
sanitation, and being engaged in child labour have decreased over time.
Such reduction is most pronounced in the domains of shelter and being
engaged in child labour. As discussed earlier, the change in the child poverty
rates in the domain of education is not statistically significant and hence
does not actually means any materialized improvements in this domain. On
the other hands, it is noted that the child poverty rates in the domains of
healthcare and social inclusion tend to increase between 2007 and 2012,
especially in the domain of healthcare. The differences in changes across the
domains of child poverty has caused an reduction in the multidimensional
child poverty index (as highlighted earlier). This suggests an important note
that when analysing poverty using a multidimensional approach, it is
important to take into account changes across different domains of poverty.
Figure 2.9 Temporal Comparison of Child Poverty across Different Domains
In summary, the analysis in Chapter 2 provided an overview multi-‐
dimensional child poverty amongf ethnic minority children, compared with
the traditional income-‐based measurementsin the most difficult areas with
high concentrations of ethnic minorities. The analysis raises concerns around
the well-‐being of ethnic minority children regardless of the approach.
Although the multidimensional poverty rate among ethnic minority children
declined, it still remainsvery high. The findings point towards improving
MultidiMensional Child Poverty of ethniC Minority Childrensituation, dynamics, and Challenges 63
63 | P a g e
interventions to reduce poverty for ethnic minority children. The main
findings of this chapter also indicate that policy interventions for child
poverty reduction would be one-‐sided if we only use the income-‐based
approach.
MultidiMensional Child Poverty of ethniC Minority Childrensituation, dynamics, and Challenges64
64 | P a g e
Chapter 3 – Determinants of Multidimensional
Child Poverty
The previous chapter described the trends in multidimensional child poverty
among the ethnic minority children between 2007 and 2012. This chapter
provides further insights on the determinants of multidimensional child
poverty, its dynamics, and especially regarding the potential effects of
multidimensional child poverty on outcomes of child development, using the
econometric models outlined in Chapter 1, Section II.2. The analysis of
empirical results from estimating these econometric models will be the
focus this chapter. Technical discussions (e.g. estimation method,
specification tests, diagnostics tests of these econometric models) are not
discussed here for brevity and simplicity. By focusing on the key
determinants of multidimensional child poverty, it is expected that the study
could indicate priorities for child poverty reduction efforts.
I. Determinants of Multidimensional Child Poverty
I.1 Determinants of Multidimensional Child Poverty
To evaluate the factors affecting multidimensional child poverty, this section
highlights the results of the estimation obtained from regression equation
[1] and [2] outlined in Chapter 1. When OLS is applied for equation [1], the
dependent variable is the multidimensional poverty index; Probit is then
applied for equation [2] where the dependent variable is defined as a
discrete variable (e.g. equal to 1 if a child is multi-‐dimensionally poor and 0
otherwise). Table 3.2 provides the estimation results. To keep the analysis
simple, the interpretation of the coefficient estimates will be made only on
those of important variables. It is important to note that most of the
MultidiMensional Child Poverty of ethniC Minority Childrensituation, dynamics, and Challenges 65
65 | P a g e
coefficient estimates are well determined and in line with the expected
effects. The power of explanation (as reflected in the goodness of fit
captured by R2 or Pseudo R2) is relatively high compared to cross-‐sectional
estimation standards. This gives a confidence in the estimates and the
interpretation reported in this section.
The estimation in Table 3.1 shows the effects of many determinants of
multidimensional child poverty in the ethnic minority areas. Most notably,
ethnicity was found as a very important driver of multidimensional poverty.
Ethnic minority children are considerably more likely to be deprived in
multiple aspects. On average and ceteris paribus, the probability of a child
living in a Kinh-‐headed household being multi-‐dimensionally poor is lower
than that of an ethnic minority child by between 25 to 48 percentage points
(in 2007 and 2012, respectively). Educational attainment levels of household
heads are also found to be an important determinant of child poverty. For
instance, the probability of being multidimensionlly poor of a child living
with a household head having upper secondary education or above is lower
than that of a child whose household heads having no education by an order
of nearly percentage points in 2012 (and 15 percentage points in 2007).
Household size also exerts some effect on child poverty. The estimates
suggest that having one more person in the household makes the probability
of children in that household being poor by one to three percentage points
higher depending on the year under consideration. Effects of landholding on
child poverty was not found consistent across years or approaches of
estimation. While having irrigated cropland reduces the probability of
children deprived in multiple aspects, the effect of forestry land was not
statistically significant from zero.
Access to infrastructure and facilities are generally found to reduce child
poverty. For instance, children living in communes with road are less likely to
be multidimensionally poor than those in the commune without this access
by between four to 10 percentage points, on average and ceteris paribus. In
addition, access to electricity grid, having traditional occupations at the
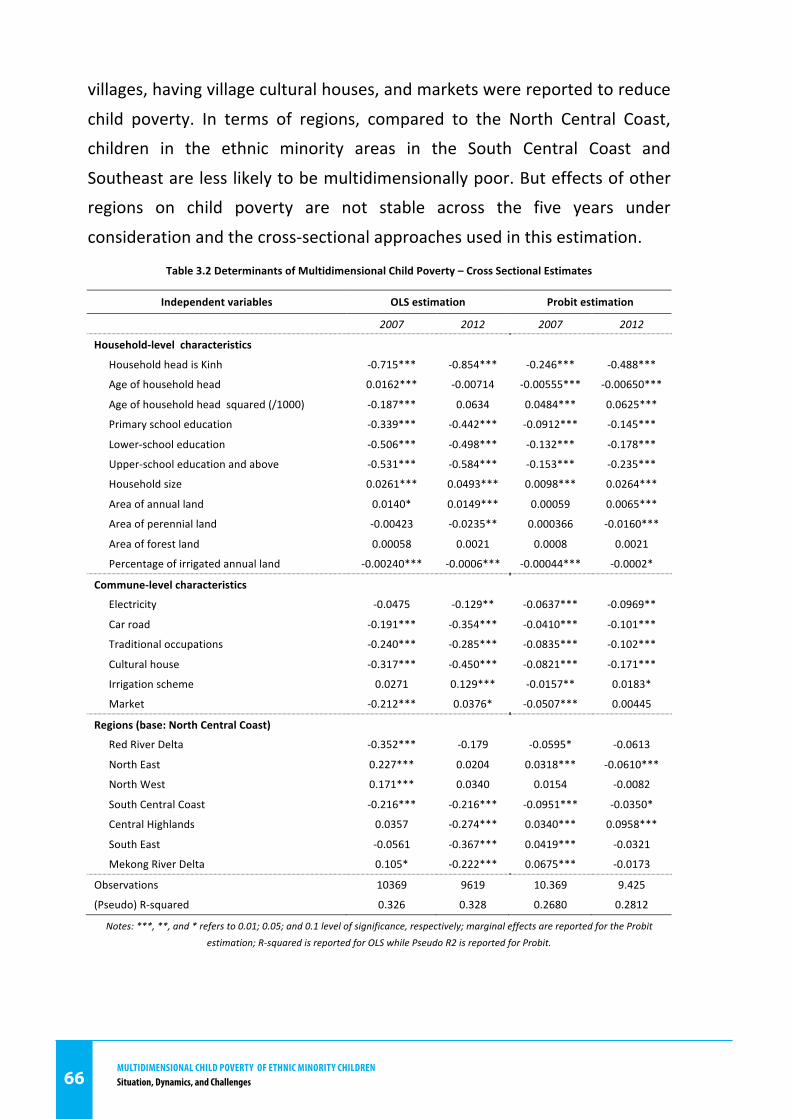
MultidiMensional Child Poverty of ethniC Minority Childrensituation, dynamics, and Challenges66
66 | P a g e
villages, having village cultural houses, and markets were reported to reduce
child poverty. In terms of regions, compared to the North Central Coast,
children in the ethnic minority areas in the South Central Coast and
Southeast are less likely to be multidimensionally poor. But effects of other
regions on child poverty are not stable across the five years under
consideration and the cross-‐sectional approaches used in this estimation.
Table 3.2 Determinants of Multidimensional Child Poverty – Cross Sectional Estimates
Independent variables OLS estimation Probit estimation
2007 2012 2007 2012
Household-‐level characteristics
Household head is Kinh -‐0.715*** -‐0.854*** -‐0.246*** -‐0.488***
Age of household head 0.0162*** -‐0.00714 -‐0.00555*** -‐0.00650***
Age of household head squared (/1000) -‐0.187*** 0.0634 0.0484*** 0.0625***
Primary school education -‐0.339*** -‐0.442*** -‐0.0912*** -‐0.145***
Lower-‐school education -‐0.506*** -‐0.498*** -‐0.132*** -‐0.178***
Upper-‐school education and above -‐0.531*** -‐0.584*** -‐0.153*** -‐0.235***
Household size 0.0261*** 0.0493*** 0.0098*** 0.0264***
Area of annual land 0.0140* 0.0149*** 0.00059 0.0065***
Area of perennial land -‐0.00423 -‐0.0235** 0.000366 -‐0.0160***
Area of forest land 0.00058 0.0021 0.0008 0.0021
Percentage of irrigated annual land -‐0.00240*** -‐0.0006*** -‐0.00044*** -‐0.0002*
Commune-‐level characteristics
Electricity -‐0.0475 -‐0.129** -‐0.0637*** -‐0.0969**
Car road -‐0.191*** -‐0.354*** -‐0.0410*** -‐0.101***
Traditional occupations -‐0.240*** -‐0.285*** -‐0.0835*** -‐0.102***
Cultural house -‐0.317*** -‐0.450*** -‐0.0821*** -‐0.171***
Irrigation scheme 0.0271 0.129*** -‐0.0157** 0.0183*
Market -‐0.212*** 0.0376* -‐0.0507*** 0.00445
Regions (base: North Central Coast)
Red River Delta -‐0.352*** -‐0.179 -‐0.0595* -‐0.0613
North East 0.227*** 0.0204 0.0318*** -‐0.0610***
North West 0.171*** 0.0340 0.0154 -‐0.0082
South Central Coast -‐0.216*** -‐0.216*** -‐0.0951*** -‐0.0350*
Central Highlands 0.0357 -‐0.274*** 0.0340*** 0.0958***
South East -‐0.0561 -‐0.367*** 0.0419*** -‐0.0321
Mekong River Delta 0.105* -‐0.222*** 0.0675*** -‐0.0173
Observations 10369 9619 10.369 9.425
(Pseudo) R-‐squared 0.326 0.328 0.2680 0.2812
Notes: ***, **, and * refers to 0.01; 0.05; and 0.1 level of significance, respectively; marginal effects are reported for the Probit estimation; R-‐squared is reported for OLS while Pseudo R2 is reported for Probit.
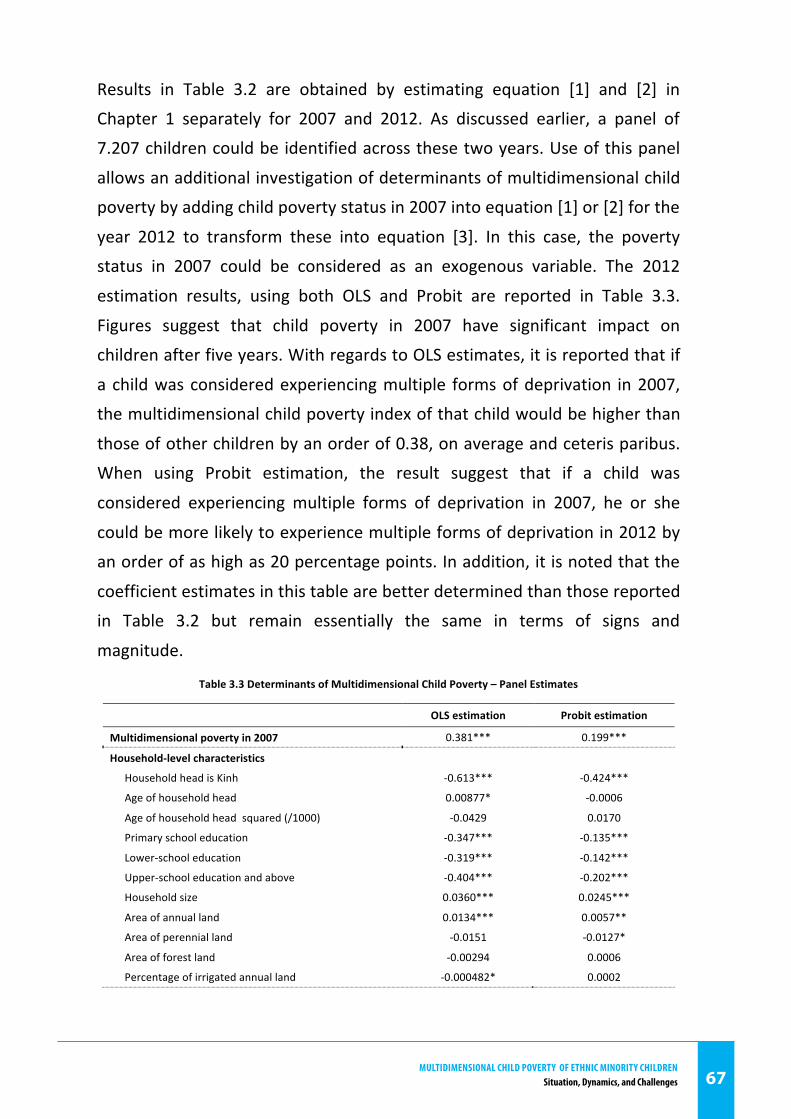
MultidiMensional Child Poverty of ethniC Minority Childrensituation, dynamics, and Challenges 67
67 | P a g e
Results in Table 3.2 are obtained by estimating equation [1] and [2] in
Chapter 1 separately for 2007 and 2012. As discussed earlier, a panel of
7.207 children could be identified across these two years. Use of this panel
allows an additional investigation of determinants of multidimensional child
poverty by adding child poverty status in 2007 into equation [1] or [2] for the
year 2012 to transform these into equation [3]. In this case, the poverty
status in 2007 could be considered as an exogenous variable. The 2012
estimation results, using both OLS and Probit are reported in Table 3.3.
Figures suggest that child poverty in 2007 have significant impact on
children after five years. With regards to OLS estimates, it is reported that if
a child was considered experiencing multiple forms of deprivation in 2007,
the multidimensional child poverty index of that child would be higher than
those of other children by an order of 0.38, on average and ceteris paribus.
When using Probit estimation, the result suggest that if a child was
considered experiencing multiple forms of deprivation in 2007, he or she
could be more likely to experience multiple forms of deprivation in 2012 by
an order of as high as 20 percentage points. In addition, it is noted that the
coefficient estimates in this table are better determined than those reported
in Table 3.2 but remain essentially the same in terms of signs and
magnitude.
Table 3.3 Determinants of Multidimensional Child Poverty – Panel Estimates
OLS estimation Probit estimation
Multidimensional poverty in 2007 0.381*** 0.199***
Household-‐level characteristics
Household head is Kinh -‐0.613*** -‐0.424***
Age of household head 0.00877* -‐0.0006
Age of household head squared (/1000) -‐0.0429 0.0170
Primary school education -‐0.347*** -‐0.135***
Lower-‐school education -‐0.319*** -‐0.142***
Upper-‐school education and above -‐0.404*** -‐0.202***
Household size 0.0360*** 0.0245***
Area of annual land 0.0134*** 0.0057**
Area of perennial land -‐0.0151 -‐0.0127*
Area of forest land -‐0.00294 0.0006
Percentage of irrigated annual land -‐0.000482* 0.0002
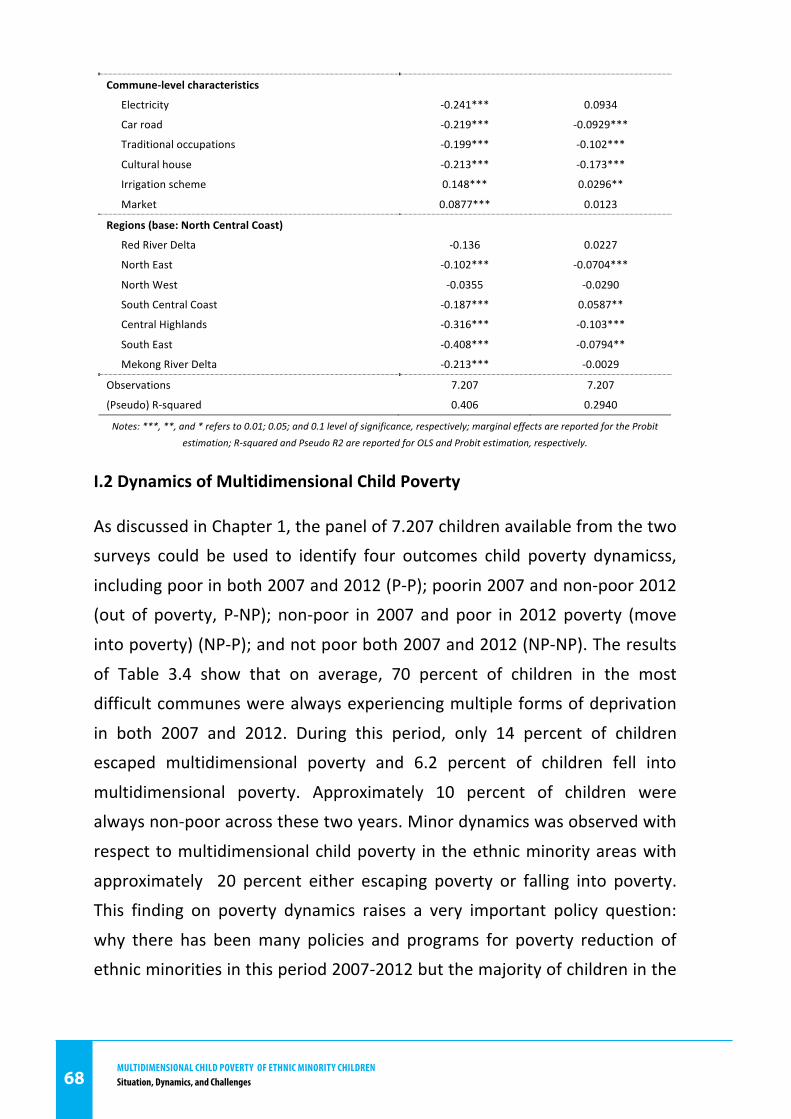
MultidiMensional Child Poverty of ethniC Minority Childrensituation, dynamics, and Challenges68
68 | P a g e
Commune-‐level characteristics
Electricity -‐0.241*** 0.0934
Car road -‐0.219*** -‐0.0929***
Traditional occupations -‐0.199*** -‐0.102***
Cultural house -‐0.213*** -‐0.173***
Irrigation scheme 0.148*** 0.0296**
Market 0.0877*** 0.0123
Regions (base: North Central Coast)
Red River Delta -‐0.136 0.0227
North East -‐0.102*** -‐0.0704***
North West -‐0.0355 -‐0.0290
South Central Coast -‐0.187*** 0.0587**
Central Highlands -‐0.316*** -‐0.103***
South East -‐0.408*** -‐0.0794**
Mekong River Delta -‐0.213*** -‐0.0029
Observations 7.207 7.207
(Pseudo) R-‐squared 0.406 0.2940
Notes: ***, **, and * refers to 0.01; 0.05; and 0.1 level of significance, respectively; marginal effects are reported for the Probit estimation; R-‐squared and Pseudo R2 are reported for OLS and Probit estimation, respectively.
I.2 Dynamics of Multidimensional Child Poverty
As discussed in Chapter 1, the panel of 7.207 children available from the two
surveys could be used to identify four outcomes child poverty dynamicss,
including poor in both 2007 and 2012 (P-‐P); poorin 2007 and non-‐poor 2012
(out of poverty, P-‐NP); non-‐poor in 2007 and poor in 2012 poverty (move
into poverty) (NP-‐P); and not poor both 2007 and 2012 (NP-‐NP). The results
of Table 3.4 show that on average, 70 percent of children in the most
difficult communes were always experiencing multiple forms of deprivation
in both 2007 and 2012. During this period, only 14 percent of children
escaped multidimensional poverty and 6.2 percent of children fell into
multidimensional poverty. Approximately 10 percent of children were
always non-‐poor across these two years. Minor dynamics was observed with
respect to multidimensional child poverty in the ethnic minority areas with
approximately 20 percent either escaping poverty or falling into poverty.
This finding on poverty dynamics raises a very important policy question:
why there has been many policies and programs for poverty reduction of
ethnic minorities in this period 2007-‐2012 but the majority of children in the
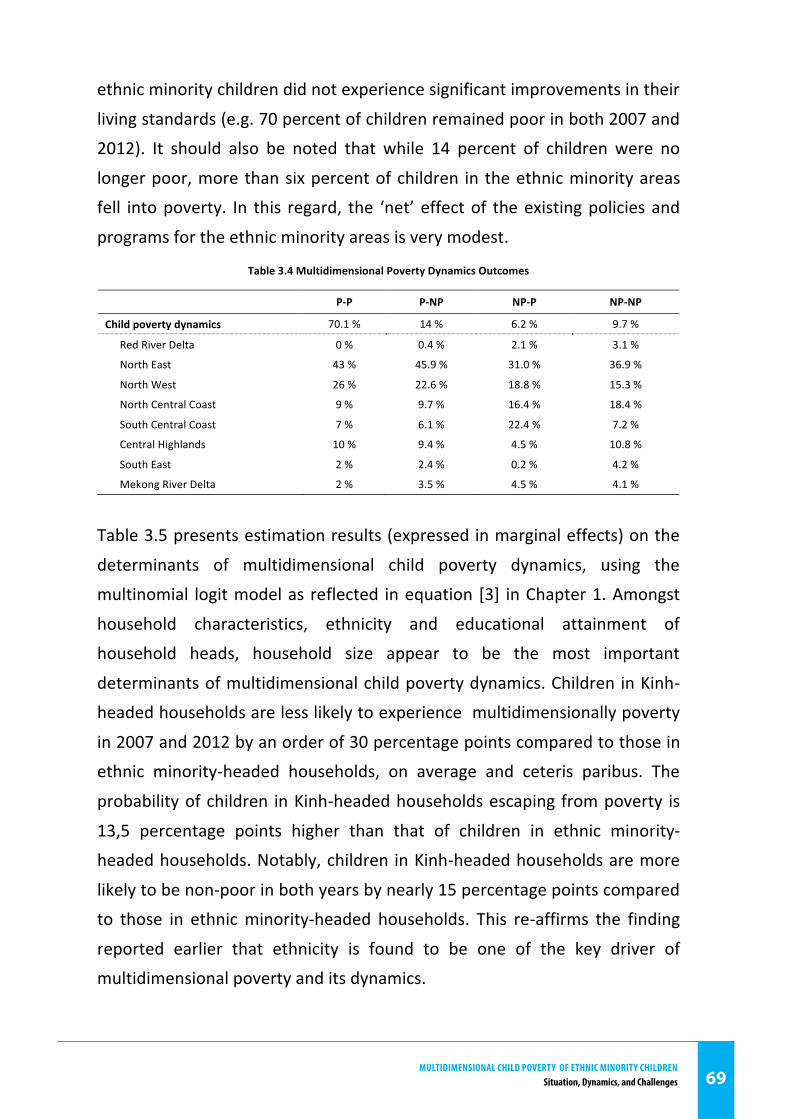
MultidiMensional Child Poverty of ethniC Minority Childrensituation, dynamics, and Challenges 69
69 | P a g e
ethnic minority children did not experience significant improvements in their
living standards (e.g. 70 percent of children remained poor in both 2007 and
2012). It should also be noted that while 14 percent of children were no
longer poor, more than six percent of children in the ethnic minority areas
fell into poverty. In this regard, the ‘net’ effect of the existing policies and
programs for the ethnic minority areas is very modest.
Table 3.4 Multidimensional Poverty Dynamics Outcomes
P-‐P P-‐NP NP-‐P NP-‐NP
Child poverty dynamics 70.1 % 14 % 6.2 % 9.7 %
Red River Delta 0 % 0.4 % 2.1 % 3.1 %
North East 43 % 45.9 % 31.0 % 36.9 %
North West 26 % 22.6 % 18.8 % 15.3 %
North Central Coast 9 % 9.7 % 16.4 % 18.4 %
South Central Coast 7 % 6.1 % 22.4 % 7.2 %
Central Highlands 10 % 9.4 % 4.5 % 10.8 %
South East 2 % 2.4 % 0.2 % 4.2 %
Mekong River Delta 2 % 3.5 % 4.5 % 4.1 %
Table 3.5 presents estimation results (expressed in marginal effects) on the
determinants of multidimensional child poverty dynamics, using the
multinomial logit model as reflected in equation [3] in Chapter 1. Amongst
household characteristics, ethnicity and educational attainment of
household heads, household size appear to be the most important
determinants of multidimensional child poverty dynamics. Children in Kinh-‐
headed households are less likely to experience multidimensionally poverty
in 2007 and 2012 by an order of 30 percentage points compared to those in
ethnic minority-‐headed households, on average and ceteris paribus. The
probability of children in Kinh-‐headed households escaping from poverty is
13,5 percentage points higher than that of children in ethnic minority-‐
headed households. Notably, children in Kinh-‐headed households are more
likely to be non-‐poor in both years by nearly 15 percentage points compared
to those in ethnic minority-‐headed households. This re-‐affirms the finding
reported earlier that ethnicity is found to be one of the key driver of
multidimensional poverty and its dynamics.
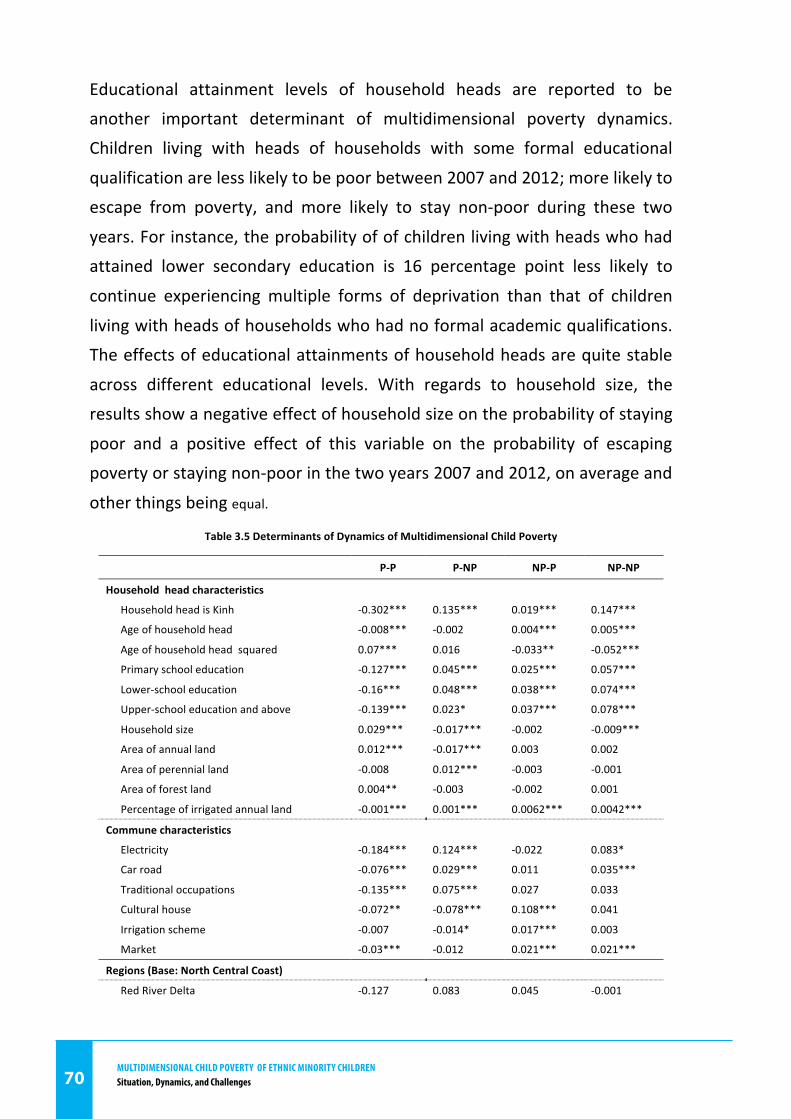
MultidiMensional Child Poverty of ethniC Minority Childrensituation, dynamics, and Challenges70
70 | P a g e
Educational attainment levels of household heads are reported to be
another important determinant of multidimensional poverty dynamics.
Children living with heads of households with some formal educational
qualification are less likely to be poor between 2007 and 2012; more likely to
escape from poverty, and more likely to stay non-‐poor during these two
years. For instance, the probability of of children living with heads who had
attained lower secondary education is 16 percentage point less likely to
continue experiencing multiple forms of deprivation than that of children
living with heads of households who had no formal academic qualifications.
The effects of educational attainments of household heads are quite stable
across different educational levels. With regards to household size, the
results show a negative effect of household size on the probability of staying
poor and a positive effect of this variable on the probability of escaping
poverty or staying non-‐poor in the two years 2007 and 2012, on average and
other things being equal.
Table 3.5 Determinants of Dynamics of Multidimensional Child Poverty
P-‐P P-‐NP NP-‐P NP-‐NP
Household head characteristics
Household head is Kinh -‐0.302*** 0.135*** 0.019*** 0.147***
Age of household head -‐0.008*** -‐0.002 0.004*** 0.005***
Age of household head squared 0.07*** 0.016 -‐0.033** -‐0.052***
Primary school education -‐0.127*** 0.045*** 0.025*** 0.057***
Lower-‐school education -‐0.16*** 0.048*** 0.038*** 0.074***
Upper-‐school education and above -‐0.139*** 0.023* 0.037*** 0.078***
Household size 0.029*** -‐0.017*** -‐0.002 -‐0.009***
Area of annual land 0.012*** -‐0.017*** 0.003 0.002
Area of perennial land -‐0.008 0.012*** -‐0.003 -‐0.001
Area of forest land 0.004** -‐0.003 -‐0.002 0.001
Percentage of irrigated annual land -‐0.001*** 0.001*** 0.0062*** 0.0042***
Commune characteristics
Electricity -‐0.184*** 0.124*** -‐0.022 0.083*
Car road -‐0.076*** 0.029*** 0.011 0.035***
Traditional occupations -‐0.135*** 0.075*** 0.027 0.033
Cultural house -‐0.072** -‐0.078*** 0.108*** 0.041
Irrigation scheme -‐0.007 -‐0.014* 0.017*** 0.003
Market -‐0.03*** -‐0.012 0.021*** 0.021***
Regions (Base: North Central Coast)
Red River Delta -‐0.127 0.083 0.045 -‐0.001
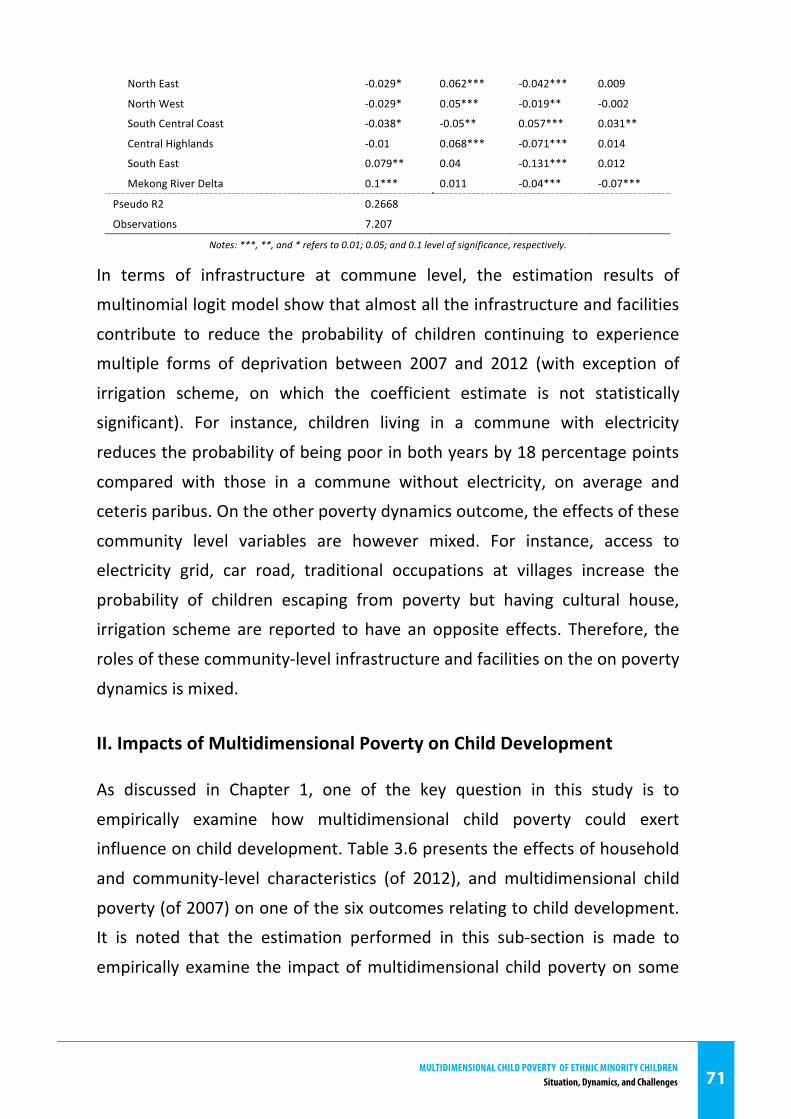
MultidiMensional Child Poverty of ethniC Minority Childrensituation, dynamics, and Challenges 71
71 | P a g e
North East -‐0.029* 0.062*** -‐0.042*** 0.009
North West -‐0.029* 0.05*** -‐0.019** -‐0.002
South Central Coast -‐0.038* -‐0.05** 0.057*** 0.031**
Central Highlands -‐0.01 0.068*** -‐0.071*** 0.014
South East 0.079** 0.04 -‐0.131*** 0.012
Mekong River Delta 0.1*** 0.011 -‐0.04*** -‐0.07***
Pseudo R2 0.2668
Observations 7.207
Notes: ***, **, and * refers to 0.01; 0.05; and 0.1 level of significance, respectively.
In terms of infrastructure at commune level, the estimation results of
multinomial logit model show that almost all the infrastructure and facilities
contribute to reduce the probability of children continuing to experience
multiple forms of deprivation between 2007 and 2012 (with exception of
irrigation scheme, on which the coefficient estimate is not statistically
significant). For instance, children living in a commune with electricity
reduces the probability of being poor in both years by 18 percentage points
compared with those in a commune without electricity, on average and
ceteris paribus. On the other poverty dynamics outcome, the effects of these
community level variables are however mixed. For instance, access to
electricity grid, car road, traditional occupations at villages increase the
probability of children escaping from poverty but having cultural house,
irrigation scheme are reported to have an opposite effects. Therefore, the
roles of these community-‐level infrastructure and facilities on the on poverty
dynamics is mixed.
II. Impacts of Multidimensional Poverty on Child Development
As discussed in Chapter 1, one of the key question in this study is to
empirically examine how multidimensional child poverty could exert
influence on child development. Table 3.6 presents the effects of household
and community-‐level characteristics (of 2012), and multidimensional child
poverty (of 2007) on one of the six outcomes relating to child development.
It is noted that the estimation performed in this sub-‐section is made to
empirically examine the impact of multidimensional child poverty on some
MultidiMensional Child Poverty of ethniC Minority Childrensituation, dynamics, and Challenges72
72 | P a g e
outcomes of child development. Therefore, the focus is placed on the
coefficient estimates of in equation [5]. The coefficient estimates are
generally well determined but the goodness of fit is relatively low compared
to panel estimation standards. This warrants caution when interpreting the
results.
Multidimensional child poverty in 2007 had a negative impact on the
number of years of schooling in 2012 (column 1). Specifically, other things
being equal, one point increase in the multidimensional child poverty in
2007, on average, decreases the number of schooling years of a child by
nearly 20 percent in 2012. Hence, a multidimensional poor child in the initial
year has had less opportunity of going to school compared with non-‐poor
children. Meanwhile, a child experiencing multiple forms of deprivations
may have to drop out early to work or his/her academic results are sufficient
to continue education. This result shows a significant impact of
multidimensional child poverty education in the subsequent years.
Child poverty in 2007 increases the prevalence of children engaging in child
labour in 2012 (column 2). Specifically, a percent point increase in
multidimensional child poverty in 2007 increases the probability of child
labour in 2012 by around four percent points, on average and other things
being equal. Thus, multidimensional child poverty increases the chances of
engaging in child labour in the subsequent years. Compared to the effect on
education, the effect of multidimensional child poverty on child labour is
relatively moderate. However, it should be noted that engagement in child
labour could imply negative effects on the other dimensions, such as
schooling or healthcare. Therefore, the direct effect of child poverty on child
labour could be moderate but there may be secondary implications.
With respect to the impact of multidimensional child poverty on children's
health, no conclusion could be drawn from the analysis. In the first instance,
when healthcare outcome is measured by the number of sick days in the last
12 months or a dummy of being sick in the last 12 months, the coefficient
MultidiMensional Child Poverty of ethniC Minority Childrensituation, dynamics, and Challenges 73
73 | P a g e
estimates are not statistically significant. When a dummy of having medical
treatment in 2012 (e.g. having serious illness that required treatment) is
used as proxy for healthcare outcome, the effect of multidimensional child
poverty in 2007 on this outcome in 2012 is statistically different from zero.
More specifically, a one point increase in multidimensional child poverty in
2007 decreases the probability of being treated at the medical care in 2012
by 5 percent points. Overall, Figures do not provide convincing evidence of
the negative impact of multidimensional child poverty on the child health in
the subsequent years. This might partly be attributed to data constraint
when measuring outcomes of healthcare among children.
The coefficient estimates are poorly determined with respect to the impact
of multidimensional child poverty on other variables that capture aspects of
child development in columns 6, 7 and 8.. The effect of multidimensional
child poverty is only statistically significant when using permanent house as
a proxy for the child’s living conditions. In particular, a one point increase in
multidimensional child poverty in 2007 reduces the probability of having a
permanent house in 2012 by nearly 9 percent points.
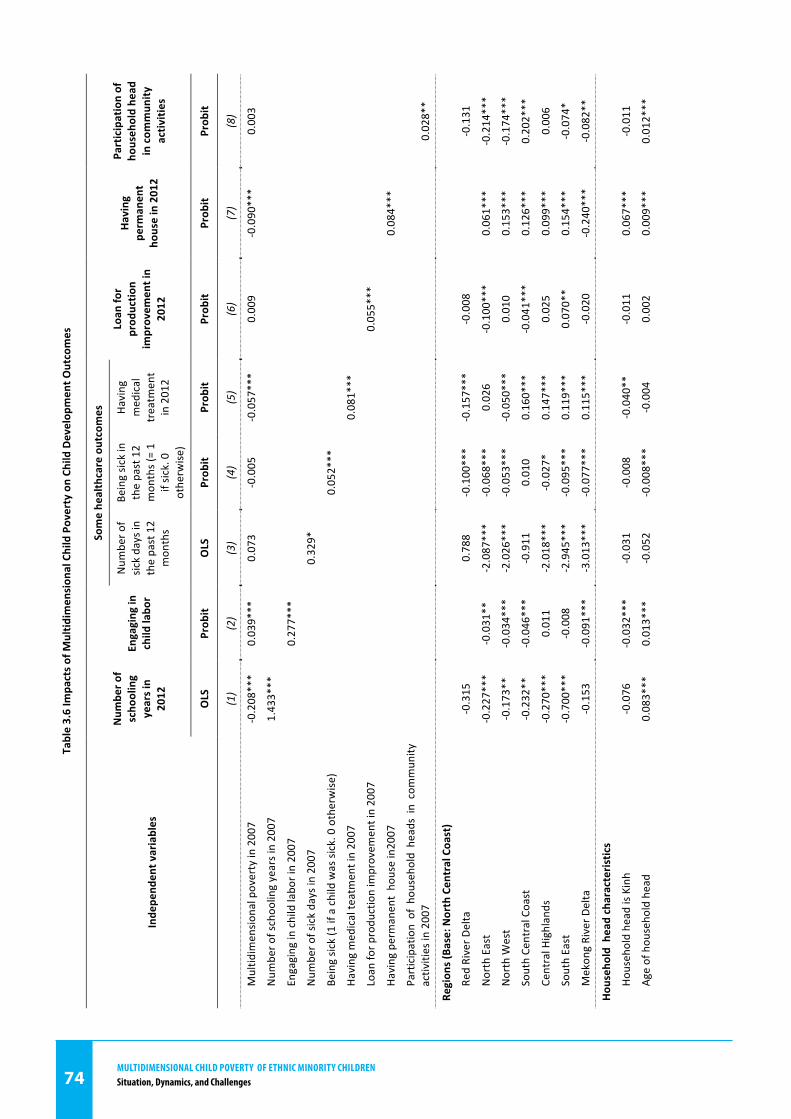
MultidiMensional Child Poverty of ethniC Minority Childrensituation, dynamics, and Challenges74
74 | Page
Tabl
e 3.
6 Im
pact
s of
Mul
tidim
ension
al C
hild
Pov
erty
on
Child
Dev
elop
men
t Out
com
es
Inde
pend
ent v
aria
bles
Num
ber o
f sc
hool
ing
year
s in
20
12
Enga
ging
in
child
labo
r
Som
e he
alth
care
out
com
es
Loan
for
prod
uctio
n im
prov
emen
t in
20
12
Hav
ing
perm
anen
t ho
use
in 2
012
Part
icip
atio
n of
ho
useh
old
head
in
com
mun
ity
activ
ities
Num
ber o
f sic
k days in
the past 12
mon
ths
Being sic
k in
the past 12
mon
ths (= 1
if sic
k. 0
otherw
ise)
Having
medical
treatm
ent
in 2012
OLS
Pr
obit
OLS
Pr
obit
Prob
it Pr
obit
Prob
it Pr
obit
(1)
(2)
(3)
(4)
(5)
(6)
(7)
(8)
Multid
imensio
nal poverty in 2007
-‐0.208***
0.039***
0.073
-‐0.005
-‐0.057***
0.009
-‐0.090***
0.003
Num
ber o
f schoo
ling years in 2007
1.433***
Engaging in child labo
r in 2007
0.277***
Num
ber o
f sick days in 2007
0.329*
Be
ing sic
k (1 if a child was sick. 0 otherwise
)
0.052***
Ha
ving medical te
atment in 2007
0.081***
Loan fo
r produ
ction improvem
ent in 2007
0.055***
Having permanent ho
use in2007
0.084***
Participation of hou
seho
ld heads in commun
ity
activities in 2007
0.028**
Regi
ons (B
ase:
Nor
th C
entr
al C
oast
)
Re
d River D
elta
-‐0.315
0.788
-‐0.100***
-‐0.157***
-‐0.008
-‐0.131
North East
-‐0.227***
-‐0.031**
-‐2.087***
-‐0.068***
0.026
-‐0.100***
0.061***
-‐0.214***
North W
est
-‐0.173**
-‐0.034***
-‐2.026***
-‐0.053***
-‐0.050***
0.010
0.153***
-‐0.174***
South Central Coast
-‐0.232**
-‐0.046***
-‐0.911
0.010
0.160***
-‐0.041***
0.126***
0.202***
Central H
ighlands
-‐0.270***
0.011
-‐2.018***
-‐0.027*
0.147***
0.025
0.099***
0.006
South East
-‐0.700***
-‐0.008
-‐2.945***
-‐0.095***
0.119***
0.070**
0.154***
-‐0.074*
Mekon
g River D
elta
-‐0.153
-‐0.091***
-‐3.013***
-‐0.077***
0.115***
-‐0.020
-‐0.240***
-‐0.082**
Hou
seho
ld h
ead
char
acte
ristic
s
Ho
usehold head is Kinh
-‐0.076
-‐0.032***
-‐0.031
-‐0.008
-‐0.040**
-‐0.011
0.067***
-‐0.011
Age of hou
seho
ld head
0.083***
0.013***
-‐0.052
-‐0.008***
-‐0.004
0.002
0.009***
0.012***
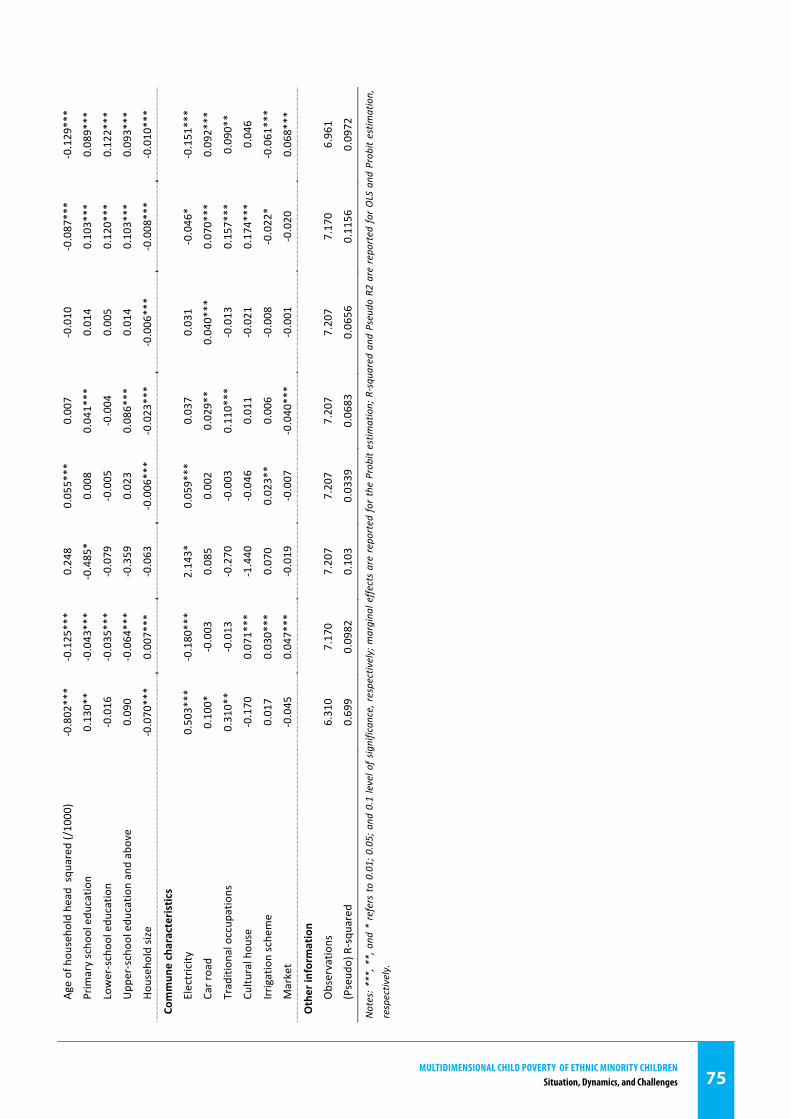
MultidiMensional Child Poverty of ethniC Minority Childrensituation, dynamics, and Challenges 75
75 | Page
Age of hou
seho
ld head sq
uared (/1000)
-‐0.802***
-‐0.125***
0.248
0.055***
0.007
-‐0.010
-‐0.087***
-‐0.129***
Primary scho
ol edu
catio
n 0.130**
-‐0.043***
-‐0.485*
0.008
0.041***
0.014
0.103***
0.089***
Lower-‐schoo
l edu
catio
n -‐0.016
-‐0.035***
-‐0.079
-‐0.005
-‐0.004
0.005
0.120***
0.122***
Upp
er-‐schoo
l edu
catio
n and above
0.090
-‐0.064***
-‐0.359
0.023
0.086***
0.014
0.103***
0.093***
Household size
-‐0.070***
0.007***
-‐0.063
-‐0.006***
-‐0.023***
-‐0.006***
-‐0.008***
-‐0.010***
Com
mun
e ch
arac
teris
tics
Electricity
0.503***
-‐0.180***
2.143*
0.059***
0.037
0.031
-‐0.046*
-‐0.151***
Car road
0.100*
-‐0.003
0.085
0.002
0.029**
0.040***
0.070***
0.092***
Tradition
al occup
ations
0.310**
-‐0.013
-‐0.270
-‐0.003
0.110***
-‐0.013
0.157***
0.090**
Cultu
ral hou
se
-‐0.170
0.071***
-‐1.440
-‐0.046
0.011
-‐0.021
0.174***
0.046
Irrigation scheme
0.017
0.030***
0.070
0.023**
0.006
-‐0.008
-‐0.022*
-‐0.061***
Market
-‐0.045
0.047***
-‐0.019
-‐0.007
-‐0.040***
-‐0.001
-‐0.020
0.068***
Oth
er in
form
atio
n
Observatio
ns
6.310
7.170
7.207
7.207
7.207
7.207
7.170
6.961
(Pseud
o) R-‐squ
ared
0.699
0.0982
0.103
0.0339
0.0683
0.0656
0.1156
0.0972
Not
es: *
**, *
*, a
nd *
ref
ers
to 0
.01;
0.0
5; a
nd 0
.1 le
vel o
f sig
nific
ance
, res
pect
ivel
y; m
argi
nal e
ffect
s ar
e re
port
ed fo
r th
e Pr
obit
estim
atio
n; R
-‐squ
ared
and
Pse
udo
R2 a
re r
epor
ted
for
OLS
and
Pro
bit
estim
atio
n,
resp
ectiv
ely.
MultidiMensional Child Poverty of ethniC Minority Childrensituation, dynamics, and Challenges76
76
In sum, Chapter 3 presents key findings in relation to the determinants of
multidimensional child poverty and its dynamics. Results indicate that
ethnicity, educational attainment levels of household heads, household
size, access to infrastructures are important factors that contribute to
improvement of children’ living standards in the ethnic minority areas.
Using the panel of children available from the two surveys between 2007
and 2012, this chapter reported a very limited dynamics of
multidimensional child poverty over time. In fact, changes in child poverty
took place in around 20 percent of children in the ethnic minority areas,
of which nearly one third fell into poverty. This raises an important
question on the impact of the policies and programs for poverty reduction
in the ethnic minority areas between 2007 and 2012. The chapter also
highlights the potential impact of multidimensional child poverty on some
outcomes of child development. Although the results are not conclusive,
it generally indicates that multidimensional child poverty exert some
negative effects on child development. The findings point towards giving
priority to improve the living standards of minority ethnic children.
MultidiMensional Child Poverty of ethniC Minority Childrensituation, dynamics, and Challenges 77
77
Chapter 4 – Poverty Reduction Policies for
Children in the Ethnic Minority Areas
In order to implement the Millennium Development Goals and Convention on
the Rights of the Child, as well as to address poverty in the ethnic minority
areas, Vietnam has formulated several policies and programmes, both directly
and indirectly addressing the child poverty in general, and poverty of ethnic
minority children in particular. This chapter provides a review the majority of
current policies/programmes that relates to multidimensional child poverty in
the ethnic minority areas and, combining with the findings reported in earlier
chapters, to provide the background for drawing recommendations of this study.
I. Approach Toward Child Poverty Reduction
Given the high poverty rates in the ethnic minority areas, an important policy
question is what are the approaches to address child poverty in Vietnam? By
reviewing most of the existing documents relating either directly or indirectly to
policies and programmes on child poverty, there are two notable observations as below:
I.1 Policies for children from Ethnic minority groups
Currently, there are a few policies that clearly states the approach adopted by
the Government to reduce child poverty, especially among ethnic minority
child. For example:
Resolution 80 of the Government on the sustainable poverty reduction in 2011-‐2020 is one of the framework policies, playing a pivotal role in poverty
reduction in Vietnam. The Resolution specifies: “Sustainable poverty reduction
is a central issue of the 2011-‐2020 socio-‐economic development strategy aimed
at improving the living conditions of the poor (especially those in mountainous
MultidiMensional Child Poverty of ethniC Minority Childrensituation, dynamics, and Challenges78
78
and ethnic minority areas); to make significant and comprehensive
improvements in poor areas; and to narrow the gap between urban and rural
areas, among regions, ethnic minorities and population groups.” Children are
not mentioned explicitly as a group that would be considered as priority. It is
likely that children could be a part of the term ‘population groups’ or ‘ethnic
minorities’ in the Resolution. In other words, Resolution 80 – the framework for
poverty reduction policies of the country -‐ does not explicitly set a priority of
addressing child poverty.
In terms of policies on ethnic minority development, the two most recent
legislative documents are the Ethnic Minority Development Strategy through
2020 (in Decision 449/QD-‐TTg dated 13/03/2013) and Programme 135 in 2013-‐
2015 and 2016-‐2020 (in Decision 551/QD-‐TTg dated 04/04/2013). These two documents clearly confirm the priority of Government of Vietnam in terms of
poverty reduction for ethnic minorities. Nevertheless, the issue of child poverty
in the ethnic minority are not mentioned in these two documents as a specific
issue that needs to be addressed. Similar issues are observed in other poverty
reduction policies for the ethnic minority areas. In other words, while priority
and commitment for poverty reduction among ethnic minorities are certain,
there are almost no explicit focus on the issue of child poverty in the current
policies and programs for poverty reduction in the ethnic minority areas.
I.2 Targeting Children in the Current Policies and Programs on Poverty Reduction
Reviewing the existing policies and programs on poverty reduction (as below)
reveals some shortcomings in targeting poor children in general and children in
the ethnic minority areas in particular.
Household is the targeting unit in most of the existing policies and programs on
poverty reduction. Accordingly, a policy on poverty reduction will select poor
households as the priority beneficiary group and support will then be delivered
to the household level. In this case, whether and how this policy could then be
translated to children is dependent on how their parents decide to allocate the
family resources. Evidence suggests that parents may not allocate resources for
the benefits for their children, and there could be a gender bias towards male
MultidiMensional Child Poverty of ethniC Minority Childrensituation, dynamics, and Challenges 79
79
children. Without an explicit targeting strategy on children, there are difficulties
in reaching children through existing policies and programs on poverty
reduction.
Secondly, one of the most important finding in this study is the challenges in
using income poverty as the main targeting criterion in the existing policies and
programs on poverty reduction. As highlighted earlier, significant percentage of
children who are not income poor but remain multidimensionally poor
especially in the domains of drinking water and sanitation, health care, and
social inclusion. The implications of using income poverty as the main targeting
criterion in the existing policies and programs on poverty reductions are as
follows. First, the children who are not poor in terms of income but deprived in
other domains would be excluded from these policies and programs. Second, there are children who are poor in terms of income but not poor in many other
domains. In this case, the poverty reduction policies and should consider
multidimensionally poor children in the target groups.
As discussed in Chapter 2 of the report, child poverty in the ethnic minority areas is of a concern, both from income poverty or multidimensional poverty
approaches. Most notably, poverty among ethnic minority children are
considerably higher than that of the Kinh children. This warrants the urgency of
reforming and developing relevant and effective policies and programs to
address the multifaceted poverty of children in the ethnic minority areas of the
country, which are now considered as ‘pockets of poverty’.
II. Policies and Programmes for Reduction of Child Poverty
The gap in the living standards between the ethnic majority group and ethnic
minorities is a long standing challenge to the socio-‐economic development in
Vietnam. There are several poverty reduction policies and programmes
prioritising ethnic minority people, particularly Programme 135 from 1999 to
present; Programme 30A; National Target Programme (NTP) on Poverty
Reduction. Generally, these policies and programmes cover almost all the
dimensions in lives of ethnic minority people. Therefore, they also cover most
of the issues of child poverty such as education, health care, shelter, safe
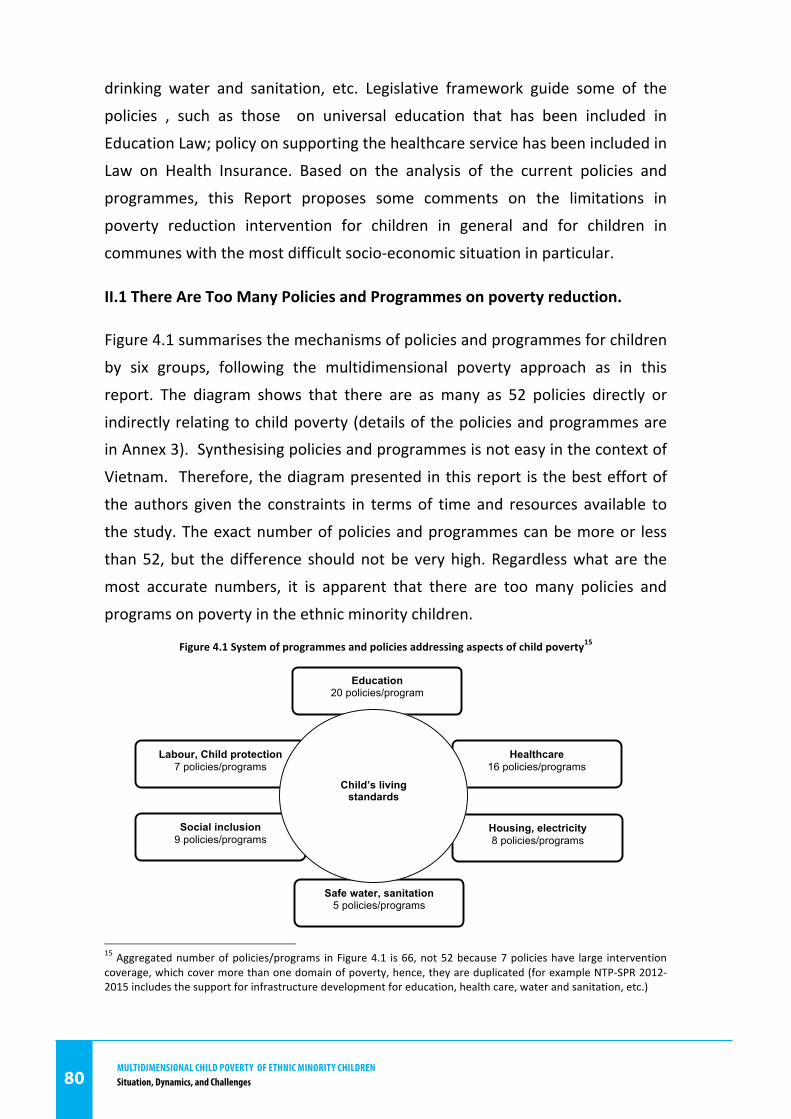
MultidiMensional Child Poverty of ethniC Minority Childrensituation, dynamics, and Challenges80
80
drinking water and sanitation, etc. Legislative framework guide some of the
policies , such as those on universal education that has been included in
Education Law; policy on supporting the healthcare service has been included in
Law on Health Insurance. Based on the analysis of the current policies and
programmes, this Report proposes some comments on the limitations in
poverty reduction intervention for children in general and for children in
communes with the most difficult socio-‐economic situation in particular.
II.1 There Are Too Many Policies and Programmes on poverty reduction.
Figure 4.1 summarises the mechanisms of policies and programmes for children
by six groups, following the multidimensional poverty approach as in this
report. The diagram shows that there are as many as 52 policies directly or
indirectly relating to child poverty (details of the policies and programmes are in Annex 3). Synthesising policies and programmes is not easy in the context of
Vietnam. Therefore, the diagram presented in this report is the best effort of
the authors given the constraints in terms of time and resources available to
the study. The exact number of policies and programmes can be more or less
than 52, but the difference should not be very high. Regardless what are the
most accurate numbers, it is apparent that there are too many policies and
programs on poverty in the ethnic minority children.
Figure 4.1 System of programmes and policies addressing aspects of child poverty15
15 Aggregated number of policies/programs in Figure 4.1 is 66, not 52 because 7 policies have large intervention coverage, which cover more than one domain of poverty, hence, they are duplicated (for example NTP-‐SPR 2012-‐2015 includes the support for infrastructure development for education, health care, water and sanitation, etc.)
Healthcare 16 policies/programs
Education 20 policies/program
Safe water, sanitation 5 policies/programs
Housing, electricity 8 policies/programs
Labour, Child protection 7 policies/programs
Social inclusion 9 policies/programs
Child’s living standards
MultidiMensional Child Poverty of ethniC Minority Childrensituation, dynamics, and Challenges 81
81
that the existence of many policies and programs on child poverty is a
reflection of the political commitment of the Government of Vietnam in
addressing poverty, including that affecting children. However, too many
policies and program interventions in this field has resulted in overlaps
regarding objectives, beneficiaries, and implementation arrangements.
According to the present study, a majority of policies and programs are in
the education domain (with 20 policies and programs). Given this
multitude of initiatives, understanding the procedures associated to these
initiatives is already a difficulty, not to mention the challenges
encountered in implementation. When it comes to practice, this large
number of policies and program are most likely to cause confusion and
problem in coordination. The next section will analyze some
consequences of such overlaps.
II.2 Most Policies/Programmes Are Under-‐Resourced
While there are many policies and programs directly or indirectly
addressing child poverty, an important question is whether adequate
resources have been allocated to support the implementation of those
policies and programs? This is a very difficult question to answer given the
data availability and institutional constraints. With regard to data
availability, there are no systematic statistics on the disbursement of
resources for poverty reduction initiatives (except figures maintained by
development partners on their portfolios). While reviewing information
about the policies and programs listed in Appendix 3 and in Figure 4.1
above, less than 10 percent of the policies and programs were found with
information on the financial imbursement. In terms of institutional
constraints, as poverty reduction initiatives are managed by any different
agencies without effective coordination mechanisms, compiling patchy
data from different sources appear to be very challenging.
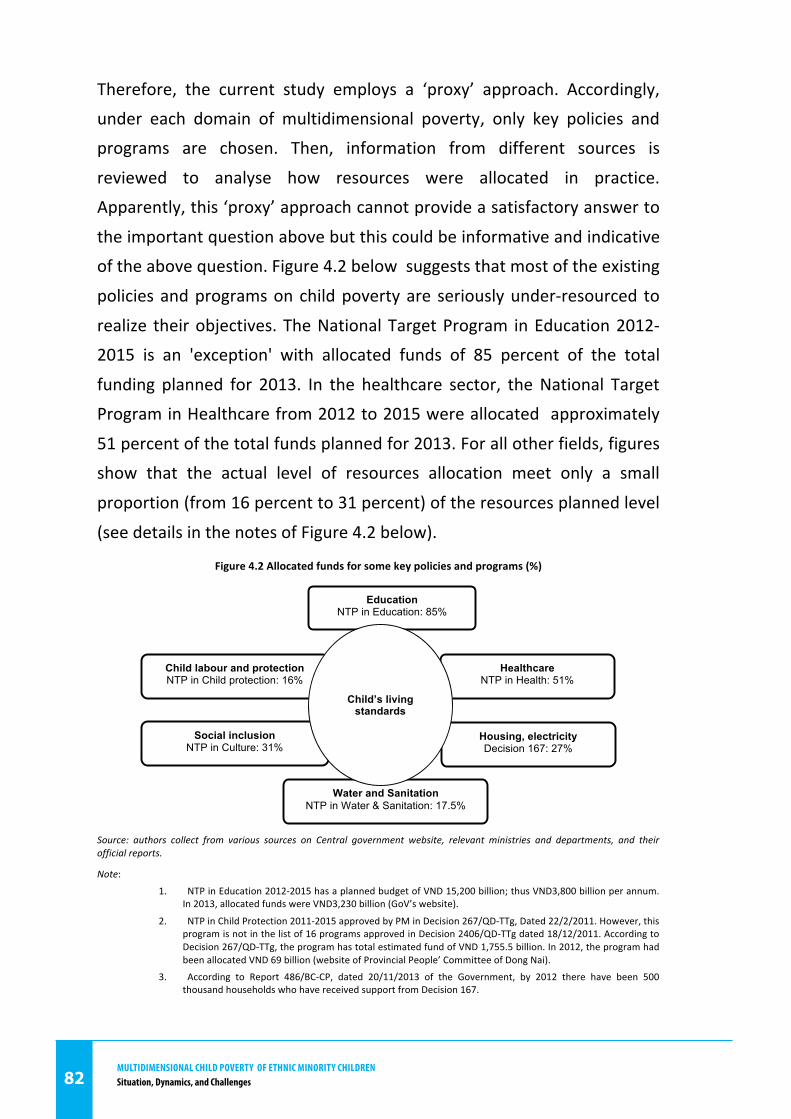
MultidiMensional Child Poverty of ethniC Minority Childrensituation, dynamics, and Challenges82
82
Therefore, the current study employs a ‘proxy’ approach. Accordingly,
under each domain of multidimensional poverty, only key policies and
programs are chosen. Then, information from different sources is
reviewed to analyse how resources were allocated in practice.
Apparently, this ‘proxy’ approach cannot provide a satisfactory answer to
the important question above but this could be informative and indicative
of the above question. Figure 4.2 below suggests that most of the existing
policies and programs on child poverty are seriously under-‐resourced to
realize their objectives. The National Target Program in Education 2012-‐
2015 is an 'exception' with allocated funds of 85 percent of the total
funding planned for 2013. In the healthcare sector, the National Target
Program in Healthcare from 2012 to 2015 were allocated approximately
51 percent of the total funds planned for 2013. For all other fields, figures
show that the actual level of resources allocation meet only a small
proportion (from 16 percent to 31 percent) of the resources planned level
(see details in the notes of Figure 4.2 below).
Figure 4.2 Allocated funds for some key policies and programs (%)
Source: authors collect from various sources on Central government website, relevant ministries and departments, and their official reports.
Note:
1. NTP in Education 2012-‐2015 has a planned budget of VND 15,200 billion; thus VND3,800 billion per annum. In 2013, allocated funds were VND3,230 billion (GoV’s website).
2. NTP in Child Protection 2011-‐2015 approved by PM in Decision 267/QD-‐TTg, Dated 22/2/2011. However, this program is not in the list of 16 programs approved in Decision 2406/QD-‐TTg dated 18/12/2011. According to Decision 267/QD-‐TTg, the program has total estimated fund of VND 1,755.5 billion. In 2012, the program had been allocated VND 69 billion (website of Provincial People’ Committee of Dong Nai).
3. According to Report 486/BC-‐CP, dated 20/11/2013 of the Government, by 2012 there have been 500 thousand households who have received support from Decision 167.
Healthcare NTP in Health: 51%
Education NTP in Education: 85%
Water and Sanitation NTP in Water & Sanitation: 17.5%
Housing, electricity Decision 167: 27%
Child labour and protection NTP in Child protection: 16%
Social inclusion NTP in Culture: 31%
Child’s living standards
MultidiMensional Child Poverty of ethniC Minority Childrensituation, dynamics, and Challenges 83
83
4. NTP in Water and Sanitation has estimated fund of VND27,600 billion, or 6900 billion per annum. According to the data on the GoV Budget (available from the GoV’s website), VND 1205 billion was allocated to this NTP in 2013.
5. NTP in Culture 2012-‐2015 has planned budget of VND 7,399 billion, or nearly 1,850 billion per annum. The actual budget allocated was VND580 billion in 2013 (GoV’s website).
6. NTP in Healthcare 2012-‐2015 has a planned budget of VND12,770 billion, or nearly 3193 billion per annum. The actual of budget allocation for this NTP was VND1,625 billion in 2013.
In the context of the recent economic slowdown, the GoV has frozen
public investment and other public expenses. This could exert important
implications in resource mobilization for poverty reduction efforts. The
question is whether the under-‐funding could be reversed in the near
future. Although the the scope of the current study will not be able to
generate a satisfactory answer to this question, it is not unreasonable to
argue that being under-‐resourced would remain a problem in the near
future due to prolonged economic difficulties and the resultant budget
constraints.
In response to the recent economic slowdown, the GoV has lowered the
budget mobilization as percentage of GDP. The budget mobilization of
Vietnam has been very high compared to that of other developing
countries. Before the current economic turmoil, the budget mobilization
was nearly 30 percent of GDP in the period 2006-‐2008. However, this
budget mobilization has decreased rapidly in the recent years to about
21.1 percent in 2012 (compiled from the GSO Statistics, various years). As
the recovery prospect remains uncertain, it is not likely to postulate a
turnback of this trend in the next few years. In this context, official
statistics on the budget investment (available from the GoV’s website)
shows that the proportion of spending for NTPs as percentage of the
budget has decreased in the recent years. The expenditure for all NTP
were estimated at around 7.1 percent of the total budget in 2008. By the
end of 2012, this figure dropped to just 4.68 percent. In this context,
there is little room for the Government to adjust the under-‐financing as
observed in the existing policies and programs on child poverty reduction.
MultidiMensional Child Poverty of ethniC Minority Childrensituation, dynamics, and Challenges84
84
II.3 Having Too Many Agencies Operating Without Effective
Coordination Mechanisms
The implementation of the overlapping policies and programs related to
child poverty as discussed in Figure 4.2, is a challenge. For example,
National Targeted Programme for Sustainable Poverty Reduction (SPR)
2012-‐2015 aims at investing in the construction of a wide range of
infrastructures and public facilities that facilitate accessibility to
education, health care, water and sanitation, electricity. The design and
implementation guidance is complex. As stipulated in 1489/QD-‐TTg
decision enacting the NTP, MOLISA has overall responsibility for program
management, and is directly responsible for the Project 1, 3, 4 while the
Central Committee on Ethnic Minority Affairs (CEMA) is responsible for
directly managing Project 2. Other Ministries, including Ministry of
Planning and Investment (MPI), Ministry of Finance (MoF), and Ministry of
Agriculture and Rural Development (MARD) are also participating
(especially the role of MPI in implementing Program 30a, which is a part
of Project 1 of that NTP).
While the involvement of multiple stakeholders is enriching, coordinating
Having different stakeholders involved is not necessarily a problem if
there is an effective coordination mechanism at place. However, such
coordination mechanism was found to be weak and ineffective in
coordinating information exchange, planning, and resource allocation is a
challenge, especially in ensuring the synergy across activities managed by
different stakeholders. While NTP is uniform in its design, actual
implementation of the different components NTP SPR is left to different
stakeholders using their own implementation arrangements. For instance,
infrastructure investment under project 1 consists of two guidelines, one
on infrastructure under Program 30a, the other applied for extremely
difficult communes coastal areas and islands; infrastructure development
under project 2 (i.e. Program 135) follows another procedure stated in a
MultidiMensional Child Poverty of ethniC Minority Childrensituation, dynamics, and Challenges 85
85
recent inter-‐Ministerial circular led by CEMA. In other words, the fact that
there are different agencies involved in managing the NTP SPR has
resulted in having different implementation arrangements for one single
activity.
Such institutional set up of the NTP SPS challenges the implementation at
the local level. In many provinces, the Department of Planning and
Investment (DPI) is the authority responsible for the implementation of
the program 30a (as part 1 of Project 1); Department of Labour, War
Invalids, and Social Affairs (DOLISA) direct the extremely difficult
communes in the coastal areas and islands (as another part of Project 1),
Project 3 and Project 4; while Provincial Ethnic Committee (PCEM) is
accountable for Project 2 (i.e. Program 135); Department of of Agriculture
and Rural Development (DARD) carries out a number of models of poverty
reduction (Project 2) and provide further support in the implementation
of other production development in Project 1 and 2. In addition, there are
other agencies involved including the Department of Finance (DoF), the
vocational training schools (mainly for vocation training activities under
Program 30a), and other mass organizations (e.g. Farmers Association,
Women's Union). It is therefore challenging effectively coordinate the
provincial agencies involved in implementation of NTP SPR, Preventing
DOLISA from exercising its ‘steering’ role in coordinating activities under
NTP SPR.
In summary, Vietnam has shortage of poverty reduction policies and
programs that seek to directly or indirectly improve the well-‐being of
children, resulting in overlaps and challenges in the implementation
arrangements. In the lack of effective coordination mechanisms involving
different stakeholders, such overlaps and complication make it difficult to
ensure the synergy across different agencies. More importantly, many of
these policies and programs are seriously under-‐resourced and also not
effectively implemented, making difficult to achieve the expected goals
MultidiMensional Child Poverty of ethniC Minority Childrensituation, dynamics, and Challenges86
86
and objectives. This situation calls for important policy changes and
institutional reforms in the near future. Recommendations in this
direction are provided below.
MultidiMensional Child Poverty of ethniC Minority Childrensituation, dynamics, and Challenges 87
87
Conclusions and Policy Recommendations
Based on the analysis results above, the report draws some conclusions as
follows:
First, child poverty in the ethnic minority areas remains very highly
prevalent regardless of measurement approaches adopted. In terms of
income poverty, nearly half of children in the ethnic minority areas were
found to be poor. According to the multidimensional poverty approach,
nearly two thirds of children in the ethnic minority areas were reported to
be poor in at least two domains of poverty and at least a half of children
in the ethnic minority areas are deprived of many basic aspects of living
standards.
Second, in the most difficult areas of the country, there is a large gap
between the living standards of ethnic minority and Kinh children. Using
the multidimensional poverty among Kinh children fell from 55.5 percent
to 28.9 percent, equivalent toan average of more than five percentage
points per year. Meanwhile, the poverty rate of ethnic minority children
was still very high at 89.3 percent in 2007, and remained at 81 percent in
2012, implying an annual reduction rate of less than two percentage
points. In other words, for any five ethnic minority children, there is only
one child that is non-‐poor in multidimensional poverty terms. The fact
that 81 percent of ethnic minority children are poor in at least two out of
the six domains of living standards in 2012 raises concern. This situation
remains persistent despite the implementation of many policies and
programs on socio-‐economic development in the ethnic minority areas.
Third, further analysis of different domains of child poverty in the ethnic
minority areas over the period 2007-‐2012 show some important findings
as follows:
MultidiMensional Child Poverty of ethniC Minority Childrensituation, dynamics, and Challenges88
88
Regarding the domains of poverty: deprivation in the domains of shelter,
safe drinking water and sanitation, engaging in child labour tends to
decrease significantly over time; while there almost no improvements
were observed in the deprivation in the education domain. Notably, child
poverty in the domains of healthcare and social inclusion tends to
increase relatively substantially. As a result, while multi-‐dimensional child
poverty in the ethnic minority areas has decreased at a moderate rate at
less than two percentage points per year, many aspects of well-‐being are
worsening or remain stubbornly highs.
In terms of ethnicity: minor improvements have been observed in the
multidimensional poverty rates among Hmong, Khmer and Bana although
change in poverty in different dimensions of these groups is small
compared with the average change at national level or is not statistically
significant. Ethnic groups such as Tay, Thai, Muong, Nung and Dao have
experienced a reduction in multidimensional child poverty faster than the
average. The remaining ethnic groups have experienced some
improvements, however at a lower rate than the others. It should be
noted that while the existing policies and programs on poverty reduction
facilitate equal access for all ethnic groups (except some designated
policies to support the ethnic groups with very low population), results
show that different groups benefit from these policies and programs quite
differently.
Concerning geographical regions: children have exited from
multidimensional poverty faster in the South compared to the North. In
addition, drivers of multidimensional poverty dynamics differ across
regions. While there are minimal differences in the domain of education,
improvements in the domain of safe drinking water and sanitation is a
major driver in the reduction of multidimensional child poverty among
the ethnic minority areas in the South. Meanwhile, the domain child
labour was reported to as the driver of reduction in multidimensional
MultidiMensional Child Poverty of ethniC Minority Childrensituation, dynamics, and Challenges 89
89
child poverty in the ethnic minority areas in the North. Notably, a
significant increase in the deprivation in the health domain was observed
in the two poorest regions of North West and Central Highlands, where
most of ethnic minority group reside.
Fourth, the results of regression analysis indicate that children living in
Kinh families are more likely to escape poverty compared with those in
ethnic minority families. Education level of the household head was
reported to be one of the most important determinant of children
escaping poverty and reducing the likelihood of children falling into
poverty. The percentage of the irrigated annual crop land is also positively
associated with the rate of escaping from poverty and negatively related
to the rate of falling into poverty (this effect is statistically significant but
not very strong). In terms of infrastructure at commune level, the analysis
results show that electricity, road that cars can travel, villages with
traditional occupations (e.g. handicraft, textile), commune cultural hall,
and daily market decreases the likelihood of children falling into poverty.
Besides, the regression estimation results also indicate a negative impact
of multidimensional poverty on the number of years of schooling and
possibility of being engaged in child labour in the future, which are two
important outcomes of child development.
Fifth, existence of multiple policies and programs directly or indirectly
aiming at improving living standards of children, especially those in the
ethnic minority areas have resulted in considerable overlaps in their
implementation. Notably, most of the key policies and programs were
found to be under-‐resourced by some significant levels. In addition, the
involvement of multiple stakeholders in the policies and programs has
brought opportunities as well as challenges. The management of existing
policies and programs are by different agencies without effective
coordination mechanisms is a major challenge, especially with respect to
the effectiveness and efficiency of poverty reduction initiatives. These
MultidiMensional Child Poverty of ethniC Minority Childrensituation, dynamics, and Challenges90
90
shortcomings could be an important cause that lead to the fact that child
poverty has been persistent in the ethnic minority areas (e.g. there are
four multidimensionally poor children out of every five children living in
the ethnic minority areas).
Based on these findings, the report draws some policy
recommendations as follows:
Firstly, it is necessary to have a consistent approach on child poverty. This
approach should ensure that children are taken into account as direct
target beneficiaries of specific support policies and programs. Income
should not be the only criterion in targeting. The income-‐based approach
to poverty has several shortcomings in identifying the beneficiaries as
many children would be excluded from critical policies. Therefore,
multidimensional poverty approach is recommended to be used in
poverty monitoring and identifying beneficiaries of poverty reduction
policies and programs. Accordingly, different domains of child poverty
should be monitored (instead of focusing only on income poverty) and
resource allocation should then be made to address the challenges that
are specific to each domain. More importantly multidimensional poverty
approach is recommended to be applied when selecting the beneficiary
for different policies and programs on poverty reduction.
Second, rationalization and integration of poverty reduction policies and
programs is recommended. Child poverty is a multidimensional issue and
it cannot be addressed thoroughly if child poverty is based only on one
policy. However, in addressing multiple deprivation requires an integrated
policy response rather than stand-‐alone initiatives, in such a way to
maximize the resources and impact. The integrated policy response is
recommended to be complemented with effective coordination
mechanisms performed by one or two leading agencies in the field of
poverty reduction.
MultidiMensional Child Poverty of ethniC Minority Childrensituation, dynamics, and Challenges 91
91
Third, the reform of existing policies and programs is recommended to be
associated with improvements in the resource allocation mechanisms.
Resource allocation is recommended to be based on medium and long
term approaches rather than annually planning and information on
resource allocation needs to be available for all stakeholders involved.
This will be the background to move forward a more ‘realistic’ approach
while designing poverty reduction policies and programs. It would be
important to consider reform in the national socio-‐economic planning and
budget-‐allocation mechanisms.
Fourth, it is also important to define the role and responsibilities of
stakeholders in the management and implementation of poverty
alleviation initiatives. Improving the effectiveness of the coordination
mechanism is urgent in reducing the fragmentation policy, programmes
and resources. Given poverty reduction is now more difficult and thus
more ‘expensive’ than it was before, such rationalization would be an
important improvement toward more efficient usage of the resources for
reduction of poverty in general and of child poverty in particular.
MultidiMensional Child Poverty of ethniC Minority Childrensituation, dynamics, and Challenges92
92
References
Alkire, S. & Santos, M. E. (2010) Acute multidimensional poverty: A new index for
developing countries. OPHI Working Paper No. 38. Oxford: OPHI.
Alkire, S., & Foster, J. (2009). Counting and multidimensional poverty measurement:
Oxford Poverty & Human Development Initiative, OPHI.
Anderson, S., Bradshaw, P., Cunningham-‐Burley, C., Hayes, F.,Jamieson, L., MacGregor,
A., Marryat, L. & Wasoff, F. (2007) Growing up in Scotland: Sweep One Overview Report. Edinburgh: Scottish Government
Ben-‐Shlomo, Y. & Kuh, D. (2002) A life course approach to chronic disease
epidemiology: conceptual models, empirical challenges and interdisciplinary perspectives. International Journal of Epidemiology, 31, 285–293
Blanden, J., Gregg, P. & MacMillan, L.(2008) Accounting for intergenerational income
persistence: non-‐cognitive skills, ability and education, Economic Journal, 117, C43–C60
Bourguignon, F., & Chakravarty, S. (2003). The measurement of multidimensional
poverty. Journal of Economic Inequality, 1(1), 25–49. CrossRef
Bromley, C. & Cunningham-‐Burley, S.(2010) Growing up in Scotland: Health inequalities in the early years. Edinburgh: The Scottish Government
Carneiro, P., Crawford, C. & Goodman, A.(2007) The Impacts of Early Cognitive and Non-‐Cognitive Skills on Later Outcomes. London: London School of Economics.
Emerson, E., Graham, H. & Hatton, C., 2006, Household income and health status in
children and adolescents in Britain, European Journal of Public Health, 16, trang 354–360.
Eric V. Edmonds, 2005. "Does Child Labor Decline with Improving Economic Status?,"
Journal of Human Resources, 40(1).
Hack, M., Klein, N. K. & Taylor, H. G.(1995) Long-‐term developmental outcomes of
low-‐birth-‐weight infants, Future of Children, 5, 176–196.
IRC, UNDP, CEMA (2013), Final Impact Evaluation of the P135-‐II using the Data from
the Endline Survey, a report for UNDP and CEMA.
MultidiMensional Child Poverty of ethniC Minority Childrensituation, dynamics, and Challenges 93
93
IRC, UNDP, and CEMA (2010), Poverty of Ethnic Minorities in Vietnam: Situation and Challenges from P135-‐II Communes, a research report of UNDP and CEMA.
Justino, P., Litchfield, J., and Hung, P., 2008, Poverty Dynamics during Trade Reform:
Evidence from Rural Vietnam, Review of Income and Wealth, 54 (2), 166-‐192.
Oxfam and ActionAid, 2011, Participatory Poverty Monitoring in Rural Communities in
Vietnam, Report.
Pham Thai Hung, Le Dang Trung, Herera Javier, Razafindrakoto Mireille, Roubaud
Francois (2008), Final report analysis of the P135-‐II Baseline survey, a research report of UNDP and CEMA.
Power, C., Atherton, K., Strachan, D. P., Shepherd, P., Fuller, E., Davis,A., Gibb, I.,
Kumari, M., Lowe, G., MacFarlane, G. J., Rahi, J., Rodgerslo,B. & Stansfeld, S.(2007)
Life-‐course influences on health in British adults: effects of socio-‐economic position in childhood and adulthood. International Journal of Epidemiology, 36, 532–539
Roelen, K. (2013), Multidimensional Child Poverty in Vietnam from a Longitudinal Perspective—Improved Lives or Impoverished Conditions?, Child Indicators Research
Roelen, K. and Evans, M. (2009) “Child poverty in Vietnam and the response from
social protection‟, presented at APPAM Conference Asian Social Protection in Comparative Perspective, Singapore, 7-‐9 January 2009.
Roelen, K., Gassmann, F. & de Neubourg, C. (2010) Child poverty in Vietnam -‐ providing insights using a country-‐specific and multidimensional model. Social Indicators Research, 98(1), 129.
World Bank (2009), Country Social Analysis: Ethnicity and Development in Vietnam: Summary Report, Working Paper No, 2776, Washington DC: World Bank.
World Bank (2012), Vietnam poverty Assessment: Well began, not yet done, Vietnam’s
remarkable progress on poverty reduction and the Emerging challenges.
MultidiMensional Child Poverty of ethniC Minority Childrensituation, dynamics, and Challenges94
94
Annexes
Annex 1. Classification of ethnic minority groups
In order to ensure the statistical representativeness and the logic in
analysing, this report classifies the surveyed households into 14 ethnic
groups based on their ethnic characteristics. In Vietnam, Kinh people
comprise the major ethnic group, accounting for 86 percent of the
population. The other 53 ethnic groups have the population of around
one million, such as Tay, Nung, Thai, Muong, Khmer, to just around a few
hundreds, such as O Du and Brau. Kinh people inhabit across the country,
yet most densely concentrated in the lowland areas and river deltas. Most
of the other ethnic groups inhabit in the mountainous and midland areas
in the North and Central of the country; most of them coexist in mixed
communities, like those in the North and Northern Central areas.
In this report, we integrate Chinese people and Kinh people in one ethnic
group. This integration is in line with other reports and researches. In
addition, Chinese group comprises an insignificant proportion in the
sample, just around 0.7 percent. Moreover, these two groups share the
similarities in economic activities. Therefore, 14 ethnic groups classified
for analysis purpose include: the Kinh majority, Tay, Thai, Muong, Nung,
Mong, Dao, Other EMs in the Northern areas, Bana, H’Re, Co Tu, Other
EMs in the Central Highlands, and others. Among these, Bana is the group
with smallest proportion in the survey sample, accounting for around 1.5
percent. Table A1.1 below gives information about the number of
observations in each ethnic group:
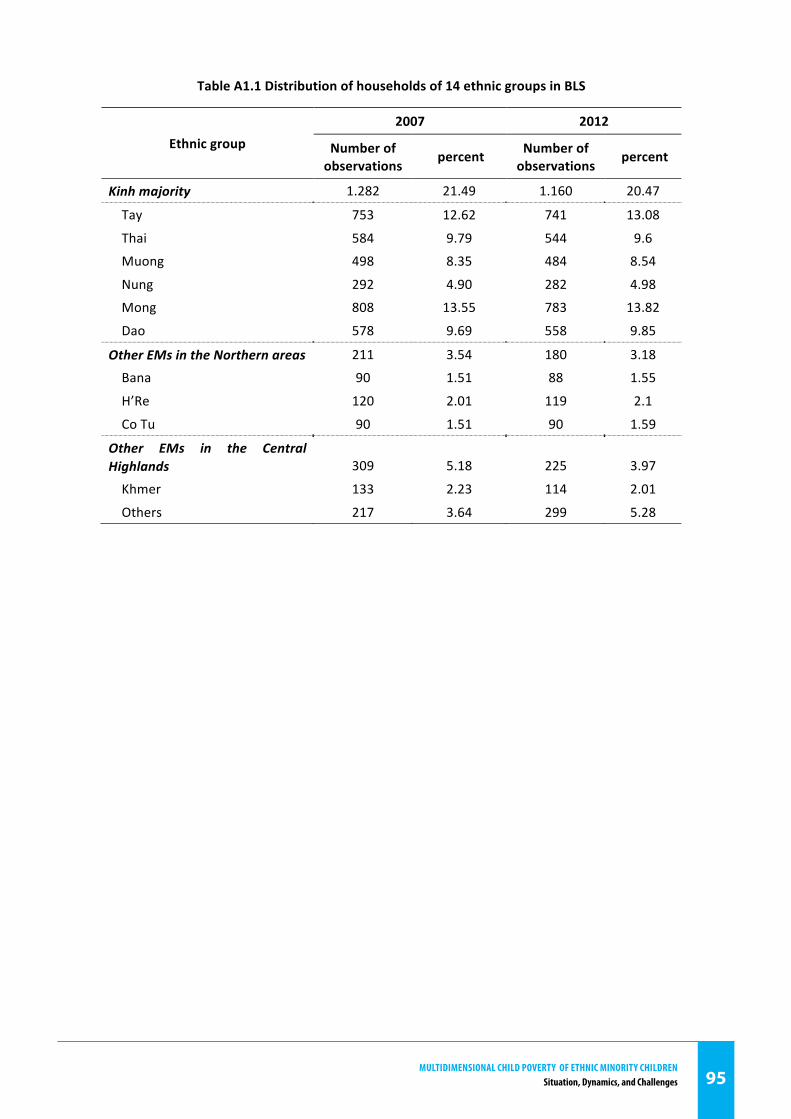
MultidiMensional Child Poverty of ethniC Minority Childrensituation, dynamics, and Challenges 95
95
Table A1.1 Distribution of households of 14 ethnic groups in BLS
Ethnic group 2007 2012
Number of observations
percent Number of observations
percent
Kinh majority 1.282 21.49 1.160 20.47
Tay 753 12.62 741 13.08
Thai 584 9.79 544 9.6
Muong 498 8.35 484 8.54
Nung 292 4.90 282 4.98
Mong 808 13.55 783 13.82
Dao 578 9.69 558 9.85
Other EMs in the Northern areas 211 3.54 180 3.18
Bana 90 1.51 88 1.55
H’Re 120 2.01 119 2.1
Co Tu 90 1.51 90 1.59
Other EMs in the Central Highlands 309 5.18 225 3.97
Khmer 133 2.23 114 2.01
Others 217 3.64 299 5.28
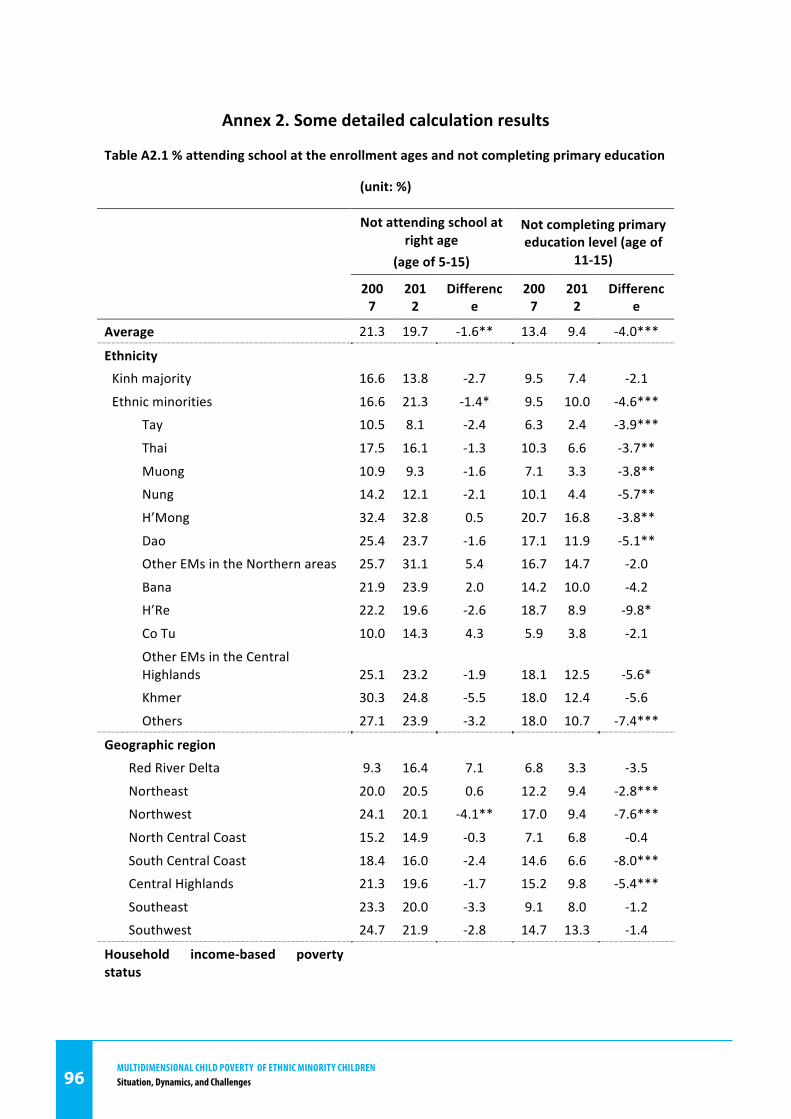
MultidiMensional Child Poverty of ethniC Minority Childrensituation, dynamics, and Challenges96
96
Annex 2. Some detailed calculation results
Table A2.1 % attending school at the enrollment ages and not completing primary education
(unit: %)
Not attending school at right age (age of 5-‐15)
Not completing primary education level (age of
11-‐15)
2007
2012
Difference
2007
2012
Difference
Average 21.3 19.7 -‐1.6** 13.4 9.4 -‐4.0***
Ethnicity Kinh majority 16.6 13.8 -‐2.7 9.5 7.4 -‐2.1
Ethnic minorities 16.6 21.3 -‐1.4* 9.5 10.0 -‐4.6***
Tay 10.5 8.1 -‐2.4 6.3 2.4 -‐3.9***
Thai 17.5 16.1 -‐1.3 10.3 6.6 -‐3.7**
Muong 10.9 9.3 -‐1.6 7.1 3.3 -‐3.8**
Nung 14.2 12.1 -‐2.1 10.1 4.4 -‐5.7**
H’Mong 32.4 32.8 0.5 20.7 16.8 -‐3.8**
Dao 25.4 23.7 -‐1.6 17.1 11.9 -‐5.1**
Other EMs in the Northern areas 25.7 31.1 5.4 16.7 14.7 -‐2.0
Bana 21.9 23.9 2.0 14.2 10.0 -‐4.2
H’Re 22.2 19.6 -‐2.6 18.7 8.9 -‐9.8*
Co Tu 10.0 14.3 4.3 5.9 3.8 -‐2.1
Other EMs in the Central Highlands 25.1 23.2 -‐1.9 18.1 12.5 -‐5.6*
Khmer 30.3 24.8 -‐5.5 18.0 12.4 -‐5.6
Others 27.1 23.9 -‐3.2 18.0 10.7 -‐7.4***
Geographic region
Red River Delta 9.3 16.4 7.1 6.8 3.3 -‐3.5
Northeast 20.0 20.5 0.6 12.2 9.4 -‐2.8***
Northwest 24.1 20.1 -‐4.1** 17.0 9.4 -‐7.6***
North Central Coast 15.2 14.9 -‐0.3 7.1 6.8 -‐0.4
South Central Coast 18.4 16.0 -‐2.4 14.6 6.6 -‐8.0***
Central Highlands 21.3 19.6 -‐1.7 15.2 9.8 -‐5.4***
Southeast 23.3 20.0 -‐3.3 9.1 8.0 -‐1.2
Southwest 24.7 21.9 -‐2.8 14.7 13.3 -‐1.4
Household income-‐based poverty status
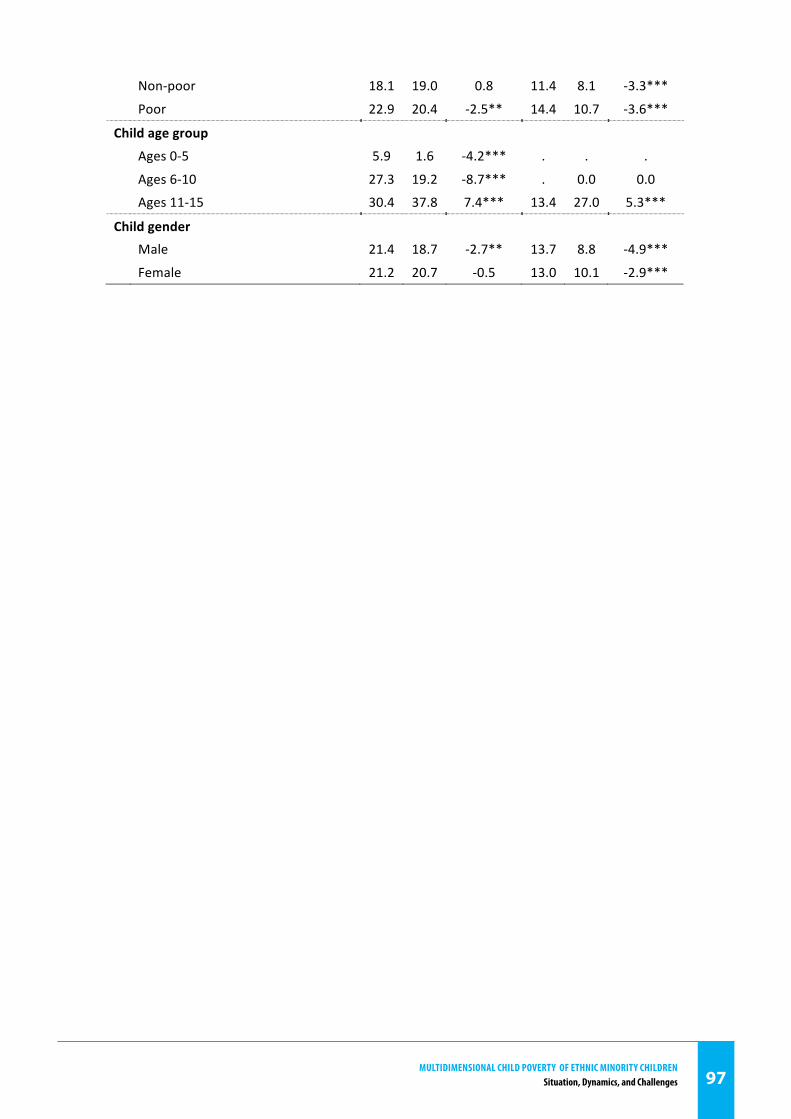
MultidiMensional Child Poverty of ethniC Minority Childrensituation, dynamics, and Challenges 97
97
Non-‐poor 18.1 19.0 0.8 11.4 8.1 -‐3.3***
Poor 22.9 20.4 -‐2.5** 14.4 10.7 -‐3.6***
Child age group
Ages 0-‐5 5.9 1.6 -‐4.2*** . . .
Ages 6-‐10 27.3 19.2 -‐8.7*** . 0.0 0.0
Ages 11-‐15 30.4 37.8 7.4*** 13.4 27.0 5.3***
Child gender
Male 21.4 18.7 -‐2.7** 13.7 8.8 -‐4.9***
Female 21.2 20.7 -‐0.5 13.0 10.1 -‐2.9***
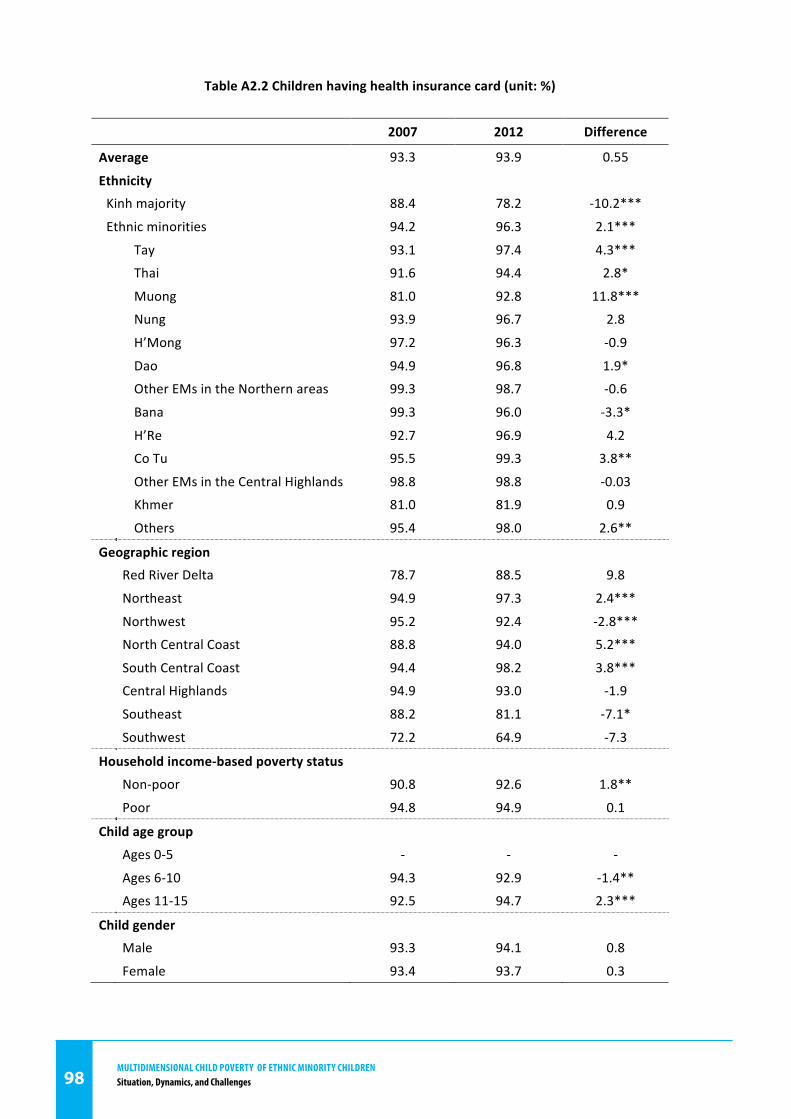
MultidiMensional Child Poverty of ethniC Minority Childrensituation, dynamics, and Challenges98
98
Table A2.2 Children having health insurance card (unit: %)
2007 2012 Difference
Average 93.3 93.9 0.55
Ethnicity Kinh majority 88.4 78.2 -‐10.2***
Ethnic minorities 94.2 96.3 2.1***
Tay 93.1 97.4 4.3***
Thai 91.6 94.4 2.8*
Muong 81.0 92.8 11.8***
Nung 93.9 96.7 2.8
H’Mong 97.2 96.3 -‐0.9
Dao 94.9 96.8 1.9*
Other EMs in the Northern areas 99.3 98.7 -‐0.6
Bana 99.3 96.0 -‐3.3*
H’Re 92.7 96.9 4.2
Co Tu 95.5 99.3 3.8**
Other EMs in the Central Highlands 98.8 98.8 -‐0.03
Khmer 81.0 81.9 0.9
Others 95.4 98.0 2.6**
Geographic region
Red River Delta 78.7 88.5 9.8
Northeast 94.9 97.3 2.4***
Northwest 95.2 92.4 -‐2.8***
North Central Coast 88.8 94.0 5.2***
South Central Coast 94.4 98.2 3.8***
Central Highlands 94.9 93.0 -‐1.9
Southeast 88.2 81.1 -‐7.1*
Southwest 72.2 64.9 -‐7.3
Household income-‐based poverty status
Non-‐poor 90.8 92.6 1.8**
Poor 94.8 94.9 0.1
Child age group
Ages 0-‐5 -‐ -‐ -‐
Ages 6-‐10 94.3 92.9 -‐1.4**
Ages 11-‐15 92.5 94.7 2.3***
Child gender
Male 93.3 94.1 0.8
Female 93.4 93.7 0.3
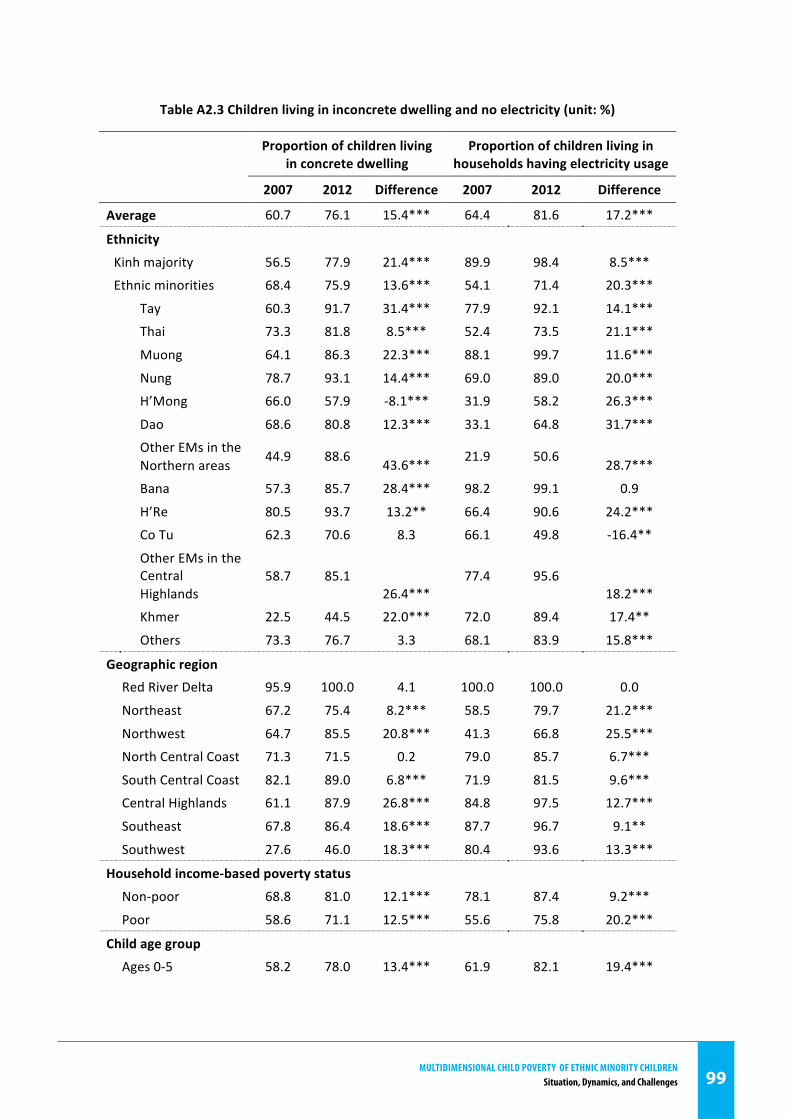
MultidiMensional Child Poverty of ethniC Minority Childrensituation, dynamics, and Challenges 99
99
Table A2.3 Children living in inconcrete dwelling and no electricity (unit: %)
Proportion of children living in concrete dwelling
Proportion of children living in households having electricity usage
2007 2012 Difference 2007 2012 Difference
Average 60.7 76.1 15.4*** 64.4 81.6 17.2***
Ethnicity
Kinh majority 56.5 77.9 21.4*** 89.9 98.4 8.5***
Ethnic minorities 68.4 75.9 13.6*** 54.1 71.4 20.3***
Tay 60.3 91.7 31.4*** 77.9 92.1 14.1***
Thai 73.3 81.8 8.5*** 52.4 73.5 21.1***
Muong 64.1 86.3 22.3*** 88.1 99.7 11.6***
Nung 78.7 93.1 14.4*** 69.0 89.0 20.0***
H’Mong 66.0 57.9 -‐8.1*** 31.9 58.2 26.3***
Dao 68.6 80.8 12.3*** 33.1 64.8 31.7***
Other EMs in the Northern areas
44.9 88.6 43.6*** 21.9 50.6 28.7***
Bana 57.3 85.7 28.4*** 98.2 99.1 0.9
H’Re 80.5 93.7 13.2** 66.4 90.6 24.2***
Co Tu 62.3 70.6 8.3 66.1 49.8 -‐16.4**
Other EMs in the Central Highlands
58.7 85.1 26.4***
77.4 95.6 18.2***
Khmer 22.5 44.5 22.0*** 72.0 89.4 17.4**
Others 73.3 76.7 3.3 68.1 83.9 15.8***
Geographic region
Red River Delta 95.9 100.0 4.1 100.0 100.0 0.0
Northeast 67.2 75.4 8.2*** 58.5 79.7 21.2***
Northwest 64.7 85.5 20.8*** 41.3 66.8 25.5***
North Central Coast 71.3 71.5 0.2 79.0 85.7 6.7***
South Central Coast 82.1 89.0 6.8*** 71.9 81.5 9.6***
Central Highlands 61.1 87.9 26.8*** 84.8 97.5 12.7***
Southeast 67.8 86.4 18.6*** 87.7 96.7 9.1**
Southwest 27.6 46.0 18.3*** 80.4 93.6 13.3***
Household income-‐based poverty status
Non-‐poor 68.8 81.0 12.1*** 78.1 87.4 9.2***
Poor 58.6 71.1 12.5*** 55.6 75.8 20.2***
Child age group
Ages 0-‐5 58.2 78.0 13.4*** 61.9 82.1 19.4***
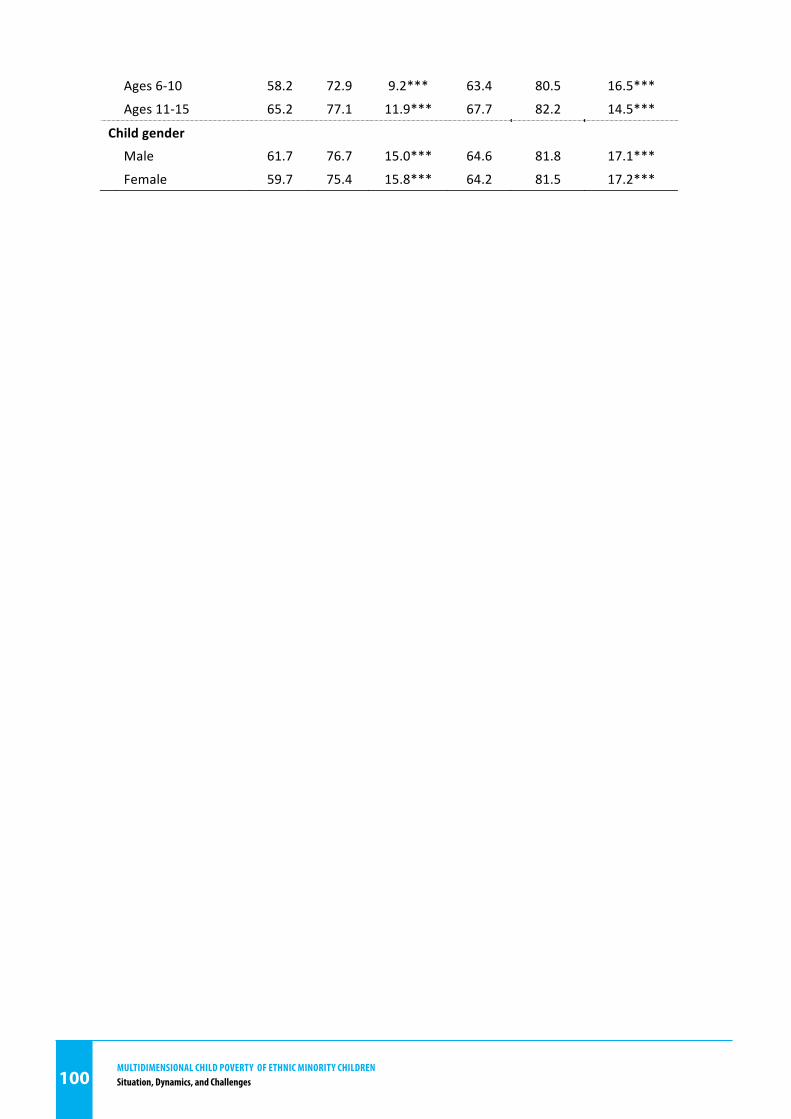
MultidiMensional Child Poverty of ethniC Minority Childrensituation, dynamics, and Challenges100
100
Ages 6-‐10 58.2 72.9 9.2*** 63.4 80.5 16.5***
Ages 11-‐15 65.2 77.1 11.9*** 67.7 82.2 14.5***
Child gender
Male 61.7 76.7 15.0*** 64.6 81.8 17.1***
Female 59.7 75.4 15.8*** 64.2 81.5 17.2***
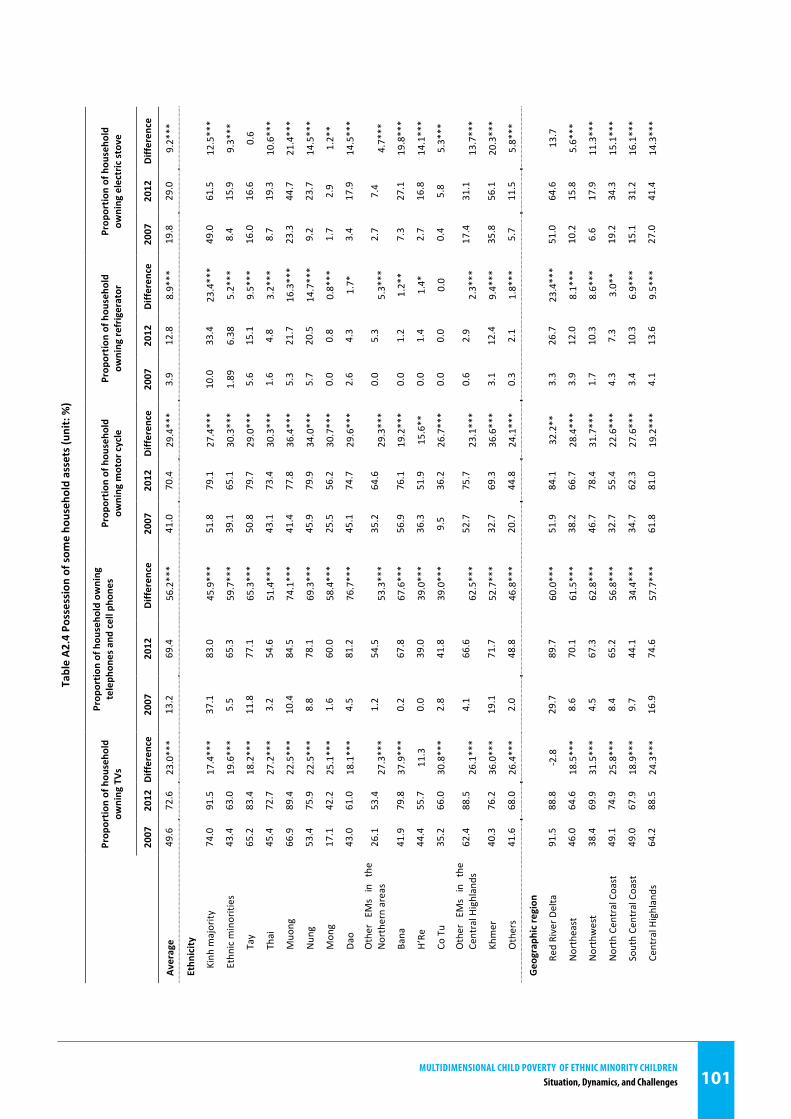
MultidiMensional Child Poverty of ethniC Minority Childrensituation, dynamics, and Challenges 101
101
Tabl
e A2
.4 P
osse
ssio
n of
som
e ho
useh
old
asse
ts (u
nit:
%)
Prop
ortio
n of
hou
seho
ld
owni
ng T
Vs
Prop
ortio
n of
hou
seho
ld o
wni
ng
tele
phon
es a
nd c
ell p
hone
s
Prop
ortio
n of
hou
seho
ld
owni
ng m
otor
cyc
le
Prop
ortio
n of
hou
seho
ld
owni
ng re
frig
erat
or
Prop
ortio
n of
hou
seho
ld
owni
ng e
lect
ric st
ove
2007
20
12
Diff
eren
ce
2007
20
12
Diff
eren
ce
2007
20
12
Diff
eren
ce
2007
20
12
Diff
eren
ce
2007
20
12
Diff
eren
ce
Aver
age
49.6
72
.6
23.0
***
13.2
69
.4
56.2
***
41.0
70
.4
29.4
***
3.9
12.8
8.
9***
19
.8
29.0
9.
2***
Ethn
icity
Kinh
maj
ority
74
.0
91.5
17
.4**
* 37
.1
83.0
45
.9**
* 51
.8
79.1
27
.4**
* 10
.0
33.4
23
.4**
* 49
.0
61.5
12
.5**
*
Ethn
ic m
inor
ities
43
.4
63.0
19
.6**
* 5.
5 65
.3
59.7
***
39.1
65
.1
30.3
***
1.89
6.
38
5.2*
**
8.4
15.9
9.
3***
Tay
65.2
83
.4
18.2
***
11.8
77
.1
65.3
***
50.8
79
.7
29.0
***
5.6
15.1
9.
5***
16
.0
16.6
0.
6
Thai
45
.4
72.7
27
.2**
* 3.
2 54
.6
51.4
***
43.1
73
.4
30.3
***
1.6
4.8
3.2*
**
8.7
19.3
10
.6**
*
Muo
ng
66.9
89
.4
22.5
***
10.4
84
.5
74.1
***
41.4
77
.8
36.4
***
5.3
21.7
16
.3**
* 23
.3
44.7
21
.4**
*
Nun
g 53
.4
75.9
22
.5**
* 8.
8 78
.1
69.3
***
45.9
79
.9
34.0
***
5.7
20.5
14
.7**
* 9.
2 23
.7
14.5
***
Mon
g 17
.1
42.2
25
.1**
* 1.
6 60
.0
58.4
***
25.5
56
.2
30.7
***
0.0
0.8
0.8*
**
1.7
2.9
1.2*
*
Dao
43.0
61
.0
18.1
***
4.5
81.2
76
.7**
* 45
.1
74.7
29
.6**
* 2.
6 4.
3 1.
7*
3.4
17.9
14
.5**
*
Oth
er EM
s in
th
e Nor
ther
n ar
eas
26.1
53
.4
27.3
***
1.2
54.5
53
.3**
* 35
.2
64.6
29
.3**
* 0.
0 5.
3 5.
3***
2.
7 7.
4 4.
7***
Bana
41
.9
79.8
37
.9**
* 0.
2 67
.8
67.6
***
56.9
76
.1
19.2
***
0.0
1.2
1.2*
* 7.
3 27
.1
19.8
***
H’Re
44
.4
55.7
11
.3
0.0
39.0
39
.0**
* 36
.3
51.9
15
.6**
0.
0 1.
4 1.
4*
2.7
16.8
14
.1**
*
Co T
u 35
.2
66.0
30
.8**
* 2.
8 41
.8
39.0
***
9.5
36.2
26
.7**
* 0.
0 0.
0 0.
0 0.
4 5.
8 5.
3***
Oth
er EM
s in
th
e Ce
ntra
l Hig
hlan
ds
62.4
88
.5
26.1
***
4.1
66.6
62
.5**
* 52
.7
75.7
23
.1**
* 0.
6 2.
9 2.
3***
17
.4
31.1
13
.7**
*
Khm
er
40.3
76
.2
36.0
***
19.1
71
.7
52.7
***
32.7
69
.3
36.6
***
3.1
12.4
9.
4***
35
.8
56.1
20
.3**
*
Oth
ers
41.6
68
.0
26.4
***
2.0
48.8
46
.8**
* 20
.7
44.8
24
.1**
* 0.
3 2.
1 1.
8***
5.
7 11
.5
5.8*
**
Geo
grap
hic
regi
on
Red
Rive
r Del
ta
91.5
88
.8
-‐2.8
29
.7
89.7
60
.0**
* 51
.9
84.1
32
.2**
3.
3 26
.7
23.4
***
51.0
64
.6
13.7
Nor
thea
st
46.0
64
.6
18.5
***
8.6
70.1
61
.5**
* 38
.2
66.7
28
.4**
* 3.
9 12
.0
8.1*
**
10.2
15
.8
5.6*
**
Nor
thw
est
38.4
69
.9
31.5
***
4.5
67.3
62
.8**
* 46
.7
78.4
31
.7**
* 1.
7 10
.3
8.6*
**
6.6
17.9
11
.3**
*
Nor
th C
entr
al C
oast
49
.1
74.9
25
.8**
* 8.
4 65
.2
56.8
***
32.7
55
.4
22.6
***
4.3
7.3
3.0*
* 19
.2
34.3
15
.1**
*
Sout
h Ce
ntra
l Coa
st
49.0
67
.9
18.9
***
9.7
44.1
34
.4**
* 34
.7
62.3
27
.6**
* 3.
4 10
.3
6.9*
**
15.1
31
.2
16.1
***
Cent
ral H
ighl
ands
64
.2
88.5
24
.3**
* 16
.9
74.6
57
.7**
* 61
.8
81.0
19
.2**
* 4.
1 13
.6
9.5*
**
27.0
41
.4
14.3
***
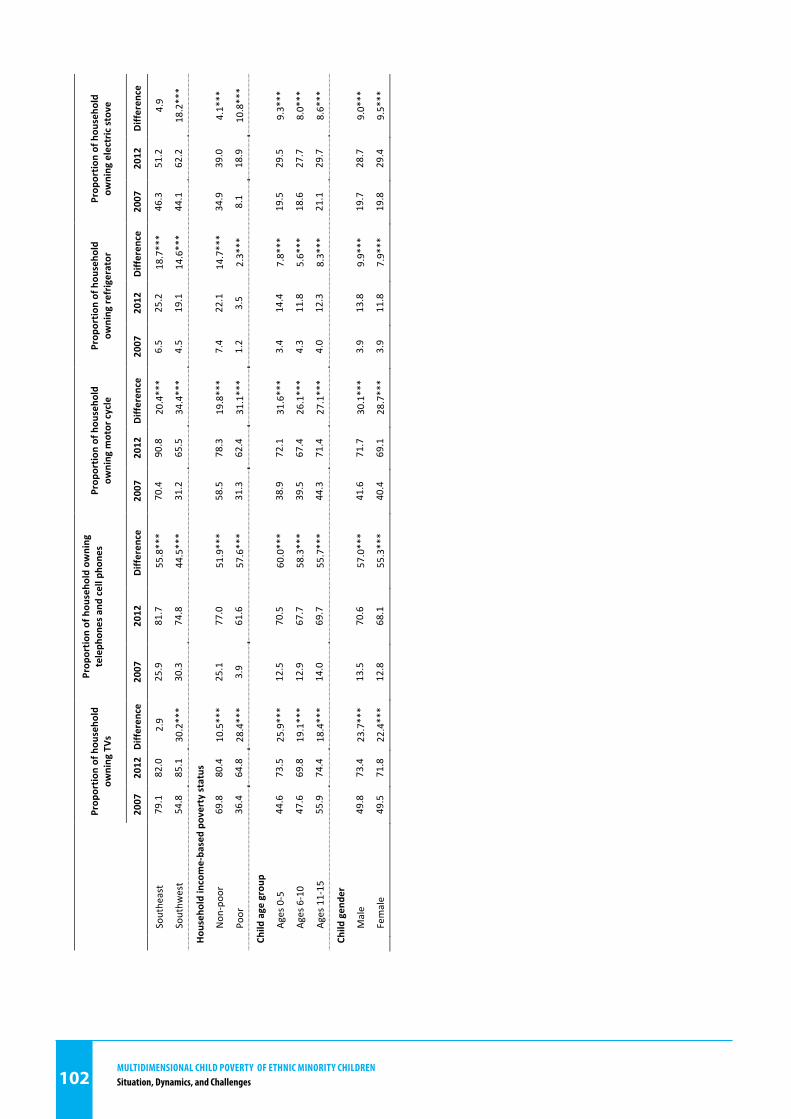
MultidiMensional Child Poverty of ethniC Minority Childrensituation, dynamics, and Challenges102
102
Prop
ortio
n of
hou
seho
ld
owni
ng T
Vs
Prop
ortio
n of
hou
seho
ld o
wni
ng
tele
phon
es a
nd c
ell p
hone
s
Prop
ortio
n of
hou
seho
ld
owni
ng m
otor
cyc
le
Prop
ortio
n of
hou
seho
ld
owni
ng re
frig
erat
or
Prop
ortio
n of
hou
seho
ld
owni
ng e
lect
ric st
ove
2007
20
12
Diff
eren
ce
2007
20
12
Diff
eren
ce
2007
20
12
Diff
eren
ce
2007
20
12
Diff
eren
ce
2007
20
12
Diff
eren
ce
Sout
heas
t 79
.1
82.0
2.
9 25
.9
81.7
55
.8**
* 70
.4
90.8
20
.4**
* 6.
5 25
.2
18.7
***
46.3
51
.2
4.9
Sout
hwes
t 54
.8
85.1
30
.2**
* 30
.3
74.8
44
.5**
* 31
.2
65.5
34
.4**
* 4.
5 19
.1
14.6
***
44.1
62
.2
18.2
***
Hou
seho
ld in
com
e-‐ba
sed
pove
rty
stat
us
Non
-‐poo
r 69
.8
80.4
10
.5**
* 25
.1
77.0
51
.9**
* 58
.5
78.3
19
.8**
* 7.
4 22
.1
14.7
***
34.9
39
.0
4.1*
**
Poor
36
.4
64.8
28
.4**
* 3.
9 61
.6
57.6
***
31.3
62
.4
31.1
***
1.2
3.5
2.3*
**
8.1
18.9
10
.8**
*
Child
age
gro
up
Ages
0-‐5
44
.6
73.5
25
.9**
* 12
.5
70.5
60
.0**
* 38
.9
72.1
31
.6**
* 3.
4 14
.4
7.8*
**
19.5
29
.5
9.3*
**
Ages
6-‐1
0 47
.6
69.8
19
.1**
* 12
.9
67.7
58
.3**
* 39
.5
67.4
26
.1**
* 4.
3 11
.8
5.6*
**
18.6
27
.7
8.0*
**
Ages
11-‐
15
55.9
74
.4
18.4
***
14.0
69
.7
55.7
***
44.3
71
.4
27.1
***
4.0
12.3
8.
3***
21
.1
29.7
8.
6***
Child
gen
der
Mal
e 49
.8
73.4
23
.7**
* 13
.5
70.6
57
.0**
* 41
.6
71.7
30
.1**
* 3.
9 13
.8
9.9*
**
19.7
28
.7
9.0*
**
Fem
ale
49.5
71
.8
22.4
***
12.8
68
.1
55.3
***
40.4
69
.1
28.7
***
3.9
11.8
7.
9***
19
.8
29.4
9.
5***
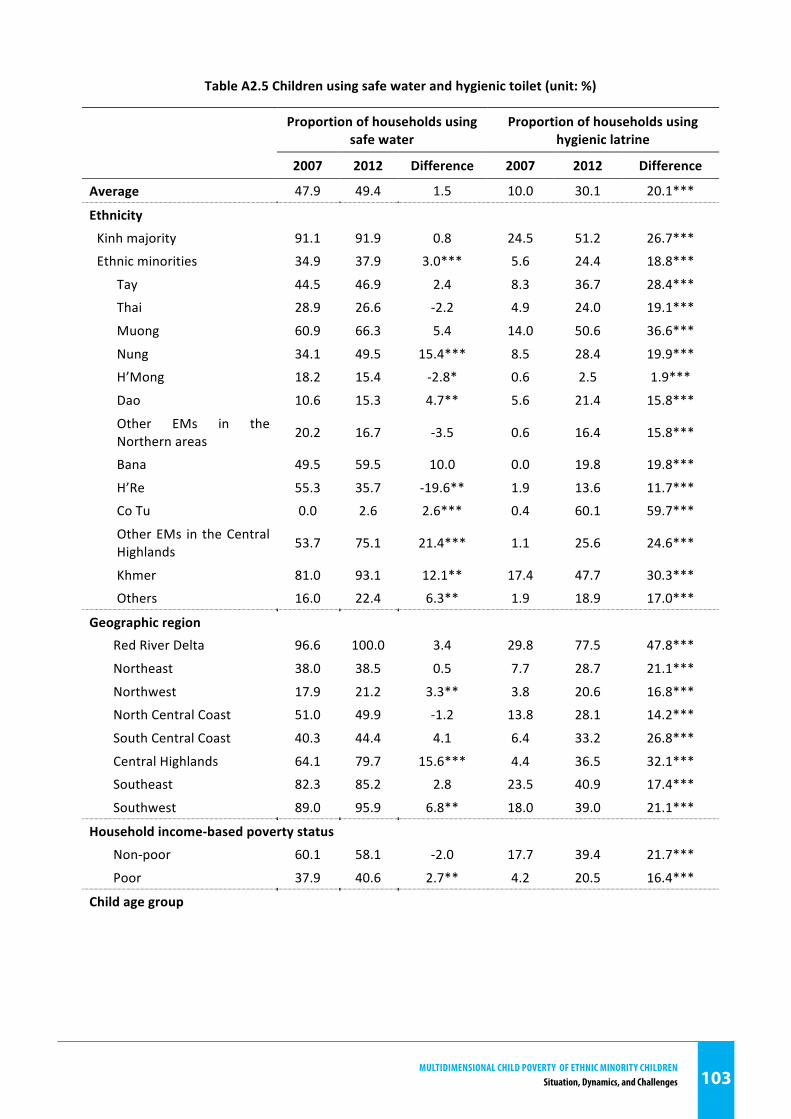
MultidiMensional Child Poverty of ethniC Minority Childrensituation, dynamics, and Challenges 103
103
Table A2.5 Children using safe water and hygienic toilet (unit: %)
Proportion of households using safe water
Proportion of households using hygienic latrine
2007 2012 Difference 2007 2012 Difference
Average 47.9 49.4 1.5 10.0 30.1 20.1***
Ethnicity
Kinh majority 91.1 91.9 0.8 24.5 51.2 26.7***
Ethnic minorities 34.9 37.9 3.0*** 5.6 24.4 18.8***
Tay 44.5 46.9 2.4 8.3 36.7 28.4***
Thai 28.9 26.6 -‐2.2 4.9 24.0 19.1***
Muong 60.9 66.3 5.4 14.0 50.6 36.6***
Nung 34.1 49.5 15.4*** 8.5 28.4 19.9***
H’Mong 18.2 15.4 -‐2.8* 0.6 2.5 1.9***
Dao 10.6 15.3 4.7** 5.6 21.4 15.8***
Other EMs in the Northern areas 20.2 16.7 -‐3.5 0.6 16.4 15.8***
Bana 49.5 59.5 10.0 0.0 19.8 19.8***
H’Re 55.3 35.7 -‐19.6** 1.9 13.6 11.7***
Co Tu 0.0 2.6 2.6*** 0.4 60.1 59.7***
Other EMs in the Central Highlands 53.7 75.1 21.4*** 1.1 25.6 24.6***
Khmer 81.0 93.1 12.1** 17.4 47.7 30.3***
Others 16.0 22.4 6.3** 1.9 18.9 17.0***
Geographic region
Red River Delta 96.6 100.0 3.4 29.8 77.5 47.8***
Northeast 38.0 38.5 0.5 7.7 28.7 21.1***
Northwest 17.9 21.2 3.3** 3.8 20.6 16.8***
North Central Coast 51.0 49.9 -‐1.2 13.8 28.1 14.2***
South Central Coast 40.3 44.4 4.1 6.4 33.2 26.8***
Central Highlands 64.1 79.7 15.6*** 4.4 36.5 32.1***
Southeast 82.3 85.2 2.8 23.5 40.9 17.4***
Southwest 89.0 95.9 6.8** 18.0 39.0 21.1***
Household income-‐based poverty status
Non-‐poor 60.1 58.1 -‐2.0 17.7 39.4 21.7***
Poor 37.9 40.6 2.7** 4.2 20.5 16.4***
Child age group
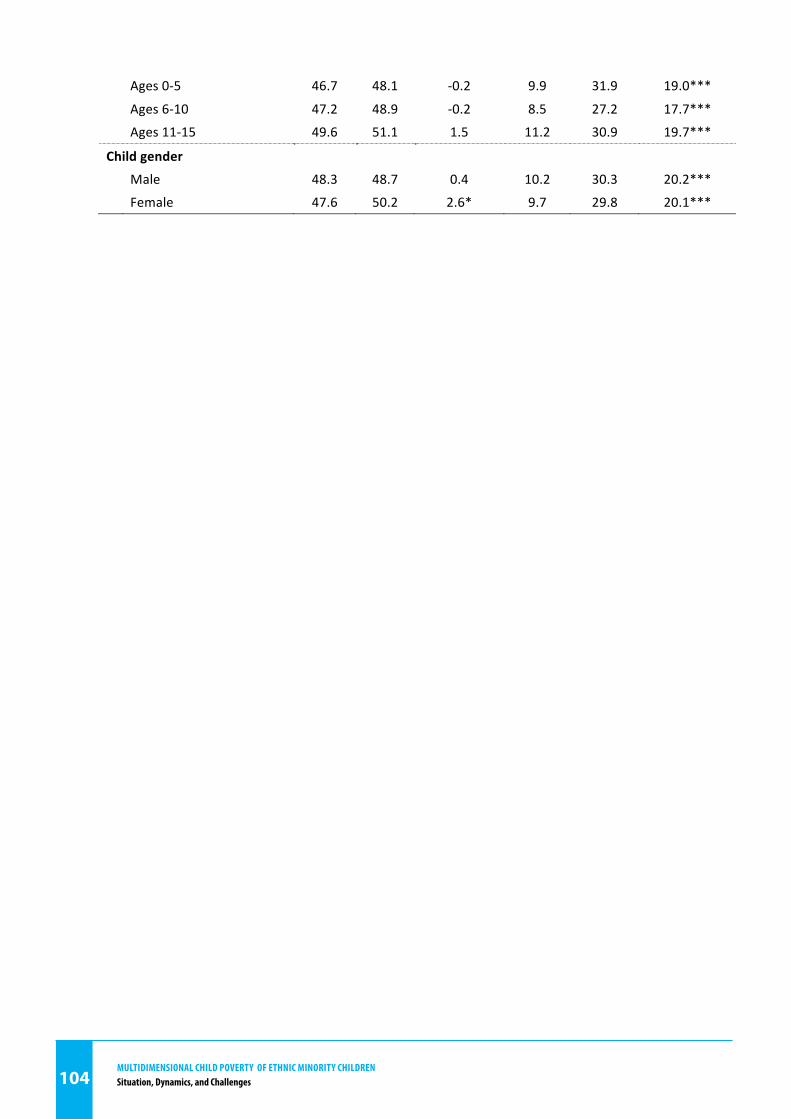
MultidiMensional Child Poverty of ethniC Minority Childrensituation, dynamics, and Challenges104
104
Ages 0-‐5 46.7 48.1 -‐0.2 9.9 31.9 19.0***
Ages 6-‐10 47.2 48.9 -‐0.2 8.5 27.2 17.7***
Ages 11-‐15 49.6 51.1 1.5 11.2 30.9 19.7***
Child gender
Male 48.3 48.7 0.4 10.2 30.3 20.2***
Female 47.6 50.2 2.6* 9.7 29.8 20.1***
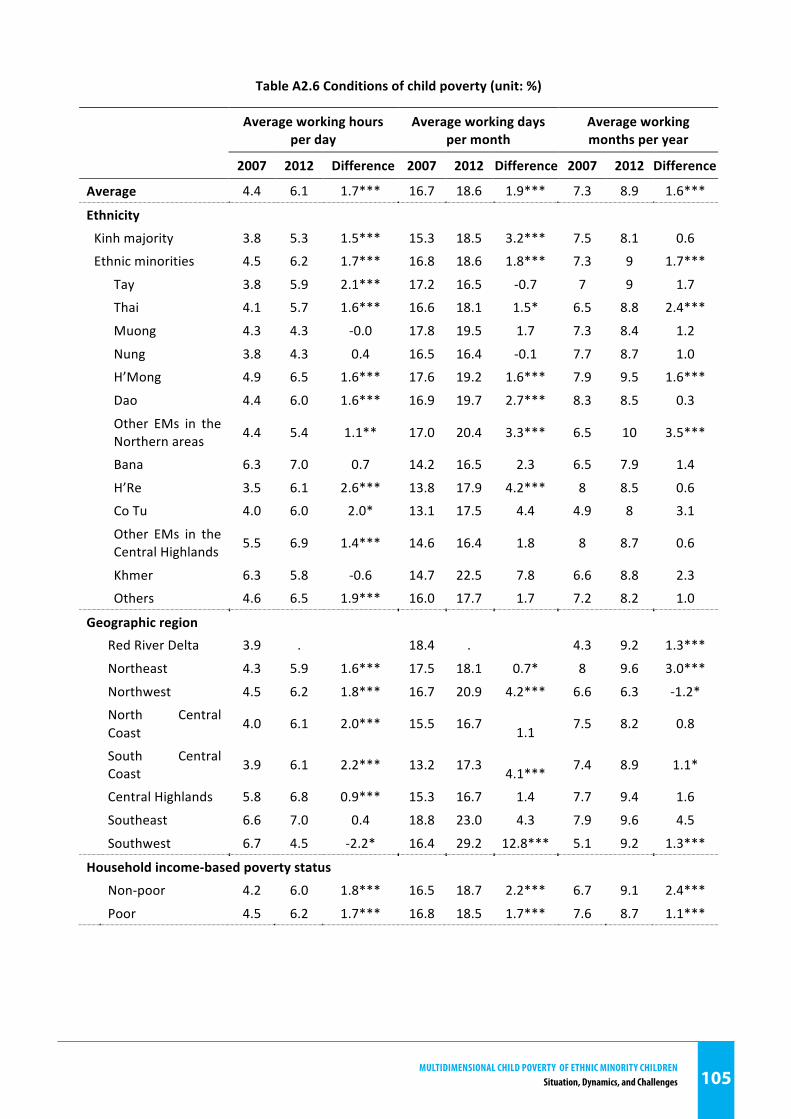
MultidiMensional Child Poverty of ethniC Minority Childrensituation, dynamics, and Challenges 105
105
Table A2.6 Conditions of child poverty (unit: %)
Average working hours per day
Average working days per month
Average working months per year
2007 2012 Difference 2007 2012 Difference 2007 2012 Difference
Average 4.4 6.1 1.7*** 16.7 18.6 1.9*** 7.3 8.9 1.6***
Ethnicity
Kinh majority 3.8 5.3 1.5*** 15.3 18.5 3.2*** 7.5 8.1 0.6
Ethnic minorities 4.5 6.2 1.7*** 16.8 18.6 1.8*** 7.3 9 1.7***
Tay 3.8 5.9 2.1*** 17.2 16.5 -‐0.7 7 9 1.7
Thai 4.1 5.7 1.6*** 16.6 18.1 1.5* 6.5 8.8 2.4***
Muong 4.3 4.3 -‐0.0 17.8 19.5 1.7 7.3 8.4 1.2
Nung 3.8 4.3 0.4 16.5 16.4 -‐0.1 7.7 8.7 1.0
H’Mong 4.9 6.5 1.6*** 17.6 19.2 1.6*** 7.9 9.5 1.6***
Dao 4.4 6.0 1.6*** 16.9 19.7 2.7*** 8.3 8.5 0.3
Other EMs in the Northern areas 4.4 5.4 1.1** 17.0 20.4 3.3*** 6.5 10 3.5***
Bana 6.3 7.0 0.7 14.2 16.5 2.3 6.5 7.9 1.4
H’Re 3.5 6.1 2.6*** 13.8 17.9 4.2*** 8 8.5 0.6
Co Tu 4.0 6.0 2.0* 13.1 17.5 4.4 4.9 8 3.1
Other EMs in the Central Highlands 5.5 6.9 1.4*** 14.6 16.4 1.8 8 8.7 0.6
Khmer 6.3 5.8 -‐0.6 14.7 22.5 7.8 6.6 8.8 2.3
Others 4.6 6.5 1.9*** 16.0 17.7 1.7 7.2 8.2 1.0
Geographic region
Red River Delta 3.9 .
18.4 .
4.3 9.2 1.3***
Northeast 4.3 5.9 1.6*** 17.5 18.1 0.7* 8 9.6 3.0***
Northwest 4.5 6.2 1.8*** 16.7 20.9 4.2*** 6.6 6.3 -‐1.2*
North Central Coast
4.0 6.1 2.0*** 15.5 16.7 1.1 7.5 8.2 0.8
South Central Coast 3.9 6.1 2.2*** 13.2 17.3 4.1*** 7.4 8.9 1.1*
Central Highlands 5.8 6.8 0.9*** 15.3 16.7 1.4 7.7 9.4 1.6
Southeast 6.6 7.0 0.4 18.8 23.0 4.3 7.9 9.6 4.5
Southwest 6.7 4.5 -‐2.2* 16.4 29.2 12.8*** 5.1 9.2 1.3***
Household income-‐based poverty status
Non-‐poor 4.2 6.0 1.8*** 16.5 18.7 2.2*** 6.7 9.1 2.4***
Poor 4.5 6.2 1.7*** 16.8 18.5 1.7*** 7.6 8.7 1.1***
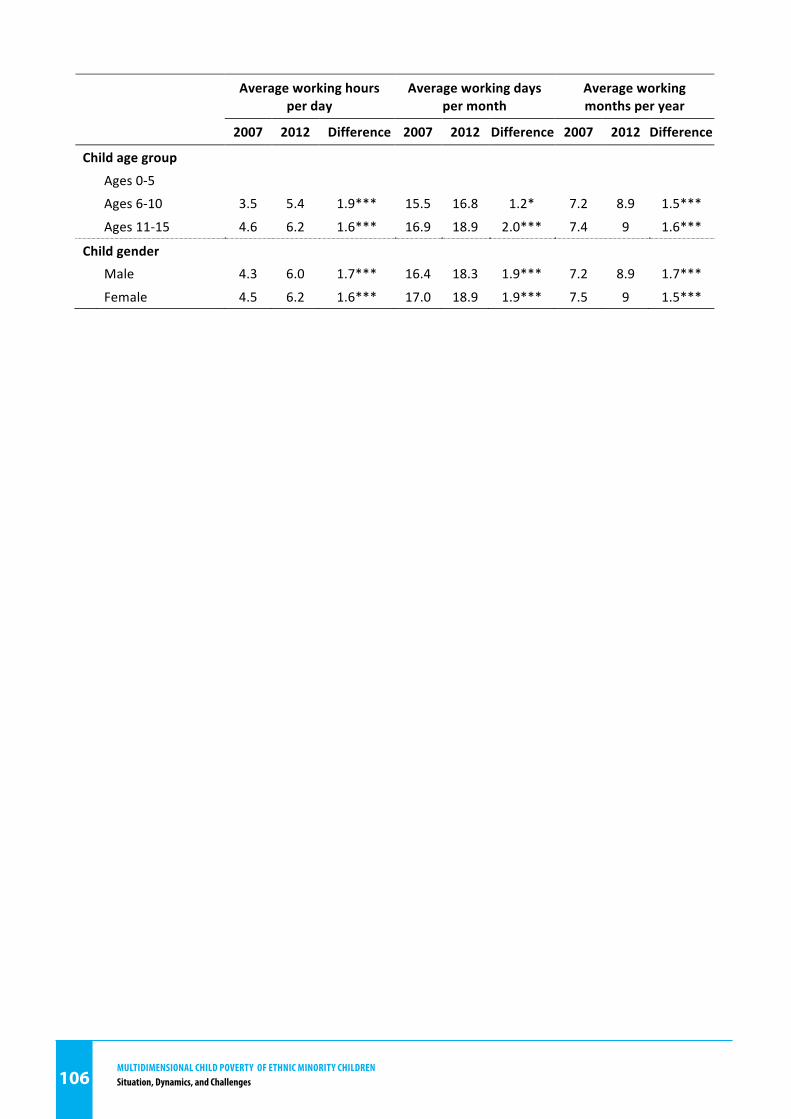
MultidiMensional Child Poverty of ethniC Minority Childrensituation, dynamics, and Challenges106
106
Average working hours per day
Average working days per month
Average working months per year
2007 2012 Difference 2007 2012 Difference 2007 2012 Difference
Child age group
Ages 0-‐5
Ages 6-‐10 3.5 5.4 1.9*** 15.5 16.8 1.2* 7.2 8.9 1.5***
Ages 11-‐15 4.6 6.2 1.6*** 16.9 18.9 2.0*** 7.4 9 1.6***
Child gender
Male 4.3 6.0 1.7*** 16.4 18.3 1.9*** 7.2 8.9 1.7***
Female 4.5 6.2 1.6*** 17.0 18.9 1.9*** 7.5 9 1.5***
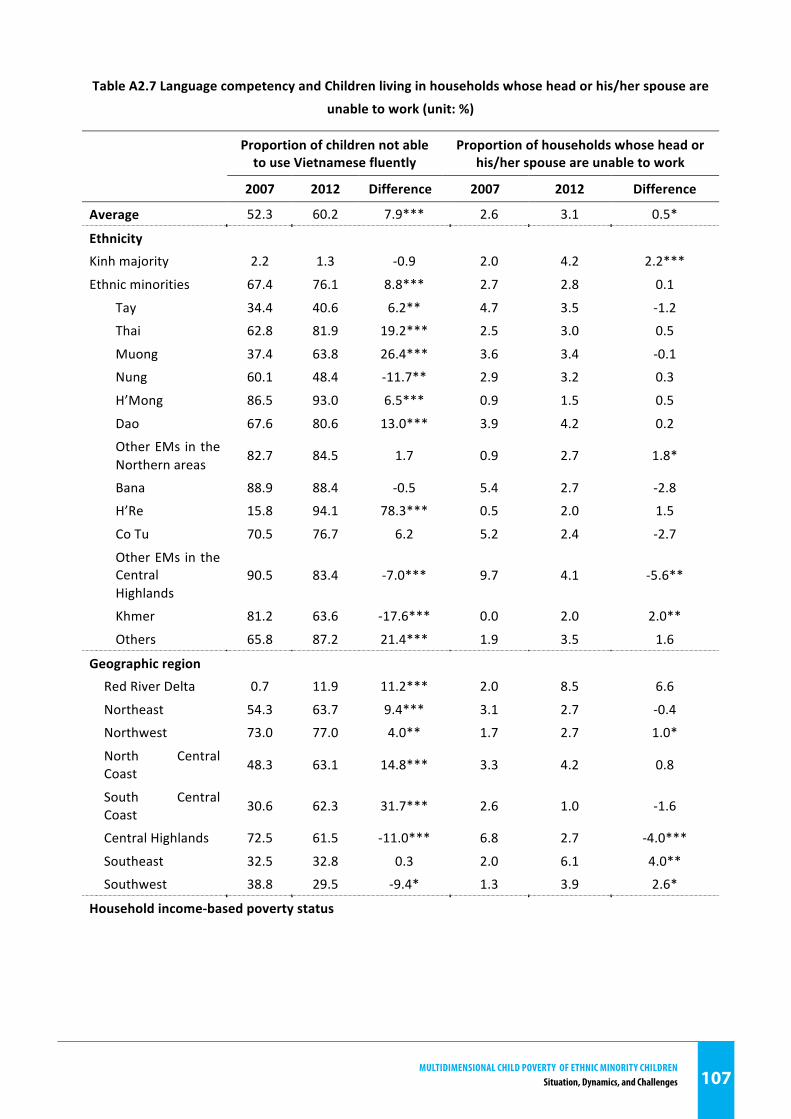
MultidiMensional Child Poverty of ethniC Minority Childrensituation, dynamics, and Challenges 107
107
Table A2.7 Language competency and Children living in households whose head or his/her spouse are
unable to work (unit: %)
Proportion of children not able to use Vietnamese fluently
Proportion of households whose head or his/her spouse are unable to work
2007 2012 Difference 2007 2012 Difference
Average 52.3 60.2 7.9*** 2.6 3.1 0.5*
Ethnicity Kinh majority 2.2 1.3 -‐0.9 2.0 4.2 2.2***
Ethnic minorities 67.4 76.1 8.8*** 2.7 2.8 0.1
Tay 34.4 40.6 6.2** 4.7 3.5 -‐1.2
Thai 62.8 81.9 19.2*** 2.5 3.0 0.5
Muong 37.4 63.8 26.4*** 3.6 3.4 -‐0.1
Nung 60.1 48.4 -‐11.7** 2.9 3.2 0.3
H’Mong 86.5 93.0 6.5*** 0.9 1.5 0.5
Dao 67.6 80.6 13.0*** 3.9 4.2 0.2
Other EMs in the Northern areas
82.7 84.5 1.7 0.9 2.7 1.8*
Bana 88.9 88.4 -‐0.5 5.4 2.7 -‐2.8
H’Re 15.8 94.1 78.3*** 0.5 2.0 1.5
Co Tu 70.5 76.7 6.2 5.2 2.4 -‐2.7
Other EMs in the Central Highlands
90.5 83.4 -‐7.0*** 9.7 4.1 -‐5.6**
Khmer 81.2 63.6 -‐17.6*** 0.0 2.0 2.0**
Others 65.8 87.2 21.4*** 1.9 3.5 1.6
Geographic region
Red River Delta 0.7 11.9 11.2*** 2.0 8.5 6.6
Northeast 54.3 63.7 9.4*** 3.1 2.7 -‐0.4
Northwest 73.0 77.0 4.0** 1.7 2.7 1.0*
North Central Coast 48.3 63.1 14.8*** 3.3 4.2 0.8
South Central Coast 30.6 62.3 31.7*** 2.6 1.0 -‐1.6
Central Highlands 72.5 61.5 -‐11.0*** 6.8 2.7 -‐4.0***
Southeast 32.5 32.8 0.3 2.0 6.1 4.0**
Southwest 38.8 29.5 -‐9.4* 1.3 3.9 2.6*
Household income-‐based poverty status
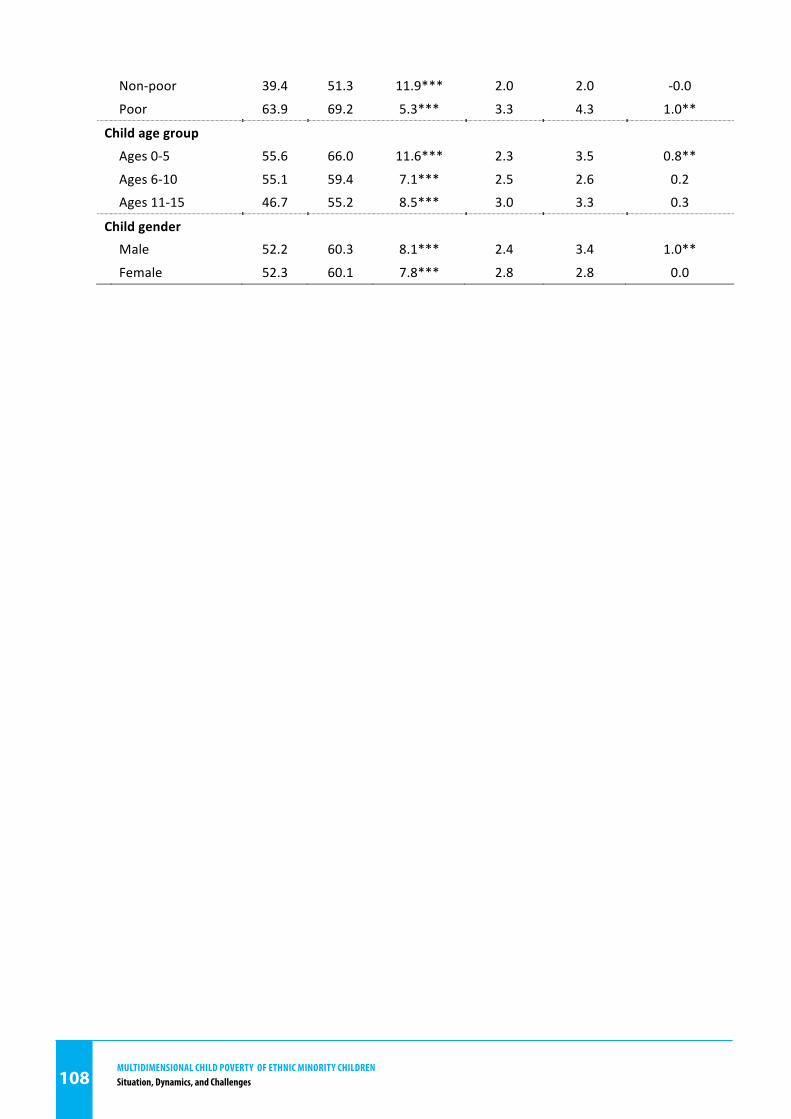
MultidiMensional Child Poverty of ethniC Minority Childrensituation, dynamics, and Challenges108
108
Non-‐poor 39.4 51.3 11.9*** 2.0 2.0 -‐0.0
Poor 63.9 69.2 5.3*** 3.3 4.3 1.0**
Child age group
Ages 0-‐5 55.6 66.0 11.6*** 2.3 3.5 0.8**
Ages 6-‐10 55.1 59.4 7.1*** 2.5 2.6 0.2
Ages 11-‐15 46.7 55.2 8.5*** 3.0 3.3 0.3
Child gender
Male 52.2 60.3 8.1*** 2.4 3.4 1.0**
Female 52.3 60.1 7.8*** 2.8 2.8 0.0
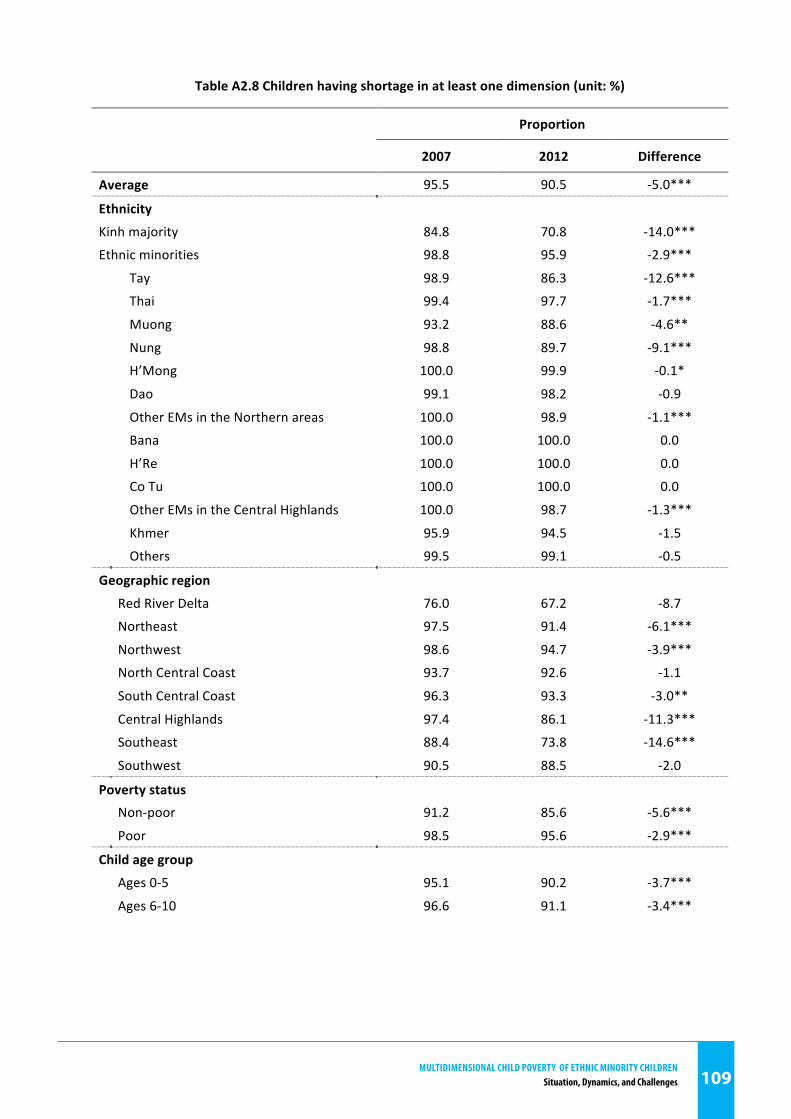
MultidiMensional Child Poverty of ethniC Minority Childrensituation, dynamics, and Challenges 109
109
Table A2.8 Children having shortage in at least one dimension (unit: %)
Proportion
2007 2012 Difference
Average 95.5 90.5 -‐5.0***
Ethnicity
Kinh majority 84.8 70.8 -‐14.0***
Ethnic minorities 98.8 95.9 -‐2.9***
Tay 98.9 86.3 -‐12.6***
Thai 99.4 97.7 -‐1.7***
Muong 93.2 88.6 -‐4.6**
Nung 98.8 89.7 -‐9.1***
H’Mong 100.0 99.9 -‐0.1*
Dao 99.1 98.2 -‐0.9
Other EMs in the Northern areas 100.0 98.9 -‐1.1***
Bana 100.0 100.0 0.0
H’Re 100.0 100.0 0.0
Co Tu 100.0 100.0 0.0
Other EMs in the Central Highlands 100.0 98.7 -‐1.3***
Khmer 95.9 94.5 -‐1.5
Others 99.5 99.1 -‐0.5
Geographic region
Red River Delta 76.0 67.2 -‐8.7
Northeast 97.5 91.4 -‐6.1***
Northwest 98.6 94.7 -‐3.9***
North Central Coast 93.7 92.6 -‐1.1
South Central Coast 96.3 93.3 -‐3.0**
Central Highlands 97.4 86.1 -‐11.3***
Southeast 88.4 73.8 -‐14.6***
Southwest 90.5 88.5 -‐2.0
Poverty status Non-‐poor 91.2 85.6 -‐5.6***
Poor 98.5 95.6 -‐2.9***
Child age group
Ages 0-‐5 95.1 90.2 -‐3.7***
Ages 6-‐10 96.6 91.1 -‐3.4***
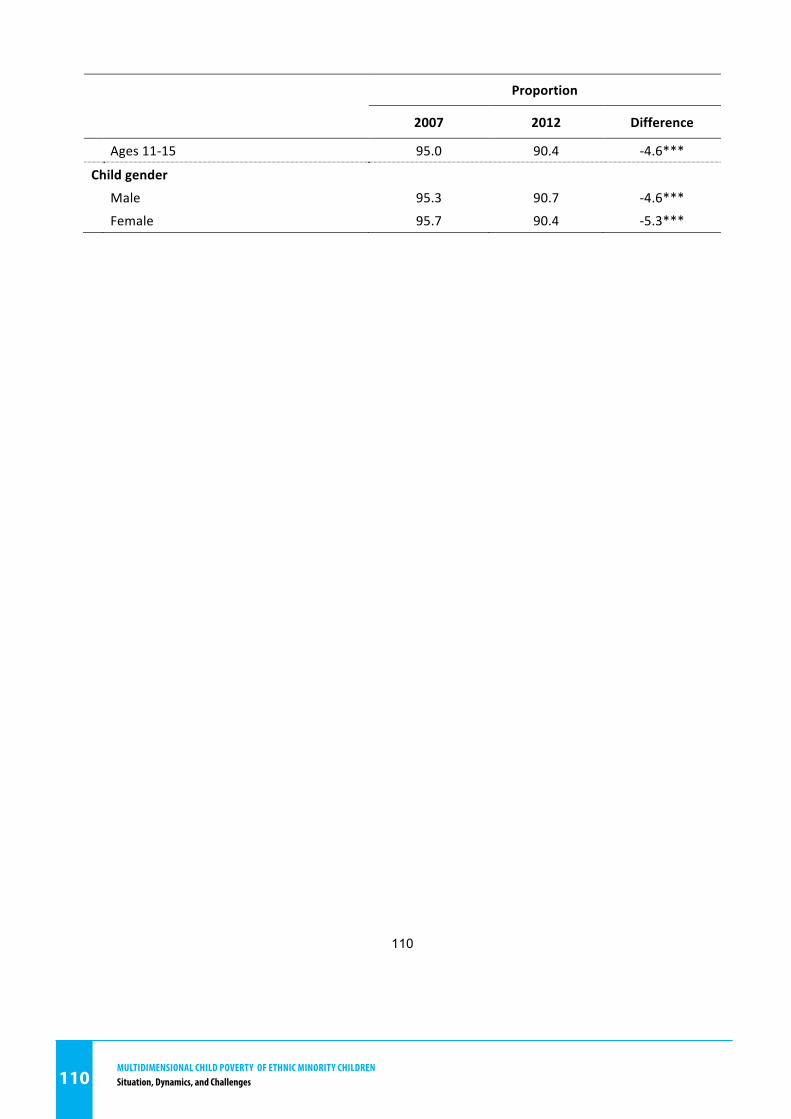
MultidiMensional Child Poverty of ethniC Minority Childrensituation, dynamics, and Challenges110
110
Proportion
2007 2012 Difference
Ages 11-‐15 95.0 90.4 -‐4.6***
Child gender
Male 95.3 90.7 -‐4.6***
Female 95.7 90.4 -‐5.3***
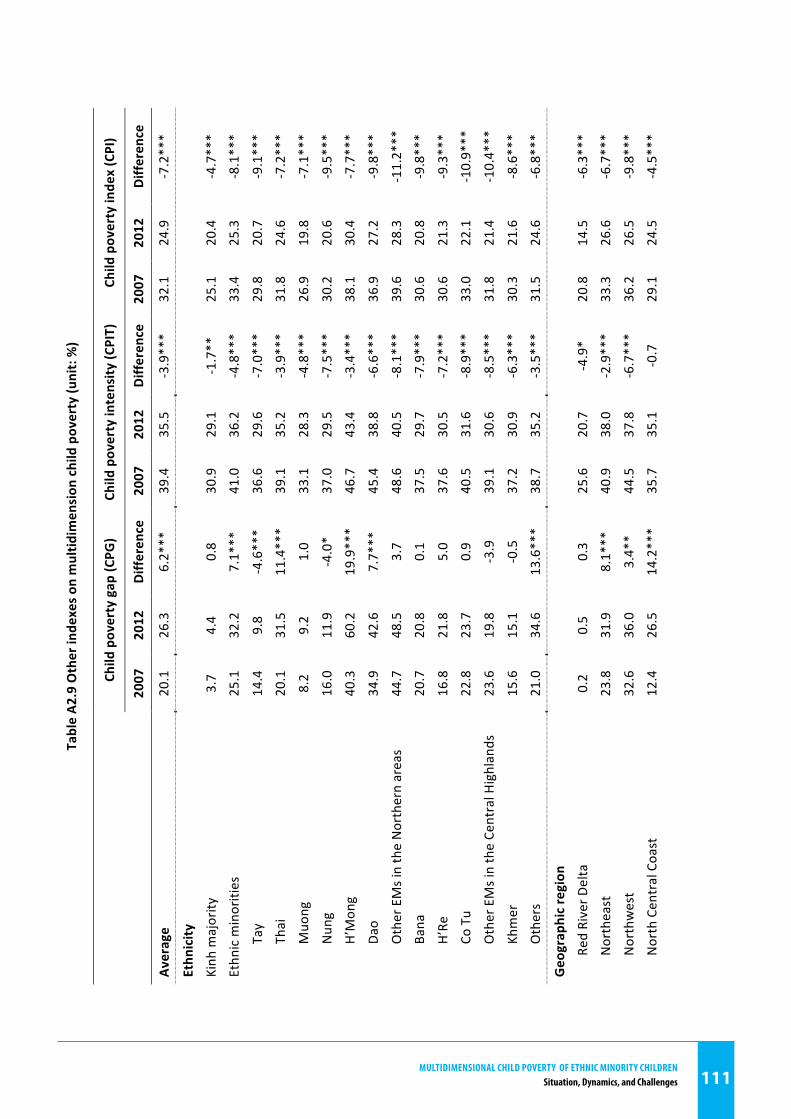
MultidiMensional Child Poverty of ethniC Minority Childrensituation, dynamics, and Challenges 111
111
Table A2
.9 Other indexes on
multid
imension
child poverty (u
nit: %)
Child poverty gap (C
PG)
Child poverty intensity
(CPIT)
Child poverty index (CPI)
2007
2012
Difference
2007
2012
Difference
2007
2012
Difference
Average
20.1
26.3
6.2***
39.4
35.5
-‐3.9***
32.1
24.9
-‐7.2***
Ethn
icity
Kinh
majority
3.7
4.4
0.8
30.9
29.1
-‐1.7**
25.1
20.4
-‐4.7***
Ethn
ic minorities
25.1
32.2
7.1***
41.0
36.2
-‐4.8***
33.4
25.3
-‐8.1***
Tay
14.4
9.8
-‐4.6***
36.6
29.6
-‐7.0***
29.8
20.7
-‐9.1***
Thai
20.1
31.5
11.4***
39.1
35.2
-‐3.9***
31.8
24.6
-‐7.2***
Muo
ng
8.2
9.2
1.0
33.1
28.3
-‐4.8***
26.9
19.8
-‐7.1***
Nun
g 16.0
11.9
-‐4.0*
37.0
29.5
-‐7.5***
30.2
20.6
-‐9.5***
H’M
ong
40.3
60.2
19.9***
46.7
43.4
-‐3.4***
38.1
30.4
-‐7.7***
Da
o 34.9
42.6
7.7***
45.4
38.8
-‐6.6***
36.9
27.2
-‐9.8***
Other EMs in the Northern areas
44.7
48.5
3.7
48.6
40.5
-‐8.1***
39.6
28.3
-‐11.2***
Bana
20.7
20.8
0.1
37.5
29.7
-‐7.9***
30.6
20.8
-‐9.8***
H’Re
16.8
21.8
5.0
37.6
30.5
-‐7.2***
30.6
21.3
-‐9.3***
Co
Tu
22.8
23.7
0.9
40.5
31.6
-‐8.9***
33.0
22.1
-‐10.9***
Other EMs in the Central H
ighlands
23.6
19.8
-‐3.9
39.1
30.6
-‐8.5***
31.8
21.4
-‐10.4***
Kh
mer
15.6
15.1
-‐0.5
37.2
30.9
-‐6.3***
30.3
21.6
-‐8.6***
Others
21.0
34.6
13.6***
38.7
35.2
-‐3.5***
31.5
24.6
-‐6.8***
Geographic region
Red River D
elta
0.2
0.5
0.3
25.6
20.7
-‐4.9*
20.8
14.5
-‐6.3***
Northeast
23.8
31.9
8.1***
40.9
38.0
-‐2.9***
33.3
26.6
-‐6.7***
Northwest
32.6
36.0
3.4**
44.5
37.8
-‐6.7***
36.2
26.5
-‐9.8***
North Central Coast
12.4
26.5
14.2***
35.7
35.1
-‐0.7
29.1
24.5
-‐4.5***
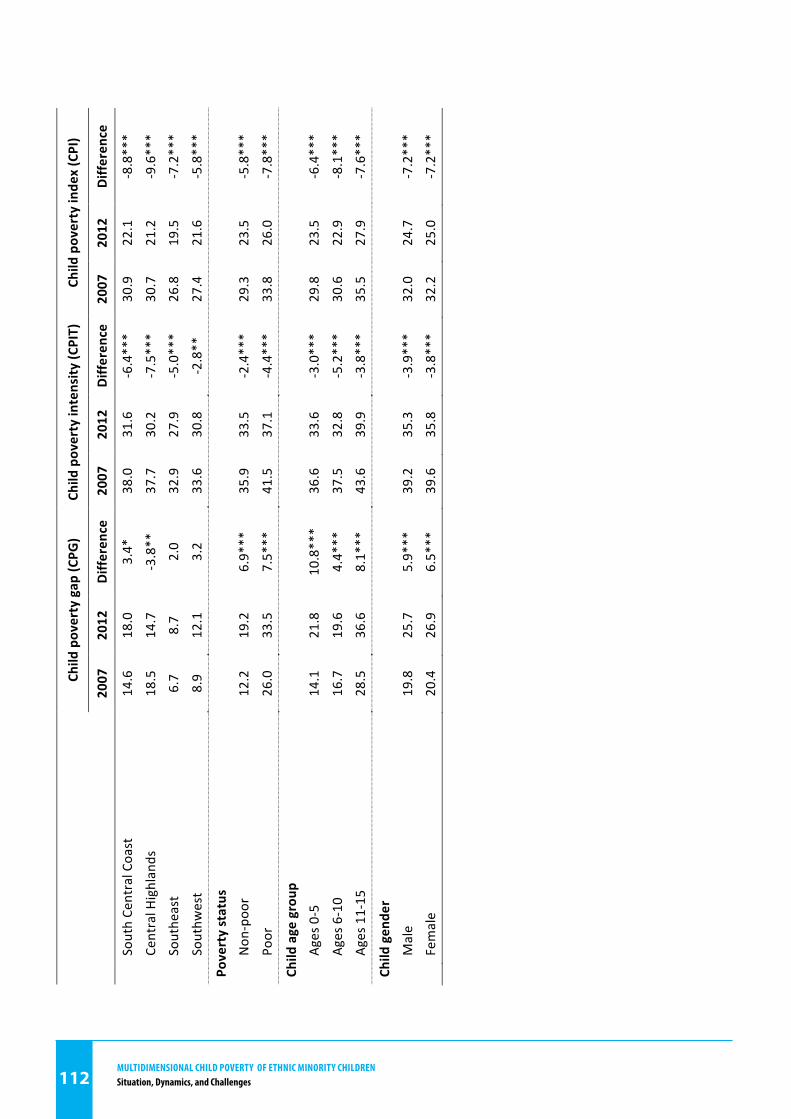
MultidiMensional Child Poverty of ethniC Minority Childrensituation, dynamics, and Challenges112
112
Child poverty gap (C
PG)
Child poverty intensity
(CPIT)
Child poverty index (CPI)
2007
2012
Difference
2007
2012
Difference
2007
2012
Difference
South Central Coast
14.6
18.0
3.4*
38.0
31.6
-‐6.4***
30.9
22.1
-‐8.8***
Central H
ighlands
18.5
14.7
-‐3.8**
37.7
30.2
-‐7.5***
30.7
21.2
-‐9.6***
Southeast
6.7
8.7
2.0
32.9
27.9
-‐5.0***
26.8
19.5
-‐7.2***
Southw
est
8.9
12.1
3.2
33.6
30.8
-‐2.8**
27.4
21.6
-‐5.8***
Poverty status
Non
-‐poo
r 12.2
19.2
6.9***
35.9
33.5
-‐2.4***
29.3
23.5
-‐5.8***
Po
or
26.0
33.5
7.5***
41.5
37.1
-‐4.4***
33.8
26.0
-‐7.8***
Child age group
Ag
es 0-‐5
14.1
21.8
10.8***
36.6
33.6
-‐3.0***
29.8
23.5
-‐6.4***
Ag
es 6-‐10
16.7
19.6
4.4***
37.5
32.8
-‐5.2***
30.6
22.9
-‐8.1***
Ag
es 11-‐15
28.5
36.6
8.1***
43.6
39.9
-‐3.8***
35.5
27.9
-‐7.6***
Child gender
Male
19.8
25.7
5.9***
39.2
35.3
-‐3.9***
32.0
24.7
-‐7.2***
Female
20.4
26.9
6.5***
39.6
35.8
-‐3.8***
32.2
25.0
-‐7.2***
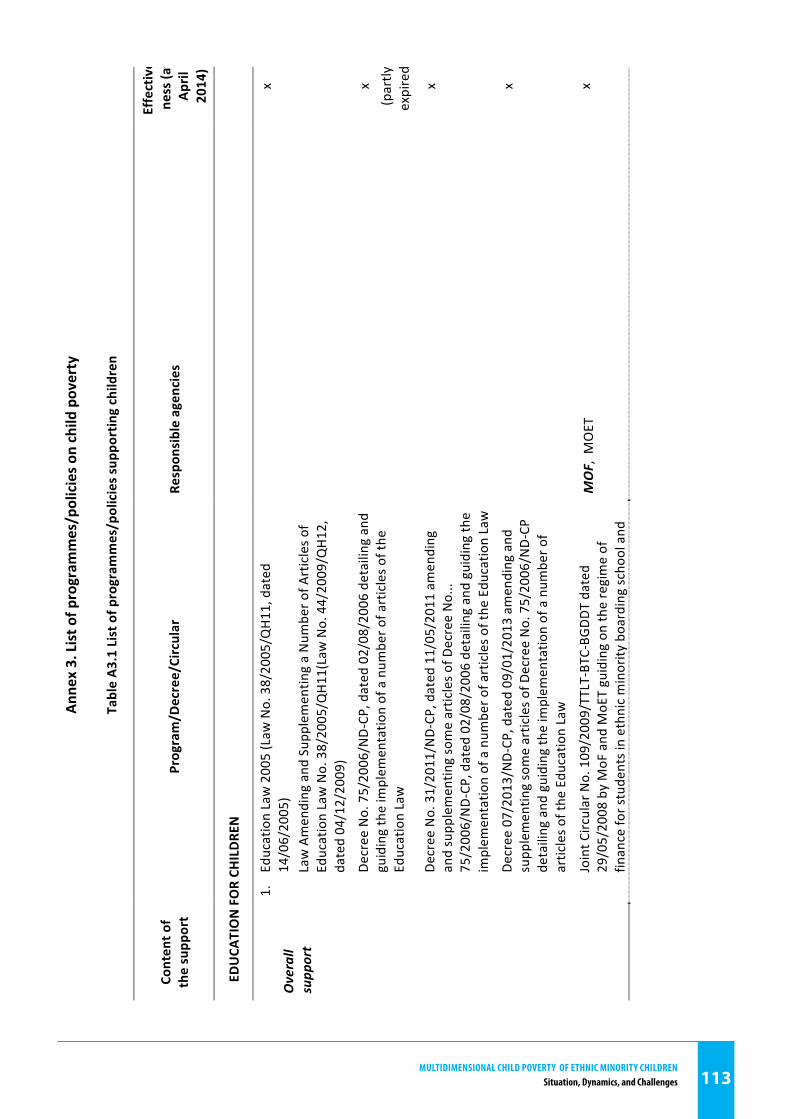
MultidiMensional Child Poverty of ethniC Minority Childrensituation, dynamics, and Challenges 113
113
Annex 3. List o
f program
mes/policies o
n child poverty
Table A3
.1 List o
f program
mes/policies supp
ortin
g children
Content o
f the supp
ort
Program/D
ecree/Circular
Respon
sible agencies
Effective-‐
ness (at
April
2014)
EDUCA
TION FOR CH
ILDREN
Overall
supp
ort
1. Education Law 2005 (Law
No. 38/2005/Q
H11, dated
14/06/2005)
Law Amending and
Sup
plem
entin
g a Num
ber o
f Articles o
f Education Law No. 38/2005/Q
H11(Law
No. 44/2009/Q
H12,
dated 04/12/2009)
x
Decree No. 75/2006/ND-‐CP
, dated 02/08/2006 detailing and
guiding the implem
entatio
n of a num
ber o
f articles o
f the
Education Law
x
(partly
expired)
Decree No. 31/2011/N
D-‐CP
, dated 11/05/2011 am
ending
and supp
lementin
g some articles o
f Decree No...
75/2006/ND-‐CP
, dated 02/08/2006 detailing and
guiding th
e implem
entatio
n of a num
ber o
f articles o
f the Edu
catio
n Law
x
Decree 07/2013/N
D-‐CP
, dated 09/01/2013 am
ending and
supp
lementin
g some articles o
f Decree No. 75/2006/N
D-‐CP
detailing and
guiding th
e implem
entatio
n of a num
ber o
f articles o
f the Edu
catio
n Law
x
Joint C
ircular No. 109/2009/TTLT-‐BTC-‐BGDD
T dated
29/05/2008 by MoF and
MoET guiding on
the regime of
finance fo
r students in ethn
ic minority boarding scho
ol and
MOF, M
OET
x
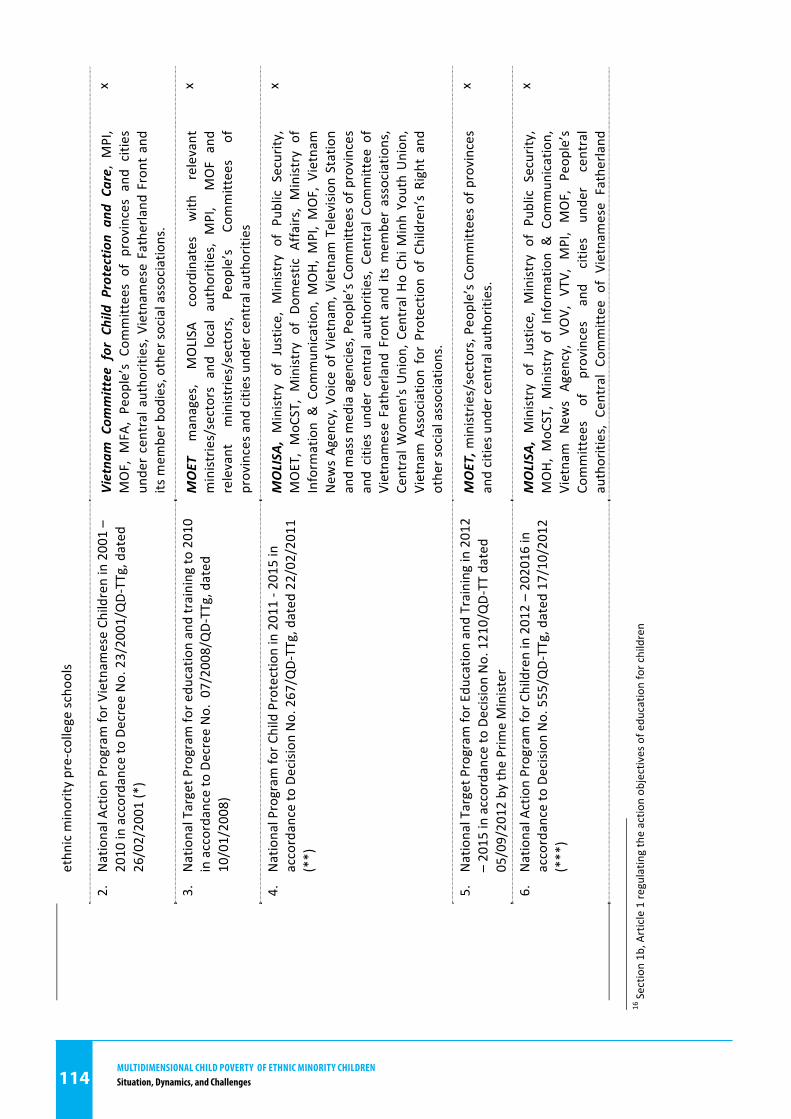
MultidiMensional Child Poverty of ethniC Minority Childrensituation, dynamics, and Challenges114
114
ethn
ic minority pre-‐college sc
hools
2. National A
ction Program fo
r Vietnam
ese Ch
ildren in 2001 –
2010 in accordance to Decree No. 23/2001/Q
D-‐TTg, dated
26/02/2001 (*)
Vietna
m Com
mittee for Child Protection an
d Ca
re, MPI,
MOF, M
FA, Peop
le’s C
ommittees of p
rovinces and
cities
under central autho
rities, Vietnam
ese Fatherland
Front and
its mem
ber b
odies, other so
cial associatio
ns.
x
3. National Target P
rogram
for e
ducatio
n and training to
2010
in accordance to Decree No. 07/2008/Q
D-‐TTg, dated
10/01/2008)
MOET
manages,
MOLISA
coordinates
with
relevant
ministries/sectors and
local authorities, MPI, M
OF
and
relevant
ministries/sectors,
Peop
le’s
Committees
of
provinces a
nd cities und
er central autho
rities
x
4. National Program
for C
hild Protection in 2011 -‐ 2
015 in
accordance to
Decision No. 267/Q
D-‐TTg, dated 22/02/2011
(**)
MOLISA
, Ministry of Justice, M
inistry of P
ublic Security,
MOET, MoC
ST, Ministry of D
omestic A
ffairs, Ministry of
Inform
ation & Com
mun
ication, M
OH, MPI, MOF, Vietnam
New
s Ag
ency, V
oice of V
ietnam
, Vietnam
Television Station
and mass media agencies, People’s Co
mmittees of provinces
and citie
s un
der central authorities, Central Co
mmittee of
Vietnamese Fatherland
Front and
its mem
ber associations,
Central W
omen's Union
, Central Ho Ch
i Minh Youth Union
, Vietnam Associatio
n for Protectio
n of Children’s Right and
other social associatio
ns.
x
5. National Target P
rogram
for E
ducatio
n and Training in 2012
– 2015 in accordance to Decision
No. 1210/QD-‐TT dated
05/09/2012 by the Prime Minister
MOET, m
inistries/sectors, People’s Co
mmittees of provinces
and citie
s und
er central autho
rities.
x
6. National A
ction Program fo
r Children in 2012 – 202016 in
accordance to
Decision No. 555/Q
D-‐TTg, dated 17/10/2012
(***)
MOLISA
, Ministry of Justice, M
inistry of P
ublic Security,
MOH, MoC
ST, Ministry of Information & Com
mun
ication,
Vietnam New
s Ag
ency, VO
V, VT
V, MPI, MOF, Peop
le’s
Committees
of
provinces
and
citie
s un
der
central
authorities, Central Co
mmittee o
f Vietnamese Fatherland
x
16 Sectio
n 1b, A
rticle 1 re
gulatin
g the actio
n ob
jectives of edu
catio
n for children
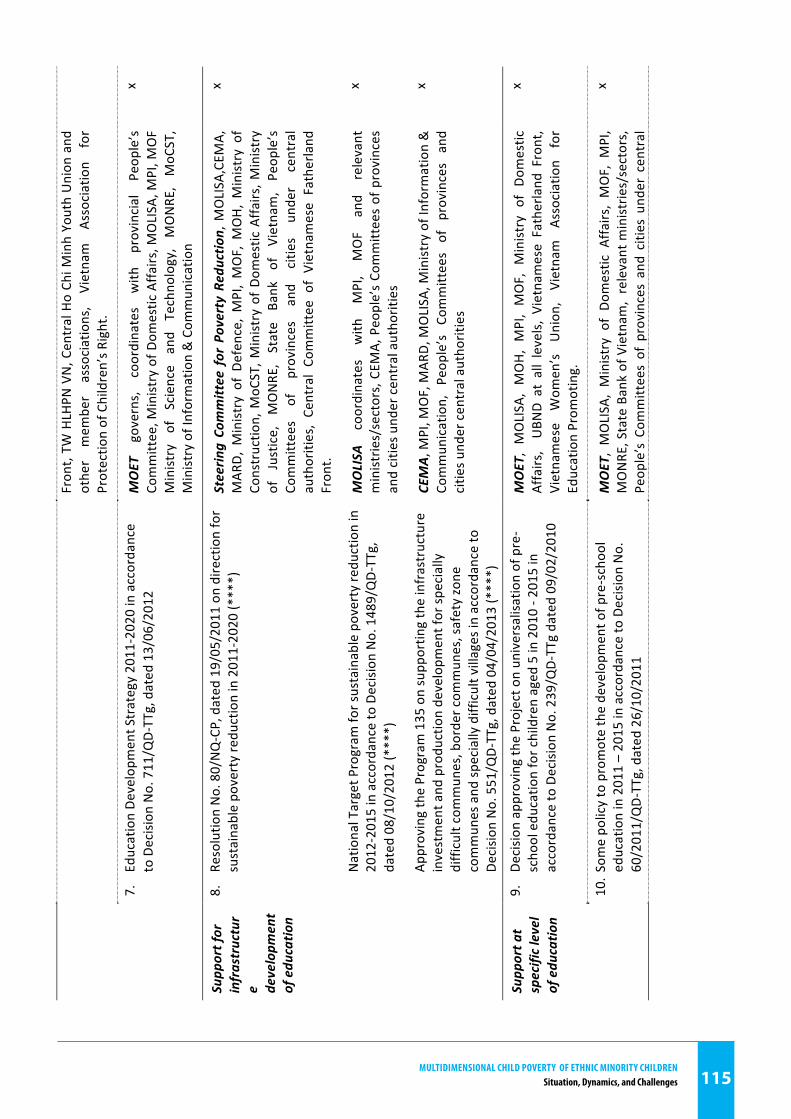
MultidiMensional Child Poverty of ethniC Minority Childrensituation, dynamics, and Challenges 115
115
Fron
t, TW
HLH
PN VN, C
entral Ho Ch
i Minh Youth Union
and
other
mem
ber
associations,
Vietnam Association
for
Protectio
n of Children’s R
ight.
7. Education De
velopm
ent Strategy 2011-‐2020 in accordance
to Decision
No. 711/Q
D-‐TTg, dated 13/06/2012
MOET governs, coordinates
with
provincial Peop
le’s
Committee, M
inistry of Dom
estic Affa
irs, M
OLISA
, MPI, M
OF
Ministry
of Science
and
Techno
logy, MONRE, MoC
ST,
Ministry of Inform
ation & Com
mun
ication
x
Supp
ort for
infrastructur
e developm
ent
of edu
catio
n
8. Re
solutio
n No. 80/NQ-‐CP, dated 19/05/2011 on
dire
ction for
sustainable po
verty redu
ction in 2011-‐2020 (****)
Steerin
g Co
mmittee for Poverty Reductio
n, M
OLISA
,CEM
A,
MAR
D, M
inistry of D
efence, MPI, MOF, M
OH, Ministry of
Constructio
n, M
oCST, M
inistry of Dom
estic Affa
irs, M
inistry
of Justice, MONRE,
State
Bank of Vietnam,
Peop
le’s
Committees
of
provinces
and
citie
s un
der
central
authorities, Central Co
mmittee o
f Vietnamese Fatherland
Fron
t.
x
National Target P
rogram
for sustainable poverty re
duction in
2012-‐2015 in accordance to Decision
No. 1489/QD-‐TTg,
dated 08/10/2012 (****)
MOLISA
coordinates
with
MPI,
MOF
and
relevant
ministries/sectors, CEM
A, People’s Co
mmittees of provinces
and citie
s und
er central autho
rities
x
Approving the Program 135 on supp
ortin
g the infrastructure
investment a
nd produ
ction developm
ent for sp
ecially
difficult commun
es, border com
mun
es, safety zone
commun
es and
specially difficult villages in accordance to
Decision
No. 551/Q
D-‐TTg, dated 04/04/2013 (****)
CEMA , M
PI, M
OF, M
ARD, M
OLISA
, Ministry of Inform
ation &
Commun
ication, Peop
le’s Co
mmittees
of provinces
and
citie
s und
er central autho
rities
x
Supp
ort a
t specific level
of edu
catio
n
9. De
cision
app
roving th
e Project o
n un
iversalisation of pre-‐
scho
ol edu
catio
n for children aged 5 in 2010 -‐ 2
015 in
accordance to
Decision No. 239/Q
D-‐TTg dated 09/02/2010
MOET, MOLISA
, MOH, MPI, MOF, M
inistry of D
omestic
Affairs, U
BND
at all levels, Vietnam
ese Fatherland
Front,
Vietnamese
Wom
en’s Union
, Vietnam Association
for
Education Prom
oting.
x
10. S
ome po
licy to promote the developm
ent o
f pre-‐schoo
l education in 2011 – 2015 in accordance to Decision
No.
60/2011/QD-‐TTg, dated 26/10/2011
MOET, MOLISA
, Ministry of D
omestic A
ffairs, MOF, M
PI,
MONRE, State Bank of Vietnam
, relevant m
inistries/sectors,
Peop
le’s Com
mittees of provinces and
cities und
er central
x
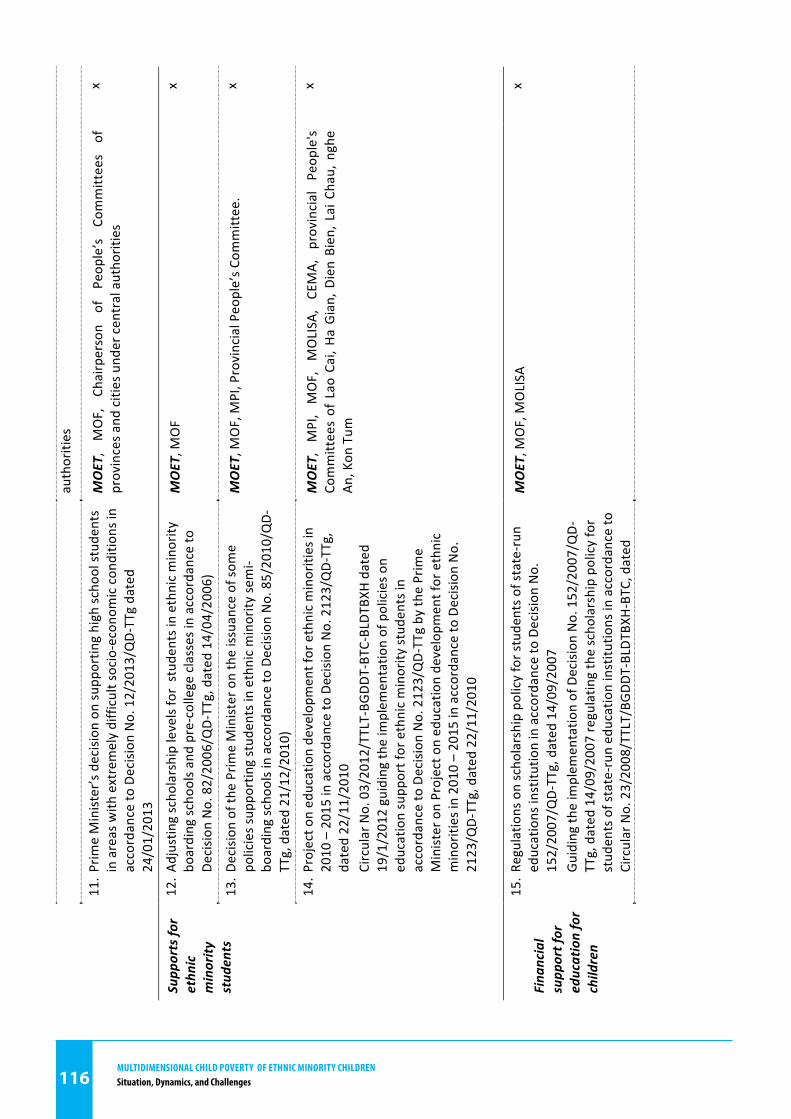
MultidiMensional Child Poverty of ethniC Minority Childrensituation, dynamics, and Challenges116
116
authorities
11. P
rime Minister’s decision on
supp
ortin
g high sc
hool stud
ents
in areas with
extremely difficult socio-‐econ
omic con
ditio
ns in
accordance to
Decision No. 12/2013/Q
D-‐TTg dated
24/01/2013
MOET,
MOF, Ch
airperson
of Peop
le’s Co
mmittees
of
provinces a
nd cities und
er central autho
rities
x
Supp
orts fo
r ethn
ic
minority
stud
ents
12. A
djustin
g scho
larship levels for stud
ents in ethnic minority
boarding sc
hools a
nd pre-‐college classes in accordance to
Decision
No. 82/2006/Q
D-‐TTg, dated 14/04/2006)
MOET, M
OF
x
13. D
ecision of th
e Prime Minister o
n the issuance of som
e po
licies sup
porting stud
ents in ethnic minority se
mi-‐
boarding sc
hools in accordance to
Decision No. 85/2010/Q
D-‐TTg, dated 21/12/2010)
MOET, M
OF, M
PI, Provincial People’s C
ommittee.
x
14. P
roject on education developm
ent for ethnic minorities in
2010 – 2015 in accordance to Decision
No. 2123/QD-‐TTg,
dated 22/11/2010
Circular No. 03/2012/TTLT-‐BG
DDT-‐BTC-‐BLDT
BXH dated
19/1/2012 guiding the implem
entatio
n of policies o
n education supp
ort for ethnic minority stud
ents in
accordance to
Decision No. 2123/QD-‐TTg by th
e Prime
Minister o
n Project o
n education developm
ent for ethnic
minorities in 2010 – 2015 in accordance to Decision
No.
2123/Q
D-‐TTg, dated 22/11/2010
MOET, MPI, MOF, MOLISA
, CEMA, provincial Peop
le's
Committees of Lao Cai, H
a Gian, Dien Bien, Lai Chau, nghe
An, Kon
Tum
x
Fina
ncial
supp
ort for
education for
children
15. R
egulations on scho
larship po
licy for students o
f state-‐run
educations institu
tion in accordance to Decision No.
152/2007/Q
D-‐TTg, dated 14/09/2007
Guiding th
e implem
entatio
n of Decision No. 152/2007/QD-‐
TTg, dated 14/09/2007 regulatin
g the scho
larship po
licy for
stud
ents of state-‐run
edu
catio
n institu
tions in accordance to
Circular No. 23/2008/TTLT/BG
DDT-‐BLDT
BXH-‐BTC, dated
MOET, M
OF, M
OLISA
x
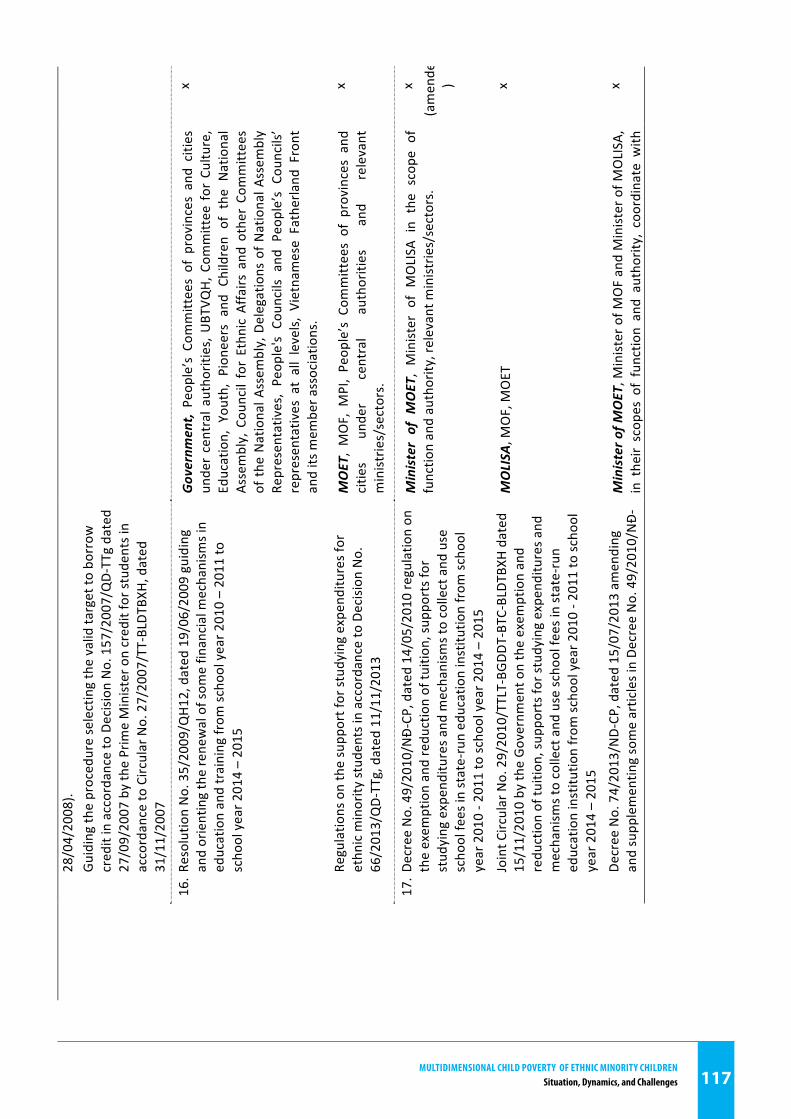
MultidiMensional Child Poverty of ethniC Minority Childrensituation, dynamics, and Challenges 117
117
28/04/2008).
Guiding th
e procedure selecting the valid ta
rget to
borrow
credit in accordance to Decision No. 157/2007/QD-‐TTg dated
27/09/2007 by the Prime Minister on credit for students in
accordance to
Circular No. 27/2007/TT-‐BLDT
BXH, dated
31/11/2007
16. R
esolution No. 35/2009/Q
H12, dated 19/06/2009 guiding
and orienting the renewal of som
e fin
ancial mechanism
s in
education and training from
scho
ol year 2
010 – 2011 to
scho
ol year 2
014 – 2015
Governm
ent,
Peop
le’s Com
mittees of provinces and
cities
under central a
utho
rities, UBTVQ
H, C
ommittee for Culture,
Education, You
th, Pion
eers and
Children
of the N
ational
Assembly, Cou
ncil for Ethn
ic Affa
irs and
other Com
mittees
of the National A
ssem
bly, Delegations of N
ational A
ssem
bly
Representatives, Peop
le's
Coun
cils
and
Peop
le’s C
ouncils’
representatives at all levels, Vietnamese Fatherland
Front
and its mem
ber a
ssociatio
ns.
x
Regulatio
ns on the supp
ort for stud
ying expenditures for
ethn
ic minority stud
ents in accordance to Decision No.
66/2013/QD-‐TTg, dated 11/11/2013
MOET, MOF, M
PI, Peop
le’s Com
mittees of provinces and
citie
s un
der
central
authorities
and
relevant
ministries/sectors.
x
17. D
ecree No. 49/2010/N
Ð-‐CP, dated 14/05/2010 regulatio
n on
the exem
ption and redu
ction of tu
ition
, sup
ports for
stud
ying expenditures a
nd mechanism
s to collect and
use
scho
ol fees in state-‐run education institu
tion from
scho
ol
year 2010 -‐ 2
011 to sc
hool year 2
014 – 2015
Minister of M
OET, Minister of M
OLISA
in
the
scop
e of
functio
n and authority, relevant m
inistries/sectors.
x (amended
)
Joint C
ircular No. 29/2010/TTLT-‐BG
DDT-‐BTC-‐BLDT
BXH dated
15/11/2010 by the Governm
ent o
n the exem
ption and
redu
ction of tu
ition
, sup
ports for stud
ying expenditures a
nd
mechanism
s to collect and
use sc
hool fees in state-‐run
education institu
tion from
scho
ol year 2
010 -‐ 2
011 to sc
hool
year 2014 – 2015
MOLISA
, MOF, M
OET
x
Decree No. 74/2013/N
D-‐CP
, dated 15/07/2013 am
ending
and supp
lementin
g some articles in De
cree No. 49/2010/N
Ð-‐
Minister o
f MOET, M
inister o
f MOF and Minister o
f MOLISA
, in their scop
es of functio
n and authority, coordinate w
ith
x
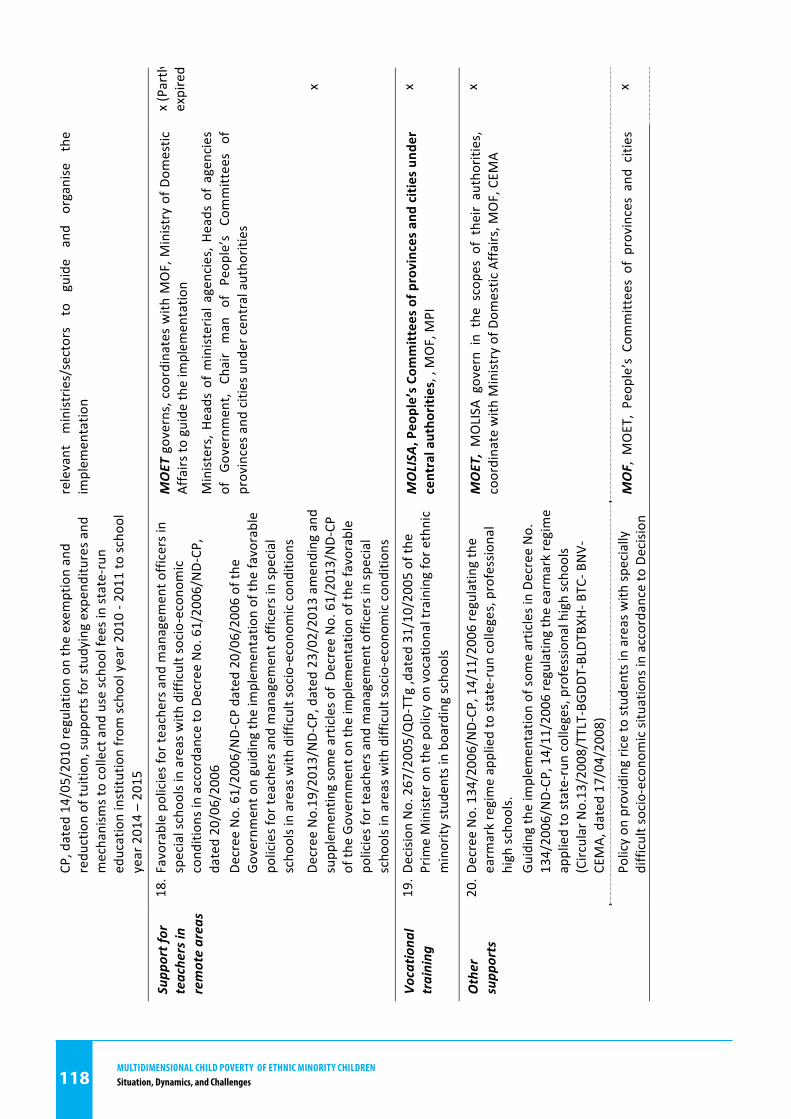
MultidiMensional Child Poverty of ethniC Minority Childrensituation, dynamics, and Challenges118
118
CP, dated 14/05/2010 regulatio
n on
the exem
ption and
redu
ction of tu
ition
, sup
ports for stud
ying expenditures a
nd
mechanism
s to collect and
use sc
hool fees in state-‐run
education institu
tion from
scho
ol year 2
010 -‐ 2
011 to sc
hool
year 2014 – 2015
relevant ministries/sectors
to guide
and
organise the
implem
entatio
n
Supp
ort for
teachers in
remote areas
18. F
avorable policies for te
achers and
managem
ent o
fficers in
special schoo
ls in areas with
difficult socio-‐econo
mic
cond
ition
s in accordance to
Decree No. 61/2006/ND-‐CP
, dated 20/06/2006
Decree No. 61/2006/ND-‐CP
dated 20/06/2006 of th
e Governm
ent o
n guiding the implem
entatio
n of th
e favorable
policies for te
achers and
managem
ent o
fficers in sp
ecial
scho
ols in areas w
ith difficult socio-‐econo
mic con
ditio
ns
MOET governs, coo
rdinates with
MOF, M
inistry of D
omestic
Affairs to
guide th
e implem
entatio
n
Ministers, H
eads of ministeria
l agencies, Heads of agencies
of Governm
ent,
Chair man of Peop
le’s Co
mmittees
of
provinces a
nd cities und
er central autho
rities
x (Partly
expired)
Decree No.19/2013/ND-‐CP
, dated 23/02/2013 am
ending and
supp
lementin
g some articles o
f De
cree No. 61/2013/N
D-‐CP
of th
e Governm
ent o
n the implem
entatio
n of th
e favorable
policies for te
achers and
managem
ent o
fficers in sp
ecial
scho
ols in areas w
ith difficult socio-‐econo
mic con
ditio
ns
x
Vocatio
nal
training
19. D
ecision No. 267/2005/QD-‐TTg ,dated 31/10/2005 of th
e Prime Minister on the po
licy on
vocational training for e
thnic
minority stud
ents in boarding scho
ols
MOLISA
, People’s Co
mmittees of provinces and
cities und
er
central autho
rities, , MOF, M
PI
x
Other
supp
orts
20. D
ecree No. 134/2006/ND-‐CP
, 14/11/2006 regulatin
g the
earm
ark regime applied to state-‐run colleges, professional
high sc
hools.
Guiding th
e implem
entatio
n of so
me articles in De
cree No.
134/2006/ND-‐CP
, 14/11/2006 regulatin
g the earm
ark regime
applied to state-‐run colleges, professional high scho
ols
(Circular No.13/2008/TTLT-‐BGDD
T-‐BLDT
BXH-‐ B
TC-‐ B
NV-‐
CEMA, dated 17/04/2008)
MOET, MOLISA
govern in the scopes of their
authorities,
coordinate with
Ministry of Dom
estic Affa
irs, M
OF, CEM
A x
Policy on
providing rice to
stud
ents in areas with
specially
difficult socio-‐econ
omic situations in accordance to Decision
MOF, M
OET, Peop
le’s Com
mittees of provinces and
cities
x

MultidiMensional Child Poverty of ethniC Minority Childrensituation, dynamics, and Challenges 119
119
No. 36/2013 QD-‐TTg, dated 24/01/2013)
under central autho
rities, Minister of, H
eads of m
inisteria
l agencies, Heads of agencies of Governm
ent, Ch
air man of
Peop
le’s Com
mittees of provinces and
cities und
er central
authorities
21. C
HILD LAB
OUR, CHILD PRO
TECTION
Child labo
ur
22. N
ational A
ction Program fo
r Children in 2001 – 2010
17, in
accordance to
Decision No. 23/2001/Q
D-‐TTg, dated
26/02/2001 (*)
Vietna
m Com
mittee fo
r Child Protection an
d Ca
re,
MPI, MOF, M
FA, Peop
le’s C
ommittees of p
rovinces a
nd
citie
s un
der
central authorities, Vietnamese
Fatherland
Fron
t and
its m
ember b
odies, so
cial mass o
rganisations.
x
23. Joint circular guiding and
prescrib
ing the list o
f working
places and
jobs fo
r which th
e em
ployment o
f laborers a
ged
under 1
8 is banned in se
rvice establishm
ents easy to be
taken advantage of fo
r prostitu
tion activities (Joint Circular
No. 21/2004/TTLT – BLDT
BXH – BYT, dated 09/12/2004)
DOLISA
, DO
H of provinces
and
citie
s un
der
central
authorities coordinate with
De
partment of Cu
lture and
Commun
ication, D
epartm
ent of C
ommerce a
nd T
ourism,
and
relevant d
epartm
ents/sector,
provincial Inspectorate
agencies of labou
r, health, People’s C
ommittee at a
ll levels.
x
Labo
ur Law
(No. 10/2012/Q
H13, dated 18/06/2012)
x
Child
protectio
n 24. L
aw on child protection, care and education (Law
No.
25/2004/QH11, dated 15/06/2004)
x
25. N
ational Program
on Ch
ild Protection in 2011 – 2015 by the
Prime Minister in accordance to Decision
No. 267/Q
D-‐dated
22/02/2011) (**)
MOLISA
, Ministry of Justice, M
inistry of P
ublic Security,
MOET, MoC
ST, Ministry of D
omestic A
ffairs, Ministry o
f Inform
ation & Com
mun
ication, M
OH, MPI, MOF, Vietnam
New
s Ag
ency, V
oice of V
ietnam
, Vietnam
Television Station
and mass media agencies, People’s Co
mmittees of provinces
and citie
s un
der central authorities, Central Co
mmittee of
Vietnamese Fatherland
Front and
its mem
ber associations,
Central W
omen's Union
, Central Ho Ch
i Minh Youth Union
, Vietnam Associatio
n for Protectio
n of Children’s Right and
x
17 Sectio
n 2d, A
rticle 1: G
oals of Child Protection
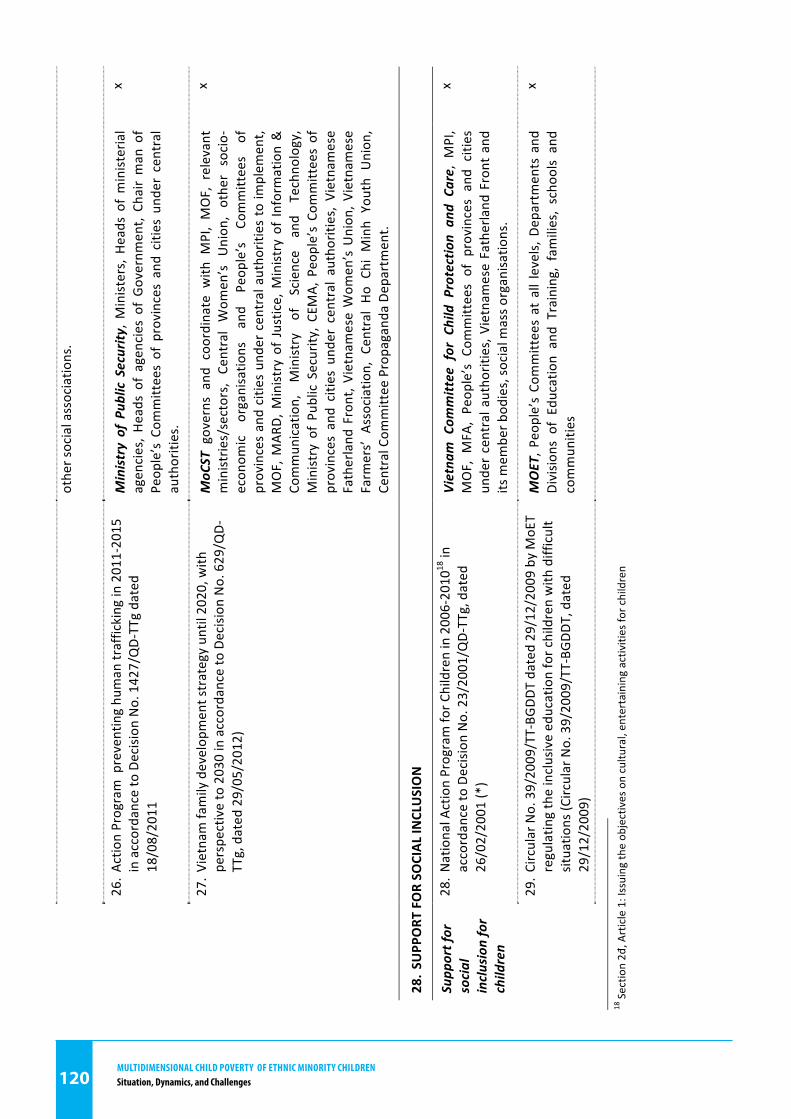
MultidiMensional Child Poverty of ethniC Minority Childrensituation, dynamics, and Challenges120
120
other social associatio
ns.
26. A
ction Program preventing hu
man trafficking in 2011-‐2015
in accordance to Decision No. 1427/QD-‐TTg dated
18/08/2011
Ministry of Pub
lic Security
, Ministers, Heads of ministeria
l agencies, Heads of agencies of Governm
ent, Ch
air man of
Peop
le’s Com
mittees of provinces and
cities und
er central
authorities.
x
27. V
ietnam
family develop
ment strategy un
til 2020, with
perspective to 2030 in accordance to Decision No. 629/Q
D-‐TTg, dated 29/05/2012)
MoC
ST governs and
coo
rdinate with
MPI, MOF, relevant
ministries/sectors, C
entral W
omen’s U
nion
, other socio-‐
econ
omic organisatio
ns and
Peop
le’s Co
mmittees
of
provinces and citie
s un
der central autho
rities to im
plem
ent,
MOF, M
ARD, M
inistry of Justice, M
inistry of In
form
ation &
Commun
ication, Ministry
of Science
and
Techno
logy,
Ministry of Pub
lic Security, CEMA, People’s Co
mmittees of
provinces and citie
s un
der central authorities, Vietnamese
Fatherland
Front, V
ietnam
ese Wom
en’s Union
, Vietnam
ese
Farm
ers’ A
ssociatio
n, C
entral H
o Ch
i Minh
Youth
Union
, Central Com
mittee Propagand
a De
partment.
x
28. S
UPP
ORT
FOR SO
CIAL IN
CLUSION
Supp
ort for
social
inclusion for
children
28. N
ational A
ction Program fo
r Children in 2006-‐2010
18 in
accordance to
Decision No. 23/2001/Q
D-‐TTg, dated
26/02/2001 (*)
Vietna
m Com
mittee for Child Protection an
d Ca
re, MPI,
MOF, M
FA, Peop
le’s C
ommittees of p
rovinces and
cities
under central autho
rities, Vietnam
ese Fatherland
Front and
its mem
ber b
odies, so
cial mass o
rganisations.
x
29. C
ircular No. 39/2009/TT-‐BG
DDT dated 29/12/2009 by MoET
regulatin
g the inclusive education for children with
difficult
situatio
ns (C
ircular No. 39/2009/TT-‐BG
DDT, dated
29/12/2009)
MOET, P
eople’s Co
mmittees at all levels, D
epartm
ents and
Division
s of Edu
catio
n and Training, families, scho
ols and
commun
ities
x
18 Sectio
n 2đ
, Article 1: Issuing th
e ob
jectives on cultu
ral, entertaining activities fo
r children
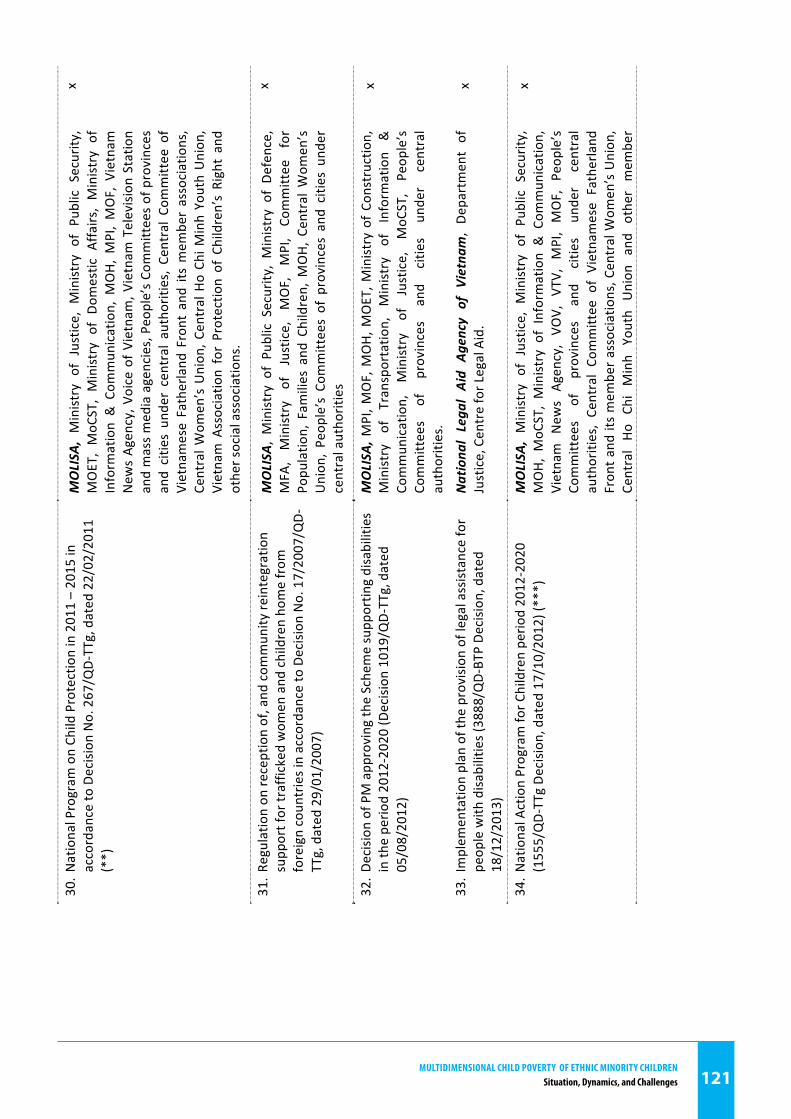
MultidiMensional Child Poverty of ethniC Minority Childrensituation, dynamics, and Challenges 121
121
30. N
ational Program
on Ch
ild Protection in 2011 – 2015 in
accordance to
Decision No. 267/Q
D-‐TTg, dated 22/02/2011
(**)
MOLISA
, Ministry of Justice, M
inistry of P
ublic Security,
MOET, MoC
ST, Ministry of D
omestic A
ffairs, Ministry of
Inform
ation & Com
mun
ication, M
OH, MPI, MOF, Vietnam
New
s Ag
ency, V
oice of V
ietnam
, Vietnam
Television Station
and mass media agencies, People’s Co
mmittees of provinces
and citie
s un
der central authorities, Central Co
mmittee of
Vietnamese Fatherland
Front and
its mem
ber associations,
Central W
omen’s Union
, Central Ho Ch
i Minh Youth Union
, Vietnam Associatio
n for Protectio
n of Children’s Right and
other social associatio
ns.
x
31. R
egulation on
reception of, and
com
mun
ity re
integration
supp
ort for trafficked wom
en and
children ho
me from
foreign coun
tries in accordance to
Decision No. 17/2007/Q
D-‐
TTg, dated 29/01/2007)
MOLISA
, Ministry of Pub
lic Security, Ministry of D
efence,
MFA
, Ministry
of Justice, MOF, MPI,
Committee for
Popu
latio
n, Fam
ilies and
Children, M
OH, Central Wom
en’s
Union
, Peop
le’s Com
mittees of provinces and
cities und
er
central autho
rities
x
32. D
ecision of PM app
roving th
e Scheme supp
ortin
g disabilities
in th
e perio
d 2012-‐2020 (Decision
1019/QD-‐TTg, dated
05/08/2012)
MOLISA
, MPI, M
OF, M
OH, M
OET, M
inistry of Con
struction,
Ministry
of Transportatio
n, Ministry
of Inform
ation
&
Commun
ication, Ministry
of Justice, MoC
ST,
Peop
le’s
Committees
of
provinces
and
citie
s un
der
central
authorities.
x
33. Implem
entatio
n plan of the provision
of legal assistance for
peop
le with
disabilitie
s (3888/Q
D-‐BTP De
cisio
n, dated
18/12/2013)
Nationa
l Lega
l Aid
Agency o
f Vietna
m, De
partment of
Justice, Centre for Legal Aid.
x
34. N
ational A
ction Program fo
r Children perio
d 2012-‐2020
(1555/QD-‐TTg De
cisio
n, dated 17/10/2012) (***)
MOLISA
, Ministry of Justice, M
inistry of P
ublic Security,
MOH, MoC
ST, Ministry of Information & Com
mun
ication,
Vietnam New
s Ag
ency, VO
V, VT
V, MPI, MOF, Peop
le’s
Committees
of
provinces
and
citie
s un
der
central
authorities, Central Co
mmittee o
f Vietnamese Fatherland
Fron
t and
its mem
ber associations, C
entral W
omen’s Union
, Central Ho
Chi Minh
Youth
Union
and
other mem
ber
x
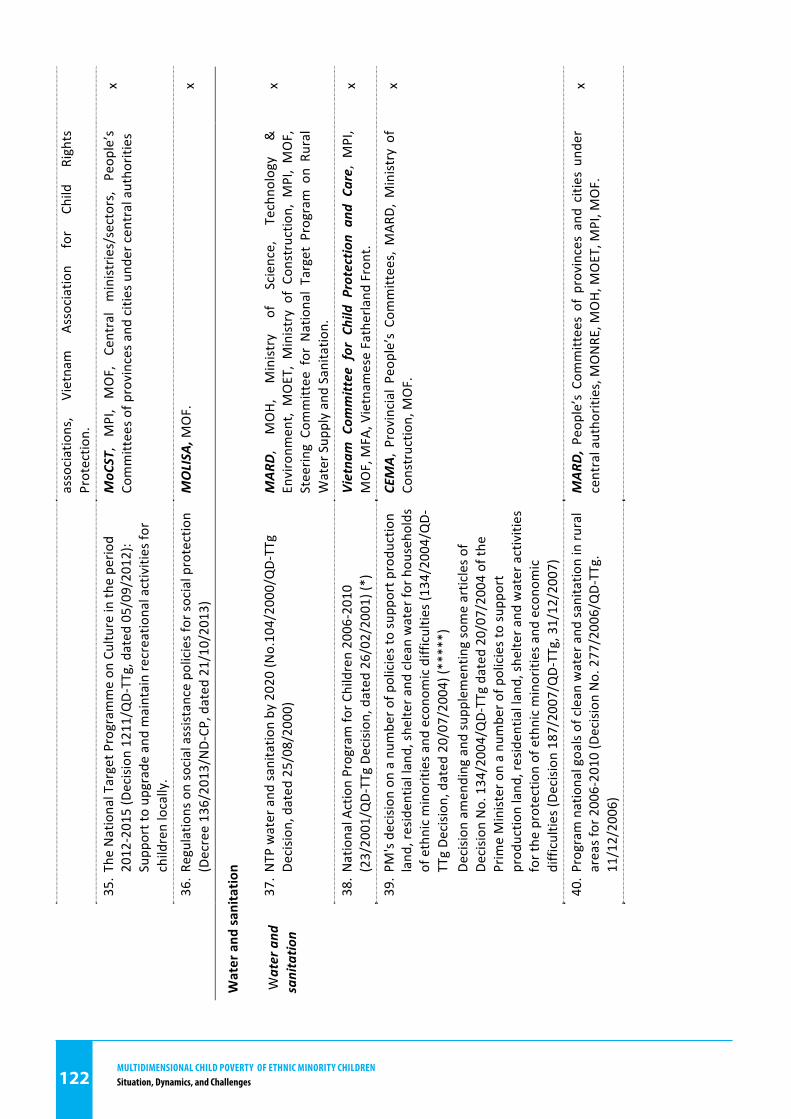
MultidiMensional Child Poverty of ethniC Minority Childrensituation, dynamics, and Challenges122
122
associations,
Vietnam
Association
for
Child
Rights
Protectio
n.
35. T
he National Target P
rogram
me on
Culture in th
e perio
d 2012-‐2015 (Decision
1211/QD-‐TTg, dated 05/09/2012):
Supp
ort to up
grade and maintain recreatio
nal activities fo
r children locally.
MoC
ST, MPI, MOF, Central ministries/sectors, Peop
le’s
Committees o
f provinces and
cities und
er central autho
rities
x
36. R
egulations on social assistance po
licies for so
cial protection
(Decree 136/2013/N
D-‐CP
, dated 21/10/2013)
MOLISA
, MOF.
x
Water and
sanita
tion
Water and
sanitatio
n 37. N
TP water and
sanitatio
n by 2020 (No.104/2000/Q
D-‐TTg
Decision
, dated 25/08/2000)
MAR
D,
MOH,
Ministry
of
Science,
Techno
logy
&
Environm
ent,
MOET, Ministry of Co
nstructio
n, M
PI, MOF,
Steerin
g Co
mmittee for N
ational Target Program
on Ru
ral
Water Sup
ply and Sanitatio
n.
x
38. N
ational A
ction Program fo
r Children 2006-‐2010
(23/2001/Q
D-‐TTg De
cisio
n, dated 26/02/2001) (*)
Vietna
m Com
mittee for Child Protection an
d Ca
re, MPI,
MOF, M
FA, V
ietnam
ese Fatherland
Front.
x
39. P
M's decisio
n on
a num
ber o
f policies to supp
ort p
rodu
ction
land
, residentia
l land, sh
elter a
nd clean water fo
r hou
seho
lds
of ethnic minorities and
econo
mic difficultie
s (134/2004/Q
D-‐TTg De
cisio
n, dated 20/07/2004) (*****)
Decision
amending and
supp
lementin
g some articles o
f De
cision
No. 134/2004/QD-‐TTg dated 20/07/2004 of the
Prime Minister on a nu
mber o
f policies to supp
ort
prod
uctio
n land
, residentia
l land, sh
elter a
nd water activities
for the protection of ethnic minorities and
econo
mic
difficulties (D
ecision 187/2007/Q
D-‐TTg, 31/12/2007)
CEMA, Provincial Peop
le’s Com
mittees, M
ARD, M
inistry of
Constructio
n, M
OF.
x
40. P
rogram
national goals of clean water and
sanitatio
n in ru
ral
areas for 2006-‐2010 (D
ecision
No. 277/2006/QD-‐TTg.
11/12/2006)
MAR
D, Peop
le’s Com
mittees of provinces and
cities und
er
central autho
rities, M
ONRE, M
OH, M
OET, M
PI, M
OF.
x
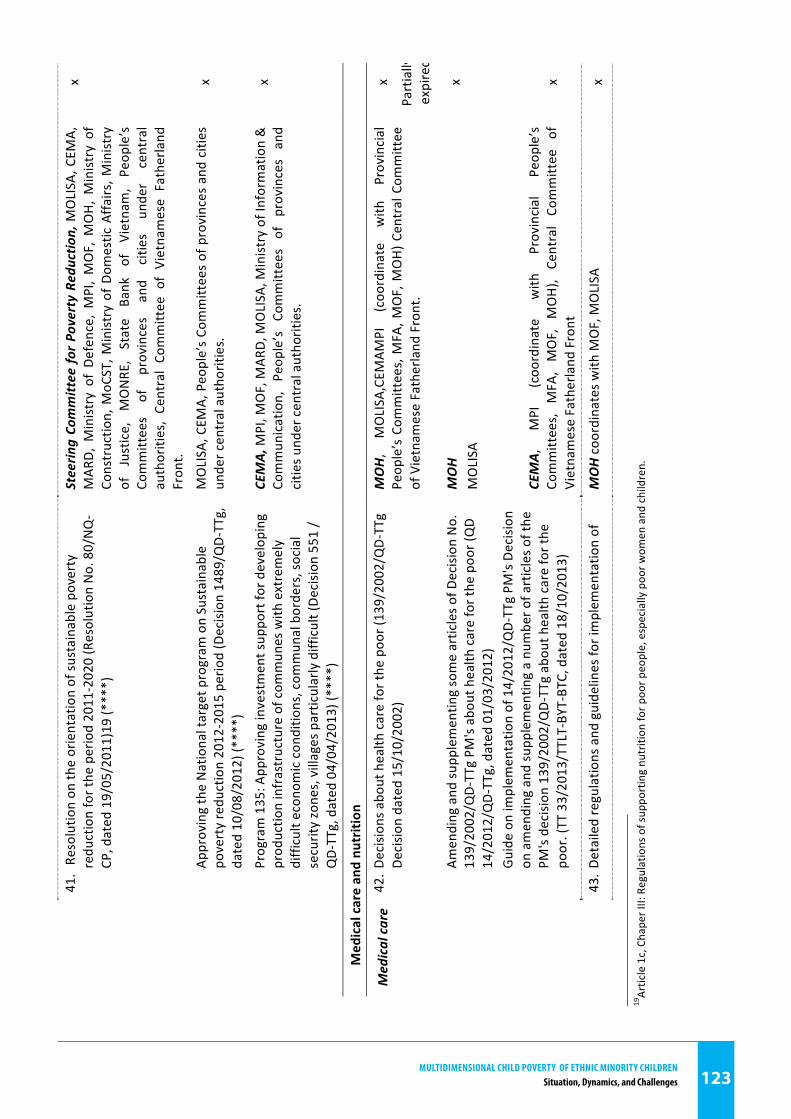
MultidiMensional Child Poverty of ethniC Minority Childrensituation, dynamics, and Challenges 123
123
41. Re
solutio
n on
the orientation of su
stainable po
verty
redu
ction for the period 2011-‐2020 (Resolution No. 80/NQ-‐
CP, dated 19/05/2011)19 (****)
Steerin
g Co
mmittee fo
r Po
verty Re
duction, M
OLISA
, CEM
A,
MAR
D, M
inistry of D
efence, MPI, MOF, M
OH, Ministry of
Constructio
n, M
oCST, M
inistry of Dom
estic Affa
irs, M
inistry
of Justice, MONRE,
State
Bank of Vietnam,
Peop
le’s
Committees
of
provinces
and
citie
s un
der
central
authorities, Central Co
mmittee o
f Vietnamese Fatherland
Fron
t.
x
Approving the National target p
rogram
on Sustainable
poverty redu
ction 2012-‐2015 perio
d (Decision
1489/QD-‐TTg,
dated 10/08/2012) (****)
MOLISA
, CEM
A, People’s Co
mmittees of provinces and
cities
under central autho
rities.
x
Program 135: A
pproving investment sup
port fo
r develop
ing
prod
uctio
n infrastructure of com
mun
es with
extremely
difficult econ
omic con
ditio
ns, com
mun
al borders, social
security zones, villages particularly difficult (De
cisio
n 551 /
QD-‐TTg, dated 04/04/2013) (****)
CEMA, M
PI, M
OF, M
ARD, M
OLISA
, Ministry of Inform
ation &
Commun
ication, Peop
le’s Co
mmittees
of provinces
and
citie
s und
er central autho
rities.
x
Medical care and nu
trition
Medical care
42. D
ecisions abo
ut health
care for the poo
r (139/2002/Q
D-‐TTg
Decision
dated 15/10/2002)
MOH,
MOLISA
,CEM
AMPI
(coo
rdinate
with
Provincial
Peop
le’s Com
mittees, M
FA, M
OF, M
OH) C
entral Com
mittee
of Vietnam
ese Fatherland
Front.
x
Partially
expired
Amending and
supp
lementin
g some articles o
f Decision
No.
139/2002/Q
D-‐TTg PM
's abou
t health
care for the poo
r (QD
14/2012/QD-‐TTg, dated 01/03/2012)
Guide on implem
entatio
n of 14/2012/Q
D-‐TTg PM
's De
cisio
n on
amending and
supp
lementin
g a nu
mber o
f articles o
f the
PM's decisio
n 139/2002/Q
D-‐TTg abou
t health
care for the
poor. (TT 33/2013/TTLT-‐BYT-‐BTC, dated 18/10/2013)
MOH
MOLISA
CEMA,
MPI
(coo
rdinate
with
Provincial
Peop
le’s
Committees, MFA
, MOF, MOH),
Central Co
mmittee of
Vietnamese Fatherland
Front
x
x
43. D
etailed regulatio
ns and
guidelines fo
r implem
entatio
n of
MOH coo
rdinates with
MOF, M
OLISA
x
19Article 1c, Chaper III: Regulations of sup
porting nu
trition
for p
oor p
eople, especially poo
r wom
en and
children.
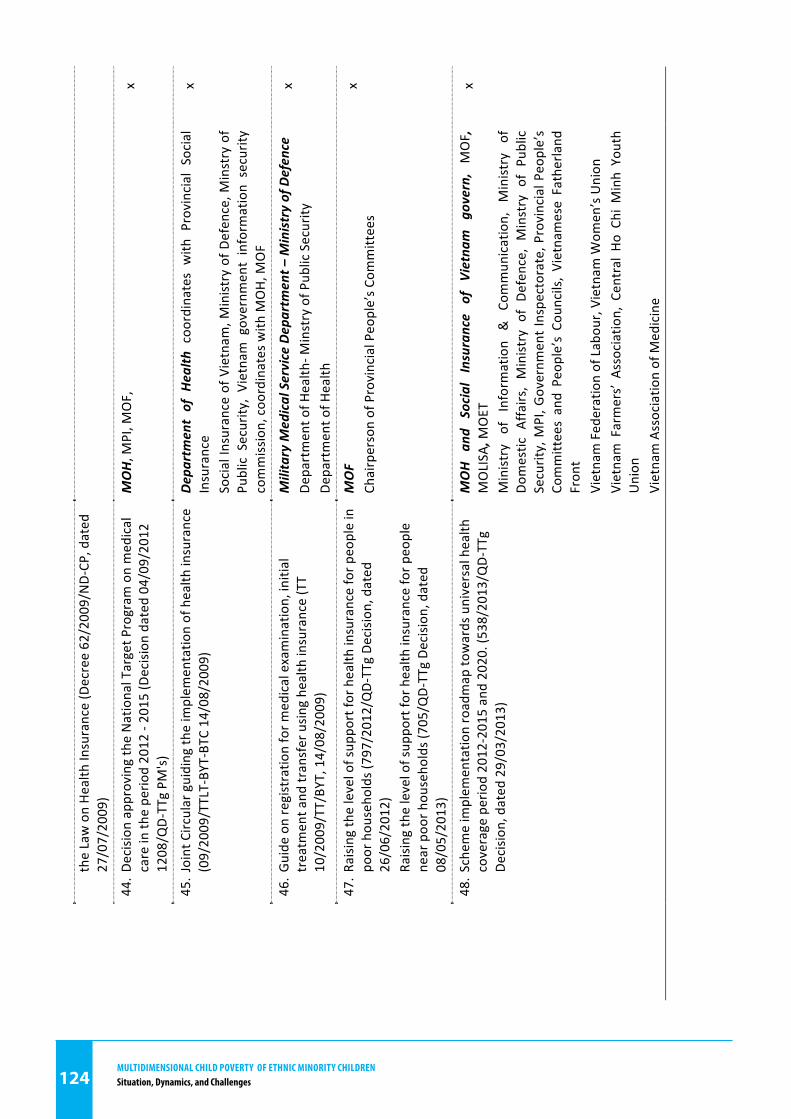
MultidiMensional Child Poverty of ethniC Minority Childrensituation, dynamics, and Challenges124
124
the Law on Health
Insurance (Decree 62/2009/ND-‐CP
, dated
27/07/2009)
44. D
ecision approving the National Target P
rogram
on medical
care in th
e perio
d 2012 -‐ 2015 (D
ecision
dated 04/09/2012
1208/Q
D-‐TTg PM
's)
MOH, M
PI, M
OF,
x
45. Joint Circular guiding th
e implem
entatio
n of health
insurance
(09/2009/TTLT-‐BYT-‐BTC 14/08/2009)
Departm
ent of H
ealth
coo
rdinates w
ith P
rovincial Social
Insurance
Social In
surance of Vietnam
, Ministry of D
efence, M
instry of
Public Security, Vietnam governm
ent inform
ation security
commission
, coo
rdinates with
MOH, M
OF
x
46. G
uide on registratio
n for m
edical examination, initial
treatm
ent a
nd transfer usin
g health insurance (TT
10/2009/TT/BYT, 14/08/2009)
Military M
edical Service Departm
ent –
Ministry of Defence
Department o
f Health
-‐ Minstry of P
ublic Security
Department o
f Health
x
47. R
aisin
g the level of sup
port fo
r health
insurance for p
eople in
poor hou
seho
lds (797/2012/Q
D-‐TTg De
cisio
n, dated
26/06/2012)
Raising th
e level of sup
port fo
r health
insurance for p
eople
near poo
r hou
seho
lds (705/QD-‐TTg De
cisio
n, dated
08/05/2013)
MOF
Chairperson of Provincial People’s C
ommittees
x
48. S
chem
e implem
entatio
n roadmap to
wards universal health
coverage period 2012-‐2015 and 2020. (538/2013/Q
D-‐TTg
Decision
, dated 29/03/2013)
MOH an
d Social Insurance
of Vietna
m go
vern, MOF,
MOLISA
, MOET
Ministry
of Inform
ation
& Co
mmun
ication, Ministry
of
Domestic A
ffairs, Ministry of D
efence, Minstry o
f Pu
blic
Security, M
PI, G
overnm
ent Inspectorate, P
rovincial P
eople’s
Committees and Peop
le’s Cou
ncils, Vietnamese Fatherland
Fron
t Vietnam Federation of Labou
r, Vietnam W
omen’s Union
Vietnam Farmers’ Associatio
n, Central H
o Ch
i Minh Youth
Union
Vietnam Associatio
n of M
edicine
x
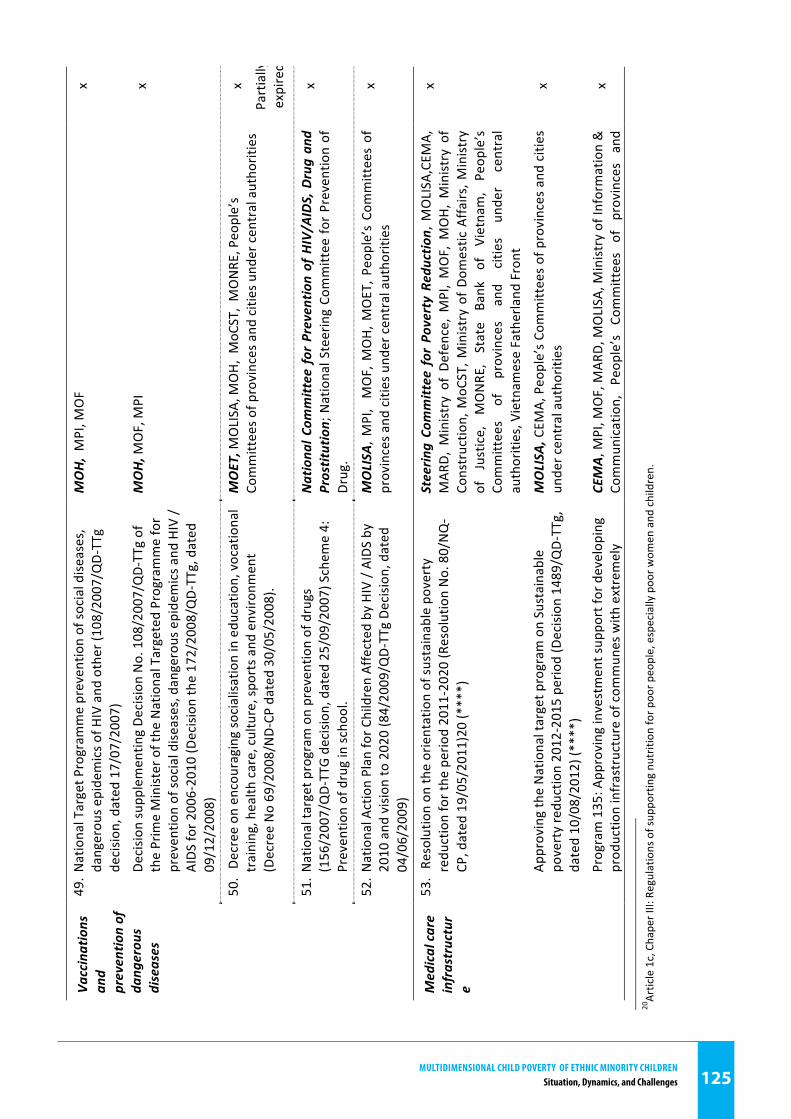
MultidiMensional Child Poverty of ethniC Minority Childrensituation, dynamics, and Challenges 125
125
Vaccinations
and
preventio
n of
dang
erou
s diseases
49. N
ational Target P
rogram
me preventio
n of so
cial dise
ases,
dangerou
s epidemics o
f HIV and
other (1
08/2007/QD-‐TTg
decision
, dated 17/07/2007)
MOH, MPI, M
OF
x
Decision
supp
lementin
g De
cision
No. 108/2007/QD-‐TTg of
the Prime Minister of the National Targeted Programme for
preventio
n of so
cial diseases, dangerous epidemics a
nd HIV /
AIDS
for 2
006-‐2010 (D
ecision
the 172/2008/Q
D-‐TTg, dated
09/12/2008)
MOH, M
OF, M
PI
x
50. De
cree on encouraging socialisation in edu
catio
n, vocational
training, health
care, culture, spo
rts a
nd enviro
nment
(Decree No 69/2008/ND-‐CP
dated 30/05/2008).
MOET, M
OLISA
, MOH, MoC
ST, MONRE, People’s
Committees o
f provinces and
cities und
er central autho
rities
x
Partially
expired
51. N
ational target p
rogram
on preventio
n of drugs
(156/2007/QD-‐TTG decision
, dated 25/09/2007) Schem
e 4:
Preventio
n of drug in sc
hool.
Nationa
l Com
mittee for Prevention of HIV/A
IDS, Drug an
d Prostitution; National Steering Co
mmittee fo
r Preventio
n of
Drug.
x
52. N
ational A
ction Plan fo
r Children Affected by HIV / AIDS
by
2010 and
vision
to 2020 (84/2009/Q
D-‐TTg De
cisio
n, dated
04/06/2009)
MOLISA
, MPI, MOF, M
OH, M
OET, P
eople’s Co
mmittees of
provinces a
nd cities und
er central autho
rities
x
Medical care
infrastructur
e
53. Re
solutio
n on
the orientation of su
stainable po
verty
redu
ction for the period 2011-‐2020 (Resolution No. 80/NQ-‐
CP, dated 19/05/2011)20 (****)
Steerin
g Co
mmittee for Poverty Reductio
n, M
OLISA
,CEM
A,
MAR
D, M
inistry of D
efence, MPI, MOF, M
OH, Ministry of
Constructio
n, M
oCST, M
inistry of Dom
estic Affa
irs, M
inistry
of Justice, MONRE,
State
Bank of Vietnam,
Peop
le’s
Committees
of
provinces
and
citie
s un
der
central
authorities, V
ietnam
ese Fatherland
Front
x
Approving the National target p
rogram
on Sustainable
poverty redu
ction 2012-‐2015 perio
d (Decision
1489/QD-‐TTg,
dated 10/08/2012) (****)
MOLISA
, CEM
A, People’s Co
mmittees of provinces and
cities
under central autho
rities
x
Program 135: A
pproving investment sup
port fo
r develop
ing
prod
uctio
n infrastructure of com
mun
es with
extremely
CEMA, M
PI, M
OF, M
ARD, M
OLISA
, Ministry of Inform
ation &
Commun
ication, Peop
le’s Co
mmittees
of provinces
and
x
20Article 1c, Chaper III: Regulations of sup
porting nu
trition
for p
oor p
eople, especially poo
r wom
en and
children.
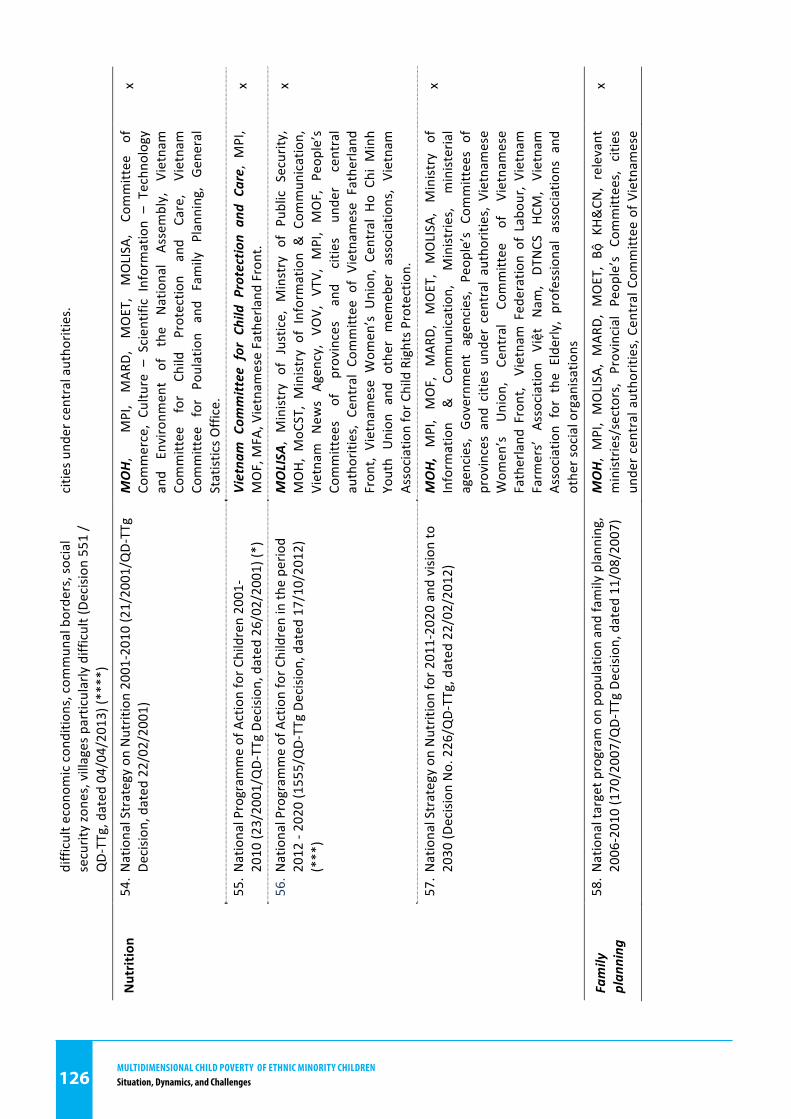
MultidiMensional Child Poverty of ethniC Minority Childrensituation, dynamics, and Challenges126
126
difficult econ
omic con
ditio
ns, com
mun
al borders, social
security zones, villages particularly difficult (De
cisio
n 551 /
QD-‐TTg, dated 04/04/2013) (****)
citie
s und
er central autho
rities.
Nutrition
54. N
ational Strategy on
Nutrition 2001-‐2010 (21/2001/Q
D-‐TTg
Decision
, dated 22/02/2001)
MOH,
MPI,
MAR
D, MOET,
MOLISA
, Co
mmittee of
Commerce, Cu
lture – Scientific Information – Techno
logy
and
Environm
ent
of the
National
Assembly, Vietnam
Committee for
Child Protectio
n and
Care,
Vietnam
Committee for Po
ulation
and
Family Planning, General
Statistics O
ffice.
x
55. N
ational Program
me of Action for C
hildren 2001-‐
2010 (2
3/2001/Q
D-‐TTg De
cisio
n, dated 26/02/2001) (*)
Vietna
m Com
mittee for Child Protection an
d Ca
re, MPI,
MOF, M
FA, V
ietnam
ese Fatherland
Front.
x
56. N
ational Program
me of Action for C
hildren in th
e perio
d 2012 -‐ 2020 (1
555/QD-‐TTg De
cisio
n, dated 17/10/2012)
(***)
MOLISA
, Ministry
of Justice, M
instry o
f Pu
blic S
ecurity,
MOH, MoC
ST, Ministry of Information & Com
mun
ication,
Vietnam New
s Ag
ency, VO
V, VT
V, MPI, MOF, Peop
le’s
Committees
of
provinces
and
citie
s un
der
central
authorities, Central Co
mmittee o
f Vietnamese Fatherland
Fron
t, Vietnamese Wom
en’s U
nion
, Central Ho Ch
i Minh
Youth
Union
and
other m
emeber a
ssociatio
ns, Vietnam
Association for C
hild Rights P
rotection.
x
57. N
ational Strategy on
Nutrition for 2
011-‐2020 and
vision
to
2030 (D
ecision
No. 226/Q
D-‐TTg, dated 22/02/2012)
MOH, MPI, MOF, MAR
D, MOET, MOLISA
, Ministry
of
Inform
ation
& Co
mmun
ication, Ministries, ministerial
agencies, Governm
ent agencies, Peop
le’s C
ommittees of
provinces and citie
s un
der central authorities, Vietnamese
Wom
en’s Union
, Central
Committee of Vietnamese
Fatherland
Front, Vietnam
Federation of Labou
r, Vietnam
Farm
ers’ Association
Việt Nam
, DT
NCS HCM
, Vietnam
Association
for the Elderly, professio
nal associations and
other social organisations
x
Family
plan
ning
58. N
ational target p
rogram
on po
pulatio
n and family plann
ing,
2006-‐2010 (170/2007/QD-‐TTg De
cisio
n, dated 11/08/2007)
MOH, MPI, MOLISA
, MAR
D, M
OET, Bộ
KH&CN
, relevant
ministries/sectors, Provincial Peop
le’s Co
mmittees, citie
s un
der central autho
rities, Central Com
mittee of V
ietnam
ese
x
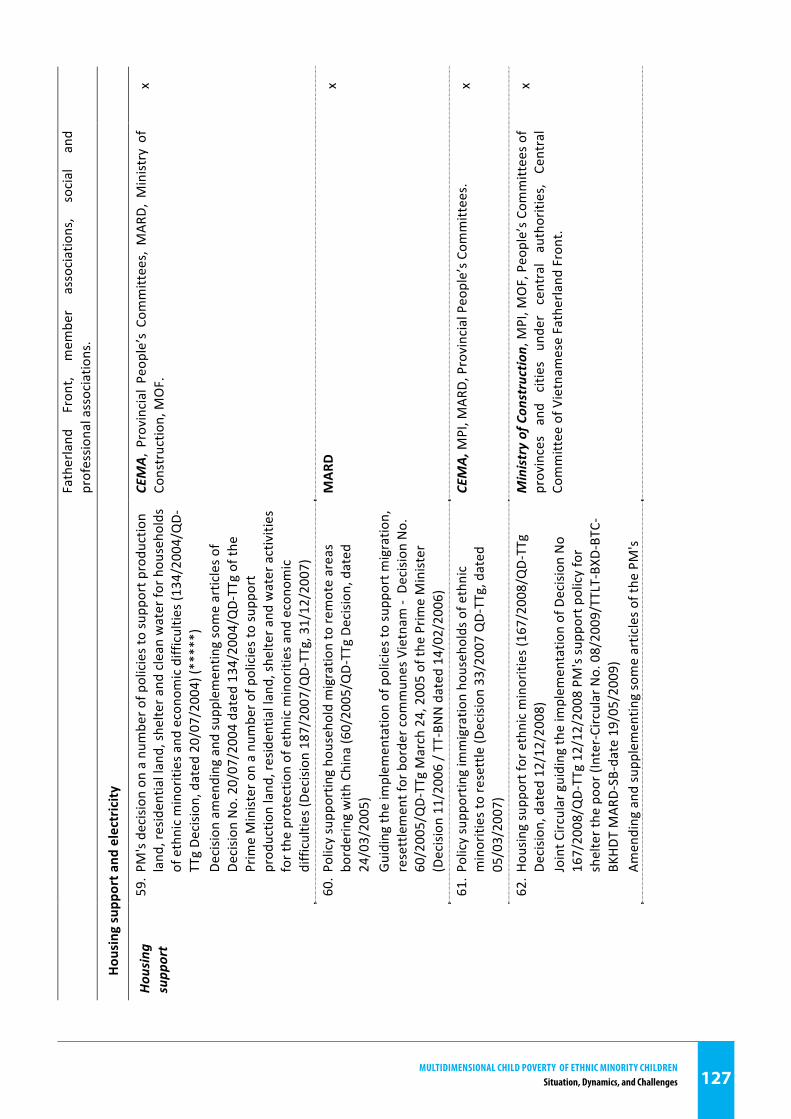
MultidiMensional Child Poverty of ethniC Minority Childrensituation, dynamics, and Challenges 127
127
Fatherland
Fron
t, mem
ber
associations,
social
and
profession
al associatio
ns.
Hou
sing sup
port and
electricity
Hou
sing
supp
ort
59. P
M's decisio
n on
a num
ber o
f policies to supp
ort p
rodu
ction
land
, residentia
l land, sh
elter a
nd clean water fo
r hou
seho
lds
of ethnic minorities and
econo
mic difficultie
s (134/2004/Q
D-‐TTg De
cisio
n, dated 20/07/2004) (*****)
Decision
amending and
supp
lementin
g some articles o
f De
cision
No. 20/07/2004 dated 134/2004/Q
D-‐TTg of th
e Prime Minister on a nu
mber o
f policies to supp
ort
prod
uctio
n land
, residentia
l land, sh
elter a
nd water activities
for the protection of ethnic minorities and
econo
mic
difficulties (D
ecision 187/2007/Q
D-‐TTg, 31/12/2007)
CEMA, Provincial Peop
le’s Com
mittees, M
ARD, M
inistry of
Constructio
n, M
OF.
x
60. P
olicy supp
ortin
g ho
usehold migratio
n to re
mote areas
bordering with
China (6
0/2005/Q
D-‐TTg De
cisio
n, dated
24/03/2005)
Guiding th
e implem
entatio
n of policies to supp
ort m
igratio
n,
resettlement for border com
mun
es Vietnam
-‐ Decision No.
60/2005/QD-‐TTg March 24, 2005 of th
e Prime Minister
(Decision 11/2006 / T
T-‐BN
N dated 14/02/2006)
MAR
D
x
61. P
olicy supp
ortin
g immigratio
n ho
useholds of ethnic
minorities to
resettle (D
ecision 33/2007 QD-‐TTg, dated
05/03/2007)
CEMA, M
PI, M
ARD, Provincial People’s C
ommittees.
x
62. H
ousing su
pport for ethnic minorities (1
67/2008/QD-‐TTg
Decision
, dated 12/12/2008)
Joint C
ircular guiding th
e implem
entatio
n of Decision No
167/2008/Q
D-‐TTg 12/12/2008 PM's supp
ort p
olicy for
shelter the poo
r (Inter-‐Circular No. 08/2009/TTLT-‐BX
D-‐BTC-‐
BKHDT
MAR
D-‐SB-‐date 19/05/2009)
Amending and
supp
lementin
g some articles o
f the PM's
Ministry of Con
struction, M
PI, M
OF, People’s Co
mmittees of
provinces
and
citie
s un
der
central authorities, Central
Committee of V
ietnam
ese Fatherland
Front.
x
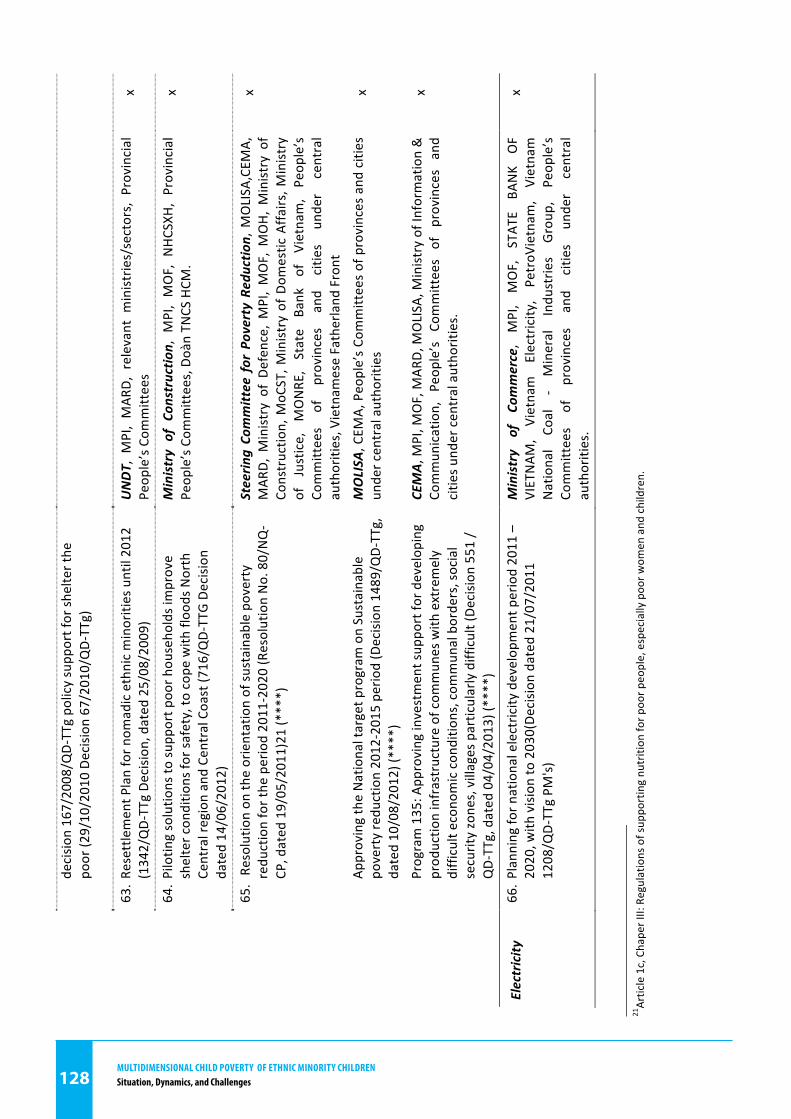
MultidiMensional Child Poverty of ethniC Minority Childrensituation, dynamics, and Challenges128
128
decision
167/2008/QD-‐TTg po
licy supp
ort for sh
elter the
poor (2
9/10/2010 De
cision
67/2010/Q
D-‐TTg)
63. R
esettle
ment P
lan for n
omadic ethnic minorities until 2012
(1342/QD-‐TTg De
cisio
n, dated 25/08/2009)
UNDT, M
PI, MAR
D, relevant ministries/sectors, Provincial
Peop
le’s Com
mittees
x
64. P
ilotin
g solutio
ns to
supp
ort p
oor h
ouseho
lds improve
shelter con
ditio
ns fo
r safety, to
cop
e with
floo
ds North
Central region and Central Coast (7
16/Q
D-‐TTG Decision
dated 14/06/2012)
Ministry of C
onstruction, M
PI, MOF, N
HCSXH
, Provincial
Peop
le’s Com
mittees, Doàn TN
CS HCM
. x
65. Re
solutio
n on
the orientation of su
stainable po
verty
redu
ction for the period 2011-‐2020 (Resolution No. 80/NQ-‐
CP, dated 19/05/2011)21 (****)
Steerin
g Co
mmittee for Poverty Reductio
n, M
OLISA
,CEM
A,
MAR
D, M
inistry of D
efence, MPI, MOF, M
OH, Ministry of
Constructio
n, M
oCST, M
inistry of Dom
estic Affa
irs, M
inistry
of Justice, MONRE,
State
Bank of Vietnam,
Peop
le’s
Committees
of
provinces
and
citie
s un
der
central
authorities, V
ietnam
ese Fatherland
Front
x
Approving the National target p
rogram
on Sustainable
poverty redu
ction 2012-‐2015 perio
d (Decision
1489/QD-‐TTg,
dated 10/08/2012) (****)
MOLISA
, CEM
A, People’s Co
mmittees of provinces and
cities
under central autho
rities
x
Program 135: A
pproving investment sup
port fo
r develop
ing
prod
uctio
n infrastructure of com
mun
es with
extremely
difficult econ
omic con
ditio
ns, com
mun
al borders, social
security zones, villages particularly difficult (De
cisio
n 551 /
QD-‐TTg, dated 04/04/2013) (****)
CEMA , M
PI, M
OF, M
ARD, M
OLISA
, Ministry of Inform
ation &
Commun
ication, Peop
le’s Co
mmittees
of provinces
and
citie
s und
er central autho
rities.
x
Electricity
66. P
lann
ing for n
ational electricity develop
ment p
eriod 2011 –
2020, w
ith vision
to 2030(De
cisio
n dated 21/07/2011
1208/Q
D-‐TTg PM
's)
Ministry
of Co
mmerce,
MPI,
MOF, STAT
E BA
NK
OF
VIETNAM
, Vietnam Electricity,
PetroV
ietnam
, Vietnam
National
Coal -‐
Mineral Indu
strie
s Group
, Peop
le’s
Committees
of
provinces
and
citie
s un
der
central
authorities.
x
21Article 1c, Chaper III: Regulations of sup
porting nu
trition
for p
oor p
eople, especially poo
r wom
en and
children.

MultidiMensional Child Poverty of ethniC Minority Childrensituation, dynamics, and Challenges 129

Related Documents