MONTANA DEPARTMENT OF FISH, WILDLIFE AND PARKS FISHERIES DIVISION JOB PROGRESS REPORT STATE: MONTANA PROJECT TITLE: Statewide Fisheries Investigations PROJECT: F-78-R-5 STUDY TITLE: Survey and Inventory of Warmwater Streams JOB NO: III-B JOB TITLE: Southeast Montana Warmwater Streams Investigations PROJECT PERIOD: July 1, 1998 through October 2010 ABSTRACT The Yellowstone River fish assemblage was sampled annually each autumn with boat- mounted electrofishing equipment since 1998. Trend areas consisted of 5 different locations; Forsyth (downstream of Cartersville Diversion), Miles City (above and below the Tongue River confluence), Fallon (above and below the O’ Fallon Creek confluence), Intake (downstream of Intake Diversion) and since 2003, Hysham (downstream of Rancher diversion). Trend areas are approximately 9.6 river km in length and are sampled once in August, September and October. All species encountered are collected, enumerated, measured, and, excepting cyprinids, weighed. An index of abundance (catch per effort) was calculated for all species captured. Catch per effort was calculated by trend section for sauger, channel catfish, and smallmouth bass. Indices of population structure (incremental relative stock density) and condition (relative weight) were calculated for sauger, channel catfish, smallmouth bass, shovelnose sturgeon, burbot, and walleye. Environmental conditions varied widely during the study period; average flows occurred during 1998 and 1999, drought conditions and low flows occurred during 2000 to 2007 and average to above average flows returned in 2008 to 2010. The fish assemblage appeared to withstand the drought conditions and responded well when average/above average flows returned in 2008. Since 1998, 42 different species have been captured and abundances of commonly collected species from all trophic guilds remained stable or increased. Catch rates of multiple species including sauger and catfish were at all time high levels during the 2010 trend survey. Blue sucker abundances fluctuated annually but the trend remained stable through the duration of the study. Excellent angling opportunities currently exist for sauger, channel catfish, smallmouth bass, and shovelnose sturgeon.

Welcome message from author
This document is posted to help you gain knowledge. Please leave a comment to let me know what you think about it! Share it to your friends and learn new things together.
Transcript
MONTANA DEPARTMENT OF FISH, WILDLIFE AND PARKS
FISHERIES DIVISION
JOB PROGRESS REPORT STATE: MONTANA PROJECT TITLE: Statewide Fisheries Investigations PROJECT: F-78-R-5 STUDY TITLE: Survey and Inventory of Warmwater
Streams JOB NO: III-B JOB TITLE: Southeast Montana Warmwater Streams
Investigations PROJECT PERIOD: July 1, 1998 through October 2010
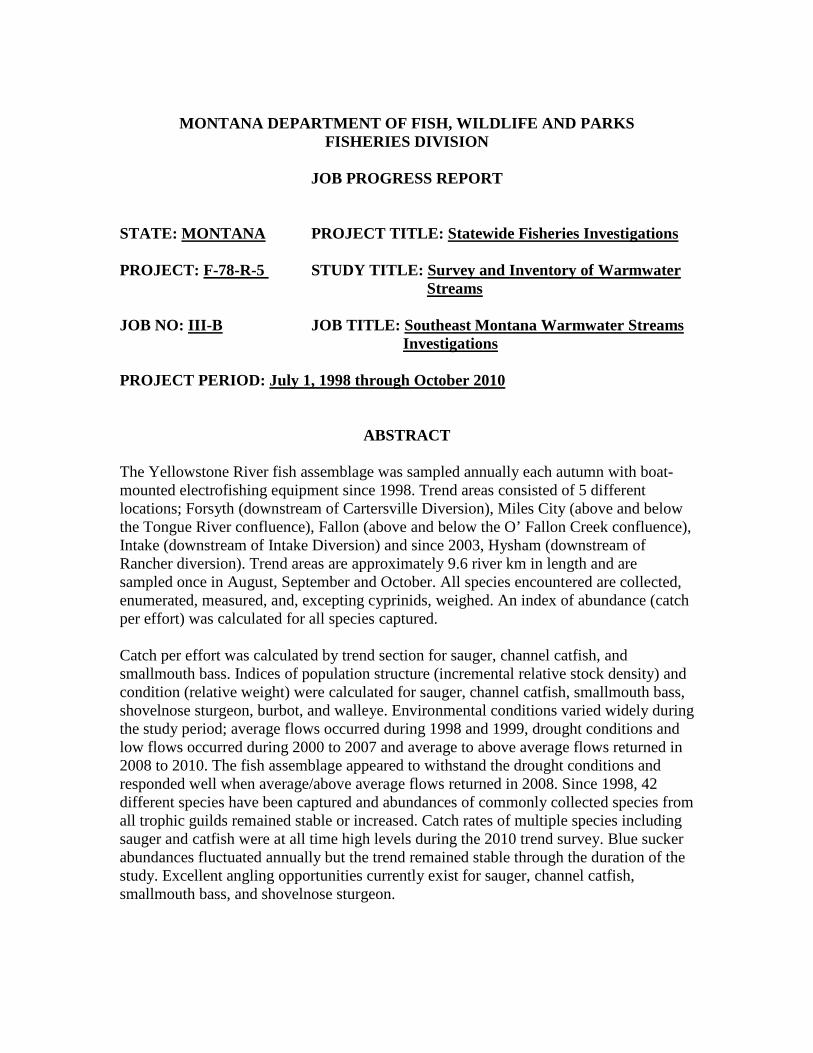
ABSTRACT The Yellowstone River fish assemblage was sampled annually each autumn with boat-mounted electrofishing equipment since 1998. Trend areas consisted of 5 different locations; Forsyth (downstream of Cartersville Diversion), Miles City (above and below the Tongue River confluence), Fallon (above and below the O’ Fallon Creek confluence), Intake (downstream of Intake Diversion) and since 2003, Hysham (downstream of Rancher diversion). Trend areas are approximately 9.6 river km in length and are sampled once in August, September and October. All species encountered are collected, enumerated, measured, and, excepting cyprinids, weighed. An index of abundance (catch per effort) was calculated for all species captured. Catch per effort was calculated by trend section for sauger, channel catfish, and smallmouth bass. Indices of population structure (incremental relative stock density) and condition (relative weight) were calculated for sauger, channel catfish, smallmouth bass, shovelnose sturgeon, burbot, and walleye. Environmental conditions varied widely during the study period; average flows occurred during 1998 and 1999, drought conditions and low flows occurred during 2000 to 2007 and average to above average flows returned in 2008 to 2010. The fish assemblage appeared to withstand the drought conditions and responded well when average/above average flows returned in 2008. Since 1998, 42 different species have been captured and abundances of commonly collected species from all trophic guilds remained stable or increased. Catch rates of multiple species including sauger and catfish were at all time high levels during the 2010 trend survey. Blue sucker abundances fluctuated annually but the trend remained stable through the duration of the study. Excellent angling opportunities currently exist for sauger, channel catfish, smallmouth bass, and shovelnose sturgeon.
2
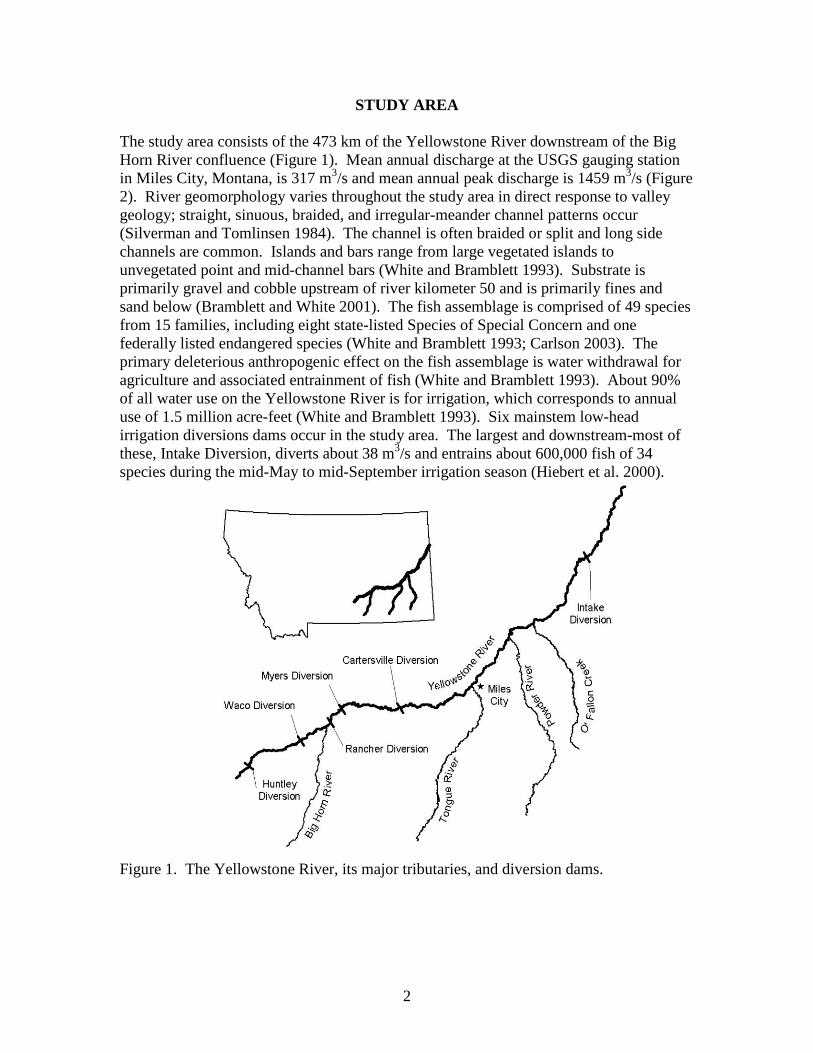
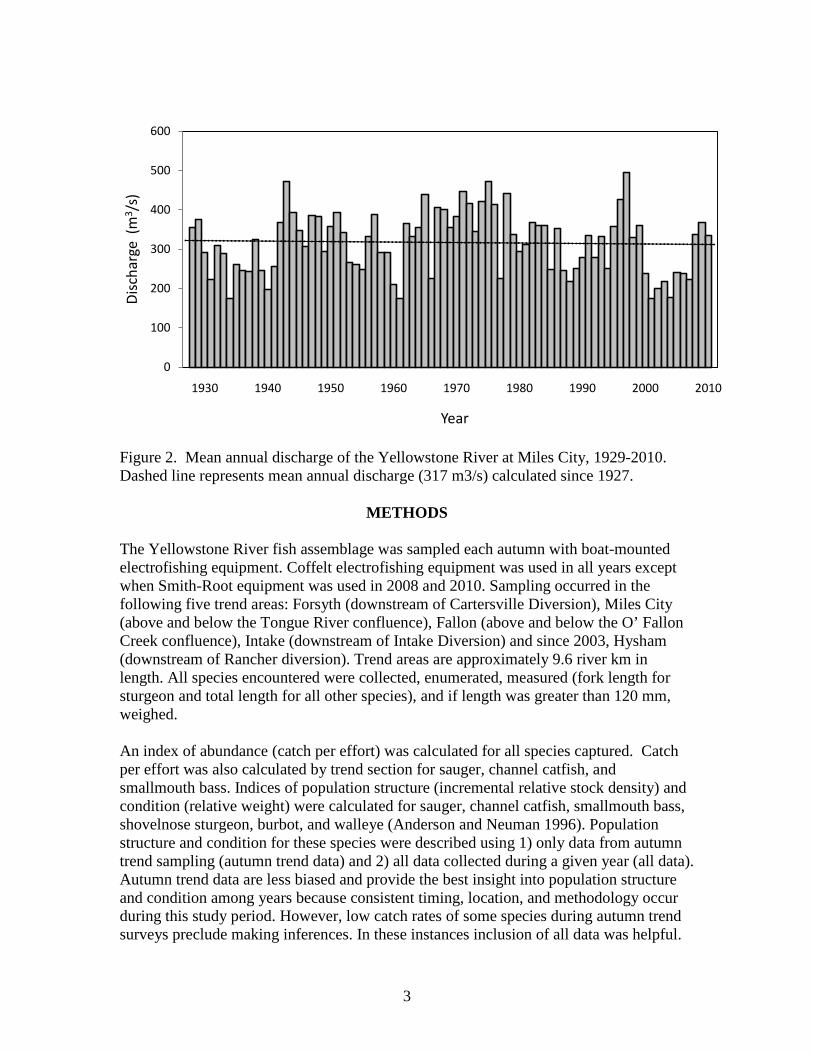
STUDY AREA The study area consists of the 473 km of the Yellowstone River downstream of the Big Horn River confluence (Figure 1). Mean annual discharge at the USGS gauging station in Miles City, Montana, is 317 m3/s and mean annual peak discharge is 1459 m3/s (Figure 2). River geomorphology varies throughout the study area in direct response to valley geology; straight, sinuous, braided, and irregular-meander channel patterns occur (Silverman and Tomlinsen 1984). The channel is often braided or split and long side channels are common. Islands and bars range from large vegetated islands to unvegetated point and mid-channel bars (White and Bramblett 1993). Substrate is primarily gravel and cobble upstream of river kilometer 50 and is primarily fines and sand below (Bramblett and White 2001). The fish assemblage is comprised of 49 species from 15 families, including eight state-listed Species of Special Concern and one federally listed endangered species (White and Bramblett 1993; Carlson 2003). The primary deleterious anthropogenic effect on the fish assemblage is water withdrawal for agriculture and associated entrainment of fish (White and Bramblett 1993). About 90% of all water use on the Yellowstone River is for irrigation, which corresponds to annual use of 1.5 million acre-feet (White and Bramblett 1993). Six mainstem low-head irrigation diversions dams occur in the study area. The largest and downstream-most of these, Intake Diversion, diverts about 38 m3/s and entrains about 600,000 fish of 34 species during the mid-May to mid-September irrigation season (Hiebert et al. 2000).
Figure 1. The Yellowstone River, its major tributaries, and diversion dams.
3
Figure 2. Mean annual discharge of the Yellowstone River at Miles City, 1929-2010. Dashed line represents mean annual discharge (317 m3/s) calculated since 1927.
METHODS The Yellowstone River fish assemblage was sampled each autumn with boat-mounted electrofishing equipment. Coffelt electrofishing equipment was used in all years except when Smith-Root equipment was used in 2008 and 2010. Sampling occurred in the following five trend areas: Forsyth (downstream of Cartersville Diversion), Miles City (above and below the Tongue River confluence), Fallon (above and below the O’ Fallon Creek confluence), Intake (downstream of Intake Diversion) and since 2003, Hysham (downstream of Rancher diversion). Trend areas are approximately 9.6 river km in length. All species encountered were collected, enumerated, measured (fork length for sturgeon and total length for all other species), and if length was greater than 120 mm, weighed. An index of abundance (catch per effort) was calculated for all species captured. Catch per effort was also calculated by trend section for sauger, channel catfish, and smallmouth bass. Indices of population structure (incremental relative stock density) and condition (relative weight) were calculated for sauger, channel catfish, smallmouth bass, shovelnose sturgeon, burbot, and walleye (Anderson and Neuman 1996). Population structure and condition for these species were described using 1) only data from autumn trend sampling (autumn trend data) and 2) all data collected during a given year (all data). Autumn trend data are less biased and provide the best insight into population structure and condition among years because consistent timing, location, and methodology occur during this study period. However, low catch rates of some species during autumn trend surveys preclude making inferences. In these instances inclusion of all data was helpful.
0
100
200
300
400
500
600
1930 1940 1950 1960 1970 1980 1990 2000 2010
Dis
char
ge (
m3 /
s)
Year

4
RESULTS AND DISCUSSION
To date, 42 different species have been captured. Catch by section is summarized in Appendix 1. Conditions varied widely during the study period; average to above average flows occurred in 1998, 1999 and 2008 to 2010. Drought conditions and low flows occurred during 2000 to 2007 (Figure 2). The fish assemblage appeared to withstand drought conditions well. Abundances of commonly collected species from all trophic guilds remained stable or increased. Catch rates of multiple species including sauger and catfish were at all time highs during the 2010 trend survey. Population structure and size-specific condition of sauger, channel catfish, smallmouth bass, and shovelnose sturgeon were consistent among years. Electrofishing gear varied during the duration of the study. High variability between sampling condition and year is inherent; therefore, trends observed for populations over time were more useful than trends in any given year. Sauger Sauger were the most commonly observed game fish and catch rates averaged over 7 fish per hour from 1998 to 2010 excluding 1999 (Figure 3). Catch rates averaged about 12 fish per hour in the 1970s and 1980s but declined to about 2 fish per hour from 1990 to 1997, leading to the listing of sauger as a Species of Special Concern in Montana (McMahon and Gardner 2001). Catch rates have improved and are greater than pre-decline levels. Catch rates of over 10 fish per hour were observed in six of the last ten years and the population is trending upwards. Catch rates of about 10 fish per hour support a good sauger fishery (McMahon 1999). Catch rates in 2008 and 2010 were over 21 and 23 fish per hour respectively. High average catch rates observed were inflated by the trend area downstream of Intake Diversion. Increased catch rates above 10 fish per hour occurred in multiple survey reaches in 2008 and 2010. Sauger catch rate downstream of Intake Diversion was a historic high, 76 fish per hour in 2010 (Figure 4).
Year
1998 2000 2002 2004 2006 2008 2010
C/f (
fish
per h
our)
0
5
10
15
20
25
Figure 3. Catch per effort of sauger in the Yellowstone River, 1998 to 20

5
Year
1998 2000 2002 2004 2006 2008 2010
C/f
(fish
per
hou
r)
0
20
40
60
80
100
Rancher Forsyth Miles City Fallon Intake
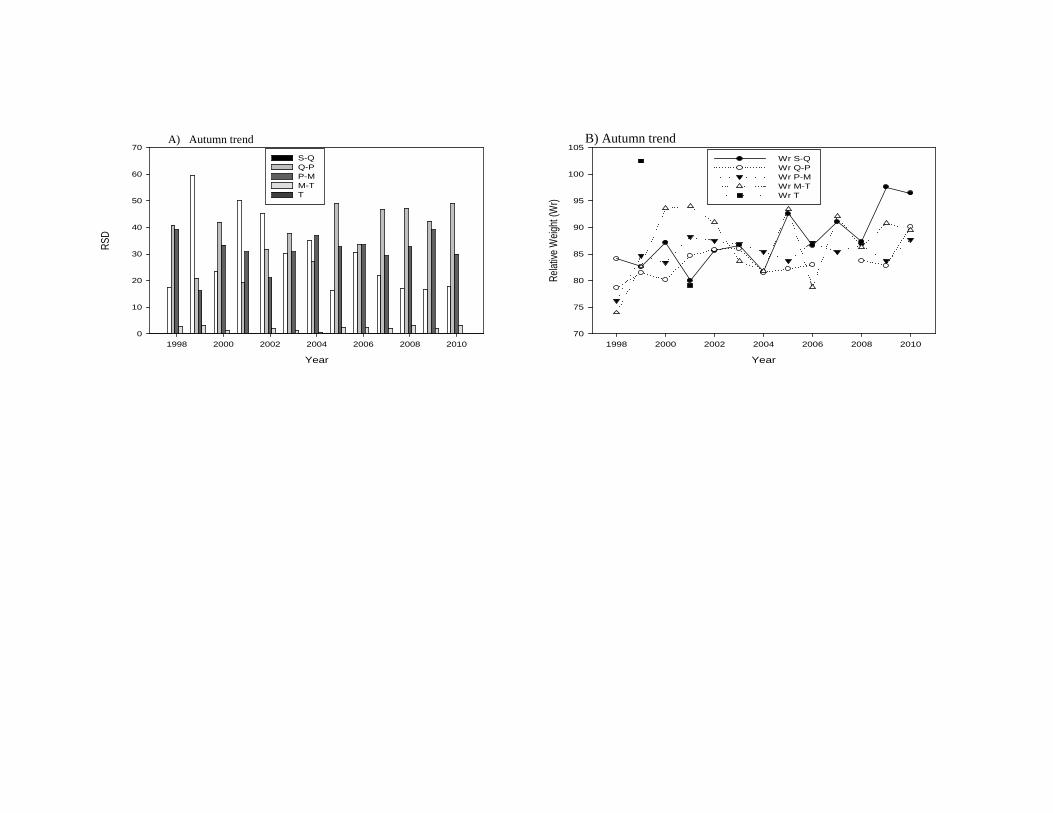
Figure 4. Catch per effort of sauger in the Yellowstone River by trend area, 1998 to 2010. Population structure was balanced from 1998 to 2010 but skewed towards larger fish (Figure 5 A, C). It is likely that this sampling regime (autumn electrofishing) is proportionally biased towards larger size-classes. Balanced population structure is observed following years when trend survey documented few young fish present in the population structure, thereby it can be assumed young, smaller fish were present but not sampled. Most juvenile sauger likely rear downstream of Intake Diversion (Penkal 1992) and autumn trend sampling reflects this. Proportionately low representation of smaller size-classes may result from proportionately low effort in rearing areas downstream of Intake Diversion. Most additional data were collected during early spring efforts to capture spawning sauger and are biased proportionally towards large fish. Drifted trammel nets, drifted gill nets and hook and line were the dominant gears deployed in spring. Size-specific relative weights are stable among years (Figure 5 B, D).
Year
1998 2000 2002 2004 2006 2008 2010
RSD
0
10
20
30
40
50
60
70S-Q Q-P P-M M-T T
Year
1998 2000 2002 2004 2006 2008 2010
Relat
ive W
eight
(Wr)
70
75
80
85
90
95
100
105Wr S-Q Wr Q-P Wr P-M Wr M-T Wr T
A) Autumn trend
B) Autumn trend

7
Year
1998 2000 2002 2004 2006 2008 2010
RSD
0
10
20
30
40
50
60
S-Q Q-P P-M M-T T
Year
1998 2000 2002 2004 2006 2008 2010
Relat
ive W
eight
(Wr)
70
75
80
85
90
95
100
105Wr S-Q Wr Q-P Wr P-M Wr M-T Wr T
Figure 5. Incremental relative stock density (RSD) and relative weight (Wr) by length category of sauger captured in the Yellowstone River, 1998 to 2010
C) All data D) All data

Sauger are a highly sought after species on the Yellowstone River and despite record high catch rates observed in 2008 and 2010 trend work, the population should continue to be closely monitored. Research concluding in 2004 documented that exploitation (18.6%) is unlikely to significantly affect this population during most years but is high enough that angler harvest should be monitored (Jaeger 2004). Floy T-bar tags have been installed in sauger since 1997. Sauger were tagged during spring spawning aggregation. It was assumed that tagged fish randomly redistributed in the Yellowstone River, decreasing tag return bias. Since 2005, spring tagging efforts resulted in 2,728 tagged sauger. Of these, 185 were caught by anglers and 128 of these fish were harvested (Table 1) Given that survival of adult fish is high (70.4%), increasing recruitment of juveniles to the adult population would further increase adult abundances barring compensatory responses (Jaeger 2004). Increasing recruitment of juveniles to the adult population can be best achieved by eliminating entrainment in Intake Canal. Construction began in 2010 to install fish screens on the Intake head gates that will prevent entrainment of fishes at Intake Diversion. The head gate structure is anticipated to be completed and functional for the 2012 irrigation season. About 67,000 sauger, most of which are juveniles, are entrained in Intake Canal each year (Hiebert et al. 2000). This corresponds to a loss of over 13,000 five-fish angler limits annually. Completion of this project will prevent sauger entrainment but more importantly prevent entrainment of nearly 600,000 fish of 34 species during the mid-May to mid-September irrigation season. Another threat to the sauger population is nonnative smallmouth bass. Expanding populations of nonnative smallmouth bass may adversely affect sauger abundances. Sauger abundances are significantly negatively correlated with smallmouth bass abundances (P = 0.004; Figure 6). Smallmouth bass have replaced sauger as the most common top predator in the Forsyth trend area. Smallmouth bass replaced sauger as the top predator in Miles City trend area until 2010 when above average flows returned (Figures 4 and 16). Smallmouth bass replaced sauger as the most common top predator in the Tongue and upper Missouri rivers following impoundment and resultant decrease in turbidity and alteration of natural hydrographs (McMahon and Gardner 2001). Loss of the natural hydrograph and warm, turbid prairie stream character of the Big Horn River combined with increasing prevalence of stream bank armoring of the Yellowstone River likely create conditions that favor smallmouth bass over sauger. Drought conditions until 2007 likely exacerbated these losses and observed increases in smallmouth bass abundances coincide with low flows.
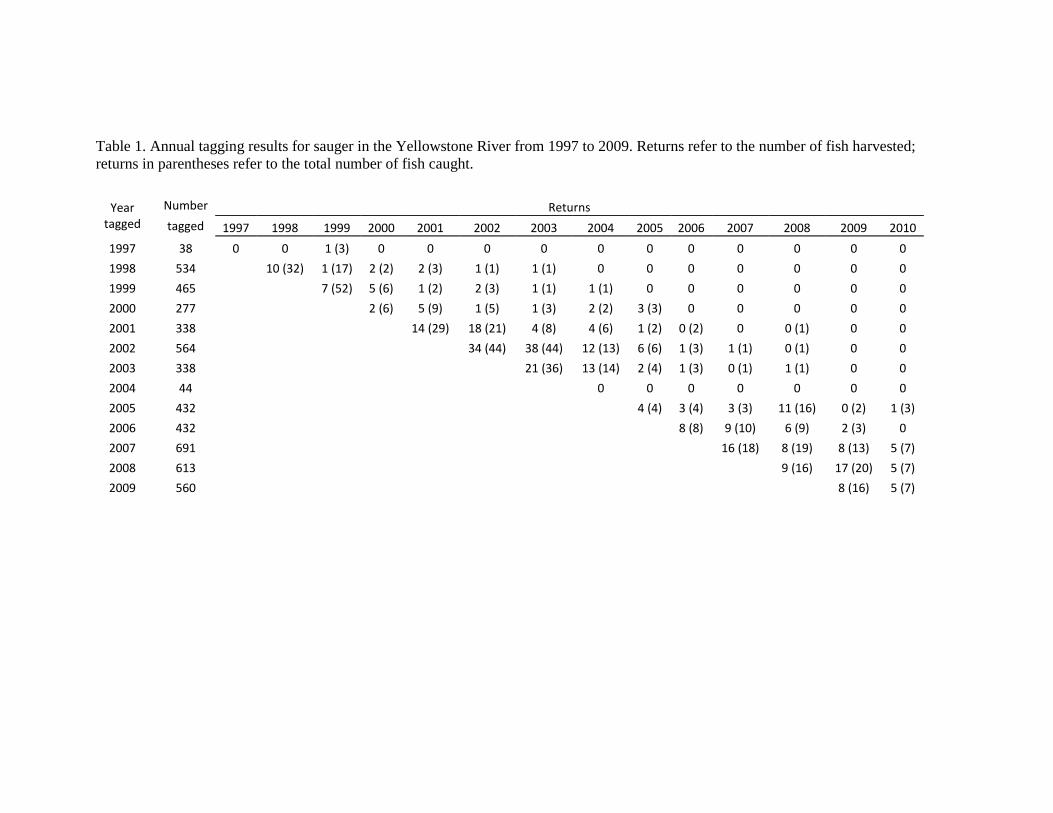
Table 1. Annual tagging results for sauger in the Yellowstone River from 1997 to 2009. Returns refer to the number of fish harvested; returns in parentheses refer to the total number of fish caught.
Year tagged
Number Returns tagged 1997 1998 1999 2000 2001 2002 2003 2004 2005 2006 2007 2008 2009 2010
1997 38 0 0 1 (3) 0 0 0 0 0 0 0 0 0 0 0
1998 534
10 (32) 1 (17) 2 (2) 2 (3) 1 (1) 1 (1) 0 0 0 0 0 0 0
1999 465
7 (52) 5 (6) 1 (2) 2 (3) 1 (1) 1 (1) 0 0 0 0 0 0
2000 277
2 (6) 5 (9) 1 (5) 1 (3) 2 (2) 3 (3) 0 0 0 0 0
2001 338
14 (29) 18 (21) 4 (8) 4 (6) 1 (2) 0 (2) 0 0 (1) 0 0
2002 564
34 (44) 38 (44) 12 (13) 6 (6) 1 (3) 1 (1) 0 (1) 0 0
2003 338
21 (36) 13 (14) 2 (4) 1 (3) 0 (1) 1 (1) 0 0
2004 44
0 0 0 0 0 0 0
2005 432
4 (4) 3 (4) 3 (3) 11 (16) 0 (2) 1 (3)
2006 432
8 (8) 9 (10) 6 (9) 2 (3) 0
2007 691
16 (18) 8 (19) 8 (13) 5 (7)
2008 613
9 (16) 17 (20) 5 (7)
2009 560
8 (16) 5 (7)
Log10 Smallmouth bass C/f
-1.5 -1.0 -0.5 0.0 0.5 1.0 1.5 2.0
Log1
0 S
auge
r C/f
-1.0
-0.5
0.0
0.5
1.0
1.5
2.0
P= 0.004R Suared= 0.191
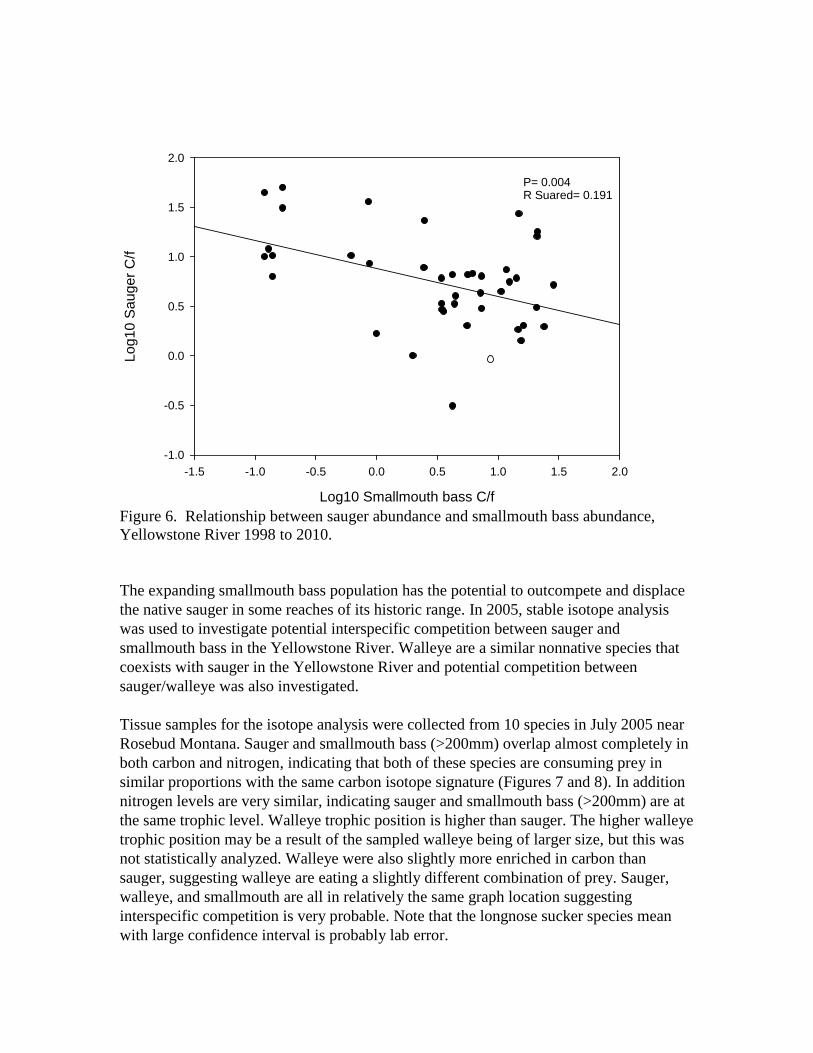
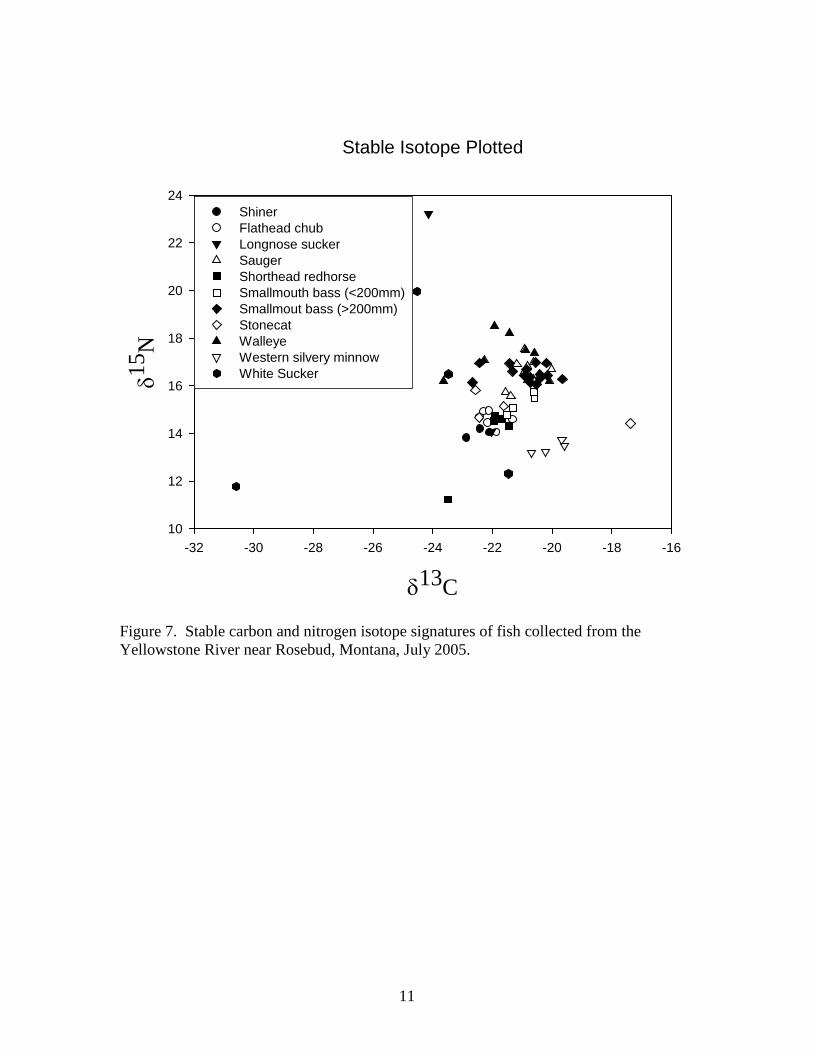
Figure 6. Relationship between sauger abundance and smallmouth bass abundance, Yellowstone River 1998 to 2010. The expanding smallmouth bass population has the potential to outcompete and displace the native sauger in some reaches of its historic range. In 2005, stable isotope analysis was used to investigate potential interspecific competition between sauger and smallmouth bass in the Yellowstone River. Walleye are a similar nonnative species that coexists with sauger in the Yellowstone River and potential competition between sauger/walleye was also investigated. Tissue samples for the isotope analysis were collected from 10 species in July 2005 near Rosebud Montana. Sauger and smallmouth bass (>200mm) overlap almost completely in both carbon and nitrogen, indicating that both of these species are consuming prey in similar proportions with the same carbon isotope signature (Figures 7 and 8). In addition nitrogen levels are very similar, indicating sauger and smallmouth bass (>200mm) are at the same trophic level. Walleye trophic position is higher than sauger. The higher walleye trophic position may be a result of the sampled walleye being of larger size, but this was not statistically analyzed. Walleye were also slightly more enriched in carbon than sauger, suggesting walleye are eating a slightly different combination of prey. Sauger, walleye, and smallmouth are all in relatively the same graph location suggesting interspecific competition is very probable. Note that the longnose sucker species mean with large confidence interval is probably lab error.
11
Stable Isotope Plotted
δ13C
-32 -30 -28 -26 -24 -22 -20 -18 -16
δ15 N
10
12
14
16
18
20
22
24ShinerFlathead chubLongnose suckerSauger Shorthead redhorseSmallmouth bass (<200mm)Smallmout bass (>200mm)StonecatWalleyeWestern silvery minnow White Sucker
Figure 7. Stable carbon and nitrogen isotope signatures of fish collected from the Yellowstone River near Rosebud, Montana, July 2005.

12
Stable Isotope Plotted by Species Mean
δ13C
-32 -30 -28 -26 -24 -22 -20 -18 -16
δ15 N
10
12
14
16
18
20
22
24
LNS
WS
WSM
WAE
SGR
SMB >200mmSMB <200mm
SCFHC
SHR
ES
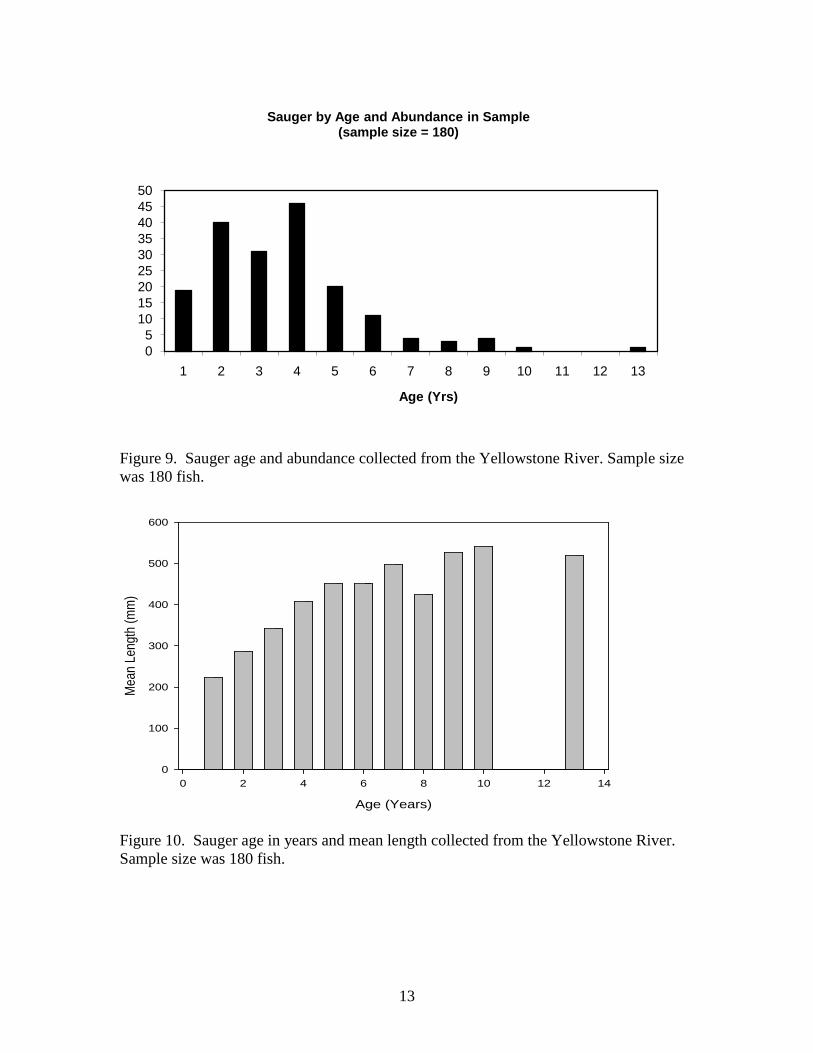
Figure 8. Stable carbon and nitrogen isotope signatures of fish collected from the Yellowstone River near Rosebud, Montana, July 2005. Species are walleye (WAE), sauger (SGR), smallmouth bass (SMB), stonecat (SC), longnose sucker (LNS), white sucker (WS), flathead chub (FHC), shorthead redhorse (SHR), emerald shiner (ES), and western silvery minnow (WSM). Error bars represent one standard error. Population dynamics of sauger were further analyzed by investigating length age relationships of sauger. Aging structures were removed from sauger in 2002 to document length frequency and age distributions within the sauger population. Majority of sauger were sampled during spring tagging effort in April and May. The remainder of the aging structures were collected in August. There were 213 sauger-aging structures collected but only 180 collected samples sufficed for proper accurate age identification. Age 4 sauger were the most prolific in abundance, followed by age 2 sauger and then age 3 sauger (Figure 9). The oldest aged sauger was estimated 13 years of age and measured 520 mm. Age 1 sauger had a mean length of 223 mm, age 2 sauger had a mean length of 287 mm, age 3 sauger had a mean length of 342 mm, age 4 sauger had a mean length of 408 mm, and age 5 sauger had a mean length of 452 mm (Figure 10). Sauger sampled downstream of Intake Diversion Dam were younger and smaller than sauger sampled above intake diversion dam (Figure 11). Interpretation of sauger length frequency and abundance by age suggests the sauger population was stable in 2002.
13
Figure 9. Sauger age and abundance collected from the Yellowstone River. Sample size was 180 fish.
Age (Years)
0 2 4 6 8 10 12 14
Mea
n Le
ngth
(mm
)
0
100
200
300
400
500
600
Figure 10. Sauger age in years and mean length collected from the Yellowstone River. Sample size was 180 fish.
05
101520253035404550
1 2 3 4 5 6 7 8 9 10 11 12 13
Age (Yrs)
Sauger by Age and Abundance in Sample (sample size = 180)

14
Figure 11. Length-frequency distribution of sauger collected from the Yellowstone River. Upstream and downstream of Intake diversion dam. Sauger mean age is represented with dashed vertical line.
0
2
4
6
8
10
1214 19 24 29 34 39 44 49 54 59
Num
ber o
f Fis
h
Total Length (cm)
Length Frequency of Sauger from Yellowstone River in 2002
Upstream Intake
Downstream Intake
Age 1 Mean
Age 2 Mean
Age 3Mean
Age 4Mean
Age 1 Mean
Age 2 Mean
Age 3Mean
Age 4Mean
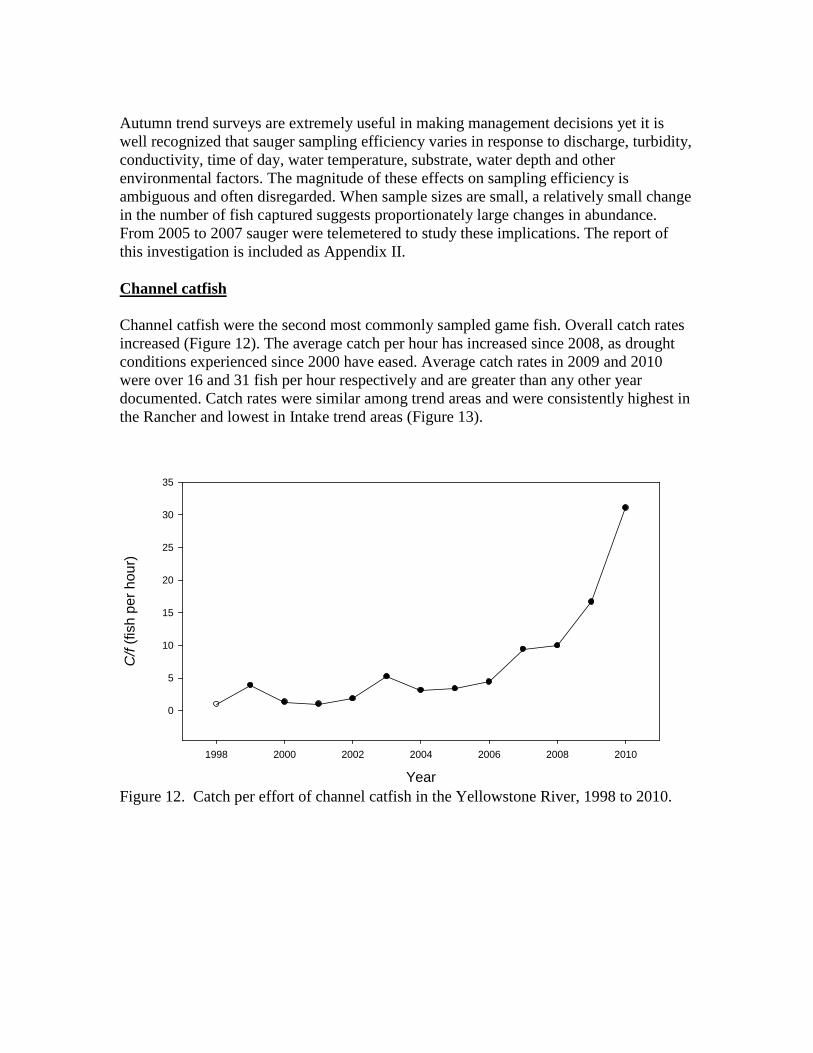
Autumn trend surveys are extremely useful in making management decisions yet it is well recognized that sauger sampling efficiency varies in response to discharge, turbidity, conductivity, time of day, water temperature, substrate, water depth and other environmental factors. The magnitude of these effects on sampling efficiency is ambiguous and often disregarded. When sample sizes are small, a relatively small change in the number of fish captured suggests proportionately large changes in abundance. From 2005 to 2007 sauger were telemetered to study these implications. The report of this investigation is included as Appendix II. Channel catfish Channel catfish were the second most commonly sampled game fish. Overall catch rates increased (Figure 12). The average catch per hour has increased since 2008, as drought conditions experienced since 2000 have eased. Average catch rates in 2009 and 2010 were over 16 and 31 fish per hour respectively and are greater than any other year documented. Catch rates were similar among trend areas and were consistently highest in the Rancher and lowest in Intake trend areas (Figure 13).
Year
1998 2000 2002 2004 2006 2008 2010
C/f
(fish
per
hou
r)
0
5
10
15
20
25
30
35
Figure 12. Catch per effort of channel catfish in the Yellowstone River, 1998 to 2010.

16
Year
1998 2000 2002 2004 2006 2008 2010
C/f
(fish
per
hou
r)
0
10
20
30
40
50
60
Rancher Forsyth Miles City Fallon Intake
Figure 13. Catch per effort of channel catfish in the Yellowstone River by trend area, 1998 to 2010. Condition of fish was relatively high during all years but has less fluctuation between size classes than previous years (Figure 14 B, D). Population structure remains very stable (Figure 14 A, C). Low proportions of stock to quality size fish suggests that smaller size classes had not fully recruited to the sampling gear (i.e. larger fish are more susceptible to electrofishing) or rear in un-sampled areas (i.e. deep pools, tributaries). Nonetheless, the stability of the observed population structure suggests that recruitment is not limiting. Fish were predominately quality to preferred size (410-610 mm) but about 11% were preferred to memorable (610-710 mm) and about 1% were memorable to trophy size (710-910 mm).

Year
1998 2000 2002 2004 2006 2008 2010
RSD
0
20
40
60
80S-Q Q-P P-M M-T T
Year
1998 2000 2002 2004 2006 2008 2010
Relat
ive W
eight
(Wr)
80
90
100
110
120
130
Wr S-Q Wr Q-P Wr P-M Wr M-T Wr T
A) Autumn trend B) Autumn trend

18
Year
1998 2000 2002 2004 2006 2008 2010
RSD
0
20
40
60
S-Q Q-P P-M M-T T
Year
1998 2000 2002 2004 2006 2008 2010
Relat
ive W
eight
(Wr)
85
90
95
100
105
110
115
120
125
Wr S-Q Wr Q-P Wr P-M Wr M-T Wr T
Figure 14. Incremental relative stock density (RSD) and relative weight (Wr) by length category of channel catfish captured in the Yellowstone River, 1998 to 2010.
C) All data D) All data
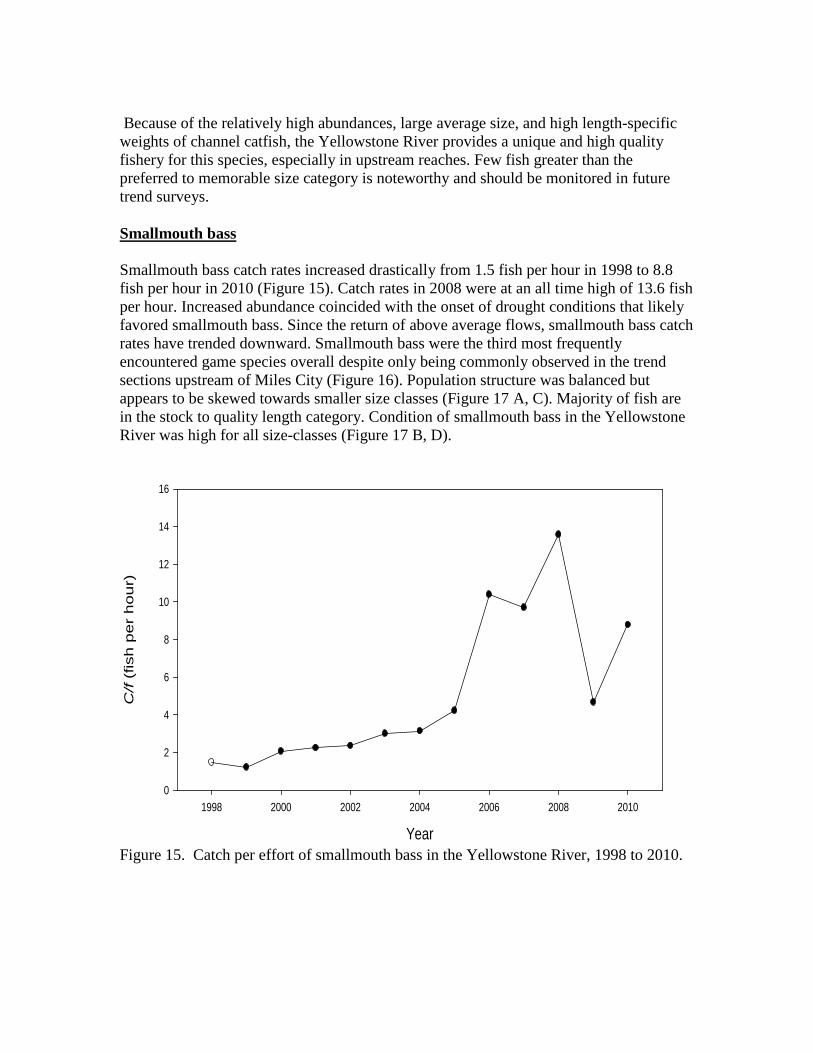
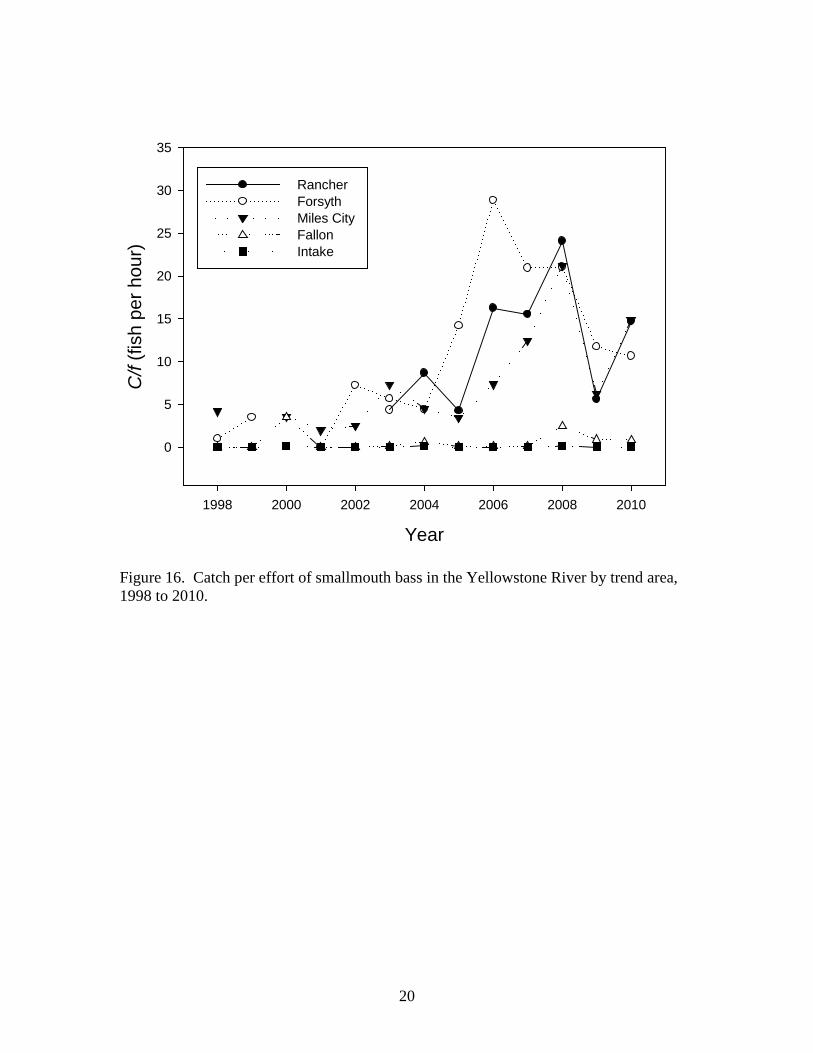
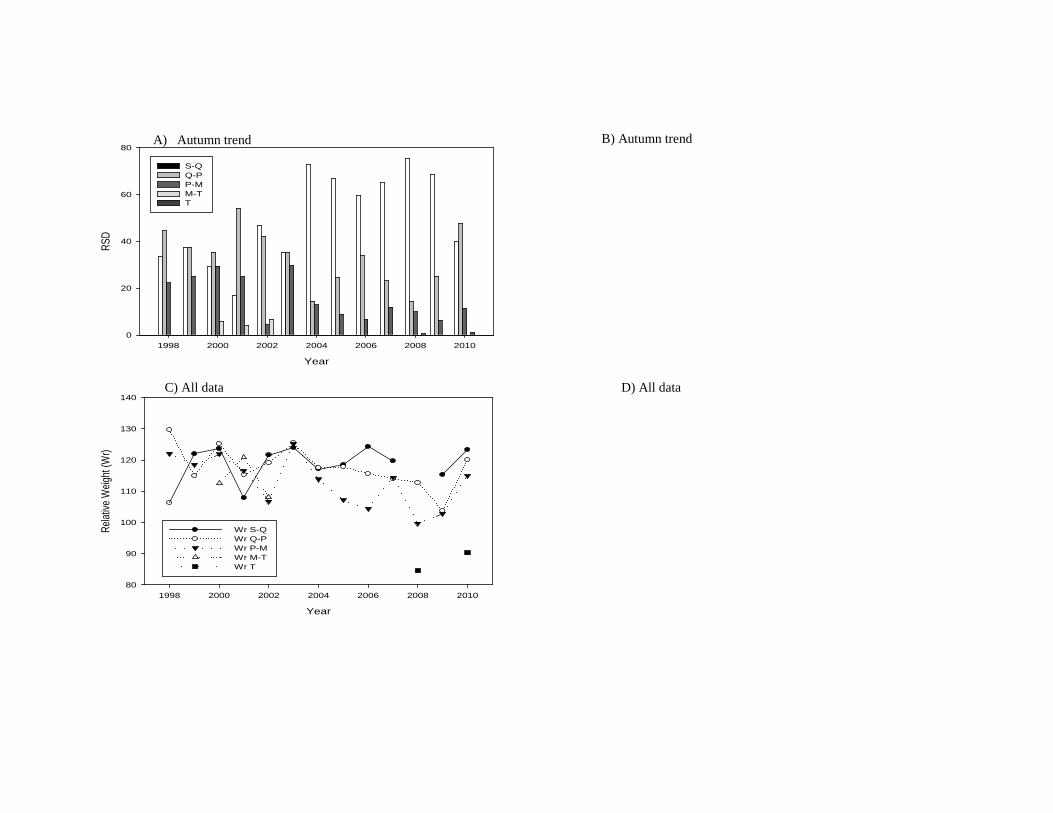
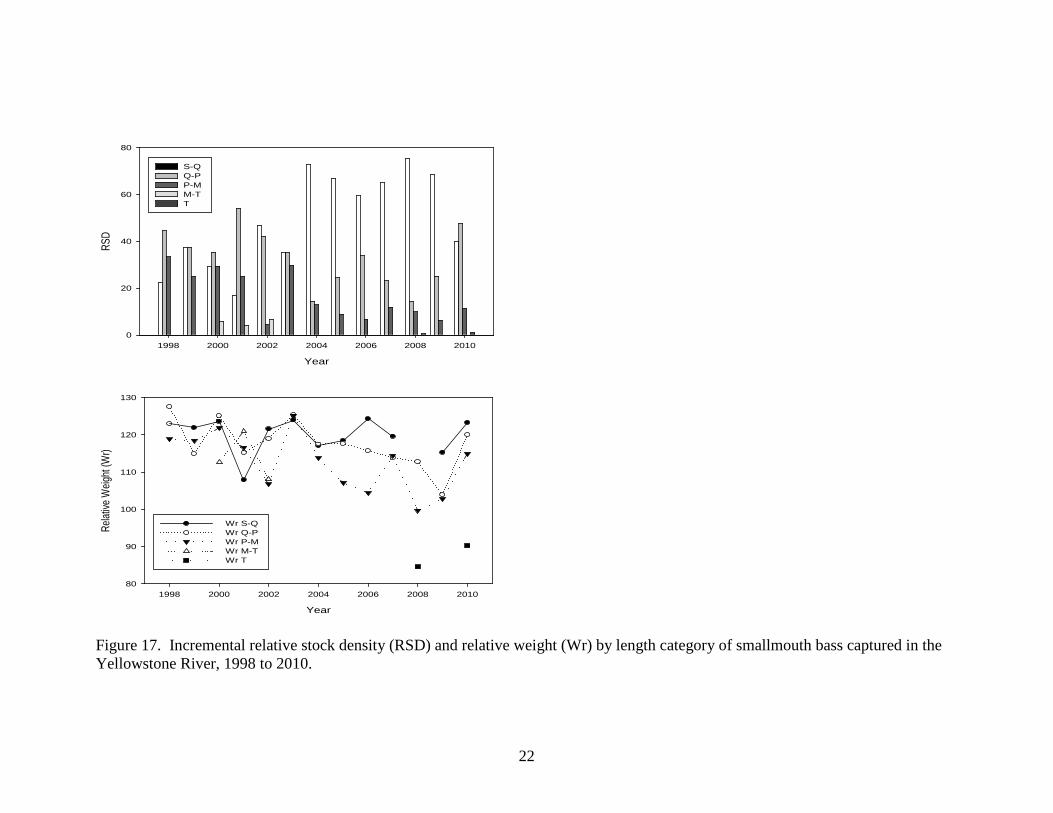
Because of the relatively high abundances, large average size, and high length-specific weights of channel catfish, the Yellowstone River provides a unique and high quality fishery for this species, especially in upstream reaches. Few fish greater than the preferred to memorable size category is noteworthy and should be monitored in future trend surveys. Smallmouth bass Smallmouth bass catch rates increased drastically from 1.5 fish per hour in 1998 to 8.8 fish per hour in 2010 (Figure 15). Catch rates in 2008 were at an all time high of 13.6 fish per hour. Increased abundance coincided with the onset of drought conditions that likely favored smallmouth bass. Since the return of above average flows, smallmouth bass catch rates have trended downward. Smallmouth bass were the third most frequently encountered game species overall despite only being commonly observed in the trend sections upstream of Miles City (Figure 16). Population structure was balanced but appears to be skewed towards smaller size classes (Figure 17 A, C). Majority of fish are in the stock to quality length category. Condition of smallmouth bass in the Yellowstone River was high for all size-classes (Figure 17 B, D).
Year
1998 2000 2002 2004 2006 2008 2010
C/f (
fish
pe
r h
ou
r)
0
2
4
6
8
10
12
14
16
Figure 15. Catch per effort of smallmouth bass in the Yellowstone River, 1998 to 2010.
20
Year
1998 2000 2002 2004 2006 2008 2010
C/f
(fish
per
hou
r)
0
5
10
15
20
25
30
35
Rancher Forsyth Miles City Fallon Intake
Figure 16. Catch per effort of smallmouth bass in the Yellowstone River by trend area, 1998 to 2010.
Year
1998 2000 2002 2004 2006 2008 2010
RSD
0
20
40
60
80
S-Q Q-P P-M M-T T
Year
1998 2000 2002 2004 2006 2008 2010
Relat
ive W
eight
(Wr)
80
90
100
110
120
130
140
Wr S-Q Wr Q-P Wr P-M Wr M-T Wr T
A) Autumn trend B) Autumn trend
C) All data D) All data
22
Year
1998 2000 2002 2004 2006 2008 2010
RSD
0
20
40
60
80
S-Q Q-P P-M M-T T
Year
1998 2000 2002 2004 2006 2008 2010
Relat
ive W
eight
(Wr)
80
90
100
110
120
130
Wr S-Q Wr Q-P Wr P-M Wr M-T Wr T
Figure 17. Incremental relative stock density (RSD) and relative weight (Wr) by length category of smallmouth bass captured in the Yellowstone River, 1998 to 2010.
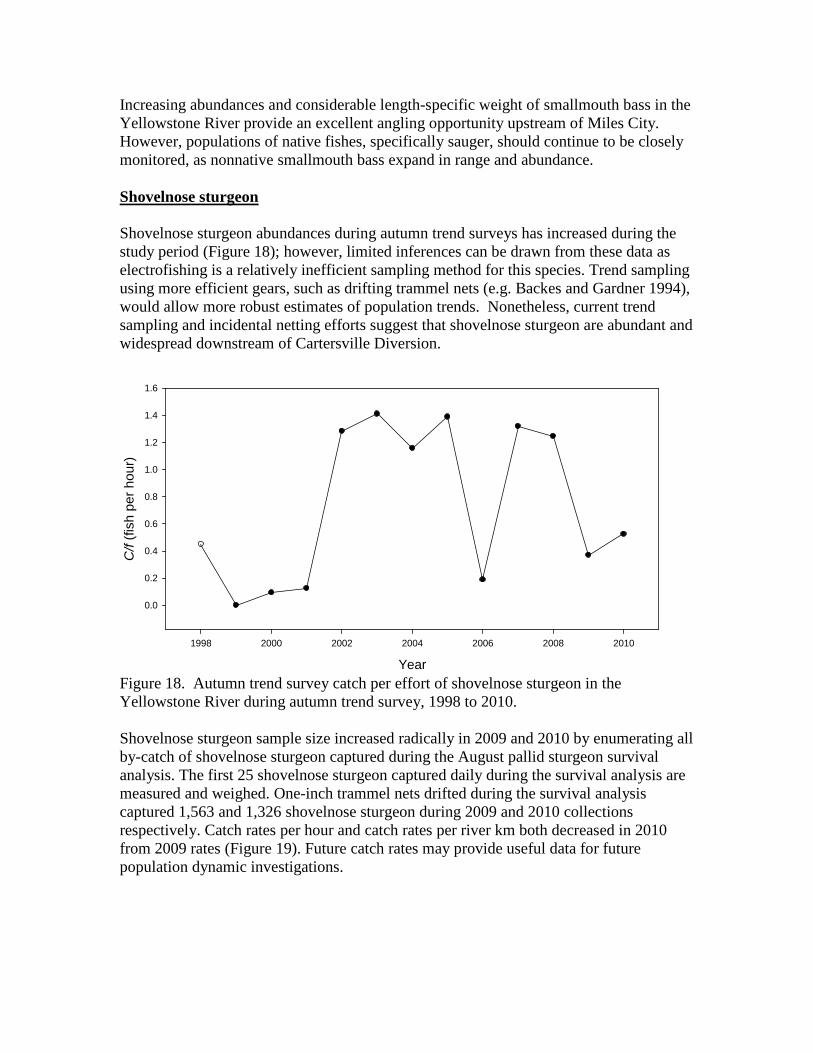
Increasing abundances and considerable length-specific weight of smallmouth bass in the Yellowstone River provide an excellent angling opportunity upstream of Miles City. However, populations of native fishes, specifically sauger, should continue to be closely monitored, as nonnative smallmouth bass expand in range and abundance. Shovelnose sturgeon Shovelnose sturgeon abundances during autumn trend surveys has increased during the study period (Figure 18); however, limited inferences can be drawn from these data as electrofishing is a relatively inefficient sampling method for this species. Trend sampling using more efficient gears, such as drifting trammel nets (e.g. Backes and Gardner 1994), would allow more robust estimates of population trends. Nonetheless, current trend sampling and incidental netting efforts suggest that shovelnose sturgeon are abundant and widespread downstream of Cartersville Diversion.
Year
1998 2000 2002 2004 2006 2008 2010
C/f
(fish
per
hou
r)
0.0
0.2
0.4
0.6
0.8
1.0
1.2
1.4
1.6
Figure 18. Autumn trend survey catch per effort of shovelnose sturgeon in the Yellowstone River during autumn trend survey, 1998 to 2010. Shovelnose sturgeon sample size increased radically in 2009 and 2010 by enumerating all by-catch of shovelnose sturgeon captured during the August pallid sturgeon survival analysis. The first 25 shovelnose sturgeon captured daily during the survival analysis are measured and weighed. One-inch trammel nets drifted during the survival analysis captured 1,563 and 1,326 shovelnose sturgeon during 2009 and 2010 collections respectively. Catch rates per hour and catch rates per river km both decreased in 2010 from 2009 rates (Figure 19). Future catch rates may provide useful data for future population dynamic investigations.

24
Year
2009 2009 2009 2010 2010 2010
C/f
(cat
ch ra
te)
10
15
20
25
30
35
40
45
C/f per hour C/f per km
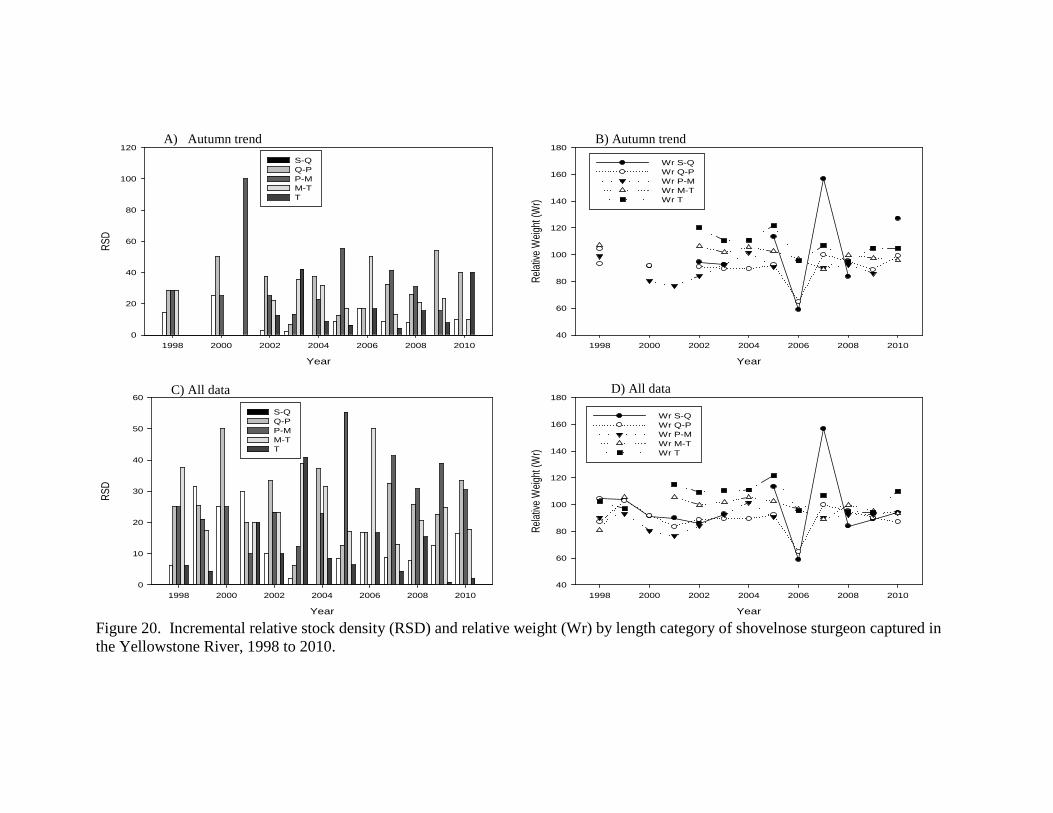
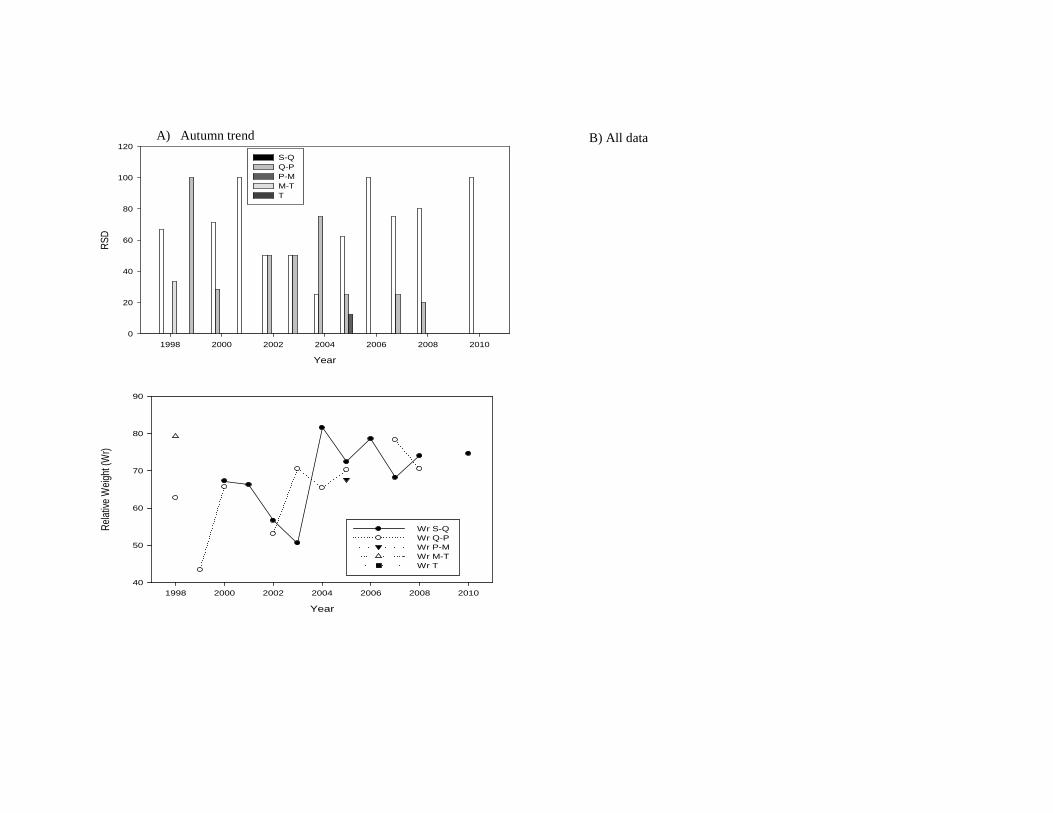
Figure 19. Catch rates of shovelnose sturgeon in the Yellowstone River in 2009 and 2010 during the August survival analysis. Highly variable catch rates during trend sampling resulted in limited population structure and condition information (Figure 20 A, B). However, combining all available data for each year suggested that population structure is stable and balanced (Figure 20 C). Size-specific condition was stable among years and stabilized further in recent years likely in response to increased sample size from pallid sturgeon survival analysis collections (Figure 20 D).
Year
1998 2000 2002 2004 2006 2008 2010
RSD
0
20
40
60
80
100
120
S-Q Q-P P-M M-T T
Year
1998 2000 2002 2004 2006 2008 2010
Relat
ive W
eight
(Wr)
40
60
80
100
120
140
160
180
Wr S-Q Wr Q-P Wr P-M Wr M-T Wr T
Year
1998 2000 2002 2004 2006 2008 2010
RSD
0
10
20
30
40
50
60
S-Q Q-P P-M M-T T
Year
1998 2000 2002 2004 2006 2008 2010
Relat
ive W
eight
(Wr)
40
60
80
100
120
140
160
180
Wr S-Q Wr Q-P Wr P-M Wr M-T Wr T
Figure 20. Incremental relative stock density (RSD) and relative weight (Wr) by length category of shovelnose sturgeon captured in the Yellowstone River, 1998 to 2010.
A) Autumn trend B) Autumn trend
C) All data D) All data

Burbot Burbot catch rates were consistently low (Figure 21). Low catch rates were likely related to the timing and gear used for sampling; burbot are most effectively sampled with baited hoop nets in the early spring and late autumn (Jones-Wuellner and Guy 2004). However, it is also possible that burbot are limited by the relatively high summer temperatures of the lower Yellowstone River (e.g. Nikcevic et al. 2000) and the low catch rates observed accurately reflect low abundances. Electrofishing is an inefficient method for capturing burbot thereby, these autumn trend data likely only provide an indication of presence or absence.
Year
1998 2000 2002 2004 2006 2008 2010
C/f
(fish
per
hou
r)
0.00
0.05
0.10
0.15
0.20
0.25
0.30
0.35
Figure 21. Autumn trend survey catch per effort of burbot in the Yellowstone River, 1998 to 2010. Low catch rates also limit inferences related to population structure and condition. Most burbot sampled during the autumn trend surveys were relatively small and of poor condition (Figure 22 A, B). Despite the addition of all length and weight data the number of burbot sampled was low and limited inferences related to this data set (Figure 22 C, D). Different gear types and sampling times would be necessary to obtain an adequate sample size to characterize abundances, structure, and condition of this population.
Year
1998 2000 2002 2004 2006 2008 2010
RSD
0
20
40
60
80
100
120S-Q Q-P P-M M-T T
Year
1998 2000 2002 2004 2006 2008 2010
Relat
ive W
eight
(Wr)
40
50
60
70
80
90
Wr S-Q Wr Q-P Wr P-M Wr M-T Wr T
A) Autumn trend B) All data

28
Year
1998 2000 2002 2004 2006 2008 2010
RSD
0
20
40
60
80
100
120
S-Q Q-P P-M M-T T
Year
1998 2000 2002 2004 2006 2008 2010
Relat
ive W
eight
(Wr)
40
50
60
70
80
90
100Wr S-Q Wr Q-P Wr P-M Wr M-T Wr T
Figure 22. Incremental relative stock density (RSD) and relative weight (Wr) by length category of burbot captured in the Yellowstone River, 1998 to 2010.
C) Autumn trend D) All data
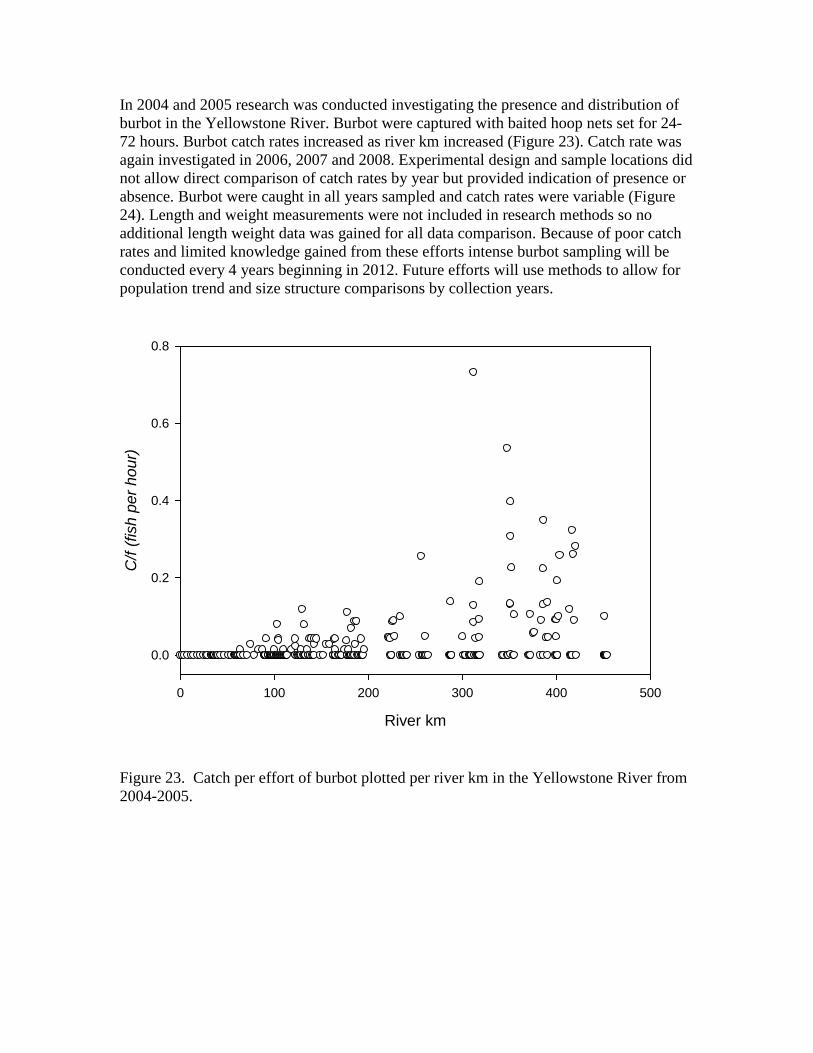
In 2004 and 2005 research was conducted investigating the presence and distribution of burbot in the Yellowstone River. Burbot were captured with baited hoop nets set for 24-72 hours. Burbot catch rates increased as river km increased (Figure 23). Catch rate was again investigated in 2006, 2007 and 2008. Experimental design and sample locations did not allow direct comparison of catch rates by year but provided indication of presence or absence. Burbot were caught in all years sampled and catch rates were variable (Figure 24). Length and weight measurements were not included in research methods so no additional length weight data was gained for all data comparison. Because of poor catch rates and limited knowledge gained from these efforts intense burbot sampling will be conducted every 4 years beginning in 2012. Future efforts will use methods to allow for population trend and size structure comparisons by collection years.
River km
0 100 200 300 400 500
C/f
(fish
per
hou
r)
0.0
0.2
0.4
0.6
0.8
Figure 23. Catch per effort of burbot plotted per river km in the Yellowstone River from 2004-2005.

30
Year
2004 2005 2006 2007 2008
C/f (
fish
per h
our)
0.004
0.006
0.008
0.010
0.012
0.014
0.016
0.018
0.020
Figure 24. Catch per effort of burbot using baited hoop nets in the Yellowstone River in 2004-2006 and 2008. Walleye Catch rates of walleye were consistently low from 1998 to 2007 and then trend upward since 2008 (Figure 25). Most walleye in the Yellowstone River were thought to be part of an adfluvial population residing in Sakakawea Reservoir (Penkal 1992). Adults move into the Yellowstone from late autumn to early spring, spawn during April, and return to the reservoir (Penkal 1992). In recent years, Sakakawea Reservoir water level has been elevated and the headwaters have been in closer than normal proximity to the Yellowstone River confluence. It is probable that the increased proximity to Sakakawea Reservoir headwaters may have influenced the upward trend of walleye in autumn trend surveys. This upward trend should be monitored closely and is of concern because of sauger/walleye hybridization potential and increased competition with native sauger as described in the stable isotope investigation.

31
Year
1998 2000 2002 2004 2006 2008 2010
C/f (
fish
pe
r h
ou
r)
0.0
0.2
0.4
0.6
0.8
1.0
1.2
1.4
1.6
1.8
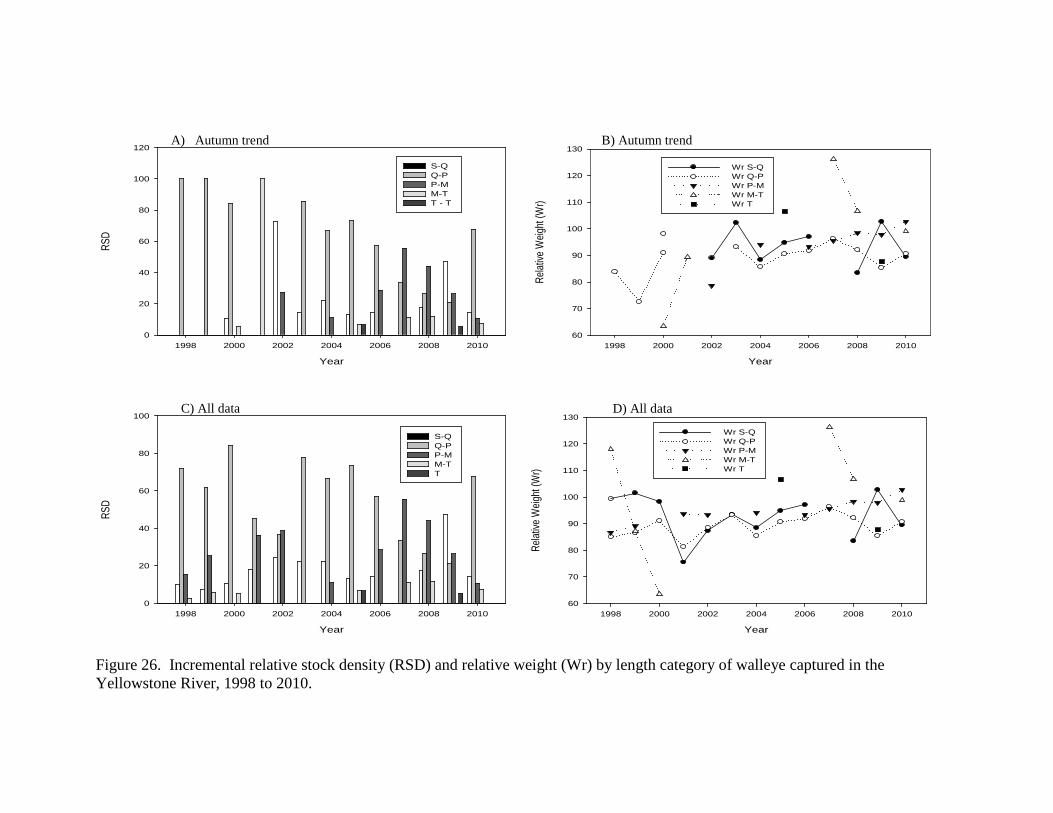
Figure 25. Catch per effort of walleye in the Yellowstone River, 1998 to 20010. The walleye population structure was unbalanced and skewed towards smaller fish when trend surveys began but in recent years the population has shifted towards larger fish (Figure 26 A, C). Size-specific condition of small walleye is less than sauger of the same size but as walleye increase in length their size-specific condition is greater than that observed for sauger of the same size (Figure 26 B, D).
Year
1998 2000 2002 2004 2006 2008 2010
RSD
0
20
40
60
80
100
120
S-Q Q-P P-M M-T T - T
Year
1998 2000 2002 2004 2006 2008 2010
Relat
ive W
eight
(Wr)
60
70
80
90
100
110
120
130
Wr S-Q Wr Q-P Wr P-M Wr M-T Wr T
Year
1998 2000 2002 2004 2006 2008 2010
RSD
0
20
40
60
80
100
S-Q Q-P P-M M-T T
Year
1998 2000 2002 2004 2006 2008 2010
Relat
ive W
eight
(Wr)
60
70
80
90
100
110
120
130
Wr S-Q Wr Q-P Wr P-M Wr M-T Wr T
Figure 26. Incremental relative stock density (RSD) and relative weight (Wr) by length category of walleye captured in the Yellowstone River, 1998 to 2010.
A) Autumn trend B) Autumn trend
C) All data D) All data

Rare game fishes Abundances of most rarely encountered game fish were low during years of low flow and increased in times with above average flows (Figure 27). Brown trout were first captured in 2008 and in 2010 and were the most abundant rare game fish captured these years. All of these fishes are nonnative and more commonly associated with cold water or lentic habitats.
Year
1998 2000 2002 2004 2006 2008 2010
C/f
(fish
per
hou
r)
0.0
0.1
0.2
0.3
0.4
0.5
0.6
Northern pike Yellow perch Black crappie White crappie Largemouth bass Brown trout Rainbow trout Bluegill Rock bass White bass Tiger muskie
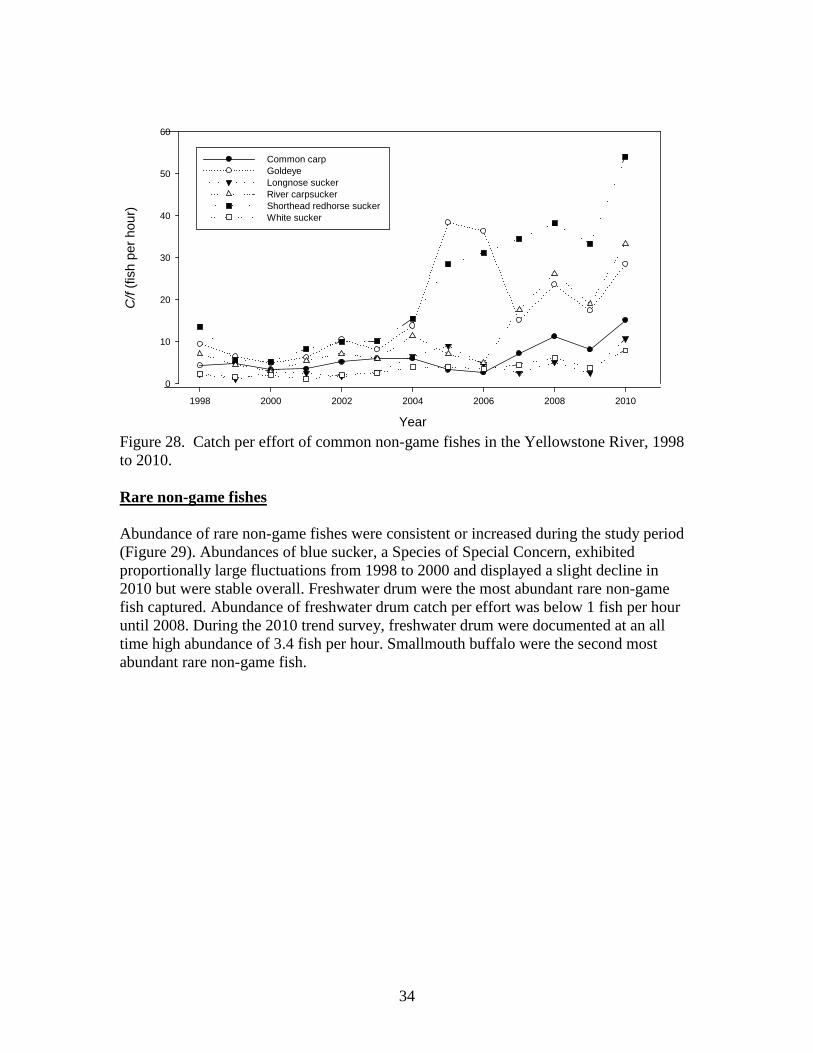
Figure 27. Catch per effort of rare game fishes in the Yellowstone River, 1998 to 2010. Common non-game fishes All abundances of common non-game fishes increased in 2010 and were at levels higher than existed in recent years (Figure 28). Shorthead redhorse sucker, and river carpsucker were the two most abundant species. Increased water levels were favorable for common non-game fishes.
34
Year
1998 2000 2002 2004 2006 2008 2010
C/f
(fish
per
hou
r)
0
10
20
30
40
50
60
Common carp Goldeye Longnose sucker River carpsucker Shorthead redhorse sucker White sucker
Figure 28. Catch per effort of common non-game fishes in the Yellowstone River, 1998 to 2010. Rare non-game fishes Abundance of rare non-game fishes were consistent or increased during the study period (Figure 29). Abundances of blue sucker, a Species of Special Concern, exhibited proportionally large fluctuations from 1998 to 2000 and displayed a slight decline in 2010 but were stable overall. Freshwater drum were the most abundant rare non-game fish captured. Abundance of freshwater drum catch per effort was below 1 fish per hour until 2008. During the 2010 trend survey, freshwater drum were documented at an all time high abundance of 3.4 fish per hour. Smallmouth buffalo were the second most abundant rare non-game fish.

35
Year
1998 2000 2002 2004 2006 2008 2010
C/f
(fish
per
hou
r)
0
1
2
3
4
Blue sucker Bigmouth buffalo Smallmouth buffalo Freshwater drum Stonecat Mountain sucker Mountain whitefish Shortnose gar Green sunfish Yellow bullhead
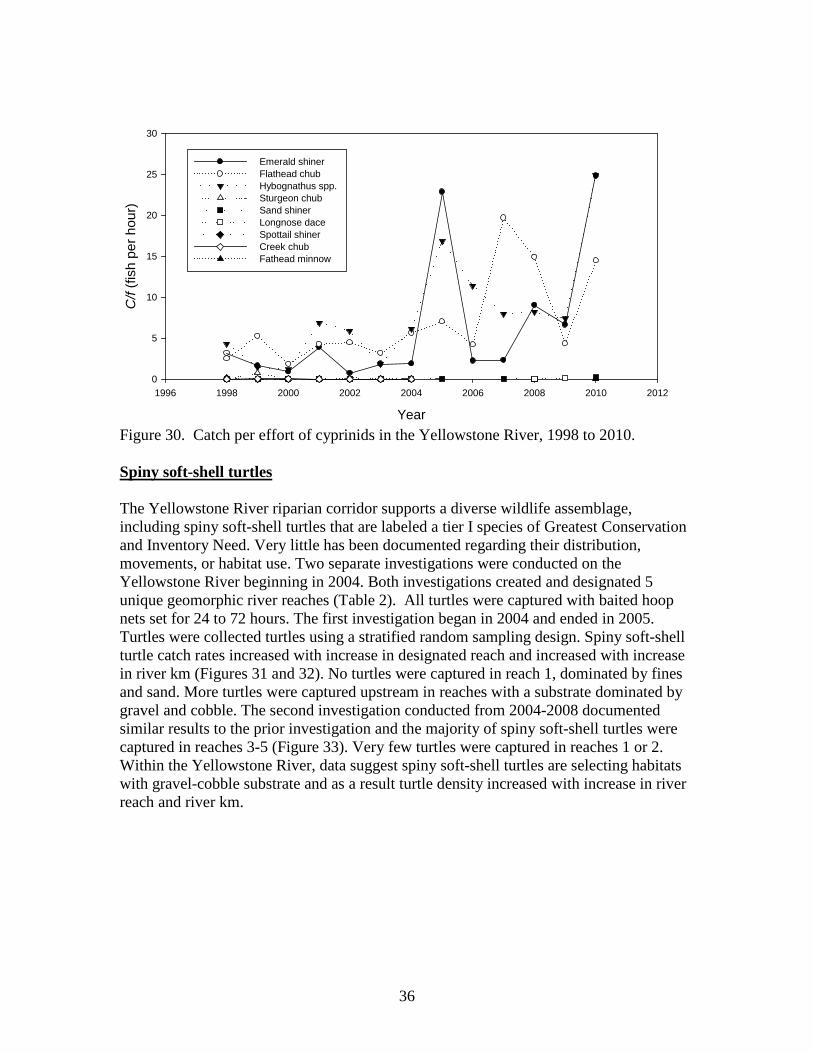
Figure 29. Catch per effort of rare non-game fishes in the Yellowstone River, 1998 to 2010. Cyprinids Only three cyprinids (flathead chub, Hybognathus spp., emerald shiner) were commonly encountered and catch rates of these species exhibited proportionally large fluctuations but a general upward trend since 2004 (Figure 30). Although electrofishing is an inefficient sampling method for most cyprinids, seine surveys found similar relative abundances among species in the Yellowstone River (Stewart 1997). Sturgeon chub, a Species of Special Concern, were rarely captured. However, electrofishing is an inefficient sampling method for this species (Stewart 1996). Sturgeon chub were commonly captured with benthic trawls throughout the Yellowstone River downstream of Cartersville Diversion (Bill Gardner, Montana Fish, Wildlife, and Parks, Lewistown, Montana, personal communication).
36
Year
1996 1998 2000 2002 2004 2006 2008 2010 2012
C/f
(fish
per
hou
r)
0
5
10
15
20
25
30
Emerald shiner Flathead chub Hybognathus spp. Sturgeon chub Sand shiner Longnose dace Spottail shiner Creek chub Fathead minnow
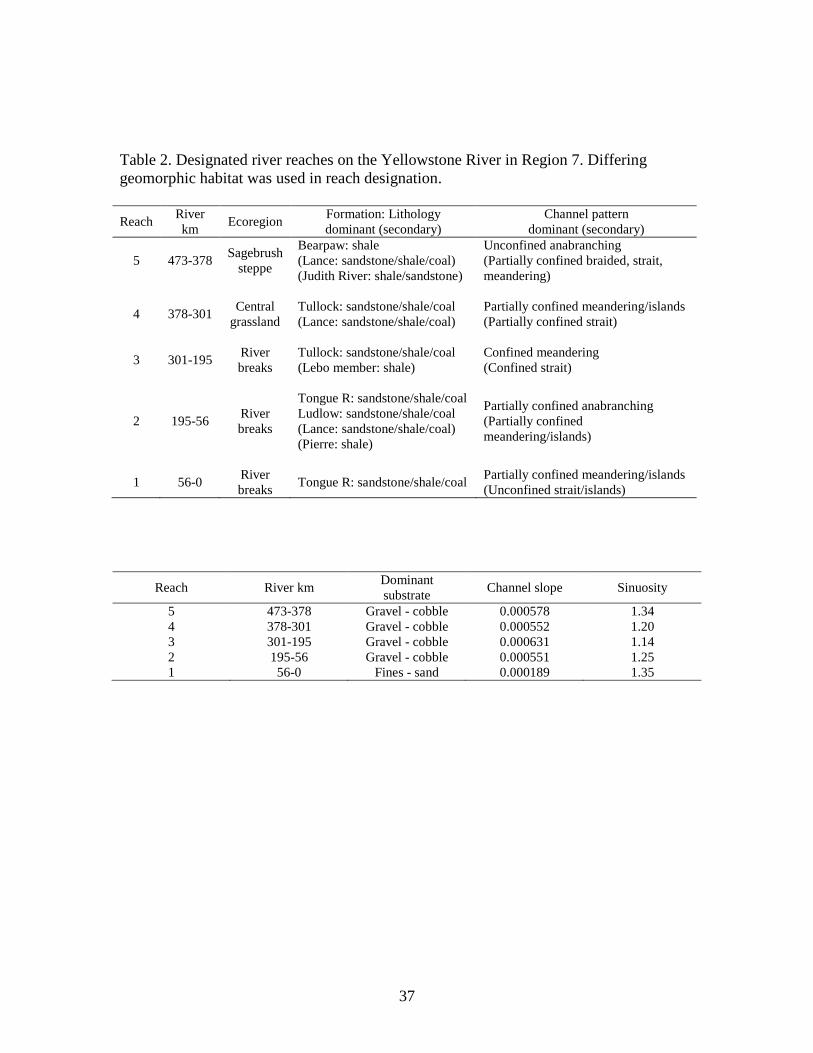
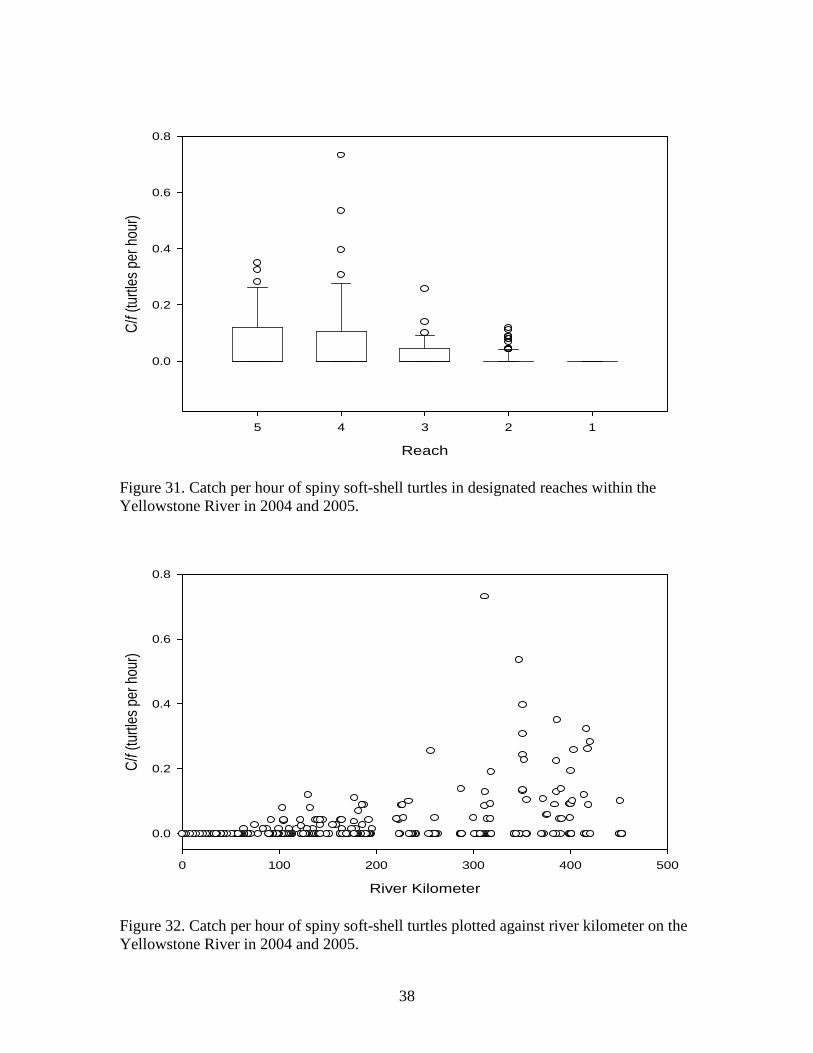
Figure 30. Catch per effort of cyprinids in the Yellowstone River, 1998 to 2010. Spiny soft-shell turtles The Yellowstone River riparian corridor supports a diverse wildlife assemblage, including spiny soft-shell turtles that are labeled a tier I species of Greatest Conservation and Inventory Need. Very little has been documented regarding their distribution, movements, or habitat use. Two separate investigations were conducted on the Yellowstone River beginning in 2004. Both investigations created and designated 5 unique geomorphic river reaches (Table 2). All turtles were captured with baited hoop nets set for 24 to 72 hours. The first investigation began in 2004 and ended in 2005. Turtles were collected turtles using a stratified random sampling design. Spiny soft-shell turtle catch rates increased with increase in designated reach and increased with increase in river km (Figures 31 and 32). No turtles were captured in reach 1, dominated by fines and sand. More turtles were captured upstream in reaches with a substrate dominated by gravel and cobble. The second investigation conducted from 2004-2008 documented similar results to the prior investigation and the majority of spiny soft-shell turtles were captured in reaches 3-5 (Figure 33). Very few turtles were captured in reaches 1 or 2. Within the Yellowstone River, data suggest spiny soft-shell turtles are selecting habitats with gravel-cobble substrate and as a result turtle density increased with increase in river reach and river km.
37
Table 2. Designated river reaches on the Yellowstone River in Region 7. Differing geomorphic habitat was used in reach designation. Reach River
km Ecoregion Formation: Lithology dominant (secondary)
Channel pattern dominant (secondary)
5 473-378 Sagebrush steppe
Bearpaw: shale (Lance: sandstone/shale/coal) (Judith River: shale/sandstone)
Unconfined anabranching (Partially confined braided, strait, meandering)
4 378-301 Central grassland
Tullock: sandstone/shale/coal (Lance: sandstone/shale/coal)
Partially confined meandering/islands (Partially confined strait)
3 301-195 River breaks
Tullock: sandstone/shale/coal (Lebo member: shale)
Confined meandering (Confined strait)
2 195-56 River breaks
Tongue R: sandstone/shale/coal Ludlow: sandstone/shale/coal (Lance: sandstone/shale/coal) (Pierre: shale)
Partially confined anabranching (Partially confined meandering/islands)
1 56-0 River breaks Tongue R: sandstone/shale/coal Partially confined meandering/islands
(Unconfined strait/islands)
Reach River km Dominant substrate Channel slope Sinuosity
5 473-378 Gravel - cobble 0.000578 1.34 4 378-301 Gravel - cobble 0.000552 1.20 3 301-195 Gravel - cobble 0.000631 1.14 2 195-56 Gravel - cobble 0.000551 1.25 1 56-0 Fines - sand 0.000189 1.35
38
Reach
12345
C/f (
turtl
es p
er h
our)
0.0
0.2
0.4
0.6
0.8
Figure 31. Catch per hour of spiny soft-shell turtles in designated reaches within the Yellowstone River in 2004 and 2005.
River Kilometer
0 100 200 300 400 500
C/f (
turtl
es p
er h
our)
0.0
0.2
0.4
0.6
0.8
Figure 32. Catch per hour of spiny soft-shell turtles plotted against river kilometer on the Yellowstone River in 2004 and 2005.

39
Reach
1 2 3 4 5
C/f (
Turlt
es p
er h
our)
0.0
0.1
0.2
0.3
0.4
0.5
0.6
0.7
Figure 33. Catch per hour of spiny soft-shell turtles in designated reaches within the Yellowstone River in 2004 and 2008.
LITERATURE CITED Anderson, R. O. and R. M. Neuman. 1996. Length, weight, and associated structural
indices. Pages 447-481 in B. R. Murphy and D. W. Willis, editors. Fisheries techniques, second edition. American Fisheries Society, Bethesda.
Backes, K. M. and W. M. Gardner. 1994. Lower Yellowstone River pallid sturgeon
study III and Missouri River pallid sturgeon creel survey. Montana Department of Fish, Wildlife, and Parks Report, Helena.
Bramblett, R. G., and R. G. White. 2001. Habitat use and movements of pallid and
shovelnose sturgeon in the Yellowstone and Missouri Rivers in Montana and North Dakota. Transactions of the American Fisheries Society 130:1006-1025.
Brown, C. J. D. 1971 Fishes of Montana. Big Sky Books, Bozeman. Carlson, J. 2003. Montana animal species of special concern. Montana Natural Heritage
Program and Montana Fish, Wildlife and Parks Report, Helena.

40
Hiebert, S. D., R. Wydoski, and T. J. Parks. 2000. Fish entrainment at the lower
Yellowstone diversion dam, Intake Canal, Montana, 1996-1998. USDI Bureau of Reclamation Report, Denver, Colorado.
Jaeger, M. E. 2004. An empirical assessment of factors precluding recovery of sauger in
the lower Yellowstone River: movement, habitat use, exploitation and entrainment. Master’s thesis. Montana State University, Bozeman.
Jones-Wuellner, M. R. and C. S. Guy. 2004. Status of burbot in Montana. Montana
Fish, Wildlife and Parks Report, Helena. McMahon, T. E. 1999. Status of sauger in Montana. Montana Fish, Wildlife and Parks
Report, Helena. McMahon, T. E., and W. M. Gardner. 2001. Status of sauger in Montana.
Intermountain Journal of Science 7:1-21. Nikcevic, M., A. Hegedis, B. Mickovic, D. Zivadinovic, and R. K. Andjus. 2000.
Thermal acclimation capacity of the burbot lota lota l. Pages 71-77 in V. Paragamian and D. Willis, editors. Burbot biology, ecology, and management. American Fisheries Society, Publication Number 1, Fisheries Management Section, Bethesda.
Penkal, R. F. 1992. Assessment and requirements of sauger and walleye populations in
the Lower Yellowstone River and its tributaries. Montana Department of Fish, Wildlife and Parks Report, Helena.
Silverman, A. J., and W. D. Tomlinsen. 1984. Biohydrology of mountain fluvial
systems: the Yellowstone (part I). U. S. Geologic Survey, Completion Report G-853-02, Reston.
Stewart, P. A. 1996. Southeast Montana warmwater streams investigations. Montana
Department of Fish, Wildlife, and Parks Report F-78-R-2, Helena. Stewart, P. A. 1997. Southeast Montana warmwater streams investigations. Montana
Department of Fish, Wildlife, and Parks Report F-78-R-4, Helena. White, R. G., and R. G. Bramblett. 1993. The Yellowstone River: its fish and fisheries.
Pages 396-414 in L. W. Hesse, C. B. Stalnaker, N. G. Benson, J. R. Zuboy, editors. Restoration planning for the rivers of the Mississippi River ecosystem. Biological Report 19, National Biological Survey, Washington, D.C.

41
Key words:
Population abundance, structure, and condition. Sauger, channel catfish, smallmouth bass, shovelnose sturgeon, burbot, walleye, game fish, non-game fish, cyprinids, spiny soft-shell turtle.
Prepared by: Jason Rhoten Date: March 1, 2011
42
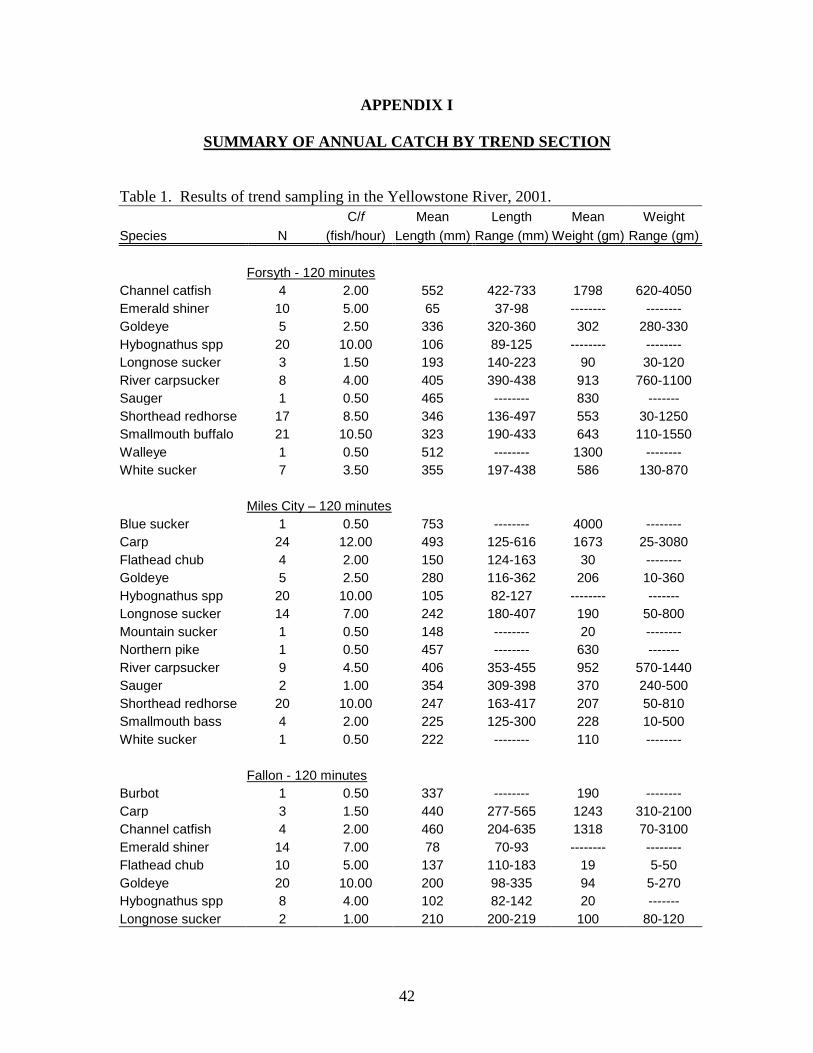
APPENDIX I
SUMMARY OF ANNUAL CATCH BY TREND SECTION Table 1. Results of trend sampling in the Yellowstone River, 2001. C/f Mean Length Mean Weight Species N (fish/hour) Length (mm) Range (mm) Weight (gm) Range (gm) Forsyth - 120 minutes Channel catfish 4 2.00 552 422-733 1798 620-4050 Emerald shiner 10 5.00 65 37-98 -------- -------- Goldeye 5 2.50 336 320-360 302 280-330 Hybognathus spp 20 10.00 106 89-125 -------- -------- Longnose sucker 3 1.50 193 140-223 90 30-120 River carpsucker 8 4.00 405 390-438 913 760-1100 Sauger 1 0.50 465 -------- 830 ------- Shorthead redhorse 17 8.50 346 136-497 553 30-1250 Smallmouth buffalo 21 10.50 323 190-433 643 110-1550 Walleye 1 0.50 512 -------- 1300 -------- White sucker 7 3.50 355 197-438 586 130-870 Miles City – 120 minutes Blue sucker 1 0.50 753 -------- 4000 -------- Carp 24 12.00 493 125-616 1673 25-3080 Flathead chub 4 2.00 150 124-163 30 -------- Goldeye 5 2.50 280 116-362 206 10-360 Hybognathus spp 20 10.00 105 82-127 -------- ------- Longnose sucker 14 7.00 242 180-407 190 50-800 Mountain sucker 1 0.50 148 -------- 20 -------- Northern pike 1 0.50 457 -------- 630 ------- River carpsucker 9 4.50 406 353-455 952 570-1440 Sauger 2 1.00 354 309-398 370 240-500 Shorthead redhorse 20 10.00 247 163-417 207 50-810 Smallmouth bass 4 2.00 225 125-300 228 10-500 White sucker 1 0.50 222 -------- 110 -------- Fallon - 120 minutes Burbot 1 0.50 337 -------- 190 -------- Carp 3 1.50 440 277-565 1243 310-2100 Channel catfish 4 2.00 460 204-635 1318 70-3100 Emerald shiner 14 7.00 78 70-93 -------- -------- Flathead chub 10 5.00 137 110-183 19 5-50 Goldeye 20 10.00 200 98-335 94 5-270 Hybognathus spp 8 4.00 102 82-142 20 ------- Longnose sucker 2 1.00 210 200-219 100 80-120

43
Table 1 (cont.) River carpsucker 6 3.00 418 352-467 1057 560-1480 Sauger 9 4.50 370 280-470 431 150-900 Shorthead redhorse 20 10.00 279 174-468 279 50-1050 Smallmouth buffalo 1 0.50 522 ------- 2010 ------- Intake - 120 minutes Carp 1 0.50 617 -------- 2200 ------- Emerald shiner 7 3.50 81 64-91 ------- ------- Flathead chub 20 10.00 139 112-187 26 10-60 Goldeye 20 10.00 218 111-395 114 10-610 Hybognathus spp 7 3.50 100 86-117 10 ------- Longnose sucker 1 0.50 176 -------- 70 -------- River carpsucker 20 10.00 388 201-468 958 100-1500 Sauger 44 22.00 195 135-404 67 15-440 Shorthead redhorse 9 4.50 192 135-235 77 30-150 Shovelnose sturgeon 1 0.50 563 -------- 570 -------- Smallmouth Buffalo 1 0.50 702 -------- 5000 -------- Stonecat 1 0.50 96 -------- 5 -------- Table 2. Results of trend sampling in the Yellowstone River, 2002. C/f Mean Length Mean Weight Species N (fish/hour) Length (mm) Range (mm) Weight (g) Range (g) Forsyth - 365 minutes Blue sucker 3 0.49 775 745-800 4085 3575-4500 Burbot 1 0.16 285 -------- 100 -------- Carp 57 9.38 534 405-678 2082 910-4550 Channel catfish 28 4.61 529 302-726 1638 220-4160 Emerald shiner 6 0.99 74 64-86 5 -------- Flathead chub 6 0.99 125 104-165 14 5-30 Freshwater drum 1 0.16 360 -------- 530 ------- Goldeye 70 11.51 317 193-363 270 70-400 Hybognathus spp 17 2.80 94 78-117 7 5-20 Longnose sucker 13 2.14 358 203-668 425 50-800 Mountain sucker 1 0.16 147 ------- 60 ------- Northern pike 1 0.16 620 -------- 1610 -------- River carpsucker 56 9.21 388 126-445 781 20-1140 Sauger 26 4.28 388 287-614 535 160-1960 Shorthead redhorse 92 15.13 298 143-498 339 40-1200 Shovelnose sturgeon 7 1.15 828 751-920 3280 2300-5550 Smallmouth bass 44 7.24 264 76-467 463 10-1640 Smallmouth buffalo 7 1.15 471 408-535 1570 990-2240 Sturgeon chub 1 0.16 80 -------- 5 -------- Walleye 4 0.66 441 332-583 853 320-1820 White sucker 43 7.07 321 130-428 435 20-860 Yellow bullhead 1 0.16 230 -------- 160 --------

44
Table 2 (cont.) Miles City - 364 minutes Bigmouth buffalo 2 0.33 566 557-574 2925 2680-3170 Black crappie 1 0.16 208 -------- 150 -------- Blue sucker 5 0.82 717 663-795 3172 2530-4300 Burbot 1 0.16 400 -------- 250 -------- Carp 50 8.24 476 324-576 1488 310-2940 Channel catfish 9 1.48 534 344-690 1673 310-2930 Emerald shiner 8 1.32 77 72-86 -------- -------- Flathead chub 67 11.04 130 95-190 23 5-80 Freshwater drum 3 0.49 427 367-494 1083 640-1550 Goldeye 58 9.56 304 106-374 255 5-410 Hybognathus spp 81 13.34 111 87-150 13 5-30 Longnose sucker 25 4.12 333 205-425 431 80-830 River carpsucker 67 11.04 376 74-498 750 5-1320 Sauger 47 7.74 367 237-528 437 110-1150 Shorthead redhorse 50 8.24 304 175-440 337 70-850 Smallmouth bass 15 2.47 247 56-348 286 5-650 Smallmouth buffalo 16 2.64 512 303-721 2016 300-5000 Sturgeon chub 1 0.16 89 -------- 5 -------- Walleye 5 0.82 328 307-341 324 280-380 White crappie 2 0.33 268 194-342 395 100-690 White sucker 6 0.99 287 230-385 290 170-580 Fallon - 396 minutes Blue sucker 2 0.30 732 721-742 3310 3300-3320 Carp 12 1.82 485 200-615 1590 120-2850 Channel catfish 5 0.76 324 145-654 672 30-2800 Emerald shiner 1 0.15 73 -------- -------- ------- Flathead chub 8 1.21 146 121-171 30 20-50 Freshwater drum 1 0.15 447 -------- 1240 ------- Goldeye 65 9.85 272 108-358 185 15-410 Hybognathus spp 10 1.52 104 77-140 10 5-20 Longnose sucker 3 0.45 342 304-366 433 310-510 Northern pike 1 0.15 536 -------- 990 -------- River carpsucker 17 2.58 366 178-459 724 70-1220 Sauger 21 3.18 372 169-565 453 30-1440 Shorthead redhorse 65 9.85 304 163-485 317 40-1040 Shovelnose sturgeon 4 0.61 602 457-690 978 320-1450 Smallmouth buffalo 1 0.15 494 -------- 1650 -------- Stonecat 7 1.06 116 92-144 11 5-20 Sturgeon chub 2 0.30 73 69-77 5 -------- White sucker 2 0.30 300 251-349 270 110-430 Intake - 370 minutes Carp 10 1.61 442 186-710 1728 100-4540 Channel catfish 4 0.65 474 235-580 1218 120-1800 Emerald shiner 3 0.48 82 77-87 5 -------- Flathead chub 30 4.84 167 124-210 44 10-80

45
Table 2 (cont.) Freshwater drum 1 0.16 295 -------- 300 -------- Goldeye 61 9.84 243 104-362 145 10-400 Hybognathus spp 39 6.29 106 91-128 9 5-20 Longnose sucker 1 0.16 267 -------- 200 -------- Northern pike 3 0.48 679 568-889 1833 920-3530 River carpsucker 40 6.45 408 168-520 1130 90-2320 Sauger 122 19.68 286 190-475 198 60-830 Shorthead redhorse 42 6.77 253 180-378 195 70-600 Shovelnose sturgeon 21 3.39 499 331-738 512 120-1700 Walleye 2 0.32 402 293-510 730 210-1250 White sucker 2 0.32 281 264-298 210 120-300 Table 3. Results of trend sampling in the Yellowstone River, 2003. C/f Mean Length Mean Weight
Species N (fish/hour) Length (mm) Range (mm)
Weight (gm) Range (gm)
Downstream of Rancher Diversion Dam - 110 minutes Carp 42 22.91 551.8 355-660 2355.5 640-3920 Channel catfish 28 15.28 561.9 423-710 2108.9 620-5300 Flathead chub 20 10.91 124.5 93-174 18 10-50 Freshwater drum 2 1.09 453.5 390-517 1440 710-2170 Goldeye 23 12.55 327 284-378 310.9 200-470 Longnose sucker 17 9.27 281.1 196-407 248.8 60-600 River carpsucker 15 8.18 396.8 282-450 793.3 290-1050 Shorthead redhorse 93 50.74 342.1 153-507 495 40-1240 Smallmouth bass 8 4.36 260.1 112-380 431.3 20-1060 Smallmouth buffalo 2 1.09 698.5 645-752 5650 4300-7000 Western silvery minnow 2 1.09 111 110-112 10 --- White sucker 10 5.46 345.5 235-432 476 120-920 Forsyth - 413 minutes Bigmouth buffalo 4 0.58 611.5 481-806 3445 210-7090 Blue sucker 2 0.29 735.5 715-756 3875 3000-4750 Burbot 1 0.15 430 --- 410 --- Carp 83 12.06 515.2 316-702 1853.7 300-5000 Channel catfish 67 9.74 508.9 295-741 1587.8 240-5020 Emerald shiner 8 1.16 78.3 68-94 10 --- Flathead chub 9 1.31 120.2 95-176 29.4 10-50 Freshwater drum 1 0.15 430 --- 1130 --- Goldeye 115 16.72 314.4 272-355 287.3 200-370 Longnose sucker 22 3.20 250.2 88-450 299.5 20-950 Mountain sucker 4 0.58 131.5 112-163 31.3 20-50 River carpsucker 68 9.88 382 225-520 760.2 120-2580 Sauger 45 6.54 361 164-552 456 20-1620 Shorthead redhorse 202 29.36 337.4 142-453 439.3 30-950 Shovelnose sturgeon 14 2.03 810.4 573-915 2700.7 680-4900 Smallmouth bass 39 5.67 223.2 68-403 417.7 10-1280

46
Table 3 (cont.) Smallmouth buffalo 11 1.60 531.5 389-722 2588.2 900-6200 Walleye 4 0.58 379 223-446 612.5 110-890 Western silvery minnow 4 0.58 105.5 90-112 12.5 10-20 White crappie 1 0.15 172 --- 80 --- White sucker 37 5.38 349.3 171-450 534.6 70-900 Miles City - 400 minutes Blue sucker 7 1.05 695.3 610-738 3162.9 2020-3840 Carp 39 5.85 515.7 309-670 2021.7 380-5000 Channel catfish 19 2.85 505.2 69-688 1737.8 380-4800 Emerald shiner 79 11.84 86.4 75-105 5 --- Flathead chub 24 3.60 143.8 110-170 35.7 10-60 Goldeye 55 8.25 307.8 140-307.8 290.2 20-460 Longnose sucker 24 3.60 310.8 125-445 360.8 20-780 River carpsucker 32 4.80 39706 227-458 827.5 150-1200 Sauger 20 3.00 381.4 265-507 508.5 170-1150 Shorthead redhorse 159 23.84 304.9 92-465 368.5 60-1130 Shovelnose sturgeon 3 0.45 796.3 684-868 2853.3 1510-3870 Smallmouth bass 49 7.35 130.5 80-384 87.5 5-1100 Smallmouth buffalo 3 0.45 583.7 480-636 3603.3 1720-5000 Stonecat 2 0.30 134.5 129-140 10 --- Tiger muskey 1 0.15 864 --- 5100 --- Walleye 1 0.15 208 --- 110 --- Western silvery minnow 21 3.15 104.9 83-139 18.6 10-40 White sucker 4 0.60 353 328-399 530 450-700 Fallon - 417 minutes Blue sucker 5 0.72 660 466-757 3052 750-4550 Burbot 1 0.14 370 --- 190 --- Carp 30 4.32 444.3 88-710 1566.9 10-4600 Channel catfish 23 3.31 393.4 70-601 1267.8 20-2270 Flathead chub 28 4.03 139.6 98-207 30 10-80 Freshwater drum 2 0.29 467 394-540 1475 820-2130 Goldeye 37 5.32 197.5 84-327 222.4 10-360 Longnose sucker 4 0.58 264.3 116-371 376.7 270-560 River carpsucker 13 1.87 351.4 72-475 872.7 280-1700 Sauger 71 10.22 380.1 174-549 502.8 40-1460 Shorthead redhorse 66 9.50 335.7 68-480 576.2 20-1350 Shovelnose sturgeon 18 2.59 743.8 584-867 2188.3 770-3930 Smallmouth bass 1 0.14 126 --- 30 --- Smallmouth buffalo 2 0.29 300 110-490 1760 --- Stonecat 3 0.43 114.7 106-128 --- --- Walleye 1 0.14 200 --- 50 --- Western silvery minnow 4 0.58 102.8 96-117 --- --- Intake - 444 minutes Blue sucker 3 0.41 730 711-750 3690 3380-4010 Carp 7 0.95 42634 187-521 1234.3 100-2000
47
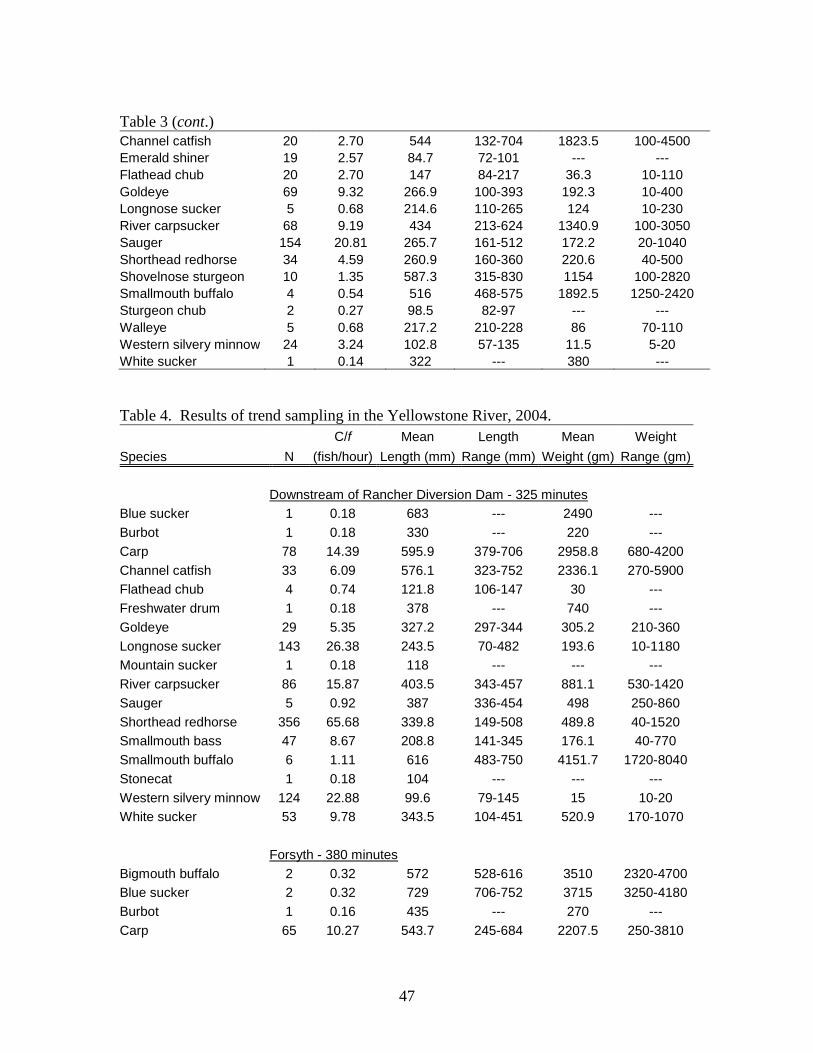
Table 3 (cont.) Channel catfish 20 2.70 544 132-704 1823.5 100-4500 Emerald shiner 19 2.57 84.7 72-101 --- --- Flathead chub 20 2.70 147 84-217 36.3 10-110 Goldeye 69 9.32 266.9 100-393 192.3 10-400 Longnose sucker 5 0.68 214.6 110-265 124 10-230 River carpsucker 68 9.19 434 213-624 1340.9 100-3050 Sauger 154 20.81 265.7 161-512 172.2 20-1040 Shorthead redhorse 34 4.59 260.9 160-360 220.6 40-500 Shovelnose sturgeon 10 1.35 587.3 315-830 1154 100-2820 Smallmouth buffalo 4 0.54 516 468-575 1892.5 1250-2420 Sturgeon chub 2 0.27 98.5 82-97 --- --- Walleye 5 0.68 217.2 210-228 86 70-110 Western silvery minnow 24 3.24 102.8 57-135 11.5 5-20 White sucker 1 0.14 322 --- 380 --- Table 4. Results of trend sampling in the Yellowstone River, 2004. C/f Mean Length Mean Weight Species N (fish/hour) Length (mm) Range (mm) Weight (gm) Range (gm) Downstream of Rancher Diversion Dam - 325 minutes Blue sucker 1 0.18 683 --- 2490 --- Burbot 1 0.18 330 --- 220 --- Carp 78 14.39 595.9 379-706 2958.8 680-4200 Channel catfish 33 6.09 576.1 323-752 2336.1 270-5900 Flathead chub 4 0.74 121.8 106-147 30 --- Freshwater drum 1 0.18 378 --- 740 --- Goldeye 29 5.35 327.2 297-344 305.2 210-360 Longnose sucker 143 26.38 243.5 70-482 193.6 10-1180 Mountain sucker 1 0.18 118 --- --- --- River carpsucker 86 15.87 403.5 343-457 881.1 530-1420 Sauger 5 0.92 387 336-454 498 250-860 Shorthead redhorse 356 65.68 339.8 149-508 489.8 40-1520 Smallmouth bass 47 8.67 208.8 141-345 176.1 40-770 Smallmouth buffalo 6 1.11 616 483-750 4151.7 1720-8040 Stonecat 1 0.18 104 --- --- --- Western silvery minnow 124 22.88 99.6 79-145 15 10-20 White sucker 53 9.78 343.5 104-451 520.9 170-1070 Forsyth - 380 minutes Bigmouth buffalo 2 0.32 572 528-616 3510 2320-4700 Blue sucker 2 0.32 729 706-752 3715 3250-4180 Burbot 1 0.16 435 --- 270 --- Carp 65 10.27 543.7 245-684 2207.5 250-3810

48
Table 4 (cont.) Channel catfish 25 3.95 537.3 266-711 1994.4 190-3720 Emerald shiner 43 6.79 73.1 56-98 --- --- Flathead chub 6 0.95 141.2 132-159 22 10-40 Freshwater drum 5 0.79 417.4 378-472 924 760-1210 Goldeye 125 19.75 316.1 195-379 275.6 60-450 Longnose sucker 44 6.95 277.8 115-452 322.1 30-920 Mountain sucker 1 0.16 130 --- 60 --- River carpsucker 84 13.27 395 268-460 803.9 250-1200 Sand shiner 1 0.16 68 --- --- --- Sauger 21 3.32 372.9 158-489 482.4 20-1100 Shorthead redhorse 269 42.50 349.9 150-505 514.3 50-1180 Shovelnose sturgeon 3 0.47 772 750-803 2430 1780-3310 Smallmouth bass 28 4.42 240.4 129-394 302.9 30-1120 Smallmouth buffalo 16 2.53 549.3 335-665 2682.5 640-5000 Walleye 2 0.32 425.5 387-464 765 530-1000 Western silvery minnow 8 1.26 79.4 74-85 --- --- White sucker 48 7.58 323.9 98-423 468.5 10-850 Miles City - 360 minutes Blue sucker 10 1.67 713.2 678-770 3069 2350-3990 Carp 53 8.83 529.9 260-1495 1906 300-3600 Channel catfish 13 2.17 416.4 256-625 810.8 140-2380 Emerald shiner 5 0.83 76.2 55-93 --- --- Flathead chub 52 8.67 146 106-196 33.3 10-80 Freshwater drum 4 0.67 404.8 372-463 972.5 780-1370 Goldeye 67 11.17 296.2 103-346 265.8 10-360 Longnose sucker 26 4.33 307 209-452 373.5 80-960 Northern pike 1 0.17 617 --- 1520 --- River carpsucker 64 10.67 390.6 251-513 831.4 100-1930 Sauger 24 4.00 395 290-485 539.6 130-1070 Shorthead redhorse 260 43.33 332.1 135-494 484.9 20-1310 Shovelnose sturgeon 1 0.17 913 --- 4400 --- Smallmouth bass 27 4.50 221.6 92-410 277 10-1140 Smallmouth buffalo 8 1.33 518.8 324-720 2405 250-6100 Walleye 3 0.50 468 393-526 993.3 490-1490 Western silvery minnow 26 4.33 121.3 98-146 21.3 10-60 White sucker 12 2.00 333.8 240-400 495 120-780 Fallon - 386 minutes Carp 22 3.42 536.9 383-652 2133.6 770-3880 Channel catfish 14 2.18 478.8 315-662 1153.6 260-3090 Flathead chub 77 11.98 132.1 92-233 33.3 5-120 Freshwater drum 3 0.47 333.7 287-392 490 320-740

49
Table 4 (cont.) Goldeye 143 22.24 273.7 86-347 238.9 60-350 Longnose sucker 6 0.93 269.7 202-350 250 80-520 Northern pike 1 0.16 827 --- 4150 --- River carpsucker 51 7.93 391.1 133-530 891 20-2330 Sauger 66 10.26 405.9 239-560 568.3 120-1320 Shorthead redhorse 146 22.71 261.2 148-487 293.6 30-1280 Smallmouth bass 4 0.62 167.3 65-207 133.3 120-150 Smallmouth buffalo 8 1.24 429.8 198-582 1530 130-3120 Stonecat 2 0.31 114 86-142 30 --- Walleye 1 0.16 384 --- 520 --- Western silvery minnow 85 13.22 103 86-140 --- --- White sucker 3 0.47 336.3 270-428 486.7 220-900 Intake - 363 minutes Bigmouth buffalo 3 0.50 646 591-700 4150 3340-5080 Blue sucker 1 0.17 733 --- 3280 --- Burbot 3 0.50 375.7 167-527 361.7 15-680 Carp 15 2.48 460.4 324-603 1424.7 490-2780 Channel catfish 9 1.49 479.9 225-668 1641.1 160-3170 Emerald shiner 9 1.49 77.9 69-86 --- --- Flathead chub 32 5.29 149.9 93-198 37.3 10-70 Freshwater drum 3 0.50 308.3 290-320 390 350-460 Goldeye 200 33.06 273.3 110-372 195.7 10-370 Longnose sucker 2 0.33 273.5 237-310 215 80-350 River carpsucker 118 19.50 415 149-560 1187.2 50-3250 Sauger 187 30.91 313.5 197-500 253.5 50-1000 Shorthead redhorse 54 8.93 271.8 130-392 280.4 30-700 Shovelnose sturgeon 31 5.12 569.8 405-861 952.6 170-3280 Smallmouth bass 1 0.17 214 --- 180 --- Smallmouth buffalo 6 0.99 416.3 189-528 1201.7 100-2160 Walleye 3 0.50 363.3 298-473 480 210-920 Western silvery minnow 35 5.79 100 84-128 10 --- White sucker 2 0.33 286 260-312 295 210-380 Table 5. Results of trend sampling in the Yellowstone River, 2005.
C/f Mean Length Mean Weight
Species N (fish/hour) Length (mm)
Range (mm)
Weight (gm)
Range (gm)
Downstream of Rancher Diversion Dam - 381 minutes Bigmouth Buffalo 1 0.16 601 --- 3560 ---
Burbot 1 0.16 336 --- 240 --- Carp 19 2.99 589 498-679 2820 1570-4020

50
Table 5 (cont.) Channel catfish 20 3.15 497 365-638 1365 430-3130
Emerald Shiner 139 21.89 78 58-91 4 --- Flathead chub 9 1.42 140 82-206 40 4-90 Freshwater drum 2 0.31 430 420-439 1060 960-1160 Goldeye 108 17.01 323 285-360 305 200-420 Longnose sucker 211 33.23 297 128-417 331 50-730 Mountain Sucker 6 0.94 177 158-205 81 55-130 Northern Pike 1 0.16 635 --- 1500 --- River carpsucker 16 2.52 395 338-430 786 460-990 Sand Shiner 1 0.16 60 --- 2 --- Sauger 2 0.31 373 350-395 370 320-420 Shorthead redhorse 174 27.40 366 140-475 591 40-1260 Smallmouth bass 27 4.25 270 112-387 393 30-1070 Smallmouth buffalo 5 0.79 646 501-700 4148 1940-4800 Stonecat 1 0.16 170 --- 70 --- Walleye 3 0.47 562 475-716 2150 970-4200 Western silvery minnow 424 66.77 99 74-129 9 4-25 White sucker 69 10.87 341 128-435 539 24-1020
Forsyth - 397 minutes Bigmouth buffalo 1 0.15 559 --- 2630 ---
Burbot 1 0.15 583 --- 950 --- Carp 32 4.84 519 313-705 2007 350-5000 Channel catfish 36 5.44 395 239-794 778 120-6150 Emerald shiner 212 32.04 82 62-105 4 --- Flathead chub 8 1.21 156 116-197 38 14-68 Freshwater drum 6 0.91 388 366-442 738 560-1110 Goldeye 333 50.33 317 228-382 298 200-520 Largemouth Bass 1 0.15 122 --- 20 --- Longnose sucker 48 7.25 326 198-485 401 90-980 Mountain sucker 3 0.45 185 175-194 80 60-110 River carpsucker 47 7.10 387 315-460 763 430-1250 Sauger 40 6.05 368 265-477 423 128-920 Shorthead redhorse 295 44.58 331 150-523 435 40-1300 Shovelnose sturgeon 1 0.15 792 --- 2430 --- Smallmouth bass 94 14.21 258 83-413 325 9-1150 Smallmouth buffalo 3 0.45 545 488-591 2667 1700-3540 Walleye 3 0.45 531 405-767 2303 630-5600 Western silvery minnow 69 10.43 107 84-138 11 4-24 White sucker 40 6.05 330 181-434 484 90-970
51
Table 5 (cont.)
Miles City - 367 minutes
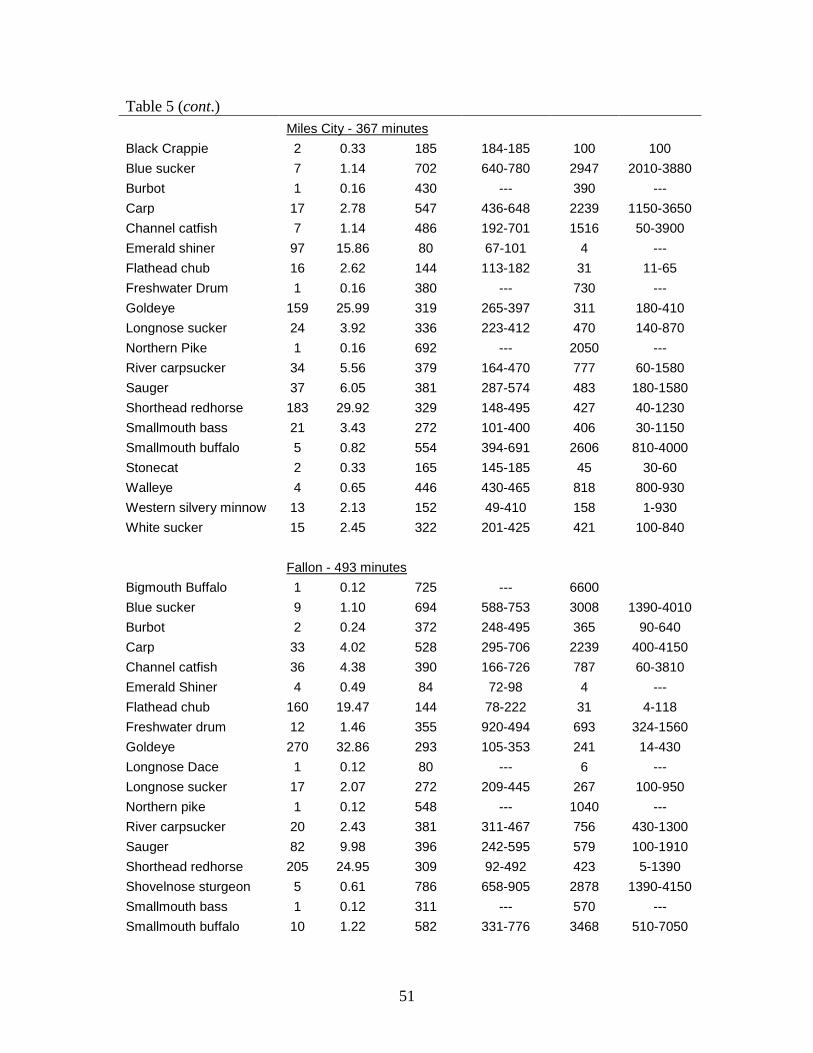
Black Crappie 2 0.33 185 184-185 100 100 Blue sucker 7 1.14 702 640-780 2947 2010-3880 Burbot 1 0.16 430 --- 390 --- Carp 17 2.78 547 436-648 2239 1150-3650 Channel catfish 7 1.14 486 192-701 1516 50-3900 Emerald shiner 97 15.86 80 67-101 4 --- Flathead chub 16 2.62 144 113-182 31 11-65 Freshwater Drum 1 0.16 380 --- 730 --- Goldeye 159 25.99 319 265-397 311 180-410 Longnose sucker 24 3.92 336 223-412 470 140-870 Northern Pike 1 0.16 692 --- 2050 --- River carpsucker 34 5.56 379 164-470 777 60-1580 Sauger 37 6.05 381 287-574 483 180-1580 Shorthead redhorse 183 29.92 329 148-495 427 40-1230 Smallmouth bass 21 3.43 272 101-400 406 30-1150 Smallmouth buffalo 5 0.82 554 394-691 2606 810-4000 Stonecat 2 0.33 165 145-185 45 30-60 Walleye 4 0.65 446 430-465 818 800-930 Western silvery minnow 13 2.13 152 49-410 158 1-930 White sucker 15 2.45 322 201-425 421 100-840
Fallon - 493 minutes Bigmouth Buffalo 1 0.12 725 --- 6600
Blue sucker 9 1.10 694 588-753 3008 1390-4010 Burbot 2 0.24 372 248-495 365 90-640 Carp 33 4.02 528 295-706 2239 400-4150 Channel catfish 36 4.38 390 166-726 787 60-3810 Emerald Shiner 4 0.49 84 72-98 4 --- Flathead chub 160 19.47 144 78-222 31 4-118 Freshwater drum 12 1.46 355 920-494 693 324-1560 Goldeye 270 32.86 293 105-353 241 14-430 Longnose Dace 1 0.12 80 --- 6 --- Longnose sucker 17 2.07 272 209-445 267 100-950 Northern pike 1 0.12 548 --- 1040 --- River carpsucker 20 2.43 381 311-467 756 430-1300 Sauger 82 9.98 396 242-595 579 100-1910 Shorthead redhorse 205 24.95 309 92-492 423 5-1390 Shovelnose sturgeon 5 0.61 786 658-905 2878 1390-4150 Smallmouth bass 1 0.12 311 --- 570 --- Smallmouth buffalo 10 1.22 582 331-776 3468 510-7050

52
Table 5 (cont.) Stonecat 5 0.61 134 108-151 24 8-32
Walleye 3 0.37 382 212-498 683 90-1080 Western silvery minnow 18 2.19 117 85-135 17 5-22 White Sucker 4 0.49 288 229-342 318 150-470
Intake - 392 minutes Bigmouth Buffalo 5 0.77 593 500-678 3444 1910-4600
Blue sucker 1 0.15 633 --- 2160 --- Burbot 3 0.46 262 240-308 97 70-140 Carp 10 1.53 541 338-788 2004 900-3710 Channel catfish 15 2.30 429 244-615 827 100-2190 Emerald shiner 321 49.13 79 59-105 4 --- Flathead chub 45 6.89 135 68-214 28 4-100 Freshwater Drum 2 0.31 313 301-324 475 440-510 Goldeye 429 65.66 273 117-347 212 10-420 Longnose sucker 4 0.61 272 208 253 100 Northern Pike 2 0.31 536 440-632 900 570-1230 Plains Minnow 3 0.46 57 55-57 --- --- River carpsucker 120 18.37 401 195-582 1106 140-3260 Sauger 156 23.88 332 170-507 303 30-1000 Shorthead redhorse 104 15.92 247 125-390 179 30-850 Shovelnose sturgeon 41 6.28 552 339-802 741 160-2680 Smallmouth buffalo 8 1.22 649 470-765 3711 1350-5300 Stonecat 1 0.15 100 --- 20 --- Walleye 3 0.46 375 360 533 450-640 Western silvery minnow 43 6.58 99 77-126 8 2-17 White sucker 7 1.07 299 270-328 301 210-380
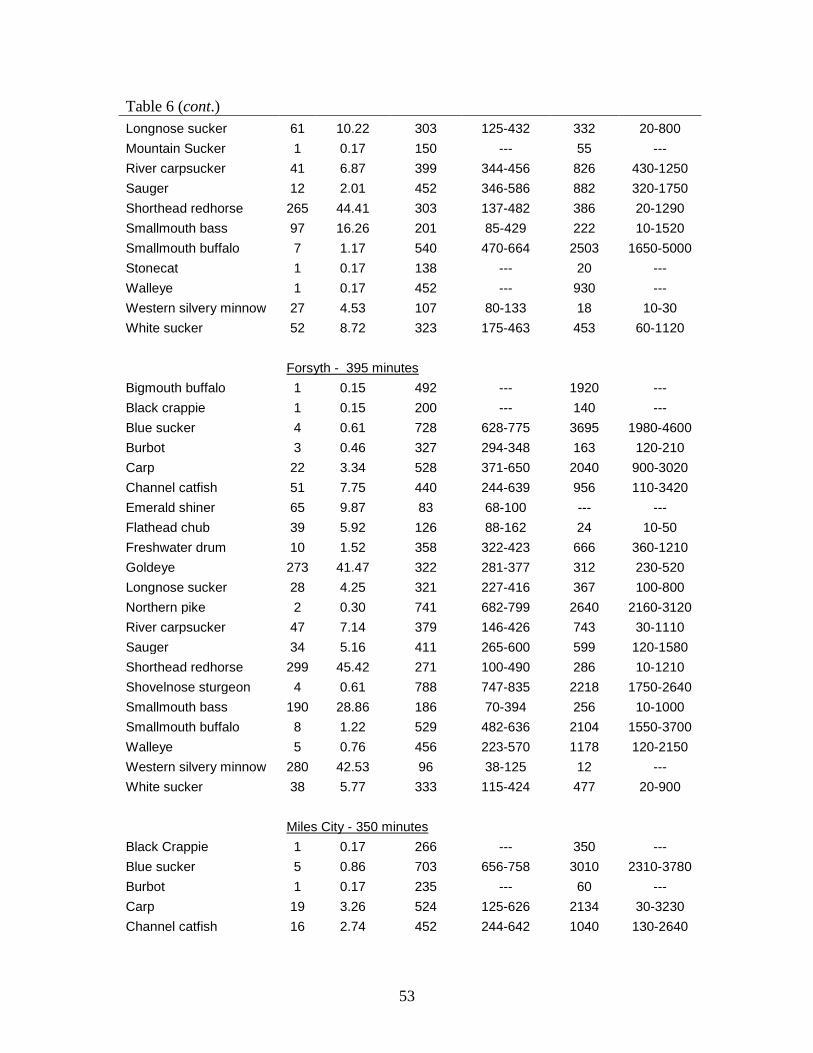
Table 6. Results of trend sampling in the Yellowstone River, 2006.
C/f Mean Length Mean Weight
Species N (fish/hour) Length (mm)
Range (mm)
Weight (gm)
Range (gm)
Downstream of Rancher Diversion Dam - 358 minutes Bigmouth Buffalo 1 0.17 592 --- 3500 ---
Carp 26 4.36 574 400-658 2597 570-4500 Channel catfish 43 7.21 515 357-712 1610 370-4500 Emerald Shiner 1 0.17 73 --- --- --- Flathead chub 6 1.01 122 106-145 18 10-25 Freshwater drum 3 0.50 380 362-392 747 640-840 Goldeye 111 18.60 325 238-373 307 140-460
53
Table 6 (cont.) Longnose sucker 61 10.22 303 125-432 332 20-800
Mountain Sucker 1 0.17 150 --- 55 --- River carpsucker 41 6.87 399 344-456 826 430-1250 Sauger 12 2.01 452 346-586 882 320-1750 Shorthead redhorse 265 44.41 303 137-482 386 20-1290 Smallmouth bass 97 16.26 201 85-429 222 10-1520 Smallmouth buffalo 7 1.17 540 470-664 2503 1650-5000 Stonecat 1 0.17 138 --- 20 --- Walleye 1 0.17 452 --- 930 --- Western silvery minnow 27 4.53 107 80-133 18 10-30 White sucker 52 8.72 323 175-463 453 60-1120
Forsyth - 395 minutes Bigmouth buffalo 1 0.15 492 --- 1920 ---
Black crappie 1 0.15 200 --- 140 --- Blue sucker 4 0.61 728 628-775 3695 1980-4600 Burbot 3 0.46 327 294-348 163 120-210 Carp 22 3.34 528 371-650 2040 900-3020 Channel catfish 51 7.75 440 244-639 956 110-3420 Emerald shiner 65 9.87 83 68-100 --- --- Flathead chub 39 5.92 126 88-162 24 10-50 Freshwater drum 10 1.52 358 322-423 666 360-1210 Goldeye 273 41.47 322 281-377 312 230-520 Longnose sucker 28 4.25 321 227-416 367 100-800 Northern pike 2 0.30 741 682-799 2640 2160-3120 River carpsucker 47 7.14 379 146-426 743 30-1110 Sauger 34 5.16 411 265-600 599 120-1580 Shorthead redhorse 299 45.42 271 100-490 286 10-1210 Shovelnose sturgeon 4 0.61 788 747-835 2218 1750-2640 Smallmouth bass 190 28.86 186 70-394 256 10-1000 Smallmouth buffalo 8 1.22 529 482-636 2104 1550-3700 Walleye 5 0.76 456 223-570 1178 120-2150 Western silvery minnow 280 42.53 96 38-125 12 --- White sucker 38 5.77 333 115-424 477 20-900
Miles City - 350 minutes Black Crappie 1 0.17 266 --- 350 ---
Blue sucker 5 0.86 703 656-758 3010 2310-3780 Burbot 1 0.17 235 --- 60 --- Carp 19 3.26 524 125-626 2134 30-3230 Channel catfish 16 2.74 452 244-642 1040 130-2640
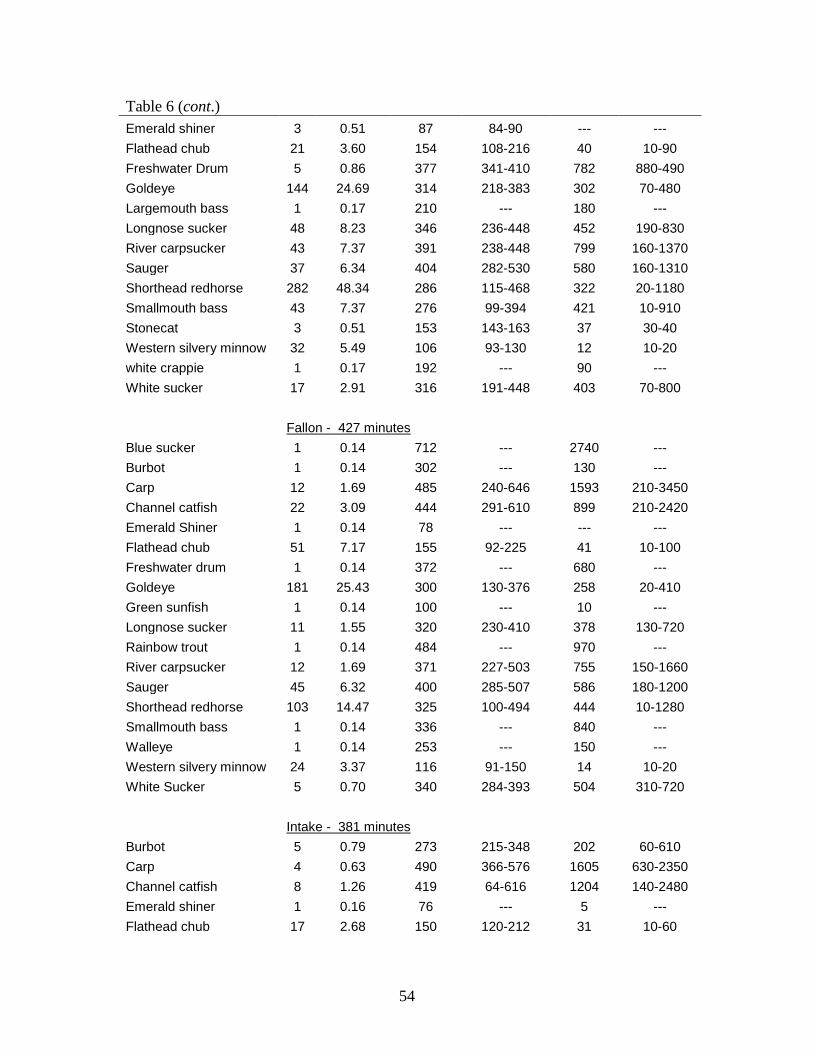
54
Table 6 (cont.) Emerald shiner 3 0.51 87 84-90 --- ---
Flathead chub 21 3.60 154 108-216 40 10-90 Freshwater Drum 5 0.86 377 341-410 782 880-490 Goldeye 144 24.69 314 218-383 302 70-480 Largemouth bass 1 0.17 210 --- 180 --- Longnose sucker 48 8.23 346 236-448 452 190-830 River carpsucker 43 7.37 391 238-448 799 160-1370 Sauger 37 6.34 404 282-530 580 160-1310 Shorthead redhorse 282 48.34 286 115-468 322 20-1180 Smallmouth bass 43 7.37 276 99-394 421 10-910 Stonecat 3 0.51 153 143-163 37 30-40 Western silvery minnow 32 5.49 106 93-130 12 10-20 white crappie 1 0.17 192 --- 90 --- White sucker 17 2.91 316 191-448 403 70-800
Fallon - 427 minutes Blue sucker 1 0.14 712 --- 2740 ---
Burbot 1 0.14 302 --- 130 --- Carp 12 1.69 485 240-646 1593 210-3450 Channel catfish 22 3.09 444 291-610 899 210-2420 Emerald Shiner 1 0.14 78 --- --- --- Flathead chub 51 7.17 155 92-225 41 10-100 Freshwater drum 1 0.14 372 --- 680 --- Goldeye 181 25.43 300 130-376 258 20-410 Green sunfish 1 0.14 100 --- 10 --- Longnose sucker 11 1.55 320 230-410 378 130-720 Rainbow trout 1 0.14 484 --- 970 --- River carpsucker 12 1.69 371 227-503 755 150-1660 Sauger 45 6.32 400 285-507 586 180-1200 Shorthead redhorse 103 14.47 325 100-494 444 10-1280 Smallmouth bass 1 0.14 336 --- 840 --- Walleye 1 0.14 253 --- 150 --- Western silvery minnow 24 3.37 116 91-150 14 10-20 White Sucker 5 0.70 340 284-393 504 310-720
Intake - 381 minutes Burbot 5 0.79 273 215-348 202 60-610
Carp 4 0.63 490 366-576 1605 630-2350 Channel catfish 8 1.26 419 64-616 1204 140-2480 Emerald shiner 1 0.16 76 --- 5 --- Flathead chub 17 2.68 150 120-212 31 10-60

55
Table 6 (cont.) Freshwater Drum 3 0.47 171 167-176 33 25-50
Goldeye 447 70.39 273 104-361 212 20-450 Northern Pike 1 0.16 630 --- 1150 --- Rainbow trout 1 0.16 438 --- 850 --- River carpsucker 18 2.83 327 185-470 634 70-1590 Sauger 194 30.55 309 165-523 255 10-1250 Shorthead redhorse 44 6.93 260 151-395 217 40-450 Shovelnose sturgeon 2 0.31 352 293-411 110 50-170 Smallmouth buffalo 3 0.47 513 473-557 1992 1350-2425 Stonecat 45 7.09 122 103-150 10 10 Walleye 1 0.16 426 --- 620 ---
Table 7. Results of trend sampling in the Yellowstone River, 2007.
C/f Mean Length Mean Weight
Species N (fish/hour) Length (mm)
Range (mm)
Weight (gm)
Range (gm)
Downstream of Rancher Diversion Dam - 382 minutes Blue Sucker 3 0.47 739 691-781 3953 2960-5000
Bigmouth Buffalo 3 0.47 614 403-840 4230 1030-8200 Burbot 1 0.16 295 --- 110 --- Carp 96 15.08 598 352-706 2933 210-7720 Channel catfish 162 25.44 566 341-763 2112 390-5900 Emerald Shiner 24 3.77 89 --- --- --- Flathead chub 530 83.25 132 105-160 25 10-50 Freshwater drum 2 0.31 402 369-435 965 640-1290 Goldeye 47 7.38 328 300-360 322 250-430 Longnose sucker 61 9.58 258 125-431 209 10-810 Mountain Sucker 2 0.31 163 158-167 60 60-60 River carpsucker 163 25.60 395 226-450 809 190-1250 Sauger 9 1.41 427 314-536 774 240-1700 Shorthead redhorse 456 71.62 322 128-512 434 20-1360 Smallmouth bass 99 15.55 177 70-374 228 10-1050 Smallmouth buffalo 12 1.88 581 452-716 3009 1310-5100 Walleye 5 0.79 604 510-743 3048 1460-6000 Western silvery minnow 92 14.45 111 80-199 13 10-30 White sucker 82 12.88 328 138-446 437 30-1000 Yellow perch 2 0.31 175 172-177 60 50-70
56
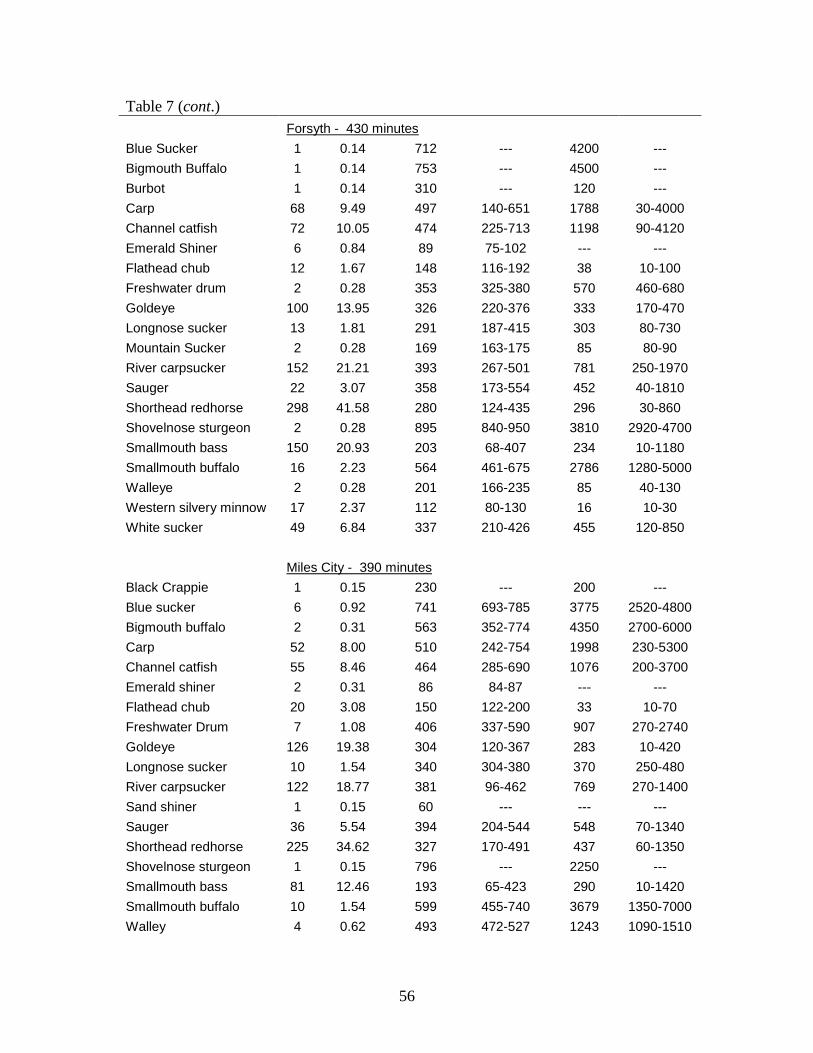
Table 7 (cont.)
Forsyth - 430 minutes
Blue Sucker 1 0.14 712 --- 4200 --- Bigmouth Buffalo 1 0.14 753 --- 4500 --- Burbot 1 0.14 310 --- 120 --- Carp 68 9.49 497 140-651 1788 30-4000 Channel catfish 72 10.05 474 225-713 1198 90-4120 Emerald Shiner 6 0.84 89 75-102 --- --- Flathead chub 12 1.67 148 116-192 38 10-100 Freshwater drum 2 0.28 353 325-380 570 460-680 Goldeye 100 13.95 326 220-376 333 170-470 Longnose sucker 13 1.81 291 187-415 303 80-730 Mountain Sucker 2 0.28 169 163-175 85 80-90 River carpsucker 152 21.21 393 267-501 781 250-1970 Sauger 22 3.07 358 173-554 452 40-1810 Shorthead redhorse 298 41.58 280 124-435 296 30-860 Shovelnose sturgeon 2 0.28 895 840-950 3810 2920-4700 Smallmouth bass 150 20.93 203 68-407 234 10-1180 Smallmouth buffalo 16 2.23 564 461-675 2786 1280-5000 Walleye 2 0.28 201 166-235 85 40-130 Western silvery minnow 17 2.37 112 80-130 16 10-30 White sucker 49 6.84 337 210-426 455 120-850
Miles City - 390 minutes Black Crappie 1 0.15 230 --- 200 ---
Blue sucker 6 0.92 741 693-785 3775 2520-4800 Bigmouth buffalo 2 0.31 563 352-774 4350 2700-6000 Carp 52 8.00 510 242-754 1998 230-5300 Channel catfish 55 8.46 464 285-690 1076 200-3700 Emerald shiner 2 0.31 86 84-87 --- --- Flathead chub 20 3.08 150 122-200 33 10-70 Freshwater Drum 7 1.08 406 337-590 907 270-2740 Goldeye 126 19.38 304 120-367 283 10-420 Longnose sucker 10 1.54 340 304-380 370 250-480 River carpsucker 122 18.77 381 96-462 769 270-1400 Sand shiner 1 0.15 60 --- --- --- Sauger 36 5.54 394 204-544 548 70-1340 Shorthead redhorse 225 34.62 327 170-491 437 60-1350 Shovelnose sturgeon 1 0.15 796 --- 2250 --- Smallmouth bass 81 12.46 193 65-423 290 10-1420 Smallmouth buffalo 10 1.54 599 455-740 3679 1350-7000 Walley 4 0.62 493 472-527 1243 1090-1510

57
Table 7 (cont.) Western silvery minnow 2 0.31 123 115-130 15 10-20
White sucker 19 2.92 342 179-420 505 60-850
Fallon - 462 minutes Blue sucker 7 0.91 692 527-833 2776 1280-4200
Burbot 1 0.13 525 --- 2310 --- Carp 27 3.51 445 100-612 1459 20-3410 Channel catfish 25 3.25 446 76-662 1267 50-3180 Emerald Shiner 13 1.69 85 78-96 --- --- Flathead chub 79 10.26 140 83-225 31 10-110 Freshwater drum 10 1.30 318 242-405 450 180-830 Goldeye 167 21.69 247 74-365 184 10-370 Longnose sucker 3 0.39 304 210-357 337 110-460 Northern Pike 2 0.26 517 515-518 820 780-860 River carpsucker 71 9.22 381 117-755 828 10-1940 Sauger 92 11.95 387 215-520 507 90-1160 Shorthead redhorse 152 19.74 308 145-437 377 30-900 Smallmouth bass 1 0.13 300 --- 450 --- Smallmouth buffalo 2 0.26 435 296-573 1425 440-2410 Walleye 3 0.39 322 170-565 493 70-1300 Western silvery minnow 78 10.13 111 87-140 12 10-30 White Sucker 3 0.39 290 220-345 327 140-480
Intake - 383 minutes Bigmouth buffalo 2 0.31 359 60-658 5000 ---
Burbot 2 0.31 347 300-393 260 170-350 Carp 3 0.47 473 403-550 1287 850-1860 Channel catfish 7 1.10 472 258-732 1229 140-3840 Emerald shiner 34 5.33 85 78-95 --- --- Flathead chub 31 4.86 148 102-205 34 10-70 Freshwater Drum 9 1.41 360 260-456 686 210-1410 Goldeye 75 11.75 251 77-366 199 10-480 River carpsucker 93 14.57 388 150-595 990 90-2750 Sauger 222 34.78 325 195-491 276 60-860 Shorthead redhorse 46 7.21 263 131-714 400 20-6200 Shovelnose sturgeon 42 6.58 516 305-708 584 90-1340 Stonecat 1 0.16 155 --- 90 --- Western silvery minnow 83 13.00 108 70-127 13 10-20 White Sucker 1 0.16 220 --- 450 --- Walleye 3 0.47 217 213-221 80 70-90

58
Table 8. Results of trend sampling in the Yellowstone River, 2008.
C/f Mean Length Mean Weight
Species N (fish/hour) Length (mm)
Range (mm)
Weight (gm)
Range (gm)
Downstream of Rancher Diversion Dam - 339 minutes Bigmouth Buffalo 6 1.06 490 83-627 2828 1890-3780
Black crappie 1 0.18 248 --- 250 --- Brown trout 1 0.18 125 --- 20 --- Burbot 1 0.18 335 --- 180 --- Carp 74 13.10 578 377-708 2554 510-4900 Channel catfish 80 14.16 563 394-754 2251 640-6620 Emerald Shiner 33 5.84 71 51-95 --- --- Flathead chub 27 4.78 123 89-180 23 10-70 Freshwater drum 13 2.30 389 315-458 726 120-1200 Goldeye 81 14.34 331 234-395 318 140-450 Largemoth bass 1 0.18 98 --- 10 --- Longnose dace 1 0.18 72 --- --- --- Longnose sucker 112 19.83 303 135-480 354 30-1320 River carpsucker 115 20.36 387 133-452 770 40-1170 Sauger 11 1.95 450 370-613 840 390-2160 Shorthead redhorse 313 55.41 334 107-500 483 10-1320 Smallmouth bass 136 24.08 192 68-412 162 10-1160 Smallmouth buffalo 7 1.24 593 505-790 3366 2040-7500 Walleye 23 4.07 540 160-735 2047 30-5200 Western silvery minnow 97 17.17 91 58-147 18 5-115 White sucker 94 16.64 356 119-467 557 10-1150
Forsyth - 362 minutes Bigmouth buffalo 1 0.17 543 --- 2340 ---
Blue sucker 5 0.83 754 688-796 3452 2370-4600 Brown trout 1 0.17 234 --- 100 --- Burbot 1 0.17 358 --- 230 --- Carp 84 13.94 533 272-2030 1828 320-4100 Channel catfish 55 9.13 464 236-820 1163 100-6400 Emerald shiner 9 1.49 85 56-109 --- --- Flathead chub 15 2.49 152 101-192 41 Oct-80 Freshwater drum 20 3.32 359 260-456 643 210-1330 Goldeye 200 33.19 327 233-400 306 140-570 Longnose sucker 23 3.82 326 135-421 457 20-1010 Plains Minnow 1 0.17 66 --- --- --- River carpsucker 250 41.48 375 213-495 702 120-1400 Sauger 97 16.10 364 248-568 408 100-1740
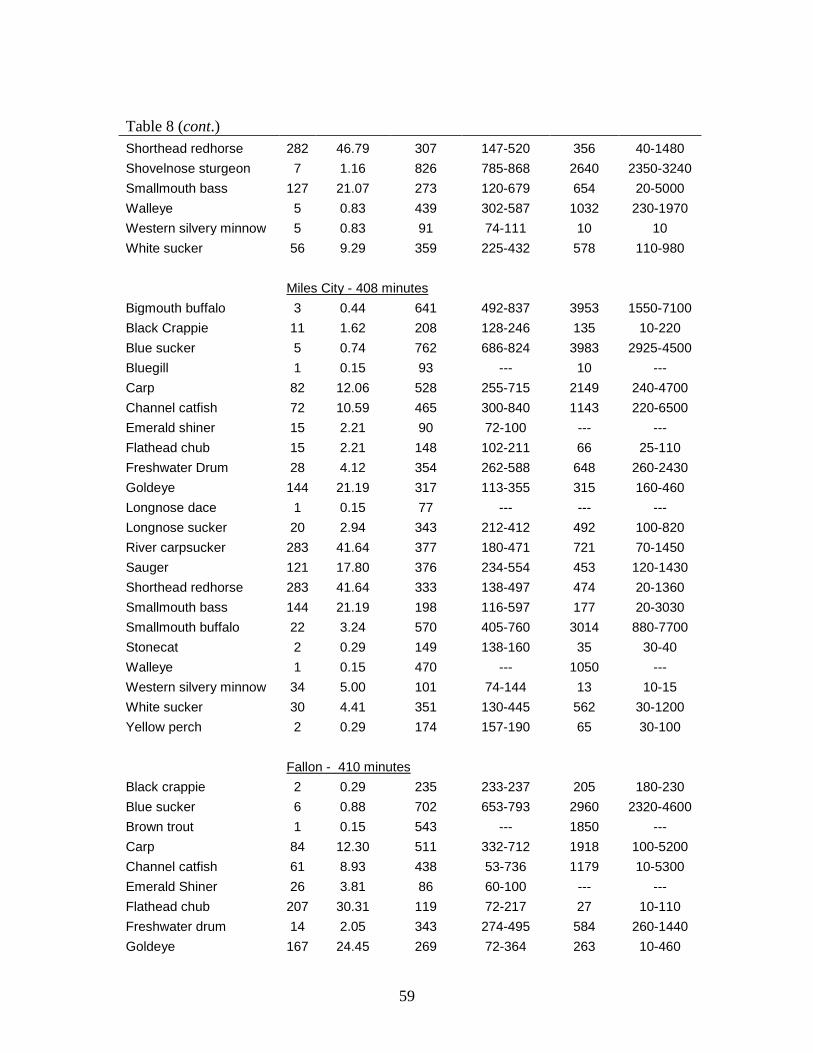
59
Table 8 (cont.) Shorthead redhorse 282 46.79 307 147-520 356 40-1480
Shovelnose sturgeon 7 1.16 826 785-868 2640 2350-3240 Smallmouth bass 127 21.07 273 120-679 654 20-5000 Walleye 5 0.83 439 302-587 1032 230-1970 Western silvery minnow 5 0.83 91 74-111 10 10 White sucker 56 9.29 359 225-432 578 110-980
Miles City - 408 minutes Bigmouth buffalo 3 0.44 641 492-837 3953 1550-7100
Black Crappie 11 1.62 208 128-246 135 10-220 Blue sucker 5 0.74 762 686-824 3983 2925-4500 Bluegill 1 0.15 93 --- 10 --- Carp 82 12.06 528 255-715 2149 240-4700 Channel catfish 72 10.59 465 300-840 1143 220-6500 Emerald shiner 15 2.21 90 72-100 --- --- Flathead chub 15 2.21 148 102-211 66 25-110 Freshwater Drum 28 4.12 354 262-588 648 260-2430 Goldeye 144 21.19 317 113-355 315 160-460 Longnose dace 1 0.15 77 --- --- --- Longnose sucker 20 2.94 343 212-412 492 100-820 River carpsucker 283 41.64 377 180-471 721 70-1450 Sauger 121 17.80 376 234-554 453 120-1430 Shorthead redhorse 283 41.64 333 138-497 474 20-1360 Smallmouth bass 144 21.19 198 116-597 177 20-3030 Smallmouth buffalo 22 3.24 570 405-760 3014 880-7700 Stonecat 2 0.29 149 138-160 35 30-40 Walleye 1 0.15 470 --- 1050 --- Western silvery minnow 34 5.00 101 74-144 13 10-15 White sucker 30 4.41 351 130-445 562 30-1200 Yellow perch 2 0.29 174 157-190 65 30-100
Fallon - 410 minutes Black crappie 2 0.29 235 233-237 205 180-230
Blue sucker 6 0.88 702 653-793 2960 2320-4600 Brown trout 1 0.15 543 --- 1850 --- Carp 84 12.30 511 332-712 1918 100-5200 Channel catfish 61 8.93 438 53-736 1179 10-5300 Emerald Shiner 26 3.81 86 60-100 --- --- Flathead chub 207 30.31 119 72-217 27 10-110 Freshwater drum 14 2.05 343 274-495 584 260-1440 Goldeye 167 24.45 269 72-364 263 10-460

60
Table 8 (cont.) Longnose sucker 1 0.15 370 --- 620 ---
Northern pike 1 0.15 826 --- 4300 --- River carpsucker 103 15.08 348 160-506 638 45-1880 Sauger 158 23.13 397 185-589 533 60-1510 Shorthead redhorse 225 32.94 260 110-452 268 15-980 Smallmouth bass 17 2.49 441 153-690 2078 50-5500 Stonecat 3 0.44 102 82-132 20 20-20 Walleye 3 0.44 334 165-490 527 60-1180 Western silvery minnow 50 7.32 95 71-135 18 10-30 White crappie 3 0.44 169 153-182 83 70-100 White Sucker 6 0.88 346 286-463 470 270-700
Intake - 359 minutes Bigmouth Buffalo 1 0.17 700 --- 6400 ---
Blue sucker 2 0.33 750 730-770 3825 3800-3850 Burbot 4 0.67 304 162-470 215 20-530 Carp 27 4.51 550 395-695 2162 260-4400 Channel catfish 44 7.35 358 66-752 666 10-3940 Emerald shiner 200 33.41 83 57-100 --- --- Flathead chub 202 33.74 130 42-243 33 5-110 Freshwater Drum 15 2.51 322 250-437 454 190-1130 Goldeye 145 24.22 290 110-385 264 10-440 Longnose sucker 2 0.33 274 250-298 265 220-310 River carpsucker 69 11.53 357 125-543 757 40-2620 Sand Shiner 1 0.17 57 --- --- --- Sauger 300 50.11 304 147-555 251 20-1330 Shorthead redhorse 92 15.37 244 127-500 188 20-540 Shovelnose sturgeon 32 5.35 542 267-850 746 50-2660 Smallmouth bass 1 0.17 220 --- 190 --- Smallmouth buffalo 7 1.17 659 531-750 3829 1500-6000 Stonecat 2 0.33 115 95-135 20 10-30 Walleye 7 1.17 275 163-470 239 30-900 Western silvery minnow 70 11.69 82 64-119 --- --- White sucker 6 1.00 347 304-418 488 320-830
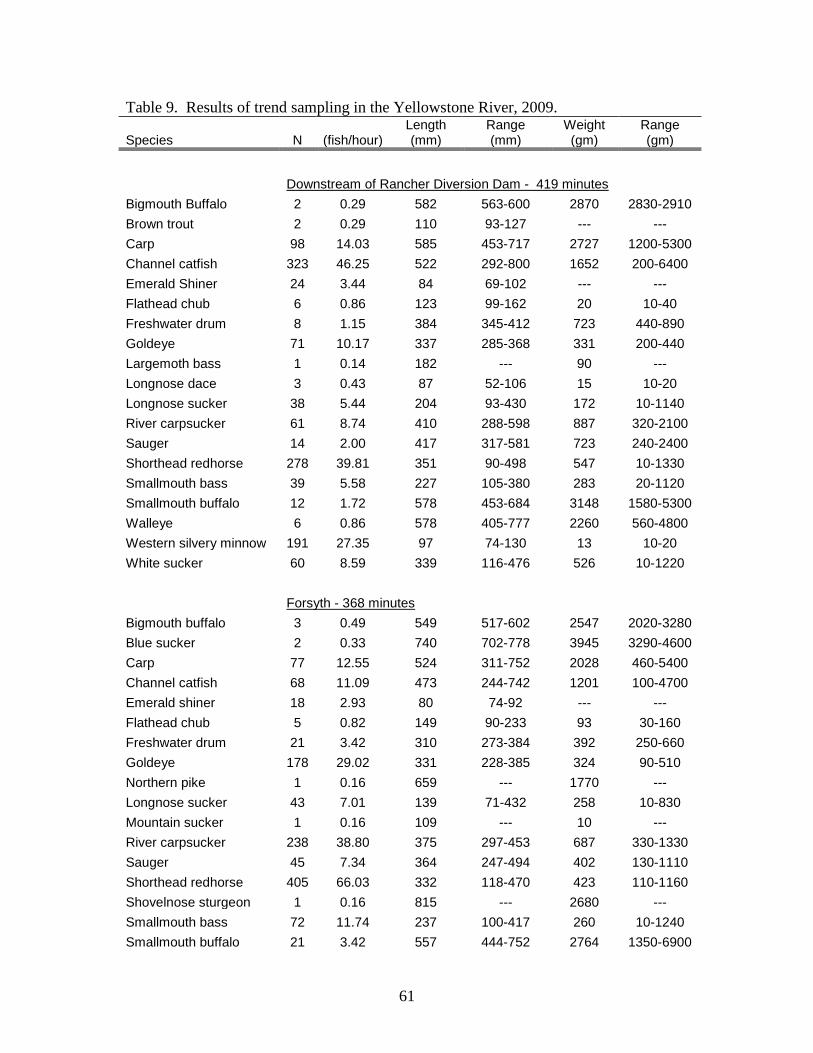
61
Table 9. Results of trend sampling in the Yellowstone River, 2009.
Species N (fish/hour) Length (mm)
Range (mm)
Weight (gm)
Range (gm)
Downstream of Rancher Diversion Dam - 419 minutes Bigmouth Buffalo 2 0.29 582 563-600 2870 2830-2910
Brown trout 2 0.29 110 93-127 --- --- Carp 98 14.03 585 453-717 2727 1200-5300 Channel catfish 323 46.25 522 292-800 1652 200-6400 Emerald Shiner 24 3.44 84 69-102 --- --- Flathead chub 6 0.86 123 99-162 20 10-40 Freshwater drum 8 1.15 384 345-412 723 440-890 Goldeye 71 10.17 337 285-368 331 200-440 Largemoth bass 1 0.14 182 --- 90 --- Longnose dace 3 0.43 87 52-106 15 10-20 Longnose sucker 38 5.44 204 93-430 172 10-1140 River carpsucker 61 8.74 410 288-598 887 320-2100 Sauger 14 2.00 417 317-581 723 240-2400 Shorthead redhorse 278 39.81 351 90-498 547 10-1330 Smallmouth bass 39 5.58 227 105-380 283 20-1120 Smallmouth buffalo 12 1.72 578 453-684 3148 1580-5300 Walleye 6 0.86 578 405-777 2260 560-4800 Western silvery minnow 191 27.35 97 74-130 13 10-20 White sucker 60 8.59 339 116-476 526 10-1220
Forsyth - 368 minutes Bigmouth buffalo 3 0.49 549 517-602 2547 2020-3280
Blue sucker 2 0.33 740 702-778 3945 3290-4600 Carp 77 12.55 524 311-752 2028 460-5400 Channel catfish 68 11.09 473 244-742 1201 100-4700 Emerald shiner 18 2.93 80 74-92 --- --- Flathead chub 5 0.82 149 90-233 93 30-160 Freshwater drum 21 3.42 310 273-384 392 250-660 Goldeye 178 29.02 331 228-385 324 90-510 Northern pike 1 0.16 659 --- 1770 --- Longnose sucker 43 7.01 139 71-432 258 10-830 Mountain sucker 1 0.16 109 --- 10 --- River carpsucker 238 38.80 375 297-453 687 330-1330 Sauger 45 7.34 364 247-494 402 130-1110 Shorthead redhorse 405 66.03 332 118-470 423 110-1160 Shovelnose sturgeon 1 0.16 815 --- 2680 --- Smallmouth bass 72 11.74 237 100-417 260 10-1240 Smallmouth buffalo 21 3.42 557 444-752 2764 1350-6900
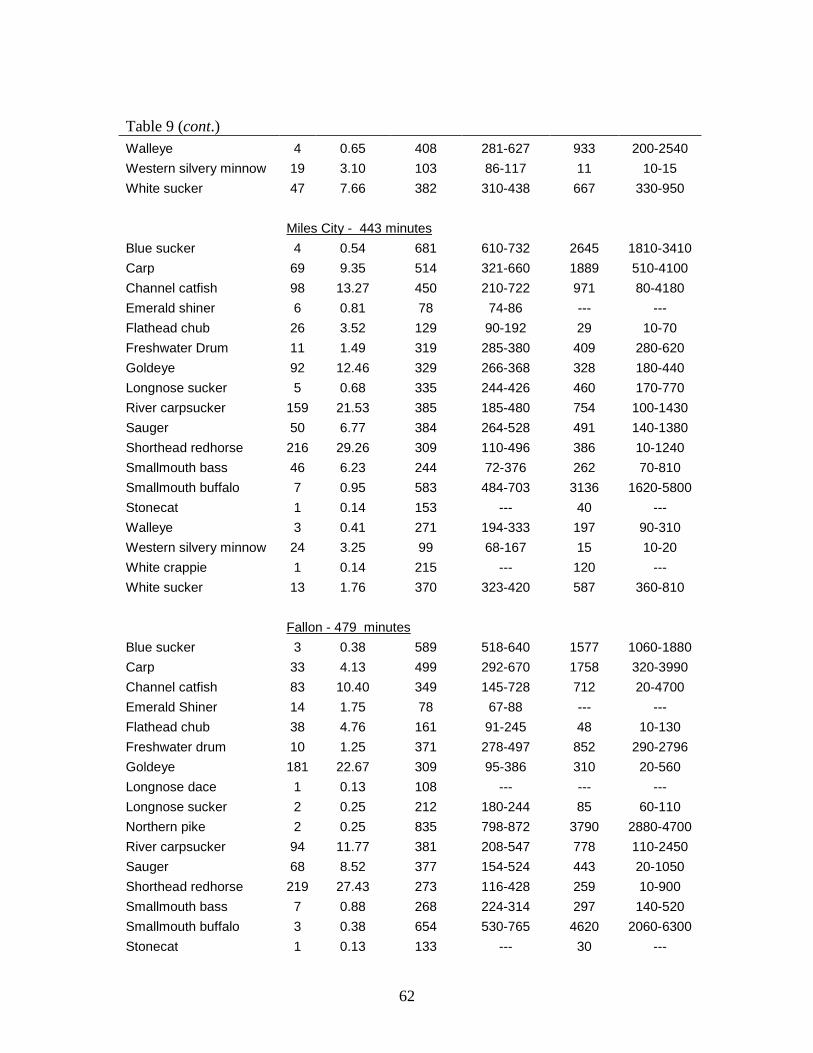
62
Table 9 (cont.) Walleye 4 0.65 408 281-627 933 200-2540
Western silvery minnow 19 3.10 103 86-117 11 10-15 White sucker 47 7.66 382 310-438 667 330-950
Miles City - 443 minutes Blue sucker 4 0.54 681 610-732 2645 1810-3410
Carp 69 9.35 514 321-660 1889 510-4100 Channel catfish 98 13.27 450 210-722 971 80-4180 Emerald shiner 6 0.81 78 74-86 --- --- Flathead chub 26 3.52 129 90-192 29 10-70 Freshwater Drum 11 1.49 319 285-380 409 280-620 Goldeye 92 12.46 329 266-368 328 180-440 Longnose sucker 5 0.68 335 244-426 460 170-770 River carpsucker 159 21.53 385 185-480 754 100-1430 Sauger 50 6.77 384 264-528 491 140-1380 Shorthead redhorse 216 29.26 309 110-496 386 10-1240 Smallmouth bass 46 6.23 244 72-376 262 70-810 Smallmouth buffalo 7 0.95 583 484-703 3136 1620-5800 Stonecat 1 0.14 153 --- 40 --- Walleye 3 0.41 271 194-333 197 90-310 Western silvery minnow 24 3.25 99 68-167 15 10-20 White crappie 1 0.14 215 --- 120 --- White sucker 13 1.76 370 323-420 587 360-810
Fallon - 479 minutes Blue sucker 3 0.38 589 518-640 1577 1060-1880
Carp 33 4.13 499 292-670 1758 320-3990 Channel catfish 83 10.40 349 145-728 712 20-4700 Emerald Shiner 14 1.75 78 67-88 --- --- Flathead chub 38 4.76 161 91-245 48 10-130 Freshwater drum 10 1.25 371 278-497 852 290-2796 Goldeye 181 22.67 309 95-386 310 20-560 Longnose dace 1 0.13 108 --- --- --- Longnose sucker 2 0.25 212 180-244 85 60-110 Northern pike 2 0.25 835 798-872 3790 2880-4700 River carpsucker 94 11.77 381 208-547 778 110-2450 Sauger 68 8.52 377 154-524 443 20-1050 Shorthead redhorse 219 27.43 273 116-428 259 10-900 Smallmouth bass 7 0.88 268 224-314 297 140-520 Smallmouth buffalo 3 0.38 654 530-765 4620 2060-6300 Stonecat 1 0.13 133 --- 30 ---
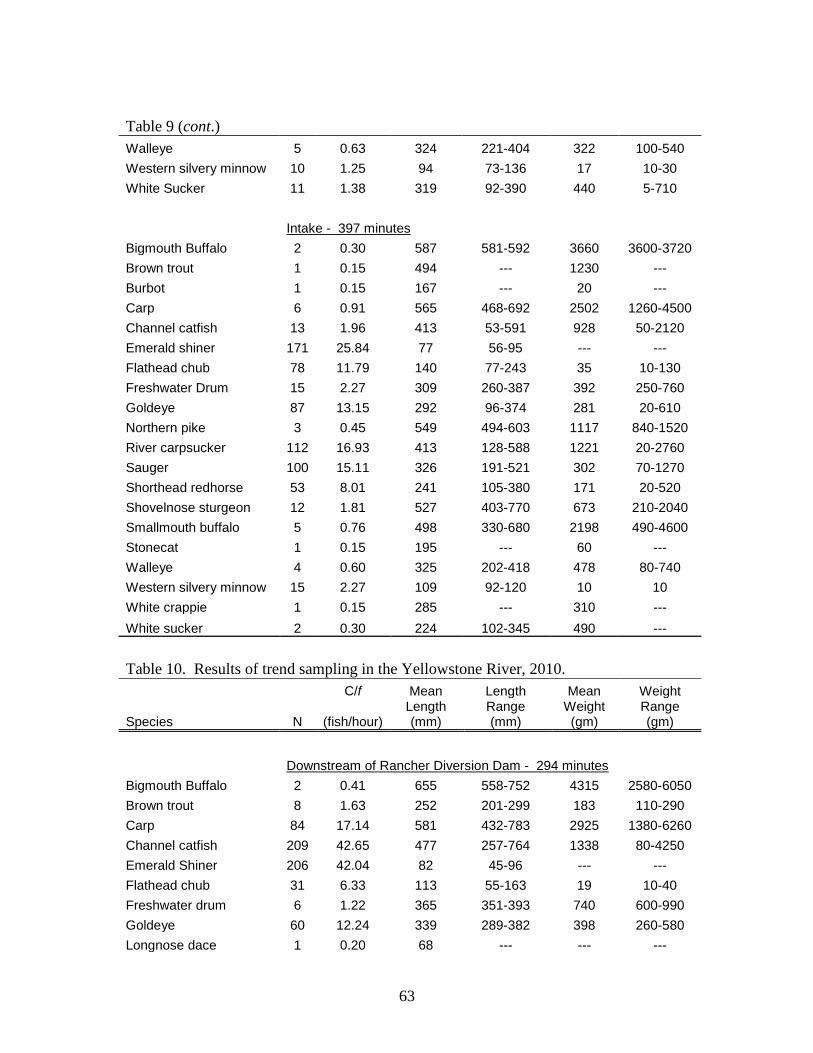
63
Table 9 (cont.) Walleye 5 0.63 324 221-404 322 100-540
Western silvery minnow 10 1.25 94 73-136 17 10-30 White Sucker 11 1.38 319 92-390 440 5-710
Intake - 397 minutes Bigmouth Buffalo 2 0.30 587 581-592 3660 3600-3720
Brown trout 1 0.15 494 --- 1230 --- Burbot 1 0.15 167 --- 20 --- Carp 6 0.91 565 468-692 2502 1260-4500 Channel catfish 13 1.96 413 53-591 928 50-2120 Emerald shiner 171 25.84 77 56-95 --- --- Flathead chub 78 11.79 140 77-243 35 10-130 Freshwater Drum 15 2.27 309 260-387 392 250-760 Goldeye 87 13.15 292 96-374 281 20-610 Northern pike 3 0.45 549 494-603 1117 840-1520 River carpsucker 112 16.93 413 128-588 1221 20-2760 Sauger 100 15.11 326 191-521 302 70-1270 Shorthead redhorse 53 8.01 241 105-380 171 20-520 Shovelnose sturgeon 12 1.81 527 403-770 673 210-2040 Smallmouth buffalo 5 0.76 498 330-680 2198 490-4600 Stonecat 1 0.15 195 --- 60 --- Walleye 4 0.60 325 202-418 478 80-740 Western silvery minnow 15 2.27 109 92-120 10 10 White crappie 1 0.15 285 --- 310 --- White sucker 2 0.30 224 102-345 490 ---
Table 10. Results of trend sampling in the Yellowstone River, 2010.
C/f Mean Length Mean Weight
Species N (fish/hour) Length (mm)
Range (mm)
Weight (gm)
Range (gm)
Downstream of Rancher Diversion Dam - 294 minutes Bigmouth Buffalo 2 0.41 655 558-752 4315 2580-6050
Brown trout 8 1.63 252 201-299 183 110-290 Carp 84 17.14 581 432-783 2925 1380-6260 Channel catfish 209 42.65 477 257-764 1338 80-4250 Emerald Shiner 206 42.04 82 45-96 --- --- Flathead chub 31 6.33 113 55-163 19 10-40 Freshwater drum 6 1.22 365 351-393 740 600-990 Goldeye 60 12.24 339 289-382 398 260-580 Longnose dace 1 0.20 68 --- --- ---
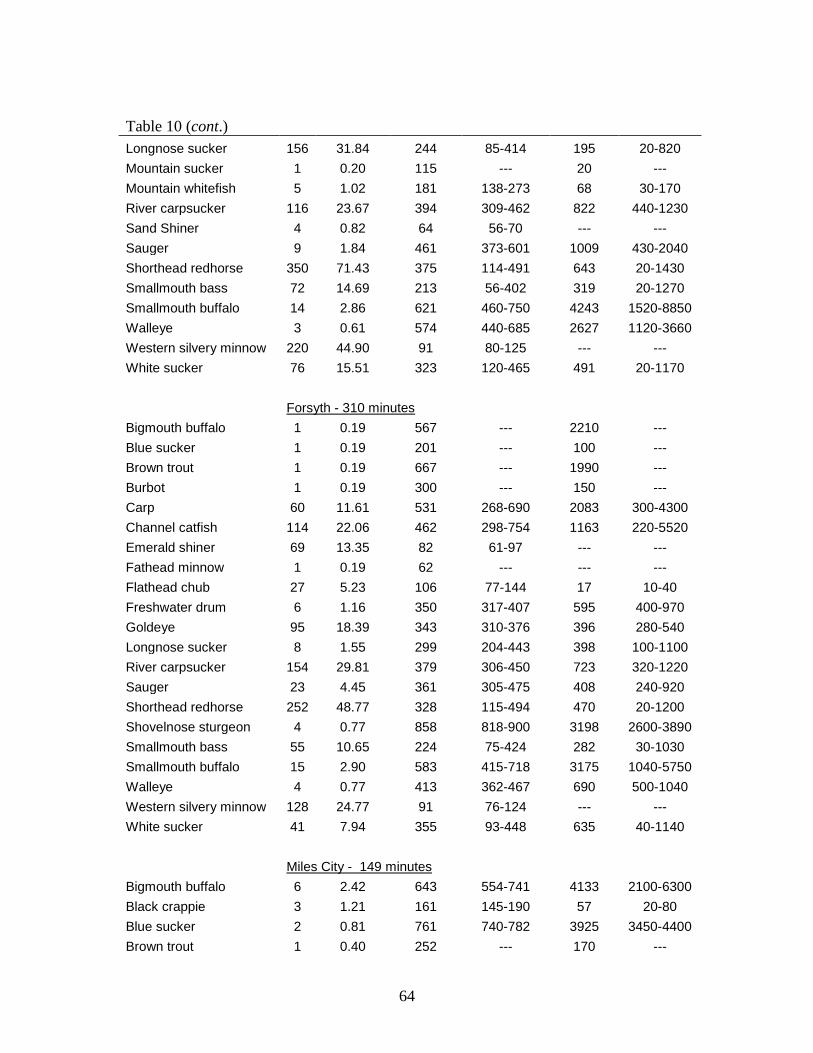
64
Table 10 (cont.) Longnose sucker 156 31.84 244 85-414 195 20-820
Mountain sucker 1 0.20 115 --- 20 --- Mountain whitefish 5 1.02 181 138-273 68 30-170 River carpsucker 116 23.67 394 309-462 822 440-1230 Sand Shiner 4 0.82 64 56-70 --- --- Sauger 9 1.84 461 373-601 1009 430-2040 Shorthead redhorse 350 71.43 375 114-491 643 20-1430 Smallmouth bass 72 14.69 213 56-402 319 20-1270 Smallmouth buffalo 14 2.86 621 460-750 4243 1520-8850 Walleye 3 0.61 574 440-685 2627 1120-3660 Western silvery minnow 220 44.90 91 80-125 --- --- White sucker 76 15.51 323 120-465 491 20-1170
Forsyth - 310 minutes Bigmouth buffalo 1 0.19 567 --- 2210 ---
Blue sucker 1 0.19 201 --- 100 --- Brown trout 1 0.19 667 --- 1990 --- Burbot 1 0.19 300 --- 150 --- Carp 60 11.61 531 268-690 2083 300-4300 Channel catfish 114 22.06 462 298-754 1163 220-5520 Emerald shiner 69 13.35 82 61-97 --- --- Fathead minnow 1 0.19 62 --- --- --- Flathead chub 27 5.23 106 77-144 17 10-40 Freshwater drum 6 1.16 350 317-407 595 400-970 Goldeye 95 18.39 343 310-376 396 280-540 Longnose sucker 8 1.55 299 204-443 398 100-1100 River carpsucker 154 29.81 379 306-450 723 320-1220 Sauger 23 4.45 361 305-475 408 240-920 Shorthead redhorse 252 48.77 328 115-494 470 20-1200 Shovelnose sturgeon 4 0.77 858 818-900 3198 2600-3890 Smallmouth bass 55 10.65 224 75-424 282 30-1030 Smallmouth buffalo 15 2.90 583 415-718 3175 1040-5750 Walleye 4 0.77 413 362-467 690 500-1040 Western silvery minnow 128 24.77 91 76-124 --- --- White sucker 41 7.94 355 93-448 635 40-1140
Miles City - 149 minutes Bigmouth buffalo 6 2.42 643 554-741 4133 2100-6300
Black crappie 3 1.21 161 145-190 57 20-80 Blue sucker 2 0.81 761 740-782 3925 3450-4400 Brown trout 1 0.40 252 --- 170 ---
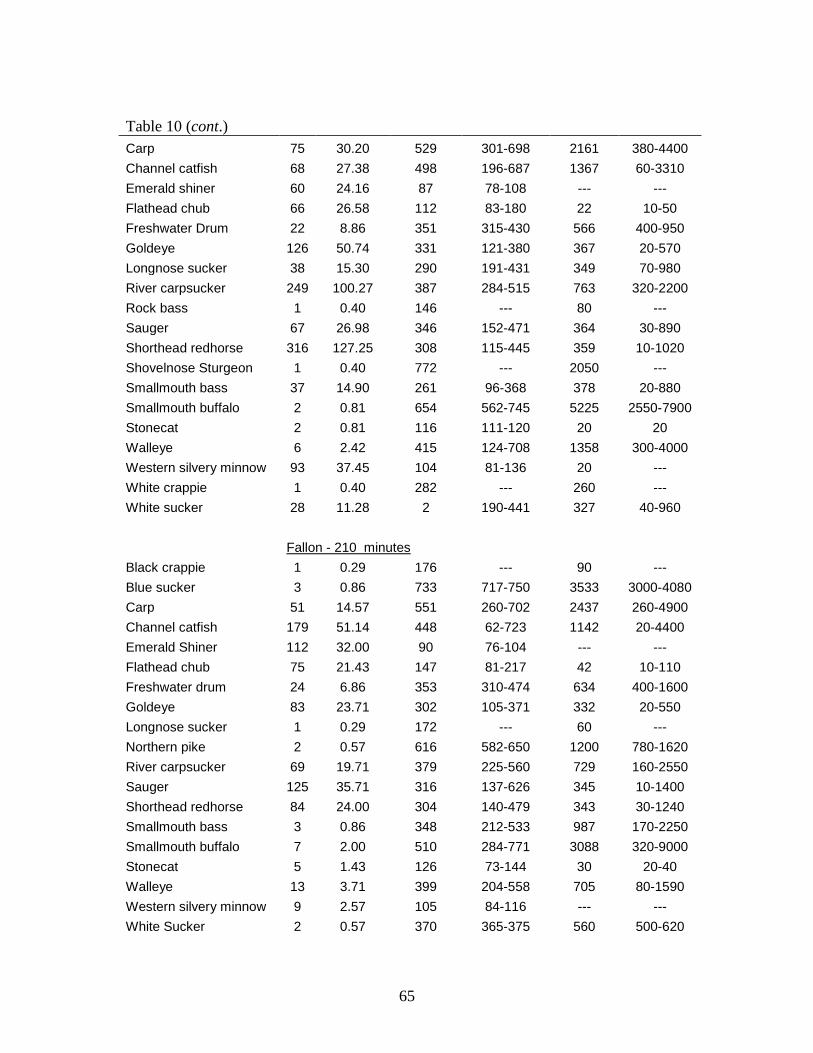
65
Table 10 (cont.) Carp 75 30.20 529 301-698 2161 380-4400
Channel catfish 68 27.38 498 196-687 1367 60-3310 Emerald shiner 60 24.16 87 78-108 --- --- Flathead chub 66 26.58 112 83-180 22 10-50 Freshwater Drum 22 8.86 351 315-430 566 400-950 Goldeye 126 50.74 331 121-380 367 20-570 Longnose sucker 38 15.30 290 191-431 349 70-980 River carpsucker 249 100.27 387 284-515 763 320-2200 Rock bass 1 0.40 146 --- 80 --- Sauger 67 26.98 346 152-471 364 30-890 Shorthead redhorse 316 127.25 308 115-445 359 10-1020 Shovelnose Sturgeon 1 0.40 772 --- 2050 --- Smallmouth bass 37 14.90 261 96-368 378 20-880 Smallmouth buffalo 2 0.81 654 562-745 5225 2550-7900 Stonecat 2 0.81 116 111-120 20 20 Walleye 6 2.42 415 124-708 1358 300-4000 Western silvery minnow 93 37.45 104 81-136 20 --- White crappie 1 0.40 282 --- 260 --- White sucker 28 11.28 2 190-441 327 40-960
Fallon - 210 minutes Black crappie 1 0.29 176 --- 90 ---
Blue sucker 3 0.86 733 717-750 3533 3000-4080 Carp 51 14.57 551 260-702 2437 260-4900 Channel catfish 179 51.14 448 62-723 1142 20-4400 Emerald Shiner 112 32.00 90 76-104 --- --- Flathead chub 75 21.43 147 81-217 42 10-110 Freshwater drum 24 6.86 353 310-474 634 400-1600 Goldeye 83 23.71 302 105-371 332 20-550 Longnose sucker 1 0.29 172 --- 60 --- Northern pike 2 0.57 616 582-650 1200 780-1620 River carpsucker 69 19.71 379 225-560 729 160-2550 Sauger 125 35.71 316 137-626 345 10-1400 Shorthead redhorse 84 24.00 304 140-479 343 30-1240 Smallmouth bass 3 0.86 348 212-533 987 170-2250 Smallmouth buffalo 7 2.00 510 284-771 3088 320-9000 Stonecat 5 1.43 126 73-144 30 20-40 Walleye 13 3.71 399 204-558 705 80-1590 Western silvery minnow 9 2.57 105 84-116 --- --- White Sucker 2 0.57 370 365-375 560 500-620
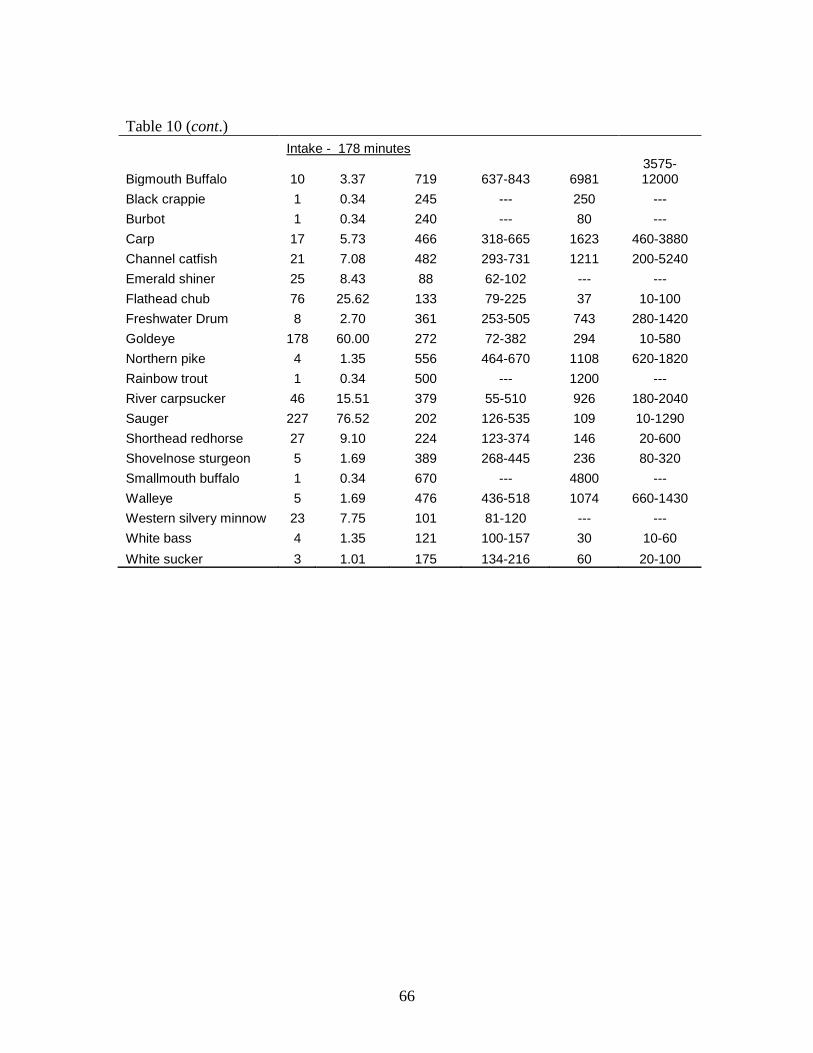
66
Table 10 (cont.)
Intake - 178 minutes
Bigmouth Buffalo 10 3.37 719 637-843 6981
3575-12000
Black crappie 1 0.34 245 --- 250 --- Burbot 1 0.34 240 --- 80 --- Carp 17 5.73 466 318-665 1623 460-3880 Channel catfish 21 7.08 482 293-731 1211 200-5240 Emerald shiner 25 8.43 88 62-102 --- --- Flathead chub 76 25.62 133 79-225 37 10-100 Freshwater Drum 8 2.70 361 253-505 743 280-1420 Goldeye 178 60.00 272 72-382 294 10-580 Northern pike 4 1.35 556 464-670 1108 620-1820 Rainbow trout 1 0.34 500 --- 1200 --- River carpsucker 46 15.51 379 55-510 926 180-2040 Sauger 227 76.52 202 126-535 109 10-1290 Shorthead redhorse 27 9.10 224 123-374 146 20-600 Shovelnose sturgeon 5 1.69 389 268-445 236 80-320 Smallmouth buffalo 1 0.34 670 --- 4800 --- Walleye 5 1.69 476 436-518 1074 660-1430 Western silvery minnow 23 7.75 101 81-120 --- --- White bass 4 1.35 121 100-157 30 10-60 White sucker 3 1.01 175 134-216 60 20-100

67
APPENDIX II
Sauger Sampling Efficiency on the Lower Yellowstone River
Jason Rhoten, Matt Jaeger, Mike Backes, Vic Riggs, Brad Schmitz, Montana Fish, Wildlife & Parks
Abstract The Yellowstone River fish assemblage has been sampled annually each autumn (August, September, and October) with boat-mounted electrofishing equipment to monitor individual species and overall population trends. This trend data has been utilized to make management decisions. Specifically, trend data has greatly influenced decisions and conclusions of sauger Sander canadensis management. It is well recognized that sampling efficiency varies in response to environmental factors such as discharge, turbidity, conductivity, time of day, water temperature, substrate, water depth and others. The magnitude of these effects on sampling efficiency is ambiguous and resultantly disregarded. A relatively small change in the number of fish captured suggests proportionately large changes in abundance because of small sample sizes collected. Therefore, given the low number of captures, the effect of ambient conditions on catch rates greatly influence perceived population trends. Adult sauger were telemetered to address study objectives in the month of April 2005 (N=50), 2006 (N=50), and 2007 (N=70). These fish were relocated in autumn 2005 and 2006 and the likelihood of capture was investigated using a randomly selected gear type (electrofishing or trammel net) under ambient environmental conditions. Only electrofishing gear was used to capture fish relocated during the autumn of 2007. The resulting capture efficiency for trammel nets and electrofishing combined was 13.6%. Electrofishing caught more fish but likelihood of capture was not significantly different between gear types (P = 0.562). Analysis of ambient environmental conditions suggested the combined model was statistically significant (P = 0.001) when all factors were modeled. Depth was the only statistically significant independent coefficient (P = 0.001) when modeled separately. The projected 90-day net median movement of sauger during trend survey season was 0.0 km.
Introduction The Yellowstone River fish assemblage has been sampled annually each autumn
(August, September, and October) with boat-mounted electrofishing equipment since 1998. Trend sampling includes 5 different locations; Forsyth (downstream of Cartersville Diversion), Miles City (above and below the Tongue River confluence), Fallon (above and below the O’ Fallon Creek confluence), Intake (downstream of Intake Diversion) and since 2003, Hysham (downstream of Rancher diversion). Trend areas are approximately 9.6 river km in length and are sampled once in August, September and October. All species encountered are collected, enumerated, measured, and, excepting cyprinids, weighed. An index of abundance (catch per effort) was/is calculated for all species captured. Data collected are analyzed, interpreted and influence management decisions. Currently, sauger Sander canadensis management is of high priority.

68
Sauger were historically present in the Yellowstone River and its tributaries from its confluence with the Missouri River upstream to the thermal transition zone that influences changes in the Yellowstone River fish assemblage near Big Timber, Montana (Brown 1971; Haddix and Estes 1976; Holton and Johnson 2003). Over the past 100 years, sauger distribution in the Yellowstone watershed has decreased as a result of habitat loss, fragmentation, and alteration, primarily related to the installation of hydroelectric and low-head irrigation diversion dams on tributaries (McMahon 1999). Distribution in tributaries has decreased by 95%; sauger are considered rare in the Tongue and Big Horn rivers in Montana, but still occur in the Powder River (McMahon and Gardner 2001). The sauger is listed as a species of special concern in Montana (Montana Natural Heritage Program 2006). However, despite these declines, 2008 and 2010 Yellowstone River trend survey work has documented increased catch rates of sauger downstream of Miles City.
The decline in sauger population has been attributed to various factors including drought, migration barriers, entrainment and exploitation (McMahon 1999, Jaeger 2004). Where plausible, efforts are being made to reduce detrimental impacts. Jaeger (2004) suggested exploitation alone does not prevent sauger recovery but because potential for over-harvest exists monitoring should be continued. Sauger are highly susceptible to overexploitation seasonally when spawning aggregations of entire stocks gather in discrete spawning areas (St. John 1990; Penkal 1992) and migratory behavior results in unusually high concentrations of sauger at dams and diversion structures (Nelson 1969; Hesse 1994; Pegg et al. 1996). Overexploitation during periods of aggregation has been implicated in the collapse of several sauger fisheries (Hesse 1994; Pegg et al. 1996, Maceina et al. 1998). Anglers on the Yellowstone River target potential areas of aggregation and have become more sophisticated and efficient at harvesting sauger in recent years (Stewart 1992; McMahon 1999).
Increased angler efficiency has prompted concern among biologists. Monitoring the sauger population has become increasingly important. Currently, autumn electrofishing trend data are the best available data used to project trends in sauger population abundance. However, a relatively small change in the number of fish captured suggests proportionately large changes in abundances because of small sample sizes collected. It is well established that sampling efficiency varies in response to multiple environmental factors. Therefore, given the low number of captures associated with autumn trend surveys, the effect of ambient conditions on catch rates greatly influence perceived population trends. In addition, sauger movement may potentially further influence capture rates observed during autumn electrofishing. Unfortunately, the magnitude of these effects on sampling efficiency is ambiguous and resultantly disregarded.
Research was conducted attempting to describe the magnitude of the of these effects on sauger sampling efficiency. The objectives of the study were: 1) to quantify the efficiency of electrofishing and trammel nets for capturing Yellowstone River sauger 2) to determine if ambient conditions (abiotic factors) influenced capture efficiency 3) to determine if sauger movements influence capture efficiency and 4) to determine if correction factors could be developed to moderate the effects of environmental stochasticity on catch rate data
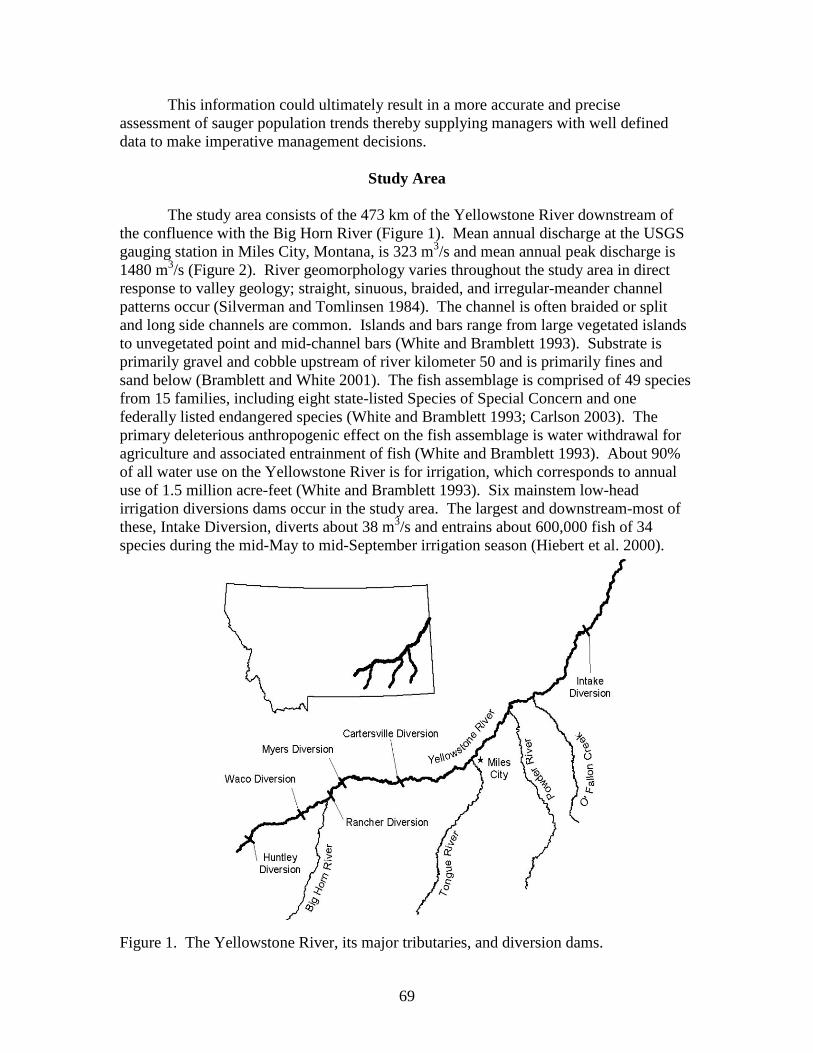
69
This information could ultimately result in a more accurate and precise assessment of sauger population trends thereby supplying managers with well defined data to make imperative management decisions.
Study Area
The study area consists of the 473 km of the Yellowstone River downstream of the confluence with the Big Horn River (Figure 1). Mean annual discharge at the USGS gauging station in Miles City, Montana, is 323 m3/s and mean annual peak discharge is 1480 m3/s (Figure 2). River geomorphology varies throughout the study area in direct response to valley geology; straight, sinuous, braided, and irregular-meander channel patterns occur (Silverman and Tomlinsen 1984). The channel is often braided or split and long side channels are common. Islands and bars range from large vegetated islands to unvegetated point and mid-channel bars (White and Bramblett 1993). Substrate is primarily gravel and cobble upstream of river kilometer 50 and is primarily fines and sand below (Bramblett and White 2001). The fish assemblage is comprised of 49 species from 15 families, including eight state-listed Species of Special Concern and one federally listed endangered species (White and Bramblett 1993; Carlson 2003). The primary deleterious anthropogenic effect on the fish assemblage is water withdrawal for agriculture and associated entrainment of fish (White and Bramblett 1993). About 90% of all water use on the Yellowstone River is for irrigation, which corresponds to annual use of 1.5 million acre-feet (White and Bramblett 1993). Six mainstem low-head irrigation diversions dams occur in the study area. The largest and downstream-most of these, Intake Diversion, diverts about 38 m3/s and entrains about 600,000 fish of 34 species during the mid-May to mid-September irrigation season (Hiebert et al. 2000).
Figure 1. The Yellowstone River, its major tributaries, and diversion dams.

70
Figure 2. Mean annual discharge of the Yellowstone River at Miles City, 1929-2009. Dashed line represents mean annual discharge calculated since 1927.
Methods Fifty radio transmitters with mortality sensors were surgically implanted into adult sauger at known spawning locations between the Powder River and Fallon, Montana in April 2005 and 2006. Fish were captured while congregated in spawning areas by drifting a 125’ 1”X8” trammel net. Tricaine Methanesulfonate (MS 222) was used to anesthetize sauger prior to surgical procedures. An incision on the ventral side of the fish allowed for implantation of a SR-M11-18 Lotek radio transmitter. Upon recovery from anesthesia sauger were contained in a holding tank and their health was visually monitored for approximately 30 minutes before they were released. Following spawning, radio tagged fish redistributed to home locations 5 to 120 kilometers from their initial capture location; therefore, data were not biased by site-specific initial capture probabilities.
Fish were relocated during autumn 2005 and 2006 using radio receivers. Fish location was determined by quadrangulation using a combination of buoys and GPS. Trials with transmitters of known location indicated that relocation accuracy was within 1 to 2 meters of actual radio location. Upon relocation of radio tagged fish a gear type (electrofishing or trammel net) was randomly selected for use. Various ambient conditions (discharge, temperature, conductivity, turbidity, depth, substrate, cloud cover, atmospheric pressure, and prior temperature fluctuation) were recorded in conjunction with the success or failure of the appropriate gear type. Cloud cover was ranked on a scale 1-5 with 1 representing clear sky and 5 overcast sky. The effect of environmental factors on sampling efficiency was modeled using logistic regression models. In addition
0
100
200
300
400
500
600
1930 1940 1950 1960 1970 1980 1990 2000
Dis
char
ge (
m3 /
s)
Year

71
multiple individual ambient conditions were analyzed in an attempt to construct probabilistic models describing the magnitude of effect varying conditions have on sampling efficiency, and develop coefficients for those ambient conditions.
Effort varied slightly in 2007 to maximize information returned. Seventy radio transmitters with mortality sensors were surgically implanted in 2007. The additional 20 radios were to increase sample size and narrow confidence intervals. Fish relocation and capture attempt protocol remained consistent apart from capture gear was limited to electrofishing only. A single sample method was selected to increase the sample size and narrow confidence intervals on ambient environmental conditions under investigation. Capture efficiency between years (2005, 2006, 2007) was also analyzed to document bias that may have occurred as a result of increased expertise of sampling protocol and capture gear.
Upon location of a telemetered sauger the coordinates were documented. Individual fish located two or more times during the efficiency trial were plotted on a map and river km location recorded. Net movement rate (km/d) was calculated for each telemetered sauger. Net movement rate was calculated by dividing the change in river kilometer between successive relocations by the number of days that had elapsed between relocations. A positive rate indicated upstream movement and a negative rate indicated downstream movement (Bramblett 1996). The 90 day (typical trend duration) projected net movement was calculated by multiplying net movement rate by 90.
Results A total of 49, 64, and 182 capture trials occurred in 2005, 2006 and 2007. Of the 295 capture trials, 40 sauger were recaptured. The resulting capture efficiency for trammel nets and electrofishing combined was 13.6%. Electrofishing recaptured 34 (14.1%) fish in 241 trials while trammel nets recapture 6 (11.1%) fish in 54 trials. Electrofishing caught more fish but likelihood of capture was not significantly different between gear types (P = 0.562 Figure 3). Electrofishing efficiency in 2005, 2006 and 2007 was not significantly different (P=0.709 Figure 4). Data analysis of year was conducted on electrofishing in 1.5m of water or less.

72
Gear type (0=net)
Out
com
e
10
0.20
0.15
0.10
0.05
0.00
95% CI for the MeanOutcome vs Gear type (0=net)
Figure 3. Efficiency of trammel netting (0=net) and electrofishing (1=electrofishing). No significant difference was detected between the two different gear types (P=0.562).
Year
Out
com
e
200720062005
0.6
0.5
0.4
0.3
0.2
0.1
0.0
95% CI for the MeanElectrofishing 1.5m or less
Figure 4. Efficiency of electrofishing between 2005, 2006, 2007. No significant difference was detected between the different years (P=0.709).
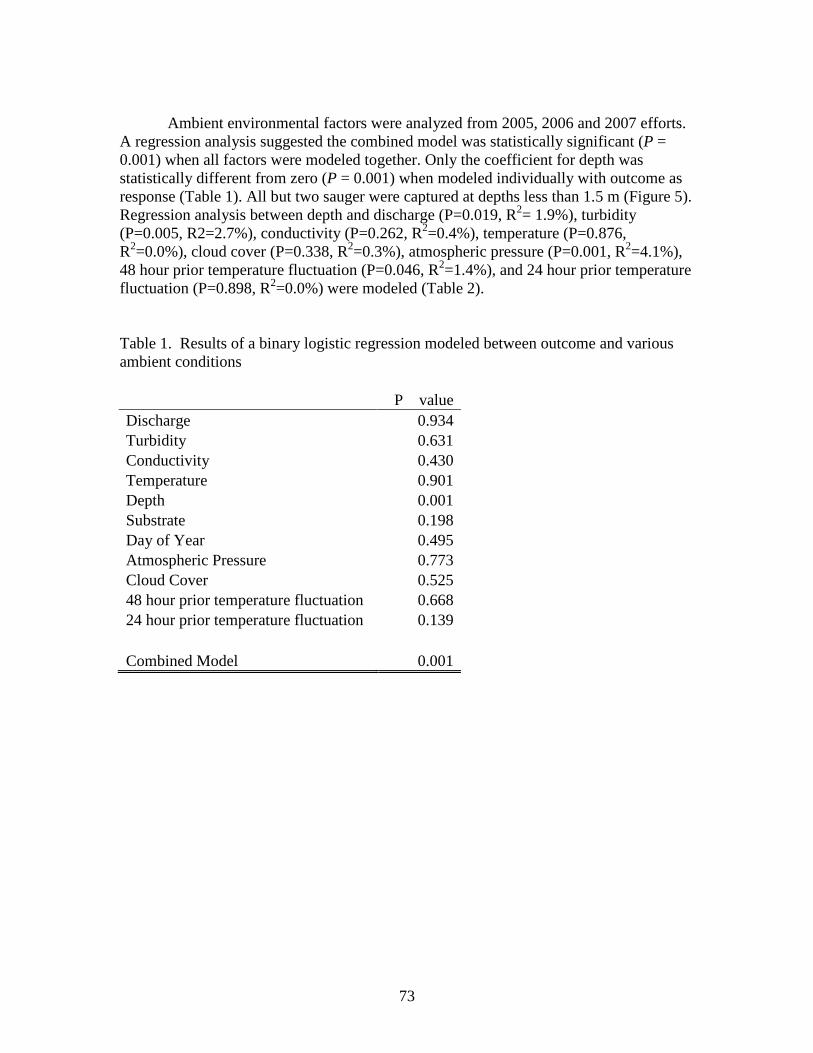
73
Ambient environmental factors were analyzed from 2005, 2006 and 2007 efforts.
A regression analysis suggested the combined model was statistically significant (P = 0.001) when all factors were modeled together. Only the coefficient for depth was statistically different from zero (P = 0.001) when modeled individually with outcome as response (Table 1). All but two sauger were captured at depths less than 1.5 m (Figure 5). Regression analysis between depth and discharge (P=0.019, R2= 1.9%), turbidity (P=0.005, R2=2.7%), conductivity (P=0.262, R2=0.4%), temperature (P=0.876, R2=0.0%), cloud cover (P=0.338, R2=0.3%), atmospheric pressure (P=0.001, R2=4.1%), 48 hour prior temperature fluctuation (P=0.046, R2=1.4%), and 24 hour prior temperature fluctuation (P=0.898, R2=0.0%) were modeled (Table 2).
Table 1. Results of a binary logistic regression modeled between outcome and various ambient conditions
P value Discharge 0.934 Turbidity 0.631 Conductivity 0.430 Temperature 0.901 Depth 0.001 Substrate 0.198 Day of Year 0.495 Atmospheric Pressure 0.773 Cloud Cover 0.525 48 hour prior temperature fluctuation 0.668 24 hour prior temperature fluctuation 0.139
Combined Model 0.001
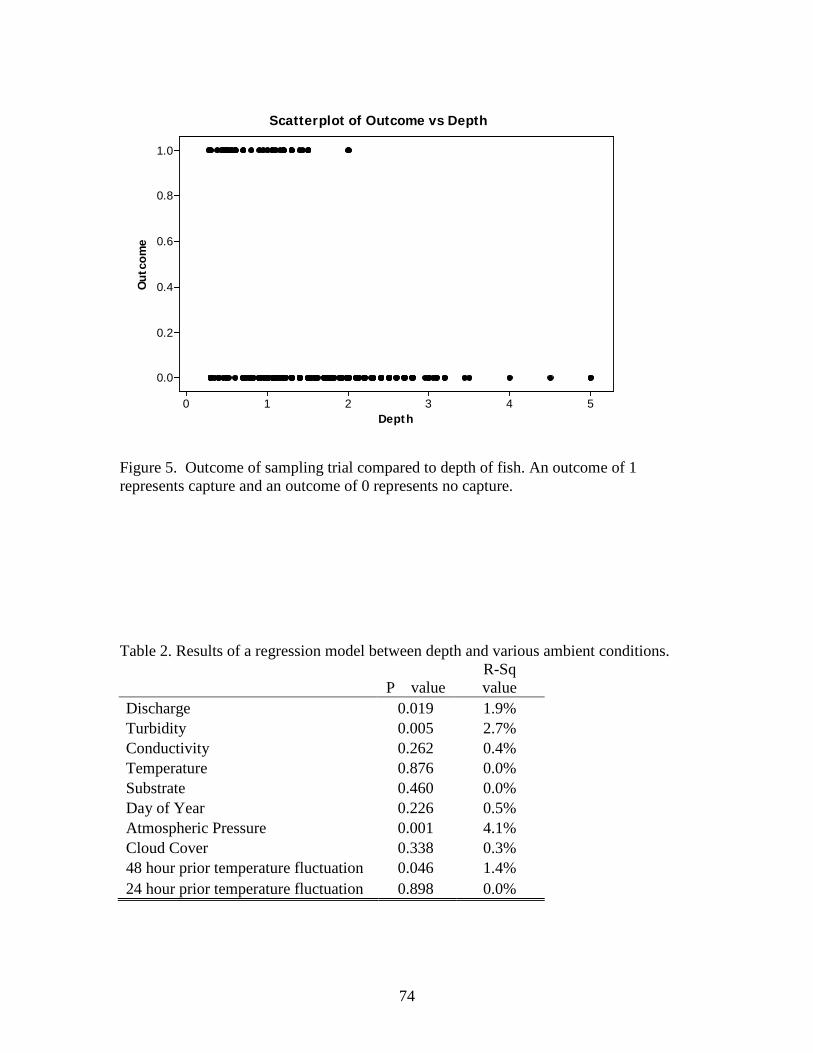
74
Depth
Out
com
e
543210
1.0
0.8
0.6
0.4
0.2
0.0
Scatterplot of Outcome vs Depth
Figure 5. Outcome of sampling trial compared to depth of fish. An outcome of 1 represents capture and an outcome of 0 represents no capture. Table 2. Results of a regression model between depth and various ambient conditions.
P value R-Sq value
Discharge 0.019 1.9% Turbidity 0.005 2.7% Conductivity 0.262 0.4% Temperature 0.876 0.0% Substrate 0.460 0.0% Day of Year 0.226 0.5% Atmospheric Pressure 0.001 4.1% Cloud Cover 0.338 0.3% 48 hour prior temperature fluctuation 0.046 1.4% 24 hour prior temperature fluctuation 0.898 0.0%

75
There were 183 relocations of sauger that could be used to analyze sauger movement (Table 3). Both median and mode sauger total movement were 0.00 km. Total movement ranged from 0.00 km to 191.35 km. Daily net movement median and mode were 0.00 km and ranged from 0.00 km to 9.11 km. The projected 90 day net movement had a median of 0.00 km and a mode of 0.00 km. The maximum projected movement for a sauger was 820.08 km. Table 3. Total movement, daily net movement, and projected 90 day net movement of sauger in the Yellowstone River telemetered at different times during the months of August, September, and October.
Total Movement (km)
Daily Net Movement (km)
Projected 90 Day Net Movement (km)
Mean 1.67 Mean 0.09 Mean 8.13 Standard Error 1.23 Standard Error 0.07 Standard Error 6.03
Median 0.00 Median 0.00 Median 0.00 Mode 0.00 Mode 0.00 Mode 0.00
Minimum 0.00 Minimum 0.00 Minimum 0.00 Maximum 191.35 Maximum 9.11 Maximum 820.08
Count 183 Count 183 Count 183
Discussion No significant difference was detected in capture gear efficiency between electrofishing and trammel nets. Following data collection in 2006 simulations indicated that a significant difference in capture efficiency between gears would not be detected until roughly 1000 capture trials occurred. This would have taken about 15 years to accomplish at the observed rate of sampling. In an attempt to build statistically significant models to generate day-specific correction factors and moderate the effects of environmental stochasticity on trend data only electrofishing was utilized in 2007. In addition, electrofishing was selected because it required less effort and less time to effectively deploy after a fish had been located. Decreased required effort and increased number of sauger radio tagged increased sampling trials in 2007. The combined sampling total for 2005 and 2006 was 113 trials while in 2007 there were 182 trials conducted. Despite concern regarding experience bias associated with effectively locating and navigating the electrofishing equipment over the known fish location, there was no detectable difference between sampling efficiency in 2005, 2006 or 2007. Comparison of capture efficiency was limited to electrofishing trials in 1.5 meters of water or less because this was the depth all but 2 captures occurred at. Although no significant difference was detected, confidence intervals for electrofishing in the year 2007 were

76
tighter and therefore the expected efficiency more precise. Tighter confidence intervals can likely be attributed to increased sample trials in 2007. When all ambient conditions were combined and modeled with outcome as the response, significance was detectable but only the coefficient depth was significant when ambient conditions were modeled separately. All but 2 fish were captured in 1.5 meters of water or less. If a fish was deeper than 1.5 meters multiple variables decrease efficiency. Electrical field intensity decreases with increased distance from the source, hence fish at greater depths experience lower electrical field intensity. In addition, fish that experience electro-taxis and succumb to electro-narcosis at greater depths are less likely to be seen by the individual netting fish. Electrofishing efficiency beyond 1.5 meters is likely reduced due to the precision of location of a specific radio tagged fish. Location precision decreases as depth increases, thus increasing depth decreases the likelihood the boat will directly pass over the location of the telemetered fish and expose it to the electrical field.
In attempt to develop a usable correction factor for trend surveys fish depth needed to be further analyzed to correlate it with an ambient condition. Biologist personal observations have documented decreased capture efficiency with unstable weather conditions, extreme high or low turbidities, temperatures, discharge and others. Although significant p values were detectable in regression analysis of depth and various other ambient conditions, low R2 values deface the significant p values. Despite lack of correlation of fish depth to ambient conditions, field experiences of biologist suggest ambient factors contribute greatly to capture efficiency observed in trend surveys.
Significant fluctuations in tend survey capture rate within the same year can be attributed to fluctuations in capture efficiency. Sauger movement throughout the duration of August, September, and October is minimal. The median projected sauger movement over a 90-day period beginning in August was 0.00 km suggesting little sauger movement occurs during this period. These findings are in agreement with Jaeger (2004) where he documented minimal movement of sauger in autumn months. Documented minimal autumn movement suggests that sauger catch rate fluctuations within the same year can be attributed to fluctuations in capture efficiency, not migration.
Trend surveys are vital to making management decisions and adjustments to capture rates are required to properly interpret the data. Until further knowledge is acquired in regards to correction factors, biologist should use personal experience and knowledge to interpret the observed capture rates of trend surveys.
In conclusion, no significant difference was detected between trammel net and electrofishing capture efficiency therefore we suggest continued use of electrofishing equipment to conduct trend surveys. Efficiency of electrofishing is dependent upon depth and efforts should be focused on depths 1.5m or less. Construction of a probabilistic model describing the effect of varying conditions on sampling efficiency could not be created with data we collected. Re-locations of radio tagged sauger suggested fish movement throughout the duration of fall trend surveys is limited. Observed fluctuations in catch rate between trend survey months within the same year can be attributed to fluctuations in capture efficiency, not fluctuations in abundance. Therefore, fluctuations in catch rate can be further interpreted from prior or post trend surveys within the same year and biologist should use personal experience and knowledge to interpret the observed capture rates of trend surveys.

77
Literature Cited Bramblett, R. G. 1996. Habitats and movements of pallid and shovelnose sturgeon in the
Yellowstone and Missouri Rivers, Montana and North Dakota. Ph.D. dissertation, Montana State University, Bozeman, Montana.
Bramblett, R. G., and R. G. White. 2001. Habitat use and movements of pallid and
shovelnose sturgeon in the Yellowstone and Missouri Rivers in Montana and North Dakota. Transactions of the American Fisheries Society 130:1006-1025.
Brown, C. J. D. 1971 Fishes of Montana. Big Sky Books, Bozeman, Montana. Carlson, J. 2003. Montana animal species of special concern. Montana Natural Heritage
Program and Montana Fish, Wildlife and Parks, Helena, Montana. Haddix, M. H., and C. C. Estes. 1976. Lower Yellowstone River fishery study. Montana
Fish and Game Report, Helena, Montana. Hesse, L. W. 1994. The status of Nebraska fishes in the Missouri River. 6. Sauger
(Percidae: Stizostedion canadense). Transactions of the Nebraska Academy of Sciences 21:109-121.
Hiebert, S. D., R. Wydoski, and T. J. Parks. 2000. Fish entrainment at the lower
Yellowstone diversion dam, Intake Canal, Montana, 1996-1998. USDI Bureau of Reclamation Report, Denver, Colorado.
Holton, G. D., and H. E. Johnson. 2003. A field guide to Montana fishes, third edition.
Montana Department of Fish, Wildlife and Parks, Helena, Montana. Jaeger, M. E. 2004. An empirical assessment of factors precluding recovery of sauger in
the lower Yellowstone River: movement, habitat use, exploitation and entrainment. Master’s thesis. Montana State University, Bozeman.
Maceina, M. J., P. W. Bettoli, S. D. Finely, and V. J. DiCenzo. 1998. Analyses of the
sauger fishery with simulated effects of a minimum size limit in the Tennessee River of Alabama. North American Journal of Fisheries Management 18:66-75.
McMahon, T. E. 1999. Status of sauger in Montana. Montana Fish, Wildlife and Parks
Report, Helena, Montana. Montana Natural Heritage Program (MNHP). 2006. Montana fish species of concern.
Montana Natural Heritage Program and Montana Department of Fish, Wildlife and Parks, Helena. http://nhp.nris.state.mt.us/SpeciesOfConcern/Default.aspx
78
Nelson, W. R. 1969. Biological characteristics of the sauger population in Lewis and Clark Lake. U. S. Department of the Interior, Bureau of Sport Fisheries and Wildlife, Technical Paper 21.
Pegg, M. A., J. B. Layzer, and P. W. Bettoli. 1996. Angler exploitation of anchor-tagged
saugers in the lower Tennessee River. North American Journal of Fisheries Management 16:218-222.
Penkal, R. F. 1992. Assessment and requirements of sauger and walleye populations in
the Lower Yellowstone River and its tributaries. Montana Department of Fish, Wildlife and Parks Report, Helena, Montana.
Silverman, A. J., and W. D. Tomlinsen. 1984. Biohydrology of mountain fluvial systems:
the Yellowstone (part I). U. S. Geologic Survey, Completion Report G-853-02, Reston, Virginia.
St. John, R. T. 1990. Sauger (Stizostedion canadense) abundance and spawning
movements in the Fort Loudoun tailwaters, Tennessee. Master’s thesis. Tennessee Tech University, Cookeville, Tennessee.
Stewart, P. A. 1992. Southeast Montana warmwater streams investigations. Montana
Department of Fish, Wildlife and Parks Report F-46-R-5, Helena, Montana. White, R. G., and R. G. Bramblett. 1993. The Yellowstone River: its fish and fisheries.
Pages 396-414 in L. W. Hesse, C. B. Stalnaker, N. G. Benson, J. R. Zuboy, editors. Restoration planning for the rivers of the Mississippi River ecosystem. Biological Report 19, National Biological Survey, Washington, D.C.
Related Documents