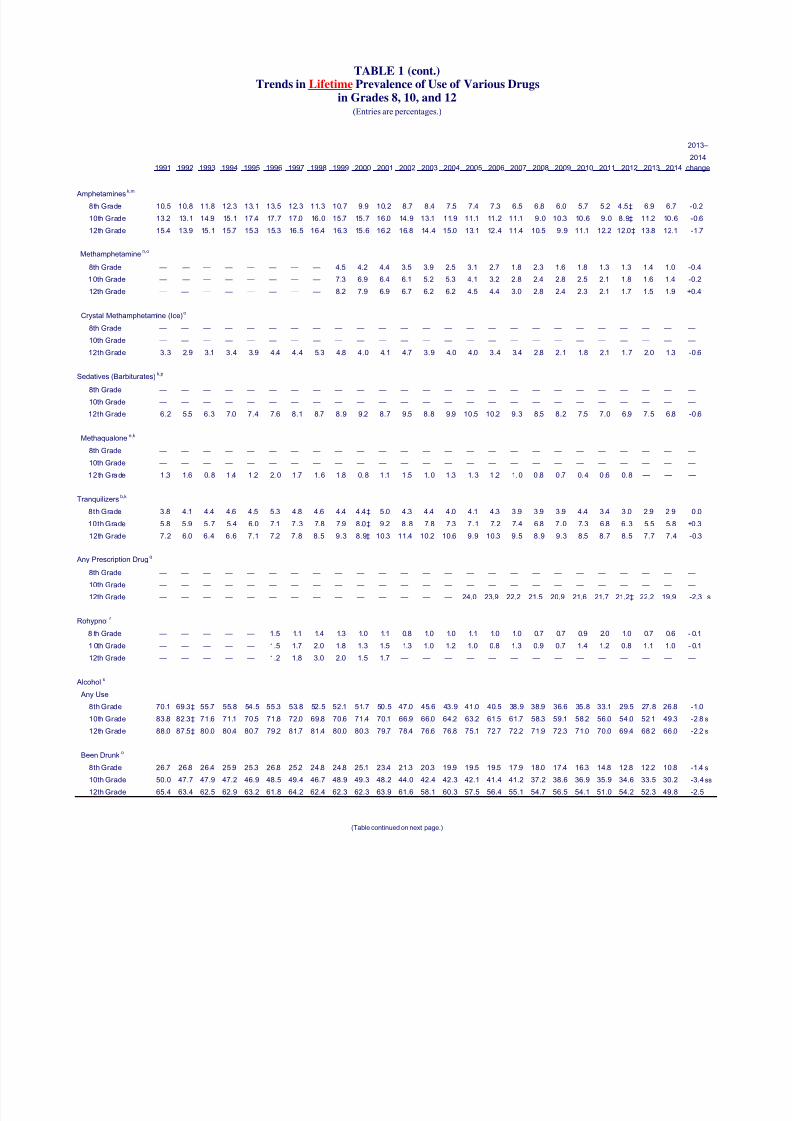
Dec. 16, 2014 Contacts: Jared Wadley, (734) 936-7819, [email protected] Ariel Bronson (734) 647-1083, [email protected] EMBARGOED FOR RELEASE AT 12:01 A.M. ET, TUESDAY, DEC. 16, 2014 Note: Video explaining the results is available at http://youtu.be/9lpJO7j3k8U Use of alcohol, cigarettes, and a number of illicit drugs declines among U.S. teens ANN ARBOR — A national survey of students in U.S. middle schools and high schools shows some important improvements in levels of substance use. Both alcohol and cigarette use in 2014 are at their lowest points since the study began in 1975. Use of a number of illicit drugs also show declines this year. These findings come from the University of Michigan's Monitoring the Future study, which tracks trends in substance use among students in 8th, 10th and 12th grades. Each year the national study, now in its 40th year, surveys 40,000 to 50,000 students in about 400 secondary schools throughout the United States. ALCOHOL Alcohol use by the nation's teens continued its long-term decline in 2014. All three grades showed a decline in the proportion of students reporting any alcohol use in the 12 months prior to the survey; the three grades combined d ropped from 43 percent to 41 percent, a statistically significant change. "Since the recent peak rate of 61 percent in 1997, there has been a fairly steady downward march in alcohol use among ado lescents," said Lloyd Johnston, the study's principal investigator. "The proportion of teens reporting any alcohol use in the prior year has fallen by about a third." Of perhaps greater importance, the proportion of teens who report "binge drinking" — that is, consuming five or more drinks in a row at least once in the two we eks preceding the survey — fell significantly again this year to 12 percent for the three grades combined. This statistic is down from a recent high point of 22 percent in 1997. While this is an important improvement, say the investigators, still roughly one in five (19 percent) 12-graders report binge drinking at least once in the prior two weeks. Some 12th-graders drink even more heavily, reporting having 10 or more, or 15 or more, drinks in a row on at least on e occasion in the prior two weeks. Since 2005 (the first year that this "extreme binge drinking" was measured), these measures also ha ve declined, from 11 percent to 7 percent in 2014 for 10 or more drinks, and from 6 percent to 4 percent for 15 or more drinks.

Welcome message from author
This document is posted to help you gain knowledge. Please leave a comment to let me know what you think about it! Share it to your friends and learn new things together.
Transcript
8/10/2019 Monitoring the Future Release.pdf
http://slidepdf.com/reader/full/monitoring-the-future-releasepdf 1/35
Dec. 16, 2014
Contacts: Jared Wadley, (734) 936-7819, [email protected]
Ariel Bronson (734) 647-1083, [email protected]
EMBARGOED FOR RELEASE AT 12:01 A.M. ET, TUESDAY, DEC. 16, 2014
Note: Video explaining the results is available at http://youtu.be/9lpJO7j3k8U
Use of alcohol, cigarettes, and a number of illicit drugs declines
among U.S. teens
ANN ARBOR — A national survey of students in U.S. middle schools and high schools shows
some important improvements in levels of substance use.
Both alcohol and cigarette use in 2014 are at their lowest points since the study began in 1975.
Use of a number of illicit drugs also show declines this year.
These findings come from the University of Michigan's Monitoring the Future study, which
tracks trends in substance use among students in 8th, 10th and 12th grades. Each year the
national study, now in its 40th year, surveys 40,000 to 50,000 students in about 400 secondary
schools throughout the United States.
ALCOHOL
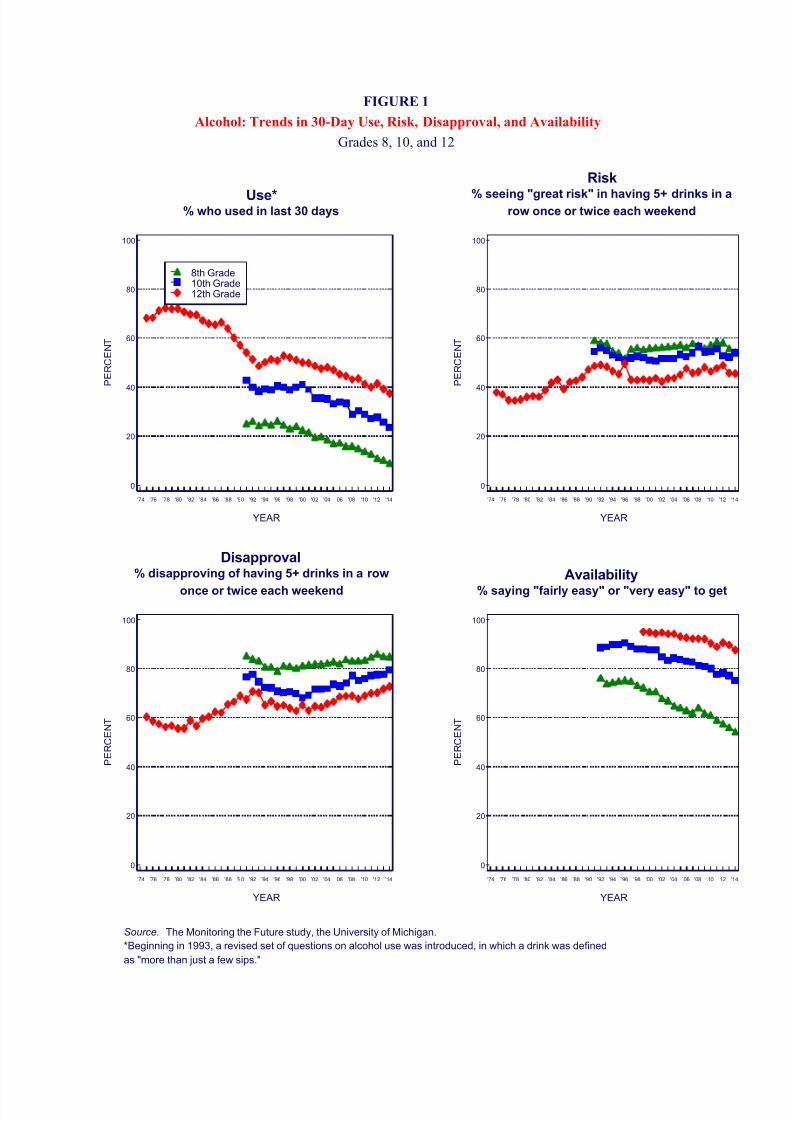
Alcohol use by the nation's teens continued its long-term decline in 2014. All three gradesshowed a decline in the proportion of students reporting any alcohol use in the 12 months prior
to the survey; the three grades combined dropped from 43 percent to 41 percent, a statisticallysignificant change.
"Since the recent peak rate of 61 percent in 1997, there has been a fairly steady downward march
in alcohol use among adolescents," said Lloyd Johnston, the study's principal investigator. "The proportion of teens reporting any alcohol use in the prior year has fallen by about a third."
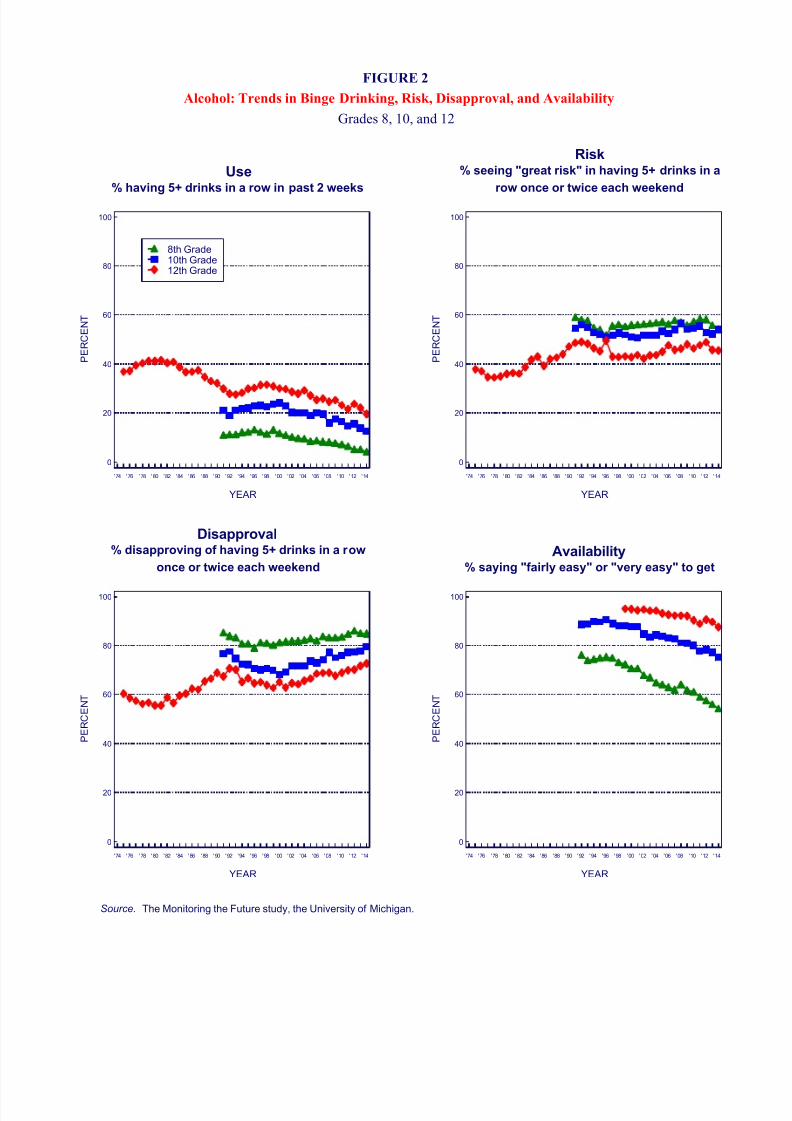
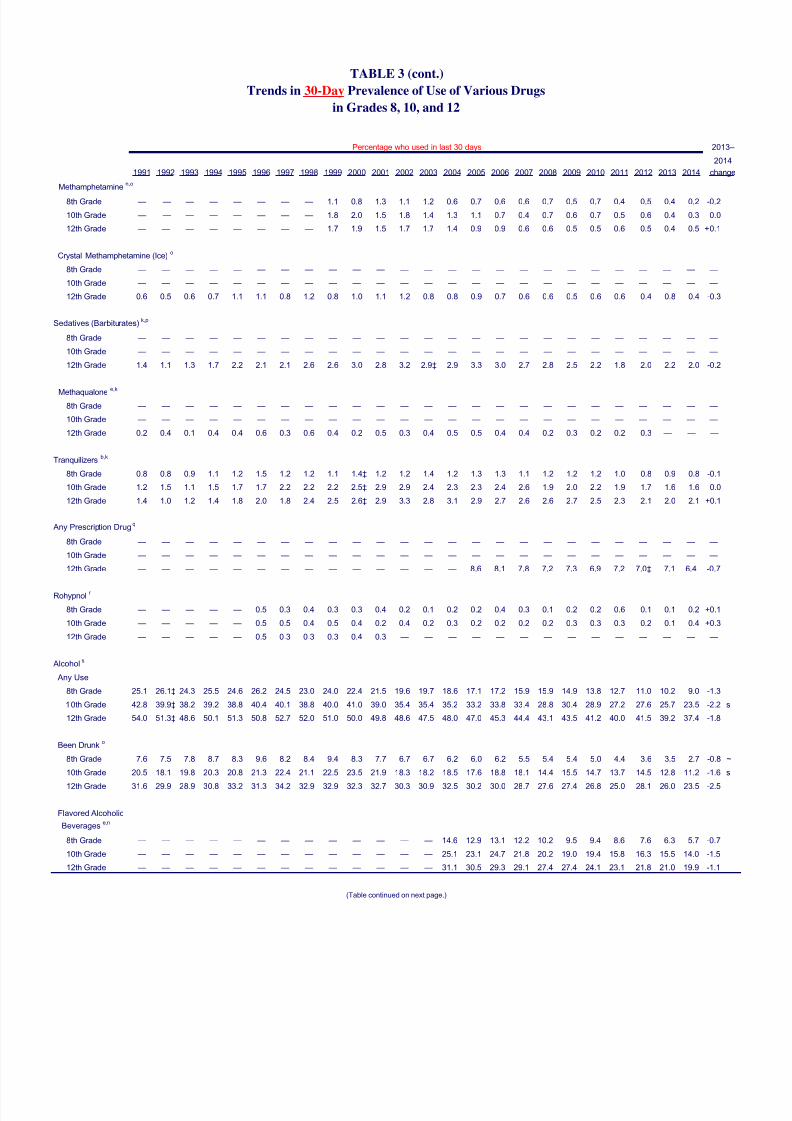
Of perhaps greater importance, the proportion of teens who report "binge drinking" — that is,
consuming five or more drinks in a row at least once in the two weeks preceding the survey — fellsignificantly again this year to 12 percent for the three grades combined. This statistic is down
from a recent high point of 22 percent in 1997. While this is an important improvement, say the
investigators, still roughly one in five (19 percent) 12-graders report binge drinking at least oncein the prior two weeks.
Some 12th-graders drink even more heavily, reporting having 10 or more, or 15 or more, drinks
in a row on at least one occasion in the prior two weeks. Since 2005 (the first year that this"extreme binge drinking" was measured), these measures also have declined, from 11 percent to
7 percent in 2014 for 10 or more drinks, and from 6 percent to 4 percent for 15 or more drinks.
8/10/2019 Monitoring the Future Release.pdf
http://slidepdf.com/reader/full/monitoring-the-future-releasepdf 2/35
2
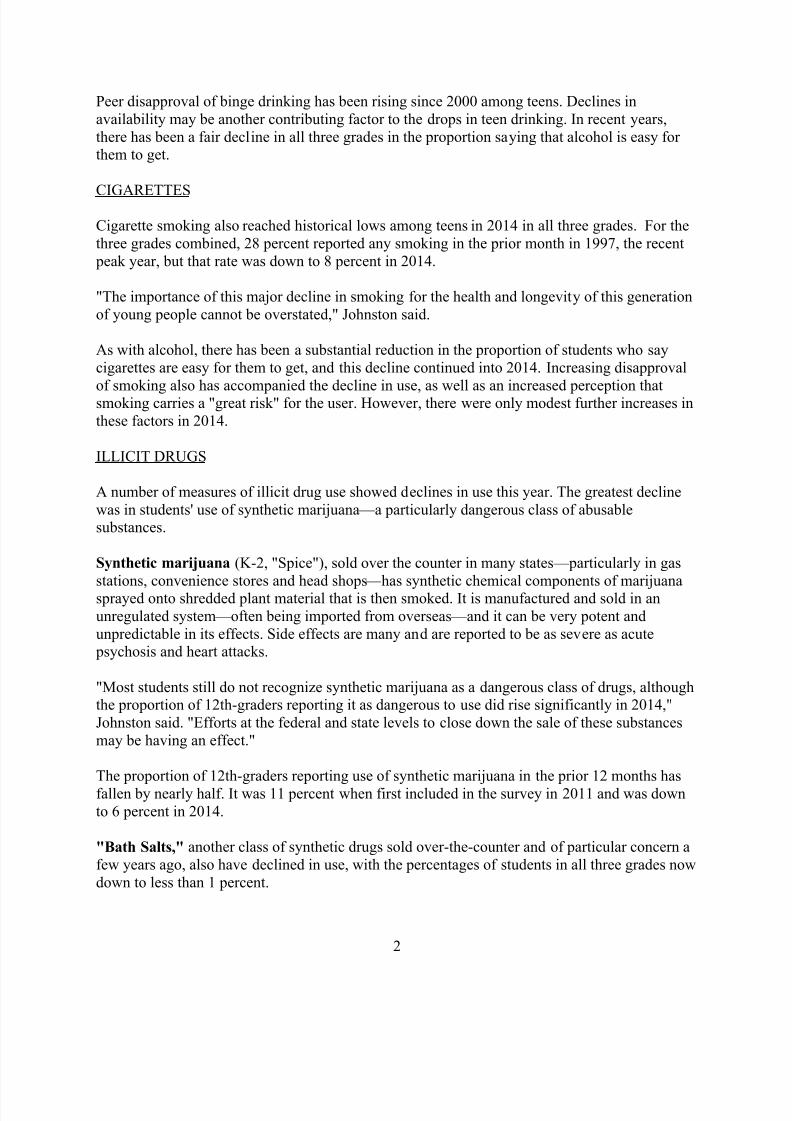
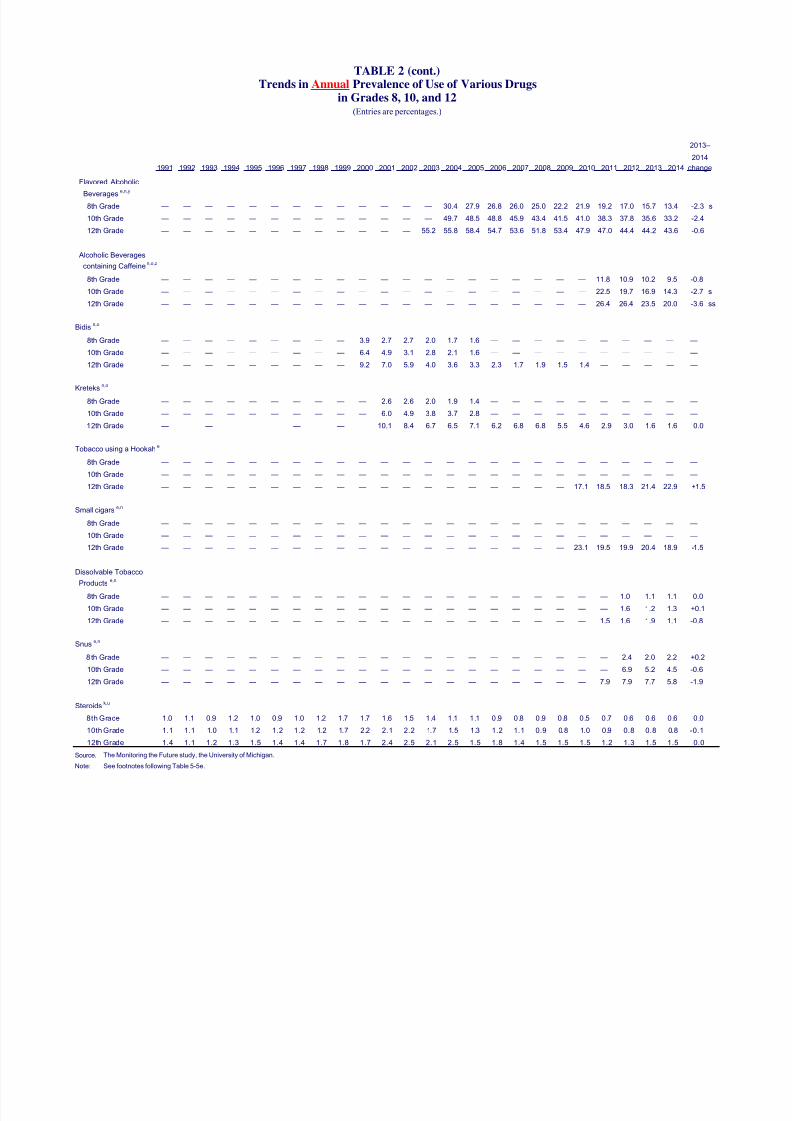
Peer disapproval of binge drinking has been rising since 2000 among teens. Declines in
availability may be another contributing factor to the drops in teen drinking. In recent years,
there has been a fair decline in all three grades in the proportion saying that alcohol is easy forthem to get.
CIGARETTES
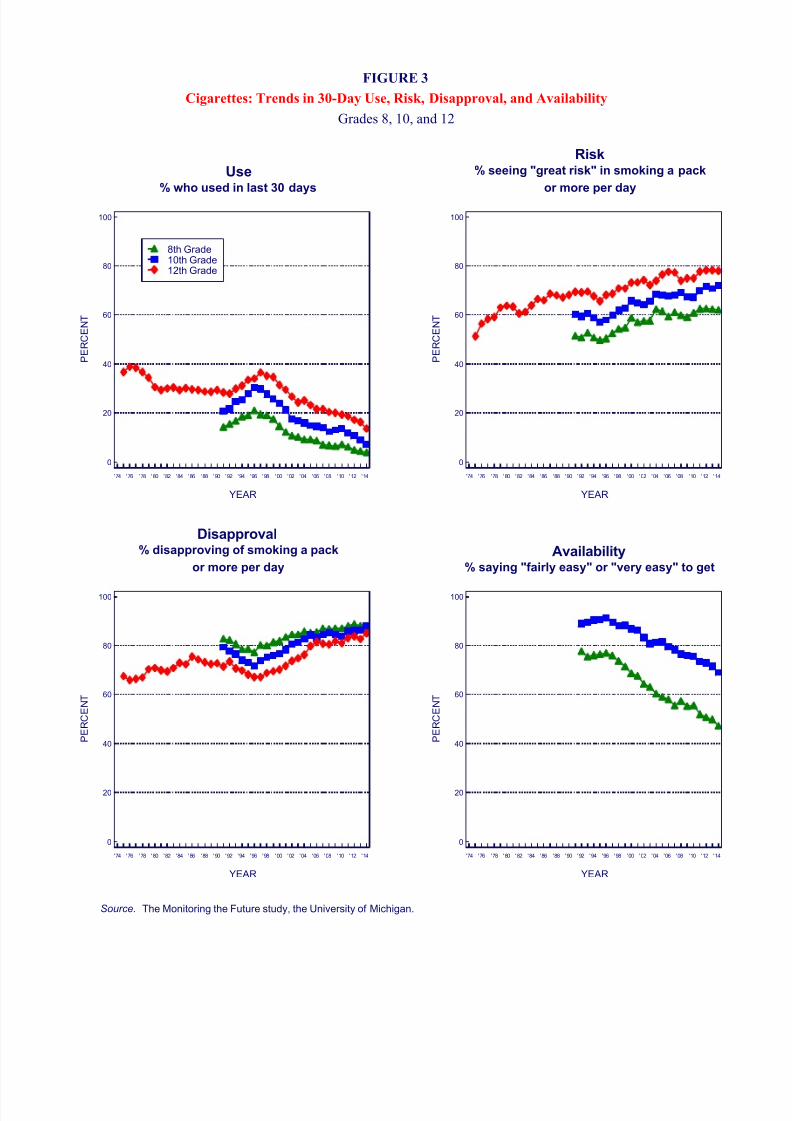
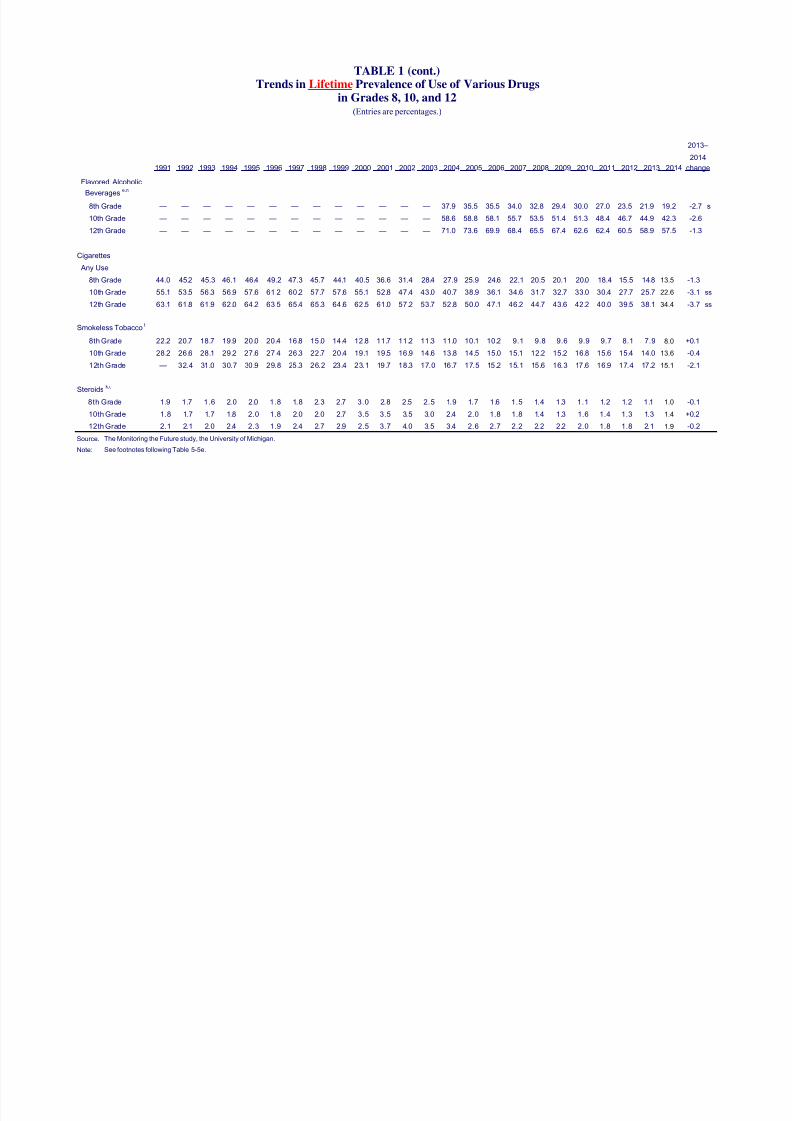
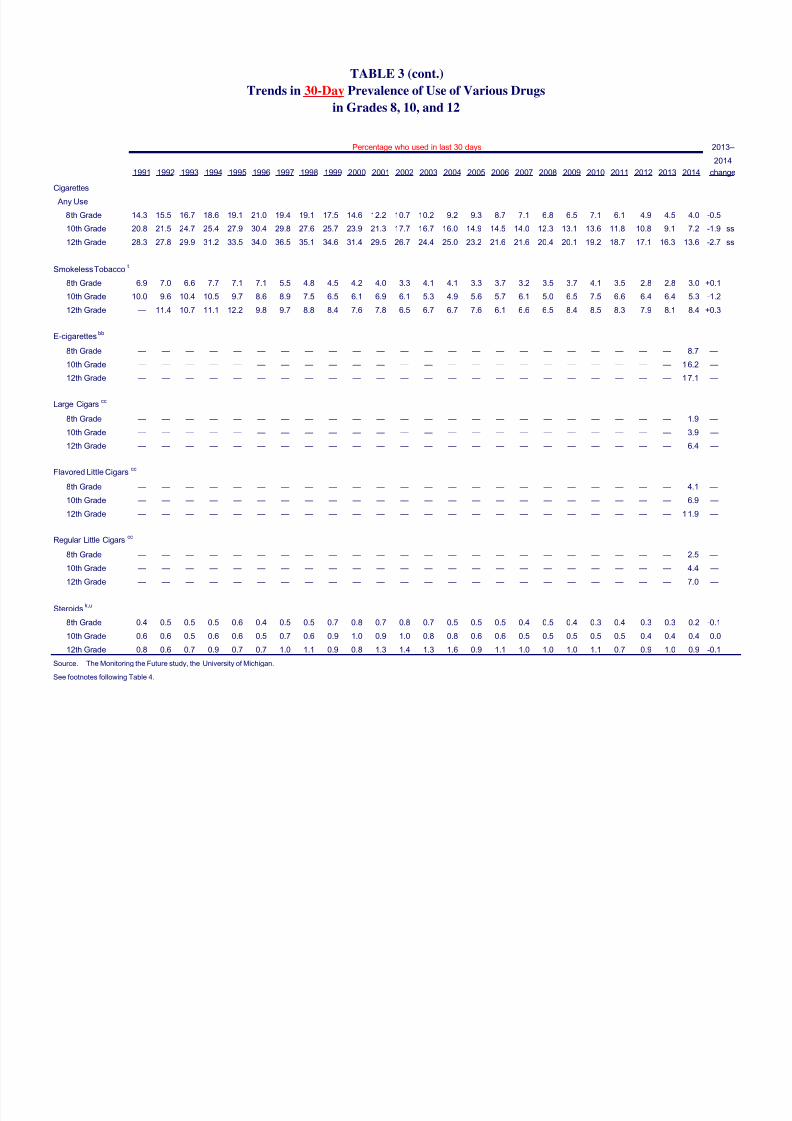
Cigarette smoking also reached historical lows among teens in 2014 in all three grades. For the
three grades combined, 28 percent reported any smoking in the prior month in 1997, the recent
peak year, but that rate was down to 8 percent in 2014.
"The importance of this major decline in smoking for the health and longevity of this generation
of young people cannot be overstated," Johnston said.
As with alcohol, there has been a substantial reduction in the proportion of students who say
cigarettes are easy for them to get, and this decline continued into 2014. Increasing disapproval
of smoking also has accompanied the decline in use, as well as an increased perception thatsmoking carries a "great risk" for the user. However, there were only modest further increases in
these factors in 2014.
ILLICIT DRUGS
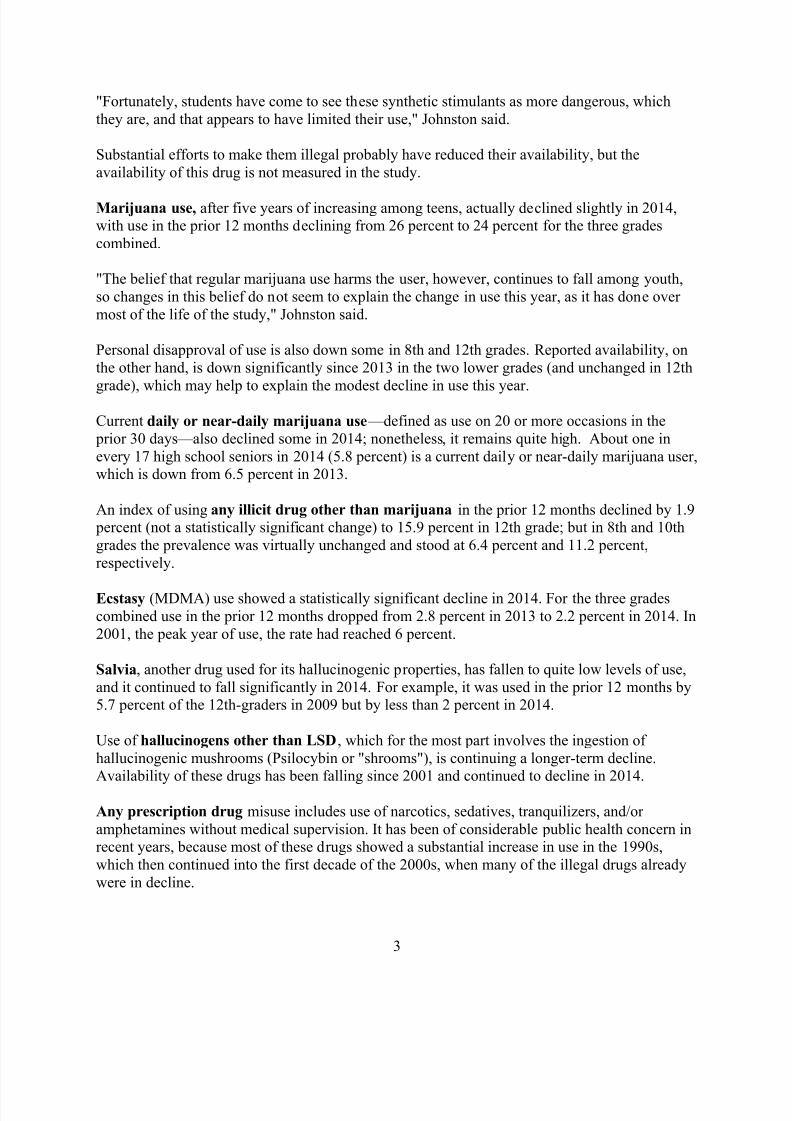
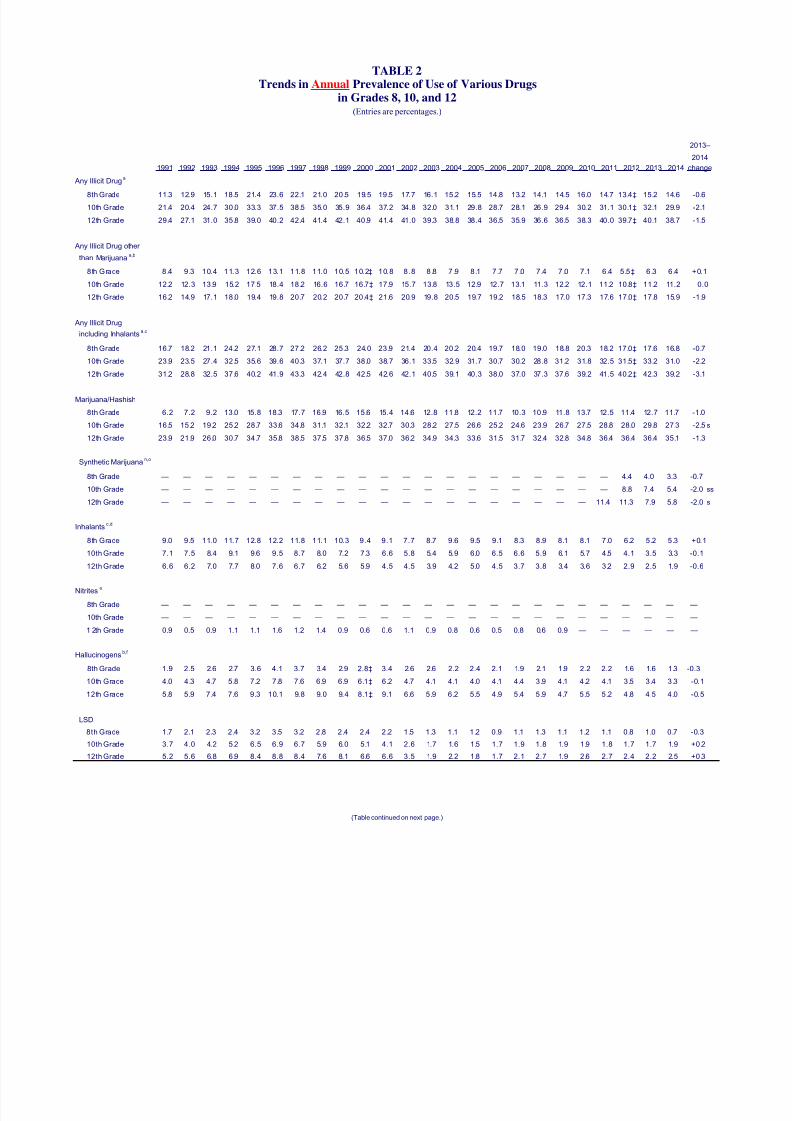
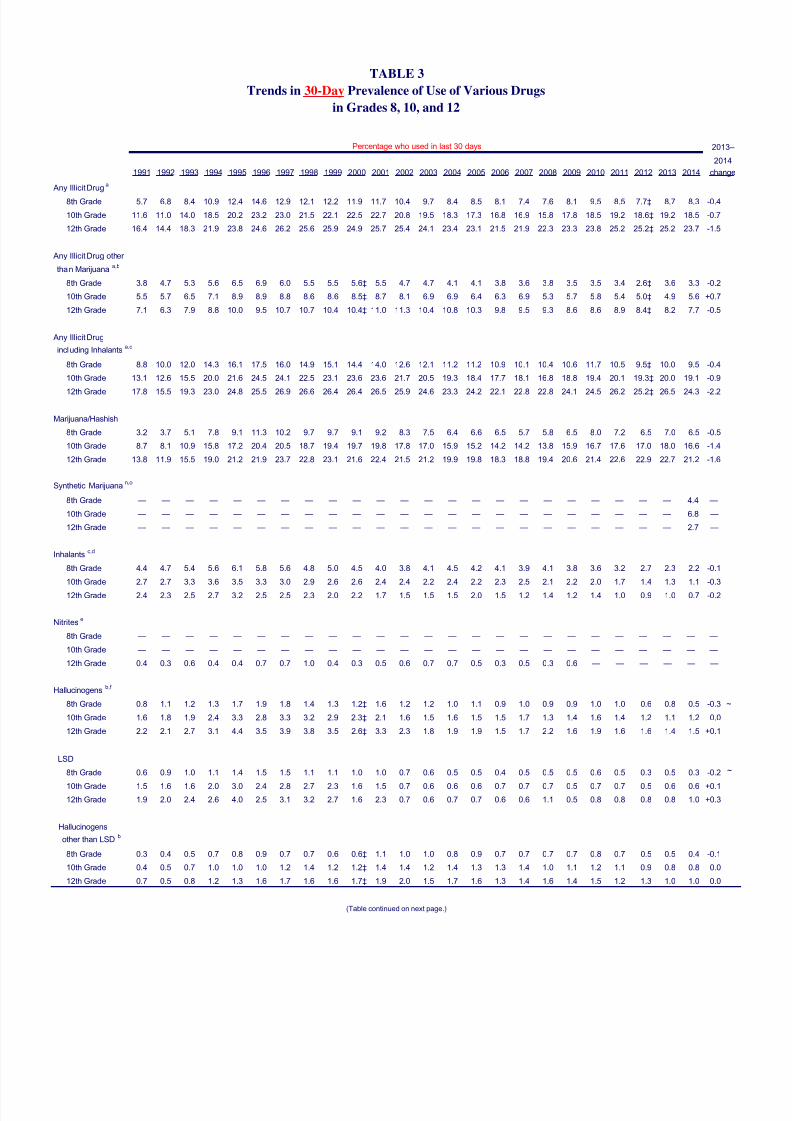
A number of measures of illicit drug use showed declines in use this year. The greatest decline
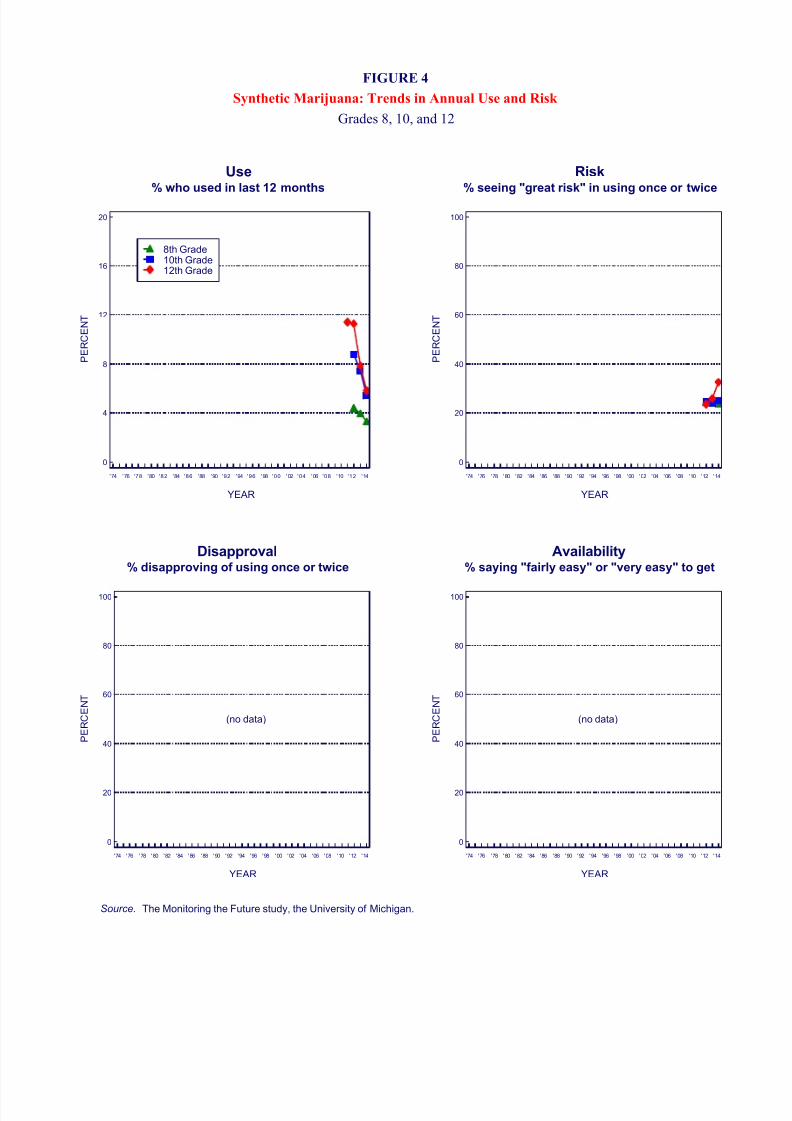
was in students' use of synthetic marijuana — a particularly dangerous class of abusablesubstances.
Synthetic marijuana (K-2, "Spice"), sold over the counter in many states — particularly in gas
stations, convenience stores and head shops — has synthetic chemical components of marijuanasprayed onto shredded plant material that is then smoked. It is manufactured and sold in an
unregulated system — often being imported from overseas — and it can be very potent and
unpredictable in its effects. Side effects are many and are reported to be as severe as acute psychosis and heart attacks.
"Most students still do not recognize synthetic marijuana as a dangerous class of drugs, althoughthe proportion of 12th-graders reporting it as dangerous to use did rise significantly in 2014,"
Johnston said. "Efforts at the federal and state levels to close down the sale of these substances
may be having an effect."
The proportion of 12th-graders reporting use of synthetic marijuana in the prior 12 months has
fallen by nearly half. It was 11 percent when first included in the survey in 2011 and was down
to 6 percent in 2014.
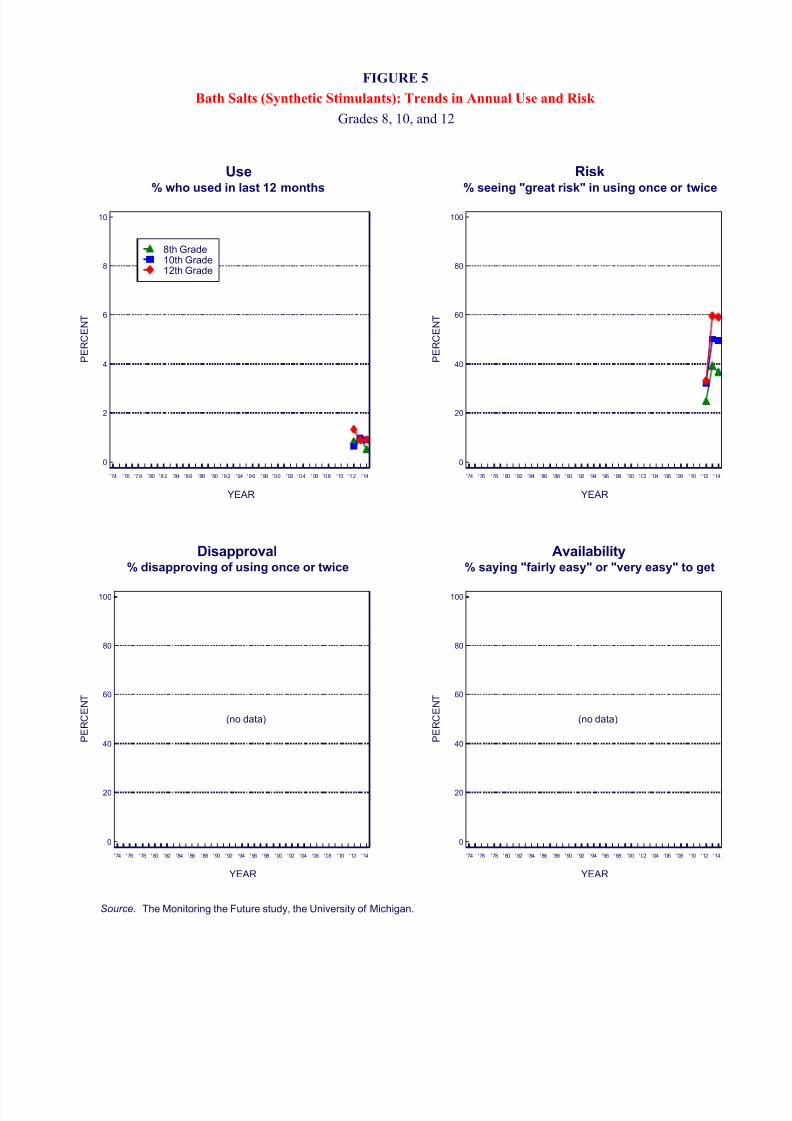
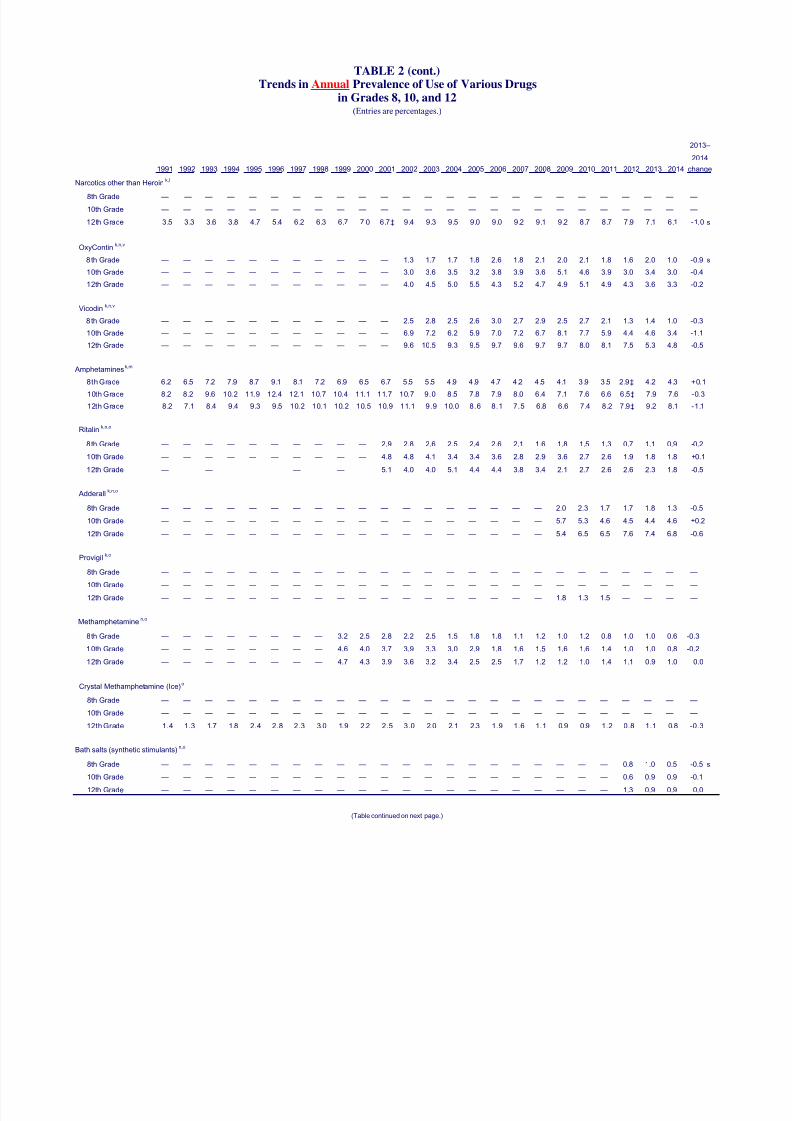
"Bath Salts," another class of synthetic drugs sold over-the-counter and of particular concern a
few years ago, also have declined in use, with the percentages of students in all three grades now
down to less than 1 percent.
8/10/2019 Monitoring the Future Release.pdf
http://slidepdf.com/reader/full/monitoring-the-future-releasepdf 3/35
3
"Fortunately, students have come to see these synthetic stimulants as more dangerous, which
they are, and that appears to have limited their use," Johnston said.
Substantial efforts to make them illegal probably have reduced their availability, but the
availability of this drug is not measured in the study.
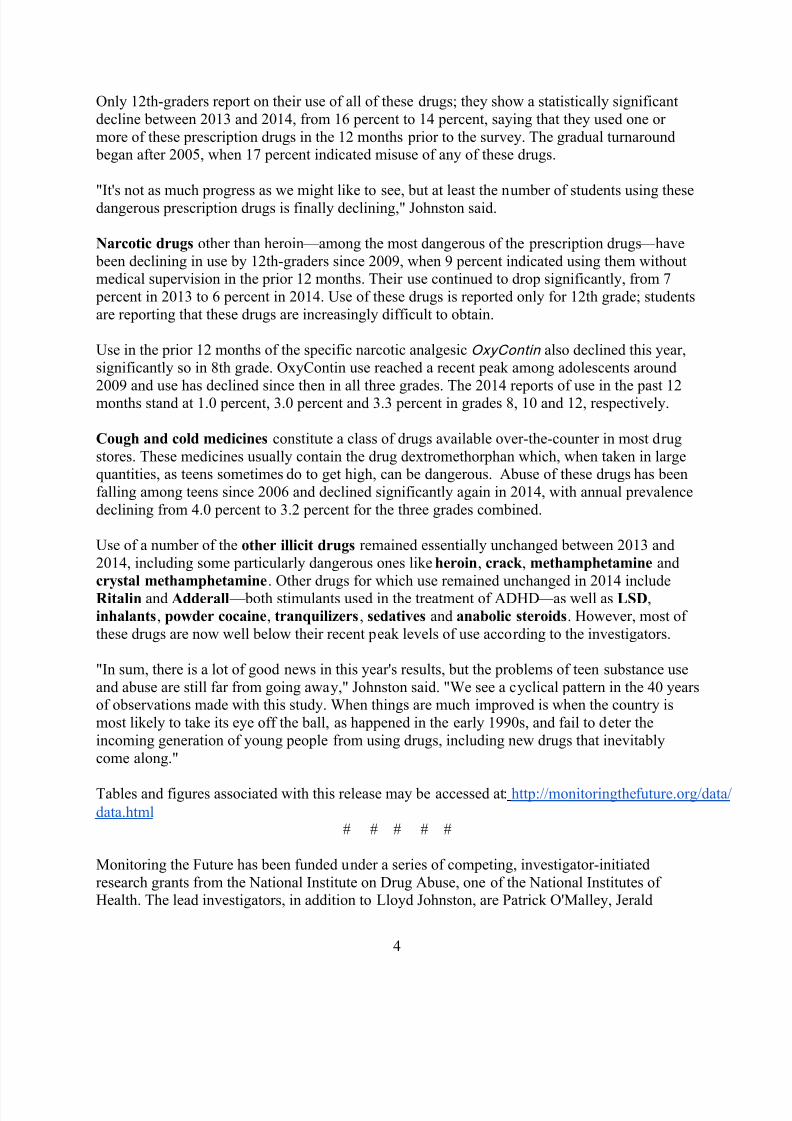
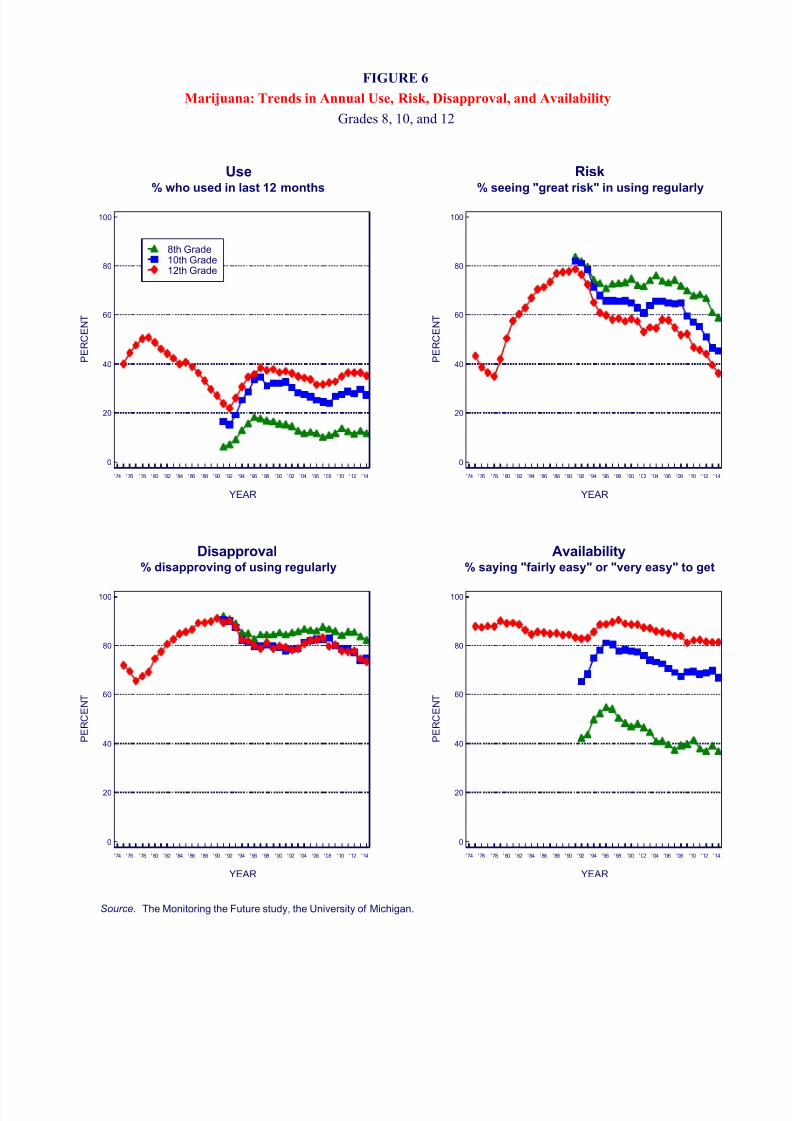
Marijuana use, after five years of increasing among teens, actually declined slightly in 2014,with use in the prior 12 months declining from 26 percent to 24 percent for the three grades
combined.
"The belief that regular marijuana use harms the user, however, continues to fall among youth,
so changes in this belief do not seem to explain the change in use this year, as it has done over
most of the life of the study," Johnston said.
Personal disapproval of use is also down some in 8th and 12th grades. Reported availability, on
the other hand, is down significantly since 2013 in the two lower grades (and unchanged in 12th
grade), which may help to explain the modest decline in use this year.
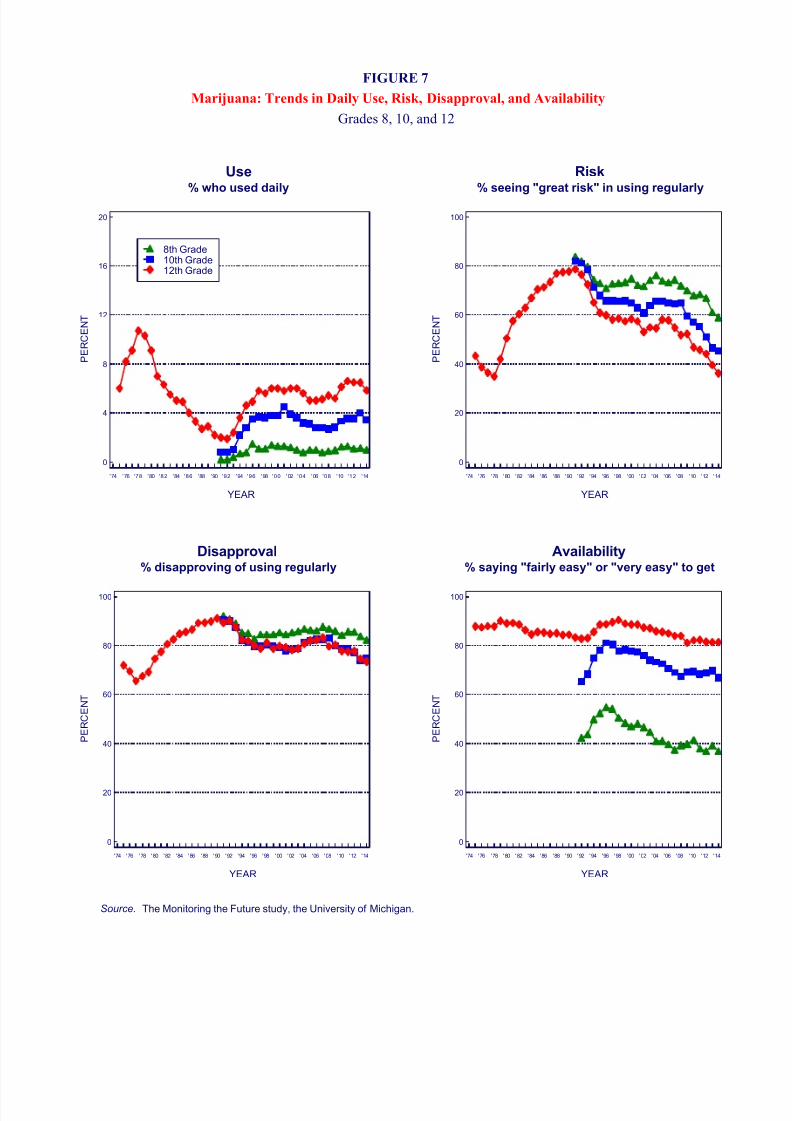
Current daily or near-daily marijuana use — defined as use on 20 or more occasions in the
prior 30 days — also declined some in 2014; nonetheless, it remains quite high. About one in
every 17 high school seniors in 2014 (5.8 percent) is a current daily or near-daily marijuana user,which is down from 6.5 percent in 2013.
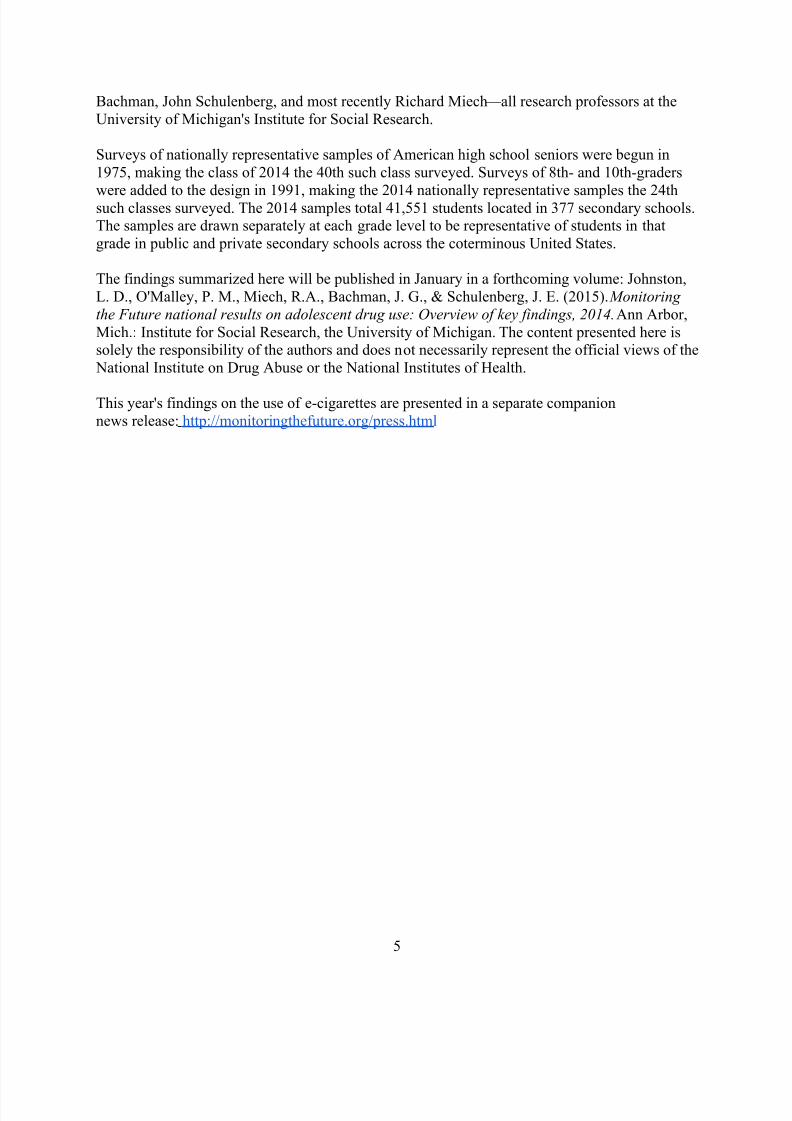
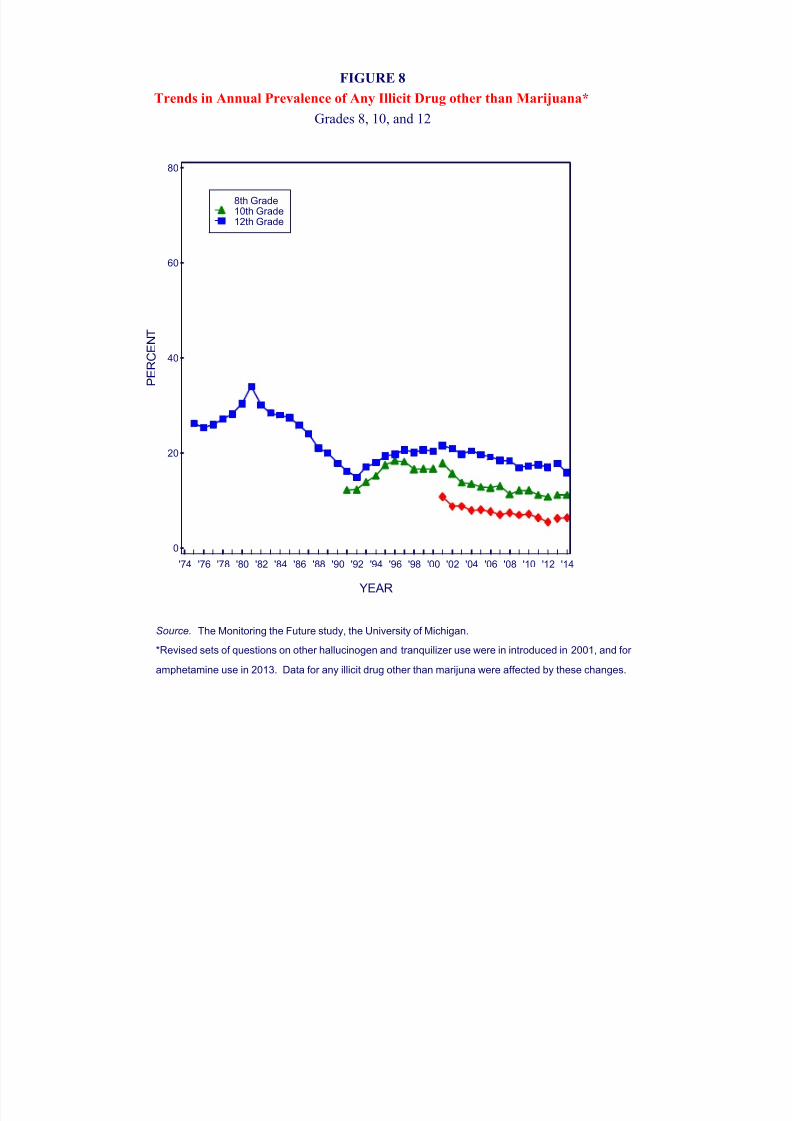
An index of using any illicit drug other than marijuana in the prior 12 months declined by 1.9 percent (not a statistically significant change) to 15.9 percent in 12th grade; but in 8th and 10th
grades the prevalence was virtually unchanged and stood at 6.4 percent and 11.2 percent,
respectively.
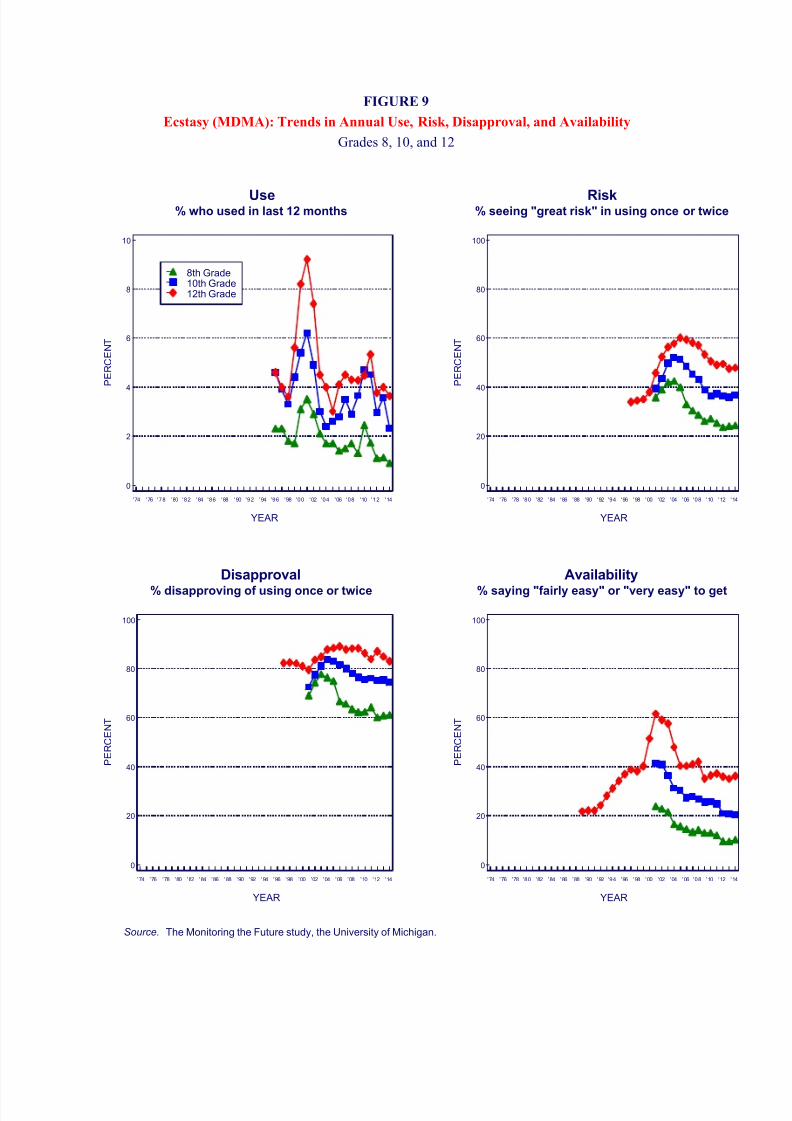
Ecstasy (MDMA) use showed a statistically significant decline in 2014. For the three grades
combined use in the prior 12 months dropped from 2.8 percent in 2013 to 2.2 percent in 2014. In
2001, the peak year of use, the rate had reached 6 percent.
Salvia, another drug used for its hallucinogenic properties, has fallen to quite low levels of use,
and it continued to fall significantly in 2014. For example, it was used in the prior 12 months by5.7 percent of the 12th-graders in 2009 but by less than 2 percent in 2014.
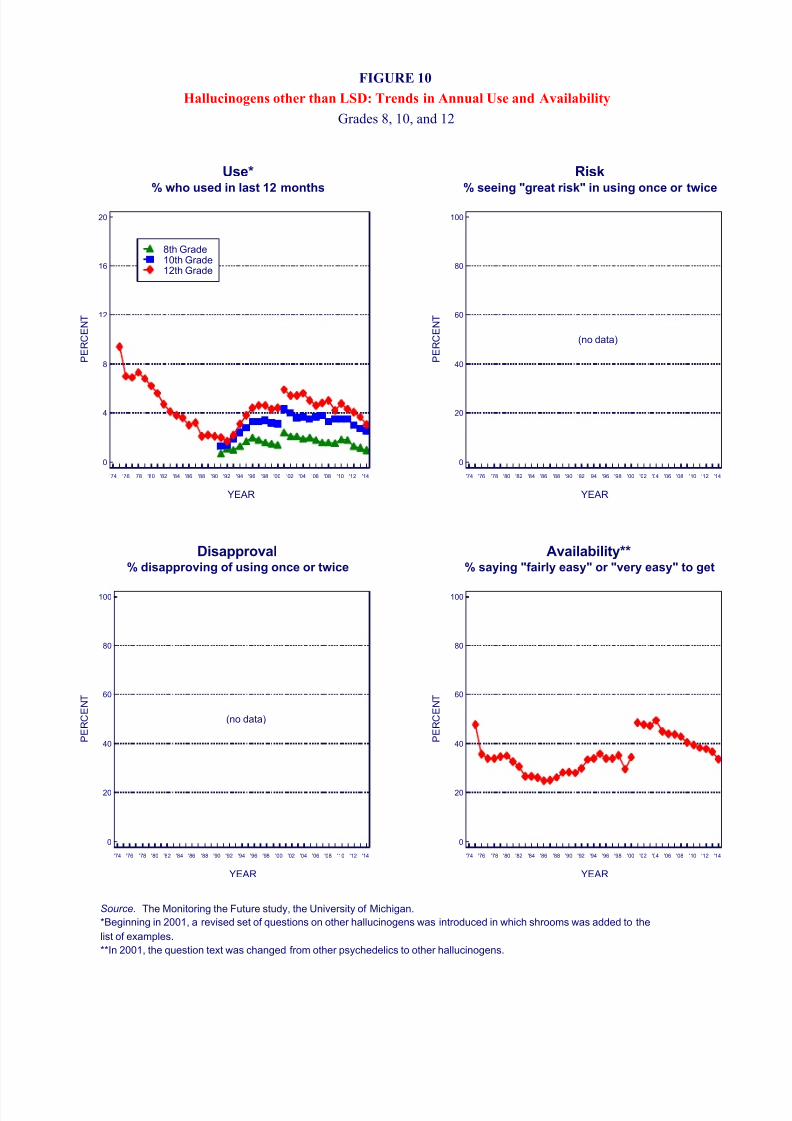
Use of hallucinogens other than LSD, which for the most part involves the ingestion of
hallucinogenic mushrooms (Psilocybin or "shrooms"), is continuing a longer-term decline.Availability of these drugs has been falling since 2001 and continued to decline in 2014.
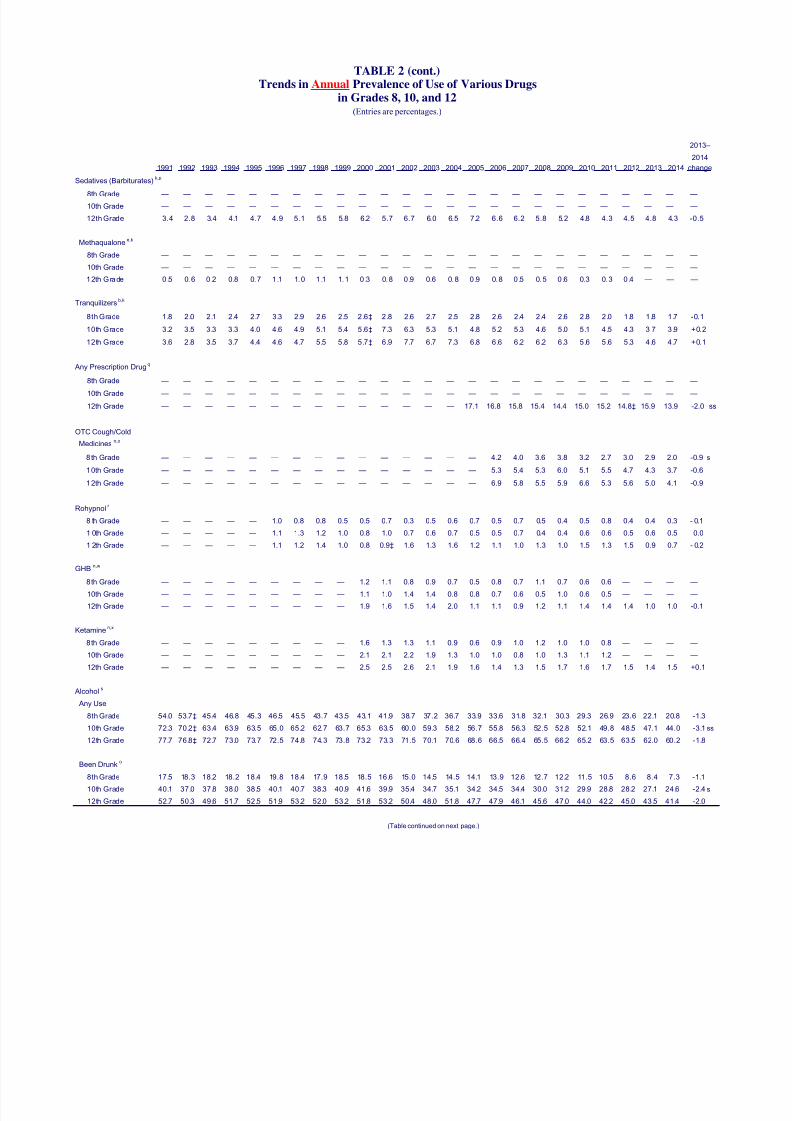
Any prescription drug misuse includes use of narcotics, sedatives, tranquilizers, and/or
amphetamines without medical supervision. It has been of considerable public health concern inrecent years, because most of these drugs showed a substantial increase in use in the 1990s,
which then continued into the first decade of the 2000s, when many of the illegal drugs already
were in decline.
8/10/2019 Monitoring the Future Release.pdf
http://slidepdf.com/reader/full/monitoring-the-future-releasepdf 4/35
4
Only 12th-graders report on their use of all of these drugs; they show a statistically significant
decline between 2013 and 2014, from 16 percent to 14 percent, saying that they used one or
more of these prescription drugs in the 12 months prior to the survey. The gradual turnaround began after 2005, when 17 percent indicated misuse of any of these drugs.
"It's not as much progress as we might like to see, but at least the number of students using thesedangerous prescription drugs is finally declining," Johnston said.
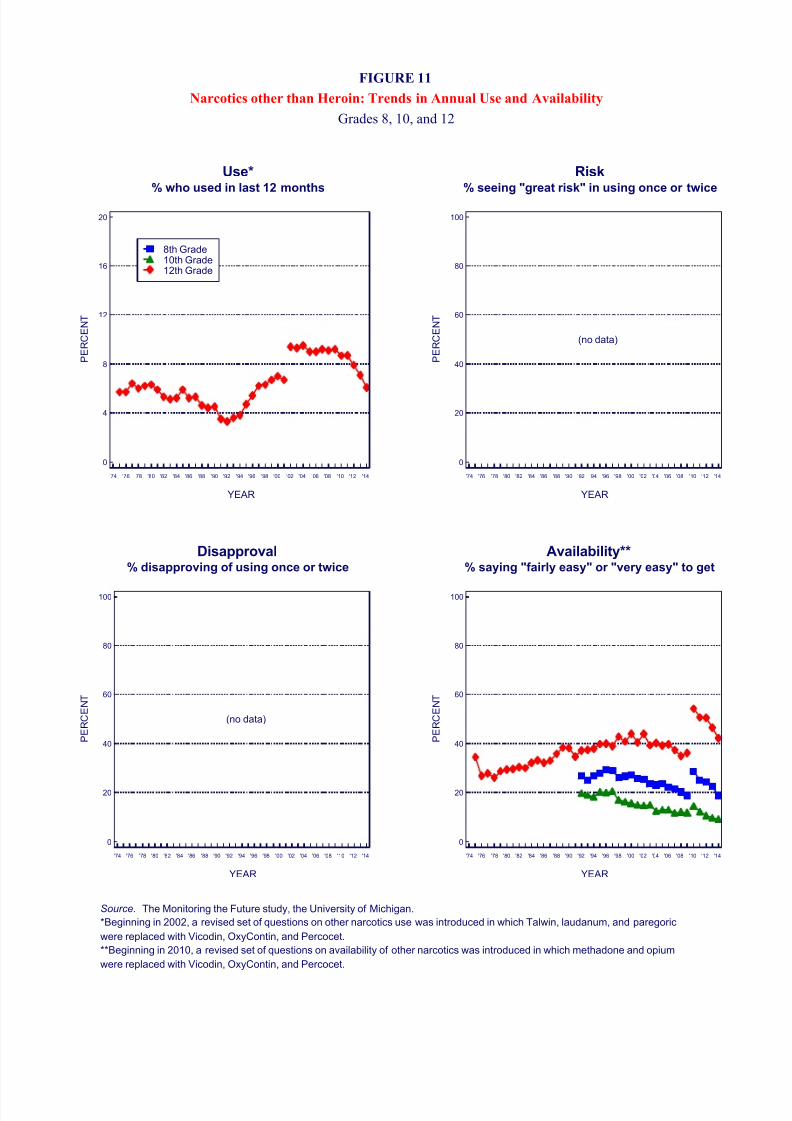
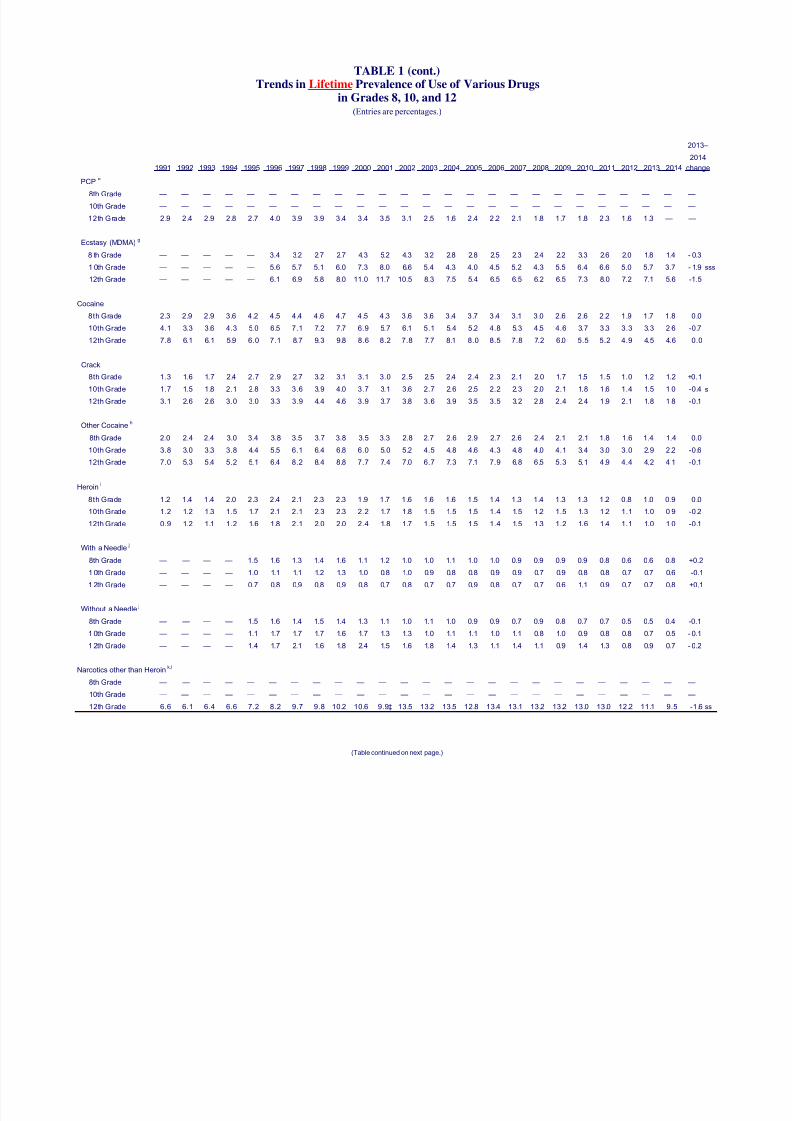
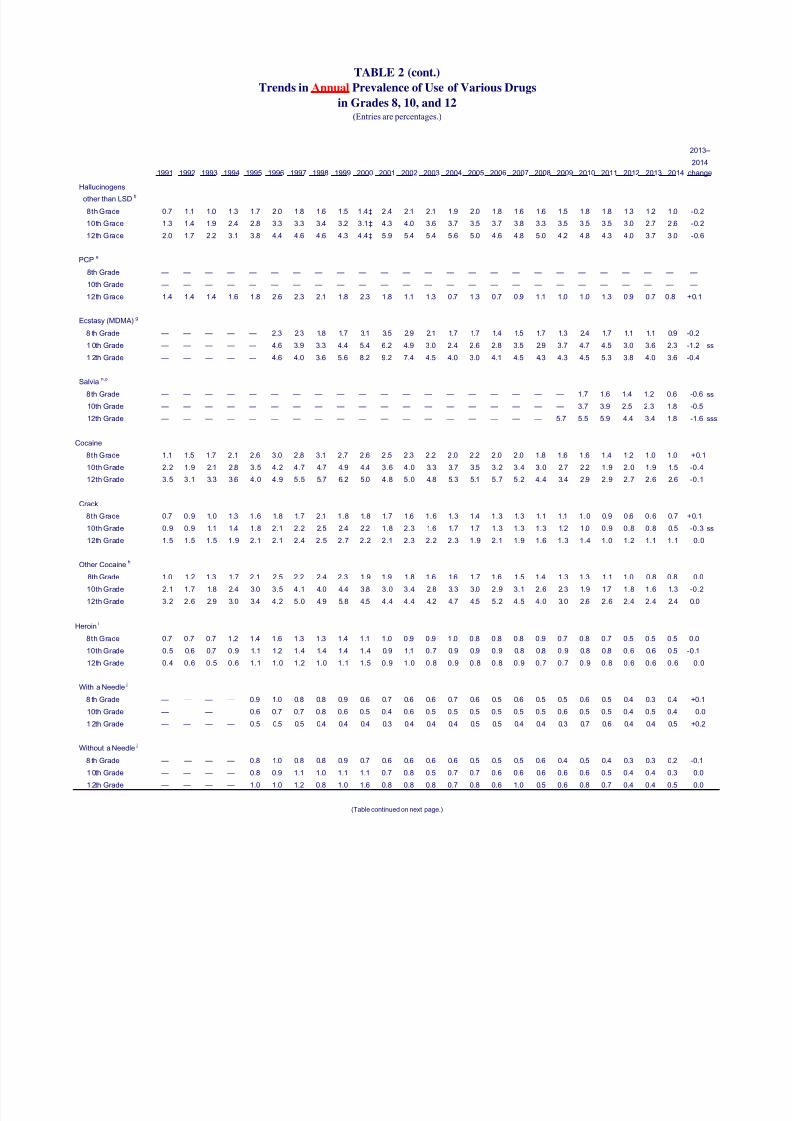
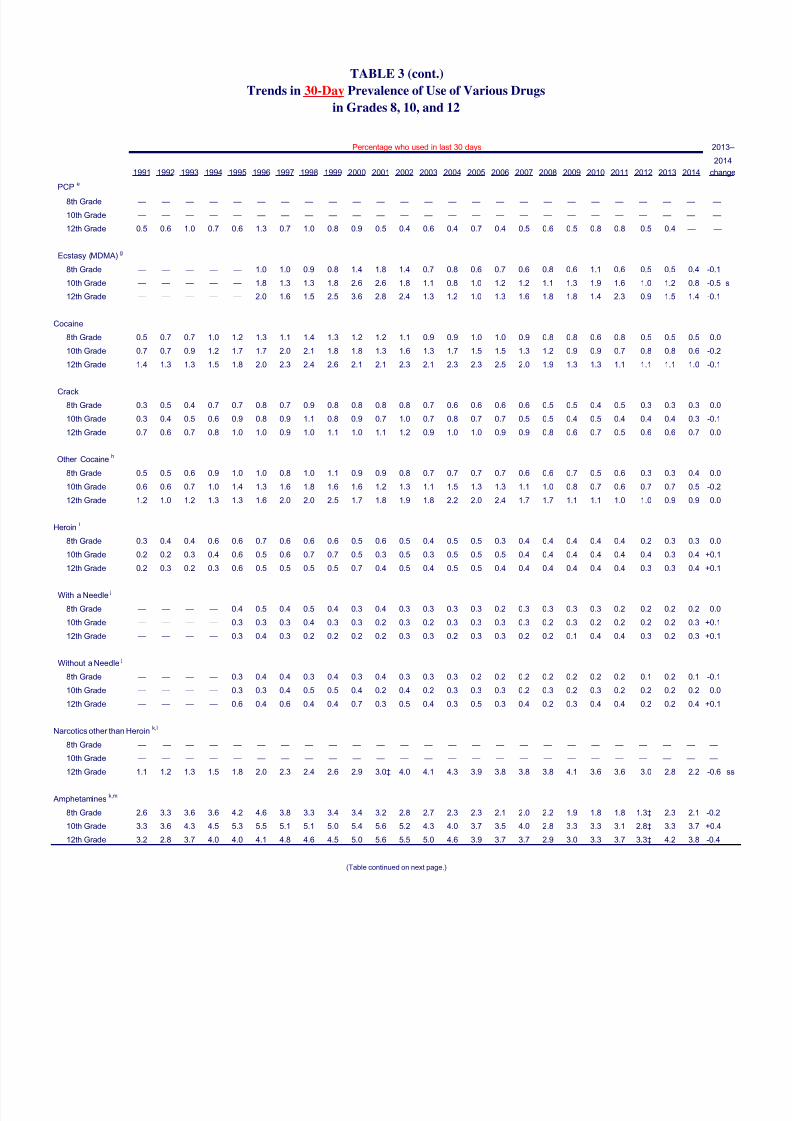
Narcotic drugs other than heroin — among the most dangerous of the prescription drugs — have
been declining in use by 12th-graders since 2009, when 9 percent indicated using them withoutmedical supervision in the prior 12 months. Their use continued to drop significantly, from 7
percent in 2013 to 6 percent in 2014. Use of these drugs is reported only for 12th grade; students
are reporting that these drugs are increasingly difficult to obtain.
Use in the prior 12 months of the specific narcotic analgesic OxyContin also declined this year,
significantly so in 8th grade. OxyContin use reached a recent peak among adolescents around
2009 and use has declined since then in all three grades. The 2014 reports of use in the past 12months stand at 1.0 percent, 3.0 percent and 3.3 percent in grades 8, 10 and 12, respectively.
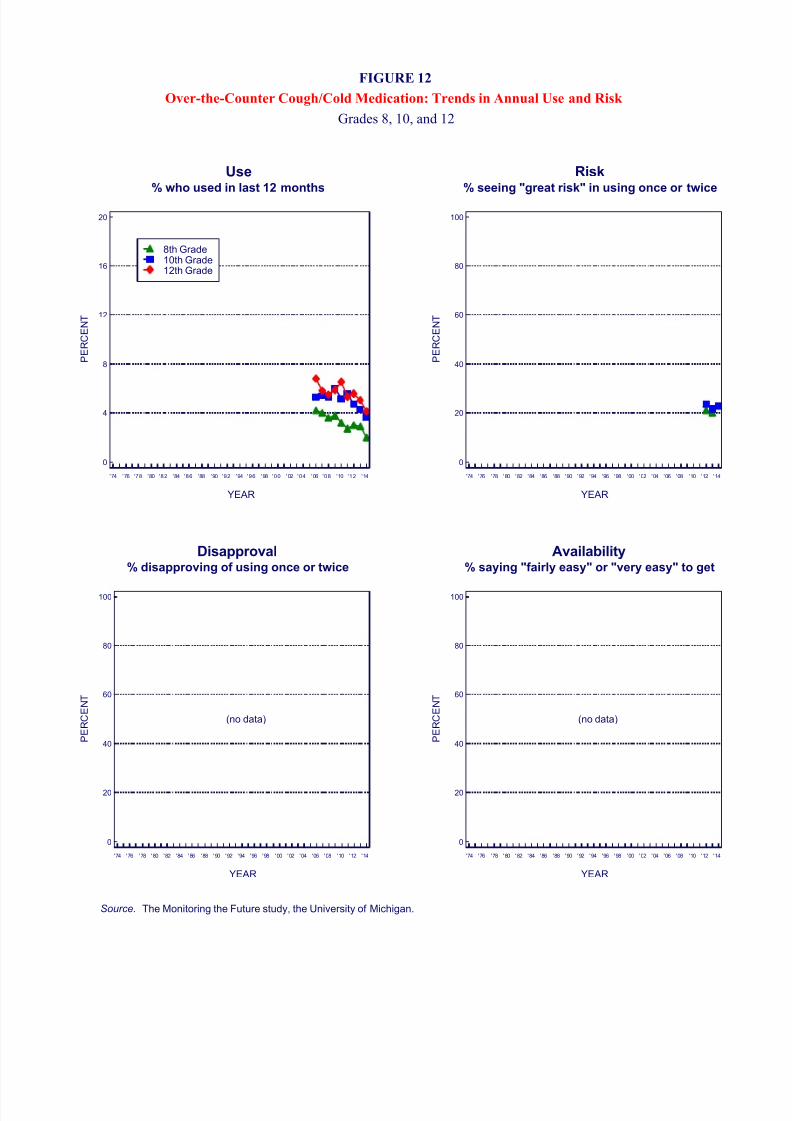
Cough and cold medicines constitute a class of drugs available over-the-counter in most drug
stores. These medicines usually contain the drug dextromethorphan which, when taken in largequantities, as teens sometimes do to get high, can be dangerous. Abuse of these drugs has been
falling among teens since 2006 and declined significantly again in 2014, with annual prevalence
declining from 4.0 percent to 3.2 percent for the three grades combined.
Use of a number of the other illicit drugs remained essentially unchanged between 2013 and
2014, including some particularly dangerous ones like heroin, crack , methamphetamine and
crystal methamphetamine. Other drugs for which use remained unchanged in 2014 include
Ritalin and Adderall — both stimulants used in the treatment of ADHD — as well as LSD,
inhalants, powder cocaine, tranquilizers, sedatives and anabolic steroids. However, most of
these drugs are now well below their recent peak levels of use according to the investigators.
"In sum, there is a lot of good news in this year's results, but the problems of teen substance use
and abuse are still far from going away," Johnston said. "We see a cyclical pattern in the 40 yearsof observations made with this study. When things are much improved is when the country is
most likely to take its eye off the ball, as happened in the early 1990s, and fail to deter the
incoming generation of young people from using drugs, including new drugs that inevitably
come along."
Tables and figures associated with this release may be accessed at: http://monitoringthefuture.org/data/
data.html# # # # #
Monitoring the Future has been funded under a series of competing, investigator-initiated
research grants from the National Institute on Drug Abuse, one of the National Institutes ofHealth. The lead investigators, in addition to Lloyd Johnston, are Patrick O'Malley, Jerald
8/10/2019 Monitoring the Future Release.pdf
http://slidepdf.com/reader/full/monitoring-the-future-releasepdf 5/35
5
Bachman, John Schulenberg, and most recently Richard Miech — all research professors at the
University of Michigan's Institute for Social Research.
Surveys of nationally representative samples of American high school seniors were begun in
1975, making the class of 2014 the 40th such class surveyed. Surveys of 8th- and 10th-graders
were added to the design in 1991, making the 2014 nationally representative samples the 24thsuch classes surveyed. The 2014 samples total 41,551 students located in 377 secondary schools.The samples are drawn separately at each grade level to be representative of students in that
grade in public and private secondary schools across the coterminous United States.
The findings summarized here will be published in January in a forthcoming volume: Johnston,
L. D., O'Malley, P. M., Miech, R.A., Bachman, J. G., & Schulenberg, J. E. (2015). Monitoring
the Future national results on adolescent drug use: Overview of key findings, 2014. Ann Arbor,
Mich.: Institute for Social Research, the University of Michigan. The content presented here issolely the responsibility of the authors and does not necessarily represent the official views of the
National Institute on Drug Abuse or the National Institutes of Health.
This year's findings on the use of e-cigarettes are presented in a separate companion
news r elease: http://monitoringthefuture.org/press.html
8/10/2019 Monitoring the Future Release.pdf
http://slidepdf.com/reader/full/monitoring-the-future-releasepdf 6/35
FIGURE 1
Alcohol: Trends in 30-Day Use, Risk, Disapproval, and Availability
Grades 8, 10, and 12
Source. The Monitoring the Future study, the University of Michigan.
*Beginning in 1993, a revised set of questions on alcohol use was introduced, in which a drink was defined
as "more than just a few sips."
Use*% who used in last 30 days
Risk
% seeing "great risk" in having 5+ drinks in arow once or twice each weekend
Disapproval% disapproving of having 5+ drinks in a row
once or twice each weekend
Availability
% saying "fairly easy" or "very easy" to get
P E R C E N T
0
20
40
60
80
100
YEAR
'74 '76 '78 '80 '82 '84 '86 '88 '90 '92 '94 '96 '98 '00 '02 '04 '06 '08 '10 '12 '14
8th Grade10th Grade12th Grade
P E R C E N T
0
20
40
60
80
100
YEAR
'74 '76 '78 '80 '82 '84 '86 '88 '90 '92 '94 '96 '98 '00 '02 '04 '06 '08 '10 '12 '14
P E R C E N T
0
20
40
60
80
100
YEAR
'74 '76 '78 '80 '82 '84 '86 '88 '90 '92 '94 '96 '98 '00 '02 '04 '06 '08 '10 '12 '14
P E R C E N T
0
20
40
60
80
100
YEAR
'74 '76 '78 '80 '82 '84 '86 '88 '90 '92 '94 '96 '98 '00 '02 '04 '06 '08 '10 '12 '14
8/10/2019 Monitoring the Future Release.pdf
http://slidepdf.com/reader/full/monitoring-the-future-releasepdf 7/35
FIGURE 2
Alcohol: Trends in Binge Drinking, Risk, Disapproval, and Availability
Grades 8, 10, and 12
Source. The Monitoring the Future study, the University of Michigan.
Use% having 5+ drinks in a row in past 2 weeks
Risk% seeing "great risk" in having 5+ drinks in a
row once or twice each weekend
Disapproval% disapproving of having 5+ drinks in a row
once or twice each weekend
Availability% saying "fairly easy" or "very easy" to get
P E R C E N T
0
20
40
60
80
100
YEAR
'74 '76 '78 '80 '82 '84 '86 '88 '90 '92 '94 '96 '98 '00 '02 '04 '06 '08 '10 '12 '14
8th Grade10th Grade12th Grade
P E R C E N T
0
20
40
60
80
100
YEAR
'74 '76 '78 '80 '82 '84 '86 '88 '90 '92 '94 '96 '98 '00 '02 '04 '06 '08 '10 '12 '14
P E R C E N T
0
20
40
60
80
100
YEAR
'74 '76 '78 '80 '82 '84 '86 '88 '90 '92 '94 '96 '98 '00 '02 '04 '06 '08 '10 '12 '14
P E R C E N T
0
20
40
60
80
100
YEAR
'74 '76 '78 '80 '82 '84 '86 '88 '90 '92 '94 '96 '98 '00 '02 '04 '06 '08 '10 '12 '14
8/10/2019 Monitoring the Future Release.pdf
http://slidepdf.com/reader/full/monitoring-the-future-releasepdf 8/35
FIGURE 3
Cigarettes: Trends in 30-Day Use, Risk, Disapproval, and Availability
Grades 8, 10, and 12
Source. The Monitoring the Future study, the University of Michigan.
Use% who used in last 30 days
Risk% seeing "great risk" in smoking a pack
or more per day
Disapproval% disapproving of smoking a pack
or more per day
Availability% saying "fairly easy" or "very easy" to get
P E R C E N T
0
20
40
60
80
100
YEAR
'74 '76 '78 '80 '82 '84 '86 '88 '90 '92 '94 '96 '98 '00 '02 '04 '06 '08 '10 '12 '14
8th Grade10th Grade12th Grade
P E R C E N T
0
20
40
60
80
100
YEAR
'74 '76 '78 '80 '82 '84 '86 '88 '90 '92 '94 '96 '98 '00 '02 '04 '06 '08 '10 '12 '14
P E R C E N T
0
20
40
60
80
100
YEAR
'74 '76 '78 '80 '82 '84 '86 '88 '90 '92 '94 '96 '98 '00 '02 '04 '06 '08 '10 '12 '14
P E R C E N T
0
20
40
60
80
100
YEAR
'74 '76 '78 '80 '82 '84 '86 '88 '90 '92 '94 '96 '98 '00 '02 '04 '06 '08 '10 '12 '14
8/10/2019 Monitoring the Future Release.pdf
http://slidepdf.com/reader/full/monitoring-the-future-releasepdf 9/35
FIGURE 4
Synthetic Marijuana: Trends in Annual Use and Risk
Grades 8, 10, and 12
Source. The Monitoring the Future study, the University of Michigan.
Use% who used in last 12 months
Risk% seeing "great risk" in using once or twice
Disapproval% disapproving of using once or twice
Availability% saying "fairly easy" or "very easy" to get
P E R C E N T
0
4
8
12
16
20
YEAR
'74 '76 '78 '80 '82 '84 '86 '88 '90 '92 '94 '96 '98 '00 '02 '04 '06 '08 '10 '12 '14
8th Grade10th Grade12th Grade
P E R C E N T
0
20
40
60
80
100
YEAR
'74 '76 '78 '80 '82 '84 '86 '88 '90 '92 '94 '96 '98 '00 '02 '04 '06 '08 '10 '12 '14
P E R C E N T
0
20
40
60
80
100
YEAR
'74 '76 '78 '80 '82 '84 '86 '88 '90 '92 '94 '96 '98 '00 '02 '04 '06 '08 '10 '12 '14
(no data)
P E R C E N T
0
20
40
60
80
100
YEAR
'74 '76 '78 '80 '82 '84 '86 '88 '90 '92 '94 '96 '98 '00 '02 '04 '06 '08 '10 '12 '14
(no data)
8/10/2019 Monitoring the Future Release.pdf
http://slidepdf.com/reader/full/monitoring-the-future-releasepdf 10/35
FIGURE 5
Bath Salts (Synthetic Stimulants): Trends in Annual Use and Risk
Grades 8, 10, and 12
Source. The Monitoring the Future study, the University of Michigan.
Use% who used in last 12 months
Risk% seeing "great risk" in using once or twice
Disapproval% disapproving of using once or twice
Availability% saying "fairly easy" or "very easy" to get
P E R C E N T
0
2
4
6
8
10
YEAR
'74 '76 '78 '80 '82 '84 '86 '88 '90 '92 '94 '96 '98 '00 '02 '04 '06 '08 '10 '12 '14
8th Grade10th Grade12th Grade
P E R C E N T
0
20
40
60
80
100
YEAR
'74 '76 '78 '80 '82 '84 '86 '88 '90 '92 '94 '96 '98 '00 '02 '04 '06 '08 '10 '12 '14
P E R C E N T
0
20
40
60
80
100
YEAR
'74 '76 '78 '80 '82 '84 '86 '88 '90 '92 '94 '96 '98 '00 '02 '04 '06 '08 '10 '12 '14
(no data)
P E R C E N T
0
20
40
60
80
100
YEAR
'74 '76 '78 '80 '82 '84 '86 '88 '90 '92 '94 '96 '98 '00 '02 '04 '06 '08 '10 '12 '14
(no data)
8/10/2019 Monitoring the Future Release.pdf
http://slidepdf.com/reader/full/monitoring-the-future-releasepdf 11/35
FIGURE 6
Marijuana: Trends in Annual Use, Risk, Disapproval, and Availability
Grades 8, 10, and 12
Source. The Monitoring the Future study, the University of Michigan.
Use% who used in last 12 months
Risk% seeing "great risk" in using regularly
Disapproval% disapproving of using regularly
Availability% saying "fairly easy" or "very easy" to get
P E R C E N T
0
20
40
60
80
100
YEAR
'74 '76 '78 '80 '82 '84 '86 '88 '90 '92 '94 '96 '98 '00 '02 '04 '06 '08 '10 '12 '14
8th Grade10th Grade12th Grade
P E R C E N T
0
20
40
60
80
100
YEAR
'74 '76 '78 '80 '82 '84 '86 '88 '90 '92 '94 '96 '98 '00 '02 '04 '06 '08 '10 '12 '14
P E R C E N T
0
20
40
60
80
100
YEAR
'74 '76 '78 '80 '82 '84 '86 '88 '90 '92 '94 '96 '98 '00 '02 '04 '06 '08 '10 '12 '14
P E R C E N T
0
20
40
60
80
100
YEAR
'74 '76 '78 '80 '82 '84 '86 '88 '90 '92 '94 '96 '98 '00 '02 '04 '06 '08 '10 '12 '14
8/10/2019 Monitoring the Future Release.pdf
http://slidepdf.com/reader/full/monitoring-the-future-releasepdf 12/35
FIGURE 7
Marijuana: Trends in Daily Use, Risk, Disapproval, and Availability
Grades 8, 10, and 12
Source. The Monitoring the Future study, the University of Michigan.
Use% who used daily
Risk% seeing "great risk" in using regularly
Disapproval% disapproving of using regularly
Availability% saying "fairly easy" or "very easy" to get
P E R C E N T
0
4
8
12
16
20
YEAR
'74 '76 '78 '80 '82 '84 '86 '88 '90 '92 '94 '96 '98 '00 '02 '04 '06 '08 '10 '12 '14
8th Grade10th Grade12th Grade
P E R C E N T
0
20
40
60
80
100
YEAR
'74 '76 '78 '80 '82 '84 '86 '88 '90 '92 '94 '96 '98 '00 '02 '04 '06 '08 '10 '12 '14
P E R C E N T
0
20
40
60
80
100
YEAR
'74 '76 '78 '80 '82 '84 '86 '88 '90 '92 '94 '96 '98 '00 '02 '04 '06 '08 '10 '12 '14
P E R C E N T
0
20
40
60
80
100
YEAR
'74 '76 '78 '80 '82 '84 '86 '88 '90 '92 '94 '96 '98 '00 '02 '04 '06 '08 '10 '12 '14
8/10/2019 Monitoring the Future Release.pdf
http://slidepdf.com/reader/full/monitoring-the-future-releasepdf 13/35
FIGURE 8
Trends in Annual Prevalence of Any Illicit Drug other than Marijuana*
Grades 8, 10, and 12
Source. The Monitoring the Future study, the University of Michigan.
*Revised sets of questions on other hallucinogen and tranquilizer use were in introduced in 2001, and for
amphetamine use in 2013. Data for any illicit drug other than marijuna were affected by these changes.
P E R C E N T
0
20
40
60
80
YEAR
'74 '76 '78 '80 '82 '84 '86 '88 '90 '92 '94 '96 '98 '00 '02 '04 '06 '08 '10 '12 '14
8th Grade10th Grade12th Grade
8/10/2019 Monitoring the Future Release.pdf
http://slidepdf.com/reader/full/monitoring-the-future-releasepdf 14/35
FIGURE 9
Ecstasy (MDMA): Trends in Annual Use, Risk, Disapproval, and Availability
Grades 8, 10, and 12
Source. The Monitoring the Future study, the University of Michigan.
Use% who used in last 12 months
Risk% seeing "great risk" in using once or twice
Disapproval
% disapproving of using once or twice
Availability
% saying "fairly easy" or "very easy" to get
P E R C E N T
0
2
4
6
8
10
YEAR
'74 '76 '78 '80 '82 '84 '86 '88 '90 '92 '94 '96 '98 '00 '02 '04 '06 '08 '10 '12 '14
8th Grade10th Grade12th Grade
P E R C E N T
0
20
40
60
80
100
YEAR
'74 '76 '78 '80 '82 '84 '86 '88 '90 '92 '94 '96 '98 '00 '02 '04 '06 '08 '10 '12 '14
P E R C E N T
0
20
40
60
80
100
YEAR
'74 '76 '78 '80 '82 '84 '86 '88 '90 '92 '94 '96 '98 '00 '02 '04 '06 '08 '10 '12 '14
P E R C E N T
0
20
40
60
80
100
YEAR
'74 '76 '78 '80 '82 '84 '86 '88 '90 '92 '94 '96 '98 '00 '02 '04 '06 '08 '10 '12 '14
8/10/2019 Monitoring the Future Release.pdf
http://slidepdf.com/reader/full/monitoring-the-future-releasepdf 15/35
FIGURE 10
Hallucinogens other than LSD: Trends in Annual Use and Availability
Grades 8, 10, and 12
Source. The Monitoring the Future study, the University of Michigan.
*Beginning in 2001, a revised set of questions on other hallucinogens was introduced in which shrooms was added to the
list of examples.
**In 2001, the question text was changed from other psychedelics to other hallucinogens.
Use*% who used in last 12 months
Risk% seeing "great risk" in using once or twice
Disapproval% disapproving of using once or twice
Availability**% saying "fairly easy" or "very easy" to get
P E R C E N T
0
4
8
12
16
20
YEAR
'74 '76 '78 '80 '82 '84 '86 '88 '90 '92 '94 '96 '98 '00 '02 '04 '06 '08 '10 '12 '14
8th Grade10th Grade12th Grade
P E R C E N T
0
20
40
60
80
100
YEAR
'74 '76 '78 '80 '82 '84 '86 '88 '90 '92 '94 '96 '98 '00 '02 '04 '06 '08 '10 '12 '14
(no data)
P E R C E N T
0
20
40
60
80
100
YEAR
'74 '76 '78 '80 '82 '84 '86 '88 '90 '92 '94 '96 '98 '00 '02 '04 '06 '08 '10 '12 '14
(no data)
P E R C E N T
0
20
40
60
80
100
YEAR
'74 '76 '78 '80 '82 '84 '86 '88 '90 '92 '94 '96 '98 '00 '02 '04 '06 '08 '10 '12 '14
8/10/2019 Monitoring the Future Release.pdf
http://slidepdf.com/reader/full/monitoring-the-future-releasepdf 16/35
FIGURE 11
Narcotics other than Heroin: Trends in Annual Use and Availability
Grades 8, 10, and 12
Source. The Monitoring the Future study, the University of Michigan.
*Beginning in 2002, a revised set of questions on other narcotics use was introduced in which Talwin, laudanum, and paregoric
were replaced with Vicodin, OxyContin, and Percocet.
**Beginning in 2010, a revised set of questions on availability of other narcotics was introduced in which methadone and opium
were replaced with Vicodin, OxyContin, and Percocet.
Use*% who used in last 12 months
Risk% seeing "great risk" in using once or twice
Disapproval% disapproving of using once or twice
Availability**% saying "fairly easy" or "very easy" to get
P E R C E N T
0
4
8
12
16
20
YEAR
'74 '76 '78 '80 '82 '84 '86 '88 '90 '92 '94 '96 '98 '00 '02 '04 '06 '08 '10 '12 '14
8th Grade10th Grade12th Grade
P E R C E N T
0
20
40
60
80
100
YEAR
'74 '76 '78 '80 '82 '84 '86 '88 '90 '92 '94 '96 '98 '00 '02 '04 '06 '08 '10 '12 '14
(no data)
P E R C E N T
0
20
40
60
80
100
YEAR
'74 '76 '78 '80 '82 '84 '86 '88 '90 '92 '94 '96 '98 '00 '02 '04 '06 '08 '10 '12 '14
(no data)
P E R C E N T
0
20
40
60
80
100
YEAR
'74 '76 '78 '80 '82 '84 '86 '88 '90 '92 '94 '96 '98 '00 '02 '04 '06 '08 '10 '12 '14
8/10/2019 Monitoring the Future Release.pdf
http://slidepdf.com/reader/full/monitoring-the-future-releasepdf 17/35
FIGURE 12
Over-the-Counter Cough/Cold Medication: Trends in Annual Use and Risk
Grades 8, 10, and 12
Source. The Monitoring the Future study, the University of Michigan.
Use% who used in last 12 months
Risk% seeing "great risk" in using once or twice
Disapproval% disapproving of using once or twice
Availability% saying "fairly easy" or "very easy" to get
P E R C E N T
0
4
8
12
16
20
YEAR
'74 '76 '78 '80 '82 '84 '86 '88 '90 '92 '94 '96 '98 '00 '02 '04 '06 '08 '10 '12 '14
8th Grade10th Grade12th Grade
P E R C E N T
0
20
40
60
80
100
YEAR
'74 '76 '78 '80 '82 '84 '86 '88 '90 '92 '94 '96 '98 '00 '02 '04 '06 '08 '10 '12 '14
P E R C E N T
0
20
40
60
80
100
YEAR
'74 '76 '78 '80 '82 '84 '86 '88 '90 '92 '94 '96 '98 '00 '02 '04 '06 '08 '10 '12 '14
(no data)
P E R C E N T
0
20
40
60
80
100
YEAR
'74 '76 '78 '80 '82 '84 '86 '88 '90 '92 '94 '96 '98 '00 '02 '04 '06 '08 '10 '12 '14
(no data)
8/10/2019 Monitoring the Future Release.pdf
http://slidepdf.com/reader/full/monitoring-the-future-releasepdf 18/35
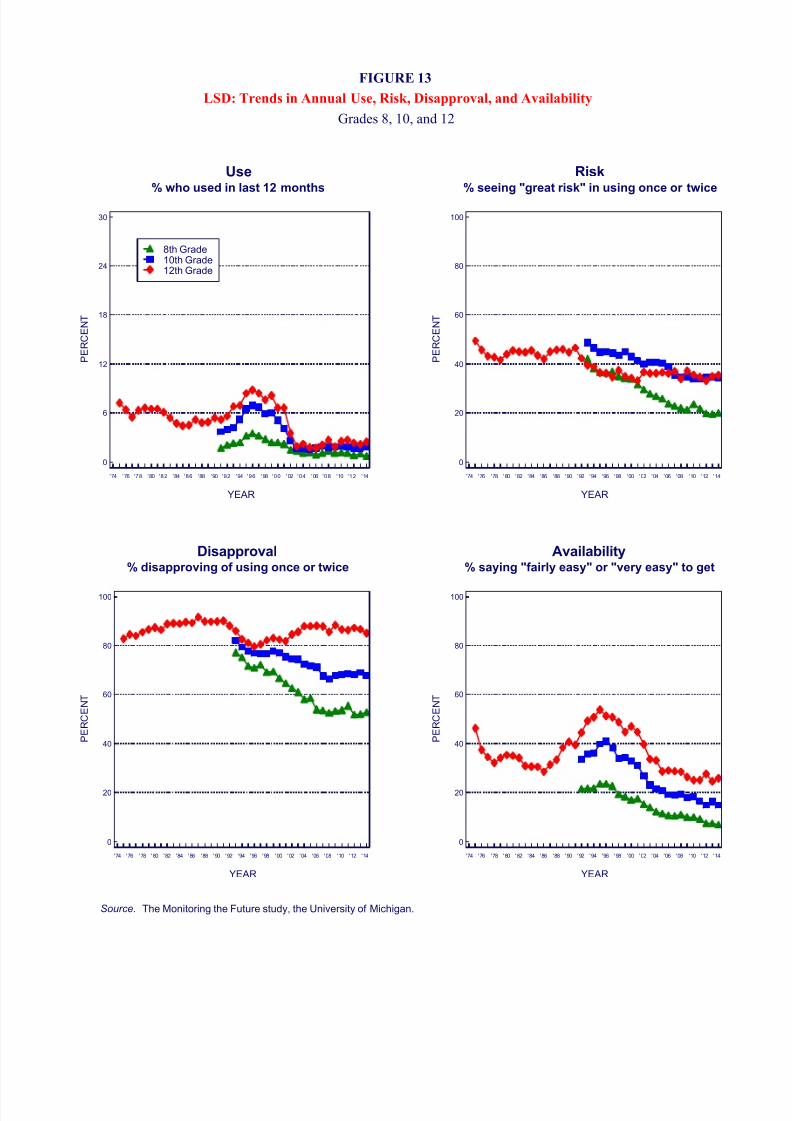
FIGURE 13
LSD: Trends in Annual Use, Risk, Disapproval, and Availability
Grades 8, 10, and 12
Source. The Monitoring the Future study, the University of Michigan.
Use% who used in last 12 months
Risk% seeing "great risk" in using once or twice
Disapproval% disapproving of using once or twice
Availability% saying "fairly easy" or "very easy" to get
P E R C E N T
0
6
12
18
24
30
YEAR
'74 '76 '78 '80 '82 '84 '86 '88 '90 '92 '94 '96 '98 '00 '02 '04 '06 '08 '10 '12 '14
8th Grade10th Grade12th Grade
P E R C E N T
0
20
40
60
80
100
YEAR
'74 '76 '78 '80 '82 '84 '86 '88 '90 '92 '94 '96 '98 '00 '02 '04 '06 '08 '10 '12 '14
P E R C E N T
0
20
40
60
80
100
YEAR
'74 '76 '78 '80 '82 '84 '86 '88 '90 '92 '94 '96 '98 '00 '02 '04 '06 '08 '10 '12 '14
P E R C E N T
0
20
40
60
80
100
YEAR
'74 '76 '78 '80 '82 '84 '86 '88 '90 '92 '94 '96 '98 '00 '02 '04 '06 '08 '10 '12 '14
8/10/2019 Monitoring the Future Release.pdf
http://slidepdf.com/reader/full/monitoring-the-future-releasepdf 19/35
1991 1992 1993 1994 1995 1996 1997 1998 1999 2000 2001 2002 2003 2004 2005 2006 2007 2008 2009 2010 2011 2012 2013 2014
8th Grade 18.7 20.6 22.5 25.7 28.5 31.2 29.4 29.0 28.3 26.8 26.8 24.5 22.8 21.5 21.4 20.9 19.0 19.6 19.9 21.4 20.1 18.5‡ 21.1 20.3 -0.8 10th Grade 30.6 29.8 32.8 37.4 40.9 45.4 47.3 44.9 46.2 45.6 45.6 44.6 41.4 39.8 38.2 36.1 35.6 34.1 36.0 37.0 37.7 36.8‡ 39.1 37.4 -1.7
12th Grade 44.1 40.7 42.9 45.6 48.4 50.8 54.3 54.1 54.7 54.0 53.9 53.0 51.1 51.1 50.4 48.2 46.8 47.4 46.7 48.2 49.9 49.1‡ 49.8 49.1 -0.8
Any Illicit Drug other
8th Grade 14.3 15.6 16.8 17.5 18.8 19.2 17.7 16.9 16.3 15.8‡ 17.0 13.7 13.6 12.2 12.1 12.2 11.1 11.2 10.4 10.6 9.8 8.7‡ 10.4 10.0 -0.5
10th Grade 19.1 19.2 20.9 21.7 24.3 25.5 25.0 23.6 24.0 23.1‡ 23.6 22.1 19.7 18.8 18.0 17.5 18.2 15.9 16.7 16.8 15.6 14.9‡ 16.4 15.9 -0.5
12th Grade 26.9 25.1 26.7 27.6 28.1 28.5 30.0 29.4 29.4 29.0‡ 30.7 29.5 27.7 28.7 27.4 26.9 25.5 24.9 24.0 24.7 24.9 24.1‡ 24.8 22.6 -2.2
including Inhalantsa,c
8th Grade 28.5 29.6 32.3 35.1 38.1 39.4 38.1 37.8 37.2 35.1 34.5 31.6 30.3 30.2 30.0 29.2 27.7 28.3 27.9 28.6 26.4 25.1‡ 25.9 25.2 -0.7
10th Grade 36.1 36.2 38.7 42.7 45.9 49.8 50.9 49.3 49.9 49.3 48.8 47.7 44.9 43.1 42.1 40.1 39.8 38.7 40.0 40.6 40.8 40.0‡ 41.6 40.4 -1.2
12th Grade 47.6 44.4 46.6 49.1 51.5 53.5 56.3 56.1 56.3 57.0 56.0 54.6 52.8 53.0 53.5 51.2 49.1 49.3 48.4 49.9 51.8 50.3‡ 52.3 49.9 -2.4
8th Grade 10.2 11.2 12.6 16.7 19.9 23.1 22.6 22.2 22.0 20.3 20.4 19.2 17.5 16.3 16.5 15.7 14.2 14.6 15.7 17.3 16.4 15.2 16.5 15.6 -0.9
10th Grade 23.4 21.4 24.4 30.4 34.1 39.8 42.3 39.6 40.9 40.3 40.1 38.7 36.4 35.1 34.1 31.8 31.0 29.9 32.3 33.4 34.5 33.8 35.8 33.7 -2.2
12th Grade 36.7 32.6 35.3 38.2 41.7 44.9 49.6 49.1 49.7 48.8 49.0 47.8 46.1 45.7 44.8 42.3 41.8 42.6 42.0 43.8 45.5 45.2 45.5 44.4 -1.1
8th Grade 17.6 17.4 19.4 19.9 21.6 21.2 21.0 20.5 19.7 17.9 17.1 15.2 15.8 17.3 17.1 16.1 15.6 15.7 14.9 14.5 13.1 11.8 10.8 10.8 0.0
10th Grade 15.7 16.6 17.5 18.0 19.0 19.3 18.3 18.3 17.0 16.6 15.2 13.5 12.7 12.4 13.1 13.3 13.6 12.8 12.3 12.0 10.1 9.9 8.7 8.7 +0.1
12th Grade 17.6 16.6 17.4 17.7 17.4 16.6 16.1 15.2 15.4 14.2 13.0 11.7 11.2 10.9 11.4 11.1 10.5 9.9 9.5 9.0 8.1 7.9 6.9 6.5 -0.4
8th Grade — — — — — — — — — — — — — — — — — — — — — — — — —
10th Grade — — — — — — — — — — — — — — — — — — — — — — — — —
1 2th Grade 1.6 1.5 1.4 1.7 1.5 1.8 2.0 2.7 1.7 0.8 1.9 1.5 1.6 1.3 1.1 1.2 1.2 0.6 1.1 — — — — — —
8th Grade 3.2 3.8 3.9 4.3 5.2 5.9 5.4 4.9 4.8 4.6‡ 5.2 4.1 4.0 3.5 3.8 3.4 3.1 3.3 3.0 3.4 3.3 2.8 2.5 2.0 -0.5
10th Grade 6.1 6.4 6.8 8.1 9.3 10.5 10.5 9.8 9.7 8.9‡ 8.9 7.8 6.9 6.4 5.8 6.1 6.4 5.5 6.1 6.1 6.0 5.2 5.4 5.0 -0.4
12th Grade 9.6 9.2 10.9 11.4 12.7 14.0 15.1 14.1 13.7 13.0‡ 14.7 12.0 10.6 9.7 8.8 8.3 8.4 8.7 7.4 8.6 8.3 7.5 7.6 6.3 -1.3
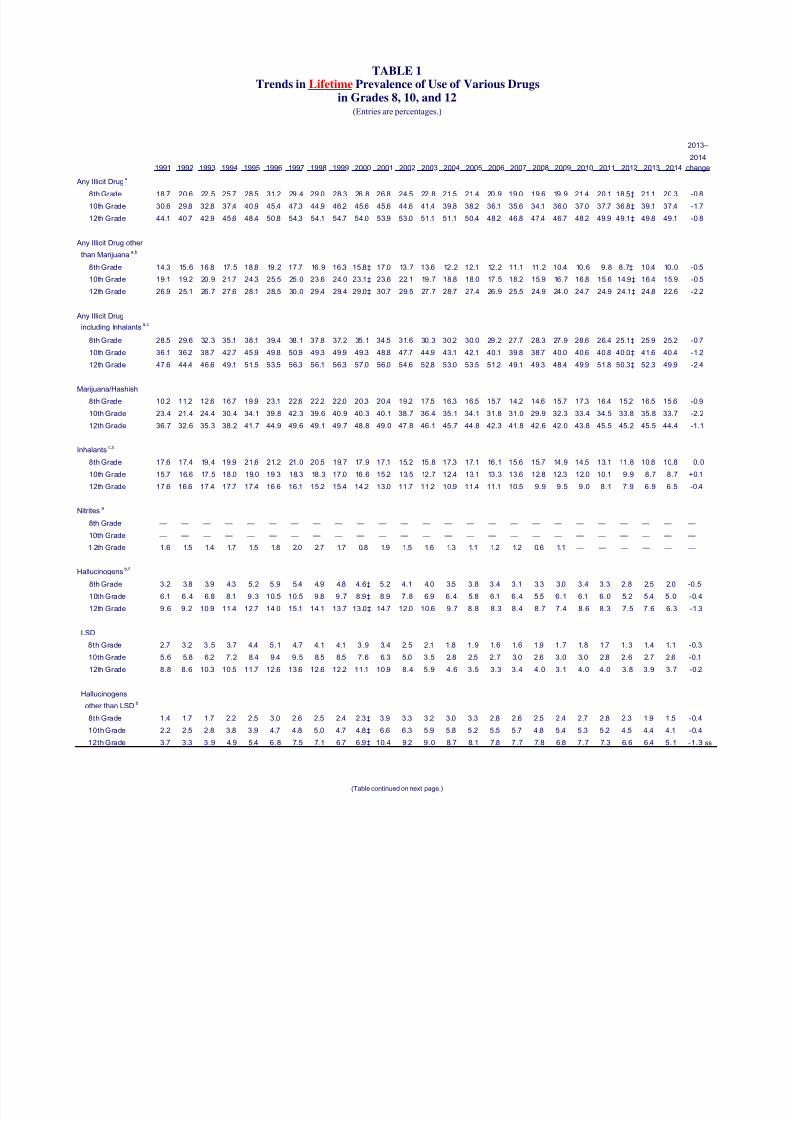
8th Grade 2.7 3.2 3.5 3.7 4.4 5.1 4.7 4.1 4.1 3.9 3.4 2.5 2.1 1.8 1.9 1.6 1.6 1.9 1.7 1.8 1.7 1.3 1.4 1.1 -0.3
10th Grade 5.6 5.8 6.2 7.2 8.4 9.4 9.5 8.5 8.5 7.6 6.3 5.0 3.5 2.8 2.5 2.7 3.0 2.6 3.0 3.0 2.8 2.6 2.7 2.6 -0.1
12th Grade 8.8 8.6 10.3 10.5 11.7 12.6 13.6 12.6 12.2 11.1 10.9 8.4 5.9 4.6 3.5 3.3 3.4 4.0 3.1 4.0 4.0 3.8 3.9 3.7 -0.2
8th Grade 1.4 1.7 1.7 2.2 2.5 3.0 2.6 2.5 2.4 2.3‡ 3.9 3.3 3.2 3.0 3.3 2.8 2.6 2.5 2.4 2.7 2.8 2.3 1.9 1.5 -0.4
10th Grade 2.2 2.5 2.8 3.8 3.9 4.7 4.8 5.0 4.7 4.8‡ 6.6 6.3 5.9 5.8 5.2 5.5 5.7 4.8 5.4 5.3 5.2 4.5 4.4 4.1 -0.4
12th Grade 3.7 3.3 3.9 4.9 5.4 6.8 7.5 7.1 6.7 6.9‡ 10.4 9.2 9.0 8.7 8.1 7.8 7.7 7.8 6.8 7.7 7.3 6.6 6.4 5.1 -1.3 ss
Inhalantsc,d
Nitritese
Hallucinogensb,f
2014
TABLE 1Trends in Lifetime Prevalence of Use of Various Drugs
in Grades 8, 10, and 12
2013–
change
Any Illicit Druga
than Marijuanaa,b
Any Illicit Drug
Marijuana/Hashish
(Entries are percentages.)
LSD
Hallucinogens
other than LSDb
(Table continued on next page.)
8/10/2019 Monitoring the Future Release.pdf
http://slidepdf.com/reader/full/monitoring-the-future-releasepdf 20/35
1991 1992 1993 1994 1995 1996 1997 1998 1999 2000 2001 2002 2003 2004 2005 2006 2007 2008 2009 2010 2011 2012 2013 2014
8th Grade — — — — — — — — — — — — — — — — — — — — — — — — — 10th Grade — — — — — — — — — — — — — — — — — — — — — — — — —
12th Grade 2.9 2.4 2.9 2.8 2.7 4.0 3.9 3.9 3.4 3.4 3.5 3.1 2.5 1.6 2.4 2.2 2.1 1.8 1.7 1.8 2.3 1.6 1.3 — —
8 th Grade — — — — — 3.4 3.2 2.7 2.7 4.3 5.2 4.3 3.2 2.8 2.8 2.5 2.3 2.4 2.2 3.3 2.6 2.0 1.8 1.4 - 0.3
1 0th Grade — — — — — 5.6 5.7 5.1 6.0 7.3 8.0 6.6 5.4 4.3 4.0 4.5 5.2 4.3 5.5 6.4 6.6 5.0 5.7 3.7 - 1.9 sss
12th Grade — — — — — 6.1 6.9 5.8 8.0 11.0 11.7 10.5 8.3 7.5 5.4 6.5 6.5 6.2 6.5 7.3 8.0 7.2 7.1 5.6 -1.5
8th Grade 2.3 2.9 2.9 3.6 4.2 4.5 4.4 4.6 4.7 4.5 4.3 3.6 3.6 3.4 3.7 3.4 3.1 3.0 2.6 2.6 2.2 1.9 1.7 1.8 0.0
10th Grade 4.1 3.3 3.6 4.3 5.0 6.5 7.1 7.2 7.7 6.9 5.7 6.1 5.1 5.4 5.2 4.8 5.3 4.5 4.6 3.7 3.3 3.3 3.3 2.6 -0.7
12th Grade 7.8 6.1 6.1 5.9 6.0 7.1 8.7 9.3 9.8 8.6 8.2 7.8 7.7 8.1 8.0 8.5 7.8 7.2 6.0 5.5 5.2 4.9 4.5 4.6 0.0
8th Grade 1.3 1.6 1.7 2.4 2.7 2.9 2.7 3.2 3.1 3.1 3.0 2.5 2.5 2.4 2.4 2.3 2.1 2.0 1.7 1.5 1.5 1.0 1.2 1.2 +0.1
10th Grade 1.7 1.5 1.8 2.1 2.8 3.3 3.6 3.9 4.0 3.7 3.1 3.6 2.7 2.6 2.5 2.2 2.3 2.0 2.1 1.8 1.6 1.4 1.5 1.0 -0.4 s 12th Grade 3.1 2.6 2.6 3.0 3.0 3.3 3.9 4.4 4.6 3.9 3.7 3.8 3.6 3.9 3.5 3.5 3.2 2.8 2.4 2.4 1.9 2.1 1.8 1.8 -0.1
8th Grade 2.0 2.4 2.4 3.0 3.4 3.8 3.5 3.7 3.8 3.5 3.3 2.8 2.7 2.6 2.9 2.7 2.6 2.4 2.1 2.1 1.8 1.6 1.4 1.4 0.0
10th Grade 3.8 3.0 3.3 3.8 4.4 5.5 6.1 6.4 6.8 6.0 5.0 5.2 4.5 4.8 4.6 4.3 4.8 4.0 4.1 3.4 3.0 3.0 2.9 2.2 -0.6
12th Grade 7.0 5.3 5.4 5.2 5.1 6.4 8.2 8.4 8.8 7.7 7.4 7.0 6.7 7.3 7.1 7.9 6.8 6.5 5.3 5.1 4.9 4.4 4.2 4.1 -0.1
8th Grade 1.2 1.4 1.4 2.0 2.3 2.4 2.1 2.3 2.3 1.9 1.7 1.6 1.6 1.6 1.5 1.4 1.3 1.4 1.3 1.3 1.2 0.8 1.0 0.9 0.0
10th Grade 1.2 1.2 1.3 1.5 1.7 2.1 2.1 2.3 2.3 2.2 1.7 1.8 1.5 1.5 1.5 1.4 1.5 1.2 1.5 1.3 1.2 1.1 1.0 0.9 -0.2
12th Grade 0.9 1.2 1.1 1.2 1.6 1.8 2.1 2.0 2.0 2.4 1.8 1.7 1.5 1.5 1.5 1.4 1.5 1.3 1.2 1.6 1.4 1.1 1.0 1.0 -0.1
8th Grade — — — — 1.5 1.6 1.3 1.4 1.6 1.1 1.2 1.0 1.0 1.1 1.0 1.0 0.9 0.9 0.9 0.9 0.8 0.6 0.6 0.8 +0.2
1 0th Grade — — — — 1.0 1.1 1.1 1.2 1.3 1.0 0.8 1.0 0.9 0.8 0.8 0.9 0.9 0.7 0.9 0.8 0.8 0.7 0.7 0.6 -0.1
1 2th Grade — — — — 0.7 0.8 0.9 0.8 0.9 0.8 0.7 0.8 0.7 0.7 0.9 0.8 0.7 0.7 0.6 1.1 0.9 0.7 0.7 0.8 +0.1
8th Grade — — — — 1.5 1.6 1.4 1.5 1.4 1.3 1.1 1.0 1.1 1.0 0.9 0.9 0.7 0.9 0.8 0.7 0.7 0.5 0.5 0.4 -0.1
1 0th Grade — — — — 1.1 1.7 1.7 1.7 1.6 1.7 1.3 1.3 1.0 1.1 1.1 1.0 1.1 0.8 1.0 0.9 0.8 0.8 0.7 0.5 - 0.1
1 2th Grade — — — — 1.4 1.7 2.1 1.6 1.8 2.4 1.5 1.6 1.8 1.4 1.3 1.1 1.4 1.1 0.9 1.4 1.3 0.8 0.9 0.7 - 0.2
8th Grade — — — — — — — — — — — — — — — — — — — — — — — — —
10th Grade — — — — — — — — — — — — — — — — — — — — — — — — —
12th Grade 6.6 6.1 6.4 6.6 7.2 8.2 9.7 9.8 10.2 10.6 9.9‡ 13.5 13.2 13.5 12.8 13.4 13.1 13.2 13.2 13.0 13.0 12.2 11.1 9.5 -1.6 ss
PCPe
Ecstasy (MDMA)g
Narcotics other than Heroink,l
TABLE 1 (cont.)Trends in Lifetime Prevalence of Use of Various Drugs
in Grades 8, 10, and 12
2013–
2014
change
Heroini
With a Needle j
Without a Needle j
Other Cocaineh
Cocaine
Crack
(Entries are percentages.)
(Table continued on next page.)
8/10/2019 Monitoring the Future Release.pdf
http://slidepdf.com/reader/full/monitoring-the-future-releasepdf 21/35
1991 1992 1993 1994 1995 1996 1997 1998 1999 2000 2001 2002 2003 2004 2005 2006 2007 2008 2009 2010 2011 2012 2013 2014
8th Grade 10.5 10.8 11.8 12.3 13.1 13.5 12.3 11.3 10.7 9.9 10.2 8.7 8.4 7.5 7.4 7.3 6.5 6.8 6.0 5.7 5.2 4.5‡ 6.9 6.7 -0.2
10th Grade 13.2 13.1 14.9 15.1 17.4 17.7 17.0 16.0 15.7 15.7 16.0 14.9 13.1 11.9 11.1 11.2 11.1 9.0 10.3 10.6 9.0 8.9‡ 11.2 10.6 -0.6
12th Grade 15.4 13.9 15.1 15.7 15.3 15.3 16.5 16.4 16.3 15.6 16.2 16.8 14.4 15.0 13.1 12.4 11.4 10.5 9.9 11.1 12.2 12.0‡ 13.8 12.1 -1.7
Methamphetaminen,o
8th Grade — — — — — — — — 4.5 4.2 4.4 3.5 3.9 2.5 3.1 2.7 1.8 2.3 1.6 1.8 1.3 1.3 1.4 1.0 -0.4
10th Grade — — — — — — — — 7.3 6.9 6.4 6.1 5.2 5.3 4.1 3.2 2.8 2.4 2.8 2.5 2.1 1.8 1.6 1.4 -0.2
12th Grade — — — — — — — — 8.2 7.9 6.9 6.7 6.2 6.2 4.5 4.4 3.0 2.8 2.4 2.3 2.1 1.7 1.5 1.9 +0.4
8th Grade — — — — — — — — — — — — — — — — — — — — — — — — —
10th Grade — — — — — — — — — — — — — — — — — — — — — — — — —
12th Grade 3.3 2.9 3.1 3.4 3.9 4.4 4.4 5.3 4.8 4.0 4.1 4.7 3.9 4.0 4.0 3.4 3.4 2.8 2.1 1.8 2.1 1.7 2.0 1.3 -0.6
Sedatives (Barbiturates)k,p
8th Grade — — — — — — — — — — — — — — — — — — — — — — — — — 10th Grade — — — — — — — — — — — — — — — — — — — — — — — — —
12th Grade 6.2 5.5 6.3 7.0 7.4 7.6 8.1 8.7 8.9 9.2 8.7 9.5 8.8 9.9 10.5 10.2 9.3 8.5 8.2 7.5 7.0 6.9 7.5 6.8 -0.6
8th Grade — — — — — — — — — — — — — — — — — — — — — — — — —
10th Grade — — — — — — — — — — — — — — — — — — — — — — — — —
12th Grade 1.3 1.6 0.8 1.4 1.2 2.0 1.7 1.6 1.8 0.8 1.1 1.5 1.0 1.3 1.3 1.2 1.0 0.8 0.7 0.4 0.6 0.8 — — —
8th Grade 3.8 4.1 4.4 4.6 4.5 5.3 4.8 4.6 4.4 4.4‡ 5.0 4.3 4.4 4.0 4.1 4.3 3.9 3.9 3.9 4.4 3.4 3.0 2.9 2.9 0.0
10th Grade 5.8 5.9 5.7 5.4 6.0 7.1 7.3 7.8 7.9 8.0‡ 9.2 8.8 7.8 7.3 7.1 7.2 7.4 6.8 7.0 7.3 6.8 6.3 5.5 5.8 +0.3
12th Grade 7.2 6.0 6.4 6.6 7.1 7.2 7.8 8.5 9.3 8.9‡ 10.3 11.4 10.2 10.6 9.9 10.3 9.5 8.9 9.3 8.5 8.7 8.5 7.7 7.4 -0.3
Any Prescription Drugq
8th Grade — — — — — — — — — — — — — — — — — — — — — — — — —
10th Grade — — — — — — — — — — — — — — — — — — — — — — — — —
12th Grade — — — — — — — — — — — — — — 24.0 23.9 22.2 21.5 20.9 21.6 21.7 21.2‡ 22.2 19.9 -2.3 s
8 th Grade — — — — — 1.5 1.1 1.4 1.3 1.0 1.1 0.8 1.0 1.0 1.1 1.0 1.0 0.7 0.7 0.9 2.0 1.0 0.7 0.6 - 0.1
1 0th Grade — — — — — 1.5 1.7 2.0 1.8 1.3 1.5 1.3 1.0 1.2 1.0 0.8 1.3 0.9 0.7 1.4 1.2 0.8 1.1 1.0 - 0.1
12th Grade — — — — — 1.2 1.8 3.0 2.0 1.5 1.7 — — — — — — — — — — — — — —
8th Grade 70.1 69.3‡ 55.7 55.8 54.5 55.3 53.8 52.5 52.1 51.7 50.5 47.0 45.6 43.9 41.0 40.5 38.9 38.9 36.6 35.8 33.1 29.5 27.8 26.8 -1.0
10th Grade 83.8 82.3‡ 71.6 71.1 70.5 71.8 72.0 69.8 70.6 71.4 70.1 66.9 66.0 64.2 63.2 61.5 61.7 58.3 59.1 58.2 56.0 54.0 52.1 49.3 -2.8 s
12th Grade 88.0 87.5‡ 80.0 80.4 80.7 79.2 81.7 81.4 80.0 80.3 79.7 78.4 76.6 76.8 75.1 72.7 72.2 71.9 72.3 71.0 70.0 69.4 68.2 66.0 -2.2 s
8th Grade 26.7 26.8 26.4 25.9 25.3 26.8 25.2 24.8 24.8 25.1 23.4 21.3 20.3 19.9 19.5 19.5 17.9 18.0 17.4 16.3 14.8 12.8 12.2 10.8 -1.4 s
10th Grade 50.0 47.7 47.9 47.2 46.9 48.5 49.4 46.7 48.9 49.3 48.2 44.0 42.4 42.3 42.1 41.4 41.2 37.2 38.6 36.9 35.9 34.6 33.5 30.2 -3.4 ss
12th Grade 65.4 63.4 62.5 62.9 63.2 61.8 64.2 62.4 62.3 62.3 63.9 61.6 58.1 60.3 57.5 56.4 55.1 54.7 56.5 54.1 51.0 54.2 52.3 49.8 -2.5
Tranquilizersb,k
Amphetamines
k,m
TABLE 1 (cont.)Trends in Lifetime Prevalence of Use of Various Drugs
in Grades 8, 10, and 12
2013–
2014
change
Methaqualonee,k
Crystal Methamphetamine (Ice)o
(Entries are percentages.)
Rohypnolr
Alcohols
Any Use
Been Drunko
(Table continued on next page.)
8/10/2019 Monitoring the Future Release.pdf
http://slidepdf.com/reader/full/monitoring-the-future-releasepdf 22/35
1991 1992 1993 1994 1995 1996 1997 1998 1999 2000 2001 2002 2003 2004 2005 2006 2007 2008 2009 2010 2011 2012 2013 2014
Beverages
e,n
8th Grade — — — — — — — — — — — — — 37.9 35.5 35.5 34.0 32.8 29.4 30.0 27.0 23.5 21.9 19.2 -2.7 s
10th Grade — — — — — — — — — — — — — 58.6 58.8 58.1 55.7 53.5 51.4 51.3 48.4 46.7 44.9 42.3 -2.6
12th Grade — — — — — — — — — — — — — 71.0 73.6 69.9 68.4 65.5 67.4 62.6 62.4 60.5 58.9 57.5 -1.3
8th Grade 44.0 45.2 45.3 46.1 46.4 49.2 47.3 45.7 44.1 40.5 36.6 31.4 28.4 27.9 25.9 24.6 22.1 20.5 20.1 20.0 18.4 15.5 14.8 13.5 -1.3
10th Grade 55.1 53.5 56.3 56.9 57.6 61.2 60.2 57.7 57.6 55.1 52.8 47.4 43.0 40.7 38.9 36.1 34.6 31.7 32.7 33.0 30.4 27.7 25.7 22.6 -3.1 ss
12th Grade 63.1 61.8 61.9 62.0 64.2 63.5 65.4 65.3 64.6 62.5 61.0 57.2 53.7 52.8 50.0 47.1 46.2 44.7 43.6 42.2 40.0 39.5 38.1 34.4 -3.7 ss
Smokeless Tobaccot
8th Grade 22.2 20.7 18.7 19.9 20.0 20.4 16.8 15.0 14.4 12.8 11.7 11.2 11.3 11.0 10.1 10.2 9.1 9.8 9.6 9.9 9.7 8.1 7.9 8.0 +0.1
10th Grade 28.2 26.6 28.1 29.2 27.6 27.4 26.3 22.7 20.4 19.1 19.5 16.9 14.6 13.8 14.5 15.0 15.1 12.2 15.2 16.8 15.6 15.4 14.0 13.6 -0.4
12th Grade — 32.4 31.0 30.7 30.9 29.8 25.3 26.2 23.4 23.1 19.7 18.3 17.0 16.7 17.5 15.2 15.1 15.6 16.3 17.6 16.9 17.4 17.2 15.1 -2.1
8th Grade 1.9 1.7 1.6 2.0 2.0 1.8 1.8 2.3 2.7 3.0 2.8 2.5 2.5 1.9 1.7 1.6 1.5 1.4 1.3 1.1 1.2 1.2 1.1 1.0 -0.1
10th Grade 1.8 1.7 1.7 1.8 2.0 1.8 2.0 2.0 2.7 3.5 3.5 3.5 3.0 2.4 2.0 1.8 1.8 1.4 1.3 1.6 1.4 1.3 1.3 1.4 +0.2
12th Grade 2.1 2.1 2.0 2.4 2.3 1.9 2.4 2.7 2.9 2.5 3.7 4.0 3.5 3.4 2.6 2.7 2.2 2.2 2.2 2.0 1.8 1.8 2.1 1.9 -0.2
Source. The Monitoring the Future study, the University of Michigan.
Note: See footnotes following Table 5-5e.
2014
TABLE 1 (cont.)Trends in Lifetime Prevalence of Use of Various Drugs
in Grades 8, 10, and 12
2013–
(Entries are percentages.)
change
Cigarettes
Any Use
Steroids
k,u
Flavored Alcoholic
8/10/2019 Monitoring the Future Release.pdf
http://slidepdf.com/reader/full/monitoring-the-future-releasepdf 23/35
1991 1992 1993 1994 1995 1996 1997 1998 1999 2000 2001 2002 2003 2004 2005 2006 2007 2008 2009 2010 2011 2012 2013 2014
8th Grade 11.3 12.9 15.1 18.5 21.4 23.6 22.1 21.0 20.5 19.5 19.5 17.7 16.1 15.2 15.5 14.8 13.2 14.1 14.5 16.0 14.7 13.4‡ 15.2 14.6 -0.6 10th Grade 21.4 20.4 24.7 30.0 33.3 37.5 38.5 35.0 35.9 36.4 37.2 34.8 32.0 31.1 29.8 28.7 28.1 26.9 29.4 30.2 31.1 30.1‡ 32.1 29.9 -2.1
12th Grade 29.4 27.1 31.0 35.8 39.0 40.2 42.4 41.4 42.1 40.9 41.4 41.0 39.3 38.8 38.4 36.5 35.9 36.6 36.5 38.3 40.0 39.7‡ 40.1 38.7 -1.5
8th Grade 8.4 9.3 10.4 11.3 12.6 13.1 11.8 11.0 10.5 10.2‡ 10.8 8.8 8.8 7.9 8.1 7.7 7.0 7.4 7.0 7.1 6.4 5.5‡ 6.3 6.4 +0.1
10th Grade 12.2 12.3 13.9 15.2 17.5 18.4 18.2 16.6 16.7 16.7‡ 17.9 15.7 13.8 13.5 12.9 12.7 13.1 11.3 12.2 12.1 11.2 10.8‡ 11.2 11.2 0.0
12th Grade 16.2 14.9 17.1 18.0 19.4 19.8 20.7 20.2 20.7 20.4‡ 21.6 20.9 19.8 20.5 19.7 19.2 18.5 18.3 17.0 17.3 17.6 17.0‡ 17.8 15.9 -1.9
including Inhalantsa,c
8th Grade 16.7 18.2 21.1 24.2 27.1 28.7 27.2 26.2 25.3 24.0 23.9 21.4 20.4 20.2 20.4 19.7 18.0 19.0 18.8 20.3 18.2 17.0‡ 17.6 16.8 -0.7
10th Grade 23.9 23.5 27.4 32.5 35.6 39.6 40.3 37.1 37.7 38.0 38.7 36.1 33.5 32.9 31.7 30.7 30.2 28.8 31.2 31.8 32.5 31.5‡ 33.2 31.0 -2.2
12th Grade 31.2 28.8 32.5 37.6 40.2 41.9 43.3 42.4 42.8 42.5 42.6 42.1 40.5 39.1 40.3 38.0 37.0 37.3 37.6 39.2 41.5 40.2‡ 42.3 39.2 -3.1
8th Grade 6.2 7.2 9.2 13.0 15.8 18.3 17.7 16.9 16.5 15.6 15.4 14.6 12.8 11.8 12.2 11.7 10.3 10.9 11.8 13.7 12.5 11.4 12.7 11.7 -1.0
10th Grade 16.5 15.2 19.2 25.2 28.7 33.6 34.8 31.1 32.1 32.2 32.7 30.3 28.2 27.5 26.6 25.2 24.6 23.9 26.7 27.5 28.8 28.0 29.8 27.3 -2.5 s
12th Grade 23.9 21.9 26.0 30.7 34.7 35.8 38.5 37.5 37.8 36.5 37.0 36.2 34.9 34.3 33.6 31.5 31.7 32.4 32.8 34.8 36.4 36.4 36.4 35.1 -1.3
Synthetic Marijuanan,o
8th Grade — — — — — — — — — — — — — — — — — — — — — 4.4 4.0 3.3 -0.7
10th Grade — — — — — — — — — — — — — — — — — — — — — 8.8 7.4 5.4 -2.0 ss
12th Grade — — — — — — — — — — — — — — — — — — — — 11.4 11.3 7.9 5.8 -2.0 s
8th Grade 9.0 9.5 11.0 11.7 12.8 12.2 11.8 11.1 10.3 9.4 9.1 7.7 8.7 9.6 9.5 9.1 8.3 8.9 8.1 8.1 7.0 6.2 5.2 5.3 +0.1
10th Grade 7.1 7.5 8.4 9.1 9.6 9.5 8.7 8.0 7.2 7.3 6.6 5.8 5.4 5.9 6.0 6.5 6.6 5.9 6.1 5.7 4.5 4.1 3.5 3.3 -0.1
12th Grade 6.6 6.2 7.0 7.7 8.0 7.6 6.7 6.2 5.6 5.9 4.5 4.5 3.9 4.2 5.0 4.5 3.7 3.8 3.4 3.6 3.2 2.9 2.5 1.9 -0.6
8th Grade — — — — — — — — — — — — — — — — — — — — — — — — —
10th Grade — — — — — — — — — — — — — — — — — — — — — — — — —
1 2th Grade 0.9 0.5 0.9 1.1 1.1 1.6 1.2 1.4 0.9 0.6 0.6 1.1 0.9 0.8 0.6 0.5 0.8 0.6 0.9 — — — — — —
8th Grade 1.9 2.5 2.6 2.7 3.6 4.1 3.7 3.4 2.9 2.8‡ 3.4 2.6 2.6 2.2 2.4 2.1 1.9 2.1 1.9 2.2 2.2 1.6 1.6 1.3 -0.3
10th Grade 4.0 4.3 4.7 5.8 7.2 7.8 7.6 6.9 6.9 6.1‡ 6.2 4.7 4.1 4.1 4.0 4.1 4.4 3.9 4.1 4.2 4.1 3.5 3.4 3.3 -0.1
12th Grade 5.8 5.9 7.4 7.6 9.3 10.1 9.8 9.0 9.4 8.1‡ 9.1 6.6 5.9 6.2 5.5 4.9 5.4 5.9 4.7 5.5 5.2 4.8 4.5 4.0 -0.5
8th Grade 1.7 2.1 2.3 2.4 3.2 3.5 3.2 2.8 2.4 2.4 2.2 1.5 1.3 1.1 1.2 0.9 1.1 1.3 1.1 1.2 1.1 0.8 1.0 0.7 -0.3
10th Grade 3.7 4.0 4.2 5.2 6.5 6.9 6.7 5.9 6.0 5.1 4.1 2.6 1.7 1.6 1.5 1.7 1.9 1.8 1.9 1.9 1.8 1.7 1.7 1.9 +0.2
12th Grade 5.2 5.6 6.8 6.9 8.4 8.8 8.4 7.6 8.1 6.6 6.6 3.5 1.9 2.2 1.8 1.7 2.1 2.7 1.9 2.6 2.7 2.4 2.2 2.5 +0.3
Any Illicit Drug
(Table continued on next page.)
Marijuana/Hashish
LSD
Inhalantsc,d
Nitrites e
Hallucinogensb,f
2014
change
Any Illicit Druga
Any Illicit Drug other
than Marijuanaa,b
TABLE 2Trends in Annual Prevalence of Use of Various Drugs
in Grades 8, 10, and 12
2013–
(Entries are percentages.)
8/10/2019 Monitoring the Future Release.pdf
http://slidepdf.com/reader/full/monitoring-the-future-releasepdf 24/35
1991 1992 1993 1994 1995 1996 1997 1998 1999 2000 2001 2002 2003 2004 2005 2006 2007 2008 2009 2010 2011 2012 2013 2014
8th Grade 0.7 1.1 1.0 1.3 1.7 2.0 1.8 1.6 1.5 1.4‡ 2.4 2.1 2.1 1.9 2.0 1.8 1.6 1.6 1.5 1.8 1.8 1.3 1.2 1.0 -0.2
10th Grade 1.3 1.4 1.9 2.4 2.8 3.3 3.3 3.4 3.2 3.1‡ 4.3 4.0 3.6 3.7 3.5 3.7 3.8 3.3 3.5 3.5 3.5 3.0 2.7 2.6 -0.2
12th Grade 2.0 1.7 2.2 3.1 3.8 4.4 4.6 4.6 4.3 4.4‡ 5.9 5.4 5.4 5.6 5.0 4.6 4.8 5.0 4.2 4.8 4.3 4.0 3.7 3.0 -0.6
8th Grade — — — — — — — — — — — — — — — — — — — — — — — — —
10th Grade — — — — — — — — — — — — — — — — — — — — — — — — —
12th Grade 1.4 1.4 1.4 1.6 1.8 2.6 2.3 2.1 1.8 2.3 1.8 1.1 1.3 0.7 1.3 0.7 0.9 1.1 1.0 1.0 1.3 0.9 0.7 0.8 +0.1
8 th Grade — — — — — 2.3 2.3 1.8 1.7 3.1 3.5 2.9 2.1 1.7 1.7 1.4 1.5 1.7 1.3 2.4 1.7 1.1 1.1 0.9 -0.2
1 0th Grade — — — — — 4.6 3.9 3.3 4.4 5.4 6.2 4.9 3.0 2.4 2.6 2.8 3.5 2.9 3.7 4.7 4.5 3.0 3.6 2.3 -1.2 ss
1 2th Grade — — — — — 4.6 4.0 3.6 5.6 8.2 9.2 7.4 4.5 4.0 3.0 4.1 4.5 4.3 4.3 4.5 5.3 3.8 4.0 3.6 -0.4
8th Grade — — — — — — — — — — — — — — — — — — — 1.7 1.6 1.4 1.2 0.6 -0.6 ss
10th Grade — — — — — — — — — — — — — — — — — — — 3.7 3.9 2.5 2.3 1.8 -0.5
12th Grade — — — — — — — — — — — — — — — — — — 5.7 5.5 5.9 4.4 3.4 1.8 -1.6 sss
8th Grade 1.1 1.5 1.7 2.1 2.6 3.0 2.8 3.1 2.7 2.6 2.5 2.3 2.2 2.0 2.2 2.0 2.0 1.8 1.6 1.6 1.4 1.2 1.0 1.0 +0.1
10th Grade 2.2 1.9 2.1 2.8 3.5 4.2 4.7 4.7 4.9 4.4 3.6 4.0 3.3 3.7 3.5 3.2 3.4 3.0 2.7 2.2 1.9 2.0 1.9 1.5 -0.4
12th Grade 3.5 3.1 3.3 3.6 4.0 4.9 5.5 5.7 6.2 5.0 4.8 5.0 4.8 5.3 5.1 5.7 5.2 4.4 3.4 2.9 2.9 2.7 2.6 2.6 -0.1
8th Grade 0.7 0.9 1.0 1.3 1.6 1.8 1.7 2.1 1.8 1.8 1.7 1.6 1.6 1.3 1.4 1.3 1.3 1.1 1.1 1.0 0.9 0.6 0.6 0.7 +0.1
10th Grade 0.9 0.9 1.1 1.4 1.8 2.1 2.2 2.5 2.4 2.2 1.8 2.3 1.6 1.7 1.7 1.3 1.3 1.3 1.2 1.0 0.9 0.8 0.8 0.5 -0.3 ss
12th Grade 1.5 1.5 1.5 1.9 2.1 2.1 2.4 2.5 2.7 2.2 2.1 2.3 2.2 2.3 1.9 2.1 1.9 1.6 1.3 1.4 1.0 1.2 1.1 1.1 0.0
8th Grade 1.0 1.2 1.3 1.7 2.1 2.5 2.2 2.4 2.3 1.9 1.9 1.8 1.6 1.6 1.7 1.6 1.5 1.4 1.3 1.3 1.1 1.0 0.8 0.8 0.0
10th Grade 2.1 1.7 1.8 2.4 3.0 3.5 4.1 4.0 4.4 3.8 3.0 3.4 2.8 3.3 3.0 2.9 3.1 2.6 2.3 1.9 1.7 1.8 1.6 1.3 -0.2
12th Grade 3.2 2.6 2.9 3.0 3.4 4.2 5.0 4.9 5.8 4.5 4.4 4.4 4.2 4.7 4.5 5.2 4.5 4.0 3.0 2.6 2.6 2.4 2.4 2.4 0.0
8th Grade 0.7 0.7 0.7 1.2 1.4 1.6 1.3 1.3 1.4 1.1 1.0 0.9 0.9 1.0 0.8 0.8 0.8 0.9 0.7 0.8 0.7 0.5 0.5 0.5 0.0
10th Grade 0.5 0.6 0.7 0.9 1.1 1.2 1.4 1.4 1.4 1.4 0.9 1.1 0.7 0.9 0.9 0.9 0.8 0.8 0.9 0.8 0.8 0.6 0.6 0.5 -0.1
12th Grade 0.4 0.6 0.5 0.6 1.1 1.0 1.2 1.0 1.1 1.5 0.9 1.0 0.8 0.9 0.8 0.8 0.9 0.7 0.7 0.9 0.8 0.6 0.6 0.6 0.0
8 th Grade — — — — 0.9 1.0 0.8 0.8 0.9 0.6 0.7 0.6 0.6 0.7 0.6 0.5 0.6 0.5 0.5 0.6 0.5 0.4 0.3 0.4 +0.1
10th Grade — — — — 0.6 0.7 0.7 0.8 0.6 0.5 0.4 0.6 0.5 0.5 0.5 0.5 0.5 0.5 0.6 0.5 0.5 0.4 0.5 0.4 0.0
1 2th Grade — — — — 0.5 0.5 0.5 0.4 0.4 0.4 0.3 0.4 0.4 0.4 0.5 0.5 0.4 0.4 0.3 0.7 0.6 0.4 0.4 0.5 +0.2
8 th Grade — — — — 0.8 1.0 0.8 0.8 0.9 0.7 0.6 0.6 0.6 0.6 0.5 0.5 0.5 0.6 0.4 0.5 0.4 0.3 0.3 0.2 -0.1
1 0th Grade — — — — 0.8 0.9 1.1 1.0 1.1 1.1 0.7 0.8 0.5 0.7 0.7 0.6 0.6 0.6 0.6 0.6 0.5 0.4 0.4 0.3 0.0
1 2th Grade — — — — 1.0 1.0 1.2 0.8 1.0 1.6 0.8 0.8 0.8 0.7 0.8 0.6 1.0 0.5 0.6 0.8 0.7 0.4 0.4 0.5 0.0
(Entries are percentages.)
TABLE 2 (cont.)
Crack
Trends in Annual Prevalence of Use of Various Drugs
in Grades 8, 10, and 12
2013–
Hallucinogens
other than LSD b
PCPe
2014
change
Other Cocaineh
Salvian,o
Ecstasy (MDMA)g
Cocaine
Heroini
With a Needle j
Without a Needle j
(Table continued on next page.)
8/10/2019 Monitoring the Future Release.pdf
http://slidepdf.com/reader/full/monitoring-the-future-releasepdf 25/35
1991 1992 1993 1994 1995 1996 1997 1998 1999 2000 2001 2002 2003 2004 2005 2006 2007 2008 2009 2010 2011 2012 2013 2014
8th Grade — — — — — — — — — — — — — — — — — — — — — — — — —
10th Grade — — — — — — — — — — — — — — — — — — — — — — — — —
12th Grade 3.5 3.3 3.6 3.8 4.7 5.4 6.2 6.3 6.7 7.0 6.7‡ 9.4 9.3 9.5 9.0 9.0 9.2 9.1 9.2 8.7 8.7 7.9 7.1 6.1 -1.0 s
8 th Grade — — — — — — — — — — — 1.3 1.7 1.7 1.8 2.6 1.8 2.1 2.0 2.1 1.8 1.6 2.0 1.0 -0.9 s
10th Grade — — — — — — — — — — — 3.0 3.6 3.5 3.2 3.8 3.9 3.6 5.1 4.6 3.9 3.0 3.4 3.0 -0.4
12th Grade — — — — — — — — — — — 4.0 4.5 5.0 5.5 4.3 5.2 4.7 4.9 5.1 4.9 4.3 3.6 3.3 -0.2
8th Grade — — — — — — — — — — — 2.5 2.8 2.5 2.6 3.0 2.7 2.9 2.5 2.7 2.1 1.3 1.4 1.0 -0.3
10th Grade — — — — — — — — — — — 6.9 7.2 6.2 5.9 7.0 7.2 6.7 8.1 7.7 5.9 4.4 4.6 3.4 -1.1
12th Grade — — — — — — — — — — — 9.6 10.5 9.3 9.5 9.7 9.6 9.7 9.7 8.0 8.1 7.5 5.3 4.8 -0.5
8th Grade 6.2 6.5 7.2 7.9 8.7 9.1 8.1 7.2 6.9 6.5 6.7 5.5 5.5 4.9 4.9 4.7 4.2 4.5 4.1 3.9 3.5 2.9‡ 4.2 4.3 +0.1
10th Grade 8.2 8.2 9.6 10.2 11.9 12.4 12.1 10.7 10.4 11.1 11.7 10.7 9.0 8.5 7.8 7.9 8.0 6.4 7.1 7.6 6.6 6.5‡ 7.9 7.6 -0.3
12th Grade 8.2 7.1 8.4 9.4 9.3 9.5 10.2 10.1 10.2 10.5 10.9 11.1 9.9 10.0 8.6 8.1 7.5 6.8 6.6 7.4 8.2 7.9‡ 9.2 8.1 -1.1
Ritalink,n,o
8th Grade — — — — — — — — — — 2.9 2.8 2.6 2.5 2.4 2.6 2.1 1.6 1.8 1.5 1.3 0.7 1.1 0.9 -0.2
10th Grade — — — — — — — — — — 4.8 4.8 4.1 3.4 3.4 3.6 2.8 2.9 3.6 2.7 2.6 1.9 1.8 1.8 +0.1
12th Grade — — — — — — — — — — 5.1 4.0 4.0 5.1 4.4 4.4 3.8 3.4 2.1 2.7 2.6 2.6 2.3 1.8 -0.5
Adderallk,n,o
8th Grade — — — — — — — — — — — — — — — — — — 2.0 2.3 1.7 1.7 1.8 1.3 -0.5
10th Grade — — — — — — — — — — — — — — — — — — 5.7 5.3 4.6 4.5 4.4 4.6 +0.2
12th Grade — — — — — — — — — — — — — — — — — — 5.4 6.5 6.5 7.6 7.4 6.8 -0.6
Provigilk,o
8th Grade — — — — — — — — — — — — — — — — — — — — — — — — —
10th Grade — — — — — — — — — — — — — — — — — — — — — — — — —
12th Grade — — — — — — — — — — — — — — — — — — 1.8 1.3 1.5 — — — —
Methamphetaminen,o
8th Grade — — — — — — — — 3.2 2.5 2.8 2.2 2.5 1.5 1.8 1.8 1.1 1.2 1.0 1.2 0.8 1.0 1.0 0.6 -0.3
10th Grade — — — — — — — — 4.6 4.0 3.7 3.9 3.3 3.0 2.9 1.8 1.6 1.5 1.6 1.6 1.4 1.0 1.0 0.8 -0.2
12th Grade — — — — — — — — 4.7 4.3 3.9 3.6 3.2 3.4 2.5 2.5 1.7 1.2 1.2 1.0 1.4 1.1 0.9 1.0 0.0
8th Grade — — — — — — — — — — — — — — — — — — — — — — — — —
10th Grade — — — — — — — — — — — — — — — — — — — — — — — — —
12th Grade 1.4 1.3 1.7 1.8 2.4 2.8 2.3 3.0 1.9 2.2 2.5 3.0 2.0 2.1 2.3 1.9 1.6 1.1 0.9 0.9 1.2 0.8 1.1 0.8 -0.3
Bath salts (synthetic stimulants)n,o
8th Grade — — — — — — — — — — — — — — — — — — — — — 0.8 1.0 0.5 -0.5 s
10th Grade — — — — — — — — — — — — — — — — — — — — — 0.6 0.9 0.9 -0.1
12th Grade — — — — — — — — — — — — — — — — — — — — — 1.3 0.9 0.9 0.0
(Entries are percentages.)
Narcotics other than Heroink,l
Vicodink,n,v
Amphetaminesk,m
TABLE 2 (cont.)Trends in Annual Prevalence of Use of Various Drugs
in Grades 8, 10, and 12
2013–
2014
Crystal Methamphetamine (Ice)o
(Table continued on next page.)
change
OxyContink,n,v
8/10/2019 Monitoring the Future Release.pdf
http://slidepdf.com/reader/full/monitoring-the-future-releasepdf 26/35
1991 1992 1993 1994 1995 1996 1997 1998 1999 2000 2001 2002 2003 2004 2005 2006 2007 2008 2009 2010 2011 2012 2013 2014
Sedatives (Barbiturates)k,p
8th Grade — — — — — — — — — — — — — — — — — — — — — — — — — 10th Grade — — — — — — — — — — — — — — — — — — — — — — — — —
12th Grade 3.4 2.8 3.4 4.1 4.7 4.9 5.1 5.5 5.8 6.2 5.7 6.7 6.0 6.5 7.2 6.6 6.2 5.8 5.2 4.8 4.3 4.5 4.8 4.3 -0.5
8th Grade — — — — — — — — — — — — — — — — — — — — — — — — —
10th Grade — — — — — — — — — — — — — — — — — — — — — — — — —
12th Grade 0.5 0.6 0.2 0.8 0.7 1.1 1.0 1.1 1.1 0.3 0.8 0.9 0.6 0.8 0.9 0.8 0.5 0.5 0.6 0.3 0.3 0.4 — — —
8th Grade 1.8 2.0 2.1 2.4 2.7 3.3 2.9 2.6 2.5 2.6‡ 2.8 2.6 2.7 2.5 2.8 2.6 2.4 2.4 2.6 2.8 2.0 1.8 1.8 1.7 -0.1
10th Grade 3.2 3.5 3.3 3.3 4.0 4.6 4.9 5.1 5.4 5.6‡ 7.3 6.3 5.3 5.1 4.8 5.2 5.3 4.6 5.0 5.1 4.5 4.3 3.7 3.9 +0.2
12th Grade 3.6 2.8 3.5 3.7 4.4 4.6 4.7 5.5 5.8 5.7‡ 6.9 7.7 6.7 7.3 6.8 6.6 6.2 6.2 6.3 5.6 5.6 5.3 4.6 4.7 +0.1
8th Grade — — — — — — — — — — — — — — — — — — — — — — — — —
10th Grade — — — — — — — — — — — — — — — — — — — — — — — — —
12th Grade — — — — — — — — — — — — — — 17.1 16.8 15.8 15.4 14.4 15.0 15.2 14.8‡ 15.9 13.9 -2.0 ss
8th Grade — — — — — — — — — — — — — — — 4.2 4.0 3.6 3.8 3.2 2.7 3.0 2.9 2.0 -0.9 s
10th Grade — — — — — — — — — — — — — — — 5.3 5.4 5.3 6.0 5.1 5.5 4.7 4.3 3.7 -0.6
12th Grade — — — — — — — — — — — — — — — 6.9 5.8 5.5 5.9 6.6 5.3 5.6 5.0 4.1 -0.9
8 th Grade — — — — — 1.0 0.8 0.8 0.5 0.5 0.7 0.3 0.5 0.6 0.7 0.5 0.7 0.5 0.4 0.5 0.8 0.4 0.4 0.3 - 0.1
1 0th Grade — — — — — 1.1 1.3 1.2 1.0 0.8 1.0 0.7 0.6 0.7 0.5 0.5 0.7 0.4 0.4 0.6 0.6 0.5 0.6 0.5 0.0
1 2th Grade — — — — — 1.1 1.2 1.4 1.0 0.8 0.9‡ 1.6 1.3 1.6 1.2 1.1 1.0 1.3 1.0 1.5 1.3 1.5 0.9 0.7 - 0.2
GHBn,w
8th Grade — — — — — — — — — 1.2 1.1 0.8 0.9 0.7 0.5 0.8 0.7 1.1 0.7 0.6 0.6 — — — —
10th Grade — — — — — — — — — 1.1 1.0 1.4 1.4 0.8 0.8 0.7 0.6 0.5 1.0 0.6 0.5 — — — —
12th Grade — — — — — — — — — 1.9 1.6 1.5 1.4 2.0 1.1 1.1 0.9 1.2 1.1 1.4 1.4 1.4 1.0 1.0 -0.1
8th Grade — — — — — — — — — 1.6 1.3 1.3 1.1 0.9 0.6 0.9 1.0 1.2 1.0 1.0 0.8 — — — —
10th Grade — — — — — — — — — 2.1 2.1 2.2 1.9 1.3 1.0 1.0 0.8 1.0 1.3 1.1 1.2 — — — —
12th Grade — — — — — — — — — 2.5 2.5 2.6 2.1 1.9 1.6 1.4 1.3 1.5 1.7 1.6 1.7 1.5 1.4 1.5 +0.1
8th Grade 54.0 53.7‡ 45.4 46.8 45.3 46.5 45.5 43.7 43.5 43.1 41.9 38.7 37.2 36.7 33.9 33.6 31.8 32.1 30.3 29.3 26.9 23.6 22.1 20.8 -1.3
10th Grade 72.3 70.2‡ 63.4 63.9 63.5 65.0 65.2 62.7 63.7 65.3 63.5 60.0 59.3 58.2 56.7 55.8 56.3 52.5 52.8 52.1 49.8 48.5 47.1 44.0 -3.1 ss
12th Grade 77.7 76.8‡ 72.7 73.0 73.7 72.5 74.8 74.3 73.8 73.2 73.3 71.5 70.1 70.6 68.6 66.5 66.4 65.5 66.2 65.2 63.5 63.5 62.0 60.2 -1.8
8th Grade 17.5 18.3 18.2 18.2 18.4 19.8 18.4 17.9 18.5 18.5 16.6 15.0 14.5 14.5 14.1 13.9 12.6 12.7 12.2 11.5 10.5 8.6 8.4 7.3 -1.1
10th Grade 40.1 37.0 37.8 38.0 38.5 40.1 40.7 38.3 40.9 41.6 39.9 35.4 34.7 35.1 34.2 34.5 34.4 30.0 31.2 29.9 28.8 28.2 27.1 24.6 -2.4 s
12th Grade 52.7 50.3 49.6 51.7 52.5 51.9 53.2 52.0 53.2 51.8 53.2 50.4 48.0 51.8 47.7 47.9 46.1 45.6 47.0 44.0 42.2 45.0 43.5 41.4 -2.0
Tranquilizersb,k
OTC Cough/Cold
Alcohols
TABLE 2 (cont.)
Methaqualonee,k
Trends in Annual Prevalence of Use of Various Drugs
2014
change
in Grades 8, 10, and 12
2013–
(Entries are percentages.)
Any Use
Been Drunko
Any Prescription Drugq
Medicinesn,o
(Table continued on next page.)
Rohypnolr
Ketaminen,x
8/10/2019 Monitoring the Future Release.pdf
http://slidepdf.com/reader/full/monitoring-the-future-releasepdf 27/35
1991 1992 1993 1994 1995 1996 1997 1998 1999 2000 2001 2002 2003 2004 2005 2006 2007 2008 2009 2010 2011 2012 2013 2014
Flavored Alcoholic
8th Grade — — — — — — — — — — — — — 30.4 27.9 26.8 26.0 25.0 22.2 21.9 19.2 17.0 15.7 13.4 -2.3 s
10th Grade — — — — — — — — — — — — — 49.7 48.5 48.8 45.9 43.4 41.5 41.0 38.3 37.8 35.6 33.2 -2.4
12th Grade — — — — — — — — — — — — 55.2 55.8 58.4 54.7 53.6 51.8 53.4 47.9 47.0 44.4 44.2 43.6 -0.6
Alcoholic Beverages
containing Caffeinen,o,z
8th Grade — — — — — — — — — — — — — — — — — — — — 11.8 10.9 10.2 9.5 -0.8
10th Grade — — — — — — — — — — — — — — — — — — — — 22.5 19.7 16.9 14.3 -2.7 s
12th Grade — — — — — — — — — — — — — — — — — — — — 26.4 26.4 23.5 20.0 -3.6 ss
Bidisn,o
8th Grade — — — — — — — — — 3.9 2.7 2.7 2.0 1.7 1.6 — — — — — — — — — —
10th Grade — — — — — — — — — 6.4 4.9 3.1 2.8 2.1 1.6 — — — — — — — — — —
12th Grade — — — — — — — — — 9.2 7.0 5.9 4.0 3.6 3.3 2.3 1.7 1.9 1.5 1.4 — — — — —
Kreteksn,o
8th Grade — — — — — — — — — — 2.6 2.6 2.0 1.9 1.4 — — — — — — — — — —
10th Grade — — — — — — — — — — 6.0 4.9 3.8 3.7 2.8 — — — — — — — — — —
12th Grade — — — — — — — — — — 10.1 8.4 6.7 6.5 7.1 6.2 6.8 6.8 5.5 4.6 2.9 3.0 1.6 1.6 0.0
Tobacco using a Hookahe
8th Grade — — — — — — — — — — — — — — — — — — — — — — — — —
10th Grade — — — — — — — — — — — — — — — — — — — — — — — — —
12th Grade — — — — — — — — — — — — — — — — — — — 17.1 18.5 18.3 21.4 22.9 +1.5
Small cigarse,n
8th Grade — — — — — — — — — — — — — — — — — — — — — — — — —
10th Grade — — — — — — — — — — — — — — — — — — — — — — — — —
12th Grade — — — — — — — — — — — — — — — — — — — 23.1 19.5 19.9 20.4 18.9 -1.5
Dissolvable Tobacco
Productse,n
8th Grade — — — — — — — — — — — — — — — — — — — — — 1.0 1.1 1.1 0.0
10th Grade — — — — — — — — — — — — — — — — — — — — — 1.6 1.2 1.3 +0.1
12th Grade — — — — — — — — — — — — — — — — — — — — 1.5 1.6 1.9 1.1 -0.8
Snuse,n
8 th Grade — — — — — — — — — — — — — — — — — — — — — 2.4 2.0 2.2 +0.2
10th Grade — — — — — — — — — — — — — — — — — — — — — 6.9 5.2 4.5 -0.6
12th Grade — — — — — — — — — — — — — — — — — — — — 7.9 7.9 7.7 5.8 -1.9
8th Grade 1.0 1.1 0.9 1.2 1.0 0.9 1.0 1.2 1.7 1.7 1.6 1.5 1.4 1.1 1.1 0.9 0.8 0.9 0.8 0.5 0.7 0.6 0.6 0.6 0.0
10th Grade 1.1 1.1 1.0 1.1 1.2 1.2 1.2 1.2 1.7 2.2 2.1 2.2 1.7 1.5 1.3 1.2 1.1 0.9 0.8 1.0 0.9 0.8 0.8 0.8 -0.1
12th Grade 1.4 1.1 1.2 1.3 1.5 1.4 1.4 1.7 1.8 1.7 2.4 2.5 2.1 2.5 1.5 1.8 1.4 1.5 1.5 1.5 1.2 1.3 1.5 1.5 0.0
Source. The Monitoring the Future study, the University of Michigan.
Note: See footnotes following Table 5-5e.
Steroidsk,u
(Entries are percentages.)
Beverages
e,n,y
in Grades 8, 10, and 12
2013–
2014
change
TABLE 2 (cont.)Trends in Annual Prevalence of Use of Various Drugs
8/10/2019 Monitoring the Future Release.pdf
http://slidepdf.com/reader/full/monitoring-the-future-releasepdf 28/35
1991 1992 1993 1994 1995 1996 1997 1998 1999 2000 2001 2002 2003 2004 2005 2006 2007 2008 2009 2010 2011 2012 2013 2014
8th Grade 5.7 6.8 8.4 10.9 12.4 14.6 12.9 12.1 12.2 11.9 11.7 10.4 9.7 8.4 8.5 8.1 7.4 7.6 8.1 9.5 8.5 7.7‡ 8.7 8.3 -0.4
10th Grade 11.6 11.0 14.0 18.5 20.2 23.2 23.0 21.5 22.1 22.5 22.7 20.8 19.5 18.3 17.3 16.8 16.9 15.8 17.8 18.5 19.2 18.6‡ 19.2 18.5 -0.7
12th Grade 16.4 14.4 18.3 21.9 23.8 24.6 26.2 25.6 25.9 24.9 25.7 25.4 24.1 23.4 23.1 21.5 21.9 22.3 23.3 23.8 25.2 25.2‡ 25.2 23.7 -1.5
Any Illicit Drug other
8th Grade 3.8 4.7 5.3 5.6 6.5 6.9 6.0 5.5 5.5 5.6‡ 5.5 4.7 4.7 4.1 4.1 3.8 3.6 3.8 3.5 3.5 3.4 2.6‡ 3.6 3.3 -0.2
10th Grade 5.5 5.7 6.5 7.1 8.9 8.9 8.8 8.6 8.6 8.5‡ 8.7 8.1 6.9 6.9 6.4 6.3 6.9 5.3 5.7 5.8 5.4 5.0‡ 4.9 5.6 +0.7
12th Grade 7.1 6.3 7.9 8.8 10.0 9.5 10.7 10.7 10.4 10.4‡ 11.0 11.3 10.4 10.8 10.3 9.8 9.5 9.3 8.6 8.6 8.9 8.4‡ 8.2 7.7 -0.5
including Inhalantsa,c
8th Grade 8.8 10.0 12.0 14.3 16.1 17.5 16.0 14.9 15.1 14.4 14.0 12.6 12.1 11.2 11.2 10.9 10.1 10.4 10.6 11.7 10.5 9.5‡ 10.0 9.5 -0.4
10th Grade 13.1 12.6 15.5 20.0 21.6 24.5 24.1 22.5 23.1 23.6 23.6 21.7 20.5 19.3 18.4 17.7 18.1 16.8 18.8 19.4 20.1 19.3‡ 20.0 19.1 -0.9
12th Grade 17.8 15.5 19.3 23.0 24.8 25.5 26.9 26.6 26.4 26.4 26.5 25.9 24.6 23.3 24.2 22.1 22.8 22.8 24.1 24.5 26.2 25.2‡ 26.5 24.3 -2.2
8th Grade 3.2 3.7 5.1 7.8 9.1 11.3 10.2 9.7 9.7 9.1 9.2 8.3 7.5 6.4 6.6 6.5 5.7 5.8 6.5 8.0 7.2 6.5 7.0 6.5 -0.5
10th Grade 8.7 8.1 10.9 15.8 17.2 20.4 20.5 18.7 19.4 19.7 19.8 17.8 17.0 15.9 15.2 14.2 14.2 13.8 15.9 16.7 17.6 17.0 18.0 16.6 -1.4
12th Grade 13.8 11.9 15.5 19.0 21.2 21.9 23.7 22.8 23.1 21.6 22.4 21.5 21.2 19.9 19.8 18.3 18.8 19.4 20.6 21.4 22.6 22.9 22.7 21.2 -1.6
Synthetic Marijuanan,o
8th Grade — — — — — — — — — — — — — — — — — — — — — — — 4.4 —
10th Grade — — — — — — — — — — — — — — — — — — — — — — — 6.8 —
12th Grade — — — — — — — — — — — — — — — — — — — — — — — 2.7 —
8th Grade 4.4 4.7 5.4 5.6 6.1 5.8 5.6 4.8 5.0 4.5 4.0 3.8 4.1 4.5 4.2 4.1 3.9 4.1 3.8 3.6 3.2 2.7 2.3 2.2 -0.1
10th Grade 2.7 2.7 3.3 3.6 3.5 3.3 3.0 2.9 2.6 2.6 2.4 2.4 2.2 2.4 2.2 2.3 2.5 2.1 2.2 2.0 1.7 1.4 1.3 1.1 -0.3
12th Grade 2.4 2.3 2.5 2.7 3.2 2.5 2.5 2.3 2.0 2.2 1.7 1.5 1.5 1.5 2.0 1.5 1.2 1.4 1.2 1.4 1.0 0.9 1.0 0.7 -0.2
8th Grade — — — — — — — — — — — — — — — — — — — — — — — — —
10th Grade — — — — — — — — — — — — — — — — — — — — — — — — —
12th Grade 0.4 0.3 0.6 0.4 0.4 0.7 0.7 1.0 0.4 0.3 0.5 0.6 0.7 0.7 0.5 0.3 0.5 0.3 0.6 — — — — — —
8th Grade 0.8 1.1 1.2 1.3 1.7 1.9 1.8 1.4 1.3 1.2‡ 1.6 1.2 1.2 1.0 1.1 0.9 1.0 0.9 0.9 1.0 1.0 0.6 0.8 0.5 -0.3 ~
10th Grade 1.6 1.8 1.9 2.4 3.3 2.8 3.3 3.2 2.9 2.3‡ 2.1 1.6 1.5 1.6 1.5 1.5 1.7 1.3 1.4 1.6 1.4 1.2 1.1 1.2 0.0
12th Grade 2.2 2.1 2.7 3.1 4.4 3.5 3.9 3.8 3.5 2.6‡ 3.3 2.3 1.8 1.9 1.9 1.5 1.7 2.2 1.6 1.9 1.6 1.6 1.4 1.5 +0.1
LSD
8th Grade 0.6 0.9 1.0 1.1 1.4 1.5 1.5 1.1 1.1 1.0 1.0 0.7 0.6 0.5 0.5 0.4 0.5 0.5 0.5 0.6 0.5 0.3 0.5 0.3 -0.2 ~
10th Grade 1.5 1.6 1.6 2.0 3.0 2.4 2.8 2.7 2.3 1.6 1.5 0.7 0.6 0.6 0.6 0.7 0.7 0.7 0.5 0.7 0.7 0.5 0.6 0.6 +0.1
12th Grade 1.9 2.0 2.4 2.6 4.0 2.5 3.1 3.2 2.7 1.6 2.3 0.7 0.6 0.7 0.7 0.6 0.6 1.1 0.5 0.8 0.8 0.8 0.8 1.0 +0.3
Hallucinogens
other than LSDb
8th Grade 0.3 0.4 0.5 0.7 0.8 0.9 0.7 0.7 0.6 0.6‡ 1.1 1.0 1.0 0.8 0.9 0.7 0.7 0.7 0.7 0.8 0.7 0.5 0.5 0.4 -0.1
10th Grade 0.4 0.5 0.7 1.0 1.0 1.0 1.2 1.4 1.2 1.2‡ 1.4 1.4 1.2 1.4 1.3 1.3 1.4 1.0 1.1 1.2 1.1 0.9 0.8 0.8 0.0
12th Grade 0.7 0.5 0.8 1.2 1.3 1.6 1.7 1.6 1.6 1.7‡ 1.9 2.0 1.5 1.7 1.6 1.3 1.4 1.6 1.4 1.5 1.2 1.3 1.0 1.0 0.0
Nitritese
Hallucinogensb,f
(Table continued on next page.)
Inhalantsc,d
TABLE 3
Trends in 30-Day Prevalence of Use of Various Drugs
in Grades 8, 10, and 12
Percentage who used in last 30 days 2013–
2014
change
Any Illicit Druga
than Marijuanaa,b
Any Illicit Drug
Marijuana/Hashish
8/10/2019 Monitoring the Future Release.pdf
http://slidepdf.com/reader/full/monitoring-the-future-releasepdf 29/35
1991 1992 1993 1994 1995 1996 1997 1998 1999 2000 2001 2002 2003 2004 2005 2006 2007 2008 2009 2010 2011 2012 2013 2014
PCPe
8th Grade — — — — — — — — — — — — — — — — — — — — — — — — —
10th Grade — — — — — — — — — — — — — — — — — — — — — — — — —
12th Grade 0.5 0.6 1.0 0.7 0.6 1.3 0.7 1.0 0.8 0.9 0.5 0.4 0.6 0.4 0.7 0.4 0.5 0.6 0.5 0.8 0.8 0.5 0.4 — —
8th Grade — — — — — 1.0 1.0 0.9 0.8 1.4 1.8 1.4 0.7 0.8 0.6 0.7 0.6 0.8 0.6 1.1 0.6 0.5 0.5 0.4 -0.1
10th Grade — — — — — 1.8 1.3 1.3 1.8 2.6 2.6 1.8 1.1 0.8 1.0 1.2 1.2 1.1 1.3 1.9 1.6 1.0 1.2 0.8 -0.5 s
12th Grade — — — — — 2.0 1.6 1.5 2.5 3.6 2.8 2.4 1.3 1.2 1.0 1.3 1.6 1.8 1.8 1.4 2.3 0.9 1.5 1.4 -0.1
8th Grade 0.5 0.7 0.7 1.0 1.2 1.3 1.1 1.4 1.3 1.2 1.2 1.1 0.9 0.9 1.0 1.0 0.9 0.8 0.8 0.6 0.8 0.5 0.5 0.5 0.0
10th Grade 0.7 0.7 0.9 1.2 1.7 1.7 2.0 2.1 1.8 1.8 1.3 1.6 1.3 1.7 1.5 1.5 1.3 1.2 0.9 0.9 0.7 0.8 0.8 0.6 -0.2
12th Grade 1.4 1.3 1.3 1.5 1.8 2.0 2.3 2.4 2.6 2.1 2.1 2.3 2.1 2.3 2.3 2.5 2.0 1.9 1.3 1.3 1.1 1.1 1.1 1.0 -0.1
8th Grade 0.3 0.5 0.4 0.7 0.7 0.8 0.7 0.9 0.8 0.8 0.8 0.8 0.7 0.6 0.6 0.6 0.6 0.5 0.5 0.4 0.5 0.3 0.3 0.3 0.0
10th Grade 0.3 0.4 0.5 0.6 0.9 0.8 0.9 1.1 0.8 0.9 0.7 1.0 0.7 0.8 0.7 0.7 0.5 0.5 0.4 0.5 0.4 0.4 0.4 0.3 -0.1
12th Grade 0.7 0.6 0.7 0.8 1.0 1.0 0.9 1.0 1.1 1.0 1.1 1.2 0.9 1.0 1.0 0.9 0.9 0.8 0.6 0.7 0.5 0.6 0.6 0.7 0.0
8th Grade 0.5 0.5 0.6 0.9 1.0 1.0 0.8 1.0 1.1 0.9 0.9 0.8 0.7 0.7 0.7 0.7 0.6 0.6 0.7 0.5 0.6 0.3 0.3 0.4 0.0
10th Grade 0.6 0.6 0.7 1.0 1.4 1.3 1.6 1.8 1.6 1.6 1.2 1.3 1.1 1.5 1.3 1.3 1.1 1.0 0.8 0.7 0.6 0.7 0.7 0.5 -0.2
12th Grade 1.2 1.0 1.2 1.3 1.3 1.6 2.0 2.0 2.5 1.7 1.8 1.9 1.8 2.2 2.0 2.4 1.7 1.7 1.1 1.1 1.0 1.0 0.9 0.9 0.0
8th Grade 0.3 0.4 0.4 0.6 0.6 0.7 0.6 0.6 0.6 0.5 0.6 0.5 0.4 0.5 0.5 0.3 0.4 0.4 0.4 0.4 0.4 0.2 0.3 0.3 0.0
10th Grade 0.2 0.2 0.3 0.4 0.6 0.5 0.6 0.7 0.7 0.5 0.3 0.5 0.3 0.5 0.5 0.5 0.4 0.4 0.4 0.4 0.4 0.4 0.3 0.4 +0.1
12th Grade 0.2 0.3 0.2 0.3 0.6 0.5 0.5 0.5 0.5 0.7 0.4 0.5 0.4 0.5 0.5 0.4 0.4 0.4 0.4 0.4 0.4 0.3 0.3 0.4 +0.1
8th Grade — — — — 0.4 0.5 0.4 0.5 0.4 0.3 0.4 0.3 0.3 0.3 0.3 0.2 0.3 0.3 0.3 0.3 0.2 0.2 0.2 0.2 0.0
10th Grade — — — — 0.3 0.3 0.3 0.4 0.3 0.3 0.2 0.3 0.2 0.3 0.3 0.3 0.3 0.2 0.3 0.2 0.2 0.2 0.2 0.3 +0.1
12th Grade — — — — 0.3 0.4 0.3 0.2 0.2 0.2 0.2 0.3 0.3 0.2 0.3 0.3 0.2 0.2 0.1 0.4 0.4 0.3 0.2 0.3 +0.1
8th Grade — — — — 0.3 0.4 0.4 0.3 0.4 0.3 0.4 0.3 0.3 0.3 0.2 0.2 0.2 0.2 0.2 0.2 0.2 0.1 0.2 0.1 -0.1
10th Grade — — — — 0.3 0.3 0.4 0.5 0.5 0.4 0.2 0.4 0.2 0.3 0.3 0.3 0.2 0.3 0.2 0.3 0.2 0.2 0.2 0.2 0.0
12th Grade — — — — 0.6 0.4 0.6 0.4 0.4 0.7 0.3 0.5 0.4 0.3 0.5 0.3 0.4 0.2 0.3 0.4 0.4 0.2 0.2 0.4 +0.1
8th Grade — — — — — — — — — — — — — — — — — — — — — — — — —
10th Grade — — — — — — — — — — — — — — — — — — — — — — — — —
12th Grade 1.1 1.2 1.3 1.5 1.8 2.0 2.3 2.4 2.6 2.9 3.0‡ 4.0 4.1 4.3 3.9 3.8 3.8 3.8 4.1 3.6 3.6 3.0 2.8 2.2 -0.6 ss
8th Grade 2.6 3.3 3.6 3.6 4.2 4.6 3.8 3.3 3.4 3.4 3.2 2.8 2.7 2.3 2.3 2.1 2.0 2.2 1.9 1.8 1.8 1.3‡ 2.3 2.1 -0.2
10th Grade 3.3 3.6 4.3 4.5 5.3 5.5 5.1 5.1 5.0 5.4 5.6 5.2 4.3 4.0 3.7 3.5 4.0 2.8 3.3 3.3 3.1 2.8‡ 3.3 3.7 +0.4
12th Grade 3.2 2.8 3.7 4.0 4.0 4.1 4.8 4.6 4.5 5.0 5.6 5.5 5.0 4.6 3.9 3.7 3.7 2.9 3.0 3.3 3.7 3.3‡ 4.2 3.8 -0.4
Crack
Other Cocaineh
Heroini
With a Needle j
Without a Needle j
Narcotics other than Heroink,l
Amphetaminesk,m
(Table continued on next page.)
Cocaine
TABLE 3 (cont.)
Trends in 30-Day Prevalence of Use of Various Drugs
in Grades 8, 10, and 12
Percentage who used in last 30 days 2013–
2014
change
Ecstasy (MDMA)g
8/10/2019 Monitoring the Future Release.pdf
http://slidepdf.com/reader/full/monitoring-the-future-releasepdf 30/35
1991 1992 1993 1994 1995 1996 1997 1998 1999 2000 2001 2002 2003 2004 2005 2006 2007 2008 2009 2010 2011 2012 2013 2014
Methamphetaminen,o
8th Grade — — — — — — — — 1.1 0.8 1.3 1.1 1.2 0.6 0.7 0.6 0.6 0.7 0.5 0.7 0.4 0.5 0.4 0.2 -0.2
10th Grade — — — — — — — — 1.8 2.0 1.5 1.8 1.4 1.3 1.1 0.7 0.4 0.7 0.6 0.7 0.5 0.6 0.4 0.3 0.0
12th Grade — — — — — — — — 1.7 1.9 1.5 1.7 1.7 1.4 0.9 0.9 0.6 0.6 0.5 0.5 0.6 0.5 0.4 0.5 +0.1
8th Grade — — — — — — — — — — — — — — — — — — — — — — — — —
10th Grade — — — — — — — — — — — — — — — — — — — — — — — — —
12th Grade 0.6 0.5 0.6 0.7 1.1 1.1 0.8 1.2 0.8 1.0 1.1 1.2 0.8 0.8 0.9 0.7 0.6 0.6 0.5 0.6 0.6 0.4 0.8 0.4 -0.3
Sedatives (Barbiturates)k,p
8th Grade — — — — — — — — — — — — — — — — — — — — — — — — —
10th Grade — — — — — — — — — — — — — — — — — — — — — — — — —
12th Grade 1.4 1.1 1.3 1.7 2.2 2.1 2.1 2.6 2.6 3.0 2.8 3.2 2.9‡ 2.9 3.3 3.0 2.7 2.8 2.5 2.2 1.8 2.0 2.2 2.0 -0.2
8th Grade — — — — — — — — — — — — — — — — — — — — — — — — —
10th Grade — — — — — — — — — — — — — — — — — — — — — — — — —
12th Grade 0.2 0.4 0.1 0.4 0.4 0.6 0.3 0.6 0.4 0.2 0.5 0.3 0.4 0.5 0.5 0.4 0.4 0.2 0.3 0.2 0.2 0.3 — — —
8th Grade 0.8 0.8 0.9 1.1 1.2 1.5 1.2 1.2 1.1 1.4‡ 1.2 1.2 1.4 1.2 1.3 1.3 1.1 1.2 1.2 1.2 1.0 0.8 0.9 0.8 -0.1
10th Grade 1.2 1.5 1.1 1.5 1.7 1.7 2.2 2.2 2.2 2.5‡ 2.9 2.9 2.4 2.3 2.3 2.4 2.6 1.9 2.0 2.2 1.9 1.7 1.6 1.6 0.0
12th Grade 1.4 1.0 1.2 1.4 1.8 2.0 1.8 2.4 2.5 2.6‡ 2.9 3.3 2.8 3.1 2.9 2.7 2.6 2.6 2.7 2.5 2.3 2.1 2.0 2.1 +0.1
Any Prescription Drugq
8th Grade — — — — — — — — — — — — — — — — — — — — — — — — —
10th Grade — — — — — — — — — — — — — — — — — — — — — — — — —
12th Grade — — — — — — — — — — — — — — 8.6 8.1 7.8 7.2 7.3 6.9 7.2 7.0‡ 7.1 6.4 -0.7
8th Grade — — — — — 0.5 0.3 0.4 0.3 0.3 0.4 0.2 0.1 0.2 0.2 0.4 0.3 0.1 0.2 0.2 0.6 0.1 0.1 0.2 +0.1
10th Grade — — — — — 0.5 0.5 0.4 0.5 0.4 0.2 0.4 0.2 0.3 0.2 0.2 0.2 0.2 0.3 0.3 0.3 0.2 0.1 0.4 +0.3
12th Grade — — — — — 0.5 0.3 0.3 0.3 0.4 0.3 — — — — — — — — — — — — — —
8th Grade 25.1 26.1‡ 24.3 25.5 24.6 26.2 24.5 23.0 24.0 22.4 21.5 19.6 19.7 18.6 17.1 17.2 15.9 15.9 14.9 13.8 12.7 11.0 10.2 9.0 -1.3
10th Grade 42.8 39.9‡ 38.2 39.2 38.8 40.4 40.1 38.8 40.0 41.0 39.0 35.4 35.4 35.2 33.2 33.8 33.4 28.8 30.4 28.9 27.2 27.6 25.7 23.5 -2.2 s
12th Grade 54.0 51.3‡ 48.6 50.1 51.3 50.8 52.7 52.0 51.0 50.0 49.8 48.6 47.5 48.0 47.0 45.3 44.4 43.1 43.5 41.2 40.0 41.5 39.2 37.4 -1.8
8th Grade 7.6 7.5 7.8 8.7 8.3 9.6 8.2 8.4 9.4 8.3 7.7 6.7 6.7 6.2 6.0 6.2 5.5 5.4 5.4 5.0 4.4 3.6 3.5 2.7 -0.8 ~
10th Grade 20.5 18.1 19.8 20.3 20.8 21.3 22.4 21.1 22.5 23.5 21.9 18.3 18.2 18.5 17.6 18.8 18.1 14.4 15.5 14.7 13.7 14.5 12.8 11.2 -1.6 s
12th Grade 31.6 29.9 28.9 30.8 33.2 31.3 34.2 32.9 32.9 32.3 32.7 30.3 30.9 32.5 30.2 30.0 28.7 27.6 27.4 26.8 25.0 28.1 26.0 23.5 -2.5
Flavored Alcoholic
Beveragese,n
8th Grade — — — — — — — — — — — — — 14.6 12.9 13.1 12.2 10.2 9.5 9.4 8.6 7.6 6.3 5.7 -0.7
10th Grade — — — — — — — — — — — — — 25.1 23.1 24.7 21.8 20.2 19.0 19.4 15.8 16.3 15.5 14.0 -1.5
12th Grade — — — — — — — — — — — — — 31.1 30.5 29.3 29.1 27.4 27.4 24.1 23.1 21.8 21.0 19.9 -1.1
2014
change
Crystal Methamphetamine (Ice)o
Methaqualonee,k
Tranquilizersb,k
Rohypnolr
Alcohols
Any Use
Been Drunko
(Table continued on next page.)
Percentage who used in last 30 days 2013–
TABLE 3 (cont.)
Trends in 30-Day Prevalence of Use of Various Drugs
in Grades 8, 10, and 12
8/10/2019 Monitoring the Future Release.pdf
http://slidepdf.com/reader/full/monitoring-the-future-releasepdf 31/35
1991 1992 1993 1994 1995 1996 1997 1998 1999 2000 2001 2002 2003 2004 2005 2006 2007 2008 2009 2010 2011 2012 2013 2014
8th Grade 14.3 15.5 16.7 18.6 19.1 21.0 19.4 19.1 17.5 14.6 12.2 10.7 10.2 9.2 9.3 8.7 7.1 6.8 6.5 7.1 6.1 4.9 4.5 4.0 -0.5
10th Grade 20.8 21.5 24.7 25.4 27.9 30.4 29.8 27.6 25.7 23.9 21.3 17.7 16.7 16.0 14.9 14.5 14.0 12.3 13.1 13.6 11.8 10.8 9.1 7.2 -1.9 ss
12th Grade 28.3 27.8 29.9 31.2 33.5 34.0 36.5 35.1 34.6 31.4 29.5 26.7 24.4 25.0 23.2 21.6 21.6 20.4 20.1 19.2 18.7 17.1 16.3 13.6 -2.7 ss
8th Grade 6.9 7.0 6.6 7.7 7.1 7.1 5.5 4.8 4.5 4.2 4.0 3.3 4.1 4.1 3.3 3.7 3.2 3.5 3.7 4.1 3.5 2.8 2.8 3.0 +0.1
10th Grade 10.0 9.6 10.4 10.5 9.7 8.6 8.9 7.5 6.5 6.1 6.9 6.1 5.3 4.9 5.6 5.7 6.1 5.0 6.5 7.5 6.6 6.4 6.4 5.3 -1.2
12th Grade — 11.4 10.7 11.1 12.2 9.8 9.7 8.8 8.4 7.6 7.8 6.5 6.7 6.7 7.6 6.1 6.6 6.5 8.4 8.5 8.3 7.9 8.1 8.4 +0.3
E-cigarettesbb
8th Grade — — — — — — — — — — — — — — — — — — — — — — — 8.7 —
10th Grade — — — — — — — — — — — — — — — — — — — — — — — 16.2 —
12th Grade — — — — — — — — — — — — — — — — — — — — — — — 17.1 —
Large Cigarscc
8th Grade — — — — — — — — — — — — — — — — — — — — — — — 1.9 —
10th Grade — — — — — — — — — — — — — — — — — — — — — — — 3.9 —
12th Grade — — — — — — — — — — — — — — — — — — — — — — — 6.4 —
Flavored Little Cigarscc
8th Grade — — — — — — — — — — — — — — — — — — — — — — — 4.1 —
10th Grade — — — — — — — — — — — — — — — — — — — — — — — 6.9 —
12th Grade — — — — — — — — — — — — — — — — — — — — — — — 11.9 —
Regular Little Cigarscc
8th Grade — — — — — — — — — — — — — — — — — — — — — — — 2.5 —
10th Grade — — — — — — — — — — — — — — — — — — — — — — — 4.4 —
12th Grade — — — — — — — — — — — — — — — — — — — — — — — 7.0 —
8th Grade 0.4 0.5 0.5 0.5 0.6 0.4 0.5 0.5 0.7 0.8 0.7 0.8 0.7 0.5 0.5 0.5 0.4 0.5 0.4 0.3 0.4 0.3 0.3 0.2 -0.1
10th Grade 0.6 0.6 0.5 0.6 0.6 0.5 0.7 0.6 0.9 1.0 0.9 1.0 0.8 0.8 0.6 0.6 0.5 0.5 0.5 0.5 0.5 0.4 0.4 0.4 0.0
12th Grade 0.8 0.6 0.7 0.9 0.7 0.7 1.0 1.1 0.9 0.8 1.3 1.4 1.3 1.6 0.9 1.1 1.0 1.0 1.0 1.1 0.7 0.9 1.0 0.9 -0.1
Source. The Monitoring the Future study, the University of Michigan.
See footnotes following Table 4.
Any Use
Smokeless Tobaccot
Steroidsk,u
in Grades 8, 10, and 12
Percentage who used in last 30 days 2013–
2014
change
Cigarettes
Trends in 30-Day Prevalence of Use of Various Drugs
TABLE 3 (cont.)
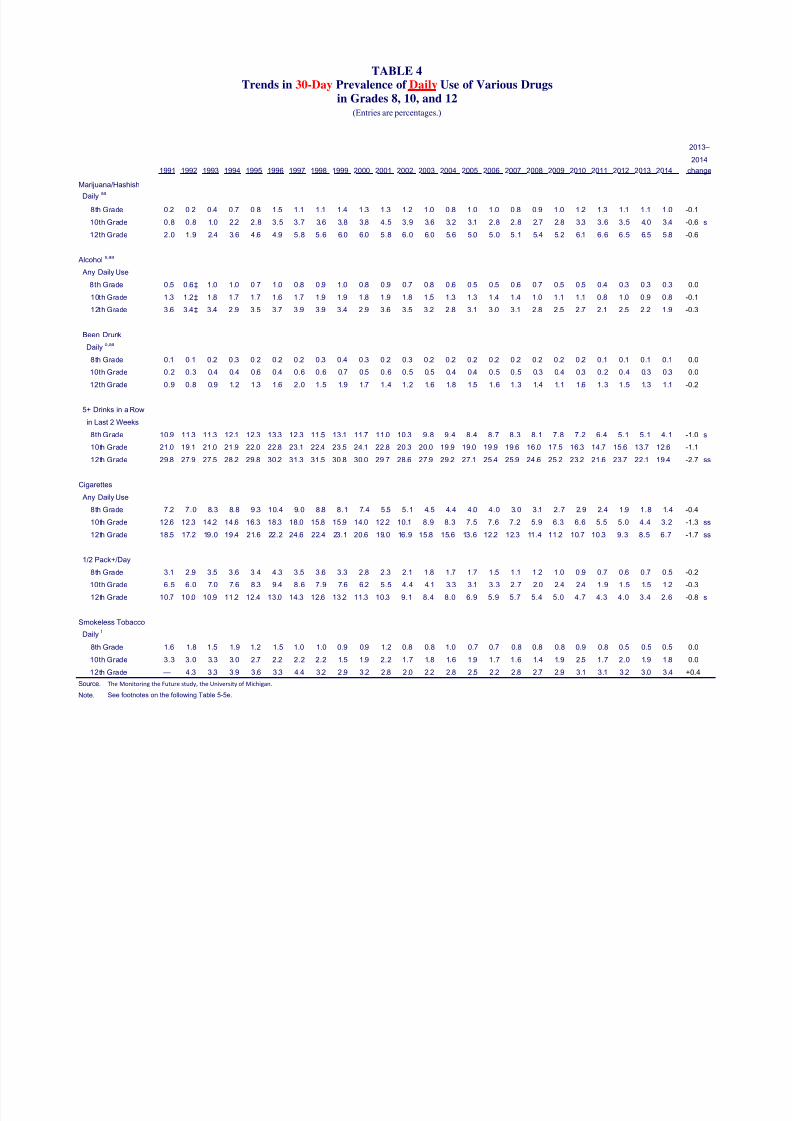
8/10/2019 Monitoring the Future Release.pdf
http://slidepdf.com/reader/full/monitoring-the-future-releasepdf 32/35
1991 1992 1993 1994 1995 1996 1997 1998 1999 2000 2001 2002 2003 2004 2005 2006 2007 2008 2009 2010 2011 2012 2013 2014
Dailyaa
8th Grade 0.2 0.2 0.4 0.7 0.8 1.5 1.1 1.1 1.4 1.3 1.3 1.2 1.0 0.8 1.0 1.0 0.8 0.9 1.0 1.2 1.3 1.1 1.1 1.0 -0.1
10th Grade 0.8 0.8 1.0 2.2 2.8 3.5 3.7 3.6 3.8 3.8 4.5 3.9 3.6 3.2 3.1 2.8 2.8 2.7 2.8 3.3 3.6 3.5 4.0 3.4 -0.6 s
12th Grade 2.0 1.9 2.4 3.6 4.6 4.9 5.8 5.6 6.0 6.0 5.8 6.0 6.0 5.6 5.0 5.0 5.1 5.4 5.2 6.1 6.6 6.5 6.5 5.8 -0.6
Any Daily Use
8th Grade 0.5 0.6‡ 1.0 1.0 0.7 1.0 0.8 0.9 1.0 0.8 0.9 0.7 0.8 0.6 0.5 0.5 0.6 0.7 0.5 0.5 0.4 0.3 0.3 0.3 0.0
10th Grade 1.3 1.2‡ 1.8 1.7 1.7 1.6 1.7 1.9 1.9 1.8 1.9 1.8 1.5 1.3 1.3 1.4 1.4 1.0 1.1 1.1 0.8 1.0 0.9 0.8 -0.1
12th Grade 3.6 3.4‡ 3.4 2.9 3.5 3.7 3.9 3.9 3.4 2.9 3.6 3.5 3.2 2.8 3.1 3.0 3.1 2.8 2.5 2.7 2.1 2.5 2.2 1.9 -0.3
8th Grade 0.1 0.1 0.2 0.3 0.2 0.2 0.2 0.3 0.4 0.3 0.2 0.3 0.2 0.2 0.2 0.2 0.2 0.2 0.2 0.2 0.1 0.1 0.1 0.1 0.0
10th Grade 0.2 0.3 0.4 0.4 0.6 0.4 0.6 0.6 0.7 0.5 0.6 0.5 0.5 0.4 0.4 0.5 0.5 0.3 0.4 0.3 0.2 0.4 0.3 0.3 0.0
12th Grade 0.9 0.8 0.9 1.2 1.3 1.6 2.0 1.5 1.9 1.7 1.4 1.2 1.6 1.8 1.5 1.6 1.3 1.4 1.1 1.6 1.3 1.5 1.3 1.1 -0.2
5+ Drinks in a Row
8th Grade 10.9 11.3 11.3 12.1 12.3 13.3 12.3 11.5 13.1 11.7 11.0 10.3 9.8 9.4 8.4 8.7 8.3 8.1 7.8 7.2 6.4 5.1 5.1 4.1 -1.0 s
10th Grade 21.0 19.1 21.0 21.9 22.0 22.8 23.1 22.4 23.5 24.1 22.8 20.3 20.0 19.9 19.0 19.9 19.6 16.0 17.5 16.3 14.7 15.6 13.7 12.6 -1.1
12th Grade 29.8 27.9 27.5 28.2 29.8 30.2 31.3 31.5 30.8 30.0 29.7 28.6 27.9 29.2 27.1 25.4 25.9 24.6 25.2 23.2 21.6 23.7 22.1 19.4 -2.7 ss
Cigarettes
Any Daily Use
8th Grade 7.2 7.0 8.3 8.8 9.3 10.4 9.0 8.8 8.1 7.4 5.5 5.1 4.5 4.4 4.0 4.0 3.0 3.1 2.7 2.9 2.4 1.9 1.8 1.4 -0.4
10th Grade 12.6 12.3 14.2 14.6 16.3 18.3 18.0 15.8 15.9 14.0 12.2 10.1 8.9 8.3 7.5 7.6 7.2 5.9 6.3 6.6 5.5 5.0 4.4 3.2 -1.3 ss
12th Grade 18.5 17.2 19.0 19.4 21.6 22.2 24.6 22.4 23.1 20.6 19.0 16.9 15.8 15.6 13.6 12.2 12.3 11.4 11.2 10.7 10.3 9.3 8.5 6.7 -1.7 ss
1/2 Pack+/Day
8th Grade 3.1 2.9 3.5 3.6 3.4 4.3 3.5 3.6 3.3 2.8 2.3 2.1 1.8 1.7 1.7 1.5 1.1 1.2 1.0 0.9 0.7 0.6 0.7 0.5 -0.2
10th Grade 6.5 6.0 7.0 7.6 8.3 9.4 8.6 7.9 7.6 6.2 5.5 4.4 4.1 3.3 3.1 3.3 2.7 2.0 2.4 2.4 1.9 1.5 1.5 1.2 -0.3
12th Grade 10.7 10.0 10.9 11.2 12.4 13.0 14.3 12.6 13.2 11.3 10.3 9.1 8.4 8.0 6.9 5.9 5.7 5.4 5.0 4.7 4.3 4.0 3.4 2.6 -0.8 s
8th Grade 1.6 1.8 1.5 1.9 1.2 1.5 1.0 1.0 0.9 0.9 1.2 0.8 0.8 1.0 0.7 0.7 0.8 0.8 0.8 0.9 0.8 0.5 0.5 0.5 0.0
10th Grade 3.3 3.0 3.3 3.0 2.7 2.2 2.2 2.2 1.5 1.9 2.2 1.7 1.8 1.6 1.9 1.7 1.6 1.4 1.9 2.5 1.7 2.0 1.9 1.8 0.0
12th Grade — 4.3 3.3 3.9 3.6 3.3 4.4 3.2 2.9 3.2 2.8 2.0 2.2 2.8 2.5 2.2 2.8 2.7 2.9 3.1 3.1 3.2 3.0 3.4 +0.4
Source. The Monitoring the Future study, the University of Michigan.
Note. See footnotes on the following Table 5-5e.
Smokeless Tobacco
Dailyt
TABLE 4Trends in 30-Day Prevalence of Daily Use of Various Drugs
in Grades 8, 10, and 12
2013–
2014
change
Marijuana/Hashish
Been Drunk
in Last 2 Weeks
Alcohols,aa
Dailyo,aa
(Entries are percentages.)
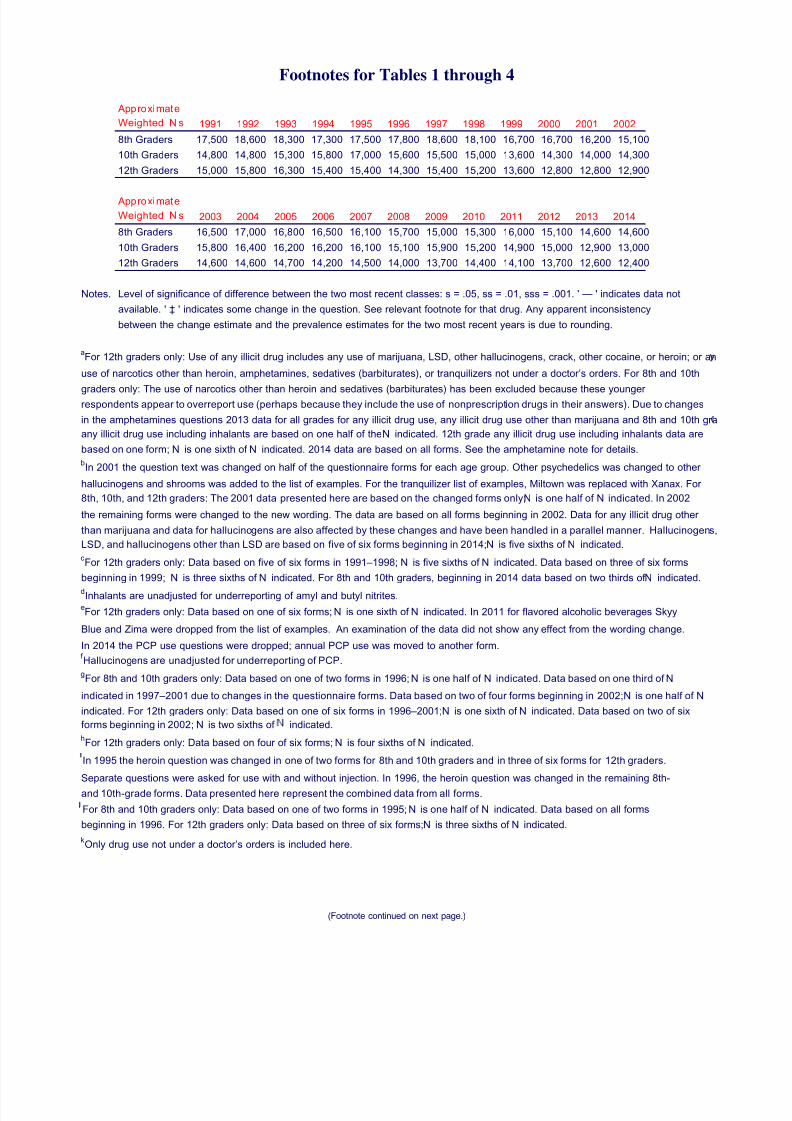
8/10/2019 Monitoring the Future Release.pdf
http://slidepdf.com/reader/full/monitoring-the-future-releasepdf 33/35
Approximate
Weighted N s 1991 1992 1993 1994 1995 1996 1997 1998 1999 2000 2001 2002
8th Graders 17,500 18,600 18,300 17,300 17,500 17,800 18,600 18,100 16,700 16,700 16,200 15,100
10th Graders 14,800 14,800 15,300 15,800 17,000 15,600 15,500 15,000 13,600 14,300 14,000 14,300
12th Graders 15,000 15,800 16,300 15,400 15,400 14,300 15,400 15,200 13,600 12,800 12,800 12,900
Approximate
Weighted N s 2003 2004 2005 2006 2007 2008 2009 2010 2011 2012 2013 2014
8th Graders 16,500 17,000 16,800 16,500 16,100 15,700 15,000 15,300 16,000 15,100 14,600 14,600
10th Graders 15,800 16,400 16,200 16,200 16,100 15,100 15,900 15,200 14,900 15,000 12,900 13,000
12th Graders 14,600 14,600 14,700 14,200 14,500 14,000 13,700 14,400 14,100 13,700 12,600 12,400
Notes. Level of significance of difference between the two most recent classes: s = .05, ss = .01, sss = .001. ' — ' indicates data not
available. ' ‡ ' indicates some change in the question. See relevant footnote for that drug. Any apparent inconsistency
between the change estimate and the prevalence estimates for the two most recent years is due to rounding.
aFor 12th graders only: Use of any illicit drug includes any use of marijuana, LSD, other hallucinogens, crack, other cocaine, or heroin; or an
use of narcotics other than heroin, amphetamines, sedatives (barbiturates), or tranquilizers not under a doctor’s orders. For 8th and 10th
graders only: The use of narcotics other than heroin and sedatives (barbiturates) has been excluded because these youngerrespondents appear to overreport use (perhaps because they include the use of nonprescription drugs in their answers). Due to changes
in the amphetamines questions 2013 data for all grades for any illicit drug use, any illicit drug use other than marijuana and 8th and 10th gra
any illicit drug use including inhalants are based on one half of the N indicated. 12th grade any illicit drug use including inhalants data are
based on one form; N is one sixth of N indicated. 2014 data are based on all forms. See the amphetamine note for details.
bIn 2001 the question text was changed on half of the questionnaire forms for each age group. Other psychedelics was changed to other
hallucinogens and shrooms was added to the list of examples. For the tranquilizer list of examples, Miltown was replaced with Xanax. For
8th, 10th, and 12th graders: The 2001 data presented here are based on the changed forms only; N is one half of N indicated. In 2002
the remaining forms were changed to the new wording. The data are based on all forms beginning in 2002. Data for any illicit drug other
than marijuana and data for hallucinogens are also affected by these changes and have been handled in a parallel manner. Hallucinogens,
LSD, and hallucinogens other than LSD are based on five of six forms beginning in 2014; N is five sixths of N indicated.
cFor 12th graders only: Data based on five of six forms in 1991–1998; N is five sixths of N indicated. Data based on three of six forms
beginning in 1999; N is three sixths of N indicated. For 8th and 10th graders, beginning in 2014 data based on two thirds of N indicated.
dInhalants are unadjusted for underreporting of amyl and butyl nitrites.eFor 12th graders only: Data based on one of six forms; N is one sixth of N indicated. In 2011 for flavored alcoholic beverages Skyy
Blue and Zima were dropped from the list of examples. An examination of the data did not show any effect from the wording change.
In 2014 the PCP use questions were dropped; annual PCP use was moved to another form.f Hallucinogens are unadjusted for underreporting of PCP.
gFor 8th and 10th graders only: Data based on one of two forms in 1996; N is one half of N indicated. Data based on one third of N
indicated in 1997–2001 due to changes in the questionnaire forms. Data based on two of four forms beginning in 2002; N is one half of N
indicated. For 12th graders only: Data based on one of six forms in 1996–2001; N is one sixth of N indicated. Data based on two of six
forms beginning in 2002; N is two sixths of indicated.
hFor 12th graders only: Data based on four of six forms; N is four sixths of N indicated.
In 1995 the heroin question was changed in one of two forms for 8th and 10th graders and in three of six forms for 12th graders.
Separate questions were asked for use with and without injection. In 1996, the heroin question was changed in the remaining 8th-
and 10th-grade forms. Data presented here represent the combined data from all forms.
For 8th and 10th graders only: Data based on one of two forms in 1995; N is one half of N indicated. Data based on all forms
beginning in 1996. For 12th graders only: Data based on three of six forms; N is three sixths of N indicated.
kOnly drug use not under a doctor’s orders is included here.
Footnotes for Tables 1 through 4
(Footnote continued on next page.)
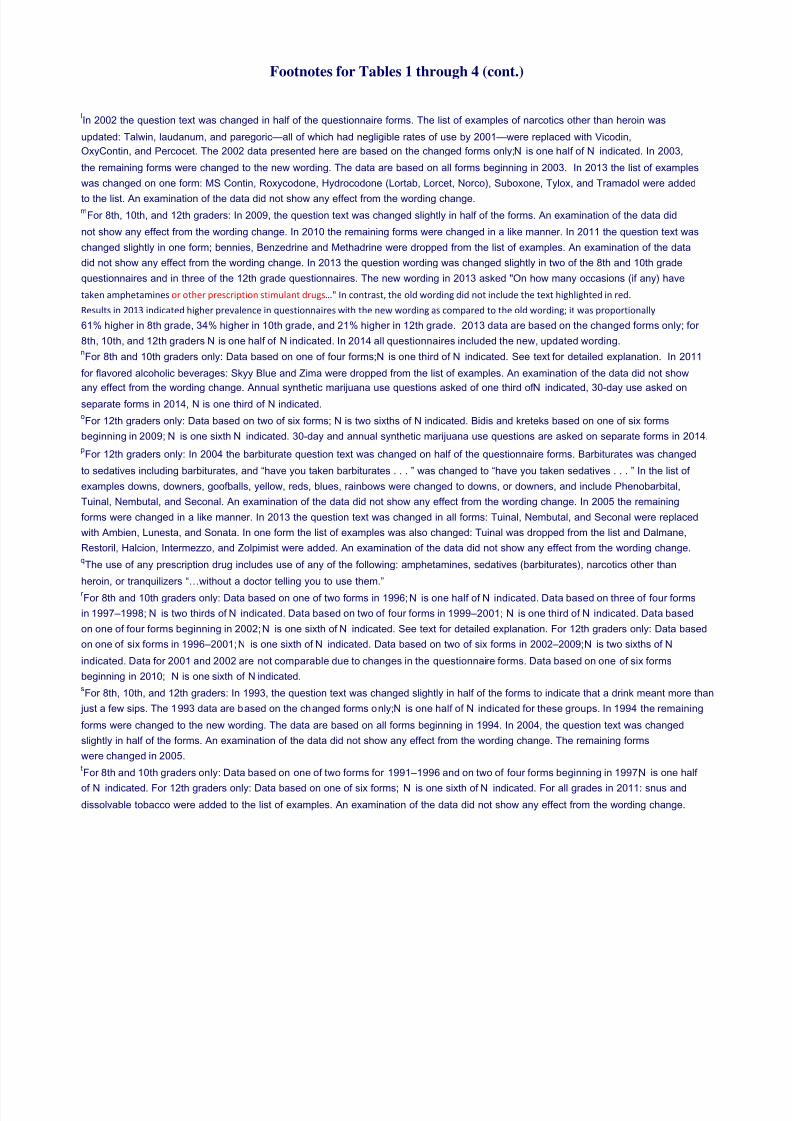
8/10/2019 Monitoring the Future Release.pdf
http://slidepdf.com/reader/full/monitoring-the-future-releasepdf 34/35
lIn 2002 the question text was changed in half of the questionnaire forms. The list of examples of narcotics other than heroin was
updated: Talwin, laudanum, and paregoric—all of which had negligible rates of use by 2001—were replaced with Vicodin,
OxyContin, and Percocet. The 2002 data presented here are based on the changed forms only; N is one half of N indicated. In 2003,
the remaining forms were changed to the new wording. The data are based on all forms beginning in 2003. In 2013 the list of examples
was changed on one form: MS Contin, Roxycodone, Hydrocodone (Lortab, Lorcet, Norco), Suboxone, Tylox, and Tramadol were added
to the list. An examination of the data did not show any effect from the wording change.m
For 8th, 10th, and 12th graders: In 2009, the question text was changed slightly in half of the forms. An examination of the data did
not show any effect from the wording change. In 2010 the remaining forms were changed in a like manner. In 2011 the question text was
changed slightly in one form; bennies, Benzedrine and Methadrine were dropped from the list of examples. An examination of the data
did not show any effect from the wording change. In 2013 the question wording was changed slightly in two of the 8th and 10th grade
questionnaires and in three of the 12th grade questionnaires. The new wording in 2013 asked "On how many occasions (if any) have
taken
amphetamines
or
other
prescription
stimulant
drugs…"
In
contrast,
the
old
wording
did
not
include
the
text
highlighted
in
red.
Results
in
2013
indicated
higher
prevalence
in
questionnaires
with
the
new
wording
as
compared
to
the
old
wording;
it
was
proportionally
61% higher in 8th grade, 34% higher in 10th grade, and 21% higher in 12th grade. 2013 data are based on the changed forms only; for
8th, 10th, and 12th graders N is one half of N indicated. In 2014 all questionnaires included the new, updated wording.nFor 8th and 10th graders only: Data based on one of four forms; N is one third of N indicated. See text for detailed explanation. In 2011
for flavored alcoholic beverages: Skyy Blue and Zima were dropped from the list of examples. An examination of the data did not show
any effect from the wording change. Annual synthetic marijuana use questions asked of one third ofN
indicated, 30-day use asked onseparate forms in 2014, N is one third of N indicated.oFor 12th graders only: Data based on two of six forms; N is two sixths of N indicated. Bidis and kreteks based on one of six forms
beginning in 2009; N is one sixth N indicated. 30-day and annual synthetic marijuana use questions are asked on separate forms in 2014.
pFor 12th graders only: In 2004 the barbiturate question text was changed on half of the questionnaire forms. Barbiturates was changed
to sedatives including barbiturates, and “have you taken barbiturates . . . ” was changed to “have you taken sedatives . . . ” In the list of
examples downs, downers, goofballs, yellow, reds, blues, rainbows were changed to downs, or downers, and include Phenobarbital,
Tuinal, Nembutal, and Seconal. An examination of the data did not show any effect from the wording change. In 2005 the remaining
forms were changed in a like manner. In 2013 the question text was changed in all forms: Tuinal, Nembutal, and Seconal were replaced
with Ambien, Lunesta, and Sonata. In one form the list of examples was also changed: Tuinal was dropped from the list and Dalmane,
Restoril, Halcion, Intermezzo, and Zolpimist were added. An examination of the data did not show any effect from the wording change.qThe use of any prescription drug includes use of any of the following: amphetamines, sedatives (barbiturates), narcotics other than
heroin, or tranquilizers “…without a doctor telling you to use them.”r For 8th and 10th graders only: Data based on one of two forms in 1996; N is one half of N indicated. Data based on three of four forms
in 1997–1998; N is two thirds of N indicated. Data based on two of four forms in 1999–2001; N is one third of N indicated. Data based
on one of four forms beginning in 2002; N is one sixth of N indicated. See text for detailed explanation. For 12th graders only: Data based
on one of six forms in 1996–2001; N is one sixth of N indicated. Data based on two of six forms in 2002–2009; N is two sixths of N
indicated. Data for 2001 and 2002 are not comparable due to changes in the questionnaire forms. Data based on one of six forms
beginning in 2010; N is one sixth of N indicated.sFor 8th, 10th, and 12th graders: In 1993, the question text was changed slightly in half of the forms to indicate that a drink meant more than
just a few sips. The 1993 data are based on the changed forms only; N is one half of N indicated for these groups. In 1994 the remaining
forms were changed to the new wording. The data are based on all forms beginning in 1994. In 2004, the question text was changed
slightly in half of the forms. An examination of the data did not show any effect from the wording change. The remaining forms
were changed in 2005.tFor 8th and 10th graders only: Data based on one of two forms for 1991–1996 and on two of four forms beginning in 1997; N is one half
of N indicated. For 12th graders only: Data based on one of six forms; N is one sixth of N indicated. For all grades in 2011: snus and
dissolvable tobacco were added to the list of examples. An examination of the data did not show any effect from the wording change.
Footnotes for Tables 1 through 4 (cont.)
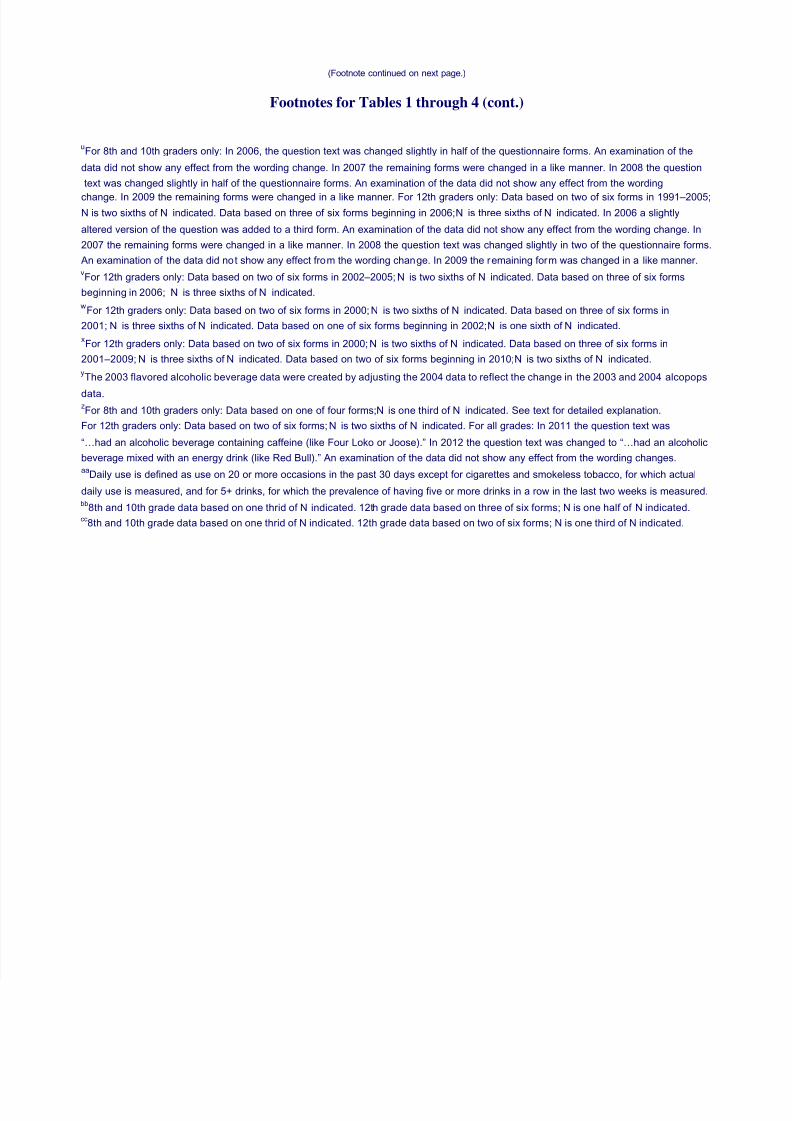
8/10/2019 Monitoring the Future Release.pdf
http://slidepdf.com/reader/full/monitoring-the-future-releasepdf 35/35
uFor 8th and 10th graders only: In 2006, the question text was changed slightly in half of the questionnaire forms. An examination of the
data did not show any effect from the wording change. In 2007 the remaining forms were changed in a like manner. In 2008 the question
text was changed slightly in half of the questionnaire forms. An examination of the data did not show any effect from the wording
change. In 2009 the remaining forms were changed in a like manner. For 12th graders only: Data based on two of six forms in 1991–2005;
N is two sixths of N indicated. Data based on three of six forms beginning in 2006; N is three sixths of N indicated. In 2006 a slightly
altered version of the question was added to a third form. An examination of the data did not show any effect from the wording change. In
2007 the remaining forms were changed in a like manner. In 2008 the question text was changed slightly in two of the questionnaire forms.
An examination of the data did not show any effect from the wording change. In 2009 the remaining form was changed in a like manner.vFor 12th graders only: Data based on two of six forms in 2002–2005; N is two sixths of N indicated. Data based on three of six forms
beginning in 2006; N is three sixths of N indicated.
wFor 12th graders only: Data based on two of six forms in 2000; N is two sixths of N indicated. Data based on three of six forms in
2001; N is three sixths of N indicated. Data based on one of six forms beginning in 2002; N is one sixth of N indicated.
xFor 12th graders only: Data based on two of six forms in 2000; N is two sixths of N indicated. Data based on three of six forms in
2001–2009; N is three sixths of N indicated. Data based on two of six forms beginning in 2010; N is two sixths of N indicated.
yThe 2003 flavored alcoholic beverage data were created by adjusting the 2004 data to reflect the change in the 2003 and 2004 alcopops
data.zFor 8th and 10th graders only: Data based on one of four forms; N is one third of N indicated. See text for detailed explanation.
For 12th graders only: Data based on two of six forms; N is two sixths of N indicated. For all grades: In 2011 the question text was
“…had an alcoholic beverage containing caffeine (like Four Loko or Joose).” In 2012 the question text was changed to “…had an alcoholic
beverage mixed with an energy drink (like Red Bull).” An examination of the data did not show any effect from the wording changes.aa
Daily use is defined as use on 20 or more occasions in the past 30 days except for cigarettes and smokeless tobacco, for which actual
daily use is measured, and for 5+ drinks, for which the prevalence of having five or more drinks in a row in the last two weeks is measured.bb
8th and 10th grade data based on one thrid of N indicated. 12th grade data based on three of six forms; N is one half of N indicated.cc
8th and 10th grade data based on one thrid of N indicated. 12th grade data based on two of six forms; N is one third of N indicated.
(Footnote continued on next page.)
Footnotes for Tables 1 through 4 (cont.)
Related Documents