Technical Report No.41 Monitoring and Evaluation of Cyanobacteria in Lake Champlain (Summer 2002) Prepared by Watzin, M., A. Shambaugh and E. Brines, UVM Rubenstein Ecosystem Science Laboratory and G. Boyer, SUNY Syracuse Department of Chemistry for Lake Champlain Basin Program December 2003 PUBLICATION SERIES THIS PROGRAM IS SPONSORED BY U.S.E.P.A. AND THE STATES OF NEW YORK AND VERMONT.

Welcome message from author
This document is posted to help you gain knowledge. Please leave a comment to let me know what you think about it! Share it to your friends and learn new things together.
Transcript
Technical Report No.41
Monitoring and Evaluation of Cyanobacteria in Lake Champlain (Summer 2002) Prepared by Watzin, M., A. Shambaugh and E. Brines, UVM Rubenstein Ecosystem Science Laboratory and G. Boyer, SUNY Syracuse Department of Chemistry for Lake Champlain Basin Program December 2003
PUBLICATION SERIES THIS PROGRAM IS SPONSORED BY U.S.E.P.A. AND THE STATES OF NEW YORK AND VERMONT.
MONITORING AND EVALUATION OF CYANOBACTERIA IN LAKE CHAMPLAIN
Summer 2002
Report to
Lake Champlain Basin Program
Mary C. Watzin, Angela d. Shambaugh, Emily K. Brines Rubenstein Ecosystem Science Laboratory
Rubenstein School of Environment and Natural Resources University of Vermont Burlington, VT 05401
with support from:
Gregory L. Boyer Department of Chemistry
State University of New York College of Environmental Science and Forestry
Syracuse, NY 13210
Final December 1, 2003
1
TABLE OF CONTENTS Executive Summary . . . . . . . . . . . . . . . . . . . . . . . . . . . . . . . . . . . . . . . . . . . . . . . . . . . . . .
2
Introduction . . . . . . . . . . . . . . . . . . . . . . . . . . . . . . . . . . . . . . . . . . . . . . . . . . . . . . . . . . . . .
3
Methods . . . . . . . . . . . . . . . . . . . . . . . . . . . . . . . . . . . . . . . . . . . . . . . . . . . . . . . . . . . . . . . .
4
Field Collection . . . . . . . . . . . . . . . . . . . . . . . . . . . . . . . . . . . . . . . . . . . . . . . . . . . . . 4 Sample Analysis . . . . . . . . . . . . . . . . . . . . . . . . . . . . . . . . . . . . . . . . . . . . . . . . . . . . . 8 Statistical Analysis of Data . . . . . . . . . . . . . . . . . . . . . . . . . . . . . . . . . . . . . . . . . . . . .
11
Results . . . . . . . . . . . . . . . . . . . . . . . . . . . . . . . . . . . . . . . . . . . . . . . . . . . . . . . . . . . . . . . . .
11
Cyanobacteria at the Long-term Biomonitoring Program Sites . . . . . . . . . . . . . . . . . 11 Cyanobacteria and Toxins in Burlington Bay . . . . . . . . . . . . . . . . . . . . . . . . . . . . . . . 12 Cyanobacteria and Toxins in St. Albans Bay . . . . . . . . . . . . . . . . . . . . . . . . . . . . . . . 13 Cyanobacteria and Toxins in Missisquoi Bay. . . . . . . . . . . . . . . . . . . . . . . . . . . . . . . 23 Summary of Patterns 2000-2002 . . . . . . . . . . . . . . . . . . . . . . . . . . . . . . . . . . . . . . . . . 25 Nutrients . . . . . . . . . . . . . . . . . . . . . . . . . . . . . . . . . . . . . . . . . . . . . . . . . . . . . . . . . . . 27 Training Workshop . . . . . . . . . . . . . . . . . . . . . . . . . . . . . . . . . . . . . . . . . . . . . . . . . . .
27
Discussion and Conclusions . . . . . . . . . . . . . . . . . . . . . . . . . . . . . . . . . . . . . . . . . . . . . . . .
30
Patterns of Cyanobacteria and Toxin Distribution in Lake Champlain. . . . . . . . . . . . 30 Effectiveness of the Prototype Monitoring and Alert Framework. . . . . . . . . . . . . . . . 31 Effectiveness of the Training Workshop . . . . . . . . . . . . . . . . . . . . . . . . . . . . . . . . . .
34
Acknowledgments . . . . . . . . . . . . . . . . . . . . . . . . . . . . . . . . . . . . . . . . . . . . . . . . . . . . . . . . 35 Literature Cited . . . . . . . . . . . . . . . . . . . . . . . . . . . . . . . . . . . . . . . . . . . . . . . . . . . . . . . . . . 35 Appendix A. Qualitative Samples - Data Summary . . . . . . . . . . . . . . . . . . . . . . . . . . . . . . 37Appendix B. Quantitative Samples - Data Summary . . . . . . . . . . . . . . . . . . . . . . . . . . . . . 40Appendix C. Toxin Samples - Data Summary . . . . . . . . . . . . . . . . . . . . . . . . . . . . . . . . . . 49Appendix D. Chlorophyll, Nutrients - Data Summary . . . . . . . . . . . . . . . . . . . . . . . . . . . . 58Appendix E. Cyanobacteria Training Booklet . . . . . . . . . . . . . . . . . . . . . . . . . . . . . . . . . . 72Appendix F. Meteorological Data Summary, Colchester Reef. . . . . . . . . . . . . . . . . . . . . . 85
2
EXECUTIVE SUMMARY Although cyanobacteria have long been a common part of the plankton of Lake Champlain, toxic blooms were never observed until 1999. In 2000, we began a research and monitoring project designed to inventory which potential toxin-producing species of cyanobacteria occurred regularly in the lake and to assess the risks to people and their pets from exposure to these algal toxins. In 2002, this project continued with the following specific objectives:
• Continue monitoring cyanobacteria in the greater Burlington area. • Expand monitoring for cyanobacteria to selected areas of the lake outside of the greater
Burlington area (screening through VT DEC lakewide monitoring effort). • Continue screening for the presence of toxins when potential toxin-producers are
observed in plankton samples. • If a bloom occurs, monitor environmental conditions, algae, and toxins throughout the
bloom. • Refine and test a tiered cyanobacteria monitoring and public alert system framework. • Hold a workshop for public health officials, water system and beach managers and other
interested parties that would provide them with the skills necessary to identify cyanobacteria blooms, and to use the tiered alert system framework.
Net and whole water plankton samples, as well as samples for nutrient and toxin analyses were collected at sites throughout the lake, concentrating on Burlington Bay, St. Albans Bay, and Missisquoi Bay. In 2002, potential toxin-producing cyanobacteria species remained a common part of the plankton of Lake Champlain. Highest abundances of these algae were found in St. Albans Bay and Missisquoi Bay in the northern part of the lake. Concentrations of microcystins at these two locations exceeded the World Health Organization guideline of 1 µg/L on several occasions during the summer and fall, sometimes by as much as one or two orders of magnitude. Toxin concentrations were highest in visible surface accumulations, or scums that occurred along the shorelines of the bay. Highest densities of BGA were found in the northern bays, where nutrient concentrations are also higher than those in Burlington Bay and the Main Lake. Within St. Albans Bay, ambient nutrient concentrations did not prove to be a good predictor of algal densities. Our prototype monitoring and alert framework worked well to document the initiation of a potentially toxic bloom. Once potential toxin-producing species reached a critical density, toxin analyses began. Although elevated toxin concentrations were not always found in high densities of potentially toxic species, all high toxin concentrations were found in dense surface accumulations of algae or scums. Since these accumulations tended to be along the shoreline, and people also use the water for recreation primarily at shoreline locations, to protect the public health, future sample collection should also emphasize these sites. There was a high degree of spatial variability in toxin concentrations at a given site, underlining the need for replicate samples in a bloom. As the sample data base continues to be developed, the most appropriate toxin concentrations for public health warnings might be developed. The training workshop for public health officials and environmental managers was well-received. Additional training and public education materials are needed.
3
INTRODUCTION In 1999, cyanobacteria, also known as blue-green algae (BGA), bloomed in parts of Lake Champlain and may have produced toxins potentially harmful to human health. During the summer of 2000, a collaborative effort involving the University of Vermont (UVM), the NRCS Watershed Science Institute, the Vermont Department of Health (VT DOH), the Vermont Department of Environmental Conservation (VT DEC), SUNY-ESF in Syracuse (SUNY), Wright State University, the Florida Department of Health and the Maine Department of Marine Resources documented the regular presence of toxin-producing blue-green algae in the lake, and the presence of trace amounts of toxin on several occasions. In the summer of 2001, UVM, VT DOH and SUNY continued the collaborative effort, concentrating on the larger Burlington Bay area. Plankton communities in the vicinity of two drinking water facilities (the Champlain Water District and the Burlington Municipal Water Treatment Plant) and two public beaches (North Beach in Burlington and Red Rocks Beach in South Burlington) were monitored over the growing season. While BGA were noted in the study area during 2001 and toxins were detected in concentrated plankton samples, environmental conditions in Burlington Bay did not support extensive blooms. Such blooms occurred in other areas of Lake Champlain, including Missisquoi Bay, the Northeast Arm and the Inland Sea. While the potential for human exposure to toxins may be greater in the Burlington Bay area because of the large municipal water systems and the beaches, the environmental conditions appear less conducive to the massive blooms that could release large amounts of toxins into the water. In 2002, therefore, sampling continued in the Burlington area, where the human population is concentrated, but also expanded to monitor other locations and to evaluate a protocol for early identification of problem blooms. The dynamics of bloom formation and toxin production by cyanobacteria in Lake Champlain are still not well known, therefore, sampling in bloom conditions also included a variety of environmental parameters in order to help identify the factors that facilitate bloom formation and toxin production. The Specific Objectives in 2002 were to:
• Continue monitoring of BGA in the greater Burlington area. • Expand monitoring for BGA to selected areas of the lake outside of the greater
Burlington area (screening through VT DEC lakewide monitoring effort). • Continue screening for the presence of toxins when potential toxin-producers are
observed in plankton samples. • If a bloom occurs, monitor environmental conditions, algae, and toxins throughout the
bloom. • Refine and test a tiered BGA monitoring and public alert system framework. • Hold a workshop for public health officials, water system and beach managers and other
interested parties that would provide them with the skills necessary to identify BGA blooms, and to use the tiered alert system framework.
In St. Albans Bay, where dense blooms are common, a more detailed study was undertaken in 2002 to 1) identify conditions that favor the development of dense populations of BGA in a surface bloom, 2) characterize the spatial and temporal variation of toxin concentrations within a
4
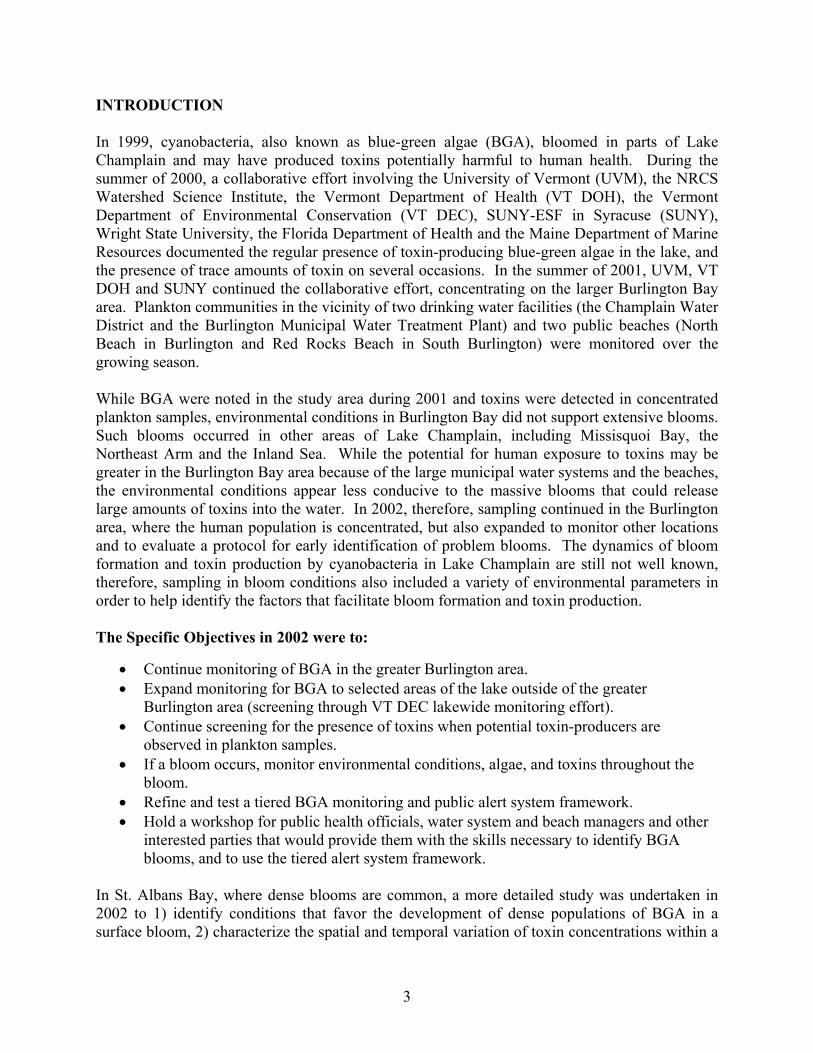
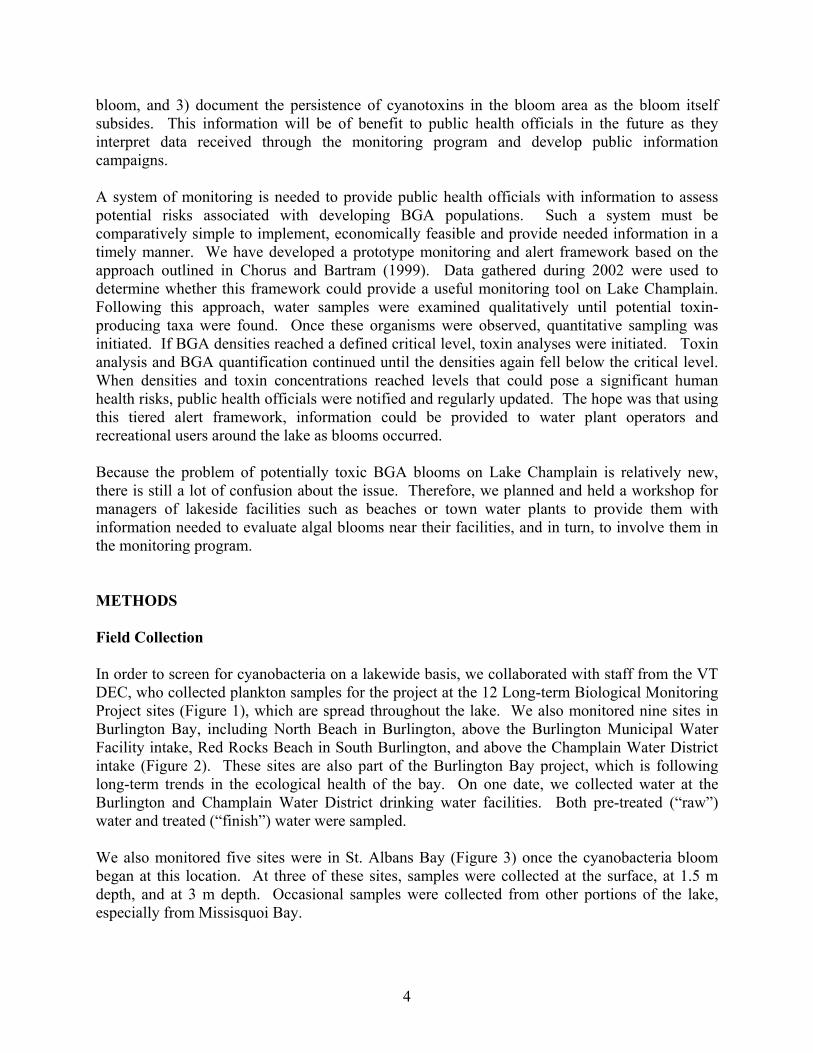
bloom, and 3) document the persistence of cyanotoxins in the bloom area as the bloom itself subsides. This information will be of benefit to public health officials in the future as they interpret data received through the monitoring program and develop public information campaigns. A system of monitoring is needed to provide public health officials with information to assess potential risks associated with developing BGA populations. Such a system must be comparatively simple to implement, economically feasible and provide needed information in a timely manner. We have developed a prototype monitoring and alert framework based on the approach outlined in Chorus and Bartram (1999). Data gathered during 2002 were used to determine whether this framework could provide a useful monitoring tool on Lake Champlain. Following this approach, water samples were examined qualitatively until potential toxin-producing taxa were found. Once these organisms were observed, quantitative sampling was initiated. If BGA densities reached a defined critical level, toxin analyses were initiated. Toxin analysis and BGA quantification continued until the densities again fell below the critical level. When densities and toxin concentrations reached levels that could pose a significant human health risks, public health officials were notified and regularly updated. The hope was that using this tiered alert framework, information could be provided to water plant operators and recreational users around the lake as blooms occurred. Because the problem of potentially toxic BGA blooms on Lake Champlain is relatively new, there is still a lot of confusion about the issue. Therefore, we planned and held a workshop for managers of lakeside facilities such as beaches or town water plants to provide them with information needed to evaluate algal blooms near their facilities, and in turn, to involve them in the monitoring program. METHODS Field Collection In order to screen for cyanobacteria on a lakewide basis, we collaborated with staff from the VT DEC, who collected plankton samples for the project at the 12 Long-term Biological Monitoring Project sites (Figure 1), which are spread throughout the lake. We also monitored nine sites in Burlington Bay, including North Beach in Burlington, above the Burlington Municipal Water Facility intake, Red Rocks Beach in South Burlington, and above the Champlain Water District intake (Figure 2). These sites are also part of the Burlington Bay project, which is following long-term trends in the ecological health of the bay. On one date, we collected water at the Burlington and Champlain Water District drinking water facilities. Both pre-treated (“raw”) water and treated (“finish”) water were sampled. We also monitored five sites were in St. Albans Bay (Figure 3) once the cyanobacteria bloom began at this location. At three of these sites, samples were collected at the surface, at 1.5 m depth, and at 3 m depth. Occasional samples were collected from other portions of the lake, especially from Missisquoi Bay.
5
Figure 1. Location of the Lake Champlain Long-Term Biomonitoring Project Stations.
Figure 2. Sampling locations in Burlington Bay, 2002.
6
A
B
C
D
E
A
B
C
D
E
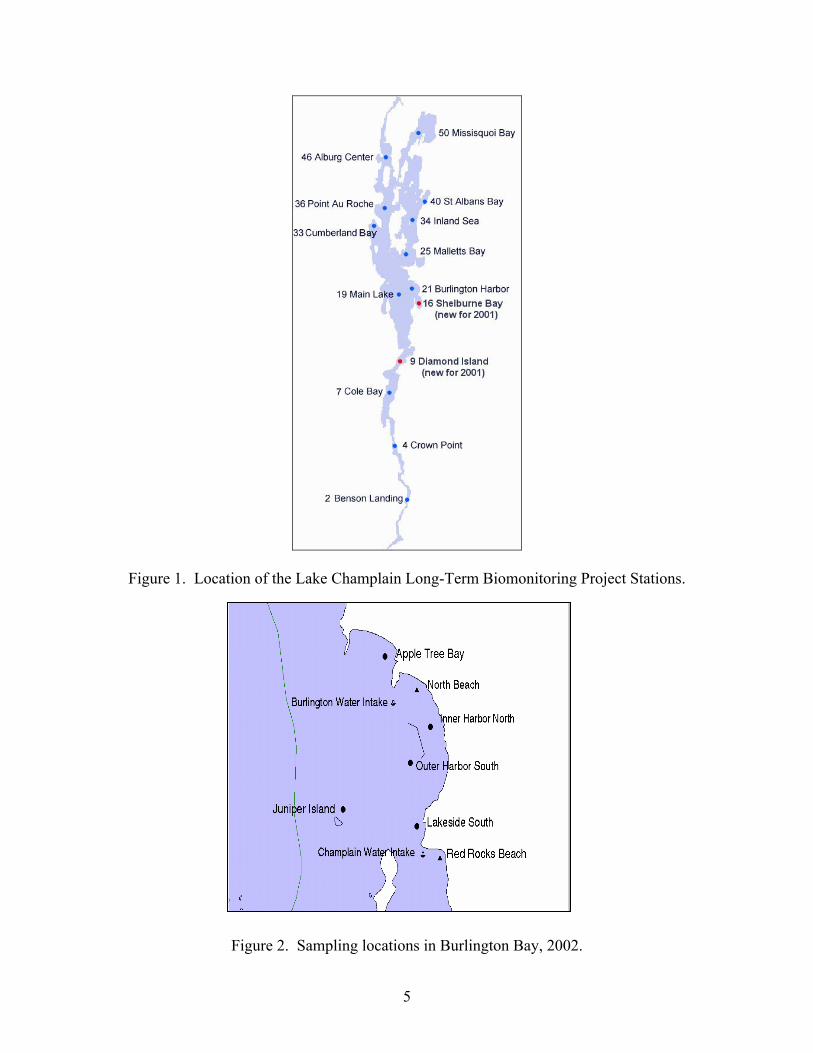
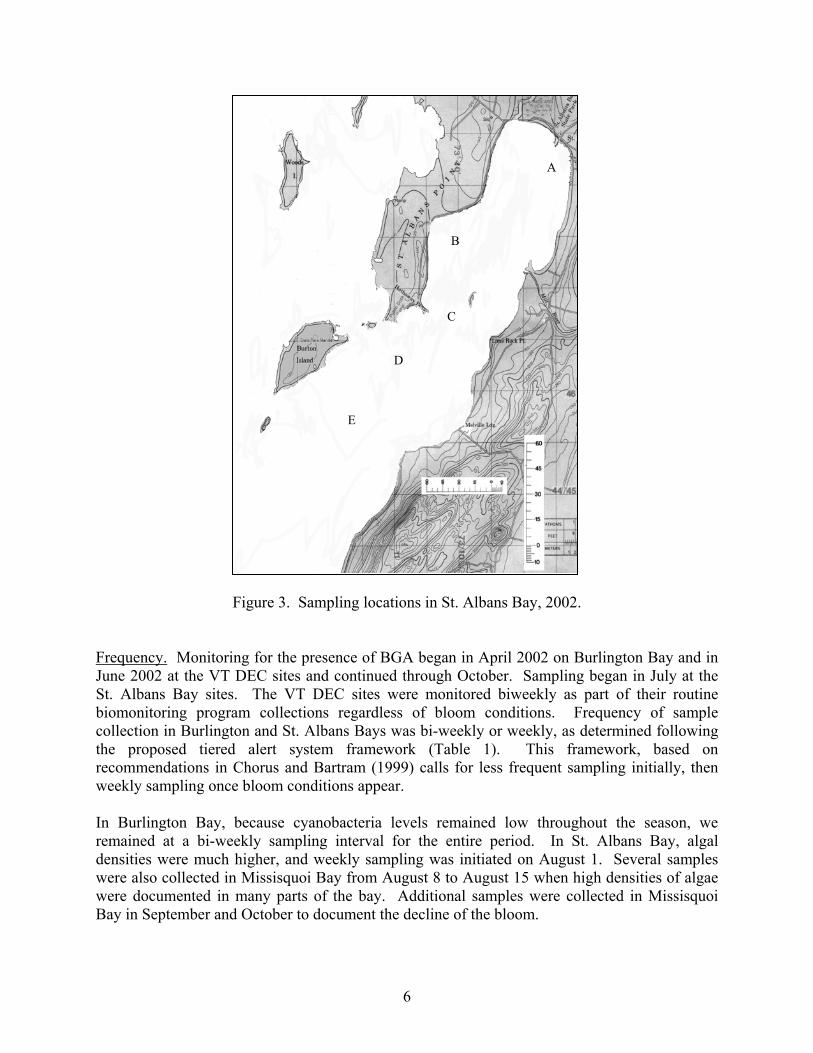
Figure 3. Sampling locations in St. Albans Bay, 2002. Frequency. Monitoring for the presence of BGA began in April 2002 on Burlington Bay and in June 2002 at the VT DEC sites and continued through October. Sampling began in July at the St. Albans Bay sites. The VT DEC sites were monitored biweekly as part of their routine biomonitoring program collections regardless of bloom conditions. Frequency of sample collection in Burlington and St. Albans Bays was bi-weekly or weekly, as determined following the proposed tiered alert system framework (Table 1). This framework, based on recommendations in Chorus and Bartram (1999) calls for less frequent sampling initially, then weekly sampling once bloom conditions appear. In Burlington Bay, because cyanobacteria levels remained low throughout the season, we remained at a bi-weekly sampling interval for the entire period. In St. Albans Bay, algal densities were much higher, and weekly sampling was initiated on August 1. Several samples were also collected in Missisquoi Bay from August 8 to August 15 when high densities of algae were documented in many parts of the bay. Additional samples were collected in Missisquoi Bay in September and October to document the decline of the bloom.
7
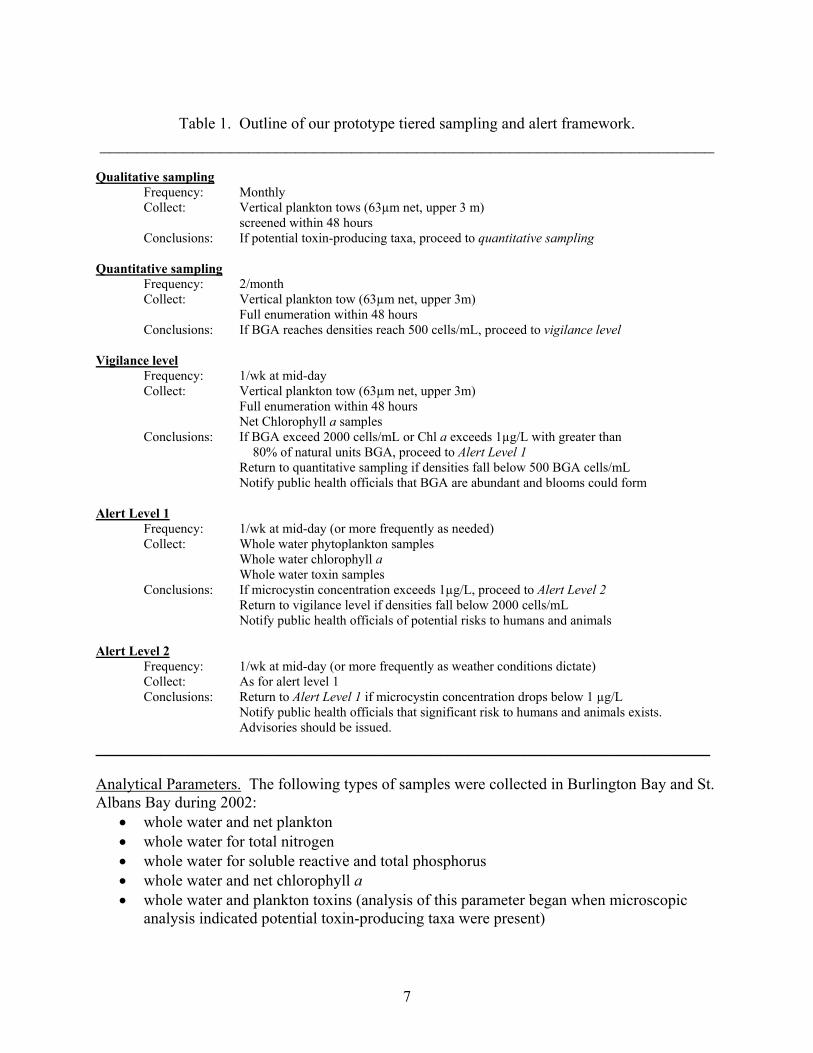
Table 1. Outline of our prototype tiered sampling and alert framework.
__________________________________________________________________ Qualitative sampling
Frequency: Monthly Collect: Vertical plankton tows (63µm net, upper 3 m)
screened within 48 hours Conclusions: If potential toxin-producing taxa, proceed to quantitative sampling
Quantitative sampling Frequency: 2/month Collect: Vertical plankton tow (63µm net, upper 3m) Full enumeration within 48 hours Conclusions: If BGA reaches densities reach 500 cells/mL, proceed to vigilance level
Vigilance level
Frequency: 1/wk at mid-day Collect: Vertical plankton tow (63µm net, upper 3m) Full enumeration within 48 hours
Net Chlorophyll a samples Conclusions: If BGA exceed 2000 cells/mL or Chl a exceeds 1µg/L with greater than
80% of natural units BGA, proceed to Alert Level 1 Return to quantitative sampling if densities fall below 500 BGA cells/mL Notify public health officials that BGA are abundant and blooms could form
Alert Level 1 Frequency: 1/wk at mid-day (or more frequently as needed) Collect: Whole water phytoplankton samples Whole water chlorophyll a Whole water toxin samples Conclusions: If microcystin concentration exceeds 1µg/L, proceed to Alert Level 2 Return to vigilance level if densities fall below 2000 cells/mL Notify public health officials of potential risks to humans and animals
Alert Level 2
Frequency: 1/wk at mid-day (or more frequently as weather conditions dictate) Collect: As for alert level 1 Conclusions: Return to Alert Level 1 if microcystin concentration drops below 1 µg/L
Notify public health officials that significant risk to humans and animals exists. Advisories should be issued.
__________________________________________________________________ Analytical Parameters. The following types of samples were collected in Burlington Bay and St. Albans Bay during 2002:
• whole water and net plankton • whole water for total nitrogen • whole water for soluble reactive and total phosphorus • whole water and net chlorophyll a • whole water and plankton toxins (analysis of this parameter began when microscopic
analysis indicated potential toxin-producing taxa were present)
8
At the VT DEC sites, only net plankton samples were collected for this project, however, total nitrogen, total phosphorus, and chlorophyll samples were collected as part of the Long-term Biomonitoring Project. In Missisquoi Bay, only whole water plankton and toxin samples were collected. In Burlington Bay, temperature, conductivity and oxygen were measured using a Seabird profiler from 0.5 m below the surface to 0.5m above the bottom. YSI portable units were used in St. Albans Bay and at the Long-term Biomonitoring Project sites. Secchi depths were measured at all locations in Burlington Bay, St. Albans Bay, and at the Long-term Biomonitoring Project sites. Sample Collection. Net plankton, net chlorophyll and net toxin samples were obtained using a 63µm Wisconsin net. A single 3m tow was collected, placed in a cooler, and transported back to the laboratory where it was subdivided for the analyses. The total volume collected for each composite was recorded. Total nitrogen, phosphorus, whole water chlorophyll, and whole water plankton samples were collected in duplicate using a 1L Niskin water sampler at 1, 1.5 or 3m. At the water treatment facilities, samples were collected directly from the raw and finish water lines after allowing them to flow freely for several minutes. 20L each of raw and finish water were collected in large carboys for toxin analysis. Two replicates were collected for each parameter. Preservation and storage. Nalgene bottles were used for all samples. Nutrient and toxin containers were cleaned with 20% hydrochloric acid solution prior to use. Nitrogen samples were preserved with sulfuric acid to a pH less than 2. Total phosphorus samples were frozen until analysis. Soluble reactive phosphorus samples were filtered and analyzed within 24 hours. Plankton samples were preserved with 1% Lugols iodine solution and stored in the dark until analysis. Chlorophyll samples were filtered and frozen for analysis within 24 hours. Lake water samples for toxin analysis were preserved in one of three ways: filtered and frozen upon return to the lab, filtered and shipped for analysis at SUNY within 24 hours, or shipped as whole water samples for analysis at SUNY within 24 hours. Water treatment facility raw and finish water samples were extracted within 48 hours and shipped for analysis. Sample Analysis Chlorophyll. All samples were thoroughly mixed and then filtered onto Whatman GF/F glass fiber filters under low pressure. Sufficient material was filtered to leave a visible green layer. Filters were placed in clean 15mL plastic centrifuge tubes and frozen. To extract the chlorophyll, 8mL of 95% ethanol was added to each tube. Tubes were placed in an 80°C water bath for 8 minutes, then covered in foil and placed in a refrigerator overnight. After extraction, the samples were brought to room temperature, shaken to homogenize the extract, and centrifuged at 3000 rpm for 10 minutes. Absorbance was measured at 665 and 750nm in non-acidified and acidified extract. Chlorophyll concentrations in the net plankton samples were extrapolated to reflect actual chlorophyll concentrations in the original lake water. About 10% of the samples were run in duplicate.
9
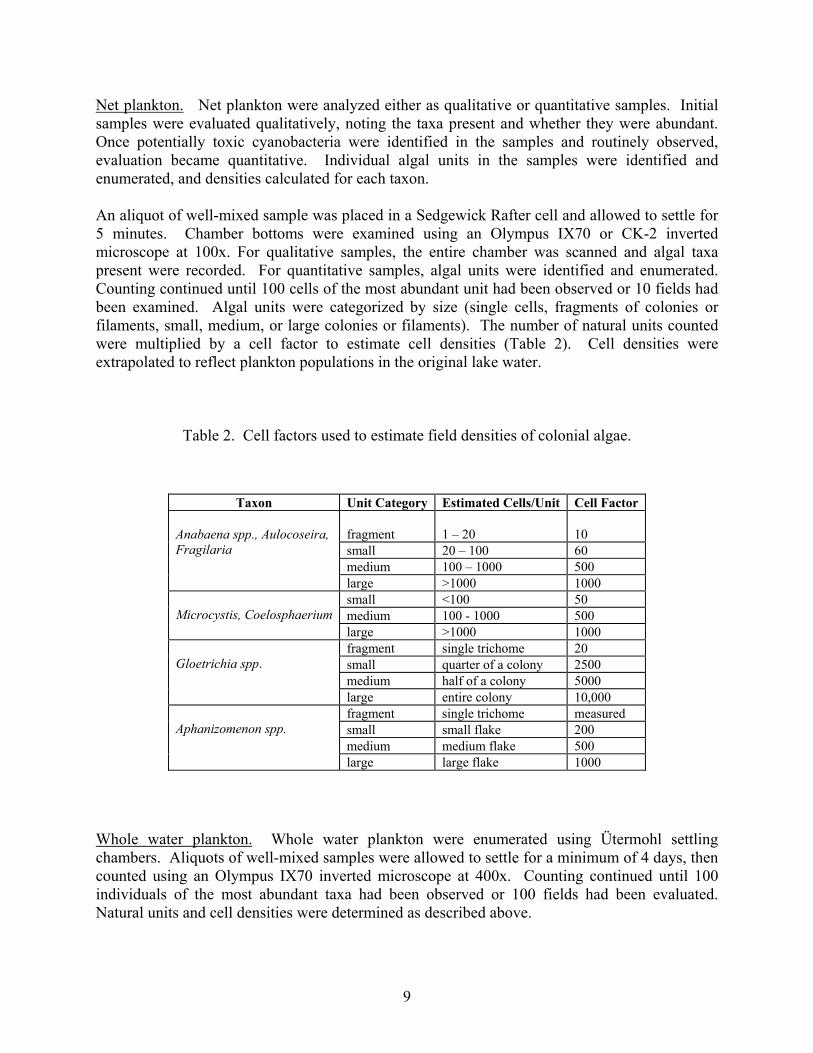
Net plankton. Net plankton were analyzed either as qualitative or quantitative samples. Initial samples were evaluated qualitatively, noting the taxa present and whether they were abundant. Once potentially toxic cyanobacteria were identified in the samples and routinely observed, evaluation became quantitative. Individual algal units in the samples were identified and enumerated, and densities calculated for each taxon. An aliquot of well-mixed sample was placed in a Sedgewick Rafter cell and allowed to settle for 5 minutes. Chamber bottoms were examined using an Olympus IX70 or CK-2 inverted microscope at 100x. For qualitative samples, the entire chamber was scanned and algal taxa present were recorded. For quantitative samples, algal units were identified and enumerated. Counting continued until 100 cells of the most abundant unit had been observed or 10 fields had been examined. Algal units were categorized by size (single cells, fragments of colonies or filaments, small, medium, or large colonies or filaments). The number of natural units counted were multiplied by a cell factor to estimate cell densities (Table 2). Cell densities were extrapolated to reflect plankton populations in the original lake water.
Table 2. Cell factors used to estimate field densities of colonial algae.
Whole water plankton. Whole water plankton were enumerated using Ütermohl settling chambers. Aliquots of well-mixed samples were allowed to settle for a minimum of 4 days, then counted using an Olympus IX70 inverted microscope at 400x. Counting continued until 100 individuals of the most abundant taxa had been observed or 100 fields had been evaluated. Natural units and cell densities were determined as described above.
Taxon Unit Category Estimated Cells/Unit Cell Factor fragment
1 – 20
10
small 20 – 100 60 medium 100 – 1000 500
Anabaena spp., Aulocoseira, Fragilaria
large >1000 1000 small <100 50 medium 100 - 1000 500
Microcystis, Coelosphaerium
large >1000 1000 fragment single trichome 20 small quarter of a colony 2500 medium half of a colony 5000
Gloetrichia spp.
large entire colony 10,000 fragment single trichome measured small small flake 200 medium medium flake 500
Aphanizomenon spp.
large large flake 1000
10
Phosphorus. Soluble reactive phosphorus samples were filtered using acid-cleaned syringe filter apparatus and Millipore RW03 nitrocellulose filters. Analysis followed the ascorbic acid method (APHA 1994) using a Shimadzu UV-1601 spectrophotometer. Total phosphorus samples were thawed and mixed thoroughly. A 50mL aliquot was digested using ammonium persulfate, and analyzed using the ascorbic acid method (APHA 1994). Total Nitrogen. Total nitrogen samples were analyzed by the LaRosa Laboratory (VT DEC) using persulfate digestion (APHA 1994). Toxin Sample Preparation. To prepare net plankton for analysis, a well-mixed aliquot of plankton concentrate was filtered onto Whatman 934-AH glass fiber filters. Filters for analysis of toxins by high pressure liquid chromatography (HPLC), and protein phosphatase inhibition assay (PPIA) at SUNY were placed on ice and shipped by overnight carrier. Filters for enyzme-linked immunosorbant assay (ELISA) analysis by the VT DOH were placed on ice and delivered to their laboratory in Burlington within 24 hours. Filters for ELISA assay by UVM were placed in 7mL glass vials with teflon lined caps with 4 mL of 50% methanol, shaken well and stored at –40°C until analysis. Whole water samples for analysis by HPLC and PPIA at SUNY were kept cold and sent off by overnight carrier within 24 hours. Raw and finish water samples were filtered through solid-phase extraction cartridges (Baker Co.) using a Cole-Parmer peristaltic pump at a rate of 10 – 12 mL/minute. Filtering continued until the cartridge appeared discolored or a minimum of 8L had been processed. Cartridges were rolled into aluminum foil and placed in a ziplock bag for shipment to SUNY within 48 hours. Microcystin (s) by ELISA. Toxin samples in 50% methanol were thawed, shaken and re-frozen three times before beginning analysis. Extracted samples were diluted with deionized water until methanol represented less than 5% of the total volume, following recommendations to improve the accuracy of the method (Metcalf et al. 2000). Microcystin plate kits were purchased from Envirologix Inc. (Portland ME). UVM and VT DOH used kits from the same production lot. Analyses at VT DOH were used as a QA/QC check. Samples were run in duplicate following manufacturer’s instructions on a KC Jr. plate reader (Biotek Instruments), utilizing standards provided in the kit. Mean values were used to determine the toxin concentration of each pair of samples. Samples exceeding the range recommended by the kit were diluted and re-analyzed. Samples below the range were also re-analyzed using manufacturer recommended dilution procedures for the standards. Laboratory blanks were run with each sample batch using deionized water. Microcystin (s) by PPIA. PPIA analysis followed a modification of Carmichael and An (1999). Microcystin LR standards (0.06 – 1000 µg/L) were prepared fresh from a 40 µg/L stock in 50% acidified methanol. The protein phosphatase 1, catalytic subunit Roche, was used at a working concentration of 0.1mU/200 µL. All assays were done in 96 well plates in a 37°C incubator. Readings at 405nm were taken every 5 minutes for 60 minutes using an E-max plate reader.
11
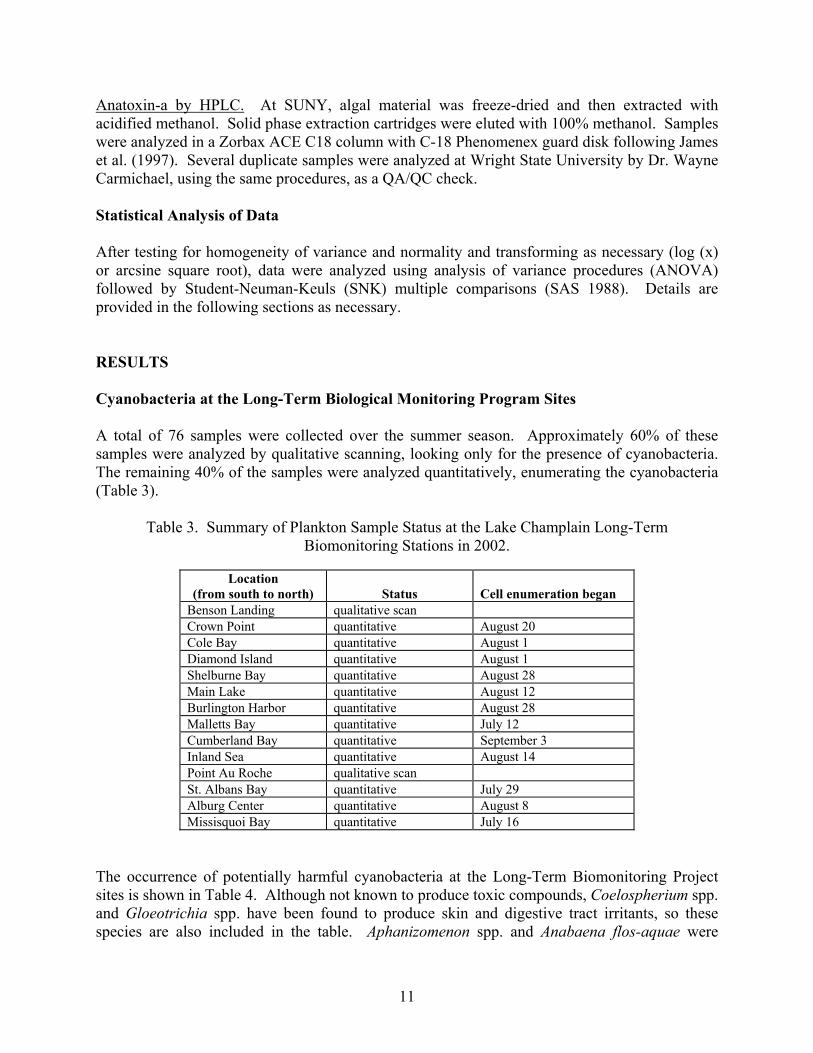
Anatoxin-a by HPLC. At SUNY, algal material was freeze-dried and then extracted with acidified methanol. Solid phase extraction cartridges were eluted with 100% methanol. Samples were analyzed in a Zorbax ACE C18 column with C-18 Phenomenex guard disk following James et al. (1997). Several duplicate samples were analyzed at Wright State University by Dr. Wayne Carmichael, using the same procedures, as a QA/QC check. Statistical Analysis of Data After testing for homogeneity of variance and normality and transforming as necessary (log (x) or arcsine square root), data were analyzed using analysis of variance procedures (ANOVA) followed by Student-Neuman-Keuls (SNK) multiple comparisons (SAS 1988). Details are provided in the following sections as necessary. RESULTS Cyanobacteria at the Long-Term Biological Monitoring Program Sites A total of 76 samples were collected over the summer season. Approximately 60% of these samples were analyzed by qualitative scanning, looking only for the presence of cyanobacteria. The remaining 40% of the samples were analyzed quantitatively, enumerating the cyanobacteria (Table 3).
Table 3. Summary of Plankton Sample Status at the Lake Champlain Long-Term Biomonitoring Stations in 2002.
Location
(from south to north)
Status Cell enumeration began
Benson Landing qualitative scan Crown Point quantitative August 20 Cole Bay quantitative August 1 Diamond Island quantitative August 1 Shelburne Bay quantitative August 28 Main Lake quantitative August 12 Burlington Harbor quantitative August 28 Malletts Bay quantitative July 12 Cumberland Bay quantitative September 3 Inland Sea quantitative August 14 Point Au Roche qualitative scan St. Albans Bay quantitative July 29 Alburg Center quantitative August 8 Missisquoi Bay quantitative July 16
The occurrence of potentially harmful cyanobacteria at the Long-Term Biomonitoring Project sites is shown in Table 4. Although not known to produce toxic compounds, Coelospherium spp. and Gloeotrichia spp. have been found to produce skin and digestive tract irritants, so these species are also included in the table. Aphanizomenon spp. and Anabaena flos-aquae were
12
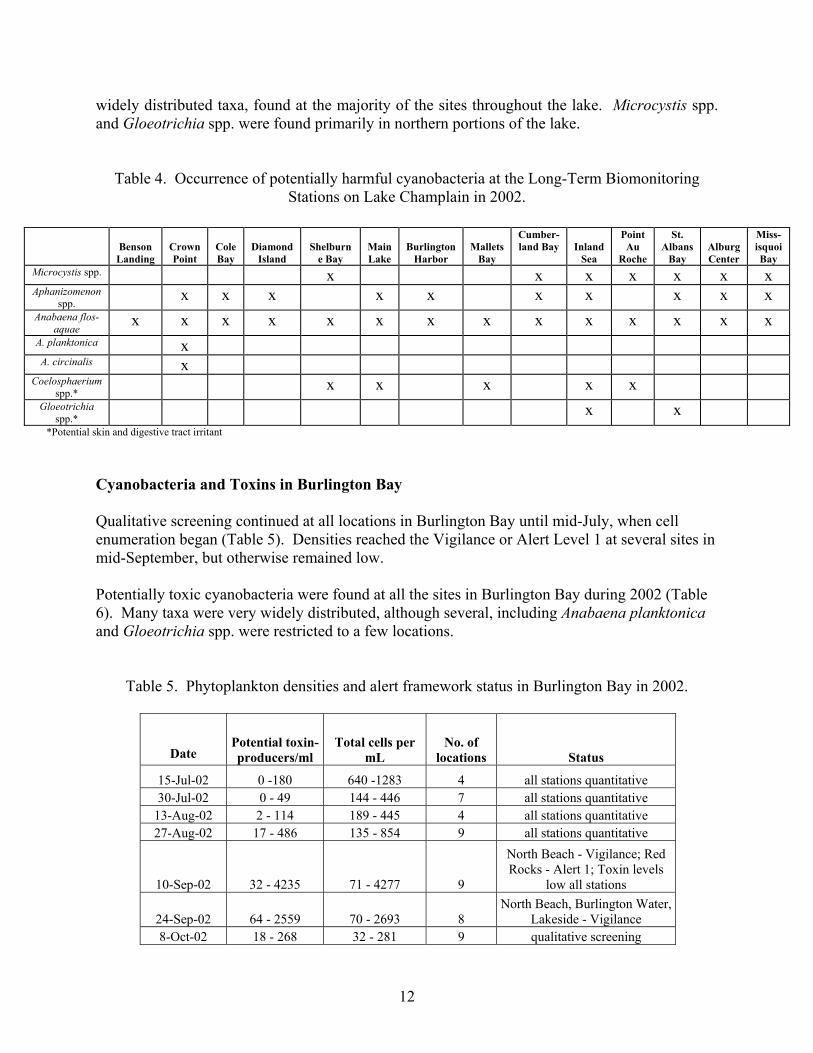
widely distributed taxa, found at the majority of the sites throughout the lake. Microcystis spp. and Gloeotrichia spp. were found primarily in northern portions of the lake.
Table 4. Occurrence of potentially harmful cyanobacteria at the Long-Term Biomonitoring Stations on Lake Champlain in 2002.
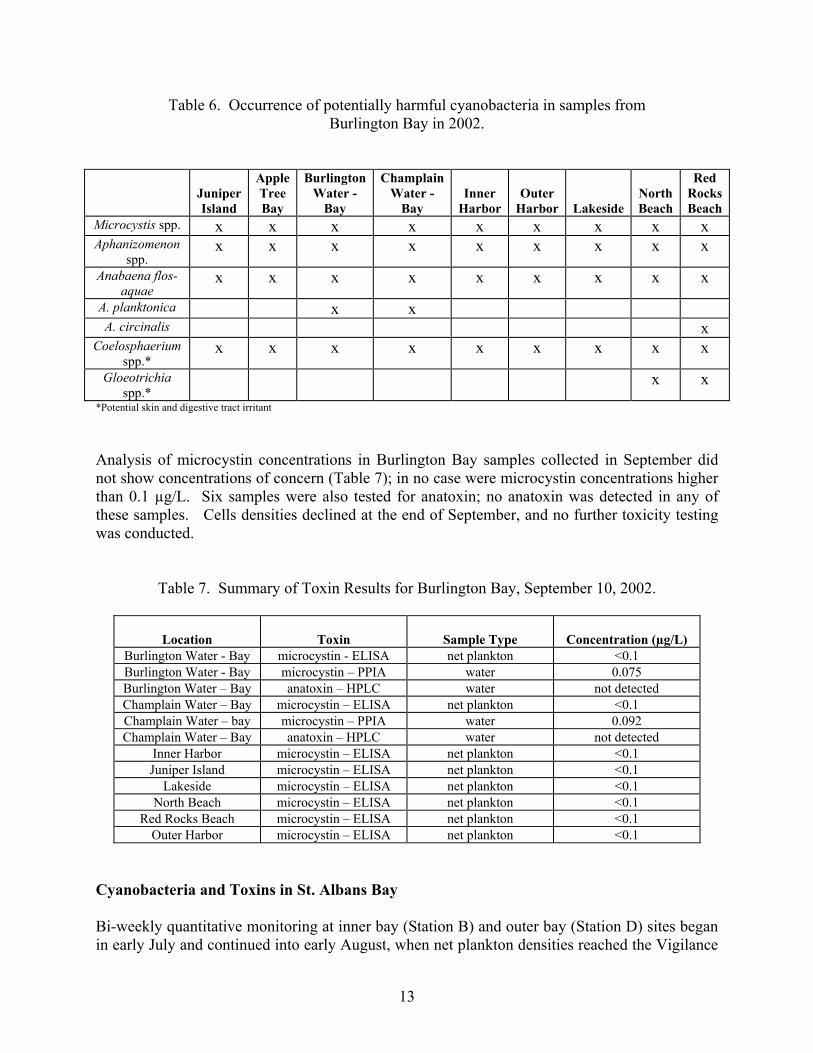
*Potential skin and digestive tract irritant Cyanobacteria and Toxins in Burlington Bay Qualitative screening continued at all locations in Burlington Bay until mid-July, when cell enumeration began (Table 5). Densities reached the Vigilance or Alert Level 1 at several sites in mid-September, but otherwise remained low. Potentially toxic cyanobacteria were found at all the sites in Burlington Bay during 2002 (Table 6). Many taxa were very widely distributed, although several, including Anabaena planktonica and Gloeotrichia spp. were restricted to a few locations.
Table 5. Phytoplankton densities and alert framework status in Burlington Bay in 2002.
Date Potential toxin-producers/ml
Total cells per mL
No. of locations Status
15-Jul-02 0 -180 640 -1283 4 all stations quantitative 30-Jul-02 0 - 49 144 - 446 7 all stations quantitative
13-Aug-02 2 - 114 189 - 445 4 all stations quantitative 27-Aug-02 17 - 486 135 - 854 9 all stations quantitative
10-Sep-02 32 - 4235 71 - 4277 9
North Beach - Vigilance; Red Rocks - Alert 1; Toxin levels
low all stations
24-Sep-02 64 - 2559 70 - 2693 8 North Beach, Burlington Water,
Lakeside - Vigilance 8-Oct-02 18 - 268 32 - 281 9 qualitative screening
Benson Landing
Crown Point
Cole Bay
Diamond
Island
Shelburn
e Bay
Main Lake
Burlington
Harbor
Mallets
Bay
Cumber-land Bay
Inland
Sea
Point Au
Roche
St. Albans
Bay
Alburg Center
Miss-isquoi Bay
Microcystis spp. x x x x x x x Aphanizomenon
spp. x x x x x x x x x x
Anabaena flos-aquae
x x x x x x x x x x x x x x A. planktonica x A. circinalis x
Coelosphaerium spp.*
x x x x x Gloeotrichia
spp.* x x
13
Table 6. Occurrence of potentially harmful cyanobacteria in samples from Burlington Bay in 2002.
Juniper Island
Apple Tree Bay
Burlington Water -
Bay
Champlain Water -
Bay
Inner
Harbor
Outer
Harbor
Lakeside
North Beach
Red Rocks Beach
Microcystis spp. x x x x x x x x x Aphanizomenon
spp. x x x x x x x x x
Anabaena flos-aquae
x x x x x x x x x
A. planktonica x x A. circinalis x
Coelosphaerium spp.*
x x x x x x x x x
Gloeotrichia spp.*
x x
*Potential skin and digestive tract irritant
Analysis of microcystin concentrations in Burlington Bay samples collected in September did not show concentrations of concern (Table 7); in no case were microcystin concentrations higher than 0.1 µg/L. Six samples were also tested for anatoxin; no anatoxin was detected in any of these samples. Cells densities declined at the end of September, and no further toxicity testing was conducted.
Table 7. Summary of Toxin Results for Burlington Bay, September 10, 2002.
Location
Toxin
Sample Type
Concentration (µg/L)
Burlington Water - Bay microcystin - ELISA net plankton <0.1 Burlington Water - Bay microcystin – PPIA water 0.075 Burlington Water – Bay anatoxin – HPLC water not detected Champlain Water – Bay microcystin – ELISA net plankton <0.1 Champlain Water – bay microcystin – PPIA water 0.092 Champlain Water – Bay anatoxin – HPLC water not detected
Inner Harbor microcystin – ELISA net plankton <0.1 Juniper Island microcystin – ELISA net plankton <0.1
Lakeside microcystin – ELISA net plankton <0.1 North Beach microcystin – ELISA net plankton <0.1
Red Rocks Beach microcystin – ELISA net plankton <0.1 Outer Harbor microcystin – ELISA net plankton <0.1
Cyanobacteria and Toxins in St. Albans Bay Bi-weekly quantitative monitoring at inner bay (Station B) and outer bay (Station D) sites began in early July and continued into early August, when net plankton densities reached the Vigilance
14
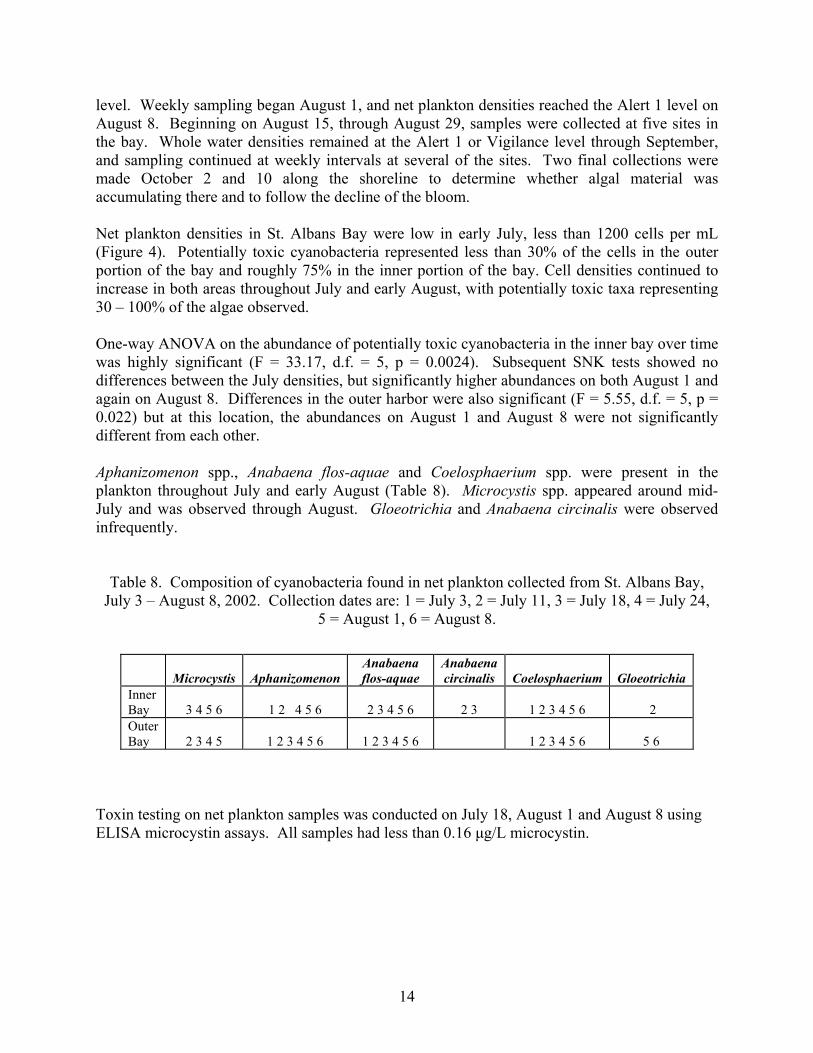
level. Weekly sampling began August 1, and net plankton densities reached the Alert 1 level on August 8. Beginning on August 15, through August 29, samples were collected at five sites in the bay. Whole water densities remained at the Alert 1 or Vigilance level through September, and sampling continued at weekly intervals at several of the sites. Two final collections were made October 2 and 10 along the shoreline to determine whether algal material was accumulating there and to follow the decline of the bloom. Net plankton densities in St. Albans Bay were low in early July, less than 1200 cells per mL (Figure 4). Potentially toxic cyanobacteria represented less than 30% of the cells in the outer portion of the bay and roughly 75% in the inner portion of the bay. Cell densities continued to increase in both areas throughout July and early August, with potentially toxic taxa representing 30 – 100% of the algae observed. One-way ANOVA on the abundance of potentially toxic cyanobacteria in the inner bay over time was highly significant (F = 33.17, d.f. = 5, p = 0.0024). Subsequent SNK tests showed no differences between the July densities, but significantly higher abundances on both August 1 and again on August 8. Differences in the outer harbor were also significant (F = 5.55, d.f. = 5, p = 0.022) but at this location, the abundances on August 1 and August 8 were not significantly different from each other. Aphanizomenon spp., Anabaena flos-aquae and Coelosphaerium spp. were present in the plankton throughout July and early August (Table 8). Microcystis spp. appeared around mid-July and was observed through August. Gloeotrichia and Anabaena circinalis were observed infrequently.
Table 8. Composition of cyanobacteria found in net plankton collected from St. Albans Bay, July 3 – August 8, 2002. Collection dates are: 1 = July 3, 2 = July 11, 3 = July 18, 4 = July 24,
5 = August 1, 6 = August 8.
Microcystis
Aphanizomenon
Anabaena flos-aquae
Anabaena circinalis
Coelosphaerium
Gloeotrichia
Inner Bay 3 4 5 6 1 2 4 5 6 2 3 4 5 6 2 3 1 2 3 4 5 6 2 Outer Bay 2 3 4 5 1 2 3 4 5 6 1 2 3 4 5 6 1 2 3 4 5 6 5 6
Toxin testing on net plankton samples was conducted on July 18, August 1 and August 8 using ELISA microcystin assays. All samples had less than 0.16 µg/L microcystin.
15
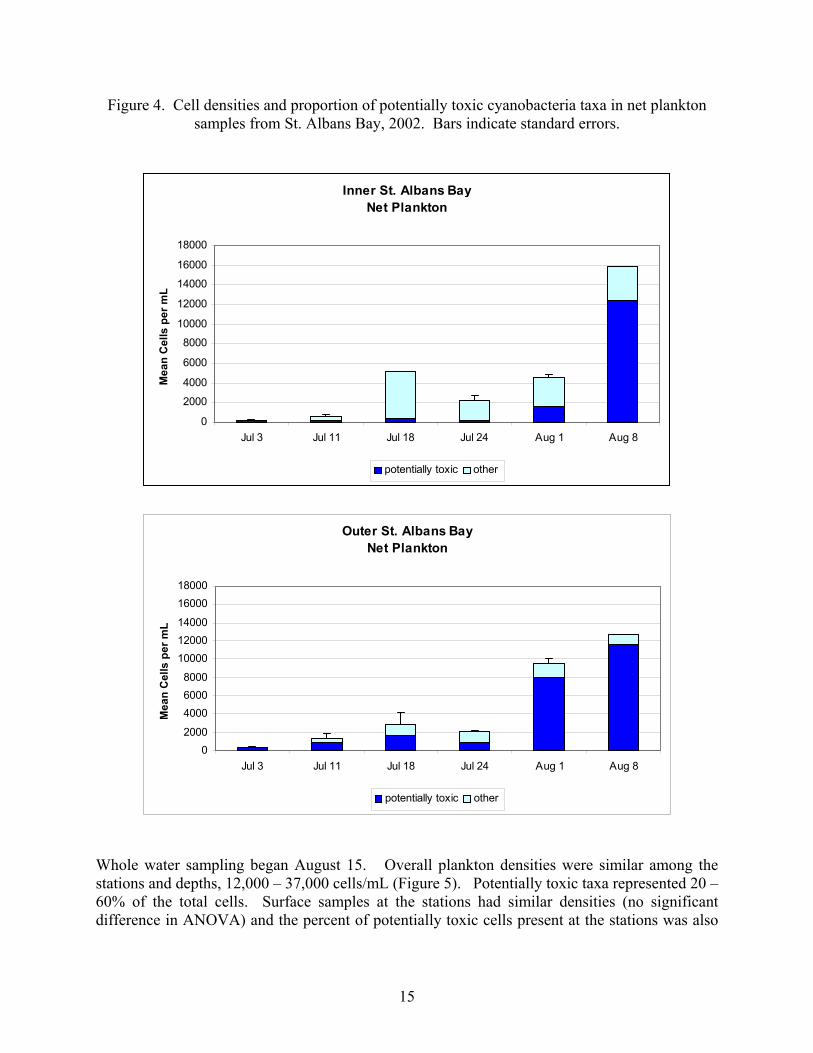
Figure 4. Cell densities and proportion of potentially toxic cyanobacteria taxa in net plankton samples from St. Albans Bay, 2002. Bars indicate standard errors.
Inner St. Albans Bay Net Plankton
0
2000
4000
6000
8000
10000
12000
14000
16000
18000
Jul 3 Jul 11 Jul 18 Jul 24 Aug 1 Aug 8
Mea
n C
ells
per
mL
potentially toxic other
Outer St. Albans Bay Net Plankton
02000
400060008000
100001200014000
1600018000
Jul 3 Jul 11 Jul 18 Jul 24 Aug 1 Aug 8
Mea
n C
ells
per
mL
potentially toxic other
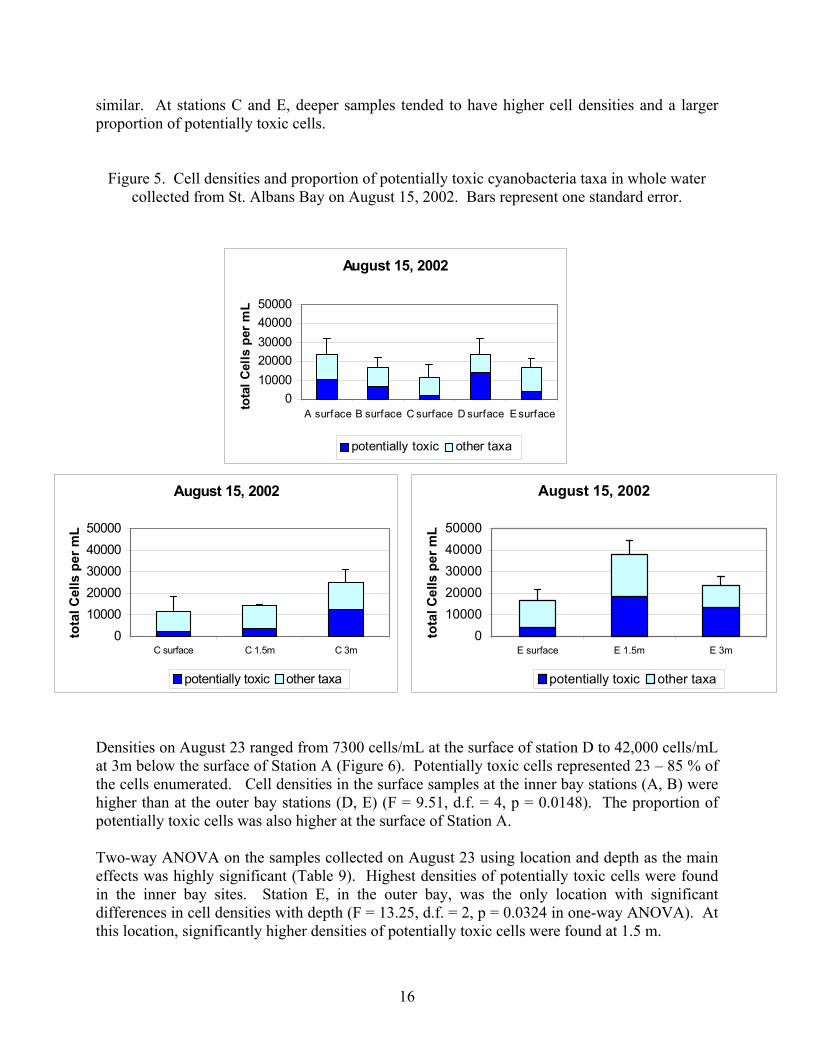
Whole water sampling began August 15. Overall plankton densities were similar among the stations and depths, 12,000 – 37,000 cells/mL (Figure 5). Potentially toxic taxa represented 20 – 60% of the total cells. Surface samples at the stations had similar densities (no significant difference in ANOVA) and the percent of potentially toxic cells present at the stations was also
16
similar. At stations C and E, deeper samples tended to have higher cell densities and a larger proportion of potentially toxic cells.
Figure 5. Cell densities and proportion of potentially toxic cyanobacteria taxa in whole water collected from St. Albans Bay on August 15, 2002. Bars represent one standard error.
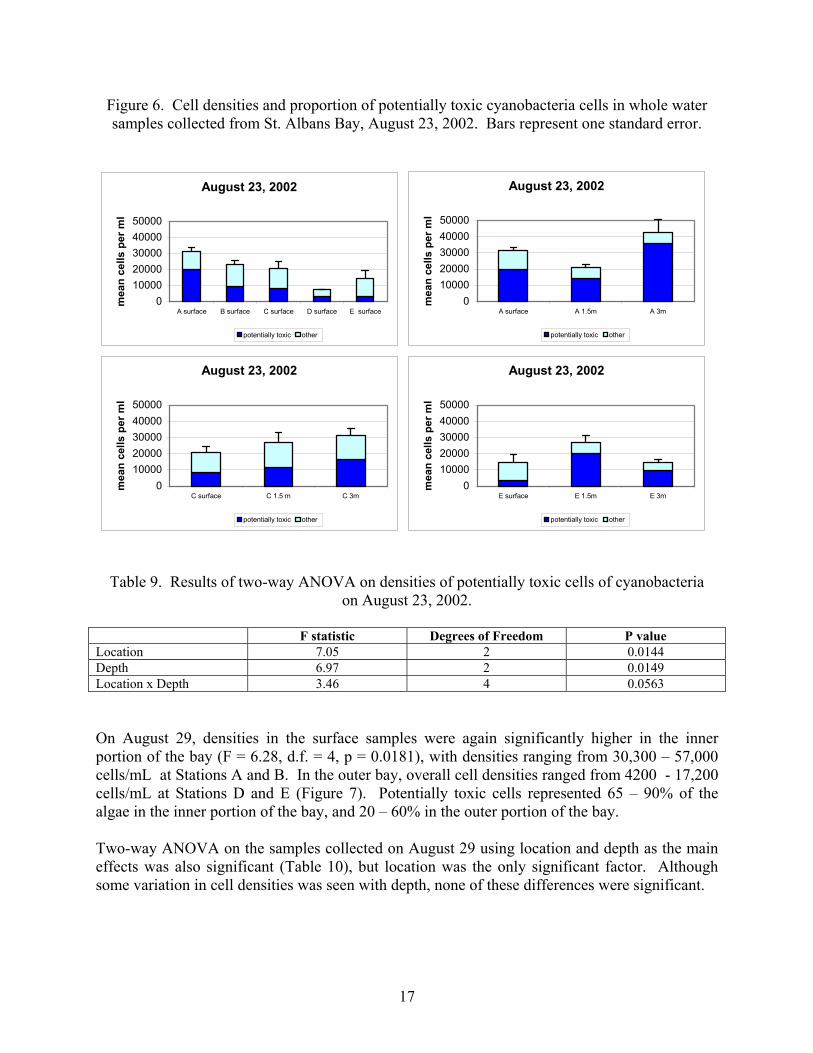
Densities on August 23 ranged from 7300 cells/mL at the surface of station D to 42,000 cells/mL at 3m below the surface of Station A (Figure 6). Potentially toxic cells represented 23 – 85 % of the cells enumerated. Cell densities in the surface samples at the inner bay stations (A, B) were higher than at the outer bay stations (D, E) (F = 9.51, d.f. = 4, p = 0.0148). The proportion of potentially toxic cells was also higher at the surface of Station A. Two-way ANOVA on the samples collected on August 23 using location and depth as the main effects was highly significant (Table 9). Highest densities of potentially toxic cells were found in the inner bay sites. Station E, in the outer bay, was the only location with significant differences in cell densities with depth (F = 13.25, d.f. = 2, p = 0.0324 in one-way ANOVA). At this location, significantly higher densities of potentially toxic cells were found at 1.5 m.
August 15, 2002
01000020000300004000050000
C surface C 1.5m C 3m
tota
l Cel
ls p
er m
L
potentially toxic other taxa
August 15, 2002
01000020000300004000050000
E surface E 1.5m E 3m
tota
l Cel
ls p
er m
L
potentially toxic other taxa
August 15, 2002
01000020000300004000050000
A surface B surface C surface D surface E surface
tota
l Cel
ls p
er m
L
potentially toxic other taxa
17
Figure 6. Cell densities and proportion of potentially toxic cyanobacteria cells in whole water samples collected from St. Albans Bay, August 23, 2002. Bars represent one standard error.
August 23, 2002
01000020000300004000050000
A surface B surface C surface D surface E surface
mea
n ce
lls p
er m
l
potentially toxic other
August 23, 2002
01000020000300004000050000
A surface A 1.5m A 3m
mea
n ce
lls p
er m
l
potentially toxic other
August 23, 2002
01000020000300004000050000
C surface C 1.5 m C 3m
mea
n ce
lls p
er m
l
potentially toxic other
August 23, 2002
01000020000300004000050000
E surface E 1.5m E 3m
mea
n ce
lls p
er m
l
potentially toxic other
Table 9. Results of two-way ANOVA on densities of potentially toxic cells of cyanobacteria on August 23, 2002.
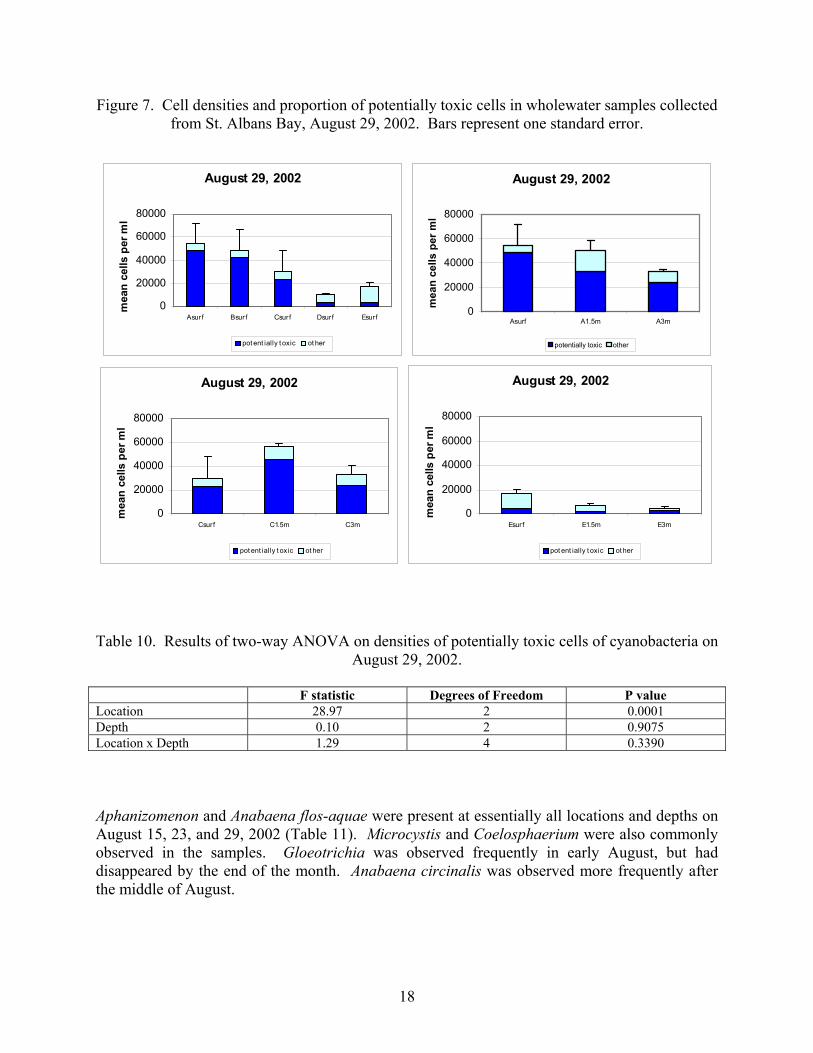
F statistic Degrees of Freedom P value Location 7.05 2 0.0144 Depth 6.97 2 0.0149 Location x Depth 3.46 4 0.0563 On August 29, densities in the surface samples were again significantly higher in the inner portion of the bay (F = 6.28, d.f. = 4, p = 0.0181), with densities ranging from 30,300 – 57,000 cells/mL at Stations A and B. In the outer bay, overall cell densities ranged from 4200 - 17,200 cells/mL at Stations D and E (Figure 7). Potentially toxic cells represented 65 – 90% of the algae in the inner portion of the bay, and 20 – 60% in the outer portion of the bay. Two-way ANOVA on the samples collected on August 29 using location and depth as the main effects was also significant (Table 10), but location was the only significant factor. Although some variation in cell densities was seen with depth, none of these differences were significant.
18
Figure 7. Cell densities and proportion of potentially toxic cells in wholewater samples collected from St. Albans Bay, August 29, 2002. Bars represent one standard error.
August 29, 2002
0
20000
40000
60000
80000
Asurf Bsurf Csurf Dsurf Esurf
mea
n ce
lls p
er m
l
pot ent ially t oxic ot her
August 29, 2002
0
20000
40000
60000
80000
Asurf A1.5m A3m
mea
n ce
lls p
er m
l
potentially toxic other
August 29, 2002
0
20000
40000
60000
80000
Csurf C1.5m C3m
mea
n ce
lls p
er m
l
pot ent ially t oxic ot her
August 29, 2002
0
20000
40000
60000
80000
Esurf E1.5m E3m
mea
n ce
lls p
er m
l
pot ent ially t oxic ot her
Table 10. Results of two-way ANOVA on densities of potentially toxic cells of cyanobacteria on
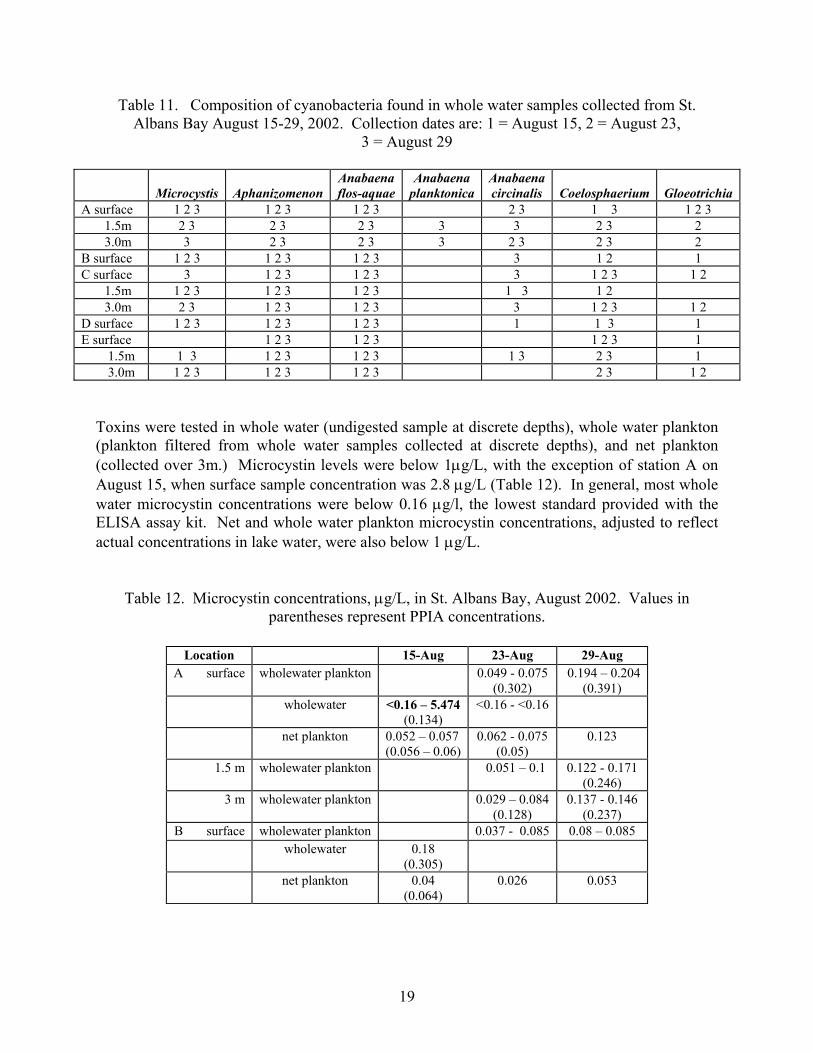
August 29, 2002. F statistic Degrees of Freedom P value Location 28.97 2 0.0001 Depth 0.10 2 0.9075 Location x Depth 1.29 4 0.3390 Aphanizomenon and Anabaena flos-aquae were present at essentially all locations and depths on August 15, 23, and 29, 2002 (Table 11). Microcystis and Coelosphaerium were also commonly observed in the samples. Gloeotrichia was observed frequently in early August, but had disappeared by the end of the month. Anabaena circinalis was observed more frequently after the middle of August.
19
Table 11. Composition of cyanobacteria found in whole water samples collected from St. Albans Bay August 15-29, 2002. Collection dates are: 1 = August 15, 2 = August 23,
3 = August 29
Microcystis
Aphanizomenon
Anabaena flos-aquae
Anabaena planktonica
Anabaena circinalis
Coelosphaerium
Gloeotrichia
A surface 1 2 3 1 2 3 1 2 3 2 3 1 3 1 2 3 1.5m 2 3 2 3 2 3 3 3 2 3 2 3.0m 3 2 3 2 3 3 2 3 2 3 2 B surface 1 2 3 1 2 3 1 2 3 3 1 2 1 C surface 3 1 2 3 1 2 3 3 1 2 3 1 2 1.5m 1 2 3 1 2 3 1 2 3 1 3 1 2 3.0m 2 3 1 2 3 1 2 3 3 1 2 3 1 2 D surface 1 2 3 1 2 3 1 2 3 1 1 3 1 E surface 1 2 3 1 2 3 1 2 3 1 1.5m 1 3 1 2 3 1 2 3 1 3 2 3 1 3.0m 1 2 3 1 2 3 1 2 3 2 3 1 2
Toxins were tested in whole water (undigested sample at discrete depths), whole water plankton (plankton filtered from whole water samples collected at discrete depths), and net plankton (collected over 3m.) Microcystin levels were below 1µg/L, with the exception of station A on August 15, when surface sample concentration was 2.8 µg/L (Table 12). In general, most whole water microcystin concentrations were below 0.16 µg/l, the lowest standard provided with the ELISA assay kit. Net and whole water plankton microcystin concentrations, adjusted to reflect actual concentrations in lake water, were also below 1 µg/L.
Table 12. Microcystin concentrations, µg/L, in St. Albans Bay, August 2002. Values in parentheses represent PPIA concentrations.
Location 15-Aug 23-Aug 29-Aug A surface wholewater plankton 0.049 - 0.075
(0.302) 0.194 – 0.204
(0.391) wholewater <0.16 – 5.474
(0.134) <0.16 - <0.16
net plankton 0.052 – 0.057 (0.056 – 0.06)
0.062 - 0.075 (0.05)
0.123
1.5 m wholewater plankton 0.051 – 0.1 0.122 - 0.171 (0.246)
3 m wholewater plankton 0.029 – 0.084 (0.128)
0.137 - 0.146 (0.237)
B surface wholewater plankton 0.037 - 0.085 0.08 – 0.085 wholewater 0.18
(0.305)
net plankton 0.04 (0.064)
0.026 0.053
20
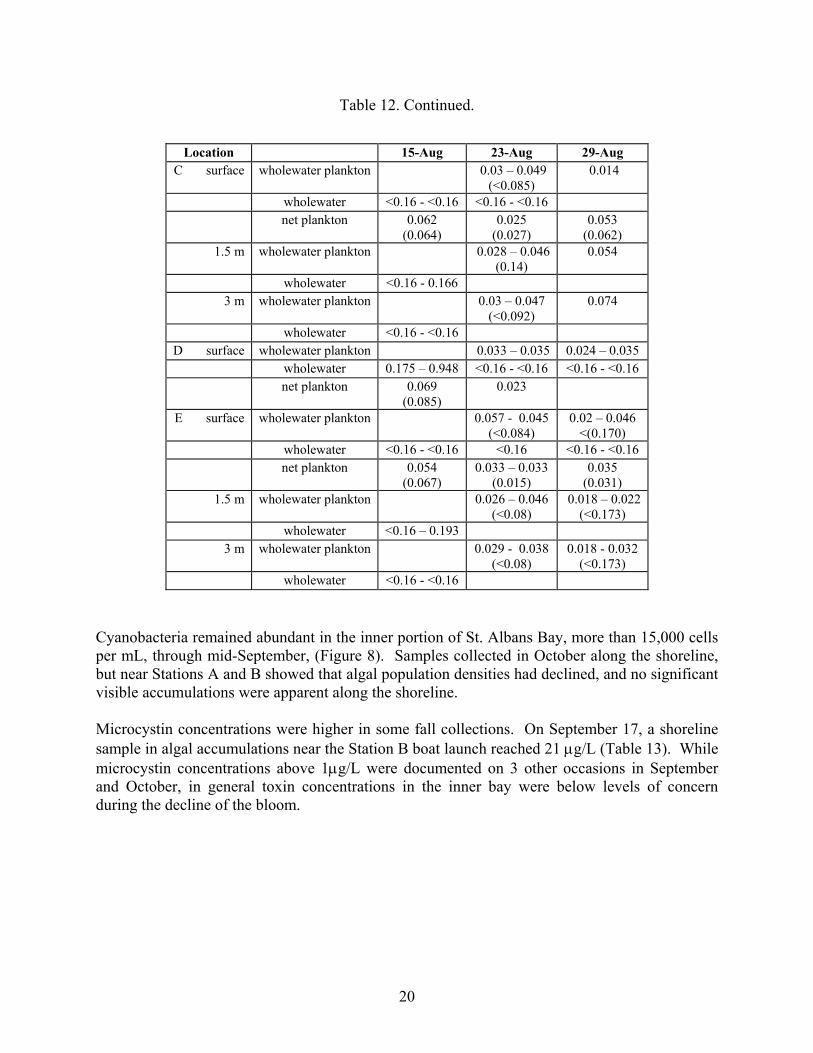
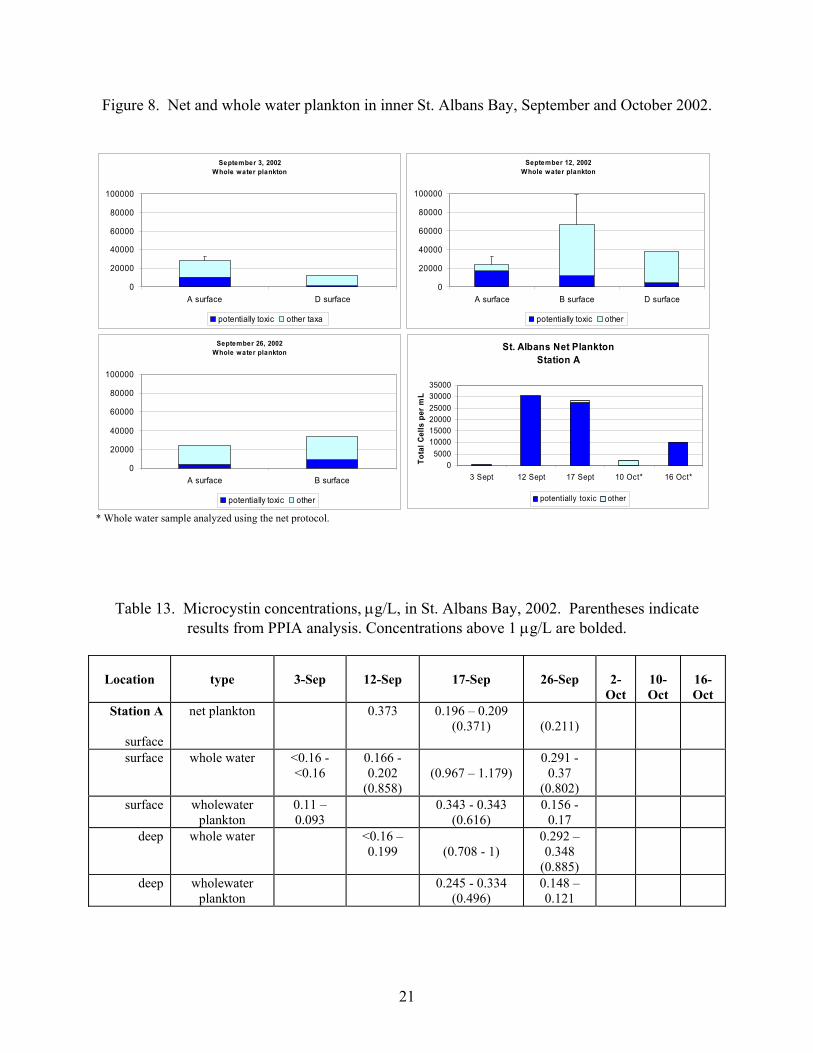
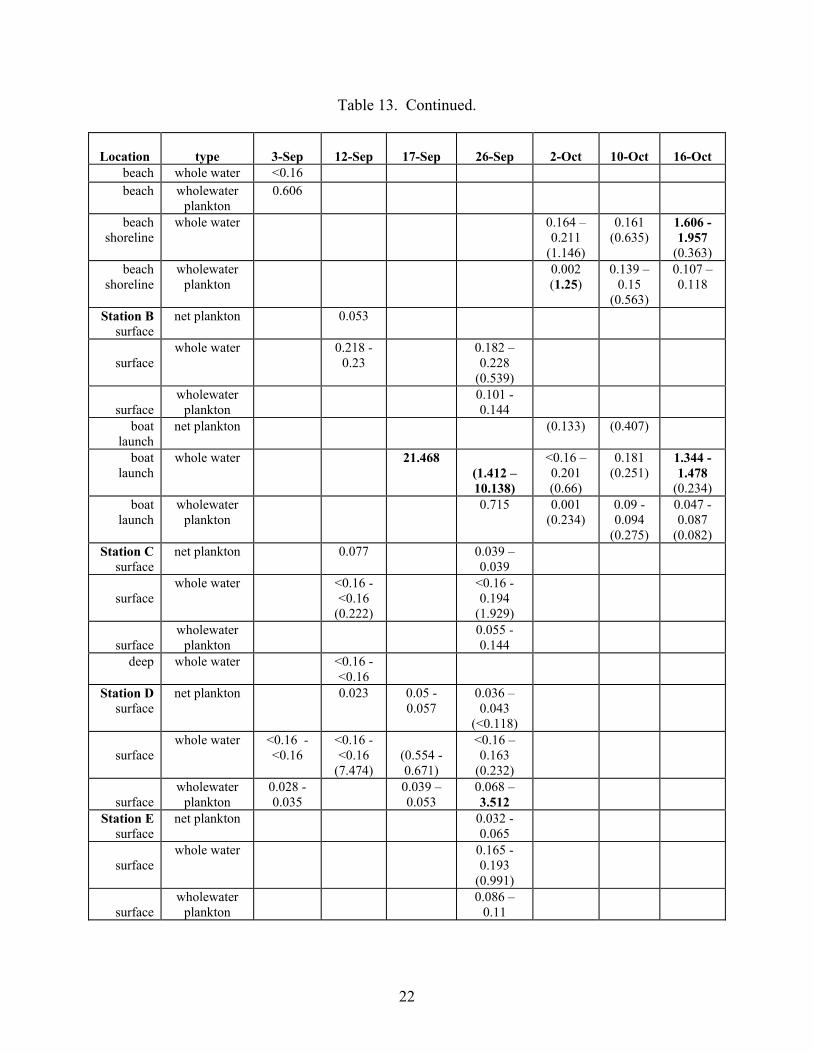
Table 12. Continued. Cyanobacteria remained abundant in the inner portion of St. Albans Bay, more than 15,000 cells per mL, through mid-September, (Figure 8). Samples collected in October along the shoreline, but near Stations A and B showed that algal population densities had declined, and no significant visible accumulations were apparent along the shoreline. Microcystin concentrations were higher in some fall collections. On September 17, a shoreline sample in algal accumulations near the Station B boat launch reached 21 µg/L (Table 13). While microcystin concentrations above 1µg/L were documented on 3 other occasions in September and October, in general toxin concentrations in the inner bay were below levels of concern during the decline of the bloom.
Location 15-Aug 23-Aug 29-Aug C surface wholewater plankton 0.03 – 0.049
(<0.085) 0.014
wholewater <0.16 - <0.16 <0.16 - <0.16 net plankton 0.062
(0.064) 0.025
(0.027) 0.053
(0.062) 1.5 m wholewater plankton 0.028 – 0.046
(0.14) 0.054
wholewater <0.16 - 0.166 3 m wholewater plankton 0.03 – 0.047
(<0.092) 0.074
wholewater <0.16 - <0.16 D surface wholewater plankton 0.033 – 0.035 0.024 – 0.035
wholewater 0.175 – 0.948 <0.16 - <0.16 <0.16 - <0.16 net plankton 0.069
(0.085) 0.023
E surface wholewater plankton 0.057 - 0.045 (<0.084)
0.02 – 0.046 <(0.170)
wholewater <0.16 - <0.16 <0.16 <0.16 - <0.16 net plankton 0.054
(0.067) 0.033 – 0.033
(0.015) 0.035
(0.031) 1.5 m wholewater plankton 0.026 – 0.046
(<0.08) 0.018 – 0.022
(<0.173) wholewater <0.16 – 0.193
3 m wholewater plankton 0.029 - 0.038 (<0.08)
0.018 - 0.032 (<0.173)
wholewater <0.16 - <0.16
21
Figure 8. Net and whole water plankton in inner St. Albans Bay, September and October 2002.
September 3, 2002 Whole water plankton
0
20000
40000
60000
80000
100000
A surface D surface
potentially toxic other taxa
September 12, 2002 Whole water plankton
0
20000
40000
60000
80000
100000
A surface B surface D surface
potentially toxic other September 26, 2002
Whole water plankton
0
20000
40000
60000
80000
100000
A surface B surface
potentially toxic other
St. Albans Net Plankton Station A
05000
100001500020000250003000035000
3 Sept 12 Sept 17 Sept 10 Oct* 16 Oct*
Tota
l Cel
ls p
er m
L
potentially toxic other
* Whole water sample analyzed using the net protocol.
Table 13. Microcystin concentrations, µg/L, in St. Albans Bay, 2002. Parentheses indicate results from PPIA analysis. Concentrations above 1 µg/L are bolded.
Location
type
3-Sep
12-Sep
17-Sep
26-Sep
2-Oct
10-Oct
16-Oct
Station A
surface
net plankton 0.373 0.196 – 0.209 (0.371)
(0.211)
surface whole water <0.16 - <0.16
0.166 - 0.202
(0.858)
(0.967 – 1.179)
0.291 - 0.37
(0.802)
surface wholewater plankton
0.11 – 0.093
0.343 - 0.343 (0.616)
0.156 - 0.17
deep whole water <0.16 – 0.199
(0.708 - 1)
0.292 – 0.348
(0.885)
deep wholewater plankton
0.245 - 0.334 (0.496)
0.148 – 0.121
22
Table 13. Continued.
Location
type
3-Sep
12-Sep
17-Sep
26-Sep
2-Oct
10-Oct
16-Oct
beach whole water <0.16 beach wholewater
plankton 0.606
beach shoreline
whole water 0.164 – 0.211
(1.146)
0.161 (0.635)
1.606 - 1.957
(0.363) beach
shoreline wholewater
plankton 0.002
(1.25) 0.139 –
0.15 (0.563)
0.107 – 0.118
Station B surface
net plankton 0.053
surface
whole water 0.218 - 0.23
0.182 – 0.228
(0.539)
surface
wholewater plankton
0.101 - 0.144
boat launch
net plankton (0.133) (0.407)
boat launch
whole water 21.468 (1.412 – 10.138)
<0.16 – 0.201 (0.66)
0.181 (0.251)
1.344 - 1.478
(0.234) boat
launch wholewater
plankton 0.715 0.001
(0.234) 0.09 - 0.094
(0.275)
0.047 - 0.087
(0.082) Station C
surface net plankton 0.077 0.039 –
0.039
surface
whole water <0.16 - <0.16
(0.222)
<0.16 - 0.194
(1.929)
surface
wholewater plankton
0.055 - 0.144
deep whole water <0.16 - <0.16
Station D surface
net plankton 0.023 0.05 - 0.057
0.036 – 0.043
(<0.118)
surface
whole water <0.16 - <0.16
<0.16 - <0.16
(7.474)
(0.554 - 0.671)
<0.16 – 0.163
(0.232)
surface
wholewater plankton
0.028 - 0.035
0.039 – 0.053
0.068 – 3.512
Station E surface
net plankton 0.032 - 0.065
surface
whole water 0.165 - 0.193
(0.991)
surface
wholewater plankton
0.086 – 0.11
23
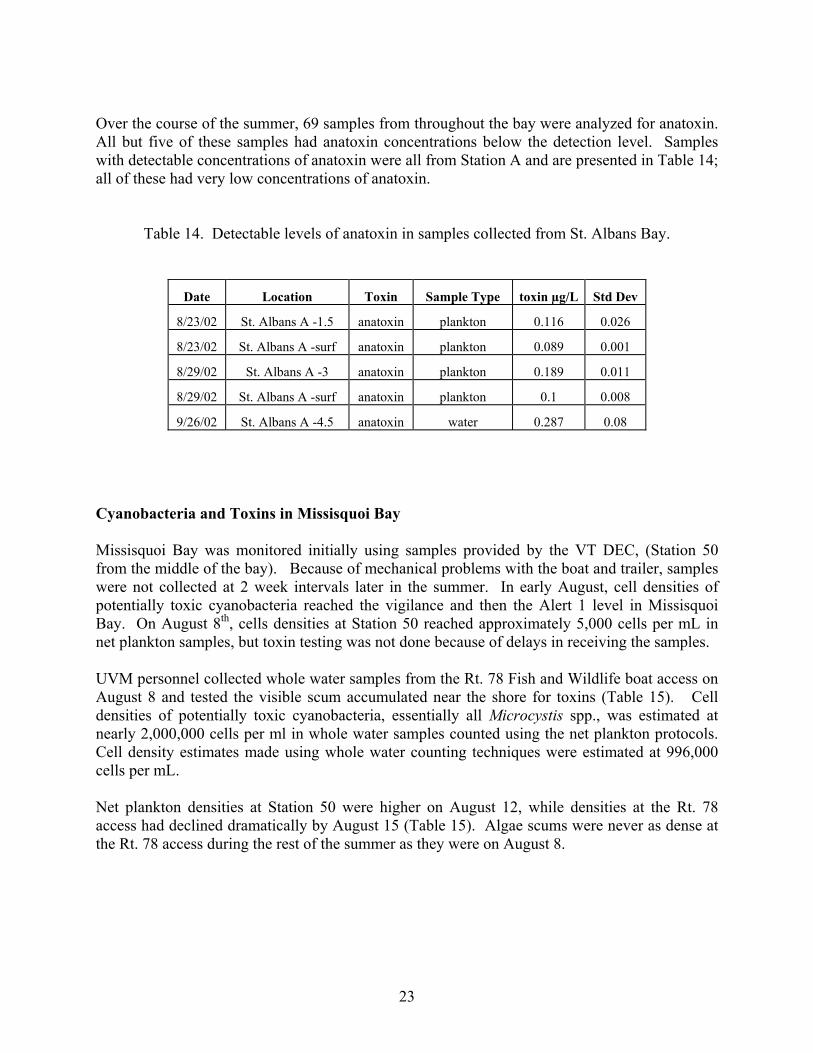
Over the course of the summer, 69 samples from throughout the bay were analyzed for anatoxin. All but five of these samples had anatoxin concentrations below the detection level. Samples with detectable concentrations of anatoxin were all from Station A and are presented in Table 14; all of these had very low concentrations of anatoxin.
Table 14. Detectable levels of anatoxin in samples collected from St. Albans Bay.
Date Location Toxin Sample Type toxin µg/L Std Dev
8/23/02 St. Albans A -1.5 anatoxin plankton 0.116 0.026
8/23/02 St. Albans A -surf anatoxin plankton 0.089 0.001
8/29/02 St. Albans A -3 anatoxin plankton 0.189 0.011
8/29/02 St. Albans A -surf anatoxin plankton 0.1 0.008
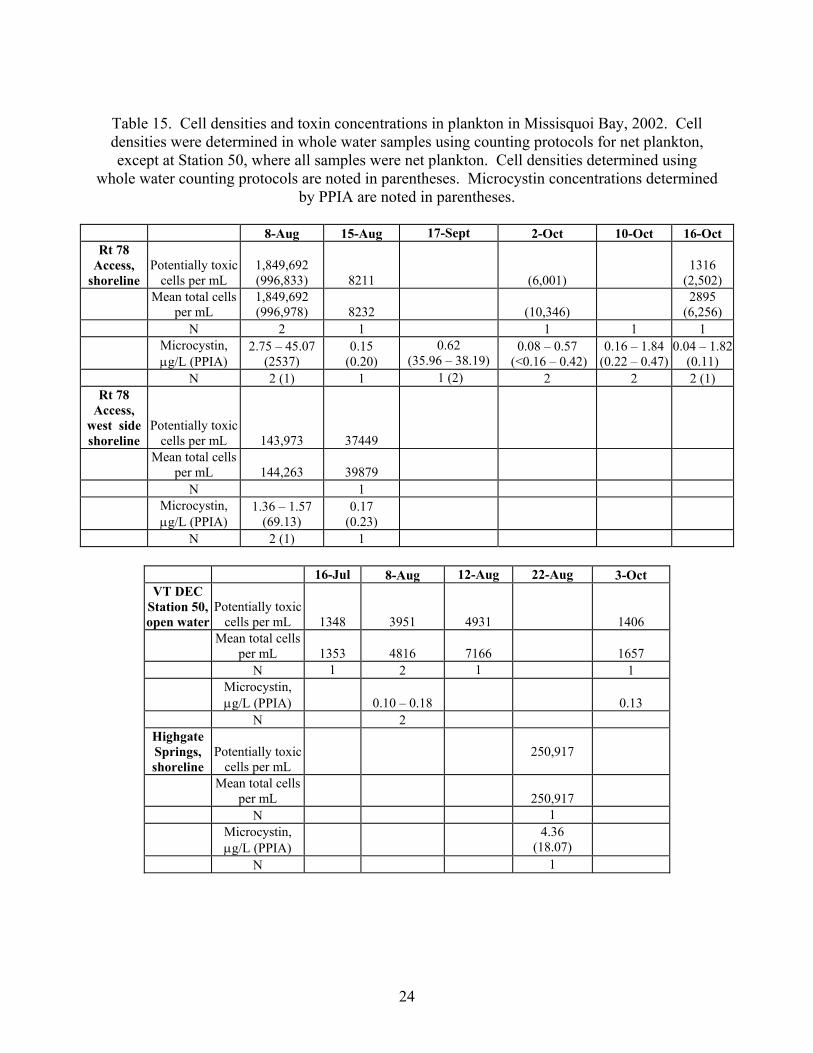
9/26/02 St. Albans A -4.5 anatoxin water 0.287 0.08 Cyanobacteria and Toxins in Missisquoi Bay Missisquoi Bay was monitored initially using samples provided by the VT DEC, (Station 50 from the middle of the bay). Because of mechanical problems with the boat and trailer, samples were not collected at 2 week intervals later in the summer. In early August, cell densities of potentially toxic cyanobacteria reached the vigilance and then the Alert 1 level in Missisquoi Bay. On August 8th, cells densities at Station 50 reached approximately 5,000 cells per mL in net plankton samples, but toxin testing was not done because of delays in receiving the samples. UVM personnel collected whole water samples from the Rt. 78 Fish and Wildlife boat access on August 8 and tested the visible scum accumulated near the shore for toxins (Table 15). Cell densities of potentially toxic cyanobacteria, essentially all Microcystis spp., was estimated at nearly 2,000,000 cells per ml in whole water samples counted using the net plankton protocols. Cell density estimates made using whole water counting techniques were estimated at 996,000 cells per mL. Net plankton densities at Station 50 were higher on August 12, while densities at the Rt. 78 access had declined dramatically by August 15 (Table 15). Algae scums were never as dense at the Rt. 78 access during the rest of the summer as they were on August 8.
24
Table 15. Cell densities and toxin concentrations in plankton in Missisquoi Bay, 2002. Cell densities were determined in whole water samples using counting protocols for net plankton, except at Station 50, where all samples were net plankton. Cell densities determined using
whole water counting protocols are noted in parentheses. Microcystin concentrations determined by PPIA are noted in parentheses.
8-Aug 15-Aug 17-Sept 2-Oct 10-Oct 16-Oct
Rt 78 Access,
shoreline Potentially toxic
cells per mL 1,849,692 (996,833) 8211 (6,001)
1316 (2,502)
Mean total cells
per mL 1,849,692 (996,978) 8232
(10,346)
2895 (6,256)
N 2 1 1 1 1
Microcystin, µg/L (PPIA)
2.75 – 45.07 (2537)
0.15 (0.20)
0.62 (35.96 – 38.19)
0.08 – 0.57 (<0.16 – 0.42)
0.16 – 1.84 (0.22 – 0.47)
0.04 – 1.82 (0.11)
N 2 (1) 1 1 (2) 2 2 2 (1) Rt 78
Access, west side shoreline
Potentially toxic cells per mL 143,973 37449
Mean total cells
per mL 144,263 39879
N 1
Microcystin, µg/L (PPIA)
1.36 – 1.57 (69.13)
0.17 (0.23)
N 2 (1) 1
16-Jul 8-Aug 12-Aug 22-Aug 3-Oct VT DEC
Station 50, open water
Potentially toxic cells per mL
1348 3951
4931
1406
Mean total cells
per mL
1353 4816
7166
1657 N 1 2 1 1
Microcystin, µg/L (PPIA)
0.10 – 0.18
0.13
N 2 Highgate Springs, shoreline
Potentially toxic cells per mL
250,917
Mean total cells
per mL
250,917 N 1
Microcystin, µg/L (PPIA)
4.36 (18.07)
N 1
25
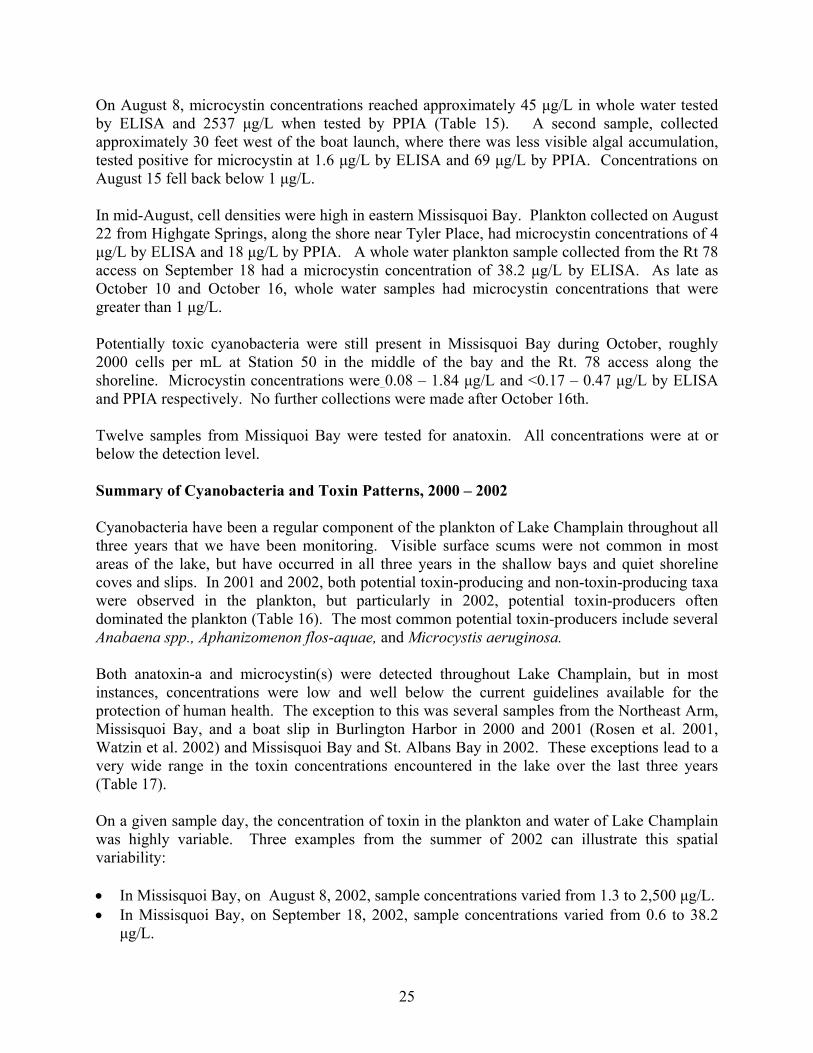
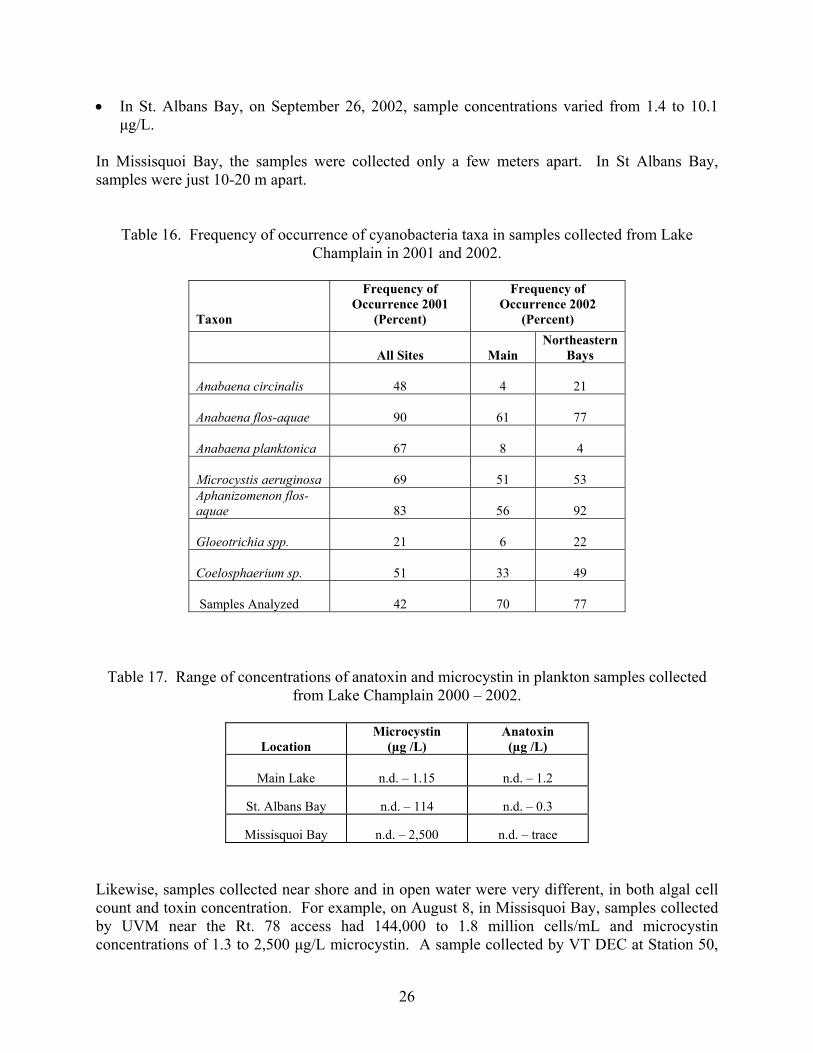
On August 8, microcystin concentrations reached approximately 45 µg/L in whole water tested by ELISA and 2537 µg/L when tested by PPIA (Table 15). A second sample, collected approximately 30 feet west of the boat launch, where there was less visible algal accumulation, tested positive for microcystin at 1.6 µg/L by ELISA and 69 µg/L by PPIA. Concentrations on August 15 fell back below 1 µg/L. In mid-August, cell densities were high in eastern Missisquoi Bay. Plankton collected on August 22 from Highgate Springs, along the shore near Tyler Place, had microcystin concentrations of 4 µg/L by ELISA and 18 µg/L by PPIA. A whole water plankton sample collected from the Rt 78 access on September 18 had a microcystin concentration of 38.2 µg/L by ELISA. As late as October 10 and October 16, whole water samples had microcystin concentrations that were greater than 1 µg/L. Potentially toxic cyanobacteria were still present in Missisquoi Bay during October, roughly 2000 cells per mL at Station 50 in the middle of the bay and the Rt. 78 access along the shoreline. Microcystin concentrations were 0.08 – 1.84 µg/L and <0.17 – 0.47 µg/L by ELISA and PPIA respectively. No further collections were made after October 16th. Twelve samples from Missiquoi Bay were tested for anatoxin. All concentrations were at or below the detection level. Summary of Cyanobacteria and Toxin Patterns, 2000 – 2002 Cyanobacteria have been a regular component of the plankton of Lake Champlain throughout all three years that we have been monitoring. Visible surface scums were not common in most areas of the lake, but have occurred in all three years in the shallow bays and quiet shoreline coves and slips. In 2001 and 2002, both potential toxin-producing and non-toxin-producing taxa were observed in the plankton, but particularly in 2002, potential toxin-producers often dominated the plankton (Table 16). The most common potential toxin-producers include several Anabaena spp., Aphanizomenon flos-aquae, and Microcystis aeruginosa. Both anatoxin-a and microcystin(s) were detected throughout Lake Champlain, but in most instances, concentrations were low and well below the current guidelines available for the protection of human health. The exception to this was several samples from the Northeast Arm, Missisquoi Bay, and a boat slip in Burlington Harbor in 2000 and 2001 (Rosen et al. 2001, Watzin et al. 2002) and Missisquoi Bay and St. Albans Bay in 2002. These exceptions lead to a very wide range in the toxin concentrations encountered in the lake over the last three years (Table 17). On a given sample day, the concentration of toxin in the plankton and water of Lake Champlain was highly variable. Three examples from the summer of 2002 can illustrate this spatial variability: • In Missisquoi Bay, on August 8, 2002, sample concentrations varied from 1.3 to 2,500 µg/L. • In Missisquoi Bay, on September 18, 2002, sample concentrations varied from 0.6 to 38.2
µg/L.
26
• In St. Albans Bay, on September 26, 2002, sample concentrations varied from 1.4 to 10.1 µg/L.
In Missisquoi Bay, the samples were collected only a few meters apart. In St Albans Bay, samples were just 10-20 m apart.
Table 16. Frequency of occurrence of cyanobacteria taxa in samples collected from Lake
Champlain in 2001 and 2002.
Taxon
Frequency of Occurrence 2001
(Percent)
Frequency of Occurrence 2002
(Percent)
All Sites Main Northeastern
Bays
Anabaena circinalis 48 4 21
Anabaena flos-aquae 90 61 77
Anabaena planktonica 67 8 4
Microcystis aeruginosa 69 51 53 Aphanizomenon flos-aquae 83 56 92
Gloeotrichia spp. 21 6 22
Coelosphaerium sp. 51 33 49
Samples Analyzed 42 70 77
Table 17. Range of concentrations of anatoxin and microcystin in plankton samples collected from Lake Champlain 2000 – 2002.
Location Microcystin
(µg /L) Anatoxin
(µg /L)
Main Lake n.d. – 1.15 n.d. – 1.2
St. Albans Bay n.d. – 114 n.d. – 0.3
Missisquoi Bay n.d. – 2,500 n.d. – trace
Likewise, samples collected near shore and in open water were very different, in both algal cell count and toxin concentration. For example, on August 8, in Missisquoi Bay, samples collected by UVM near the Rt. 78 access had 144,000 to 1.8 million cells/mL and microcystin concentrations of 1.3 to 2,500 µg/L microcystin. A sample collected by VT DEC at Station 50,
27
in the middle of the bay had 3,980 cells/mL, and microcystin concentrations of 0.10 – 0.18 µg/L microcystin. We also compared the toxin concentrations measured in different sample matrices, including whole water, which was analyzed without methanol extraction, plankton samples filtered from whole water, and 63 µm plankton net samples, which were extracted with methanol prior to analysis. All comparisons were of pairs of samples that were collected from the same site on the same day. There were no significant differences between sample matrices in paired t-tests, but for most pairs, microcystin concentrations were quite low. Patterns were as follows: • Filtered whole water plankton samples tended to be higher than plankton net samples (11 of
15). • Whole water samples tended to be higher than plankton net samples (4 of 5 pairs above trace
levels). • Whole water samples tended to be higher than filtered plankton samples (11 of 12 pairs
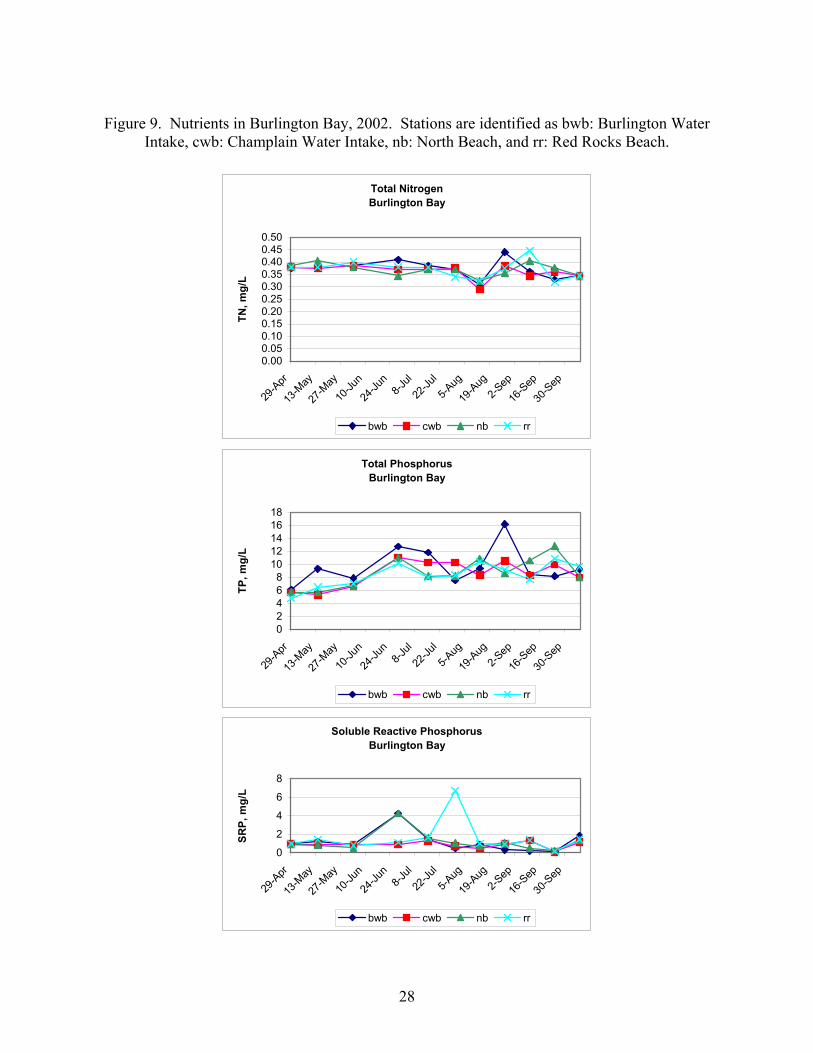
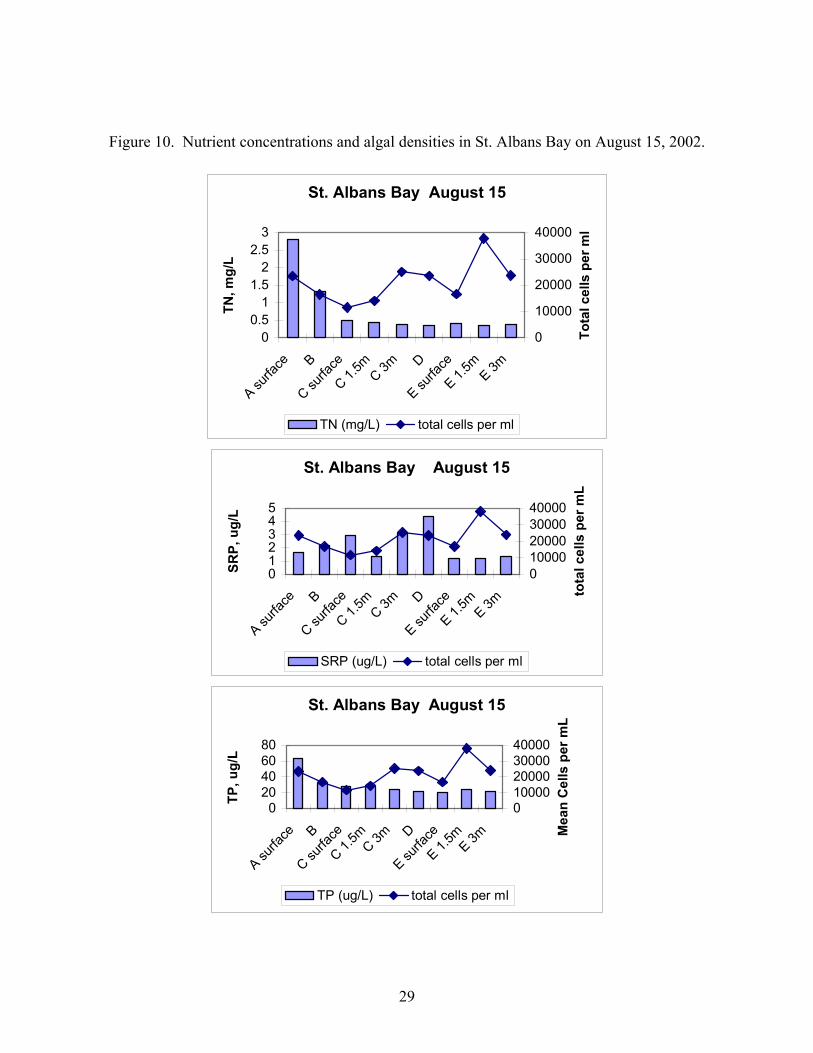
above trace levels). Nutrients Nutrient concentrations in Burlington Bay were generally low and there were few differences in nutrient concentrations among the stations (Figure 9). Soluble reactive phosphorus concentrations were almost twice as high at the Burlington Water – Bay and North Beach sites on June 28, but this was not observed again. The high soluble reactive phosphorus at Red Rocks Beach in early August may be the result of a lab error. Nutrients in St. Albans Bay were significantly higher than those found in Burlington Bay. High nutrient concentrations typically support higher algal densities, and much higher algal densities were observed in St. Albans Bay than in Burlington Bay. Within St. Albans Bay, differences in algal densities did not correspond well with smaller spatial differences in nutrient concentrations, and no clear patterns of association could be discerned. Data from August 15 appears in Figure 10. Similar results were found for August 23 and 29. Training Workshop A training workshop was held at the UVM School of Natural Resources’ Rubenstein Ecosystem Science Laboratory on September 19, 2002. This workshop was designed to introduce public health officials, water supply managers and others to cyanobacteria ecology and identification. Participants received a booklet which discussed cyanobacteria ecology, human and animal health issues related to cyanobacteria, and the proposed tiered alert system. Photographs of bloom situations and cyanobacteria, algal density and toxicity data from 2001, and a list of resources including books, internet sites and laboratory contacts were also included in the booklet. A copy is attached as Appendix E. After presentation of the booklet and a discussion, participants were provided with the opportunity to view live and preserved algal materials in the laboratory. In addition, copies of the booklet have been sent to other individuals who have heard about the workshop from one of the participants.
28
Figure 9. Nutrients in Burlington Bay, 2002. Stations are identified as bwb: Burlington Water
Intake, cwb: Champlain Water Intake, nb: North Beach, and rr: Red Rocks Beach.
Total Nitrogen Burlington Bay
0.000.050.100.150.200.250.300.350.400.450.50
29-A
pr
13-M
ay
27-M
ay
10-Ju
n
24-Ju
n8-J
ul
22-Ju
l
5-Aug
19-A
ug2-S
ep
16-S
ep
30-S
ep
TN, m
g/L
bwb cwb nb rr
Total Phosphorus Burlington Bay
02468
1012141618
29-A
pr
13-M
ay
27-M
ay
10-Ju
n
24-Ju
n8-J
ul
22-Ju
l
5-Aug
19-A
ug2-S
ep
16-S
ep
30-S
ep
TP, m
g/L
bwb cwb nb rr
Soluble Reactive Phosphorus Burlington Bay
0
2
4
6
8
29-A
pr
13-M
ay
27-M
ay
10-Ju
n
24-Ju
n8-J
ul
22-Ju
l
5-Aug
19-A
ug2-S
ep
16-S
ep
30-S
ep
SRP,
mg/
L
bwb cwb nb rr
29
Figure 10. Nutrient concentrations and algal densities in St. Albans Bay on August 15, 2002.
St. Albans Bay August 15
00.5
11.5
22.5
3
A surfa
ce B
C surfa
ce
C 1.5m
C 3mD
E surfa
ce
E 1.5m
E 3m
TN, m
g/L
0
10000
20000
30000
40000
Tota
l cel
ls p
er m
l
TN (mg/L) total cells per ml
St. Albans Bay August 15
012345
A surfa
ce B
C surfa
ce
C 1.5m
C 3mD
E surfa
ce
E 1.5m E 3m
SRP,
ug/
L
010000200003000040000
tota
l cel
ls p
er m
L
SRP (ug/L) total cells per ml
St. Albans Bay August 15
020406080
A surfa
ce B
C surfa
ce
C 1.5m
C 3mD
E surfa
ce
E 1.5m E 3m
TP, u
g/L
010000200003000040000
Mea
n C
ells
per
mL
TP (ug/L) total cells per ml
30
The workshop was attended by 13 people from Vermont and New York agencies including: Vermont Dept. of Environmental Conservation – Water Supply Division Vermont Dept. of Health New York Dept. of Environmental Conservation New York Dept. of Health Burlington VT Dept. of Public Works Burlington VT Dept. of Parks and Recreation Champlain Water District, South Burlington VT Dept. of Health, Clinton County, NY Overall response to the workshop was positive. Many participants had limited knowledge of cyanobacteria and associated toxins, most had not had opportunity to view specimens of these organisms. Many commented that the list of resources and the photographs would be very useful. DISCUSSION AND CONCLUSIONS Patterns of Cyanobacteria and Toxin Distribution in Lake Champlain Cyanobacteria were common in Lake Champlain in 2002, as they have been in previous years. The pattern of high percentages of cyanobacteria in late summer and fall is not new; it was reported in plankton surveys conducted in the late 1970s and the early 1990s (Myer and Gruendling, 1979; Brown et al., 1991; 1992; Shambaugh et al., 1999). It is also a pattern that is consistent with the ecology of these organisms. High densities of cyanobacteria and other algae are known to be correlated with high concentrations of nutrients (Paerl et al. 2001). Burlington has historically had much lower concentrations of phosphorus and nitrogen than St. Albans and Missisquoi Bays (VT DEC 2003). Therefore, it is not surprising to find total plankton densities significantly lower in Burlington Bay than in these two northern bays over the last three years (this report, Rosen et al., 2001, Watzin et al., 2002). Cyanobacteria also prefer warmer water temperatures and tend to form surface blooms or scums only in protected areas, when winds are calm (Dokulil and Teubner, 2000; Paerl et al., 2001). They also have the ability to regulate their position in the water column and will accumulate at the surface when environmental conditions permit. During the summer in Vermont, prevailing winds are generally out of the south (data from the NWS, Colchester reef site, summarized in Appendix F). This would favor algal accumulation at the northern ends of bays and northern shorelines. In St. Albans Bay, highest cyanobacteria densities in 2002 were noted in the northern portion of the inner bay. In Missisquoi Bay, high densities of algae were first noted along the northern shores and shoreline accumulations were documented first by Quebec officials in this area of the bay.
31
In early August, winds were from the north prior to the development of a dense shoreline accumulations at the Rt. 78 access, a southern exposure, on August 8. Wind-induced movement of surface water is a feasible mechanism by which high densities of algae might be transported and concentrated into scum along the shoreline. There, wave action and heat can break down the cells, releasing toxins into the water. In such a situation, toxin levels in both water and plankton samples would be expected to be high because of both the large concentrations of cells and the leakage from damaged cells. Potentially toxic cyanobacteria taxa were noted in all locations sampled by UVM and many of the locations sampled by the VT DEC as part of the long term biomonitoring project. Highest densities of these taxa occurred in St. Albans and Missisquoi Bays. In general, when potentially toxic taxa were documented in the net plankton samples collected from Burlington north to the Canadian border, they represented the majority of the algae present in the sample. Analysis of plankton samples for both microcystin and anatoxin showed that many samples had no detectable toxin or very low concentrations even when potentially toxic taxa were abundant. While microcystin concentrations in whole water and plankton sometimes approached 1 µg/L when plankton densities were high and well distributed in the water column, only samples obtained from visible accumulations at the surface and shoreline of Missisquoi Bay and St. Albans Bay had microcystin concentrations higher than 10 µg/L in water or plankton. Effectiveness of the Prototype Monitoring and Alert Framework The proposed tiered alert system was effective at identifying locations where potentially toxic algal populations were developing in a timely manner. However, we altered the protocol early in the season by collecting samples on a biweekly basis as soon as meteorological conditions favored bloom development. Monthly samples seemed too infrequent to catch the initiation of a bloom. Reliance on net plankton collections for screening purposes offered good sensitivity and provided an efficient tool for identifying potentially toxic cyanobacteria populations. The use of natural units to rapidly and efficiently generate a cell count also proved an effective tool for determining algal density. The trigger of 500 cells to move from Quantitative monitoring to Vigilance, and 2000 cells per mL to move from Vigilance to Alert 1 status seemed a little low. We recommend increasing these levels to 2000 and 4000 cells per mL, respectively. In our samples, toxin concentrations did not reach levels of concern until densities of potentially toxic taxa were significantly higher than 4000 cells per mL, and, therefore, we would not be likely to miss a developing situation by using this density as a trigger to begin toxin testing. At most locations in the lake, cell densities remained well below 2000 cells per mL throughout the summer and toxins were not a concern. The use of chlorophyll a concentrations as a trigger seems unnecessary and redundant. In all cases, the chlorophyll threshold was exceeded very early on, and analysis for chlorophyll a is time consuming and provides little information about the density of potential toxin-producing species of cyanobacteria.
32
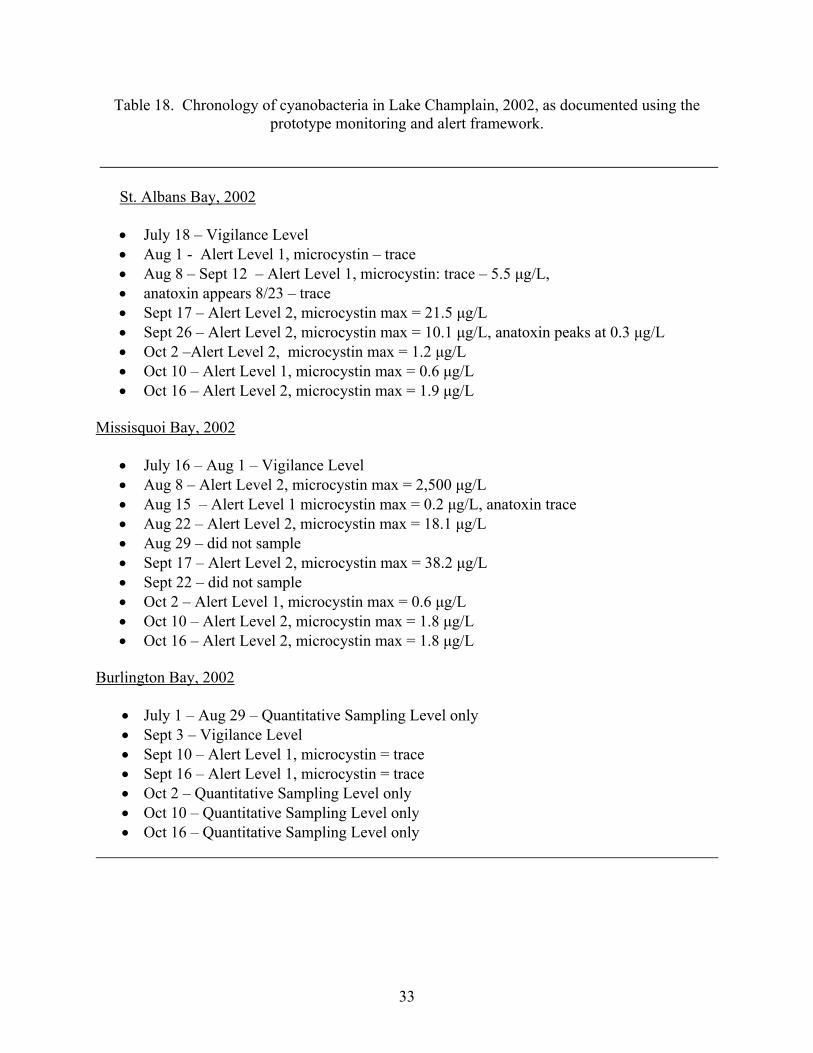
In both St. Albans and Missisquoi Bays, cell counts triggered Vigilance status at least a week prior to reaching the Alert status of greater than 2000 cells per mL (Table 18). This provided health officials with sufficient time to develop notices to advise the public about the high algal densities and precautions for avoiding exposure. In Missisquoi Bay, the bloom developed very rapidly, and microcystin was present at levels exceeding the 1 µg/L advisory level soon after bloom development. In both bays, once Alert level was reached, cell densities remained high for the remainder of the summer and fall (Table 18). In all locations, high cell counts did not always indicate high toxin concentration, but high toxin concentrations were never found when cell counts were low. Therefore, initiating analyses for toxin only after cell densities reach the Alert level trigger seems appropriate. However the threshold for moving forward from Alert Level 1 to 2 could be debated further. The Alert Level 2 trigger of 1 µg/L microcystin was suggested by the World Health Organization based on health data related to chronic exposure to microcystin by consuming contaminated drinking water (WHO 1998, Chorus and Bartrum 1999). Although there are several drinking water plants that draw water from shallow water areas in northern Lake Champlain (Rosen et al. 2001), in 2002, the primary use for the tiered alert system was to alert recreational users of the lake, where an acute exposure concentration may be a more reasonable trigger. However, few data exist on which to estimate an acute response. Furthermore, the extreme spatial variability in samples suggest that when one sample shows a microcystin concentration of 1 µg/L, other nearby locations may be one or two orders of magnitude higher. Because it is impossible to test all locations where algae may be accumulating, and recreationists are likely exposed to a variety of conditions when in the water, prudence may be warranted. In 2002, anatoxin concentrations never exceeded 1 µg/L. In prior years, higher concentrations have been observed and dog deaths from anatoxin exposure have occurred (Rosen, 2001, Watzin et al. 2002). The prototype alert system does not have an anatoxin component because there are still no rapid screening methods for anatoxin. Because anatoxin-producing species such as Anabaena spp. can be common in Lake Champlain, when cell densities of these organisms reach high levels, public health officials must consider this risk as well. The rapid development of the bloom in Missisquoi Bay in 2002 showed the need for frequent interagency communication. Public health officials in Quebec Province closed beaches and water facilities along the northern shores of Missisquoi Bay before most public health officials in Vermont and New York were even aware of the problem. Conflicting public information during the summer also led to confusion among the public. While conveying a greater problem than exists is alarmist and violates the public’s trust, the lack of clear information could also lead to avoidable exposures in problem areas, for both people and their pets.
33
Table 18. Chronology of cyanobacteria in Lake Champlain, 2002, as documented using the prototype monitoring and alert framework.
St. Albans Bay, 2002 • July 18 – Vigilance Level • Aug 1 - Alert Level 1, microcystin – trace • Aug 8 – Sept 12 – Alert Level 1, microcystin: trace – 5.5 µg/L, • anatoxin appears 8/23 – trace • Sept 17 – Alert Level 2, microcystin max = 21.5 µg/L • Sept 26 – Alert Level 2, microcystin max = 10.1 µg/L, anatoxin peaks at 0.3 µg/L • Oct 2 –Alert Level 2, microcystin max = 1.2 µg/L • Oct 10 – Alert Level 1, microcystin max = 0.6 µg/L • Oct 16 – Alert Level 2, microcystin max = 1.9 µg/L
Missisquoi Bay, 2002
• July 16 – Aug 1 – Vigilance Level • Aug 8 – Alert Level 2, microcystin max = 2,500 µg/L • Aug 15 – Alert Level 1 microcystin max = 0.2 µg/L, anatoxin trace • Aug 22 – Alert Level 2, microcystin max = 18.1 µg/L • Aug 29 – did not sample • Sept 17 – Alert Level 2, microcystin max = 38.2 µg/L • Sept 22 – did not sample • Oct 2 – Alert Level 1, microcystin max = 0.6 µg/L • Oct 10 – Alert Level 2, microcystin max = 1.8 µg/L • Oct 16 – Alert Level 2, microcystin max = 1.8 µg/L
Burlington Bay, 2002
• July 1 – Aug 29 – Quantitative Sampling Level only • Sept 3 – Vigilance Level • Sept 10 – Alert Level 1, microcystin = trace • Sept 16 – Alert Level 1, microcystin = trace • Oct 2 – Quantitative Sampling Level only • Oct 10 – Quantitative Sampling Level only • Oct 16 – Quantitative Sampling Level only
34
A system of communication among the agencies would keep all public health officials informed of potential bloom situations. Because weather conditions can greatly affect the distribution and intensity of the bloom in different areas, warning people to avoid visible accumulations of algae, especially shoreline scums, seems appropriate. Because recreationists sometimes travel around the lake, widely publicized advisories, beyond the immediate area of the bloom, also seem wise. Continued evaluation of the tiered alert system should continue in 2003, using the same cell density and toxin concentration alert triggers used in 2002. With additional data collection, it may be possible to further characterize the range of microcystin concentrations that might be expected during bloom conditions in various sections of the lake. Because anatoxin can also be a problem in the lake, testing for the presence of anatoxin must also continue when potential anatoxin-producing cyanobacteria are present. As the database of algal densities and corresponding toxin concentrations continues to be developed, it may be possible to make further recommendations about appropriate warnings, including some guidance about potential anatoxin exposure that might be used in the interim until a rapid assessment method for anatoxin is developed and available. Our data suggest that the highest concentrations of toxin are likely to occur in the dense shoreline accumulations of algae. These areas are also where recreational users of the lake are most likely to be exposed to the toxins. Therefore, it seems important that any monitoring program sample in these shoreline locations, not just out in the open water, where most monitoring programs tend to focus. It also seems important to take replicate samples and to report the range of toxin concentrations encountered. Assessment of environmental factors such as total nitrogen, total phosphorus and soluble reactive phosphorus did not appear to provide insight into bloom development. Assessment of factors such as water temperature, wind direction and intensity, and the amount of sunlight may have more potential to predict bloom development. Effectiveness of the Training Workshop The training session was instructive for those who are actively involved in screening for the development of cyanobacteria populations and those responsible for protecting human health. Because the problem of potentially toxic blooms is still relatively new on Lake Champlain, very few outside of the research community are familiar with methods for monitoring or knowledgeable about cyanobacterial species identification. The feedback from all the individuals at the workshop was positive. Most would like even more information about the algae and the potential human health risks associated with the algal toxins. The usefulness of the tiered alert system will increase with increasing public awareness of cyanobacteria blooms and their potential risks. As educational materials are developed for the public health officials and environmental managers, the need for appropriate educational materials for the general public should also be considered.
35
ACKNOWLEDGMENTS In addition to the funding provided by the Lake Champlain Basin Program, significant funding for this project was provided by the Green Mountain Power Corporation through the Burlington Bay Project. For completeness, simplicity and clarity, all the samples collected and data produced are reported here, regardless of funding source. We gratefully acknowledge field and laboratory assistance provided by Pete Stangel and other staff of the Vermont and New York DEC, Bob Acabbo, Lisa Bowen, Leman Bronson, Dick Furbush, Amy Mahar, Amber Pitt, Jamie Rowder, and Ryan Salem. LITERATURE CITED APHA, 1995. Standard Methods for the Examination of Water and Wastewater. 19th Edition.
American Public Health Association. Washington DC. Brown, E. A. Duchovnay, A. McIntosh, A. Shambaugh, and A. Williams. 1991. 1991 Lake
Champlain Biomonitoring Report. Vermont Water Resources and Lake Studies Center. School of Natural Resources, University of Vermont.
Brown, E. A. Duchovnay, A. McIntosh, A. Shambaugh, and A. Williams. 1992. 1992 Lake
Champlain Biomonitoring Report. Vermont Water Resources and Lake Studies Center. School of Natural Resources, University of Vermont.
Carmichael, W. W. and J. An. 1999. Using an enzyme linked immunosorbent assay (ELISA)
and a protein phosphatase inhibition assay (PP1A) for the detection of microcystins and nodularins. Nat. Toxins. 7: 377-385.
Chorus, I., and J. Bartram. 1999. Toxic Cyanobacteria in Water: A guide to their public health
consequences, monitoring and management. E&FN Spon, New York, NY, 416 pp. Dokulil, M. T., and K. Teubner. 2000. Cyanobacterial dominance in lakes. Hydrobiologia.
438:1-12. James, K.J., Sherlock, I.R., Stack, M.A. 1997. Anatoxin-a in Irish freshwater and Cyanobacteria,
determined using a new fluorometric liquid chromatographic method. Toxicon 35:963-971.
Metcalf, J.S., P Hyenstrand, K.A. Beatie, and G.A. Codd. 2000. Effects of physiocochemical variables and cyanobacterial extracts on the immunoassay of microcystin-LR by two ELISA kits. J. Appl. Microbio. 89: 532-538.
Paerl, H. W., R. S. Fulton, P. H. Moisander, and J. Dyble. 2001. Harmful Freshwater Algal Blooms, with an emphasis on cyanobacteria. The Scientific World. 1:76-113.
Rosen, B. H., A. Shambaugh, M. Watzin, G. Boyer, F. Smith, L. Ferber, C. Eliopoulos, and P.
Stangel. 2001. Evaluation of Potential Blue-green Algal Toxins in Lake Champlain. Technical report prepared for Lake Champlain Basin Program, July 2001.
36
SAS Institute Inc. 1988. SAS/STATTM User’s Guide, Release 6.03. Cary, North Carolina, SAS
Institute Inc. Shambaugh, A., A. Duchovnay, and A. McIntosh. 1999. A Survey of Lake Champlain Plankton.
In: "Lake Champlain in Transition: From Research toward Restoration" T. O. Manley, and P. L. Manley, Eds., Amer. Geophys. Union, Wash. DC., pp. 323-340.
Vermont Department of Environmental Conservation. 2003. Long-term Biomonitoring Data Set.
Available on the web at http://www.lcbp.org/wtrqual.htm. Watzin, M.C., A.L. Shambaugh, E.K. Brines, and G.L. Boyer. 2002. Monitoring and evaluation
of Cyanobacteria in Burlington Bay, Lake Champlain: Summer 2001. Technical report prepared for Lake Champlain Basin Program, July 2002.
World Health Organization. 1998. Guidelines for Drinking Water Quality. 2nd ed. Addendum to
Volume 2, Health Criteria and Other Supporting Information. World Health Organization, Geneva.
Related Documents