www.dtz.com 1 Money into Property Europe 2012 Forced deleveraging next 25 April 2012 Contents Introduction 2 Section 1 – Sizing of the market 3 Section 2 – Current sentiment 10 Section 3 – Our key views 14 Appendix 18 Authors Magali Marton Head of CEMEA Research +33 1 49 64 49 54 [email protected] Tony McGough Global Head of Forecasting & Strategy Research +44 (0)20 3296 2314 [email protected] Hans Vrensen Global Head of Research +44 (0)20 3296 2159 [email protected] Despite ongoing economic and political turmoil, the European commercial real estate market has shown resilience in 2011 with 5% growth in invested stock, measured in local currency. o Despite this growth, there were sharp contrasts in trends; UK invested stock levels shrank (-1% in local currency) whilst the Continent showed a wide range of growth rates, from -6% for the Baltic states to +19% across the CEE countries. o Surprisingly, European debt continued its increase in 2011. But, because equity growth was more robust, some deleveraging was still accomplished over the year. At 58%, the European loan to value ratio is only modestly down from its 62% peak in 2009 Investment transaction volume growth in Europe slowed down in 2011 (+9%). Investors‟ appetite has focused on the mature markets in Europe (UK, Germany and France). However, relative to stock size, the Nordics and CEE markets were the most liquid last year. Our global investors‟ and lenders‟ surveys show that market players are generally less optimistic compared to one year ago; but sentiment in Europe is much less positive than in the other regions. o Lenders expect less new lending and tighter conditions, with a further decline in existing loan performance. Investors expect less net investment activity and fear a decline in bank lending. o New European banking regulations are not helping matters as we expect them to force more deleveraging. This forced deleveraging will increase the existing debt funding gap across key European markets. However, increased activity from non-bank lenders is expected to bridge the gap, in part. Uncertainty regarding the current outlook has triggered a return of risk aversion. To deal with this, we consider alternative economic scenarios. Our base case assumes a slow and steady recovery. The downside is best represented by a eurozone break-up scenario. o In the base case, European invested stock is expected to grow but at a moderate pace of 2% in 2012 and 4% in 2013. However, in the downside scenario, invested stock is projected to decline by -14% in 2012 and -4% in 2013. o Investment volumes are projected to register an 11% decline in 2012 under the base case. o We continue to see many attractive investment opportunities in the base case, based on our DTZ Fair Value Index TM . But, in the downside scenario, eurozone markets suffer significantly.

Welcome message from author
This document is posted to help you gain knowledge. Please leave a comment to let me know what you think about it! Share it to your friends and learn new things together.
Transcript
www.dtz.com
1
1
Money into Property Europe 2012
Forced deleveraging next
25 April 2012
Contents
Introduction 2
Section 1 – Sizing of the market 3
Section 2 – Current sentiment 10
Section 3 – Our key views 14
Appendix 18
Authors
Magali Marton Head of CEMEA Research +33 1 49 64 49 54 [email protected]
Tony McGough
Global Head of Forecasting & Strategy Research +44 (0)20 3296 2314 [email protected] Hans Vrensen Global Head of Research +44 (0)20 3296 2159 [email protected]
Despite ongoing economic and political turmoil, the European commercial real estate market has shown resilience in 2011 with 5% growth in invested stock, measured in local currency.
o Despite this growth, there were sharp contrasts in trends; UK invested stock levels shrank (-1% in local currency) whilst the Continent showed a wide range of growth rates, from -6% for the Baltic states to +19% across the CEE countries.
o Surprisingly, European debt continued its increase in 2011. But, because equity growth was more robust, some deleveraging was still accomplished over the year. At 58%, the European loan to value ratio is only modestly down from its 62% peak in 2009
Investment transaction volume growth in Europe slowed down in 2011 (+9%). Investors‟ appetite has focused on the mature markets in Europe (UK, Germany and France). However, relative to stock size, the Nordics and CEE markets were the most liquid last year.
Our global investors‟ and lenders‟ surveys show that market players are generally less optimistic compared to one year ago; but sentiment in Europe is much less positive than in the other regions.
o Lenders expect less new lending and tighter conditions, with a further decline in existing loan performance. Investors expect less net investment activity and fear a decline in bank lending.
o New European banking regulations are not helping matters as we expect them to force more deleveraging. This forced deleveraging will increase the existing debt funding gap across key European markets. However, increased activity from non-bank lenders is expected to bridge the gap, in part.
Uncertainty regarding the current outlook has triggered a return of risk aversion. To deal with this, we consider alternative economic scenarios. Our base case assumes a slow and steady recovery. The downside is best represented by a eurozone break-up scenario.
o In the base case, European invested stock is expected to grow but at a moderate pace of 2% in 2012 and 4% in 2013. However, in the downside scenario, invested stock is projected to decline by -14% in 2012 and -4% in 2013.
o Investment volumes are projected to register an 11% decline in 2012 under the base case.
o We continue to see many attractive investment opportunities in the base case, based on our DTZ Fair Value Index
TM. But, in the
downside scenario, eurozone markets suffer significantly.
Money into Property Europe 2012
www.dtz.com
2
2
Introduction
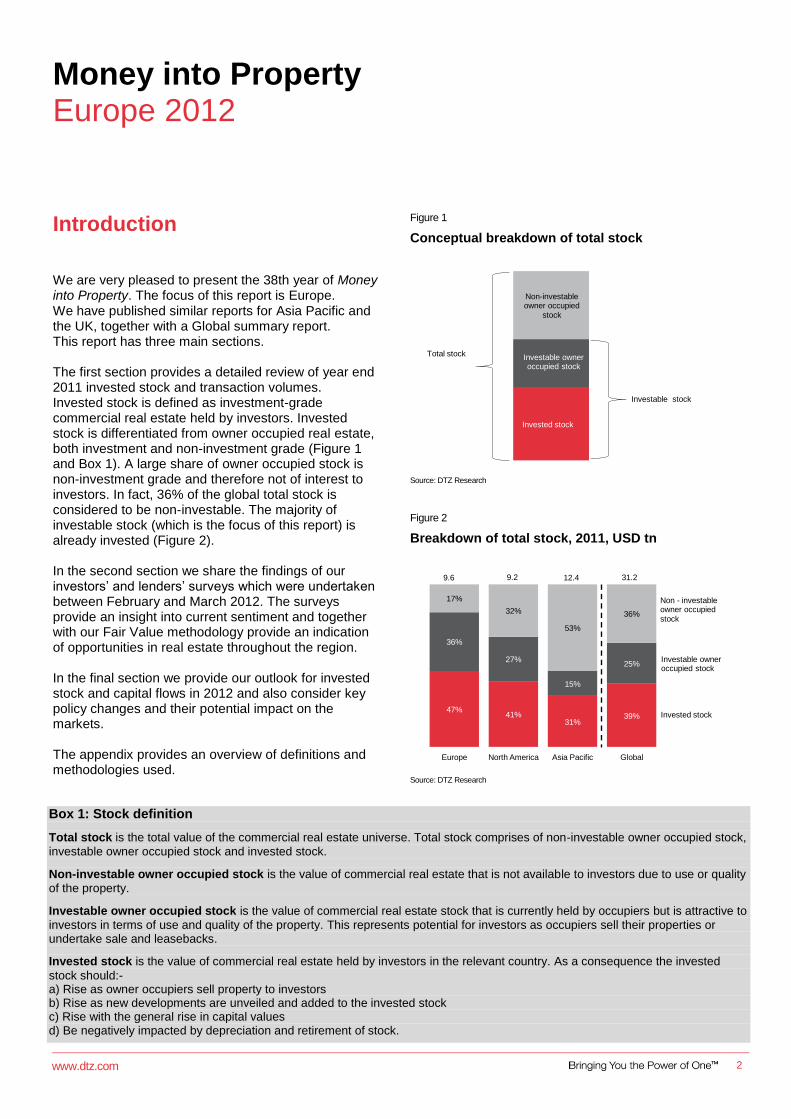
We are very pleased to present the 38th year of Money into Property. The focus of this report is Europe. We have published similar reports for Asia Pacific and the UK, together with a Global summary report. This report has three main sections. The first section provides a detailed review of year end 2011 invested stock and transaction volumes. Invested stock is defined as investment-grade commercial real estate held by investors. Invested stock is differentiated from owner occupied real estate, both investment and non-investment grade (Figure 1 and Box 1). A large share of owner occupied stock is non-investment grade and therefore not of interest to investors. In fact, 36% of the global total stock is considered to be non-investable. The majority of investable stock (which is the focus of this report) is already invested (Figure 2). In the second section we share the findings of our investors‟ and lenders‟ surveys which were undertaken between February and March 2012. The surveys provide an insight into current sentiment and together with our Fair Value methodology provide an indication of opportunities in real estate throughout the region. In the final section we provide our outlook for invested stock and capital flows in 2012 and also consider key policy changes and their potential impact on the markets. The appendix provides an overview of definitions and methodologies used.
Figure 1
Conceptual breakdown of total stock
Invested stock
Investable owner occupied stock
Non-investable owner occupied
stock
Investable stock
Total stock
Source: DTZ Research
Figure 2
Breakdown of total stock, 2011, USD tn
47%41%
31%39%
36%
27%
15%
25%
17%
32%
53%
36%
Europe North America Asia Pacific Global
9.6 9.2 12.4 31.2
Invested stock
Investable owner occupied stock
Non - investableowner occupied stock
Source: DTZ Research
Box 1: Stock definition
Total stock is the total value of the commercial real estate universe. Total stock comprises of non-investable owner occupied stock,
investable owner occupied stock and invested stock.
Non-investable owner occupied stock is the value of commercial real estate that is not available to investors due to use or quality
of the property.
Investable owner occupied stock is the value of commercial real estate stock that is currently held by occupiers but is attractive to
investors in terms of use and quality of the property. This represents potential for investors as occupiers sell their properties or undertake sale and leasebacks.
Invested stock is the value of commercial real estate held by investors in the relevant country. As a consequence the invested
stock should:- a) Rise as owner occupiers sell property to investors b) Rise as new developments are unveiled and added to the invested stock c) Rise with the general rise in capital values d) Be negatively impacted by depreciation and retirement of stock.
.
Money into Property Europe 2012
www.dtz.com
3
Section 1 – Sizing of the market
Invested stock trends
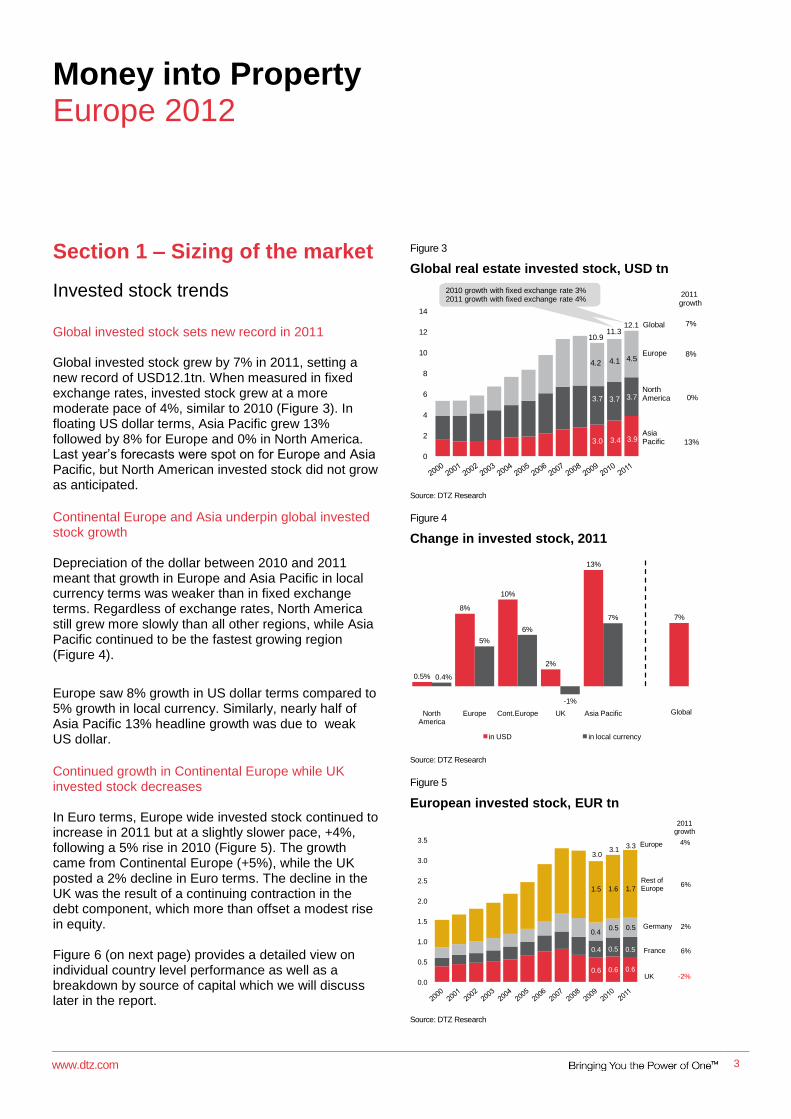
Global invested stock sets new record in 2011 Global invested stock grew by 7% in 2011, setting a new record of USD12.1tn. When measured in fixed exchange rates, invested stock grew at a more moderate pace of 4%, similar to 2010 (Figure 3). In floating US dollar terms, Asia Pacific grew 13% followed by 8% for Europe and 0% in North America. Last year‟s forecasts were spot on for Europe and Asia Pacific, but North American invested stock did not grow as anticipated.
Continental Europe and Asia underpin global invested stock growth Depreciation of the dollar between 2010 and 2011 meant that growth in Europe and Asia Pacific in local currency terms was weaker than in fixed exchange terms. Regardless of exchange rates, North America still grew more slowly than all other regions, while Asia Pacific continued to be the fastest growing region (Figure 4).
Europe saw 8% growth in US dollar terms compared to 5% growth in local currency. Similarly, nearly half of Asia Pacific 13% headline growth was due to weak US dollar.
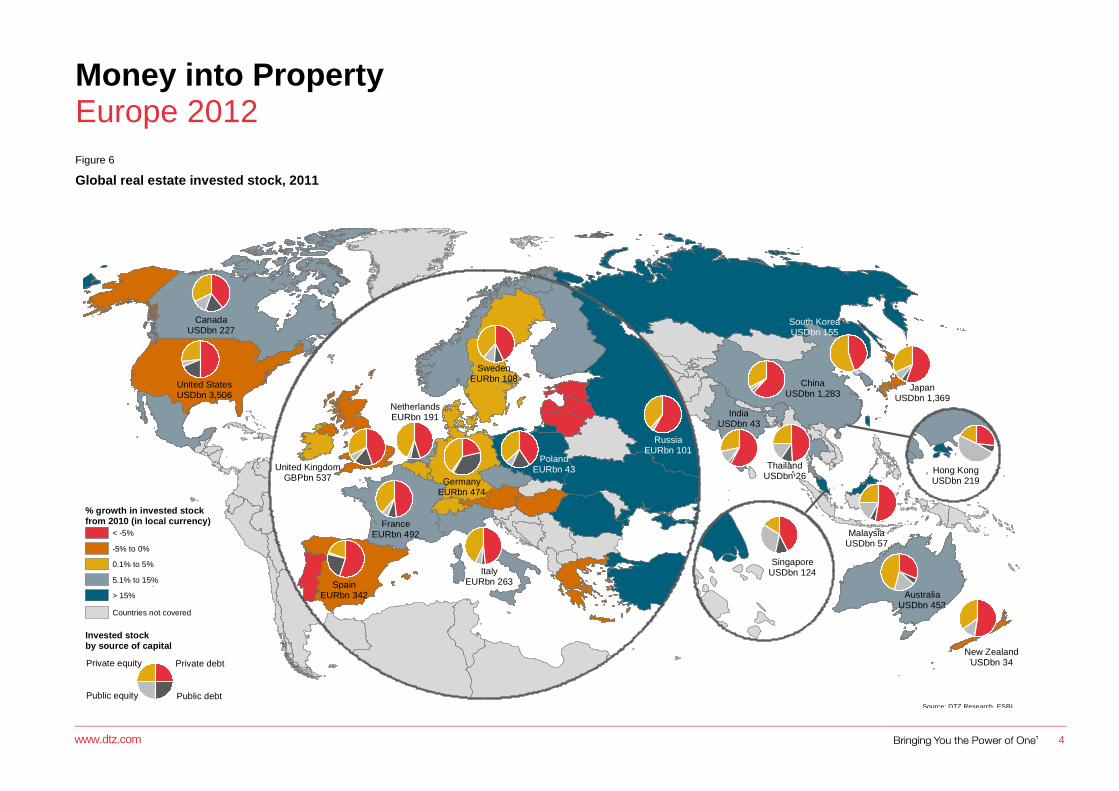
Continued growth in Continental Europe while UK invested stock decreases In Euro terms, Europe wide invested stock continued to increase in 2011 but at a slightly slower pace, +4%, following a 5% rise in 2010 (Figure 5). The growth came from Continental Europe (+5%), while the UK posted a 2% decline in Euro terms. The decline in the UK was the result of a continuing contraction in the debt component, which more than offset a modest rise in equity. Figure 6 (on next page) provides a detailed view on individual country level performance as well as a breakdown by source of capital which we will discuss later in the report.
Figure 3
Global real estate invested stock, USD tn
3.0 3.4 3.9
3.7 3.7 3.7
4.2 4.1 4.5
0
2
4
6
8
10
12
14
0%
13%
2010 growth with fixed exchange rate 3%2011 growth with fixed exchange rate 4%
Global
8%
2011growth
Europe
North America
Asia Pacific
7%
10.9
12.111.3
Source: DTZ Research
Figure 4
Change in invested stock, 2011
0.5%
8%
10%
2%
13%
7%
0.4%
5%
6%
-1%
7%
North America
Europe Cont.Europe UK Asia Pacific Global
in USD in local currency
Global
Source: DTZ Research
Figure 5
European invested stock, EUR tn
0.6 0.6 0.6
0.4 0.5 0.5
0.40.5 0.5
1.5 1.6 1.7
3.0 3.1
3.3
0.0
0.5
1.0
1.5
2.0
2.5
3.0
3.5
Germany
UK
2011growth
6%
-2%
Rest ofEurope
France
2%
6%
Europe 4%
Source: DTZ Research
Money into Property Europe 2012
www.dtz.com
4
Source: DTZ Research
SingaporeUSDbn 124
Hong KongUSDbn 219
ChinaUSDbn 1,283
CanadaUSDbn 227
AustraliaUSDbn 453
United StatesUSDbn 3,506
IndiaUSDbn 43
JapanUSDbn 1,369
South KoreaUSDbn 155
ThailandUSDbn 26
MalaysiaUSDbn 57
New ZealandUSDbn 34
SpainEURbn 342
SwedenEURbn 108
FranceEURbn 492
GermanyEURbn 474
United KingdomGBPbn 537
ItalyEURbn 263
PolandEURbn 43
RussiaEURbn 101
NetherlandsEURbn 191
Source: DTZ Research, ESRI
% growth in invested stockfrom 2010 (in local currency)
< -5%
-5% to 0%
0.1% to 5%
5.1% to 15%
> 15%
Countries not covered
Guangzhou
Invested stockby source of capital
Private debtPrivate equity
Public debtPublic equity
Figure 6
Global real estate invested stock, 2011

Money into Property Europe 2012
www.dtz.com 5
5
Growth slows across main markets, except for CEE and Nordics Invested stock growth spread across Europe in 2011, with a large majority of countries showing rises (Figure 7). The eurozone debt crisis has impacted heavily on real estate, and the European market appeared more fragmented than ever before. There are sharp contrasts in trends; the UK‟s invested stock shrank (-1% in local currency) whilst the Continent showed a wide range of growth, from -6% in the Baltic states to +19% in the CEE.
The CEE region was boosted by strong capital value growth in Poland, resulting in invested stock growth of 19%. The Nordics have continued to outperform the regional average and posted a 7% increase in invested stock in 2011, following a 5% increase in 2010. By contrast, lower growth was registered in the main European markets such as Germany, with a modest 2% increase in 2011. Growth also halved in France to 6% from 11% in 2010.
France overtakes Germany to become second largest European market European real estate invested stock remains dominated by the UK, Germany and France, which account for 50% of the total (Figure 8). Within Europe, the UK is the only market to currently have an invested stock above EUR600bn. Germany was overtaken by France as the second largest commercial real estate market in Europe as growth in the later was triple that in the former.
Figure 7
Change in invested stock, local currency
19%
7% 6%
2% 2%
-1%
-6%
5%
-2%
5%
11%
4%
-7%
0.4%
-6%
3%
CEE Nordics France Germany PIIGS UK Baltic states
Europe
2011 2010
Source: DTZ Research
Figure 8
Invested stock, EUR bn
0 200 400 600
Baltic states
CEE
Netherlands
Italy
Nordics
Spain
Germany
France
United Kingdom
2011 2010
Source: DTZ Research
Money into Property Europe 2012
www.dtz.com
6
Sources of capital
Global debt returns to growth, but equity still stronger
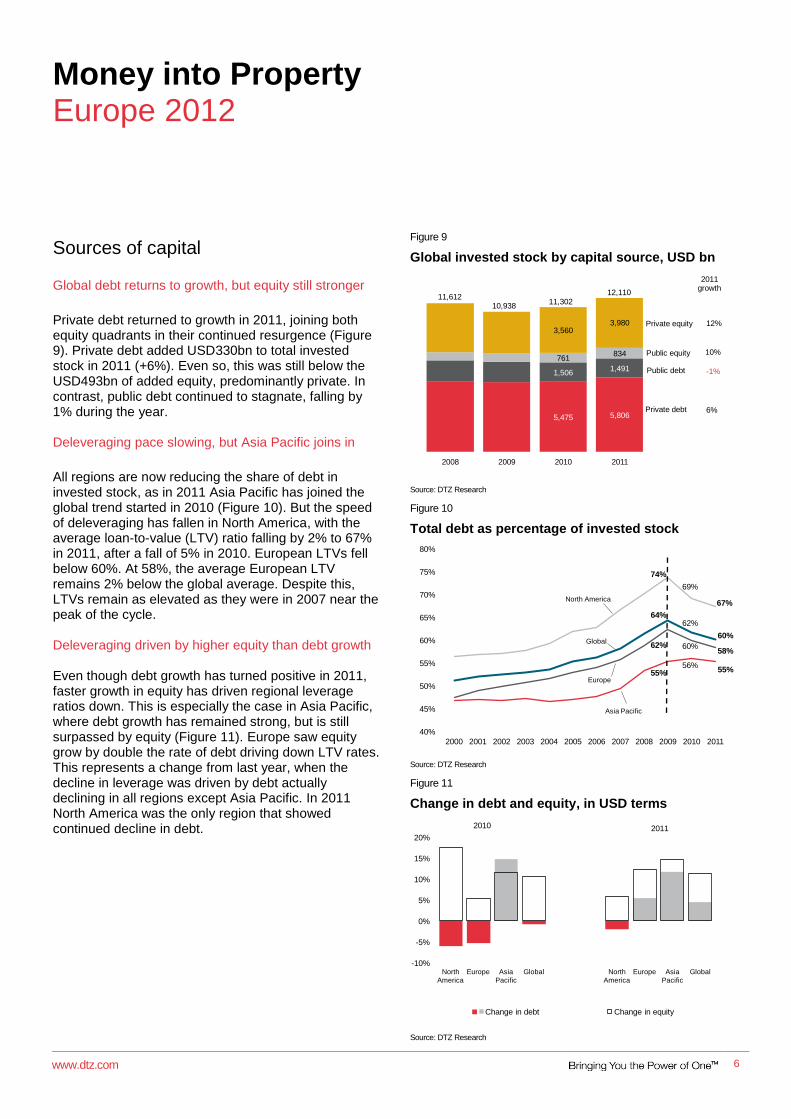
Private debt returned to growth in 2011, joining both equity quadrants in their continued resurgence (Figure 9). Private debt added USD330bn to total invested stock in 2011 (+6%). Even so, this was still below the USD493bn of added equity, predominantly private. In contrast, public debt continued to stagnate, falling by 1% during the year. Deleveraging pace slowing, but Asia Pacific joins in
All regions are now reducing the share of debt in invested stock, as in 2011 Asia Pacific has joined the global trend started in 2010 (Figure 10). But the speed of deleveraging has fallen in North America, with the average loan-to-value (LTV) ratio falling by 2% to 67% in 2011, after a fall of 5% in 2010. European LTVs fell below 60%. At 58%, the average European LTV remains 2% below the global average. Despite this, LTVs remain as elevated as they were in 2007 near the peak of the cycle. Deleveraging driven by higher equity than debt growth Even though debt growth has turned positive in 2011, faster growth in equity has driven regional leverage ratios down. This is especially the case in Asia Pacific, where debt growth has remained strong, but is still surpassed by equity (Figure 11). Europe saw equity grow by double the rate of debt driving down LTV rates. This represents a change from last year, when the decline in leverage was driven by debt actually declining in all regions except Asia Pacific. In 2011 North America was the only region that showed continued decline in debt.
Figure 9
Global invested stock by capital source, USD bn
5,475 5,806
1,5061,491
761834
3,5603,980
2008 2009 2010 2011
10,93811,302
6%
-1%
10%
12%
11,61212,110
Private equity
Public equity
Public debt
Private debt
2011 growth
Source: DTZ Research
Figure 10
Total debt as percentage of invested stock
40%
45%
50%
55%
60%
65%
70%
75%
80%
2000 2001 2002 2003 2004 2005 2006 2007 2008 2009 2010 2011
69%
60%
56%
62%
67%
60%
58%
55%
74%
62%
64%
55%
North America
Global
Asia Pacific
Europe
Source: DTZ Research
Figure 11
Change in debt and equity, in USD terms
-10%
-5%
0%
5%
10%
15%
20%
North
America
Europe Asia
Pacific
Global North
America
Europe Asia
Pacific
Global
Change in debt Change in equity
2010 2011
Source: DTZ Research
Money into Property Europe 2012
www.dtz.com
7
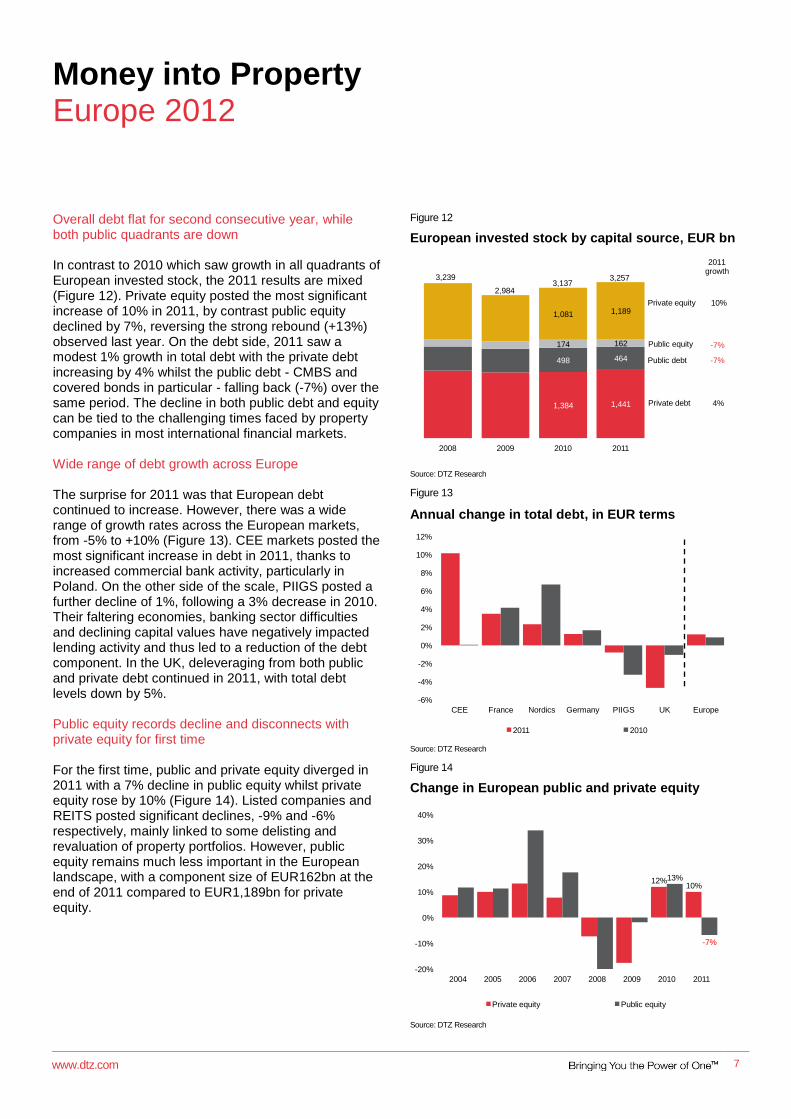
Overall debt flat for second consecutive year, while both public quadrants are down In contrast to 2010 which saw growth in all quadrants of European invested stock, the 2011 results are mixed (Figure 12). Private equity posted the most significant increase of 10% in 2011, by contrast public equity declined by 7%, reversing the strong rebound (+13%) observed last year. On the debt side, 2011 saw a modest 1% growth in total debt with the private debt increasing by 4% whilst the public debt - CMBS and covered bonds in particular - falling back (-7%) over the same period. The decline in both public debt and equity can be tied to the challenging times faced by property companies in most international financial markets. Wide range of debt growth across Europe The surprise for 2011 was that European debt continued to increase. However, there was a wide range of growth rates across the European markets, from -5% to +10% (Figure 13). CEE markets posted the most significant increase in debt in 2011, thanks to increased commercial bank activity, particularly in Poland. On the other side of the scale, PIIGS posted a further decline of 1%, following a 3% decrease in 2010. Their faltering economies, banking sector difficulties and declining capital values have negatively impacted lending activity and thus led to a reduction of the debt component. In the UK, deleveraging from both public and private debt continued in 2011, with total debt levels down by 5%. Public equity records decline and disconnects with private equity for first time For the first time, public and private equity diverged in 2011 with a 7% decline in public equity whilst private equity rose by 10% (Figure 14). Listed companies and REITS posted significant declines, -9% and -6% respectively, mainly linked to some delisting and revaluation of property portfolios. However, public equity remains much less important in the European landscape, with a component size of EUR162bn at the end of 2011 compared to EUR1,189bn for private equity.
Figure 12
European invested stock by capital source, EUR bn
1,384 1,441
498 464
174 162
1,081 1,189
2008 2009 2010 2011
4%
10%
-7%
-7%
2,984
3,2573,137
2011 growth
3,239
Private debt
Public debt
Public equity
Private equity
Source: DTZ Research
Figure 13
Annual change in total debt, in EUR terms
-6%
-4%
-2%
0%
2%
4%
6%
8%
10%
12%
CEE France Nordics Germany PIIGS UK Europe
2011 2010
Source: DTZ Research
Figure 14
Change in European public and private equity
12%10%
13%
-7%
-20%
-10%
0%
10%
20%
30%
40%
2004 2005 2006 2007 2008 2009 2010 2011
Private equity Public equity
Source: DTZ Research
Money into Property Europe 2012
www.dtz.com
8
Transaction volumes
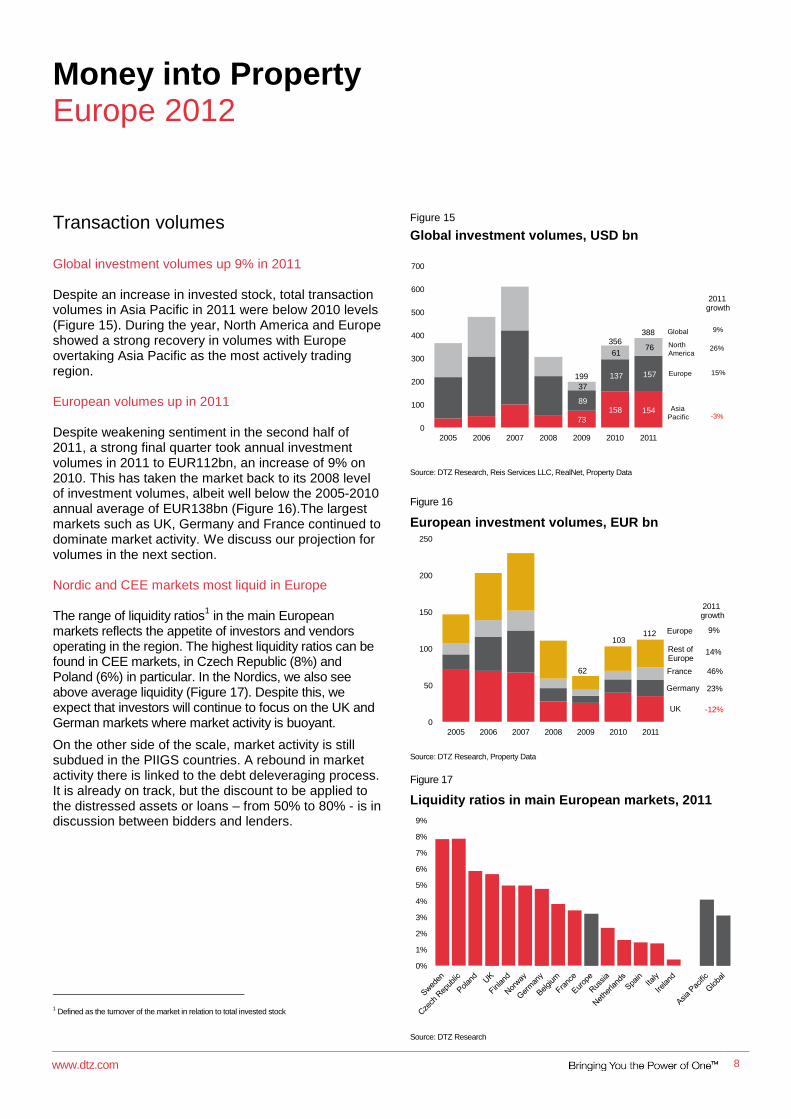
Global investment volumes up 9% in 2011 Despite an increase in invested stock, total transaction volumes in Asia Pacific in 2011 were below 2010 levels (Figure 15). During the year, North America and Europe showed a strong recovery in volumes with Europe overtaking Asia Pacific as the most actively trading region. European volumes up in 2011 Despite weakening sentiment in the second half of 2011, a strong final quarter took annual investment volumes in 2011 to EUR112bn, an increase of 9% on 2010. This has taken the market back to its 2008 level of investment volumes, albeit well below the 2005-2010 annual average of EUR138bn (Figure 16).The largest markets such as UK, Germany and France continued to dominate market activity. We discuss our projection for volumes in the next section. Nordic and CEE markets most liquid in Europe The range of liquidity ratios
1 in the main European
markets reflects the appetite of investors and vendors operating in the region. The highest liquidity ratios can be found in CEE markets, in Czech Republic (8%) and Poland (6%) in particular. In the Nordics, we also see above average liquidity (Figure 17). Despite this, we expect that investors will continue to focus on the UK and German markets where market activity is buoyant.
On the other side of the scale, market activity is still subdued in the PIIGS countries. A rebound in market activity there is linked to the debt deleveraging process. It is already on track, but the discount to be applied to the distressed assets or loans – from 50% to 80% - is in discussion between bidders and lenders.
1 Defined as the turnover of the market in relation to total invested stock
Figure 15
Global investment volumes, USD bn
73
158 15489
137 157
37
61 76
0
100
200
300
400
500
600
700
2005 2006 2007 2008 2009 2010 2011
388
199
9%
26%
15%
-3%
2011growth
North
America
Europe
Asia
Pacific
Global
356
Source: DTZ Research, Reis Services LLC, RealNet, Property Data
Figure 16
European investment volumes, EUR bn
0
50
100
150
200
250
2005 2006 2007 2008 2009 2010 2011
62
103112
Rest of Europe
UK
Germany
France
Europe
2011growth
23%
-12%
14%
46%
9%
Source: DTZ Research, Property Data
Figure 17
Liquidity ratios in main European markets, 2011
0%
1%
2%
3%
4%
5%
6%
7%
8%
9%
Source: DTZ Research
Money into Property Europe 2012
www.dtz.com
9
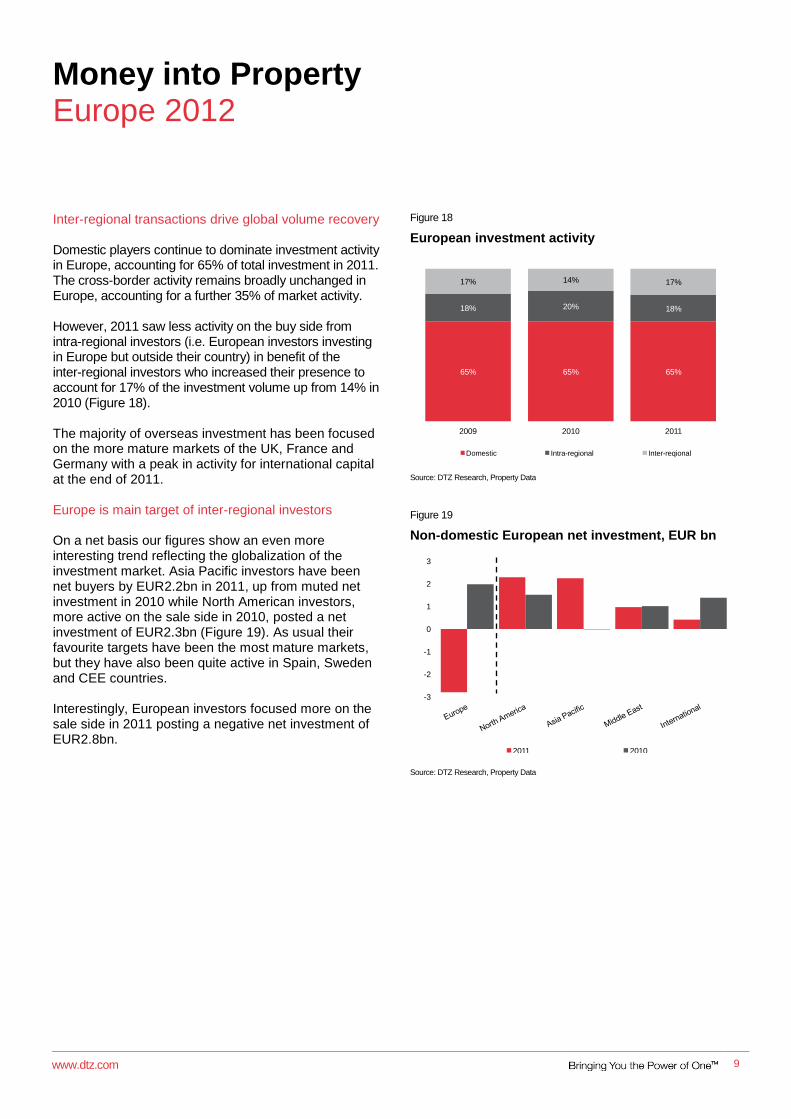
Inter-regional transactions drive global volume recovery Domestic players continue to dominate investment activity in Europe, accounting for 65% of total investment in 2011. The cross-border activity remains broadly unchanged in Europe, accounting for a further 35% of market activity. However, 2011 saw less activity on the buy side from intra-regional investors (i.e. European investors investing in Europe but outside their country) in benefit of the inter-regional investors who increased their presence to account for 17% of the investment volume up from 14% in 2010 (Figure 18). The majority of overseas investment has been focused on the more mature markets of the UK, France and Germany with a peak in activity for international capital at the end of 2011. Europe is main target of inter-regional investors On a net basis our figures show an even more interesting trend reflecting the globalization of the investment market. Asia Pacific investors have been net buyers by EUR2.2bn in 2011, up from muted net investment in 2010 while North American investors, more active on the sale side in 2010, posted a net investment of EUR2.3bn (Figure 19). As usual their favourite targets have been the most mature markets, but they have also been quite active in Spain, Sweden and CEE countries. Interestingly, European investors focused more on the sale side in 2011 posting a negative net investment of EUR2.8bn.
Figure 18
European investment activity
65% 65% 65%
18% 20% 18%
17% 14% 17%
2009 2010 2011
Domestic Intra-regional Inter-reqional
Source: DTZ Research, Property Data
Figure 19
Non-domestic European net investment, EUR bn
-3
-2
-1
0
1
2
3
2011 2010
Source: DTZ Research, Property Data

Money into Property Europe 2012
www.dtz.com
10
Section 2 – Current sentiment
Our lenders‟ and investors‟ surveys illustrate the prevailing market sentiment, which we expect to impact actual future performance.
Lenders‟ survey
Lenders expect less new lending and tighter conditions Existing lenders, predominantly banks, expect future lending to decrease and terms and conditions to tighten. Compared to the 2011 survey, those expecting lending to increase have more than halved, while investors expecting it to decrease have more than doubled (Figure 20). In addition, 2012 lending terms and conditions (“T&C”) deteriorated acutely between the 2011 and 2012 surveys, with a more than six fold increase in tighter T&C‟s. The current survey view on 2013 is that T&C‟s will relax to a similar level to those expected for 2012 in last year‟s survey. Expectations in 2011 for a relaxation in T&C‟s did not materialise. Lenders expect loan performance to deteriorate further Lenders expect loan performance to deteriorate further in 2012 (Figure 21). This is in contrast to last year‟s results, when lenders expected all categories of loan performance to improve in 2012. This year‟s survey responses indicate a doubling for defaults, a tripling of arrears and near quadrupling of losses, when compared to the 2011 expectations in last year‟s survey. More progress on non-prime work outs during 2011 The working out of loans is well underway for prime property (Figure 22). Lenders‟ view of progress in 2012 is similar to the responses of the 2011 survey: only 15% state that the prime asset work-outs are left to do, compared to 20% last year. With non-prime property, 43% of the work-out has not yet started. This is 10% less than in last year‟s survey. In short, our lenders‟ survey shows that more progress has been made on working out non-prime versus prime collateral during the year.
Figure 20
Expectations for new lending and changes in terms and conditions
50%
22%33%
6%
36%
36%
41%
57%
30%
51%
14%
37%
10%
64%
13%
Gross new lendingOverall market lending terms and conditions
2012
(2012 survey)
2012
(2011 survey)
Down
Same
Up
2013
(2012 survey)
2012
(2012 survey)
2012
(2011 survey)
Tighten
Same
Relax
Source: DTZ Research
Figure 21
Expectations for loan performance
44%32% 33%
39%32%
44% 44%37% 33%
44%63%
33%
39% 58%
11%
50%58%
44%
11%5%
33%22%
11%
44%
6% 5%
22%
2011 vs 2010
2012 vs 2011
2012 vs 2011
2011 vs 2010
2012 vs 2011
2012 vs 2011
2011 vs 2010
2012 vs 2011
2012 vs 2011
Down Same Up
Loan in arrears Loan in default Loan losses
2011 survey 2012
survey
2011 2012 2012
2011 survey
2012
survey 2011 survey
2012
survey
2011 2012 2012 2011 2012 2012
Source: DTZ Research
Figure 22
Lenders’ assessment of progress in working-out
20%
53%
15%
43%
65%
42%
70%
57%
15%5%
15%
Prime Non-prime Prime Non-prime
2011 survey 2012 survey
Have already finished
Well underway
Not started yet
Source: DTZ Research
Money into Property Europe 2012
www.dtz.com
11
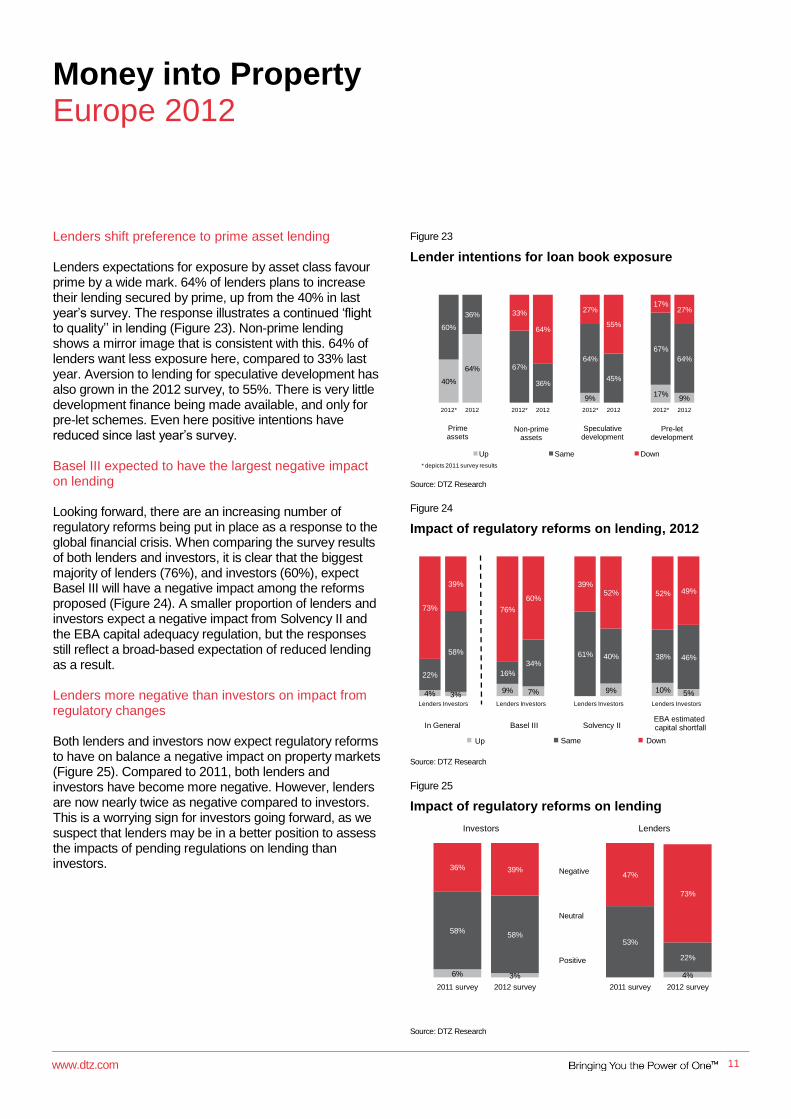
Lenders shift preference to prime asset lending Lenders expectations for exposure by asset class favour prime by a wide mark. 64% of lenders plans to increase their lending secured by prime, up from the 40% in last year‟s survey. The response illustrates a continued „flight to quality‟‟ in lending (Figure 23). Non-prime lending shows a mirror image that is consistent with this. 64% of lenders want less exposure here, compared to 33% last year. Aversion to lending for speculative development has also grown in the 2012 survey, to 55%. There is very little development finance being made available, and only for pre-let schemes. Even here positive intentions have reduced since last year‟s survey. Basel III expected to have the largest negative impact on lending Looking forward, there are an increasing number of regulatory reforms being put in place as a response to the global financial crisis. When comparing the survey results of both lenders and investors, it is clear that the biggest majority of lenders (76%), and investors (60%), expect Basel III will have a negative impact among the reforms proposed (Figure 24). A smaller proportion of lenders and investors expect a negative impact from Solvency II and the EBA capital adequacy regulation, but the responses still reflect a broad-based expectation of reduced lending as a result. Lenders more negative than investors on impact from regulatory changes Both lenders and investors now expect regulatory reforms to have on balance a negative impact on property markets (Figure 25). Compared to 2011, both lenders and investors have become more negative. However, lenders are now nearly twice as negative compared to investors. This is a worrying sign for investors going forward, as we suspect that lenders may be in a better position to assess the impacts of pending regulations on lending than investors.
Figure 23
Lender intentions for loan book exposure
40%
64%
9%17%
9%
60%
36%
67%
36%
64%
45%
67%
64%
33%
64%
27%
55%
17%27%
2012* 2012 2012* 2012 2012* 2012 2012* 2012
Up Same Down
* depicts 2011 survey results
Prime assets
Non-prime assets
Speculative development
Pre-let development
Source: DTZ Research
Figure 24
Impact of regulatory reforms on lending, 2012
4% 3%9% 7% 9% 10% 5%
22%
58%
16%
34%61% 40% 38% 46%
73%
39%
76%
60%
39%52% 52% 49%
Lenders Investors Lenders Investors Lenders Investors Lenders Investors
Positive Neutral Negative
In General Basel III Solvency IIEBA estimated capital shortfall
Up Same Down
Source: DTZ Research
Figure 25
Impact of regulatory reforms on lending
6% 3% 4%
58%58%
53%
22%
36% 39%47%
73%
2011 survey 2012 survey 2011 survey 2012 survey
Negative
Neutral
Positive
Investors Lenders
Source: DTZ Research

Money into Property Europe 2012
www.dtz.com
12
Investors‟ survey Investors become less optimistic on net investments Our survey findings show that on balance net investment globally is expected to increase in 2012 (Figure 26). However, the majority of respondents expecting to increase net investment have declined since 2010, from 76%, to 57% in 2011. Five times as many investors expected net investments to decrease (31%) compared to a year ago (6%). This reflects mounting caution in the market due to increased risk on the back of the continuing European sovereign debt crisis as well as difficulty in sourcing the right product. More competition in sourcing opportunities for prime The increased risk aversion with investors has lead to increased competition for the best properties. Investors are finding it much more difficult to buy prime properties in 2012 compared to 2011 (Figure 27). In last year‟s survey, opportunities in the non-prime market were seen as more difficult to access. But, while a significant portion of investors (39%) still regarded non-prime as difficult to access, now a greater proportion (40%) see it as easy to source in 2012. This suggests that, with prime product keenly priced and very competitive, non-prime property has already become a more important target to a bigger section of the investor base. Decline in bank debt offset by increase from institutions Nearly 70% of investors expect bank debt to decline during 2012, a near tripling from the 25% in last year‟s survey. The only category of debt expected to increase is from institutions, with 58% of investors projecting an increase (Figure 28). In fact, debt from institutions is expected to increase more than any other source of finance. Expectations for bonds and mezzanine finance have declined from last year‟s survey.
Figure 26
Net investment expectations in real estate
76%66%
57%
14% 28%
11%
10% 6%
31%
2010 survey 2011 survey 2012 survey
Up
Same
Down
Source: DTZ Research
Figure 27
EMEA buying opportunities by property grade
77%
10%
28%40%
20%
29%
36%20%
3%
61%
36% 39%
2011 survey 2012 survey 2011 survey 2012 survey
Prime Non-Prime
Hard
Normal
Easy
Source: DTZ Research
Figure 28
Expectations for availability of finance by lender
48% 47% 44%
58%
11%
37%
43%
27%45%
32%
20%
44%
9%
25%
10% 10%
69%
19%
Institutions Bank Other* Institutions Bank Other*
Up
Same
Down
2011 survey 2012 survey
*Other covers corporate bonds, CMBS and mezzanine finance Source: DTZ Research

Money into Property Europe 2012
www.dtz.com
13
Bank lending is expected to drop most in EMEA The global decrease in commercial bank lending is largely explained by the significant expected decrease in EMEA, and to a significant extent in North America as well (Figure 29). In EMEA mezzanine finance and debt from institutions is expected to compensate for this reduction. In North America expectations for institutional funding are evenly balanced between growth and decline. In Asia Pacific debt from institutions is viewed as less important than bank lending, but it is corporate bonds which are expected to increase the most out of any source of finance. Half of EMEA investors in talks with banks on loan amendments Half of investors in EMEA and 75% in North America are in talks with banks on loan amendments and/or extensions (Figure 30). This contrasts with Asia Pacific where just over a quarter of investors are in a similar position. This is consistent with the global leverage ratios shown earlier. If loans are unable to be refinanced or extended then investors continue to favour equity injection as their most preferable solution. Partial loan repayment comes second in rank followed by consensual asset sales. Equity investments in property loans likely to be part of solution going forward Investors‟ own involvement in bridging the overall market‟s financing gap is gradually increasing. 42% of investors acknowledge that they have invested in property loans or engaged in partial equity positions. This is up by over a third from the 31% in 2011 (Figure 31). And among those of who responded positively, the balance between investment in loans and in equity positions has now shifted to the former. Further movement of investors into property loans seems a possibility, but may be limited as the proportion of those not involved lacking capacity, as opposed to interest, is increasing.
Figure 29
Expectations for availability of finance by region, 2012
54%
2%
40%53%
25%
31%
13%
50%
50%36%
50%
15%
85%
50%
10% 11%
25%
Asia Pacific EMEA North America
Asia Pacific EMEA North America
Down
Normal
Up
Commercial bank lending Debt from institutions
Source: DTZ Research
Figure 30
Investors’ exposure to loan workout, 2012
73%
50%
25%
42%48%
18%
11%
25%
14%
14%
9%
39%
50%44%
38%
Asia Pacific EMEA North America
Global Overall average
Extension and restructuring
Extension only
No
Source: DTZ Research
Figure 31
Investors’ exposure to loan and equity positions
69%58%
40%
26%35%
49%
31%42%
20%42%
65%
51%40%
32%
2011 survey 2012 survey 2011 survey 2012 survey 2011 survey 2012 survey
Yes
No
Propertyloans
Equityposition
Both
Nocapability
Nointerest
Yes No
2011
survey2011
survey
2011
survey2012
survey
2012
survey
2012
survey
Source: DTZ Research
Money into Property Europe 2012
www.dtz.com
14 14
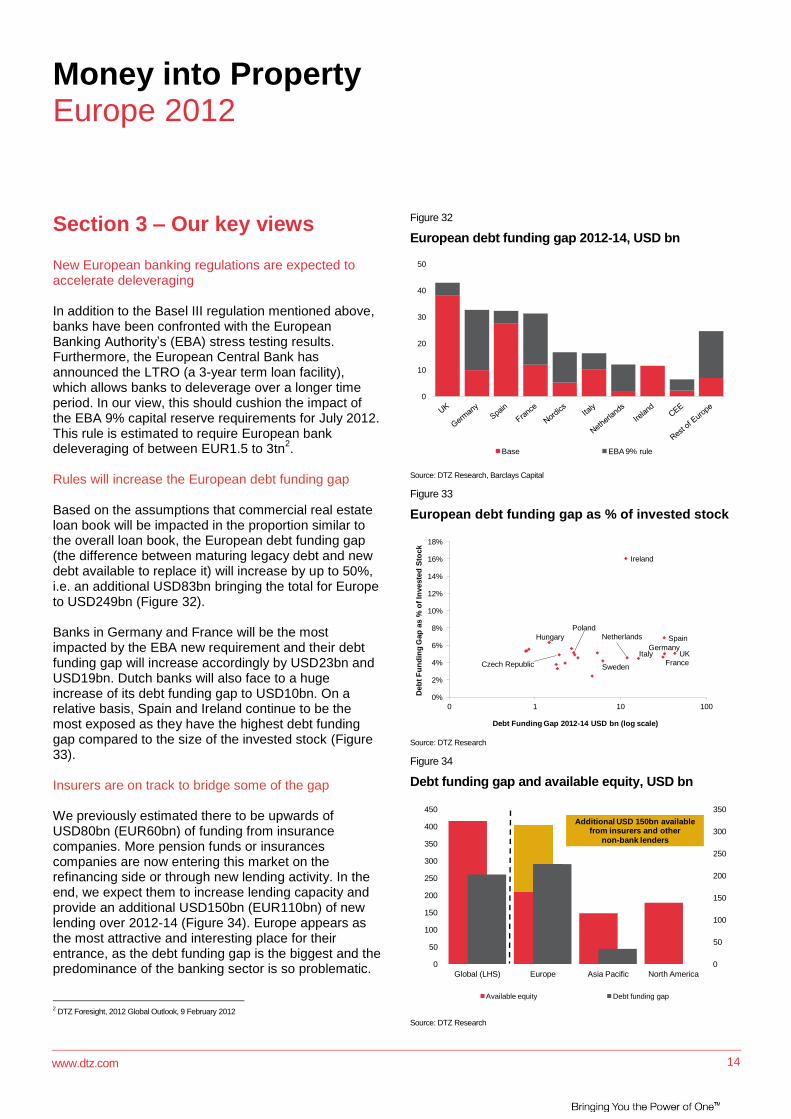
Section 3 – Our key views New European banking regulations are expected to accelerate deleveraging In addition to the Basel III regulation mentioned above, banks have been confronted with the European Banking Authority‟s (EBA) stress testing results. Furthermore, the European Central Bank has announced the LTRO (a 3-year term loan facility), which allows banks to deleverage over a longer time period. In our view, this should cushion the impact of the EBA 9% capital reserve requirements for July 2012. This rule is estimated to require European bank deleveraging of between EUR1.5 to 3tn
2.
Rules will increase the European debt funding gap Based on the assumptions that commercial real estate loan book will be impacted in the proportion similar to the overall loan book, the European debt funding gap (the difference between maturing legacy debt and new debt available to replace it) will increase by up to 50%, i.e. an additional USD83bn bringing the total for Europe to USD249bn (Figure 32). Banks in Germany and France will be the most impacted by the EBA new requirement and their debt funding gap will increase accordingly by USD23bn and USD19bn. Dutch banks will also face to a huge increase of its debt funding gap to USD10bn. On a relative basis, Spain and Ireland continue to be the most exposed as they have the highest debt funding gap compared to the size of the invested stock (Figure 33). Insurers are on track to bridge some of the gap We previously estimated there to be upwards of USD80bn (EUR60bn) of funding from insurance companies. More pension funds or insurances companies are now entering this market on the refinancing side or through new lending activity. In the end, we expect them to increase lending capacity and provide an additional USD150bn (EUR110bn) of new lending over 2012-14 (Figure 34). Europe appears as the most attractive and interesting place for their entrance, as the debt funding gap is the biggest and the predominance of the banking sector is so problematic.
2 DTZ Foresight, 2012 Global Outlook, 9 February 2012
Figure 32
European debt funding gap 2012-14, USD bn
0
10
20
30
40
50
Base EBA 9% rule
Source: DTZ Research, Barclays Capital
Figure 33
European debt funding gap as % of invested stock
UK
Spain
Ireland
FranceItaly
Germany
Hungary
Sweden
NetherlandsPoland
Czech Republic
0%
2%
4%
6%
8%
10%
12%
14%
16%
18%
0 1 10 100
Deb
t F
un
din
g G
ap
as %
of
Investe
d S
tock
Debt Funding Gap 2012-14 USD bn (log scale) Source: DTZ Research
Figure 34
Debt funding gap and available equity, USD bn
0
50
100
150
200
250
300
350
0
50
100
150
200
250
300
350
400
450
Global (LHS) Europe Asia Pacific North America
Available equity Debt funding gap
Additional USD 150bn availablefrom insurers and other
non-bank lenders
Source: DTZ Research
Money into Property Europe 2012
www.dtz.com
15
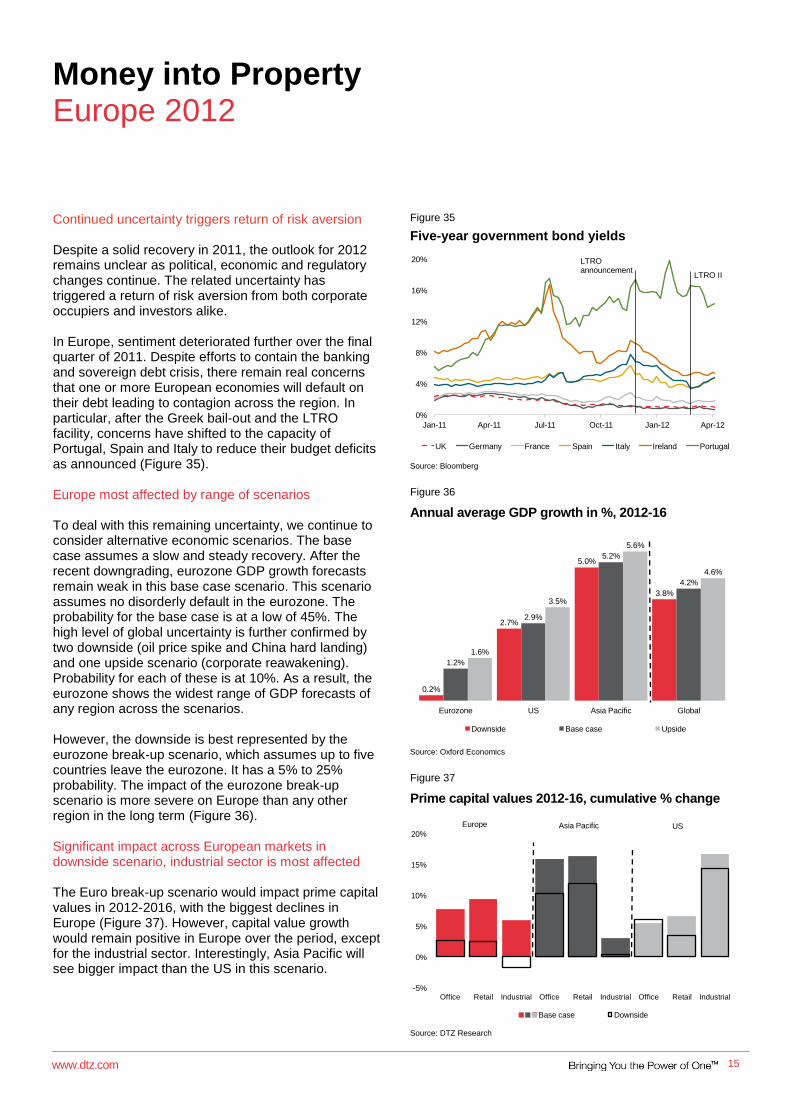
Continued uncertainty triggers return of risk aversion Despite a solid recovery in 2011, the outlook for 2012 remains unclear as political, economic and regulatory changes continue. The related uncertainty has triggered a return of risk aversion from both corporate occupiers and investors alike. In Europe, sentiment deteriorated further over the final quarter of 2011. Despite efforts to contain the banking and sovereign debt crisis, there remain real concerns that one or more European economies will default on their debt leading to contagion across the region. In particular, after the Greek bail-out and the LTRO facility, concerns have shifted to the capacity of Portugal, Spain and Italy to reduce their budget deficits as announced (Figure 35). Europe most affected by range of scenarios To deal with this remaining uncertainty, we continue to consider alternative economic scenarios. The base case assumes a slow and steady recovery. After the recent downgrading, eurozone GDP growth forecasts remain weak in this base case scenario. This scenario assumes no disorderly default in the eurozone. The probability for the base case is at a low of 45%. The high level of global uncertainty is further confirmed by two downside (oil price spike and China hard landing) and one upside scenario (corporate reawakening). Probability for each of these is at 10%. As a result, the eurozone shows the widest range of GDP forecasts of any region across the scenarios. However, the downside is best represented by the eurozone break-up scenario, which assumes up to five countries leave the eurozone. It has a 5% to 25% probability. The impact of the eurozone break-up scenario is more severe on Europe than any other region in the long term (Figure 36). Significant impact across European markets in downside scenario, industrial sector is most affected The Euro break-up scenario would impact prime capital values in 2012-2016, with the biggest declines in Europe (Figure 37). However, capital value growth would remain positive in Europe over the period, except for the industrial sector. Interestingly, Asia Pacific will see bigger impact than the US in this scenario.
Figure 35
Five-year government bond yields
0%
4%
8%
12%
16%
20%
Jan-11 Apr-11 Jul-11 Oct-11 Jan-12 Apr-12
UK Germany France Spain Italy Ireland Portugal
LTRO announcement
LTRO II
Source: Bloomberg
Figure 36
Annual average GDP growth in %, 2012-16
0.2%
2.7%
5.0%
3.8%
1.2%
2.9%
5.2%
4.2%
1.6%
3.5%
5.6%
4.6%
Eurozone US Asia Pacific Global
Downside Base case Upside
Source: Oxford Economics
Figure 37
Prime capital values 2012-16, cumulative % change
-5%
0%
5%
10%
15%
20%
Office Retail Industrial Office Retail Industrial Office Retail Industrial
Base case Downside
Europe Asia Pacific US
Source: DTZ Research
Money into Property Europe 2012
www.dtz.com
16
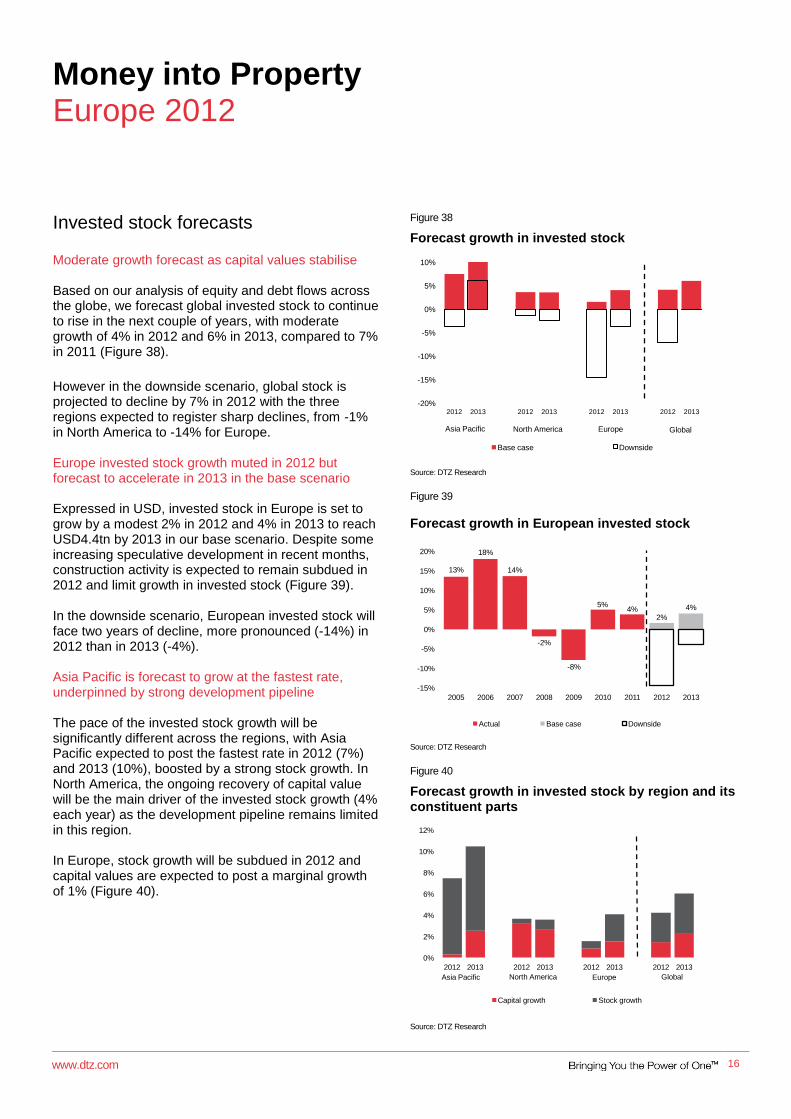
Invested stock forecasts Moderate growth forecast as capital values stabilise Based on our analysis of equity and debt flows across the globe, we forecast global invested stock to continue to rise in the next couple of years, with moderate growth of 4% in 2012 and 6% in 2013, compared to 7% in 2011 (Figure 38).
However in the downside scenario, global stock is projected to decline by 7% in 2012 with the three regions expected to register sharp declines, from -1% in North America to -14% for Europe. Europe invested stock growth muted in 2012 but forecast to accelerate in 2013 in the base scenario Expressed in USD, invested stock in Europe is set to grow by a modest 2% in 2012 and 4% in 2013 to reach USD4.4tn by 2013 in our base scenario. Despite some increasing speculative development in recent months, construction activity is expected to remain subdued in 2012 and limit growth in invested stock (Figure 39). In the downside scenario, European invested stock will face two years of decline, more pronounced (-14%) in 2012 than in 2013 (-4%). Asia Pacific is forecast to grow at the fastest rate, underpinned by strong development pipeline The pace of the invested stock growth will be significantly different across the regions, with Asia Pacific expected to post the fastest rate in 2012 (7%) and 2013 (10%), boosted by a strong stock growth. In North America, the ongoing recovery of capital value will be the main driver of the invested stock growth (4% each year) as the development pipeline remains limited in this region. In Europe, stock growth will be subdued in 2012 and capital values are expected to post a marginal growth of 1% (Figure 40).
Figure 38
Forecast growth in invested stock
-20%
-15%
-10%
-5%
0%
5%
10%
2012 2013 2012 2013 2012 2013 2012 2013
Base case Downside
Asia Pacific North America Europe Global
Source: DTZ Research
Figure 39
Forecast growth in European invested stock
13%
18%
14%
-2%
-8%
5%4%
2%
4%
-15%
-10%
-5%
0%
5%
10%
15%
20%
2005 2006 2007 2008 2009 2010 2011 2012 2013
Actual Base case Downside
Source: DTZ Research
Figure 40
Forecast growth in invested stock by region and its constituent parts
0%
2%
4%
6%
8%
10%
12%
2012 2013 2012 2013 2012 2013 2012 2013
Capital growth Stock growth
Asia Pacific EuropeNorth America Global
Source: DTZ Research
Money into Property Europe 2012
www.dtz.com
17
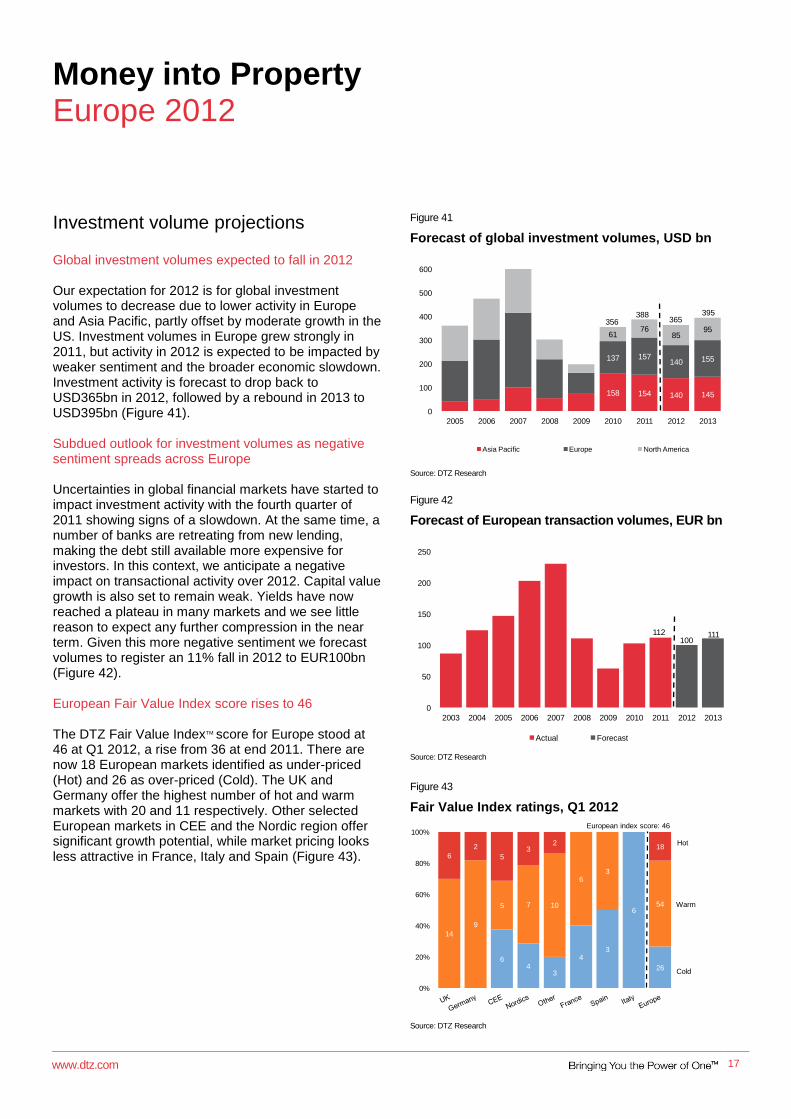
Investment volume projections Global investment volumes expected to fall in 2012 Our expectation for 2012 is for global investment volumes to decrease due to lower activity in Europe and Asia Pacific, partly offset by moderate growth in the US. Investment volumes in Europe grew strongly in 2011, but activity in 2012 is expected to be impacted by weaker sentiment and the broader economic slowdown. Investment activity is forecast to drop back to USD365bn in 2012, followed by a rebound in 2013 to USD395bn (Figure 41). Subdued outlook for investment volumes as negative sentiment spreads across Europe Uncertainties in global financial markets have started to impact investment activity with the fourth quarter of 2011 showing signs of a slowdown. At the same time, a number of banks are retreating from new lending, making the debt still available more expensive for investors. In this context, we anticipate a negative impact on transactional activity over 2012. Capital value growth is also set to remain weak. Yields have now reached a plateau in many markets and we see little reason to expect any further compression in the near term. Given this more negative sentiment we forecast volumes to register an 11% fall in 2012 to EUR100bn (Figure 42). European Fair Value Index score rises to 46 The DTZ Fair Value IndexTM score for Europe stood at 46 at Q1 2012, a rise from 36 at end 2011. There are now 18 European markets identified as under-priced (Hot) and 26 as over-priced (Cold). The UK and Germany offer the highest number of hot and warm markets with 20 and 11 respectively. Other selected European markets in CEE and the Nordic region offer significant growth potential, while market pricing looks less attractive in France, Italy and Spain (Figure 43).
Figure 41
Forecast of global investment volumes, USD bn
158 154 140 145
137 157140 155
6176
8595
0
100
200
300
400
500
600
2005 2006 2007 2008 2009 2010 2011 2012 2013
Asia Pacific Europe North America
388365
395356
Source: DTZ Research
Figure 42
Forecast of European transaction volumes, EUR bn
112100
111
0
50
100
150
200
250
2003 2004 2005 2006 2007 2008 2009 2010 2011 2012 2013
Actual Forecast
Source: DTZ Research
Figure 43
Fair Value Index ratings, Q1 2012
64
3
43
6
26
14
9
5 7 10
63
54
6
2
53
218
0%
20%
40%
60%
80%
100%European index score: 46
Hot
Warm
Cold
Source: DTZ Research
Money into Property Europe 2012
www.dtz.com
18
Appendix
Definitions
Invested stock refers to the value of investment grade commercial real estate held by different investor groups. The total value of the real estate capital market is defined as the total volume of commercial real estate debt outstanding plus the total value of equity in commercial real estate holdings.
Private debt refers to the total outstanding loan value to the real estate sector that is not held in the form of listed financial securities. Loans granted and subsequently securitised prior to maturity are not included in this data. Private debt relates to the activity of all participants involved in the provision of commercial real estate loans including institutional lenders, commercial bank lending and insurance companies.
Public debt refers to the total outstanding loan value to the real estate sector held in the form of listed financial securities, i.e. property company corporate bonds, covered bonds with commercial property as collateral and commercial mortgage backed securities (CMBS).
Private equity refers to the equity proportion of the commercial real estate holdings of insurance companies, pension funds, private property companies, high net worth individuals and unlisted property vehicles. The debt proportion has been stripped out by applying a different gearing ratio for each investor group.
Public equity refers to the equity proportion of the commercial real estate holdings of listed property companies, REITs and other listed property vehicles. The debt proportion has been stripped out by applying a different gearing ratio for each investor group.
Gearing (or LTV) ratio is defined as debt/(debt+equity). The various investor groups have different gearing levels based on their risk profile, investment strategy, as well as their capital sources.
Investment volumes refer to the total value of investment transactions in the commercial direct real estate market. Hotel and residential deals are excluded from the analysis.
Money into Property methodology
Private debt allocation In order to capture the value of commercial real estate loans issued by domestic banks to fund cross-border investment and likewise by foreign banks to fund domestic property investment, private debt is allocated based on the pattern of cross-border investment transactions.
Cross-border allocation in invested stock The value of the commercial real estate held by different investor groups is allocated based on the location of the property rather than the origin of investor.
Currency conversions Invested stock and its components are converted by using the average quarterly exchange rate for each year under review.
Transaction volumes
Transaction volumes represent the buying and selling of property and are independent of stock. For example there can be a lot of transactions, but if price does not change and the property is already in the invested stock figures then there will be no change in invested stock. The only change is the owner of the property, which could trigger a change in quadrant (say public to private). Higher transaction volumes do indicate interest in the market, they tend to imply more development activity or capital values are rising.

Money into Property Europe 2012
www.dtz.com
19
Fair value methodology
The DTZ Fair Value Index TM was launched in August 2010 and has now been rolled out for all 192 markets covered by DTZ forecasts.
Fair value is the value at which an investor is indifferent between a risk free return and the expected return from holding property, taking into account the extra risk of investing in the property asset class.
When the property price is at fair value, an investor is being adequately compensated for the risk taken in choosing to purchase real estate; similarly, when the property price is below the fair value price, an investor is being more than compensated for the risk taken in choosing to purchase real estate.
When buying at or below fair value, an investor does not necessarily buy at the bottom of the market.
Our fair value analysis focuses on prime assets and a five-year investment horizon, and hold for the market overall; individual transactions may provide opportunities and risks beyond the average market view.
For more information see the note DTZ Fair Value Estimates – Methodology and Examples at www.DTZ.com
Disclaimer This report should not be relied upon as a basis for entering into transactions without seeking specific, qualified, professional advice. Whilst facts have been rigorously checked, DTZ can take no responsibility for any damage or loss suffered as a result of any inadvertent inaccuracy within this report. Information contained herein should not, in whole or part, be published, reproduced or referred to without prior approval. Any such reproduction should be credited to DTZ.
Related Documents